Article

A Methodological Proposal for the Analysis of Lighting the House Building Façades

by
Hugo Castro Noblejas
1,*,
Juan Francisco Sortino Barrionuevo
1,
Darío Gumiel Muñoz
2 and
Matías Francisco Mérida Rodríguez
1
1
Geography Department, University of Malaga, 29071 Malaga, Spain
2
COO AGRON S.C.A., 29071 Malaga, Spain
*
Author to whom correspondence should be addressed.
ISPRS Int. J. Geo-Inf. 2021, 10(8), 536; https://doi.org/10.3390/ijgi10080536
Submission received: 3 June 2021 / Revised: 21 July 2021 / Accepted: 6 August 2021 / Published: 9 August 2021

Abstract

:
Natural lighting is a fundamental element in the habitability of dwellings. However, it is still difficult to calculate its effect on the façades of the buildings in detail, due to the morphological complexity of the property itself, as well as the environment that surrounds it. This study provides a methodological proposal that uses pre-existing open data to extrude buildings by using a GIS procedure. Based on three selected real estate properties with different characteristics in the city of Marbella (Spain), the hours of sunlight received by each building’s façade are calculated, taking into account the digital land model and the digital surface model of the area. The results confirm the usefulness of the method to measure and analyze differences in luminosity between buildings with similar urban characteristics and their surroundings, as well as to record the differences in luminosity between floors and the orientations of the same building at several heights. The methodological proposal opens a path for many applications related to energy efficiency, housing conditions, and property valuation.

1. Introduction

Urban areas have been the most widespread habitat on the planet for 15 years, and 56% of the world’s population in 2019 were concentrated in them [1]. Urban dwellers live in complex and heterogeneous geographical areas, which are composed of buildings, infrastructure, equipment, and vegetation.
Solar radiation is a determining factor of residents’ quality of life, representing a value to the differential appreciation in their spaces, both public and private (habitability). Therefore, orientation of a house towards the sun is a factor of high relevance, especially in temperate climates. In addition, sunlight is increasingly being employed as one of the main sources of energy through the use of thermal or photovoltaic energy.
Sunlight has an important effect on property valuation and on the desirability of a property. The importance of luminosity is, therefore, one of the key climatic characteristics of a geographical area, especially in regions where the economy is based on climate tourism. There are numerous previous works that, from an econometric approach, include solar lighting as fundamental [2]; however, many of these studies were carried out in another socioeconomic context and without the current geographic information system (GIS) and building information modelling (BIM) tools. With these technological advances, it is possible to analyze in greater detail the incidence of direct sunlight, to compare buildings with similar characteristics and even the difference in luminosity between the different floors in tall buildings. If, until now, simulations of solar radiation were applied to 2D surfaces, such as the roofs of buildings or street surfaces, this work provides a methodological procedure that introduces a third dimension (volume) in the measurement of sunlight, which is essential for having a more complete perception of the reality of the situation. It is an instrument designed to facilitate the measurement of sunlight at the urban planning scale, which is unlike other detailed techniques that are designed to know the energy balance at the level of a home or building.
  • In this context, and based on the new possibilities allowed by advances in GIS, the main objective of this article is to develop a methodology that integrates 2D and 3D data based on remote sensing techniques, in order to obtain an accurate estimation of sunlight reception for all façades of a series of buildings, considering the surroundings and topography as potential obstacles. Other objectives under consideration are:
  • Sub-objective 1: to determine the procedure for analyzing the extrusion process of 3D buildings based on freely available data sources in Spain.
  • Sub-objective 2: to create of a methodology that allows to quantify the hours of direct light that a façade receives, by means of panels equivalent to each floor of the building (3-m length).
  • Sub-objective 3: to measure and analyze the differences in luminosity between nearby buildings with similar urban characteristics.
  • Sub-objective 4: to contrast the differences in luminosity between the different floors and orientations of the same multi-family building.

2. State-of-the-Art

2.1. Extrusion of Buildings

To date, different ways of developing the measurement of geometrical parameters of buildings, including their volumetry, have been studied. Altimetric data can be obtained from a point cloud generated by light detection and ranging (LiDAR) [3,4], from aerial photogrammetry [5,6] based on CityGML data, as has been done in some German regions, where the data were developed and provided by the public administration [7], or using cadastral data [8]. With altimetric data, the obstruction process can be generated through different software, depending on whether the BIM model is available for the study area or not. In the event that the model has to be built from scratch, software such as AutoCad or CityEngine are commonly used for the design of the constructional units [9]. In recent years, alternative procedures have been proposed to facilitate the systematization of these calculations for larger spatial areas, such as the automation of LiDAR point cloud data processing [10], or knowledge network design, making information accessible to users not trained in the subject [11].

2.2. Analysis of the Solar Volume

For the calculation of the hours of sunlight that a surface receives, solar radiation analysis tools are necessary, which calculate the insolation in a selected territorial delimitation. The GIS procedure for the analysis of solar volume depends on the software with which the calculations are made. Some examples are the extension of the 3D Analyst tool in ArcGIS [3,12], or the model r. sun implemented in the open source environment of GRASS GIS [13]. In this research, the tools provided in ArcGIS are used, which are based on hemispheric visual basin algorithm methods [14,15,16]. The amount of total radiation calculated for a particular area is provided as global radiation. The calculation of direct, diffuse, and global insolation is repeated for the framework of the topographic surface, which generates insolation maps for a whole geographical area. There are numerous works that use the volume of sun shade, based on the accumulation of radiation in urban areas, to mainly measure the usable solar energy of solar panels on roofs, or the thermal comfort in public spaces [17]. However, the third dimension, which includes façades, is still a poorly explored area from a methodological point of view [18].

2.3. Application of Remote Sensing and BIM Techniques in Real Estate Valuation and Solutions

The value of the property is influenced by such a large number of factors that no investigation could contain them all [19]. It is not only restricted by different conditions of each study area, but also by the limited number of samples to perform analyses. In addition, the problems of multilinearity and spatial autocorrelation between indicators could bias the outcome [20,21]. Therefore, there is a wide range of research that analyzes the factors that affect property prices according to the aim of the study or the attributes of greatest interest. Remote sensing data with varying resolution and temporal scope are now widely available and serve as a key data source for property valuation research. After the development in the systematic creation of 3D models through the extrusion of buildings, it is possible to vectorize the information to perform statistical analyses. Following this approach, new methodologies can be highlighted, such as the research developed by Franco and Macdonald [22]. These authors explored the role of remote sensing in assessing the impact of vegetation and urban amenities on the value of property, using aerial images obtained from an intergraph digital mapping camera with a 0.5-m resolution. The classification that the author proposes is accurate and indicates the remote detection of terrestrial objects that can be integrated into the assessment process. Jain [23] extracted socioeconomic attributes from high-resolution images with the purpose of knowing property taxation and identifying the age of construction by an object-based classification. Zhang et al. [24] applied spatial interpolation to produce a DEM map that displays urban housing prices, combined with the water flood method (using the reference price as flood). The section cutting method simulates and identifies price peaks in a city. In addition, they analyze the spatial morphology of prices together with the main traffic lines using the band float method.
With the integrated development of the Cadastre and the modelling of BIM, several researchers have begun to explore the potential of 3D modelling in matters related to property management, taxation, and valuation. Some studies assess the possibility of using BIM to model land administration in 3D, and property boundaries [25,26,27]. Mahdjoubi et al. [28] proposed the application of laser and BIM scanning technologies to achieve a quick snapshot of the structure and the modelling of the building for accurate and fast services provided by the real estate sector. Kara et al. [29] focused on the evaluation of the different analyses that can be used for property valuation in the context of the land administration domain model (LADM), whereas El Yamani et al. [30] designed a comprehensive 3D property valuation model for residential property units, including both indoor (volume and area of the rooms, walls, openings) and outdoor (vegetation, transport, exposure to sunlight and noise) variables.
While new technologies have been developed in the field of architecture and construction, BIM has also been widely used in building performance, energy efficiency and sustainability analyses [31], or thermal comfort [32,33]. These studies allow visualizing thermal conditions over time, proposing a simple way to identify changes. Several research studies have been carried out to analyze one of the most influential factors in real estate prices, which is also vital for generating solutions that respond to climate change: insulation and thermal regulation of housing, or the use of air for the generation of photovoltaic energy. Andrić et al. [3] designed a building heat demand model based on the analogy of thermo-electricity, whereas Hofierka and Zlocha [13] developed a 3D solar radiation model for 3D urban areas.
The integration of this expertise has enriched the design and management phase of a building’s life cycle. These technical advances generate differences in the habitability of housing, which also affect its economic valuation. The price of residential real estates is strongly influenced by environmental factors in the surroundings of the property, due to the intrinsic connection between the human needs and the location [34,35]. The hedonic price model has been widely applied in the property valuation market to estimate value based on property attributes, as well as in external factors. Since it splits an integrated product into individual components, it is useful when focusing on attributes of specific dimensions (environmental, location, economic, etc.) [19].

3. Materials

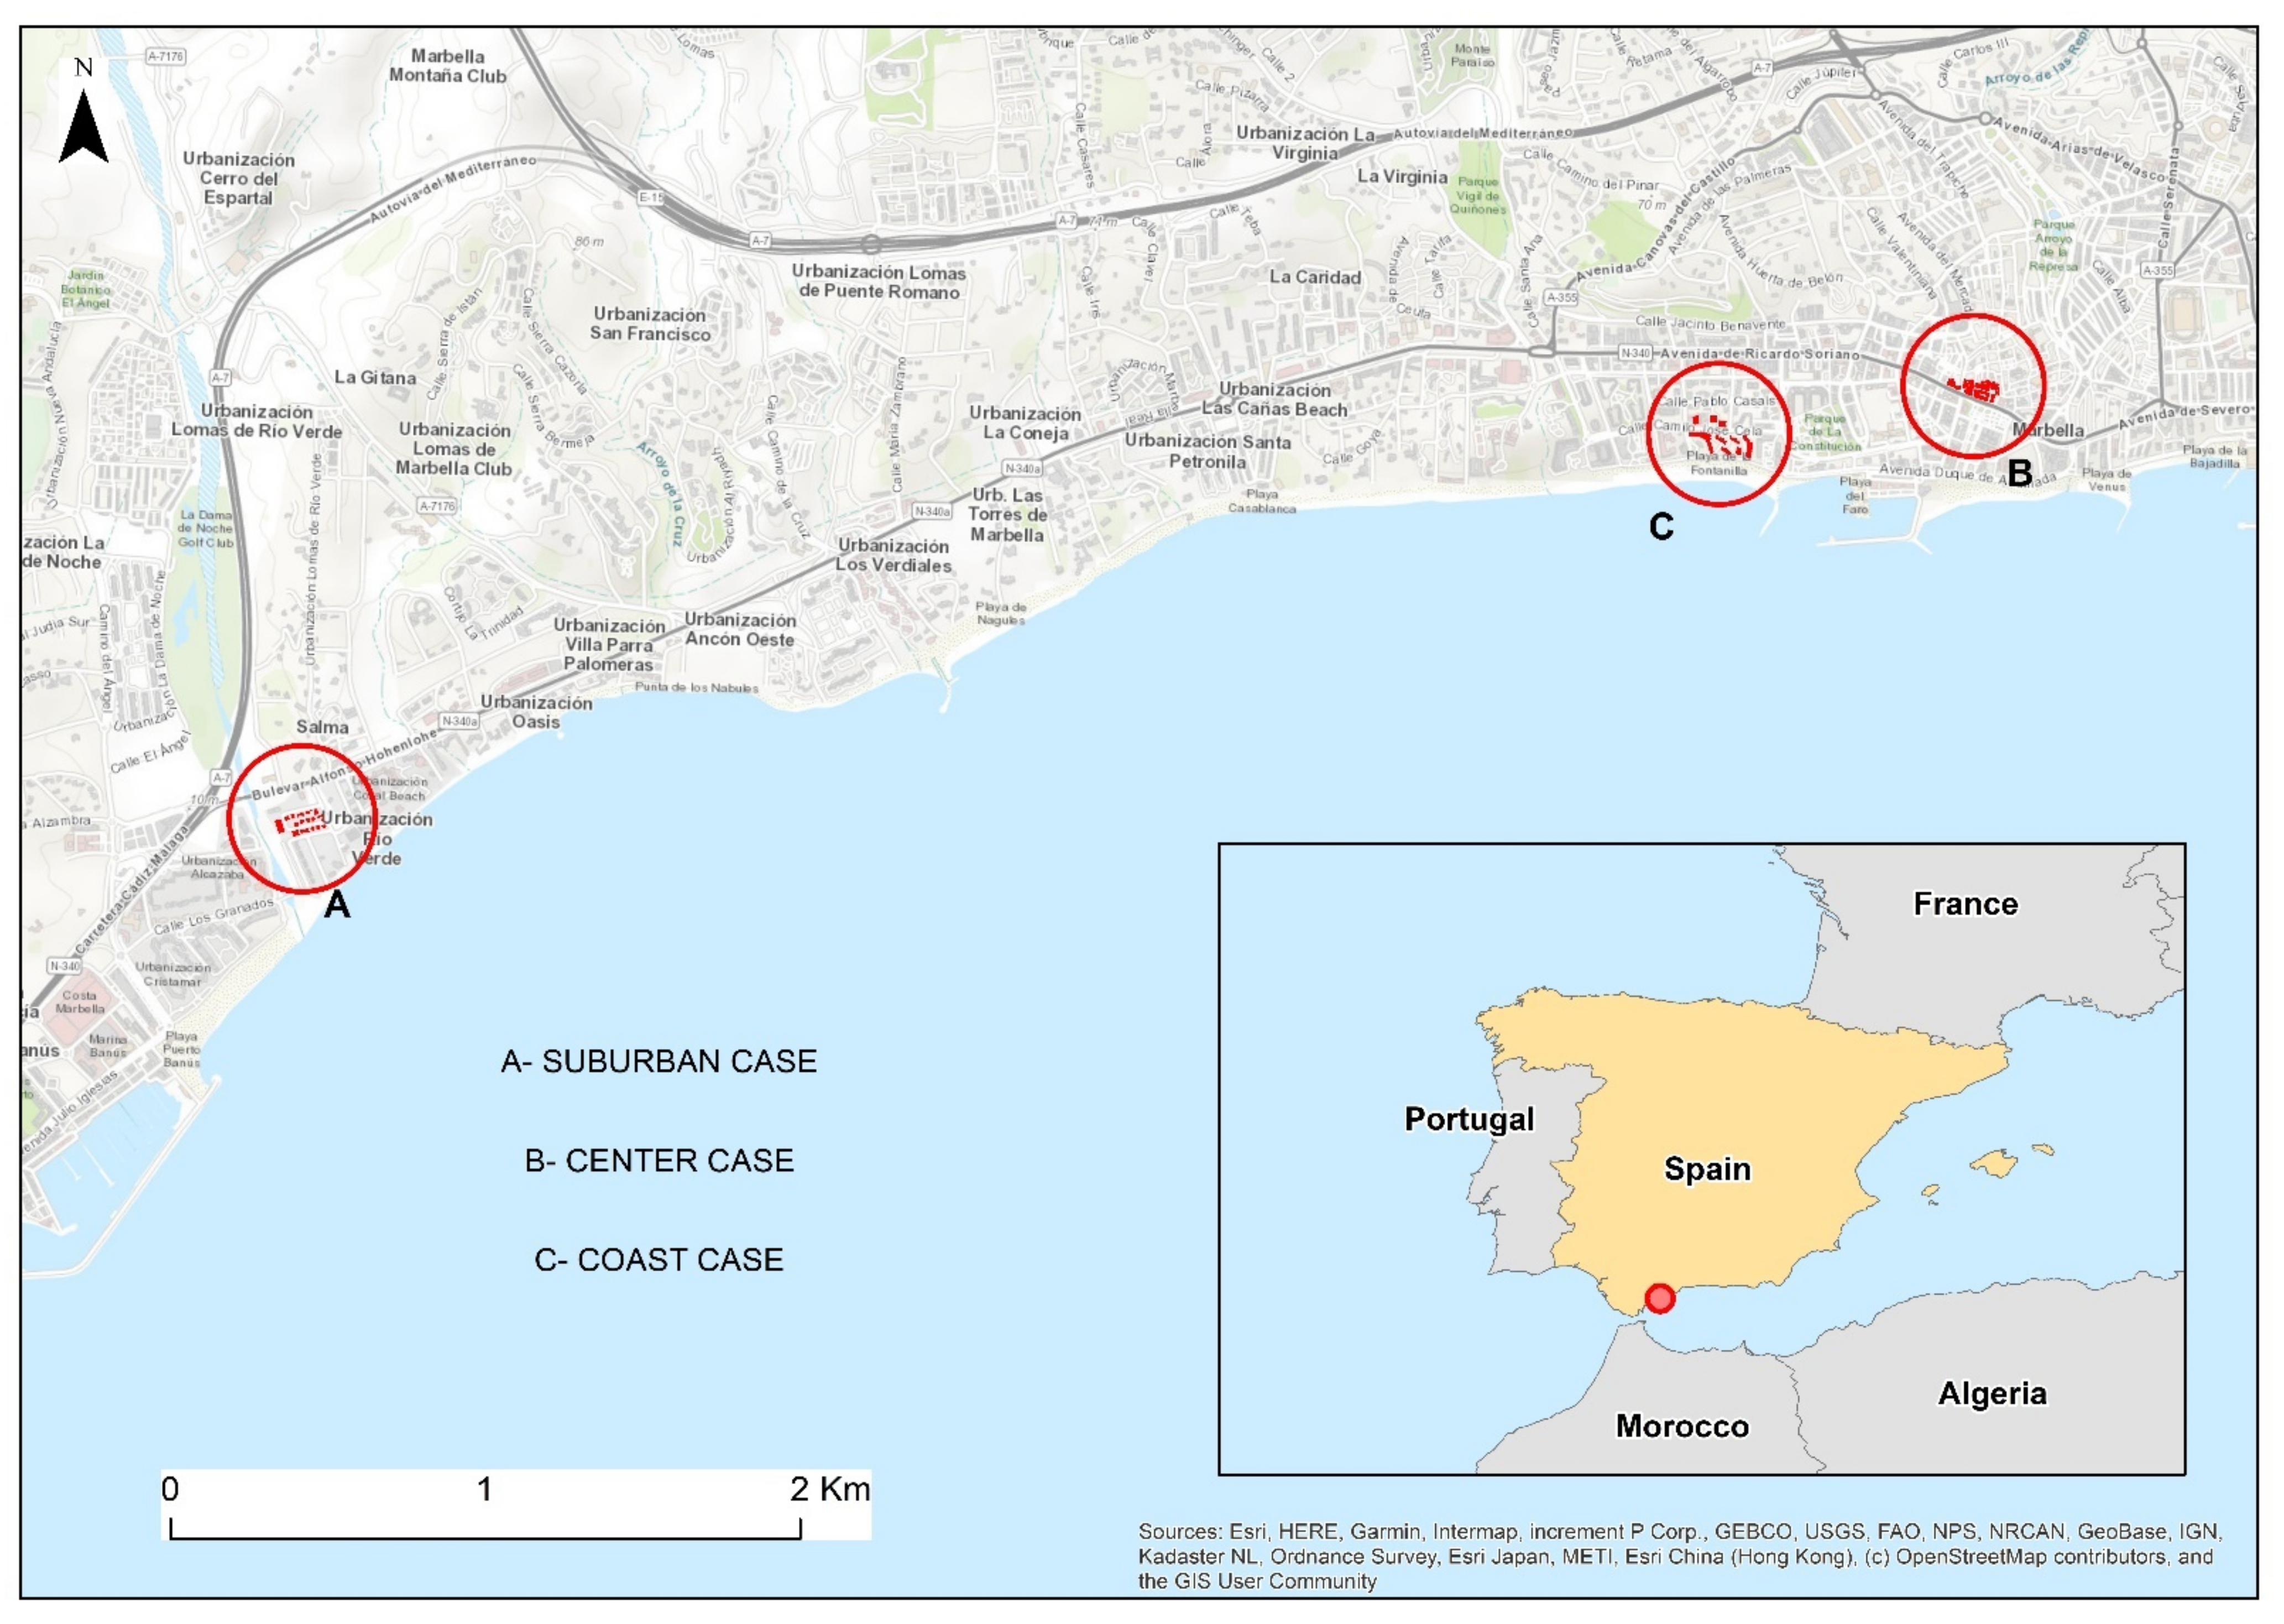
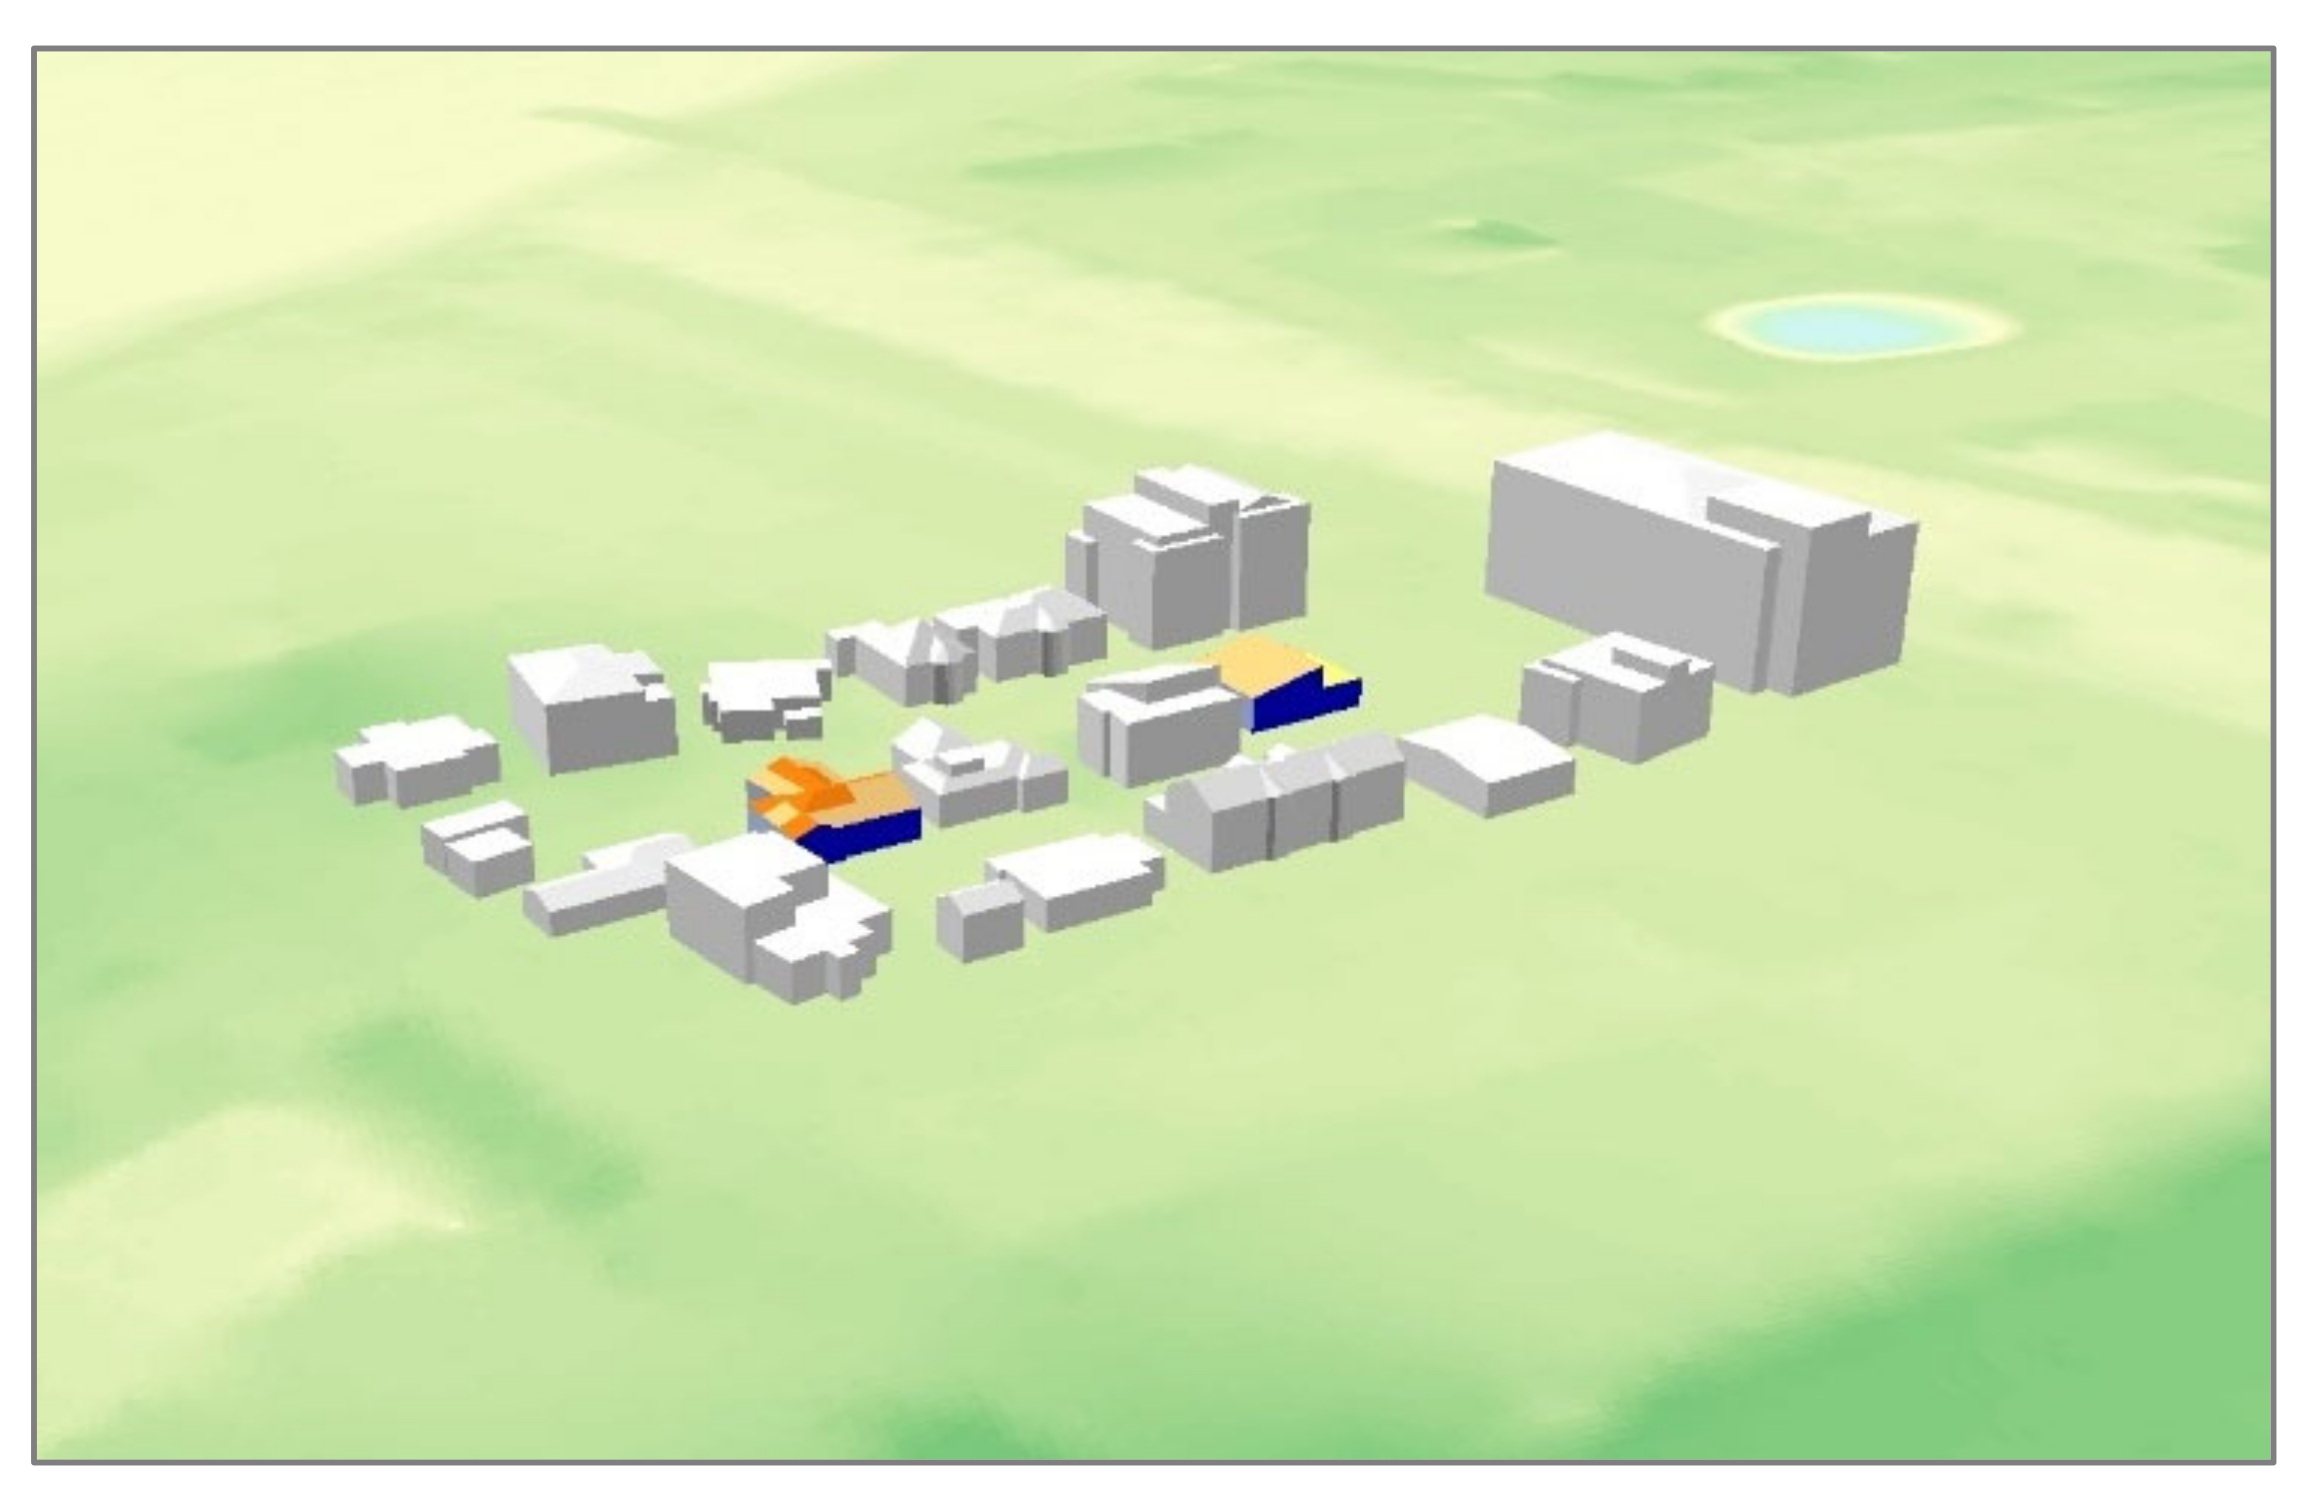
3.1. Study Area and Cases of Study

The proposed model has been applied to three sample areas in the municipality of Marbella. Marbella is located in Southern Spain, on the Mediterranean coast, and is part of the Western Costa del Sol, in the province of Málaga. Since the 1950s, it has been a touristic city of international recognition. This change in the production model broke with the traditional configuration of the town. The tourism boom brought a large increase in the population up to the present day (147,633 inhabitants in 2020) [36], and a hypertrophic and discouraging urban development that has often failed to take living conditions, in particular, in urban-centric areas into account. Urban growth has been homogeneous throughout the coastal area, forming a conurbation with the adjacent municipalities of the Costa del Sol.
The different stages of the urbanization process have a wide range of characteristics that result in a differentiated behavior in the housing market. For this reason, three areas that serve as a sample for some of the main urban typologies of the Marbella urban core have been selected. A second factor for selecting those areas was the presence of larger buildings in the surroundings, which make the lack of lighting obvious and enable the accuracy of the results to be confirmed. Each sample area selected (Figure 1) covers between 1 and 3 ha, which is essential for carrying out the study of a whole specific building and it avoids a very complex and slow processing.
  • Suburban area of single-family dwellings with some higher-pitched buildings: sample of two houses.
  • Historic centre delimited by more recent multi-family buildings: sample of a two-story building.
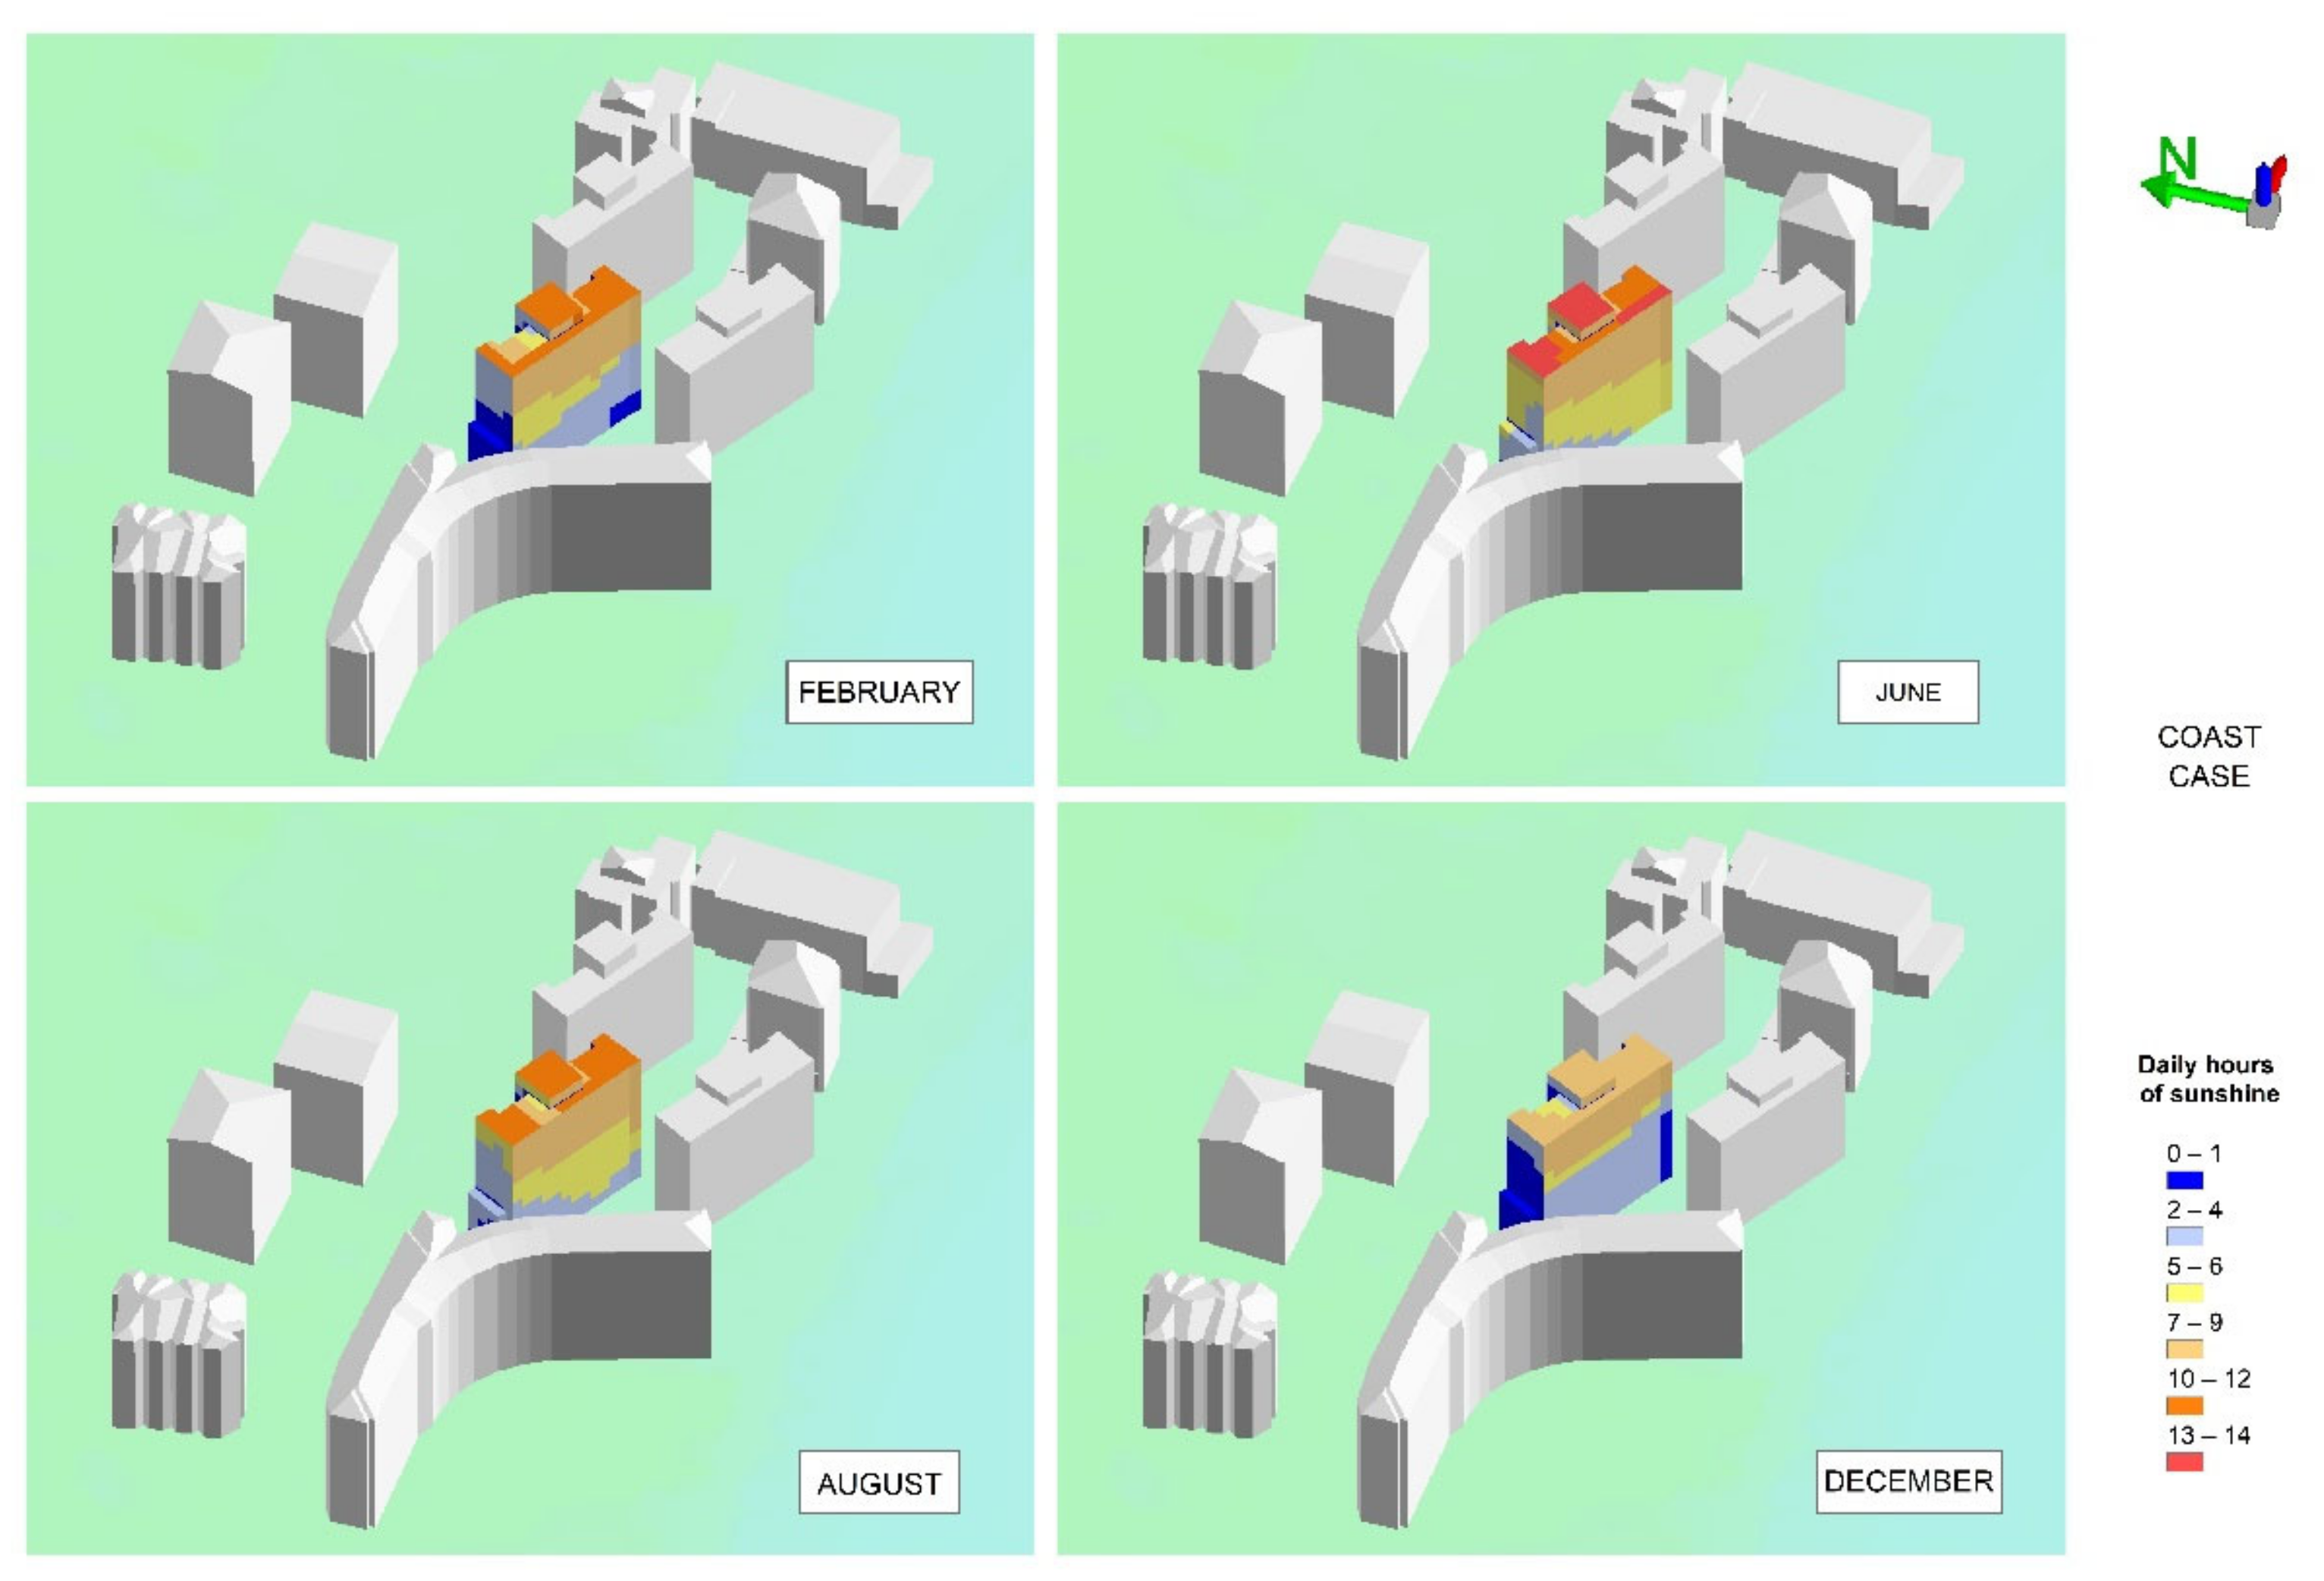
  • Urban expansion of buildings with more than six floors, next to the shoreline: sample of a multi-family building.
In total, four buildings were analyzed.

3.2. Software and Data Source Used

The software used to obtain the results of shadow hours through shadow panels were ArcGIS and ArcGIS Pro, developed by ESRI, along with the following extensions of the software:
  • ArcGIS Pro with 3D Analyst and Spatial Analyst licenses
  • ArcGIS Solutions Deployment
  • LAStools for LiDAR data processing
  • ArcGIS Solutions
On the other hand, it was necessary to have a series of data sources to obtain the results of the shadow panels in 3D buildings; these sources were composed of spatial databases of two-dimensional buildings (2D) and LiDAR data, for obtaining DEMs, which allowed the analysis and the study of the data. The data sources used are described below:
  • General Directorate for the Cadastre (DGC from its Spanish acronym): at the Cadastre Electronic Site, in its section Download vector cartography, the cadastral information Urban without historical record of the municipality is obtained. The special database, in shapefile format, is called Constru, which contains traces of the building elements in 2D.
  • Spanish National Geographic Institute (IGN): through its Download Center:
    -
    Digital elevation models. LiDAR 1st Coverage data containing the three-dimensional point cloud needed to obtain various DEM are used.
    -
    Aerial photos and images. The Most recent PNOA Ortophotos are used for the corresponding Spanish National Topographic Map 1: 50,000 (MTN50) sheet, in order to have an image of the study area as a guide or additional support for the interpretation of the results.

4. Methods and Procedure

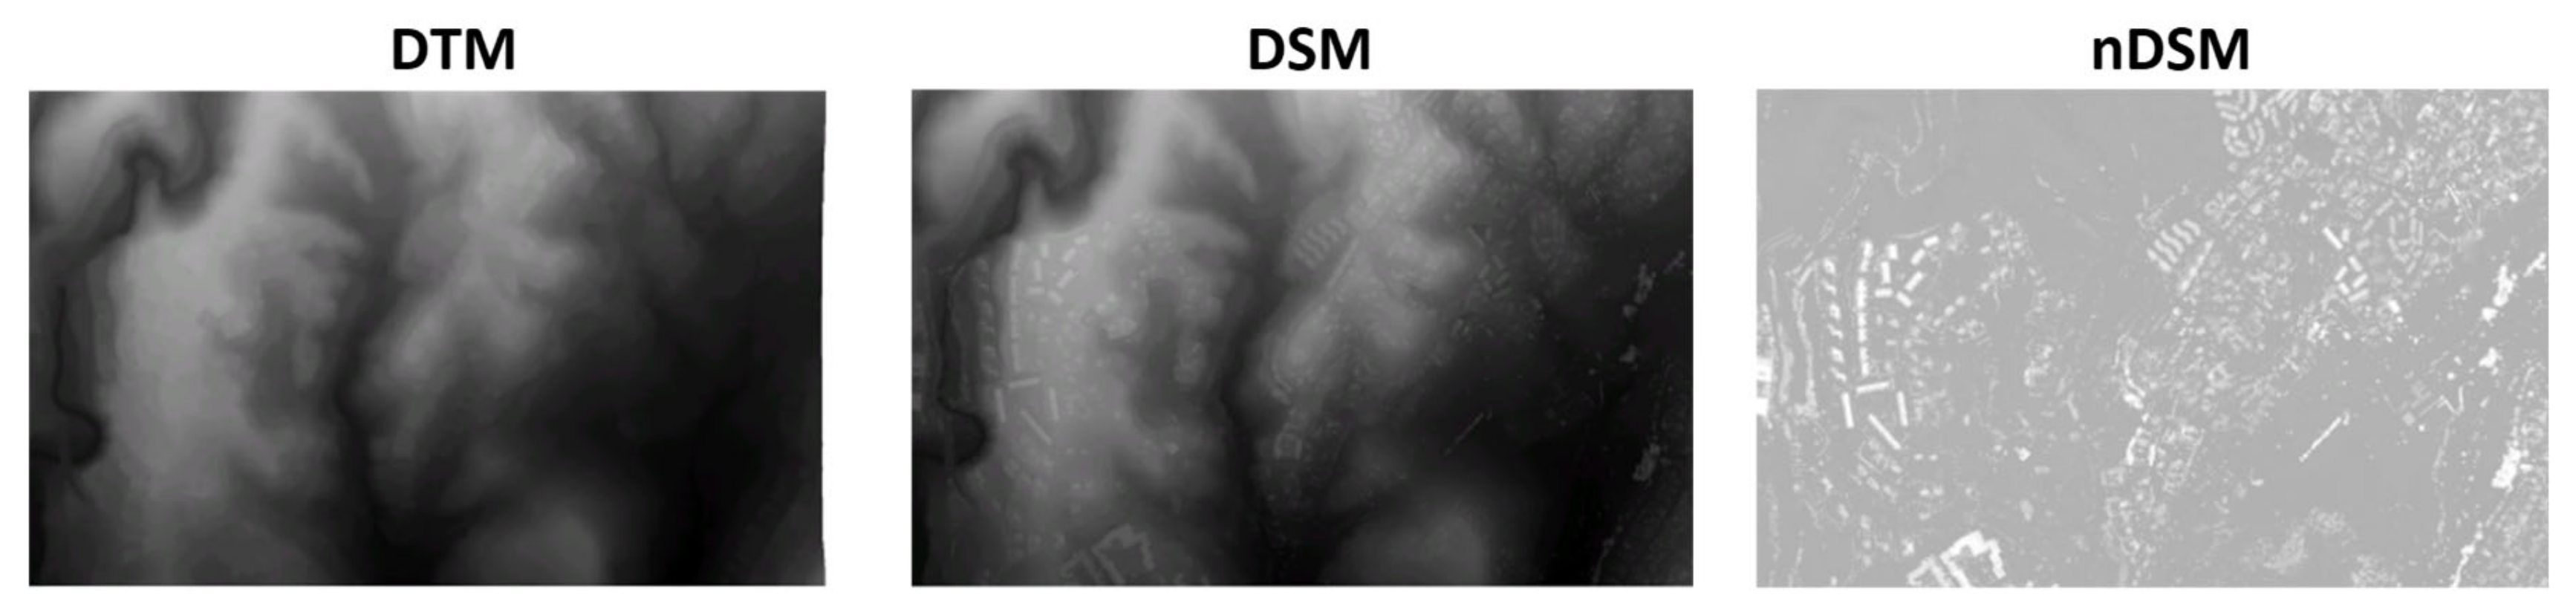
4.1. Creation of Digital Elevation Models

In order to generate a tridimensional building, it is necessary to have a three-dimensional point cloud to obtain high spatial precision DEM, such as those used in this research using LiDAR technology. It is based on a scanner that emits laser light at a target and determines its location, depending on how far the light travels before it is reflected on the object. A LiDAR point cloud shows the individual points where the laser hit an object, which enable to visualize and analyze the location of the surfaces in three dimensions. This allows to filter the laser bounces that produced different objects of the Earth’s surface and therefore, to obtain different DEMs (Figure 2):
-
The digital terrain model (DTM) shows only the terrain elevation, without buildings or other features.
-
The digital surface model (DSM) presents the elevation of the terrain and the characteristics of the terrain.
-
The standard DSM (nDSM) shows the height of the above-ground characteristics of all the buildings (the standard elevation).
The use of these three-dimensional LiDAR clouds has allowed to estimate the heights of a large number of 2D buildings. The data have been obtained from the IGN through the download of *LAZ files, from which the LiDAR three-dimensional dot cloud in *LAS format was been used, and processed using ArcGIS Pro. The three-dimensional point cloud, which can be seen in Figure 3, contains millions of units with the necessary three coordinates (X, Y, Z).

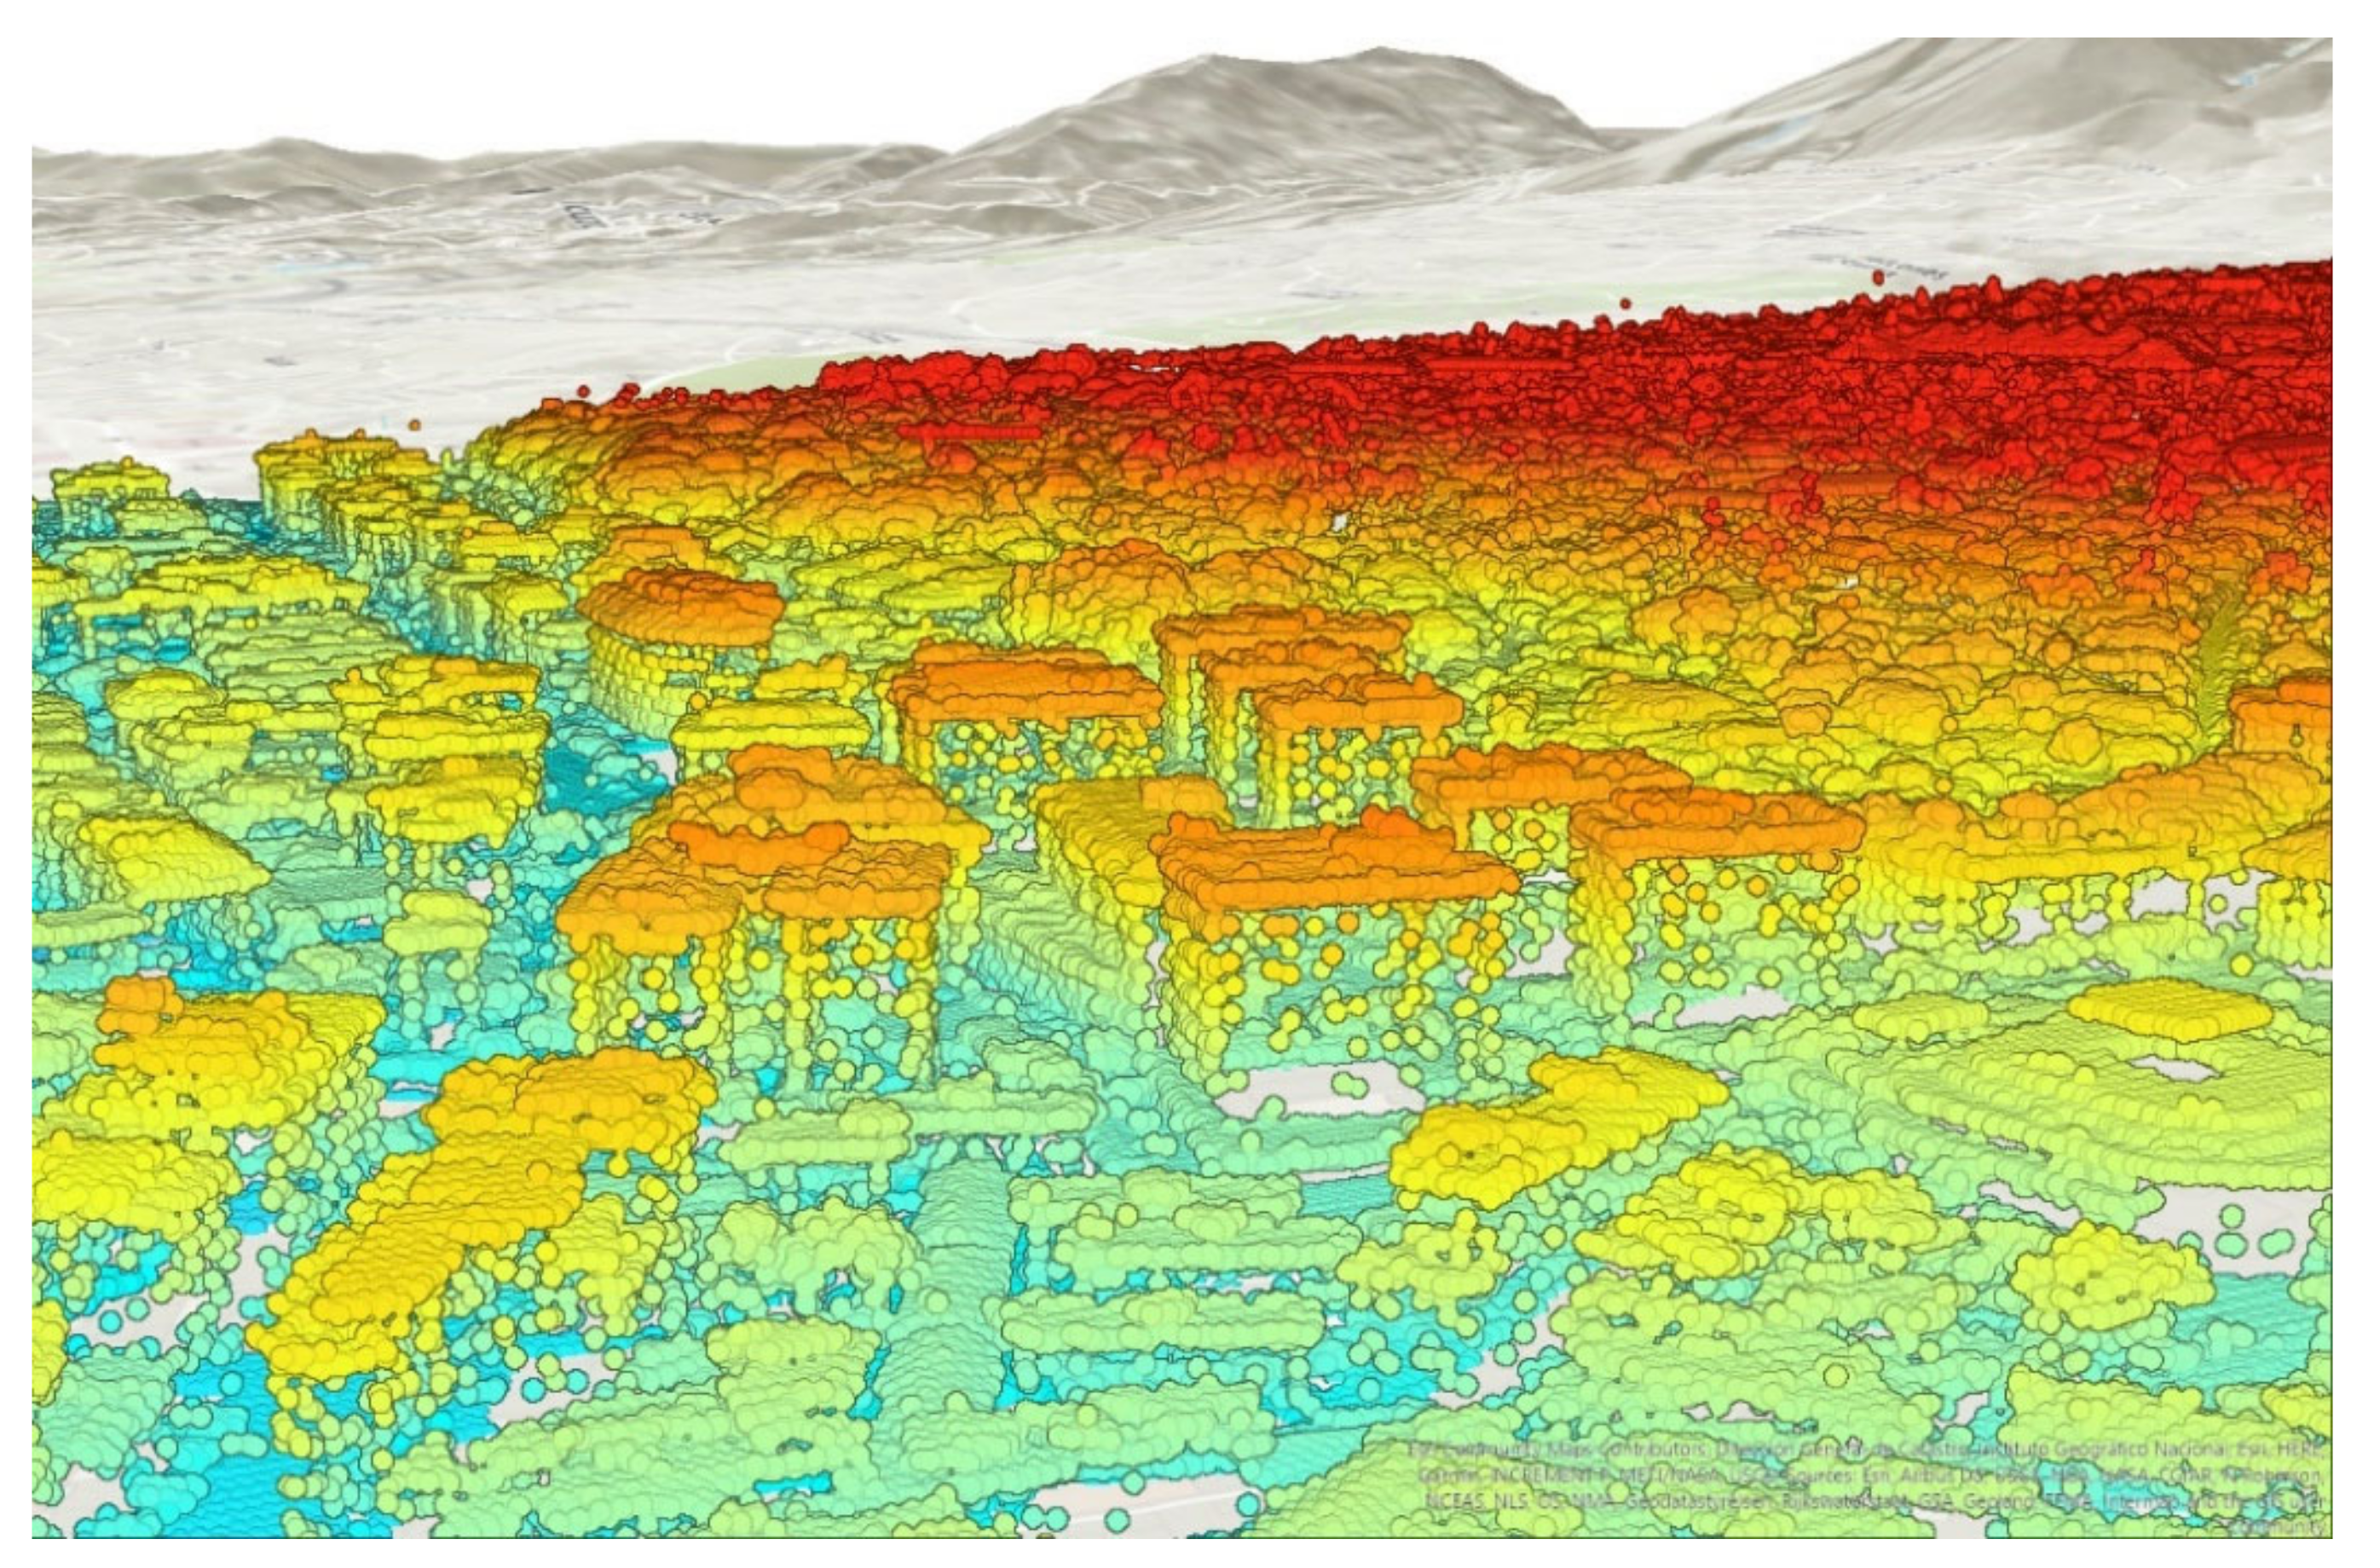
4.2. Building Creation in 3D Format (Multipatch)

In previous processes, LiDAR data were converted into three elevation layers: DTM, DSM, and nDSM. At this step in the methodology, these elevation layers and the footprints of buildings extracted from the Cadastre were used to calculate the attribute data of shapes and roof heights. The buildings in multi-patch 3D format are obtained by applying the following steps:
  • Getting building roof shapes
The created DEM rasters (DTM, DSM and nDSM), together with the footprints of the building in two dimensions (2D) obtained from the Cadastre, were used to calculate the attributes, the shapes and the height of the roofs. The Publish Schematic Buildings tool from ArcGIS Pro Publish Schematic Local Government Scene toolkit was used to extract the roof shapes of the buildings. This tool generates a new layer in which attributes are added to the footprints of 2D buildings. Specifically, seven new fields are generated in the attribute table of the 2D building footprint, depending on the number of DEMs used as input. The fields are explained in the following list:
  • BLDGHEIGHT (Building height): the maximum height of the building.
  • EAVEHEIGHT (Eave height): the minimum building height. Buildings without eave height have flat roofs.
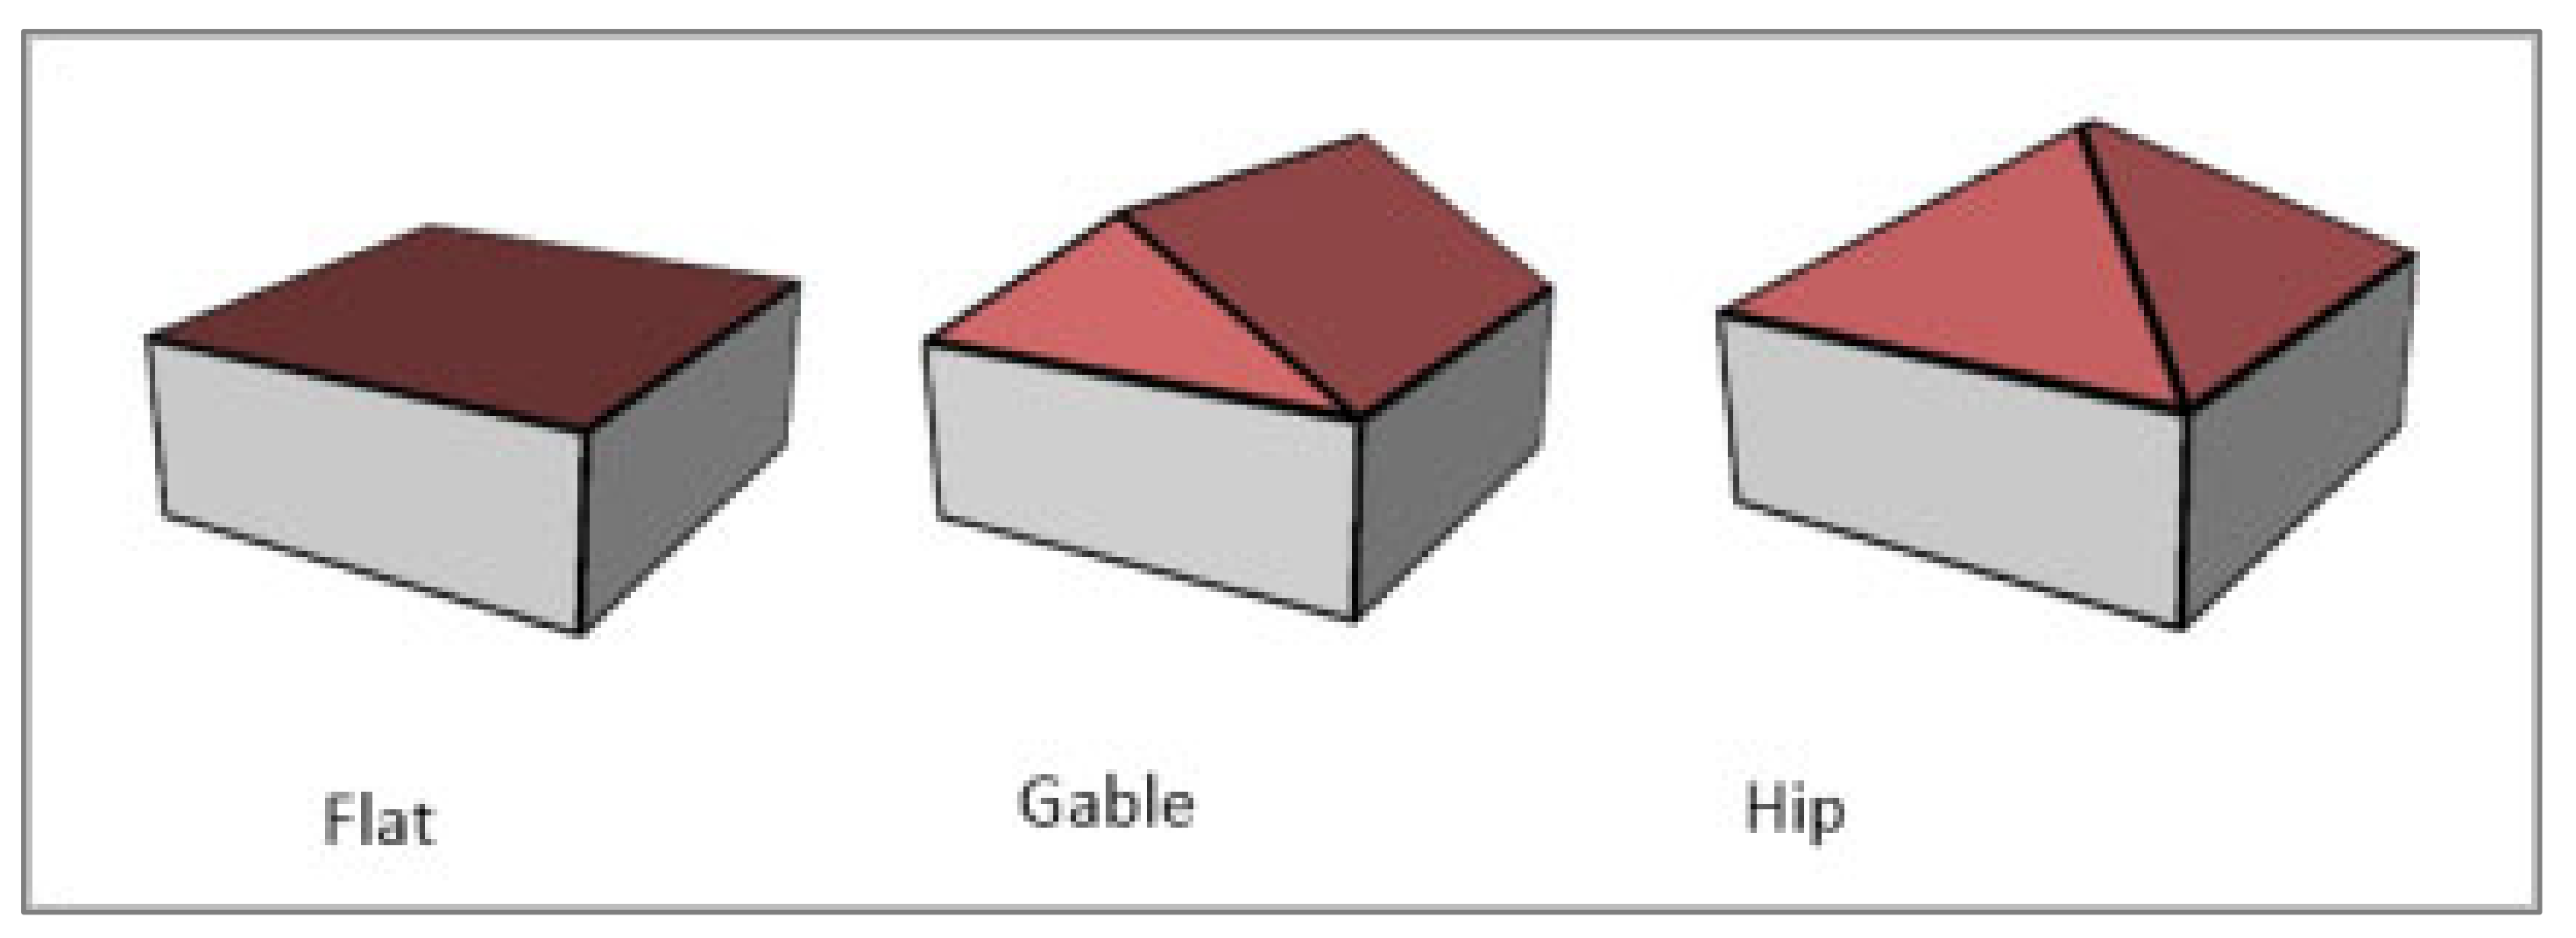
  • ROOFFORM (roof shape): the shape of the roof that is identified in the footprint of the buildings. The shape of the roof can be flat, gable or hip (Figure 4).
  • BuildingFID: the building’s internal ID number.
  • BASEELEV (elevation of the base): the height of the base of the building, generally equal to the elevation of the floor where the building is located.
  • ROOFDIR (roof direction): the direction of the compass (in degrees) of the roof. Only the gable roof shapes have values for this field.
  • RoofDirAdjust (Adjusted roof direction): This field allows adjustment of the roof direction. The default value is 0. A value of 1 rotates the roof counter clockwise 90 degrees, while a value of 2 rotates it 180 degrees. This field is used to manually edit cover forms that were incorrectly extracted and that are not used in this step.
B.
Checking the accuracy of the roofing of buildings
The degree of accuracy of building footprints in buildings is checked with the built-in roof shape attributes. This procedure is performed through the Confidence Measurement tool, which calculates the root mean square error (RMSE). This tool assesses the difference between the roof shape data containing the footprints of 2D buildings and the values used in the DSM. A high RMSE indicates a high error for the generated building footprints, which can be caused by two reasons: on the one hand, incorrect entering of the roof shape into the building footprint or, on the other hand, a misinterpretation of LiDAR data. This step is very important, as it allows detecting errors and correcting them, obtaining a much more reliable 2D building footprint.
C.
General correction of buildings
One of the most common problems is that the footprint of the buildings undergoes a distortion or displacement in XY coordinates with respect to orthophoto images and DEM data. It is very important to correct these geometric errors derived from the Cadastre data by modifying the vertexes. For this purpose, a visual review has been carried out and all traces of buildings distorted or displaced have been adjusted, until an optimal level of alignment between the two data sources has been obtained. The Modify Roof Form tool, integrated into the Publish Schematic Local Government Scene toolkit of the ArcGIS Pro software, has allowed to carried out these corrections.
D.
Conversion from 3D polygon to multipatch format
The footprint of the buildings, symbolized so far to be seen in a 3D form, are 2D entities. If these entities were shared with another user, this information would have to be re-symbolized in order to be visualized in 3D format. In order to permanently maintain the 3D features, the 2D format is exported to multipatch 3D format through the option Convert to Multipatch Feature Class, included in the toolkit Publish Schematic Local Government Scene.

4.3. Shadow Impact Analysis

The calculations of shadow hours carried out through the panels that compose the buildings require the multipatch files obtained in the previous steps. The total computation of shadow hours for each building has been achieved using the Shadow Impact Analysis tool, available in ArcGIS Pro. Before the launch and execution of the tool, a couple of basic concepts have to be defined in order to allow the correct calculation of the shadow hours for each building within the study area.
  • Solar position
Different solar position models have been developed for specific dates. This is essential to calculate the shadow panels of the buildings, according to the date of the year to be analyzed. In order to generate solar position patterns, it is necessary to configure a series of boundary conditions in the Create Sun Position option of the Shadow Impact Analysis tool. These boundary conditions are detailed below:
-
Input observer: these are the elements for which the impact of the shadow has to be calculated (e.g., a park or a building).
-
Elevation and horizon of the observer: this parameter will be automatically calculated by the software, otherwise, the condition Elevation Observer is set with the average elevation of the observing entity, and the field Observer Horizon Distance is set with a value slightly larger than the radius of the reference data.
-
Time zone: the time zone of the study area. In this work, the time zone of Madrid (Spain).
-
Start and end date and time: start and end date for each analysis. In this work 4 different solar periods are used, which are detailed below, in Table 1:
-
Time interval: the temporality that the tool uses to calculate the different positions of the sun is defined. In this work, this parameter was set at 30 min.
Solar point locations are only used for viewing purposes (Figure 5). All shadow impact calculations are based on the attributes of the characteristics of the solar points, which use the distance from the horizon to establish the distance to the observer and obtain the shadow calculations.
B.
Shadow panels
The Create Shadow Panels function of the Evaluate Shadows toolkit was used to estimate the shadow hours that affect all the 3D constructions in each period. The tool allows assessing the impact of the characteristics of each shadow over buildings, and it calculates the duration and the accumulated area of shadows for the selected period of study. The shadow accumulation data representing an attribute for each 3D building stage were essential for obtaining data, both for shadow and for hours of illumination. This allows a series of analyses and comparisons between different buildings, different orientations within the same building, and between different floors of the same building.
The data used in this tool to obtain the shadow panels are as follow (Figure 6):
  • Observer Features: calculates the impact of the building’s shadow.
  • Output Shadows Panels: generation of panels containing the calculated shadow attributes.
  • Panel Size: the size of the observer panel in meters. In this work, it was decided to use a 3-m-length panel since it is the standard height of a floor in a building. This means that a panel is created every 3 m and was adjusted to the number of floors of the 3D building. For the finish of non-quadrangular forms, such as roofs, some panels are smaller. The results were therefore calculated on the basis of the total area and not on the basis of the panel as a basic unit.
  • Sun Position: the solar positions created and developed in previous steps are used.
  • Obstruction Features: all the buildings in the surroundings that can cast shadows on the evaluated building have been chosen. While this parameter is optional when using the tool, it is appropriate to include this information, since it improves the results.
  • Use Observer Features as Obstruction: this option checks if the observer function of a 3D volume can cast shadows. In this work, the 3D buildings were considered as the observers, and, as the buildings always cast shadow on themselves, it was appropriate to leave this option enabled.
  • Obstruction Terrain: is necessary to incorporate the surface model of the elevations that can cast shadows on the characteristics of the observer, that is, the DSM of the study area.
The data obtained when using this tool are the following:
shadow_h: the amount of shadow hours in each building panel.
shadow_hits: the number of time intervals (sun positions) that each building panel is in the shadow.
num_suns: the number of sunlight hours received by each building panel.
Starting_date: initial date and time of the performed analysis.
Ending_date: final date and time of the performed analysis.
It is important to note that the shadow measurements correspond to the amount of solar positions that do not have direct contact with the panel of the building under analysis. For this process, a 30-min time iteration was established, resulting in two shadow measurements per hour.

4.4. Comparison of Shadow Models between Different Scenarios

In this research, the objective was to compare the received and accumulated shadow impacts in the selected construction units, considering the differences between the solar days on the same building. The comparative analyses used for each study areas are described below:
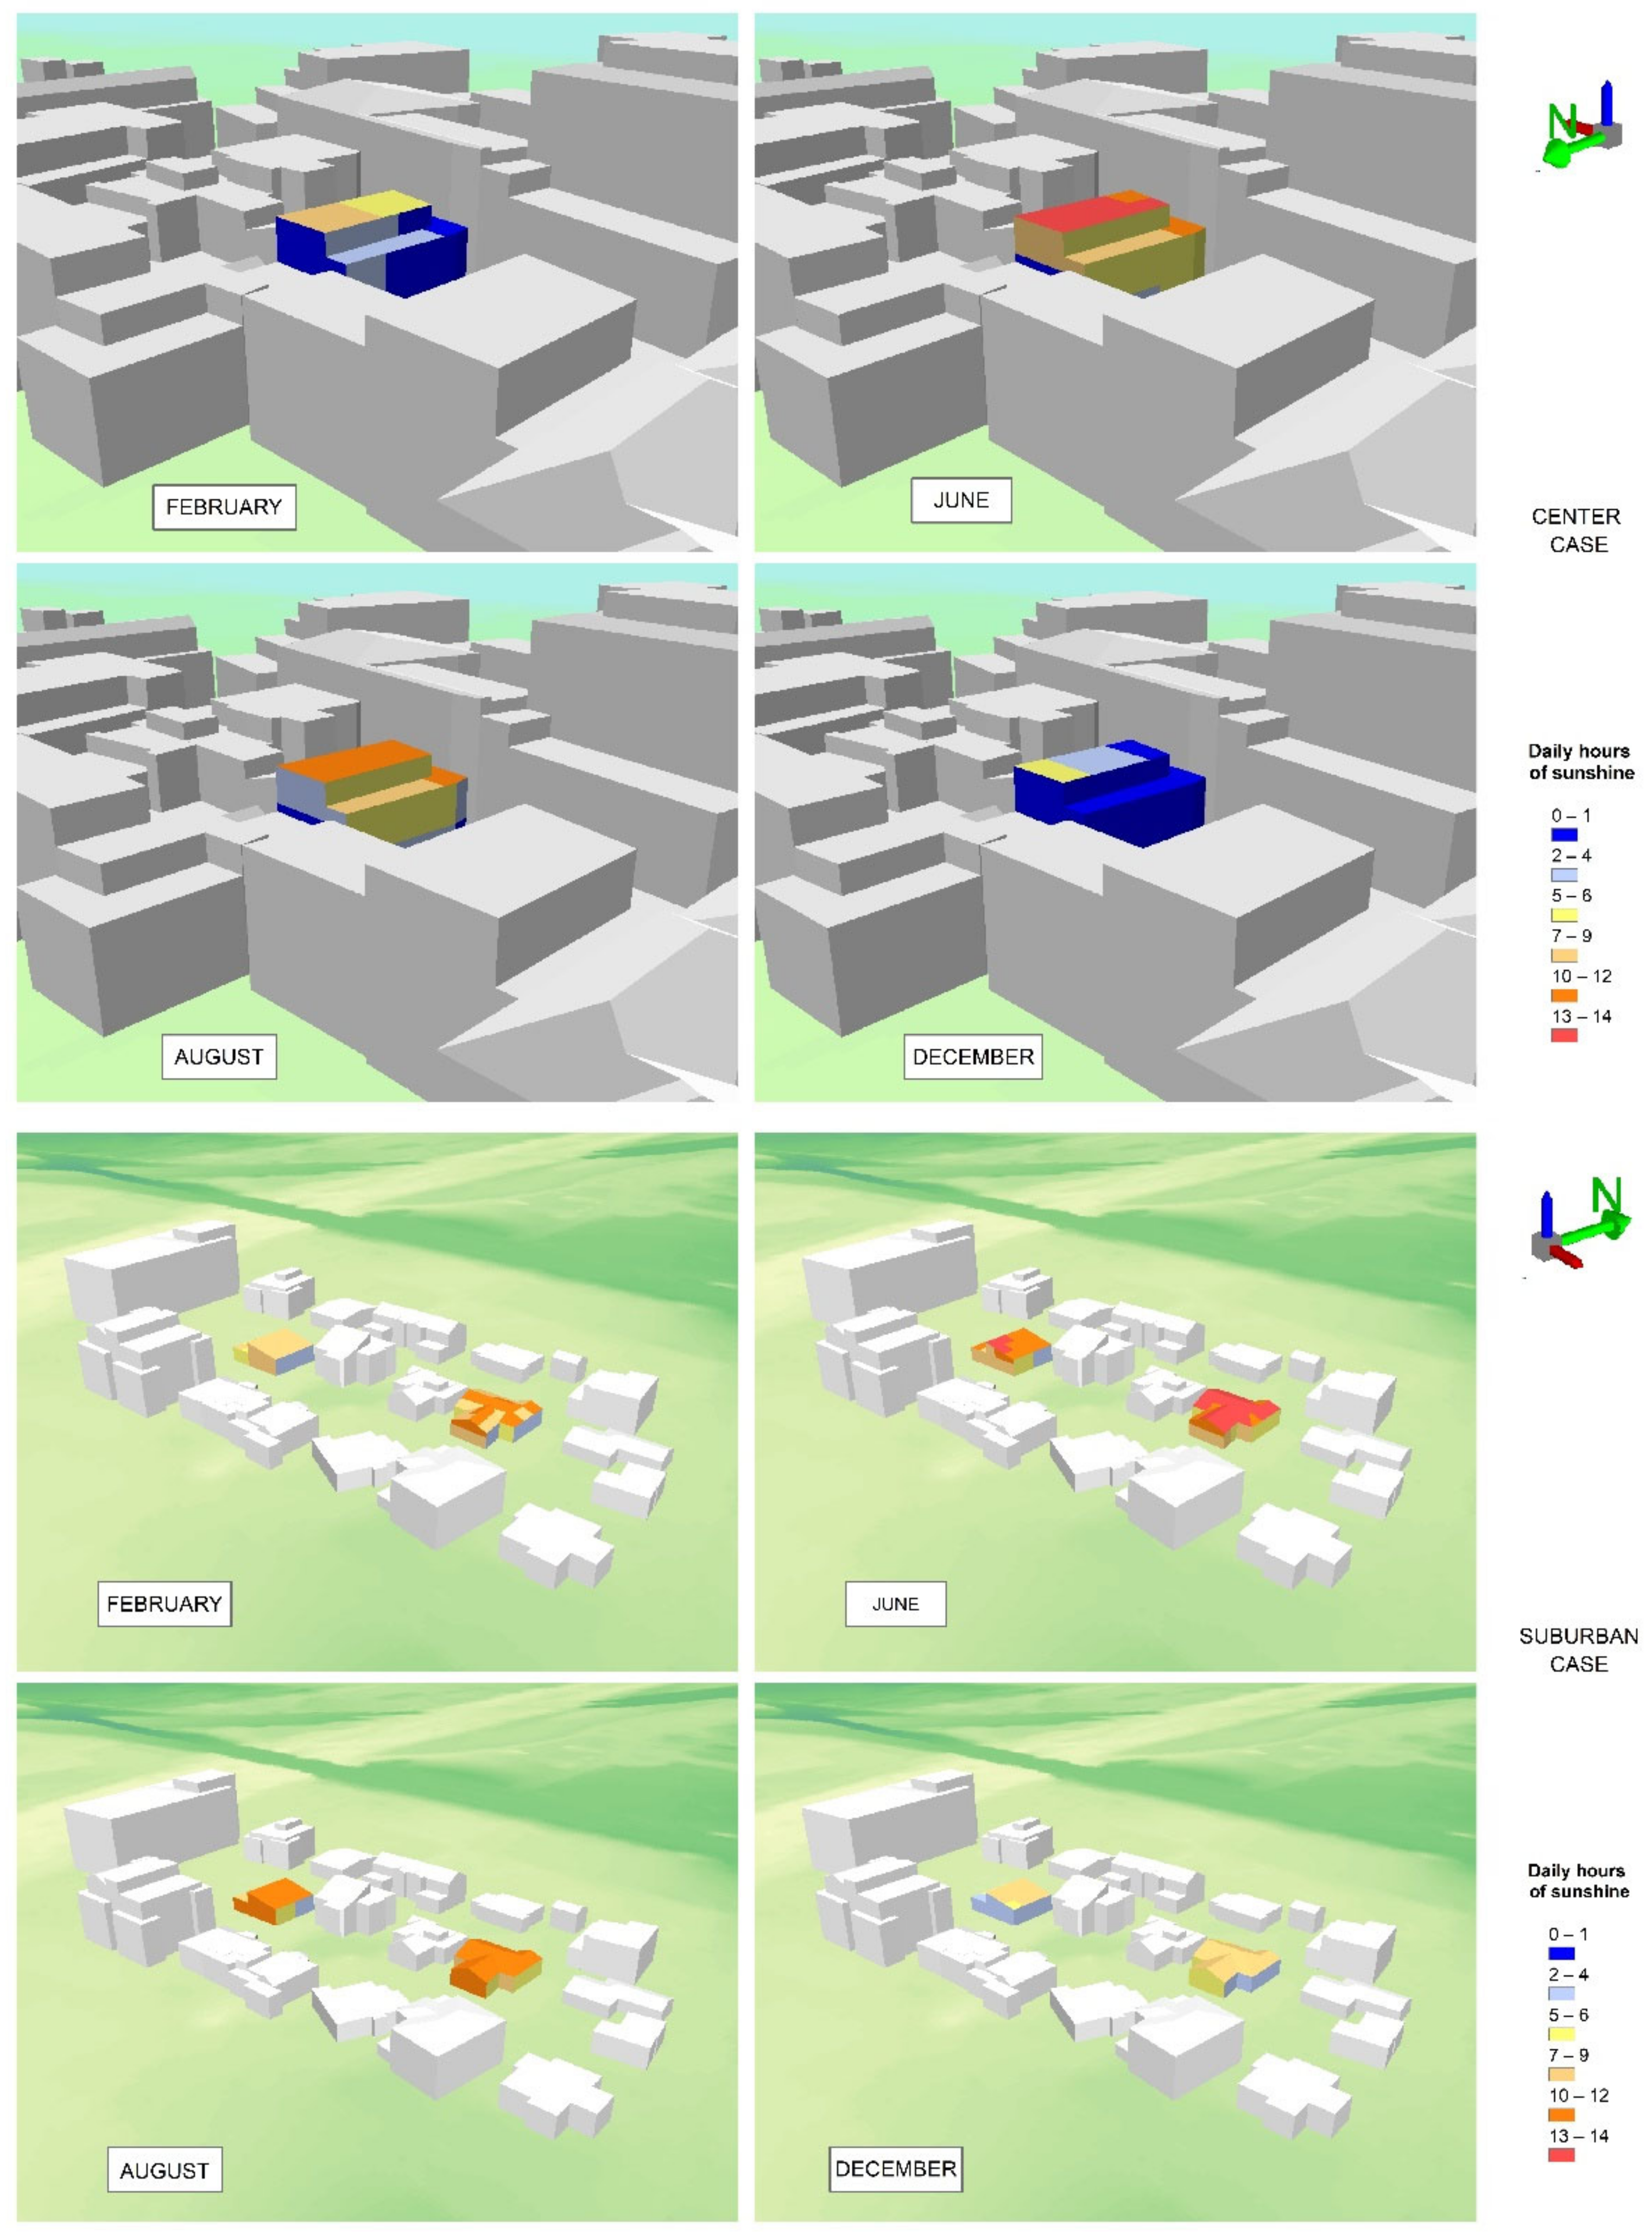
  • Measurement at different dates of the year (February, June, August and December) for each building.
  • Comparison between two single-family houses with similar characteristics.
  • Comparison between case studies with a different construction environment.
  • Comparison between different orientations of the building façade.
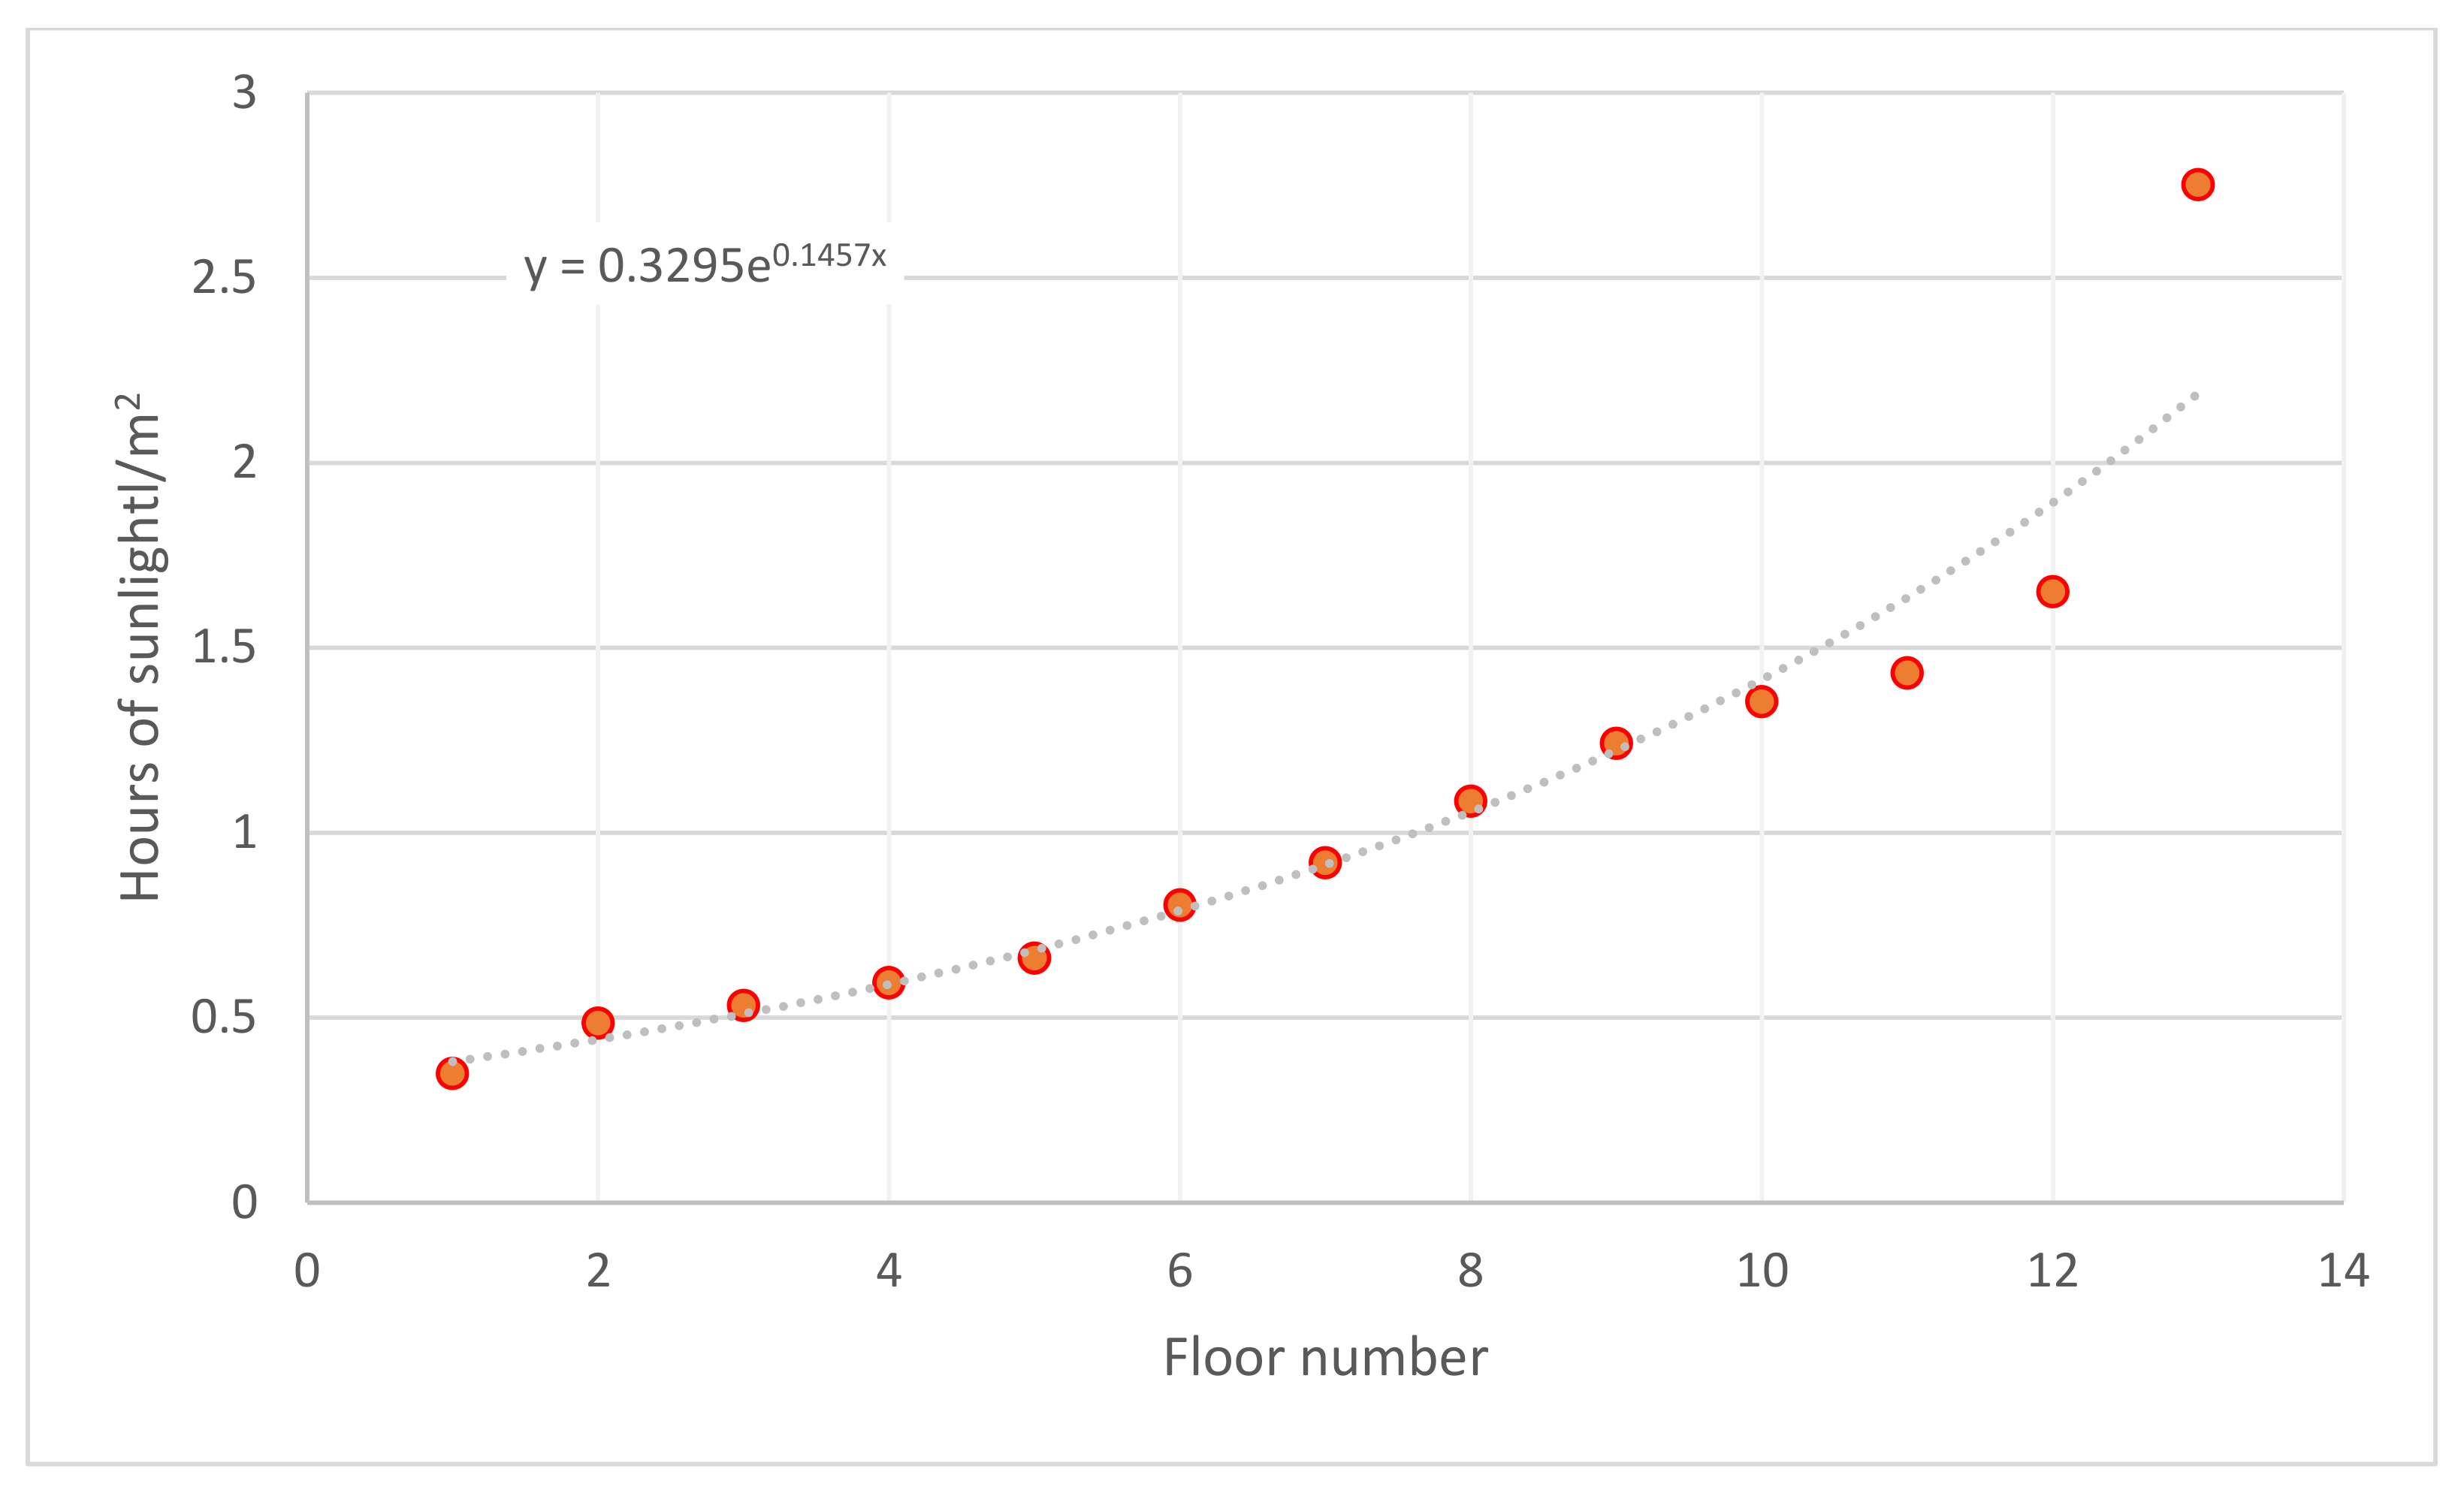
  • Comparison for the same date between different floors of the building.
The Compare Shadows tool is used to compare shadow impacts between two scenarios. This tool is executed to compare differences in the shadow at a single point in time, or to compare differences in the accumulated shadow at several points in time.
Another tool used to obtain results is Calculate Shadow Areas, which provides results from areas that meet certain shadow criteria (e.g., areas that experience more than five additional hours of shadow).
The summary of the methodological steps followed in this research is outlined in the flowchart shown in Figure 7.

5. Results

The solar exposure calculations generate an estimation of the periods in shadow, taking the elements raised in multipatch format into account. The time that the surface receives direct sunlight, which is based on the time that the surface spend in the shadow, was chosen to interpret the results. The graphical representation of the results can be seen in Figure 8.
Table 2 shows the wide difference in direct sunlight between the study samples. Overall, the case of the historic center has very low lighting values, and the roof is the only area of the building with a noticeable sunlight reception all year around. The low luminosity in the south façade can also be highlighted, despite having an orientation that receives more hours of sun in the northern hemisphere.
In the case of the two single-family dwellings, a greater annual luminosity is observed, with a greater number of hours of sunlight in all their façades. It can be observed how the proximity of “Periphery 1” to a high building reduces by almost half (42%) the reception of sunlight with respect to “Periphery 2”. In addition, it should be noted how the difference between the two cases in December at its south façade, which is a fundamental source of light and natural heat for the habitability of the building, is especially significant.
In the case of the multi-family buildings, as can be seen in Table 3, there is a wide illumination difference between the ground floor (1–3) and the upper floor (10–13). In June, when the range is greater (2.8 h/m2) in the general computation of the four façades of the building, there is an increase in luminosity of 350% between the ground and the top floors. This difference is logically reduced during the rest of the year, as the solar time exposure decreases. However, in February, the difference may imply receiving (or not) direct sunlight. The façades of floors 1–6, with north and west orientation, lack direct sunlight. Another aspect to consider is the difference in solar time exposure due to the orientation of the façade. The difference between two houses located on the same floor, but opposite in their orientation, is 0.4 h/m2, which means that the south side quadruples the reception of direct sunlight.
Finally (see Figure 9), it should be noted that, although the degree of correlation between the floor of the house and the sunlight is high (0.91), there is a greater quantitative leap between the group of higher floors and the rest of the floors, so that both variables do not maintain a linear correlation.
Logically, this increase in sunlight on the top floor is intensified if the light received by the ceiling is taken into account, which can be used thanks to skylights or terraces in the house.

6. Discussion and Conclusions

The results show the potential of a tool to measure the shadows that are casted on a building. The study cases show different phenomena, which are difficult to verify with isotropic terrain models. On the one hand, it makes possible to compare the conditions of luminosity between similar and even close real estates, being able to detect significant differences not appreciable a priori. This is the case of the two suburban single-family dwellings with the same layout and orientation, but with buildings in the immediate surroundings that can have a considerable impact on their habitability. It also allows to observe how dwellings with the most desired orientation on the Costa del Sol (South), can have constructive obstacles precisely in this orientation. Finally, the measurement of the differences in sunlight between floors of a multi-family building is a contribution of interest. Although due to the urban complexity of its environment, it is not properly appreciated, it can provide detailed information for estimating the value of the dwelling and, at the same time, it can help potential inhabitants to know the lighting of the dwelling. The non-linear correlation between the height of the floor and the sunlight is a very useful tool in weighting the choice of buying or renting a house, together with other factors involved in such a decision.
The greatest challenge of this methodology, at least in Spain, is to carry out a readjustment work between the information of the building footprint and the LiDAR information for the obstruction of the buildings. Currently, the systematic development of this methodological procedure is not completely effective due to the level of detail of LiDAR modelling and the difficulty of processing in conventional computers, but it will be a very useful tool in the near future. It is also expected to introduce other urban elements, which influence the calculation of lighting in the future, such as vegetation.
The measurement of this environmental variable can be used for architectural studies, when considering the distribution of rooms or other structural elements of a dwelling, as well as to improve its energy efficiency. It can also be useful in real estate matters, in order to know the characteristics of the product for sale and to adjust its price in relation to other properties; and it can be effective in spatial planning and management to systematically analyse the environmental conditions of larger areas, such as urban districts. In future researches, it would be interesting to take not only the impact of sunlight, but also its inclination angle into account, in order to assess how much it penetrates into the interior of the house.
Apart from the aforementioned line of research, this methodology can play a fundamental role in solving energy and thermal problems of dwellings in the context of cities that try to be more efficient from an energetic perspective, and that must deal with environmental problems such as heat islands.

Author Contributions

Hugo Castro Noblejas designed the conceptual approach; compiled previous and current researches; analyzed the data, interpreted the results and was involved in writing the manuscript. Juan Francisco Sortino Barrionuevo and Hugo Castro Noblejas were involved in the design of the methodology. Juan Francisco Sortino Barrionuevo was involved in writing the manuscript and the design of complementary material. Matías Francisco Mérida Rodríguez was involved in writing the manuscript, and revised and approved the final version of the manuscript. Darío Gumiel Muñoz revised background and developed the methodology. All authors have read and agreed to the published version of the manuscript.

Funding

This work is part of the project “Paisaje y valor inmobiliario en diversos modelos territoriales de entornos litorales y sublitorales mediterráneos”, financed by the Ministry of Sciences, Innovation and Universities (Spain) (PGC2018-097652-B-I00). Main researcher: Matías F. Mérida Rodríguez.

Acknowledgments

The authors would like to thank ESRI for providing ArcGIS Pro technical support.

Conflicts of Interest

The authors declare no conflict of interest.

Abbreviations

2DTwo-dimensional space
3DThree-dimensional space
BIMBuilding Information Modelling
DEMDigital Elevation Models
DGCGeneral Directorate for the Cadastre
DSMDigital Surface Model
DTMDigital Terrain Model
GISGeographic Information System
IGNSpanish National Geographic Institute
LADMLand Administration Domain Model
LiDARLight Detection and Ranging
MTN50Spanish National Topographic Map 1: 50,000
nDSMStandard digital surface model
PNOASpanish National Plan for Aerial Orthophotography
RMSERoot-mean-square error

References

  1. World Bank. (s.f.). Urban Population. 2021. Available online: https://data.worldbank.org/indicator/SP.URB.TOTL.IN.ZS (accessed on 3 February 2021).
  2. Garcia Pozo, A. A nested housing market structure: Additional evidence. Hous. Stud. 2009, 24, 373–395. [Google Scholar] [CrossRef]
  3. Andrić, I.; Gomes, N.; Pina, A.; Ferrão, P.; Fournier, J.; Lacarrière, B.; Le Corre, O. Modeling the long-term effect of climate change on building heat demand: Case study on a district level. Energy Build. 2016, 126, 77–93. [Google Scholar] [CrossRef]
  4. Park, Y.; Guldmann, J.M. Creating 3D city models with building footprints and LIDAR point cloud classification: A machine learning approach. Comput. Environ. Urban Syst. 2019, 75, 76–89. [Google Scholar] [CrossRef]
  5. Calugaru, A.; Anca, P.F.; Vasile, A. 3D cartography in urban environments for municipal administrations. In Proceedings of the 6th International Conference on Cartography and GIS, Albena, Bulgaria, 13–17 June 2016; p. 725. Available online: https://www.researchgate.net/profile/Temenoujka-Bandrova/publication/309772611_6th_International_Conference_on_Cartography_and_GIS/links/5d13644a299bf1547c7f9906/6th-International-Conference-on-Cartography-and-GIS.pdf#page=725 (accessed on 14 October 2020).
  6. Murtiyoso, A.; Veriandi, M.; Suwardhi, D.; Soeksmantono, B.; Harto, A.B. Automatic Workflow for Roof Extraction and Generation of 3D CityGML Models from Low-Cost UAV Image-Derived Point Clouds. ISPRS Int. J. Geo Inf. 2020, 9, 743. [Google Scholar] [CrossRef]
  7. Kolbe, T.H. Representing and exchanging 3D city models with CityGML. In 3D Geo-Information Sciences; Springer: Berlin/Heidelberg, Germany, 2009; pp. 15–31. [Google Scholar]
  8. Martín-Vares, A.V.; Olivares García, J.M.; Groeger, G. El Catastro que nos viene... El Catastro de edificios en 3D en los países europeos y la definición de las especificaciones de los edificios para la infraestructura de datos europea. CT Catastro 2010, 70, 27–43. [Google Scholar]
  9. Ungur, A.B.; Tudor, S.; Ferencz, Z. Example of a GIS Application afferent to the introduction of real estate cadastre in Cluj Napoca city, using AutoCAD Map 3D. Int. Multidiscip. Sci. GeoConference SGEM 2016, 3, 207–214. [Google Scholar] [CrossRef]
  10. Poux, F.; Billen, R. Voxel-based 3D point cloud semantic segmentation: Unsupervised geometric and relationship featuring vs. deep learning methods. ISPRS Int. J. Geo Inf. 2019, 8, 213. [Google Scholar] [CrossRef] [Green Version]
  11. Neuville, R.; Pouliot, J.; Poux, F.; de Rudder, L.; Billen, R. A Formalized 3D Geovisualization Illustrated to Selectivity Purpose of Virtual 3D City Model. ISPRS Int. J. Geo Inf. 2018, 7, 194. [Google Scholar] [CrossRef] [Green Version]
  12. Zhang, J. Developing a Comprehensive Framework for Property Valuation Using 3D and Remote Sensing Techniques in China. Master’s Thesis, University of Twente, Enschede, The Netherlands, 2019. Available online: https://library.itc.utwente.nl/papers_2019/msc/upm/zhang.pdf (accessed on 6 September 2020).
  13. Hofierka, J.; Zlocha, M. A new 3-D solar radiation model for 3-D city models. Trans. GIS 2012, 16, 681–690. [Google Scholar] [CrossRef]
  14. Rich, P.M.; Dubayah, R.O.; Hetrick, W.A.; Saving, S.C. Using viewshed models to calculate intercepted solar radiation: Applications in ecology. Am. Soc. Photogramm. Remote Sens. Tech. Pap. 1994, 524–529. Available online: http://www.professorpaul.com/publications/rich_et_al_1994_asprs.pdf (accessed on 4 October 2020).
  15. Fu, P.; Rich, P.M. Design and implementation of the solar analyst: An ArcView extension for modeling solar radiation at landscape scales. In Proceedings of the Nineteenth Annual ESRI User Conference, San Diego, CA, USA, 26–30 July 1999; Available online: http://www.esri.com/library/userconf/proc99/proceed/papers/pap867/p867.htm (accessed on 6 October 2020).
  16. Fu, P.; Rich, P.M. A geometric solar radiation model with applications in agriculture and forestry. Comput. Electron. Agric. 2002, 37, 25–35. [Google Scholar] [CrossRef]
  17. Miranda, F.; Doraiswamy, H.; Lage, M.; Wilson, L.; Hsieh, M.; Silva, C.T. Shadow accrual maps: Efficient accumulation of city-scale shadows over time. IEEE Trans. Vis. Comput. Graph. 2018, 25, 1559–1574. [Google Scholar] [CrossRef] [Green Version]
  18. Saretta, E.; Caputo, P.; Frontini, F. A review study about energy renovation of building facades with BIPV in urban environment. Sustain. Cities Soc. 2019, 44, 343–355. [Google Scholar] [CrossRef]
  19. Sirmans, G.S.; Macpherson, D.A.; Zietz, E.N. The Composition of Hedonic Pricing Models. J. Real Estate Lit. 2005, 13, 3–43. Available online: http://www.jstor.org/stable/44103506 (accessed on 6 October 2020).
  20. Ismail, S. Spatial autocorrelation and real estate studies: A literature review. Reg. Sci. Urban Econ. 2006, 1, 1–13. [Google Scholar]
  21. McMillen, D.P. Issues in spatial data analysis. J. Reg. Sci. 2010, 50, 119–141. [Google Scholar] [CrossRef]
  22. Franco, S.F.; Macdonald, J.L. Measurement and valuation of urban greenness: Remote sensing and hedonic applications to Lisbon, Portugal. Reg. Sci. Urban Econ. 2018, 72, 156–180. [Google Scholar] [CrossRef]
  23. Jain, S. Remote sensing application for property tax evaluation. Int. J. Appl. Earth Obs. Geoinf. 2008, 10, 109–121. [Google Scholar] [CrossRef]
  24. Zhang, Z.; Lu, X.; Zhou, M.; Song, Y.; Luo, X.; Kuang, B. Complex spatial morphology of urban housing based on digital elevation model: A case study of Wuhan City, China. Sustainability 2019, 11, 348. [Google Scholar] [CrossRef] [Green Version]
  25. Atazadeh, B.; Kalantari, M.; Rajabifard, A.; Ho, S. Modelling building ownership boundaries within BIM environment: A case study in Victoria, Australia. Comput. Environ. Urban Syst. 2017, 61, 24–38. [Google Scholar] [CrossRef]
  26. Atazadeh, B.; Kalantari, M.; Rajabifard, A.; Ho, S.; Ngo, T. Building information modelling for high-rise land administration. Trans. GIS 2017, 21, 91–113. [Google Scholar] [CrossRef]
  27. Drobež, P.; Fras, M.K.; Ferlan, M.; Lisec, A. Transition from 2D to 3D real property cadastre: The case of the Slovenian cadastre. Comput. Environ. Urban Syst. 2017, 62, 125–135. [Google Scholar] [CrossRef]
  28. Mahdjoubi, L.; Moobela, C.; Laing, R. Providing real-estate services through the integration of 3D laser scanning and building information modelling. Comput. Ind. 2013, 64, 1272–1281. [Google Scholar] [CrossRef]
  29. Kara, A.; van Oosterom, P.; Çağdaş, V.; Işıkdağ, Ü.; Lemmen, C. 3 Dimensional data research for property valuation in the context of the LADM Valuation Information Model. Land Use Policy 2020, 98, 104179. [Google Scholar] [CrossRef]
  30. El Yamani, S.; Hajji, R.; Nys, G.A.; Ettarid, M.; Billen, R. 3D Variables Requirements for Property Valuation Modeling Based on the Integration of BIM and CIM. Sustainability 2021, 13, 2814. [Google Scholar] [CrossRef]
  31. Eleftheriadis, S.; Mumovic, D.; Greening, P. Life cycle energy efficiency in building structures: A review of current developments and future outlooks based on BIM capabilities. Renew. Sustain. Energy Rev. 2017, 67, 811–825. [Google Scholar] [CrossRef] [Green Version]
  32. Encinas, F.; De Herde, A. Sensitivity analysis in building performance simulation for summer comfort assessment of apartments from the real estate market. Energy Build. 2013, 65, 55–65. [Google Scholar] [CrossRef]
  33. Natephra, W.; Motamedi, A.; Yabuki, N.; Fukuda, T. Integrating 4D thermal information with BIM for building envelope thermal performance analysis and thermal comfort evaluation in naturally ventilated environments. Build. Environ. 2017, 124, 194–208. [Google Scholar] [CrossRef]
  34. Freeman, A.M., III. Hedonic Prices, Property Values and Measuring Environmental Benefits: A survey of the Issues. Scand. J. Econ. 1979, 81, 154–173. [Google Scholar] [CrossRef] [Green Version]
  35. Abidoye, R.B.; Chan, A.P.C. Critical review of hedonic pricing model application in property price appraisal: A case of Nigeria. Int. J. Sustain. Built Environ. 2017, 6, 250–259. [Google Scholar] [CrossRef]
  36. Instituto Nacional de Estadística. Estadística del Padrón Continuo. 2021. Available online: https://www.ine.es/dyngs/INEbase/es/operacion.htm?c=Estadistica_C&cid=1254736177012&menu=resultados&idp=1254734710990 (accessed on 10 April 2021).
Figure 1. Location of the three areas of study.
Ijgi 10 00536 g001
Figure 2. Digital elevation models (DTM, DSM, and nDSM).
Ijgi 10 00536 g002
Figure 3. *LAS cloud of points.
Ijgi 10 00536 g003
Figure 4. Different roof shapes with the same building footprint. Source: ESRI.
Ijgi 10 00536 g004
Figure 5. Sample of the solar position model in the field of study.
Ijgi 10 00536 g005
Figure 6. Example of representation of the shadow panel model.
Ijgi 10 00536 g006
Figure 7. Outline of the methodological stages.
Ijgi 10 00536 g007
Figure 8. Results of accumulated hours of sunlight per day in the four days of measurement.
Ijgi 10 00536 g008aIjgi 10 00536 g008b
Figure 9. Relation between the floor number of the sample building and the sunlight hours per accumulated meter.
Ijgi 10 00536 g009
Table 1. Dates and time ranges in which the calculations were made.
DateStarting TimeEnding Time
20 June 2020 (Summer solstice)7:3021:30
21 August 20208:0020:30
21 December 2020 (Winter solstice)9:0018:03
21 February 20208:3019:00
Table 2. Hours of direct sunlight per square meter of façade surface, considering the orientation of the façade on four days of the year.
Historic CenterPeriphery 1Periphery 2
Feb.Jun.Ago.Dic.Feb.Jun.Ago.Dic.Feb.Jun.Ago.Dic.
South00.30.201.11.21.40.41.31.41.50.9
East00000.20.20.20.10.40.70.60.3
West00.30.200.40.50.40.30.710.80.6
North00.20.1000.90.3001.30.60
Roof0.81.91.70.311.31.20.81.82.62.41.5
Monthly
Total
0.82.82.10.32.74.13.51.64.275.93.3
Annual Total611.920.4
Table 3. Hours of direct sunlight per square meter of façade surface. Multi-family building case.
JuneAugustDecemberFebruary
No. of Floors1–34–67–910–131–34–67–910–131–34–67–910–131–34–67–910–13
South0.40.50.60.70.40.50.60.80.20.20.40.70.20.30.60.8
East0.10.20.30.40.10.20.30.4000.10.300.10.20.3
West0.10.10.20.300.10.10.20000.1000.10.2
North0.20.30.30.50.10.10.20.300000000.1
Roof-0.6-1.7-0.3-1.5-0-1.1-0.1-1.3
Total0.81.71.43.60.61.21.23.20.20.20.52.20.20.50.92.6
Total building7.56.23.14.2
Publisher’s Note: MDPI stays neutral with regard to jurisdictional claims in published maps and institutional affiliations.

