Article

Spatiotemporal Characteristics of Urban Land Expansion and Population Growth in Africa from 2001 to 2019: Evidence from Population Density Data

1
School of Geographic and Oceanographic Sciences, Nanjing University, Nanjing 210023, China
2
Institute of African Studies, Nanjing University, Nanjing 210023, China
3
Collaborative Innovation Center of South China Sea Studies, Nanjing University, Nanjing 210093, China
4
Institute of Population Studies, Nanjing University of Posts and Telecommunications, Nanjing 210042, China
*
Author to whom correspondence should be addressed.
ISPRS Int. J. Geo-Inf. 2021, 10(9), 584; https://doi.org/10.3390/ijgi10090584
Submission received: 5 July 2021 / Revised: 16 August 2021 / Accepted: 26 August 2021 / Published: 29 August 2021

Abstract

:
Africa has been undergoing a rapid urbanization process, which is critical to the achievement of the 11th Sustainable Development Goal (SDG11). Using population density data from LandScan, we proposed a population density-based thresholding method to generate urban land and urban population data in Africa from 2001 to 2019, which were further applied to detect the spatiotemporal characteristics of Africa’s urbanization. The results showed that urban land and urban population have both grown rapidly in Africa, which increased by about 5.92% and 4.91%, respectively. The top three countries with the most intense urbanization process in Africa are Nigeria, the Democratic Republic of the Congo, and Ethiopia. The coupling relationship index of urban land expansion and population growth was 0.76 in Africa during 2001–2019. Meanwhile, the total proportion of uncoordinated development types at the provincial level was getting higher, which indicated an uncoordinated relationship between urban land expansion and population growth in Africa. Cropland, grassland, rural land, and forests were the most land-use types occupied by urban expansion. The proportion of cropland, grassland, and forests occupied was getting higher and higher from 2001 to 2019. The extensive urban land use may have an impact on the environmental and economic benefits brought by urbanization, which needs further research.

1. Introduction

In 2018, 55% of the world’s population lived in urban areas. By 2050, it is estimated that 68% of the world’s population will be urban. Africa is the least urbanized region in the world with only about 43% of the population being urban [1], compared with North America (82% of the population in 2018 lives in urban areas), Latin America and the Caribbean (81%), Europe (74%), and Oceania (68%). However, Africa has the highest rate of urban population growth, exceeding 4% per year during 1950–1990, and is expected to remain at 3% or more per year during 2035–2040. Between 1950 and 2018, the urban population of Africa increased more than 16-fold, from 33 million to 548 million. Due to the relatively high growth rate of the urban population in Africa in the future, by 2050, Africa will have 1.5 billion urban residents, second only to Asia’s 3.5 billion, although it will still be the geographic region with the lowest degree of urbanization in the world [1]. Whether in the past, present, or future, Africa is undergoing a very rapid process of urbanization. Urbanization is one of the key factors affecting the development of African cities [2,3].
In 2015, 17 Sustainable Development Goals (SDGs) anchoring the 2030 Agenda were proposed by United Nations (UN) and adopted by more than 150 world leaders [4,5]. The target of SDG11 is to make the city inclusive, safe, resilient, and sustainable. With the continuous urbanization of the world, sustainable development increasingly depends on the successful management of urban growth, especially in low-income and low-middle-income countries, which are expected to have the fastest urbanization rate [1]. As the African continent has the largest number of low-income and low-middle-income countries and has been undergoing rapid urbanization, special attention should be paid to the growth of urban population and urban land expansion, which is a critical part of the world’s sustainable development. Recent studies have shown that many urban areas in Africa are finding it increasingly difficult to cope with intensive, unplanned, and unsustainable urbanization [3,6]. For example, with rapid urbanization, the increasingly crowded informal residential areas in Africa are eroding the socio-economic and environmental benefits associated with urbanization and sustainable development [7,8]. Meanwhile, cropland loss from urban expansion is very serious in Africa [9].
Before studying the characteristics of urbanization in Africa, we need to determine the urban land and corresponding urban population in Africa. The definition of urban is complex, which implies the combination of population and built-up land [10]. In many studies, researchers often choose one of the people-based or building-based criteria to define the city [11]. The database https://www.citypopulation.de (accessed on 15 June 2021) [12] regularly updates the national census statistics of different countries: the listed cities start at 10,081 inhabitants in Egypt, 40,048 in Nigeria, 20,079 in the Democratic Republic of the Congo, 13,700 in Ethiopia, and 13,108 in South Africa in the latest updated data. As for the database of World Urbanization Prospects proposed by the UN, a global threshold of 300,000 inhabitants was imposed [1]. Different countries and different datasets have different statistical standards, and the statistical time may be discontinuous. At the same time, it is common to regard the built-up land as the urban area in many studies. For example, the Global Urban Footprint (GUF) [13] is an available urban extent data product derived from the impervious surface of radar satellites TerraSAR X and TanDEM X. There are also many studies to obtain urban areas through the impervious surface of remote sensing data such as Landsat [14], MODIS [15], and nighttime light images [16]. The most common problem of building-based criteria is that it is inconvenient to distinguish between urban and rural areas. Studies have shown that in the past 40 years, in many parts of the world, the number of cities and the speed of urban expansion defined by buildings are faster than those defined by population [11,17]. As a result, we hope to propose a method to identify urban land and urban population at the same time.
Population density is one of the most important characteristics of a city [18]. As suggested by the UN, population density can be an additional criterion to classify urban-rural [19]. Areas with at least 1500 people per km² and a minimum population of 50,000 were defined as urban centers in the Global Human Settlement (GHS) database [20,21,22]. Levin and Zhang (2017) regarded adjacent grid cells of LandScan with >1500 people/km² as cities, and thus identified 4153 global cities [23]. The same as African countries, China is also a developing country and has experienced a rapid urban transformation since the early 1980s. An average population density of more than 1500 people/km² has been one of the criteria of the 2000 Census urban definitions in China [24]. As a result, we tried to divide urban and rural areas using the population density dataset of LandScan with 1500 people/km² as the threshold. Meanwhile, the population located in urban areas was regarded as urban population. We assessed the accuracy of this thresholding method with both quantitative and qualitative techniques of evaluation.
After defining the urban land and urban population in Africa, we raised and addressed the following questions to understand the characteristics of urban land expansion and population growth in Africa: (1) temporal and spatial changes of urban land and urban population during the different periods; (2) whether the change rate of urban land expansion and population growth in Africa coordinated; (3) situation and sustainability of other land types occupied by urban land in Africa during expansion.
To increase the comparability and consistency of urbanization study in Africa across time and space, this study proposes a population density-based thresholding method to generate urban land and urban population. The rest of this study is organized as follows. Section 2 introduces the study area and data source; Section 3 describes details of methodologies adopted in this study; Section 4 presents and analyzes the results, followed by the discussion and conclusion in Section 5 and Section 6, respectively.

2. Study Area and Data

2.1. Study Area

The total area of Africa is about 32 million km², which includes 55 countries or regions, with a total of 751 provinces. In 2018, the urbanization level of Africa was 43%, with 547.6 million people living in cities [1]. Twenty African cities were selected to verify the feasibility of the methods used in our study, and their geographical locations are presented in Figure 1. According to the corresponding urban population in 2018 and the classification standards of [25] and [1], these 20 cities can be divided into six categories, and the detailed information is shown in Table 1. The selection of cities for evaluation is in line with randomness.

2.2. Data Source

LandScan is a time-series community standard for spatially disaggregated global population data produced by the Oak Ridge National Laboratory (ORNL) [26]. The spatial resolution of LandScan is approximately 1 km. LandScan is the most commonly used global population distribution data, as it has the longest time series and the finest resolution. In this study, LandScan data spanning from 2001 to 2019 were generated from the website https://landscan.ornl.gov/ (accessed on 15 May 2021).
The global public land cover dataset MCD12Q1 with a spatial resolution of 500 m from the Moderate Resolution Imaging Spectroradiometer (MODIS) products was used to study the urban land-use change [27]. The time series of this dataset spans from 2001 to 2019, which can be obtained from the EARTHDATA website https://search.earthdata.nasa.gov/ (accessed on 20 May 2021).
The ground truth land-use data used in this study were derived from The Atlas of Urban Expansion (2016 Edition) (http://atlasofurbanexpansion.org/, accessed on 20 May 2021). This dataset selected 200 cities around the world and produced land-use maps circa the years 1990, 2000, and 2014. Landsat imagery, with a spatial resolution of 30 m, was classified into seven classes using the unsupervised classification method, which includes urban built-up [28].
Moreover, the administrative boundary data was collected from the Database of Global Administrative Areas (GADM) (https://gadm.org/, accessed on 8 June 2021). Additionally, the statistical urban population data in Africa were obtained from the UN (https://population.un.org/wup/, accessed on 10 June 2021). In addition, the nighttime light data used in this study was from harmonized global nighttime light dataset produced by Li Xuecao (2020) [29].

3. Methods

Four main procedures were undertaken to identify spatiotemporal characteristics of urban land expansion and population growth in Africa. Firstly, urban land and urban population were generated using LandScan data with thresholding method and overlay analysis. Secondly, we assessed the accuracy of urban land and urban population obtained from the first step. Thirdly, elasticity coefficient was adopted to detect the coupling development between urban land expansion and population growth. At last, the reclassified MCD12Q1 land-use data were integrated with the acquired urban land to study the urban land-use change (Figure 2).

3.1. Identification of Urban Land and Urban Population

Population and population density are common indicators for dividing urban and rural areas [30,31]. As stated above, 1500 people/km² was selected as the threshold to generate spatial layers of urban land and urban population. The steps were as follows: (1) we considered grid cells of LandScan with >1500 people/km² as urban land and the images were converted to binary images; (2) the binary images were post-processed using the post-classification sieve function within Envi 5.3.1 (© 2015 Exelis) to eliminate the isolated classified pixels; (3) the population of the corresponding urban area was regarded as urban population. As a result, the spatial layers of urban land and urban population were obtained.

3.2. Accuracy Assessment of Urban Population and Urban Land Generated from LandScan

We verified the obtained data to confirm the feasibility of collecting urban population and urban land from LandScan. A linear regression model was applied to the generated urban population and statistical urban population from the UN. As for the generated urban land, we verified it qualitatively and quantitatively. From a qualitative point of view, we visually compared the generated five African cities’ urban scope and shape with the existing land-use map and gradient nighttime light level map, in which the calculation of gradient nighttime light types can be referred to Jiang (2021) [32]. From the perspective of quantitative, we selected the generated urban land of 20 African cities to calculate its user’s accuracy, producer’s accuracy, and kappa coefficient with the ground truth data from The Atlas of Urban Expansion (2016 Edition).

3.3. Coupling Development of Urban Land Expansion and Population Growth

To depict the human–land relationship in the process of urbanization, the elasticity coefficient was adopted to partition the types of coupling development between urban land expansion and population growth [33]. The elasticity coefficient can be calculated as follows:
EC = PR / LR  
where EC denotes the elasticity coefficient between urban land expansion and population growth, PR is the average annual change rate of the urban population, whereas LR is the average annual change rate of urban land.
According to the increase and decrease changes of PR and LR and the numerical comparison, the coupling relationship between urban population and urban land can be divided into six types. The illustration can be seen in Figure 3 and Table 2. Taking type I as an example, PR and LR are positive at the same time, and the former is greater, indicating that urban population and urban land increase at the same time and the growth of urban population is faster than that of urban land. Based on the numerical comparison between PR and LR , the six coupling types can be divided into two categories: coordinated and uncoordinated development. Detailed information is shown in Table 2.

3.4. Land use Change

There are five classification schemes included in the land cover products MCD12Q1, of which the International Geosphere-Biosphere Programme (IGBP) is the most widely used [34]. In this study, the IGBP classification scheme was adopted to extract land-use types, which were reclassified into seven types, namely, forest, grassland, built-up land, cropland, barren land, water, and other. To study the land-use change of urban land, we integrated the urban land generated above with these seven types of land use. Taking Lagos as an example, urban land generated from LandScan mainly overlapped on the built-up land from MCD12Q1 (Figure 4). Using the simple dichotomous division method [10], the built-up land that did not coincide with urban land was regarded as rural land. As a result, land-use maps comprised eight types, including forest, grassland, urban land, rural land, cropland, barren land, water, and other. At last, through the transfer matrix of urban land-use change, we can get the situation of other land-use types occupied by urban land.

4. Results

4.1. Verifying the Urban Population and Urban Land Generated from LandScan

To verify the accuracy of the urban population generated from LandScan in this study, statistical urban population from the UN was used for comparison. Linear regression analysis was applied to the two datasets and the comparison result is shown in Figure 5. The results show that the urban population obtained from LandScan has a linear correlation with the statistical urban population of UN, with the R2 reaching 0.9871. At the same time, the linear correlation coefficient is 0.8903, which is close to 1. As a result, the urban population generated from LandScan has a strong relationship with that from the UN.
For urban land generated from LandScan, we verified it from both qualitative and quantitative perspectives. Figure 6 depicts the qualitative comparison of urban land generated from LandScan (Figure 6d) with land use maps from The Atlas of Urban Expansion (2016 Edition) (Figure 6a) and MCD12Q1 (Figure 6b), and spatial distribution maps of nighttime light types (Figure 6c). It is obvious that the spatial distribution of urban land generated from LandScan is similar to the urban built-up from The Atlas of Urban Expansion (2016 Edition) and built-up land from MCD12Q1. As for the distribution of nighttime light types, the urban land generated from LandScan was not completely covered by the high nighttime light, except for Cairo. However, the shape of high nighttime light distribution is very similar to that of urban land. This also supports demographers’ views that urban transformation in Sub-Saharan Africa can be better interpreted as a demographic phenomenon rather than a strictly economic one [35,36].
To better verify the urban land generated from LandScan, 20 cities were selected to conduct the accuracy assessment. The accuracy was evaluated by the ground true land-use map collected from The Atlas of Urban Expansion (2016 Edition). The kappa coefficient, producer’s accuracy, and user’s accuracy of 20 cities are shown in Figure 7. The kappa coefficient ranges from 0.66 to 0.99. The user’s accuracy in all cities is higher than 60%, and some even reach 96%, except for Gombe. Meanwhile, the producer’s accuracy of the 19 cities is higher than 50%, and the highest is 86%. The derived urban center in LandScan is smaller than the ground truth data, which includes most artificial impervious areas and associated infrastructures, parks, lakes, and so on within the urban boundary [37]. Additionally, the spatial resolution of LandScan is 1 km, which is much coarser than that of the ground truth data (30 m). As a result, we think the method used in this study is reasonable and can be effectively implemented.

4.2. Spatiotemporal Changes of Urban Population and Urban Land

4.2.1. Time-Series Changes of Urban Population and Urban Land in Africa

Urban population and urban land showed a synchronous growth trend in Africa from 2001 to 2019 (Figure 8). The urban land increased from 37,160 to 104,647 km², with an average annual growth rate of 5.92%. At the same time, the urban population increased from 233.73 million to 554.33 million, with an average annual growth rate of 4.91%. The growth rate of urban land was higher than that of the urban population on the whole. Taking 2001 as the benchmark, we estimated the year-on-year growth rate of the urban population and urban land in Africa, and world urban population, which can be seen in Figure 8. The growth rate of the urban population in Africa has increased steadily from 2001 to 2019, which was significantly higher than the average growth rate of the world’s urban population. At the same time, the expansion of urban land fluctuated greatly. The growth rate of urban land area exceeded that of the urban population in 2003.

4.2.2. Spatial Distribution of Urban Land Expansion and Population Growth in Africa in Different Periods

In order to explore the spatial development dynamics and distribution pattern of urban land expansion and population growth in Africa from 2001 to 2019, the spatial distribution of urban land and urban population growth in African cities from 2001 to 2007, 2007–2013, 2013–2019, and 2001–2019 are presented on the vector map of provincial administrative divisions (Figure 9 and Figure 10).
The urban land areas increased by 67,487 km² from 2001 to 2019, of which from 2001 to 2007, 2007–2013, and 2013–2019, the area increased by 15,567, 18,472, and 33,448 km², respectively. The urban land experienced the most dramatic growth in 2013–2019, and the increased area is 2.15 times and 1.81 times that in 2001–2007 and 2007–2013, respectively. As for the spatial distribution of urban land growth in Africa during the different periods, there were similar spatial distribution characteristics, which are demonstrated in Figure 9. The growth of urban land was mainly concentrated in countries such as Nigeria, Egypt, the Democratic Republic of the Congo, and Ethiopia. Urban land has been growing rapidly in all provinces of some countries like Nigeria, the Democratic Republic of the Congo, and Kenya. Meanwhile, urban land growth in some countries is concentrated in some areas. For example, urban land growth in South Africa is mainly concentrated in coastal areas, Gauteng, and North West provinces. Nigeria has always been the leading country of urban land change during the study period. In addition, the proportion of urban land change in Nigeria to the total urban land change in Africa was getting higher and higher, with 17.73%, 20.85%, and 26.43% from 2001 to 2007, 2007–2013, 2013–2019, which was much higher than that of other African countries (Table 3). At the same time, the urban land expansion of Ethiopia and the Democratic Republic of the Congo was getting faster and faster. Together with Nigeria, they constituted the top three countries in Africa with the largest urban land expansion from 2001 to 2019. The top 10 countries with the largest urban land expansion account for more than 60% of the total urban land expansion in Africa during the study periods.
From 2001 to 2019, the urban population increased by 320.60 million people, of which from 2001 to 2007, 2007–2013, and 2013–2019, the urban population increased by 83.84 million, 76.97 million, and 159.80 million people, respectively. Similar to the urban land growth, the urban population grew the most rapidly from 2013 to 2019, which was almost the sum of the urban population growth in the other two periods of 2001–2007 and 2007–2013. Nigeria and the Democratic Republic of the Congo have been among the top three countries with the most urban population growth, of which Nigeria has always been the first with absolute superiority (Table 4). The urban population growth in Ethiopia has also been relatively rapid, except in 2007–2013. Ethiopia’s urban population growth was mainly concentrated in Addis Ababa, Amhara, and Southern Nations, Nationalities and People (Figure 10). During the study period, the top 10 countries with the largest urban population growth accounted for more than 60% of the total urban population growth in Africa.

4.3. Spatiotemporal Characteristics of Coupling Development between Urban Land and Urban Population

From 2001 to 2019, the coupling relationship index of urban population and urban land was 0.76. In general, the growth rate of urban land was greater than that of the urban population in Africa, and the type of coupling relationship was in type VI.
Figure 11 shows the spatial change of the coordination relationship between urban land and urban population in different provinces of Africa in different periods. As shown in Figure 11, the urban development in African provinces was mainly in type I and type VI. Nigeria has always been dominated by type VI. The urban development of the Democratic Republic of the Congo was mainly in type VI except from 2013 to 2019. Meanwhile, the urban development of Ethiopia was more complex. As the most urbanized area in Ethiopia, Addis Ababa was mainly dominated by type VI, except 2013–2019. From 2001 to 2019, the EC values of Nigeria, the Democratic Republic of the Congo, and Ethiopia were 0.90, 0.49, and 0.82, respectively, which means that the growth rate of the urban population in these countries was lower than that of urban land, and urban land showed an extensive growth.
We counted the proportion of urban development types in different periods, and the results are displayed in Figure 12. According to the change of the proportion of different types of cities over time, type VI was increasing, while type I was decreasing. The total proportion of uncoordinated development types (IV, V, and VI) was getting higher and higher. Therefore, the balance of urban land expansion and population growth in Africa is not optimistic. Among them, type VI represents the synchronous growth of urban population and urban land, and the growth of urban land is faster than that of population, which indicates that most provinces are still in the stage of rapid urbanization, and it is speculated that the imbalance of urban land expansion and population growth will continue or even intensify in the future.

4.4. Characteristics of Other Land Types Occupied by Urban Expansion

According to the above analysis, the land expansion rate of African cities is higher than that of the urban population, which may lead to extensive use of land resources. Therefore, it is necessary to monitor the situation of other land types occupied by African cities. Figure 13 is a Pareto diagram of other land types occupied by urban expansion in different periods. Except for urban land, land use in Africa is divided into forest, grassland, rural land, cropland, barren land, water, and other. As can be seen from Figure 13, forest, grassland, rural land, and cropland are the four types that have been occupied mostly by urban expansion, accounting for more than 95% in different periods. From 2001 to 2019, among the types of land occupied by urban expansion, cropland was occupied up to 29%, followed by grassland, rural land, and forest (Figure 13d). During the study period, the proportion of cropland occupied by urban expansion has gradually increased and has become the most occupied land-use type (Figure 13a-c). At the same time, the proportion of grassland and forest was gradually increasing too, but the proportion of rural land occupied by urban land has dropped sharply. To sum up, with the rapid expansion of urban land in Africa, more and more cropland, grassland and forest have been invaded.

5. Discussion

In this study, we propose a population density-based thresholding method to identify urban land and urban population. This is a simple, fast, and effective method to identify urban area, which can provide continuous and comparable urban land and urban population data for different regions. Using this method, we can get the data of urban population and urban land in African countries and conduct further comparative research.
Findings show that Africa has experienced considerable growth in urban land and urban population from 2001 to 2019. Urban land averagely increased by 5.92% per annum, while urban population increased averagely by about 4.91% per annum during 2001–2019. The speed of urban land expansion is relatively faster than the growth of urban population, which is consistent with previous studies [17,38]. Nigeria, the Democratic Republic of the Congo, and Ethiopia are the three countries with the fastest urban land expansion and urban population growth in Africa. This is mainly due to the reason that Africa’s urbanization is commonly driven by demography [39,40,41]. In 2019, Nigeria was the most populous country in Africa with a population of 201 million, followed by Ethiopia (70 million), Egypt (68 million), and the Democratic Republic of the Congo (51 million) [42]. As for the average annual growth rate of population from 2001 to 2019, the Democratic Republic of the Congo was the highest with a growth rate of 3.8%, followed by Nigeria (3.7%), Ethiopia (3.3%), and Egypt (2.6%) [42,43].
Whether from the perspective of Africa as a whole or most provinces of African countries, the growth rate of urban land is greater than that of urban population, which is in line with Angel’s prediction that urban land cover in sub-Saharan Africa will expand at the fastest speed during 2000–2050 [17]. From a global perspective, urban growth brought about by urbanization is reflected in the outward expansion, inward compression, or upward high-rise buildings [44,45]. However, the spatial expansion of African cities is characterized by large-scale and uncontrollable, which is technically known as urban sprawl. Studies on African urbanization show that urban sprawl leads to unsustainable land development and often engulfs the surrounding urban areas, transforming non-urban land, especially agricultural land, into urban land [46,47]. It is consistent with the results of this study that cropland was the most land-use type occupied by urban land. Food insecurity has been a long-standing problem in Africa. About 257 million people in Africa are in malnutrition, accounting for nearly one-third of the world’s malnutrition population [48]. Additionally, a quarter of Africa’s population is still starving. Food insecurity in Africa has been a great challenge to the achievement of the Second Sustainable Development Goal (SDG2) that living in a world with no hunger proposed by the 2030 Agenda. There is no doubt that the disordered urban expansion in Africa will hinder the realization of SDG2 even more.
The future development of cities and the subsequent occupation of land and natural resources will determine whether we can move towards an environmentally sustainable future. The unplanned or improperly managed urban expansion will lead to rapid sprawl [49], pollution [50], and environmental degradation [51], as well as unsustainable production and consumption patterns [52]. Unfortunately, many urban areas in Africa have been undergoing dense, unplanned, and unsustainable urbanization, which is considered to be eroding the socio-economic and environmental benefits associated with urbanization and sustainable development [41]. Africa’s forests are mainly distributed in the equatorial region, stretching from Sierra Leone to Victoria Great Lakes region [53], including the Democratic Republic of the Congo, parts of Nigeria, and Ethiopia, which are undergoing rapid urbanization. As shown in the results of this article, encroachment of forests by the extensive urban land use in Africa is also obvious. Such urban expansion has the potential to destroy the habitats of key biodiversity hotspots and lead to carbon emissions associated with tropical deforestation and land use change.
Sustainable development is still one of the most advocated development concepts in the world. However, there are still limited signs of progress in achieving sustainable development in Africa. Rapid and unplanned urbanization is a major threat to the sustainable development of Africa. This study provides a simple and easy way to monitor the urban population growth and urban land expansion in African cities. This will help to fully understand the complex urbanization process in Africa and formulate better urban development policies. With the rapid increase in the population of African cities, more and more related issues will emerge. Therefore, more research is needed to focus on the process of urbanization in Africa.

6. Conclusions

Urbanization is a complex geographical process with the simultaneous growth of population and land, closely related to social economy and environment, etc. Africa is experiencing rapid urbanization, and some problems related to rapid urbanization are emerging. In this study, we propose a population density-based thresholding method to generate urban land and urban population data in Africa, which can be applied to further study the characteristics of Africa’s urbanization process. Our method is proved to be feasible. The results show that from 2001 to 2019, the average annual growth rate of urban land in Africa was 5.92%, which was greater than that of the urban population (4.91%). Moreover, the growth rate of the urban population in African is greater than that of the world, which is consistent with previous research conclusions. The regional analysis of urban population and urban land change in Africa shows that the top three countries with the fastest urbanization process in Africa are Nigeria, the Democratic Republic of the Congo, and Ethiopia. As for the coordinated relationship between urban population growth and urban land expansion, results show that the total proportion of uncoordinated development types (IV, V, and VI) was getting higher, which means that the urban land use in Africa tends to be extensive, and land-use efficiency is reduced. With the rapid urbanization in Africa and extensive urban land use, more and more cropland, grassland, and forest are occupied. The encroachment of cropland may exacerbate food security in Africa. Additionally, with the expansion of cities, the deforestation of forests will cause more carbon emissions and will affect biodiversity, which will have an impact on the environment.
According to the results of this paper, the extensive land use induced by rapid urbanization process in Africa is likely to damage the environmental benefits of Africa. As the second-largest continent in the world and home to a population of 1.29 billion, sustainable urbanization is very important for Africa and even the world. As a result, it is very important to monitor urban dynamics in Africa and formulate sustainable urban development policies. More efforts are needed to achieve the goal of sustainable urban environment in Africa.

Author Contributions

Conceptualization and methodology, Shengnan Jiang, Zhenke Zhang and Hang Ren; software and data curation, Shengnan Jiang and Guoen Wei; formal analysis, Shengnan Jiang and Guoen Wei; validation, Shengnan Jiang and Zhenke Zhang; writing—original draft, Shengnan Jiang; writing—review and editing, Minghui Xu and Binglin Liu; data collection and Processing Shengnan Jiang and Hang Ren; funding acquisition, Zhenke Zhang. All authors have read and agreed to the published version of the manuscript.

Funding

This research was funded by the National Key R&D Program of China (No. 2018YFE0105900).

Institutional Review Board Statement

Not applicable.

Informed Consent Statement

Not applicable.

Data Availability Statement

The data that we used in this study can be requested by contacting the corresponding author.

Acknowledgments

The authors express thanks to anonymous reviewers for their constructive comments and advice.

Conflicts of Interest

The authors declare no conflict of interest.

References

  1. UNDESA/PD. World Urbanization Prospects: The 2018 Revision (ST/ESA/SER.A/420); United Nations: New York, NY, USA, 2019. [Google Scholar]
  2. UNDESA/PD. World Urbanization Prospects: The 2011 Revision; United Nations: New York, NY, USA, 2012. [Google Scholar]
  3. Darkwah, R.M.; Cobbinah, P.B. Stewardship of urban greenery in an era of global urbanisation. Int. J. Environ. Ecol. Geol. Geophys. Eng. 2014, 8, 671–674. [Google Scholar]
  4. Zhu, Z.; Zhou, Y.; Seto, K.C.; Stokes, E.C.; Deng, C.; Pickett, S.T.; Taubenböck, H. Understanding an urbanizing planet: Strategic directions for remote sensing. Remote Sens. Environ. 2019, 228, 164–182. [Google Scholar] [CrossRef]
  5. Anderson, K.; Ryan, B.; Sonntag, W.; Kavvada, A.; Friedl, L. Earth observation in service of the 2030 Agenda for Sustainable Development. Geo-Spat. Inf. Sci. 2017, 20, 77–96. [Google Scholar] [CrossRef]
  6. Misilu, E.; Shouyu, C.; Li Qin, Z. Sustainable urbanisation’s challenge in Democratic Republic of Congo. J. Sustain. Dev. 2010, 3, 246–258. [Google Scholar]
  7. Visagie, J.; Turok, I. Getting urban density to work in informal settlements in Africa. Environ. Urban. 2020, 32, 351–370. [Google Scholar] [CrossRef]
  8. Ren, H.; Guo, W.; Zhang, Z.; Kisovi, L.M.; Das, P. Population Density and Spatial Patterns of Informal Settlements in Nairobi, Kenya. Sustainability 2020, 12, 7717. [Google Scholar] [CrossRef]
  9. d’Amour, C.B.; Reitsma, F.; Baiocchi, G.; Barthel, S.; Güneralp, B.; Erb, K.-H.; Haberl, H.; Creutzig, F.; Seto, K.C. Future urban land expansion and implications for global croplands. Proc. Natl. Acad. Sci. USA 2017, 114, 8939–8944. [Google Scholar] [CrossRef] [Green Version]
  10. Henriques, C.; Domingues, A.; Pereira, M. What Is Urban after All? A Critical Review of Measuring and Mapping Urban Typologies in Portugal. ISPRS Int. J. Geo-Inf. 2020, 9, 630. [Google Scholar] [CrossRef]
  11. Dijkstra, L.; Florczyk, A.J.; Freire, S.; Kemper, T.; Melchiorri, M.; Pesaresi, M.; Schiavina, M. Applying the degree of urbanisation to the globe: A new harmonised definition reveals a different picture of global urbanisation. J. Urban Econ. 2020, 2020, 103312. [Google Scholar] [CrossRef]
  12. Brinkhoff, T. City Population. 2017. Available online: www.city-population.de (accessed on 15 June 2021).
  13. Esch, T.; Marconcini, M.; Felbier, A.; Roth, A.; Heldens, W.; Huber, M.; Schwinger, M.; Taubenböck, H.; Müller, A.; Dech, S. Urban footprint processor—Fully automated processing chain generating settlement masks from global data of the TanDEM-X mission. IEEE Geosci. Remote Sens. Lett. 2013, 10, 1617–1621. [Google Scholar] [CrossRef] [Green Version]
  14. Jing, C.; Zhou, W.; Qian, Y.; Yu, W.; Zheng, Z. A novel approach for quantifying high-frequency urban land cover changes at the block level with scarce clear-sky Landsat observations. Remote Sens. Environ. 2021, 255, 112293. [Google Scholar] [CrossRef]
  15. Huang, X.; Huang, J.; Wen, D.; Li, J. An updated MODIS global urban extent product (MGUP) from 2001 to 2018 based on an automated mapping approach. Int. J. Appl. Earth Obs. Geoinf. 2021, 95, 102255. [Google Scholar] [CrossRef]
  16. Wang, C.; Yu, B.; Chen, Z.; Liu, Y.; Song, W.; Li, X.; Yang, C.; Small, C.; Shu, S.; Wu, J. Evolution of Urban Spatial Clusters in China: A Graph-Based Method Using Nighttime Light Data. Ann. Am. Assoc. Geogr. 2021, 1–22. [Google Scholar] [CrossRef]
  17. Angel, S.; Parent, J.; Civco, D.L.; Blei, A.; Potere, D. The dimensions of global urban expansion: Estimates and projections for all countries, 2000–2050. Prog. Plan. 2011, 75, 53–107. [Google Scholar] [CrossRef]
  18. Taubenböck, H.; Standfuß, I.; Klotz, M.; Wurm, M. The physical density of the city—Deconstruction of the delusive density measure with evidence from two European megacities. ISPRS Int. J. Geo-Inf. 2016, 5, 206. [Google Scholar] [CrossRef] [Green Version]
  19. UNDESA. Principles and Recommendations for Population and Housing Censuses, Revision 3; UN: New York, NY, USA, 2017. [Google Scholar]
  20. Dijkstra, L.; Poelman, H. A harmonised definition of cities and rural areas: The new degree of urbanisation. WP 2014, 1, 2014. [Google Scholar]
  21. Florczyk, A.; Melchiorri, M.; Corbane, C.; Schiavina, M.; Maffenini, M.; Pesaresi, M.; Politis, P.; Sabo, S.; Freire, S.; Ehrlich, D. Description of the GHS urban centre database 2015, Public Release 2019, Version 1.0; Publication Office of the European Union: Luxembourg, 2019. [Google Scholar]
  22. European Union; FAO; UN-Habitat; OECD; World Bank. Applying the Degree of Urbanisation: A Methodological Manual to Define Cities, Towns and Rural Areas for International Comparisons (2021 Edition); Publications Office of the European Union: Luxembourg, 2021. [Google Scholar]
  23. Levin, N.; Zhang, Q. A global analysis of factors controlling VIIRS nighttime light levels from densely populated areas. Remote Sens. Environ. 2017, 190, 366–382. [Google Scholar] [CrossRef] [Green Version]
  24. Chan, K.W.; Hu, Y. Urbanization in China in the 1990s: New definition, different series, and revised trends. China Rev. 2003, 3, 49–71. [Google Scholar]
  25. Fang, C. A review of Chinese urban development policy, emerging patterns and future adjustments. Geogr. Res. 2014, 33, 674–686. [Google Scholar]
  26. Bhaduri, B.; Bright, E.; Coleman, P.; Dobson, J. LandScan: Locating people is what matters. Geoinformatics 2002, 5, 34–37. [Google Scholar]
  27. Sulla-Menashe, D.; Friedl, M.A. User Guide to Collection 6 MODIS Land Cover (MCD12Q1 and MCD12C1) Product; USGS: Reston, VA, USA, 2018; pp. 1–18. [Google Scholar]
  28. Angel, S.; Blei, A.M.; Parent, J.; Lamson-Hall, P.; Sánchez, N.G.; Civco, D.; Lei, R.Q.; Thom, K. Atlas of urban expansion—2016 Edition: Areas and densities. Choice Rev. Online 2016, 1, 50–1227. [Google Scholar] [CrossRef]
  29. Li, X.; Zhou, Y.; Zhao, M.; Zhao, X. A harmonized global nighttime light dataset 1992–2018. Sci. Data 2020, 7, 1–9. [Google Scholar] [CrossRef] [PubMed]
  30. Song, X.; Liu, P.; Zhou, Y. Urban and rural area division: Taking Shanghai as an example. Acta Geogr. Sin. 2006, 61, 787–797. [Google Scholar]
  31. Li, X.; Zhou, W. Dasymetric mapping of urban population in China based on radiance corrected DMSP-OLS nighttime light and land cover data. Sci. Total Environ. 2018, 643, 1248–1256. [Google Scholar] [CrossRef] [PubMed]
  32. Jiang, S.; Wei, G.; Zhang, Z.; Wang, Y.; Xu, M.; Wang, Q.; Das, P.; Liu, B. Detecting the Dynamics of Urban Growth in Africa Using DMSP/OLS Nighttime Light Data. Land 2021, 10, 13. [Google Scholar] [CrossRef]
  33. Wu, Y.; Liu, Y.; Li, Y. Spatio-temporal coupling of demographic-landscape urbanization and its driving forces in China. Acta Geogr. Sin. 2018, 73, 1865–1879. [Google Scholar]
  34. Ma, M.; Lang, Q.; Yang, H.; Shi, K.; Ge, W. Identification of Polycentric Cities in China Based on NPP-VIIRS Nighttime Light Data. Remote Sens. 2020, 12, 3248. [Google Scholar] [CrossRef]
  35. De Vries, J. Problems in the measurement, description, and analysis of historical urbanization. In Urbanization in History: A Process of Dynamic Interactions; Clarendon Press: Oxford, UK, 1990; pp. 43–60. [Google Scholar]
  36. Dyson, T. The role of the demographic transition in the process of urbanization. Popul. Dev. Rev. 2011, 37, 34–54. [Google Scholar] [CrossRef] [PubMed]
  37. Li, X.; Gong, P.; Zhou, Y.; Wang, J.; Bai, Y.; Chen, B.; Hu, T.; Xiao, Y.; Xu, B.; Yang, J. Mapping global urban boundaries from the global artificial impervious area (GAIA) data. Environ. Res. Lett. 2020, 15, 094044. [Google Scholar] [CrossRef]
  38. Xu, G.; Dong, T.; Cobbinah, P.B.; Jiao, L.; Sumari, N.S.; Chai, B.; Liu, Y. Urban expansion and form changes across African cities with a global outlook: Spatiotemporal analysis of urban land densities. J. Clean. Prod. 2019, 224, 802–810. [Google Scholar] [CrossRef]
  39. Cohen, B. Urbanization in developing countries: Current trends, future projections, and key challenges for sustainability. Technol. Soc. 2006, 28, 63–80. [Google Scholar] [CrossRef]
  40. Songsore, J. The Urban Transition in Ghana: Urbanization, National Development and Poverty Reduction; University of Ghana: Legon, Accra, Ghana, 2009. [Google Scholar]
  41. Cobbinah, P.B.; Erdiaw-Kwasie, M.O.; Amoateng, P. Africa’s urbanisation: Implications for sustainable development. Cities 2015, 47, 62–72. [Google Scholar] [CrossRef]
  42. AfDB; AUC; ECA. African Statistical Yearbook 2020; ECA Printing and Publishing Unit: Addis Ababa, Ethiopia, 2020. [Google Scholar]
  43. ECA; ACS. African Statistical Yearbook 2006; Economic Commission for Africa: Addis Ababa, Ethiopia, 2007. [Google Scholar]
  44. Angel, S.; Sheppard, S.; Civco, D.L.; Buckley, R.; Chabaeva, A.; Gitlin, L.; Kraley, A.; Parent, J.; Perlin, M. The Dynamics of Global Urban Expansion; Citeseer: Washington, DC, USA, 2005. [Google Scholar]
  45. Seto, K.C.; Güneralp, B.; Hutyra, L.R. Global forecasts of urban expansion to 2030 and direct impacts on biodiversity and carbon pools. Proc. Natl. Acad. Sci. USA 2012, 109, 16083–16088. [Google Scholar] [CrossRef] [Green Version]
  46. Amoateng, P.; Cobbinah, P.B.; Owusu-Adade, K. Managing physical development in peri-urban areas of Kumasi, Ghana: A case of Abuakwa. J. Urban Environ. Eng. 2013, 7, 96–109. [Google Scholar] [CrossRef]
  47. Cobbinah, P.B.; Amoako, C. Urban sprawl and the loss of peri-urban land in Kumasi, Ghana. Int. J. Soc. Hum. Sci. 2012, 6, e397. [Google Scholar]
  48. FAO; ECA. Addressing the Threat from Climate Variability and Extremes for Food Security and Nutrition; Regional Overview of Food Security and Nutrition; Food and Agriculture Organization of the United Nations (FAO) and United Nations Economic Cooperation for Africa (UNECA): Accra, Ghana, 2018. [Google Scholar]
  49. Cobbinah, P.B.; Aboagye, H.N. A Ghanaian twist to urban sprawl. Land Use Policy 2017, 61, 231–241. [Google Scholar] [CrossRef]
  50. Liang, L.; Wang, Z.; Li, J. The effect of urbanization on environmental pollution in rapidly developing urban agglomerations. J. Clean. Prod. 2019, 237, 117649. [Google Scholar] [CrossRef]
  51. Capps, K.A.; Bentsen, C.N.; Ramírez, A. Poverty, urbanization, and environmental degradation: Urban streams in the developing world. Freshw. Sci. 2016, 35, 429–435. [Google Scholar] [CrossRef]
  52. Zhao, J.; Liu, H.; Dong, R. Sustainable urban development: Policy framework for sustainable consumption and production. Int. J. Sustain. Dev. World Ecol. 2008, 15, 318–325. [Google Scholar]
  53. Aubréville, A.M.A. The disappearance of the tropical forests of Africa. Fire Ecol. 2013, 9, 3–13. [Google Scholar] [CrossRef] [Green Version]
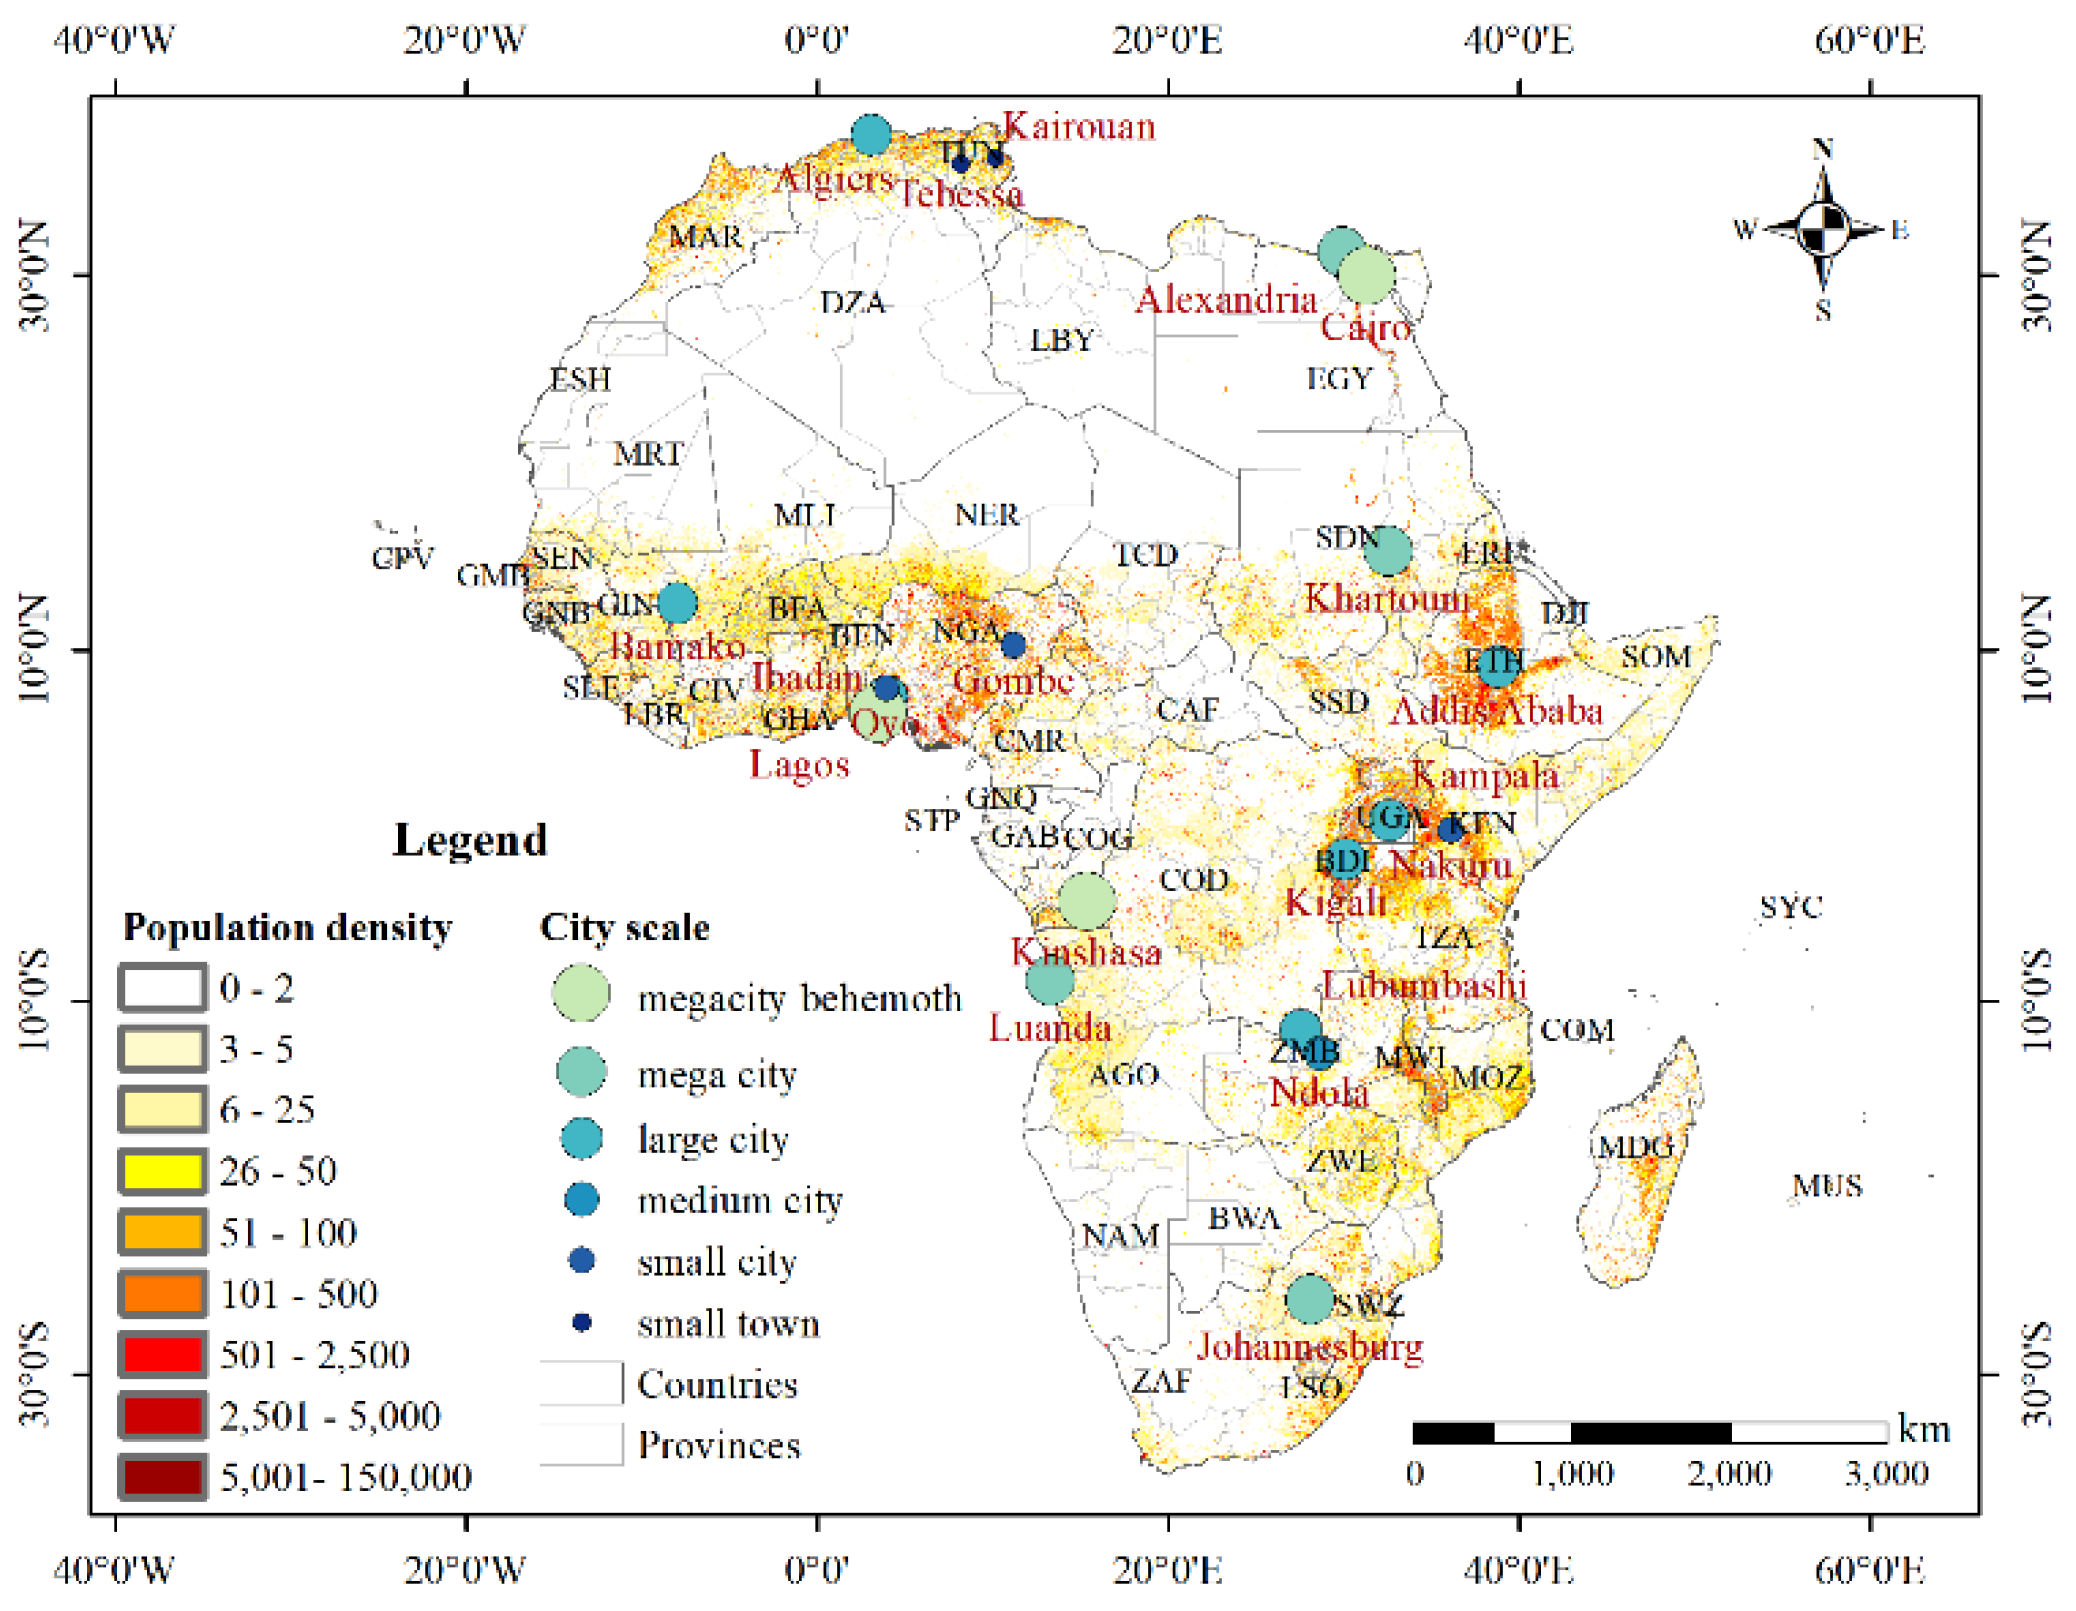
Figure 1. Location of 20 evaluated cities and population density from LandScan in 2018.
Ijgi 10 00584 g001
Figure 2. The flowchart and technical framework of the study.
Ijgi 10 00584 g002
Figure 3. Schematic diagram of the partitioning criterion of different coordination relationship types.
Ijgi 10 00584 g003
Figure 4. Overlapping diagram of urban land generated from LandScan and built-up land from MCD12Q1: taking Lagos in 2019 as an example.
Ijgi 10 00584 g004
Figure 5. Comparison between urban population obtained from UN and LandScan.
Ijgi 10 00584 g005
Figure 6. Comparison among land use maps for 2014 from The Atlas of Urban Expansion (2016 Edition) (a) and MCD12Q1 (b); distribution of nighttime light types for 2014 (c); urban land for 2014 generated from LandScan (d).
Ijgi 10 00584 g006
Figure 7. The producer’s and user’s accuracy of 20 cities in ascending order of the kappa coefficient.
Ijgi 10 00584 g007
Figure 8. Temporal change of urban population and urban land in Africa from 2001 to 2019. Note: the growth rate was calculated based on 2001.
Ijgi 10 00584 g008
Figure 9. Spatial changes of urban land in different periods.
Ijgi 10 00584 g009
Figure 10. Spatial changes of the urban population in different periods.
Ijgi 10 00584 g010
Figure 11. Spatial changes of coordination relationships in different periods.
Ijgi 10 00584 g011
Figure 12. The proportion of different coupling types in different periods.
Ijgi 10 00584 g012
Figure 13. Pareto chart of other land types occupied by urban expansion in different periods.
Ijgi 10 00584 g013
Table 1. Classification standard of city-scale and cities included.
City ScalePopulationCities
Megacity behemoth≥10 millionCairo, Kinshasa, Lagos
Megacity5~10 millionAlexandria, Johannesburg, Khartoum, Luanda
Large city1~5 millionAddis Ababa, Algiers, Bamako, Ibadan, Kampala, Kigali, Lubumbashi
Medium city0.5~1 millionNdola
Small city0.3~0.5 millionGombe, Nakuru, Oyo
Town<0.3 millionKairouan, Tebessa
Table 2. Types of coupling relationship between urban population and land.
Coordination RelationshipTypesCriteriaExplanation
Coordinated developmentIPR > 0, LR > 0, PR/LR > 1The growth rate of population is greater than that of land, which means the intensive degree of land use is higher, and the relationship between population and land tends to be coordinated.
IIPR > 0, LR < 0
IIIPR < 0, LR < 0, PR/LR < 1
Uncoordinated developmentIVPR < 0, LR < 0, PR/LR > 1The population growth rate is lower than that of land, which may lead to extensive use of land resources and an imbalance between population and land.
VPR < 0, LR > 0
VIPR > 0, LR > 0, PR/LR < 1
Table 3. Ten major African countries and their share of urban land growth in different periods.
Rank2001–20072007–20132013–20192001–2019
1Nigeria
(17.73%)
Nigeria
(20.85%)
Nigeria
(26.43%)
Nigeria
(24.30%)
2Egypt
(8.02%)
Egypt
(12.99%)
The Democratic Republic of the Congo
(8.28%)
Ethiopia
(8.48%)
3South Africa
(6.94%)
The Democratic Republic of the Congo
(10.23%)
Ethiopia
(7.77%)
The Democratic Republic of the Congo
(8.32%)
4The Democratic Republic of the Congo
(5.76%)
Ethiopia
(6.06%)
Egypt
(7.12%)
Egypt
(6.01%)
5Uganda
(5.12%)
Kenya
(5.62%)
Tanzania
(4.41%)
Ghana
(4.10%)
6Kenya
(4.75%)
Sudan
(5.24%)
Ghana
(3.76%)
Sudan
(4.01%)
7Morocco
(4.18%)
South Africa
(4.48%)
Sudan
(3.59%)
South Africa
(3.72%)
8Ethiopia
(4.07%)
Uganda
(3.50%)
Kenya
(2.58%)
Cameroon
(3.08%)
9Algeria
(4.04%)
Tanzania
(3.19%)
South Africa
(2.57%)
Tanzania
(2.61%)
10Côte d’Ivoire
(3.19%)
Cameroon
(2.10%)
Morocco
(2.46%)
Tunisia
(2.44%)
Total63.81%74.26%69.07%67.08%
Table 4. Ten major African countries and their share of urban population growth in different periods.
Rank2001–20072007–20132013–20192001–2019
1Nigeria
(15.28%)
Nigeria
(31.50%)
Nigeria
(27.71%)
Nigeria
(25.35%)
2Ethiopia
(12.93%)
The Democratic Republic of the Congo
(12.94%)
The Democratic Republic of the Congo
(10.85%)
The Democratic Republic of the Congo
(10.44%)
3The Democratic Republic of the Congo
(7.37%)
Egypt
(6.37%)
Ethiopia
(8.56%)
Ethiopia
(6.82%)
4Cameroon
(4.88%)
South Africa
(4.80%)
Egypt
(7.98%)
Egypt
(6.57%)
5Zimbabwe
(4.72%)
Morocco
(4.25%)
Côte d’Ivoire
(5.10%)
Côte d’Ivoire
(3.79%)
6Egypt
(4.07%)
Tanzania
(4.17%)
Sudan
(3.87%)
Ghana
(3.47%)
7Ghana
(3.96%)
Ghana
(4.09%)
Madagascar
(3.04%)
Sudan
(3.46%)
8Tunisia
(3.76%)
Sudan
(3.34%)
Ghana
(2.91%)
Tanzania
(3.03%)
9Algeria
(3.59%)
Côte d’Ivoire (3.29%)Tanzania
(2.36%)
Tunisia
(2.80%)
10Tanzania
(3.25%)
Tunisia
(2.74%)
Algeria
(2.35%)
South Africa
(2.74%)
Total63.80%77.51%74.73%68.46%
Publisher’s Note: MDPI stays neutral with regard to jurisdictional claims in published maps and institutional affiliations.

