1. Introduction
Analysis of pedestrians’ motion is one of the core problems for many autonomous systems in public scenes, such as surveillance, crowd simulation, mobile robot navigation, and autonomous driving. It is also essential for urban safety, and city planning. Trajectory prediction relies on the past observed human motion to predict the future locations of the pedestrians. Perceiving the crowd behavior and understanding the future behavior of agents are crucial abilities. Trajectory prediction is a challenging task. The pedestrian trajectory can be influenced by multiple factors, including individual moving style, the underlying destination, the motion of other agents, the environment topology structure, etc. Moreover, the agents velocity, the interactions with other moving pedestrians also affect the walking behavior of an individual. An efficient and effective end-to-end trainable framework is expected to improve pedestrian trajectory prediction performance.
Most current methods of pedestrian action prediction are sequence prediction. Since the Long-short term memory networks (LSTM) show the ability to learn and reproduce long sequences effectively, some LSTM-based approaches [
1] are proposed to learn social behaviors. Then, some researchers integrate rich information into the standard LSTM, such as current intention of neighbors [
2], group coherent motion patterns [
3], scene information [
4,
5], high-level road-agent behavior [
6], dynamic and static context-aware motion [
7]. By adding this information to human movement trajectories in the prediction process, the performance can be improved significantly. In addition, some researchers try to use classical algorithms in AI-based methods. For example, combining Kalman filter algorithm and support vector machine algorithm to predict the trajectory prediction of fast flight ping-pong in the research of ping-pong robot [
8], and using a Deep Kalman Filtering Network (DKFN) for traffic prediction [
9]. The results show that the prediction accuracy is obviously improved compared with the single algorithm.
This problem of trajectory prediction can be viewed as a sequence generation task, where researchers are interested in predicting the future trajectory of people based on their past positions. Some efforts [
10,
11,
12,
13,
14] have been made to tackle social interactions and produce socially acceptable trajectories through generative adversarial networks (GANs). They introduce the adversarial loss along with sequence generation. Note that the notorious instability of training is a challenge, so integration needs to be done carefully. This strategy can improve the traditional trajectory prediction performance obviously.
Applying attention in sequence learning tasks has proved its effectiveness in the overall algorithm performance [
11,
15,
16,
17], and in pedestrian trajectory prediction methods [
18,
19,
20,
21]. It is helpful to draw more plausible trajectories. Some researchers [
11,
15,
16] use the soft attention modules to evaluate social interactions. Fernando et al. [
17] applied hard attention to assign weights based on pedestrians’ distance, they also introduced additional soft attention to evaluate the interaction salience in a scene region. So, their trajectory prediction drew conclusions about which region was more likely for a pedestrian to navigate through. In the proposed work, we use the transformer network adopting an attention mechanism with Query-Key-Value (QKV) model to predict the pedestrian future location.
Inspired by the great success of transformer in natural language processing [
18,
19], computer vision [
20,
22,
23], and audio processing [
21,
24,
25], we aim to implement trajectory forecasting with an end-to-end transformer model. Thanks to their better capability to learn non-linear patterns, we argue that transformer networks are suitable for sequence modeling and trajectories forecasting. Giuliari et al. [
26] utilize a simple Transformer model to achieve good performance on the single trajectory forecasting task. They feed the current and prior positions sequence to the encoder-decoder transformer network (TF), and predict the future track positions. However, the decoder is trained with ground truth, but tested with predicted positions. The predicted points are often biased, and affect the following prediction, resulting in inevitable error cascades. To overcome this problem, we propose a transformer model embedding the random deviation query. During training, disturbance error is embedded in the query, and the decoder is still required to predict accurate trajectory. In this way, the network has the ability of self-correction, alleviates the prediction deviation caused by error cascade, and improves the robustness.
In this work our main contributions are twofold:
First, we propose an effective and end-to-end trainable framework built upon the transformer framework which is embedded with a random deviation query for trajectory forecasting. Taking advantage of the self-correcting ability introduced by the random deviation query, the robustness of the existing transformer network is enhanced. For detail, we design an attention mask to solve the assignment problems between parallel input queries and sequentially predict.
Second, we present a co-training strategy based on a classification branch to improve the training effect. The whole scheme is trained collaboratively by the original loss and classification loss, which can improve the accuracy of the results. Experimental results compared with the state of the art methods show that the proposed method can predict plausible trajectory with higher accuracy.
The remainder of this paper is organized as follows. In
Section 2, we briefly review the related work. Then the materials and methods are proposed in
Section 3. Experimental results on datasets are presented in
Section 4. Finally, the conclusion and prospect are presented in
Section 5.
2. Related Work
Analysis of pedestrians’ motion has been studied for many years. Some researchers have dedicated their works to model pedestrian dynamics [
27,
28], develop software for pedestrian trajectories extraction [
29], and estimate pedestrian safety level [
30]. We give a brief review of the literature on pedestrian trajectory forecasting, especially approaches that compared with the proposed method. For the purpose of this paper, we distinguish two main trends for related work: social-based and attention-based trajectory forecasting.
social-based trajectory forecasting: Many existing methods employ social information into trajectory prediction. Early works include LSTM-based methods [
1,
2,
4,
5,
7] that utilize LSTM network to learn context information. Then, a variety of social information are taken into account, such as current intention of neighbors [
2,
31], group coherent motion patterns [
3], scene context [
4,
5,
32,
33], high-level road-agent behavior [
6], dynamic and static context-aware motion [
7], and social interactions modelling [
34]. Then, following the success of the Generative Adversarial Network (GANs), some efforts [
10,
11,
12,
13,
14] have been made to tackle social interactions. The social GAN model (abbreviated as SGAN) attemps to generate multiple trajectory predictions for each observed trajectory. Their network includes a pooling module to expand the neighborhood around each person of interest (POI) to cover the whole scene so all the pedestrians can be considered in the training and prediction processes. This effectively expands the local neighborhood context to a global level. Similarly, Sophie [
11] uses GAN to generate multiple future paths for each trajectory.
attention-based trajectory forecasting: Attention-based models have been widely used in many tasks, such as natural language processing [
18,
19], computer vision [
20,
22,
23], and audio processing [
21,
24,
25]. In the area of trajectory prediction, attention mechanisms have been used to draw more plausible trajectories [
11,
15,
16,
17,
35,
36]. Sadeghian et al. [
11] focus on the problem of wider scope: one that involves both pedestrians and vehicles. Giuliari et al. [
26] utilize a simple transformer model to achieve good performance on a single trajectory forecasting task. They feed the current and prior positions sequence to the encoder-decoder transformer network (TF) and predict the future track positions. The SoPhie method [
11] uses two attention modules to deal with scene context and social interactions.
Different from the methods reviewed above, an effective and end-to-end trainable transformer-based framework is used to predict the pedestrian trajectory. The temporal and spatial information of trajectories is embedded in queries. Moreover, embedding random deviation query is helpful for robustness and generalizability.
3. Materials and Methods
In this work, we address the problem of future positions prediction by processing their current and prior positions. Encoder-decoder transformer learns the pedestrian trajectory embeddings. The random deviation query and co-training strategy are beneficial to boost network performance. We will present the details of the proposed method in the following. The proposed approach is visualized in
Figure 1. Symbols and their representations in this section are shown in
Table 1.
3.1. Problem Formulation
Assume there are total of N pedestrians involved in a scene, and t is the current time stamp (frame). The trajectory of a pedestrian from time stamp to is denoted as . The spatial location at time t of the pedestrian is denoted as . If we let 0 be the current time stamp, the current and prior positions observed in Cartesian coordinates are denoted as , and the predicted positions are . The proposed network aims to generate predicted trajectories that match the ground truth future trajectories .
We sequentially predict the points in each future frame. Since some works [
37,
38] have shown that the displacement prediction is easier in sequential estimation, therefore we predict the location displacement corresponding to a current frame for each pedestrian. A 2M-dimensional displacement vector
is used to discribe pedestrian
’s walking path in the past M time stamps with respect to
. When feeding to the transformer, the input vector is embedded onto a higher D-dimensional space by a linear projection with a matrix of weights
. Similarly, the output of the transformer is back-projected to the Cartesian coordinates.
Positional encoding: The transformer network discards the sequential nature of time-series data used in the LSTM-based model, but models temporal dependencies with the self-attention mechanism. Thus, the input embedding data
consists of spatial trajectory embedding
and temporal position embedding
. By following the same setting as in [
18], the position embedding
is defined by sine and cosine functions. Each dimension of the positional encoding varies in time according to a sinusoid of different frequency, from
to 10,000·
, which ensures a unique time stamp for the error.
Position embeddings are useful in our model, since they give the network a sense of which position of the sequence it is currently dealing with. There is no position information in self-attention. Through position embedding, each position has a unique position vector. In other words, each appends a one-hot vector .
3.2. Encoder-Decoder Transformer
Figure 1 shows the overall framework of the proposed approach for pedestrian trajectory prediction. In general, the framework is a transformer-based network assisted with random deviation queries and a classify branch to enhance performance. The observed pedestrian positions are fed to the network, and the network predicts the future trajectory. The detail information of the encoder and decoder in the transformer are also shown.
Firstly, an end-to-end transformer is used as the base network to learn the function from prior trajectory sequence to future sequence. In this work, the encoder-decoder network is composed of six encoder blocks and six decoder blocks. The encoder block includes a multi-head attention and a feed forward network (FFN), and the decoder block contains two multi-head attention (one of which uses masked) and an FFN. Each is followed by a residual add to prevent degradation and a layer normalization to accelerate convergence.
The transformer is a mechanism in which a model learns to make predictions by selectively focusing on given data. While self-attention is an attention mechanism in which the model uses the observed portion of the sample and makes predictions of the remaining. The inputs of an attention module consist of Q (query embedding inputs), K (key embedding inputs) and V (value embedding inputs). Thus, the output is the weighted sum of the Value vectors, where the weight assigned to each V is determined by the scaled dot product of Q and the corresponding K.
Multi-head attention is the core component of Transformer. Unlike simple attention, the multi-head mechanism breaks the input into many small chunks, computes the scaled dot product of each subspace in parallel, and finally concatenates all the attention output.
where
are the weight matrices in queries, keys, values, and output. All these weights can be trained.
In each sub-layer, multi-head attention has a feed forward network (FFN). The order in FFN is a linear transformation [
18], Relu activation [
39], and another linear transformation. The dropout is used to reduce overfitting, speed up training and enhance performance.
During the training procedure, the encoder is fed current and previous positions embeddings. Then the encoder outputs are passed to the decoder as memory to make an attention operation. In addition, the decoder is fed object queries which are referred to as position embedding of predicted position vectors, and the object queries are ground truth points in training. The decoder generates positions of future time stamps when testing.
In addition, we design an attention mask to prevent positions from attending to subsequent positions. This masking ensures that the predictions for position
i can depend only on the known outputs at positions prior to
i. The mask matrix
is added to the softmax layer of self-attention in the decoder, i.e,
.
where
determines whether the query
is prior to the query
. The queries after the current time stamp are masked so that the prediction is only based on the current and prior data.
3.3. Random Deviation Query
Encoder-decoder transformer learns the pedestrian trajectory embeddings. However, we observe that the output of the decoder block is not parallel in testing, but is predicted sequentially. Especially, the input of the decoder is ground truth in training, but predict queries with bias in testing. This deviation would cascade, leading to worsening predicted position along with the time stamp. Introducing appropriate deviation in training may improve the robustness and the performance of the network. With this motivation, random deviation queries is added as the input of the decoder for training to simulate the biased input. The random deviation query is defined as “deviation query + ground truth query”. Even though one predicted point deviates from the ground truth, subsequent frames can still predict accurate position.
To improve the training effect, we also introduce a co-training strategy, which is based on the classification task. In the training process, the random deviation query containing real positions information can assist the decoder training. While in testing, the decoder input contains predicted position information which is deviated most of the time. Considering the decoder receives the predicted value rather than the ground truth in testing, a classification branch is added to judge whether the predicted sequence is accurate or not. As
Figure 1 shows, a fully connected layer is set as a classifier.
The labels of the deviation query are defined based on the random deviation value. In the classification branch, the accuracy discrimination distance (ADD)is defined to measure the degree of deviation. , where and are random deviation queries, and are ground truth queries. If the ADD is greater than the threshold value (which is set as 0.3), the corresponding label is 0. Similarly, the label is 1 when ADD is less than the threshold. The reason is that we assume the network can predict an accurate future trajectory. Theoretically, if the current position deviates far from the real point, then the next position predicted based on it would not be accurate, and vice versa.
3.4. Final Objective
For the loss calculation, the original trajectory loss is the distance between the predicted position displacement and the ground truth position displacement at time stamp , i.e., . denotes the total frames of predictions. The classification loss is the cross-entropy of the output of the classifer and the corresponding labels , i.e.,
The final loss for the network is defined as:
where
keeps the balance of the two objectives.
is set as 50 for training.
4. Results
We evaluate the end-to-end transformer model on several trajectory forecasting datasets, and achieve comparable performance compared to methods in the literature. Implementation of the proposed model and its training are based on the PyTorch deep learning framework, using NVIDIA Geforce RTX 3090 GPU.
4.1. Experiment Setup
The detail information of the datasets and metrics are listed as follows:
Datasets; Following the related prior research, we evaluate the proposed method on two public datasets: ETH [
40] and UCY [
41]. These datasets contain 5 video sequences (Hotel, ETH, UCY, ZARA1, and ZARA2) consisting of 1536 pedestrians in total with different movement patterns and social interactions. People walk in parallel, moving in groups, turning in the corner, avoiding collisions when they walk face-to-face. These are common scenarios that involve social behaviors. These sequences are recorded in 25 frames/second (fps) and contain 4 different scene backgrounds.
Metrics; Average Displacement Error (ADE), mean square error overall estimated points in the predicted trajectory and ground-truth trajectory. Final Displacement Error (FDE), the distance between the predicted final destination and the ground-truth final destination. They can be mathematically defined as follows:
4.2. Experiment on ETH and UCY Dataset
First we compare the proposed methods to the state of the art methods on ETH and UCY datasets following the single trajectory deterministic protocol.
Table 2 summarizes these results and shows that the proposed model achieves comparable performance. The results are separated into two categories: social version and individual version, listed in the top and bottom parts of the table, respectively (separated with a line). We achieve the best performance in the individual version (blue data). For the social version, comparable results are achieved. The average error result also indicates that adding more mapping information can significantly improve performance. Comparison with some approaches with a best-of-20 protocol [
14] are shown in
Table 3. Several models are trained, drawing 20 samples during both training and testing, and the best model is selected. So far, the best-of-20 protocol is a kind of upper-bound. The proposed method yields the best performance compared with other individual methods on ETH and UCY datasets (blue data). Furthermore, we achieve the best performance in the ADE and FDE on the Hotel dataset and FDE on Zara2 (black bold data), compared with the social-based and individual-based approaches.
Figure 2 shows the qualitative comparison of the predicting results between the proposed method with TF [
26], a classical transformer method. Some examples successfully predict the trajectories with small errors are shown on the first two rows. The last row shows some suboptimal cases. For example, the pedestrian took a linear path while the real trajectory is curved. Even so, the proposed method predicts a plausible path.
We observe that most individual-based methods perform worse than social-based methods. The reason is that social information is considered, e.g., the influence of other agents. For example, when a pedestrian comes in the opposite direction or stops on the planning path, the original plan should be changed to avoid a collision. Besides, when traveling with a partner, the agent should keep the speed and distance constant. Another factor affecting performance is abnormal trajectory. For example, a pedestrian making a sudden turn. The observed information cannot reflect the pedestrian’s intention to turn, but the phenomenon of turning in the prediction time stamp. The predictive function of the model is useless in this case, and the prediction path is still straight. The reasons are as follows: firstly, the destination of a pedestrian is unknown, future turns cannot be predicted according to the previous trajectory information. Secondly, the pedestrians’ history behavior habits are unknown. If combining the historical track of the agents and the observed trajectories, accurate predictions may still be made even when there are turns or speed changes.
4.3. Ablation Study
A number of ablation studies are performed to show the details of the proposed method. The results and discussions are shown following.
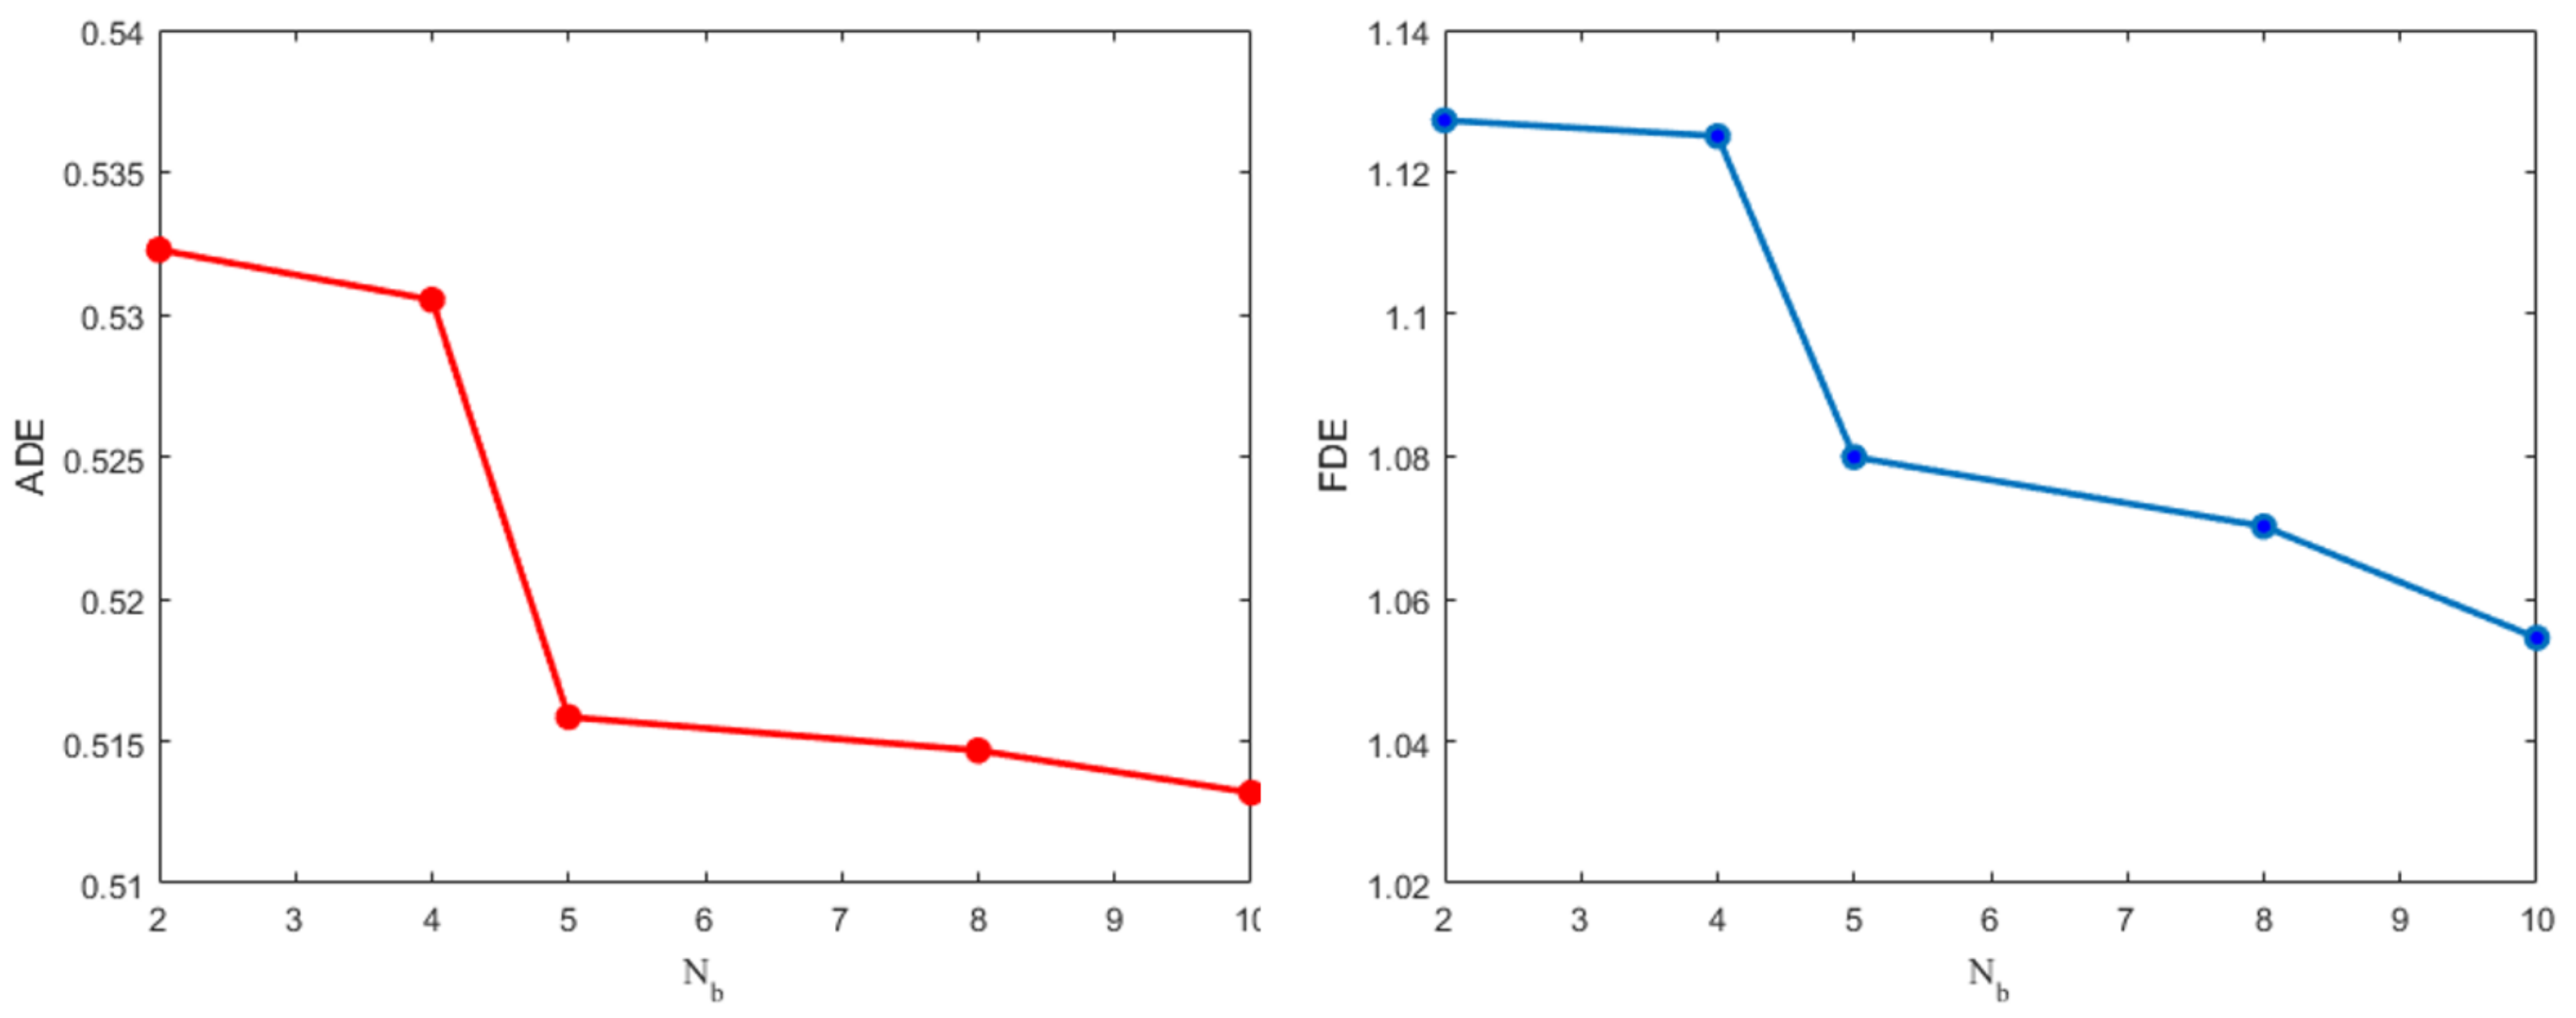
4.3.1. Effect on Different Numbers of Encoder-Decoder Blocks
Table 4 shows ADE and FDE results when the number of blocks in the encoder and decoder is changed. For the encoder, each block contains a multi-head attention module, an FFN, and two following residual connections. For the decoder, each block contains two multi-head attention (one of which uses masked), an FFN, and two following residual connections too. Since the encoder and decoder architectures play the same important role, we set the same numbers of blocks in both of them. We can see that with the increase of blocks, ADE and FDE gradually decreased. ADE and FDE tend to be stable when the number of blocks increases to 6. Thus, considering the balance between performance and computation, the number of blocks layers is set to 6 in the modular transformer. The comparison visualization results of average ADE and FDE can be seen in
Figure 3.
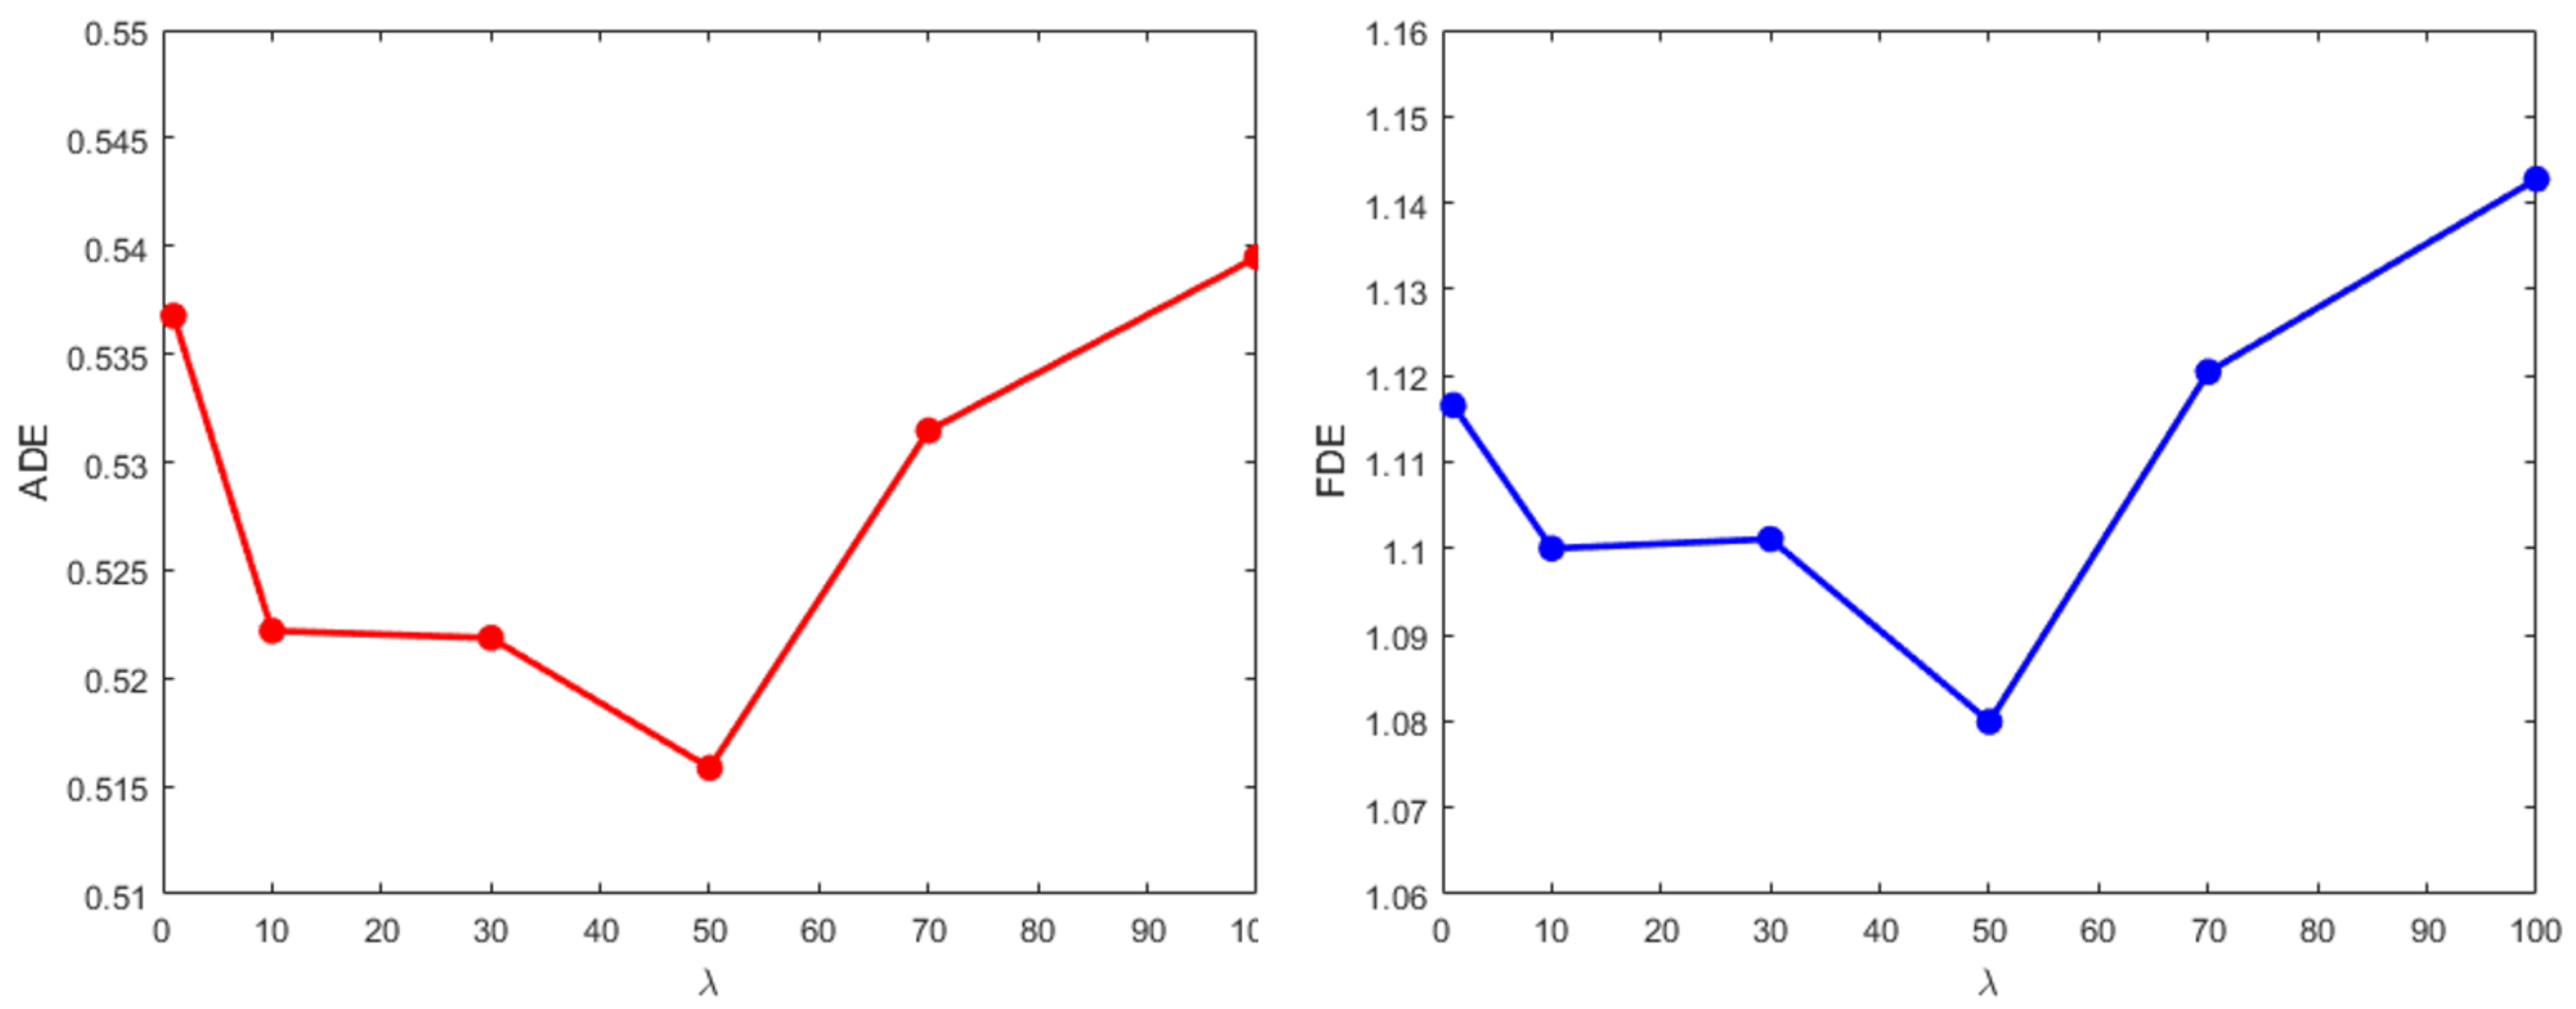
4.3.2. Effect on Different Key Parameter
A comparison experiment is taken on ETH and UCY datasets to find the optimum value of super parameter
, which is used to keep the balance of the loss. With the increase of
, the performance keeps getting better steadily until up to 50 when starts to deteriorate. Especially when adding ADE and FDE to make the error superposition, the effect is more obvious (black bold data). Since the ADE and FDE are very small, adding them together can better reveal the differences. This means that a suitable equilibrium loss function can encourage the network to predict a more accurate trajectory. Although similar results can be achieved by other values,
Table 5 shows that the parameter of 50 is often sufficient to achieve very good results on pedestrian forecasting. Eventually, the parameter
is set to 50. This result shows that it is necessary to choose a suitable key parameter, and it can balance the different loss functions in the training process. The comparison visualization results of average ADE and FDE can be seen in
Figure 4.
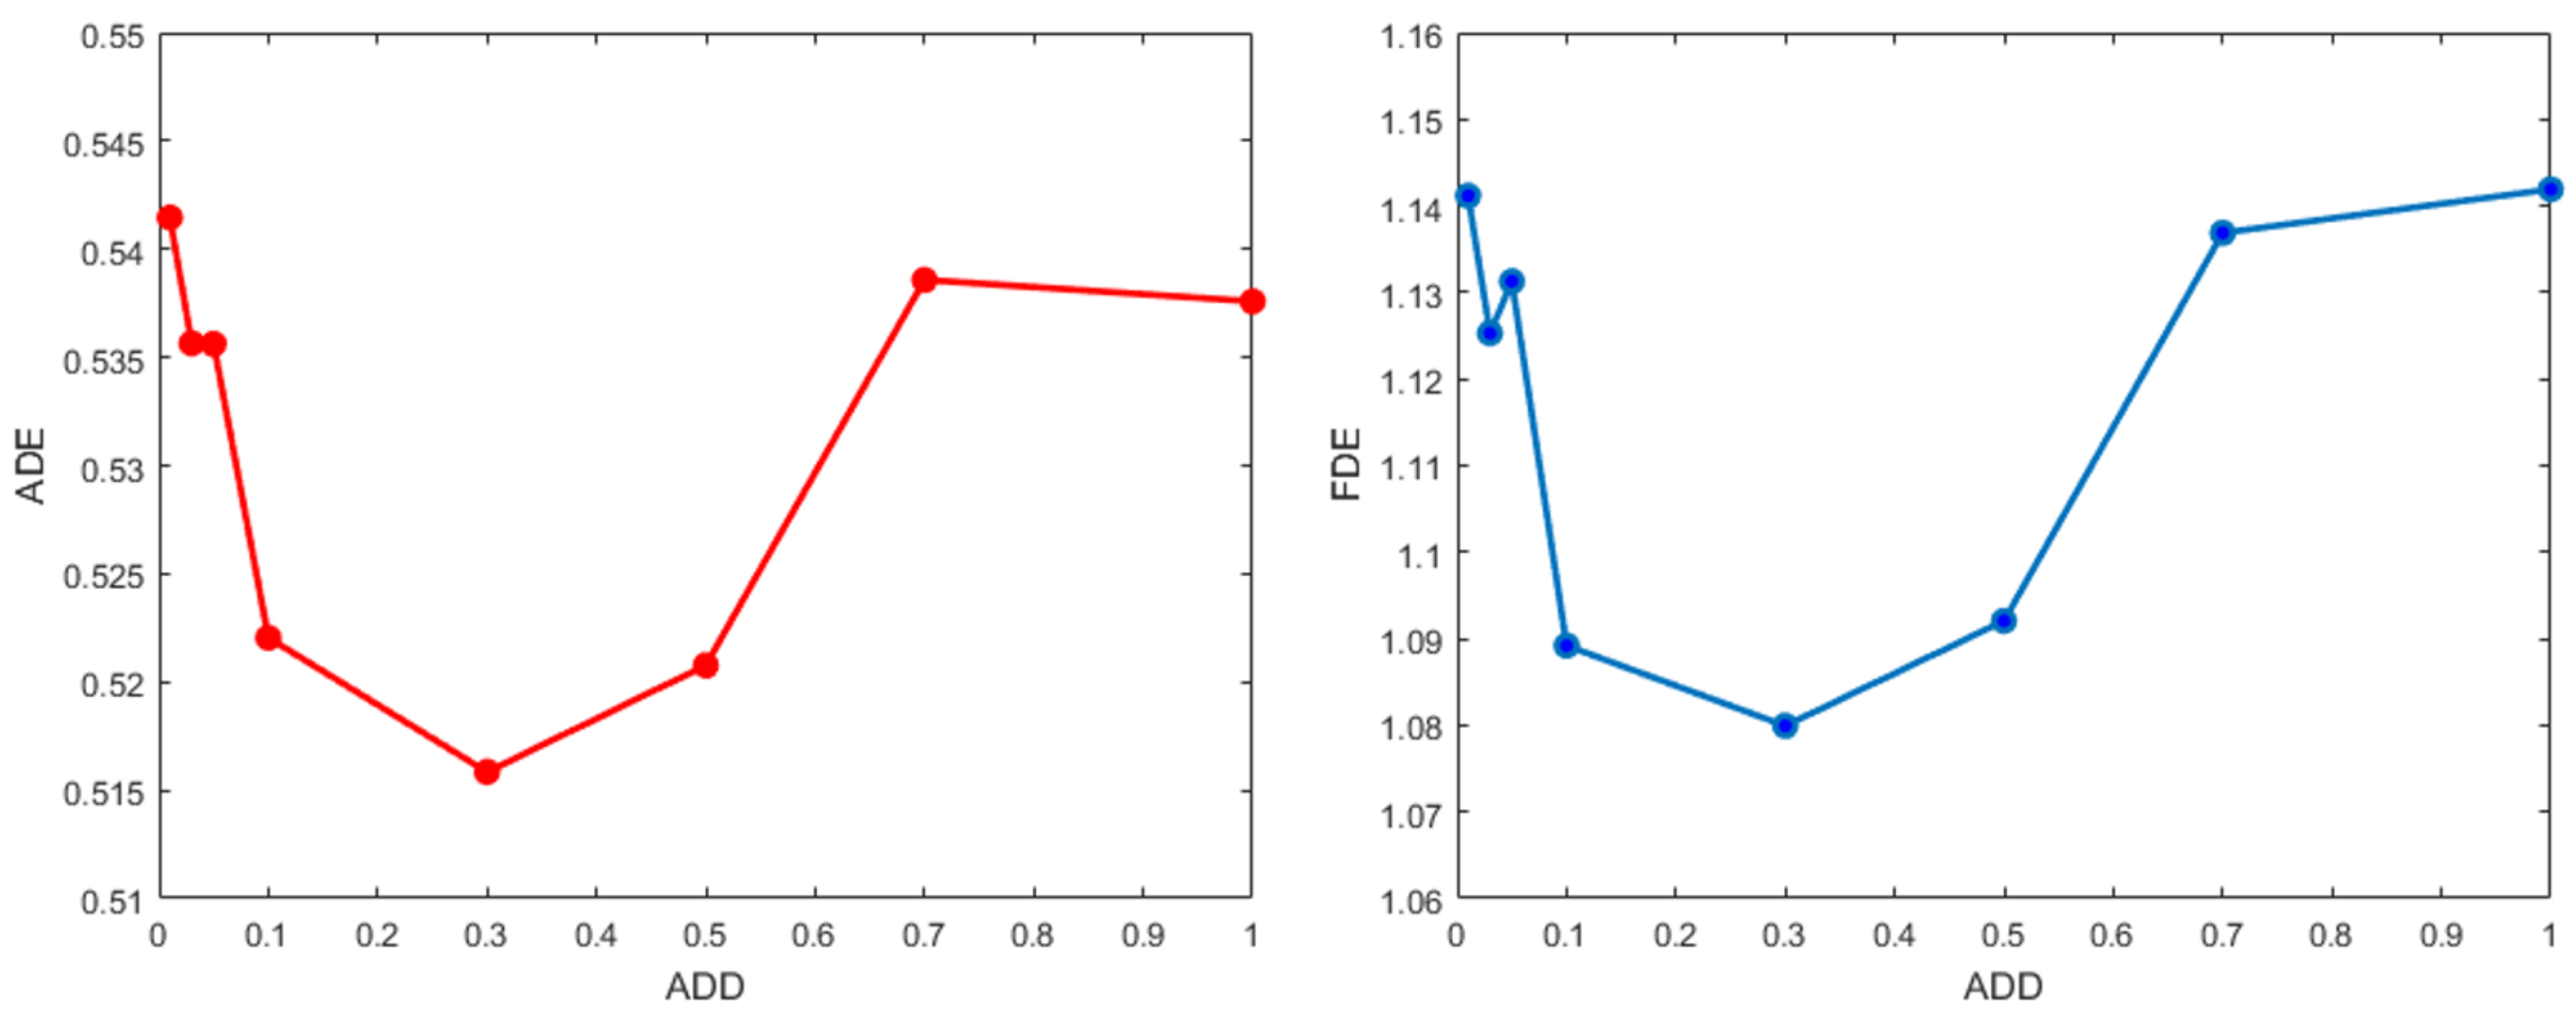
4.3.3. Effect on Different Accuracy Discrimination Distance
Accuracy discrimination distance (ADD) is defined to measure the degree of deviation. It is helpful to enhance the robustness of the network. If ADD is too large, the network would be insensitive to deviations, resulting in largely biased prediction. On the contrary, too small ADD invalidates the classifier branch, leading to deviation correction failure. The comparison results on ETH and UCY datasets with different ADD are shown in
Table 6, and the visualization results of average ADE and FDE can be seen in
Figure 5. To balance these two aspects, the threshold of ADD is set as 0.3 to pursue the best performance in average ADE and FDE.


