Article

Drought Assessment Based on Fused Satellite and Station Precipitation Data: An Example from the Chengbi River Basin, China

1
College of Architecture and Civil Engineering, Guangxi University, Nanning 530004, China
2
Key Laboratory of Disaster Prevention and Structural Safety of Ministry of Education, College of Civil Engineering and Architecture, Guangxi University, Nanning 530004, China
3
Guangxi Provincal Engineering Research Center of Water Security and Intelligent Control for Karst Region, Guangxi University, Nanning 530004, China
4
School of Water Conservancy and Civil Engineering, Northeast Agricultural University, Harbin 150000, China
*
Author to whom correspondence should be addressed.
ISPRS Int. J. Geo-Inf. 2022, 11(1), 48; https://doi.org/10.3390/ijgi11010048
Submission received: 2 December 2021 / Revised: 7 January 2022 / Accepted: 7 January 2022 / Published: 10 January 2022

Abstract

:
Drought poses a significant constraint on economic development. Drought assessment using the standardized precipitation index (SPI) uses only precipitation data, eliminating other redundant and complex calculation processes. However, the sparse stations in southwest China and the lack of information on actual precipitation measurements make drought assessment highly dependent on satellite precipitation data whose accuracy cannot be guaranteed. Fortunately, the Chengbi River Basin in Baise City is rich in station precipitation data. In this paper, based on the evaluation of the accuracy of IMERG precipitation data, geographically weighted regression (GWR), geographic difference analysis (GDA), and cumulative distribution function (CDF) are used to fuse station precipitation data and IMERG precipitation data, and finally, the fused precipitation data with the highest accuracy are selected to evaluate the drought situation. The results indicate that the accuracy of IMERG precipitation data needs to be improved, and the quality of CDF-fused precipitation data is higher than the other two. The drought analysis indicated that the Chengbi River Basin is in a cyclical drought and flood situation, and from October to December 2014, the SPI was basically between +1 and −1, showing a spatial pattern of slight flooding, normal conditions, and slight drought.

1. Introduction

Drought brings great harm to the production and life of human society, and may have serious indirect impacts on water-dependent ecosystems and species, which is one of the natural disasters with the most frequent occurrence and complex causes [1,2]. There have been many famous drought events in the world with heavy losses and negative impacts. For example, in Yorkshire, U.K., the most severe water drought was from 1995 to 1996, with a return period estimate of over 200 years [3]. In the United States, 18 droughts between 1980 and 2013 caused USD 253 billion in damages; the most recent drought event was the drought in California from 2011 to 2014, the damage of which exceeded USD 50 billion [4]. In 2012, nearly two-thirds of the continental United States suffered from a drought that caused tens of billions of dollars in damage, according to the National Centers for Environmental Information (NCEI) [5]. In order to minimize the economic losses caused by drought, more and more scholars are becoming aware of the importance of disaster research. There are fruitful research results in various aspects of drought assessment [6,7,8,9,10,11,12], drought early warning [13,14,15,16,17,18,19], and drought management [20,21,22,23].
Since only precipitation data are used in the drought assessment utilizing SPI, the precision of the assessment results is highly dependent on the accuracy of the precipitation data. At present, the main ways to obtain precipitation data are ground station observation and satellite observation. Ground stations can obtain high-precision precipitation information, but the limited quantity and uneven distribution make it difficult to reflect the heterogeneity of the spatial and temporal distribution of precipitation. With the development of satellite inversion precipitation technology in recent years, the spatial and temporal limitations of precipitation information can be solved, but there are errors in the results of satellite inversion precipitation products due to the influence of topography [24], climate [25], adjacent sea position [26], rainfall intensity [27], and so on. Therefore, it is necessary to combine the advantages of station precipitation data and satellite precipitation data to obtain accurate precipitation fusion data with long time series and wide spatial extent, which can serve to accurately assess the drought. In recent years, scholars have extensively worked on the selection of satellite data, the fusion of precipitation data, and the accurate assessment of drought.
An accuracy analysis of IMERG and two sets of TRMM (TRMM 3B42 and TRMM 3B42RT) satellite data using the simple averaging method in Singapore found that IMERG satellite data outperformed TRMM satellite data in terms of describing the spatial variability of precipitation and precipitation detection capability [28]. Other scholars compared and analyzed IMERG precipitation, TMPA precipitation, and GSMaP precipitation in India, and the study found that IMERG data can reflect the average value of monsoon rainfall and its variability more realistically than the measurement-adjusted TMPA and GSMaP data [29]. Moazami et al. [30] investigated the performance of multiple high-resolution remotely sensed precipitation estimates at hourly and daily time scales over Canada for 2014–2018; the study of IMERG V06 and MRMS precipitation estimates at a relatively high temporal resolution indicated that both products had the potential to complement ground-based observations over Canada. Ayat et al. [31] evaluated the effect of different sources of data in the uncertainties of a merged satellite product by comparing the Integrated Multi-satellite Retrievals for GPM (IMERG) Final product (V06B) with a ground-based radar product, Multi-Radar Multi-Sensor (MRMS), using both pixel-based and object-based approaches. In 2012, AghaKouchak et al. [32] used a Bayesian correction algorithm to combine GPCP data with real-time satellite precipitation datasets for drought monitoring and analysis. Hnilica et al. [33] presented a new approach to the bias correction utilizing principal components in combination with quantile mapping, which allowed for the correction of multivariate data sets. The proposed procedure significantly reduced the bias in covariance and correlation structures, as well as in the distribution of individual variables. Precipitation maps derived from the Tropical Rainfall Measuring Mission (TRMM) Multi-Satellite Precipitation Analysis (TMPA) 3B42 v7 satellite-based raw precipitation product provided by the National Aeronautics and Space Administration (NASA) were used to analyze the drought severity, duration, and impact areas in the Konya Closed Basin from 1998 to 2015 [34]. Katiraie-Boroujerdy, P.S. et al. [35] used a quantile mapping method with gauge information to reduce the systematic error of the Precipitation Estimation from Remotely Sensed Information using Artificial Neural Networks-Cloud Classification System (PERSIANN-CCS). During calibration and validation, the annual bias surface means were reduced by 98%. Le et al. [36] presented an efficient approach based on a combination of the convolutional neural network and the autoencoder architecture, called the convolutional autoencoder neural network, to correct the pixel-by-pixel bias for satellite-based products. In 2020, Wei et al. [37] evaluated the suitability of the latest retrospective Integrated Multi-satellite Retrievals for Global Precipitation Measurement V06 (IMERG) Final Run product with a relatively long period (beginning from June 2000) for drought monitoring over mainland China.
Montaseri et al. [38] used seven meteorological drought indices and Monte Carlo simulation methods to monitor drought characteristics in 12 different regions of the world with different climatic conditions. Nasrollahi et al. [39] provided Drought Hazard Index (DHI) maps using standardized precipitation indices (SPI) for 3- and 12-month time steps at weather stations for the period 1985–2011, using kriging interpolation and natural break methods in ArcGIS 9.3 software. Drought Vulnerability Index (DVI) maps were also provided through eight socio-economic and physical indicators. Finally, the Drought Risk Index (DRI) maps were provided by integrating the DHI and DVI maps, identifying the areas of Iran most vulnerable to drought. Samantaray et al. [40] analyzed drought events in the central Mahanadi river basin, a predominantly agricultural area in Orissa, India, using crop water stress as an indicator. At present, the research on drought in China mainly focuses on large basins, such as drought evaluation and prediction in Shandong Province [41], drought disaster risk assessment in the Yellow-Huaihai basin [42], comprehensive drought assessment in the upper reaches of the Yangtze River in Sichuan and Chongqing [43], comprehensive hydro-meteorological drought assessment in the Weihe River basin [12], etc. There are few studies on the application in small basins. Fernández et al. [44] used a multiplicative seasonal autoregressive integrated moving average model to forecast monthly streamflow in a small watershed (0.067 square kilometers) in Galicia (NW Spain); the results showed no drought evidence in this basin. Liu et al. [45] analyzed the drought status of the Dapoling basin (1627 square kilometers) from September to November using the SPI index.
In this paper, the Chengbi River Basin in the karst region of southwest China is taken as the study area, and on the basis of confirming the availability of satellite precipitation data, the satellite precipitation data are fused with the station precipitation data, and finally, the precipitation data with the highest accuracy after fusion are used for drought assessment in the Chengbi River Basin.
The research framework consists of three parts: accuracy assessment of IMERG precipitation data, accuracy assessment of fused precipitation data, and drought assessment using the fused precipitation data with the highest accuracy.

2. Study Area and Data Sets
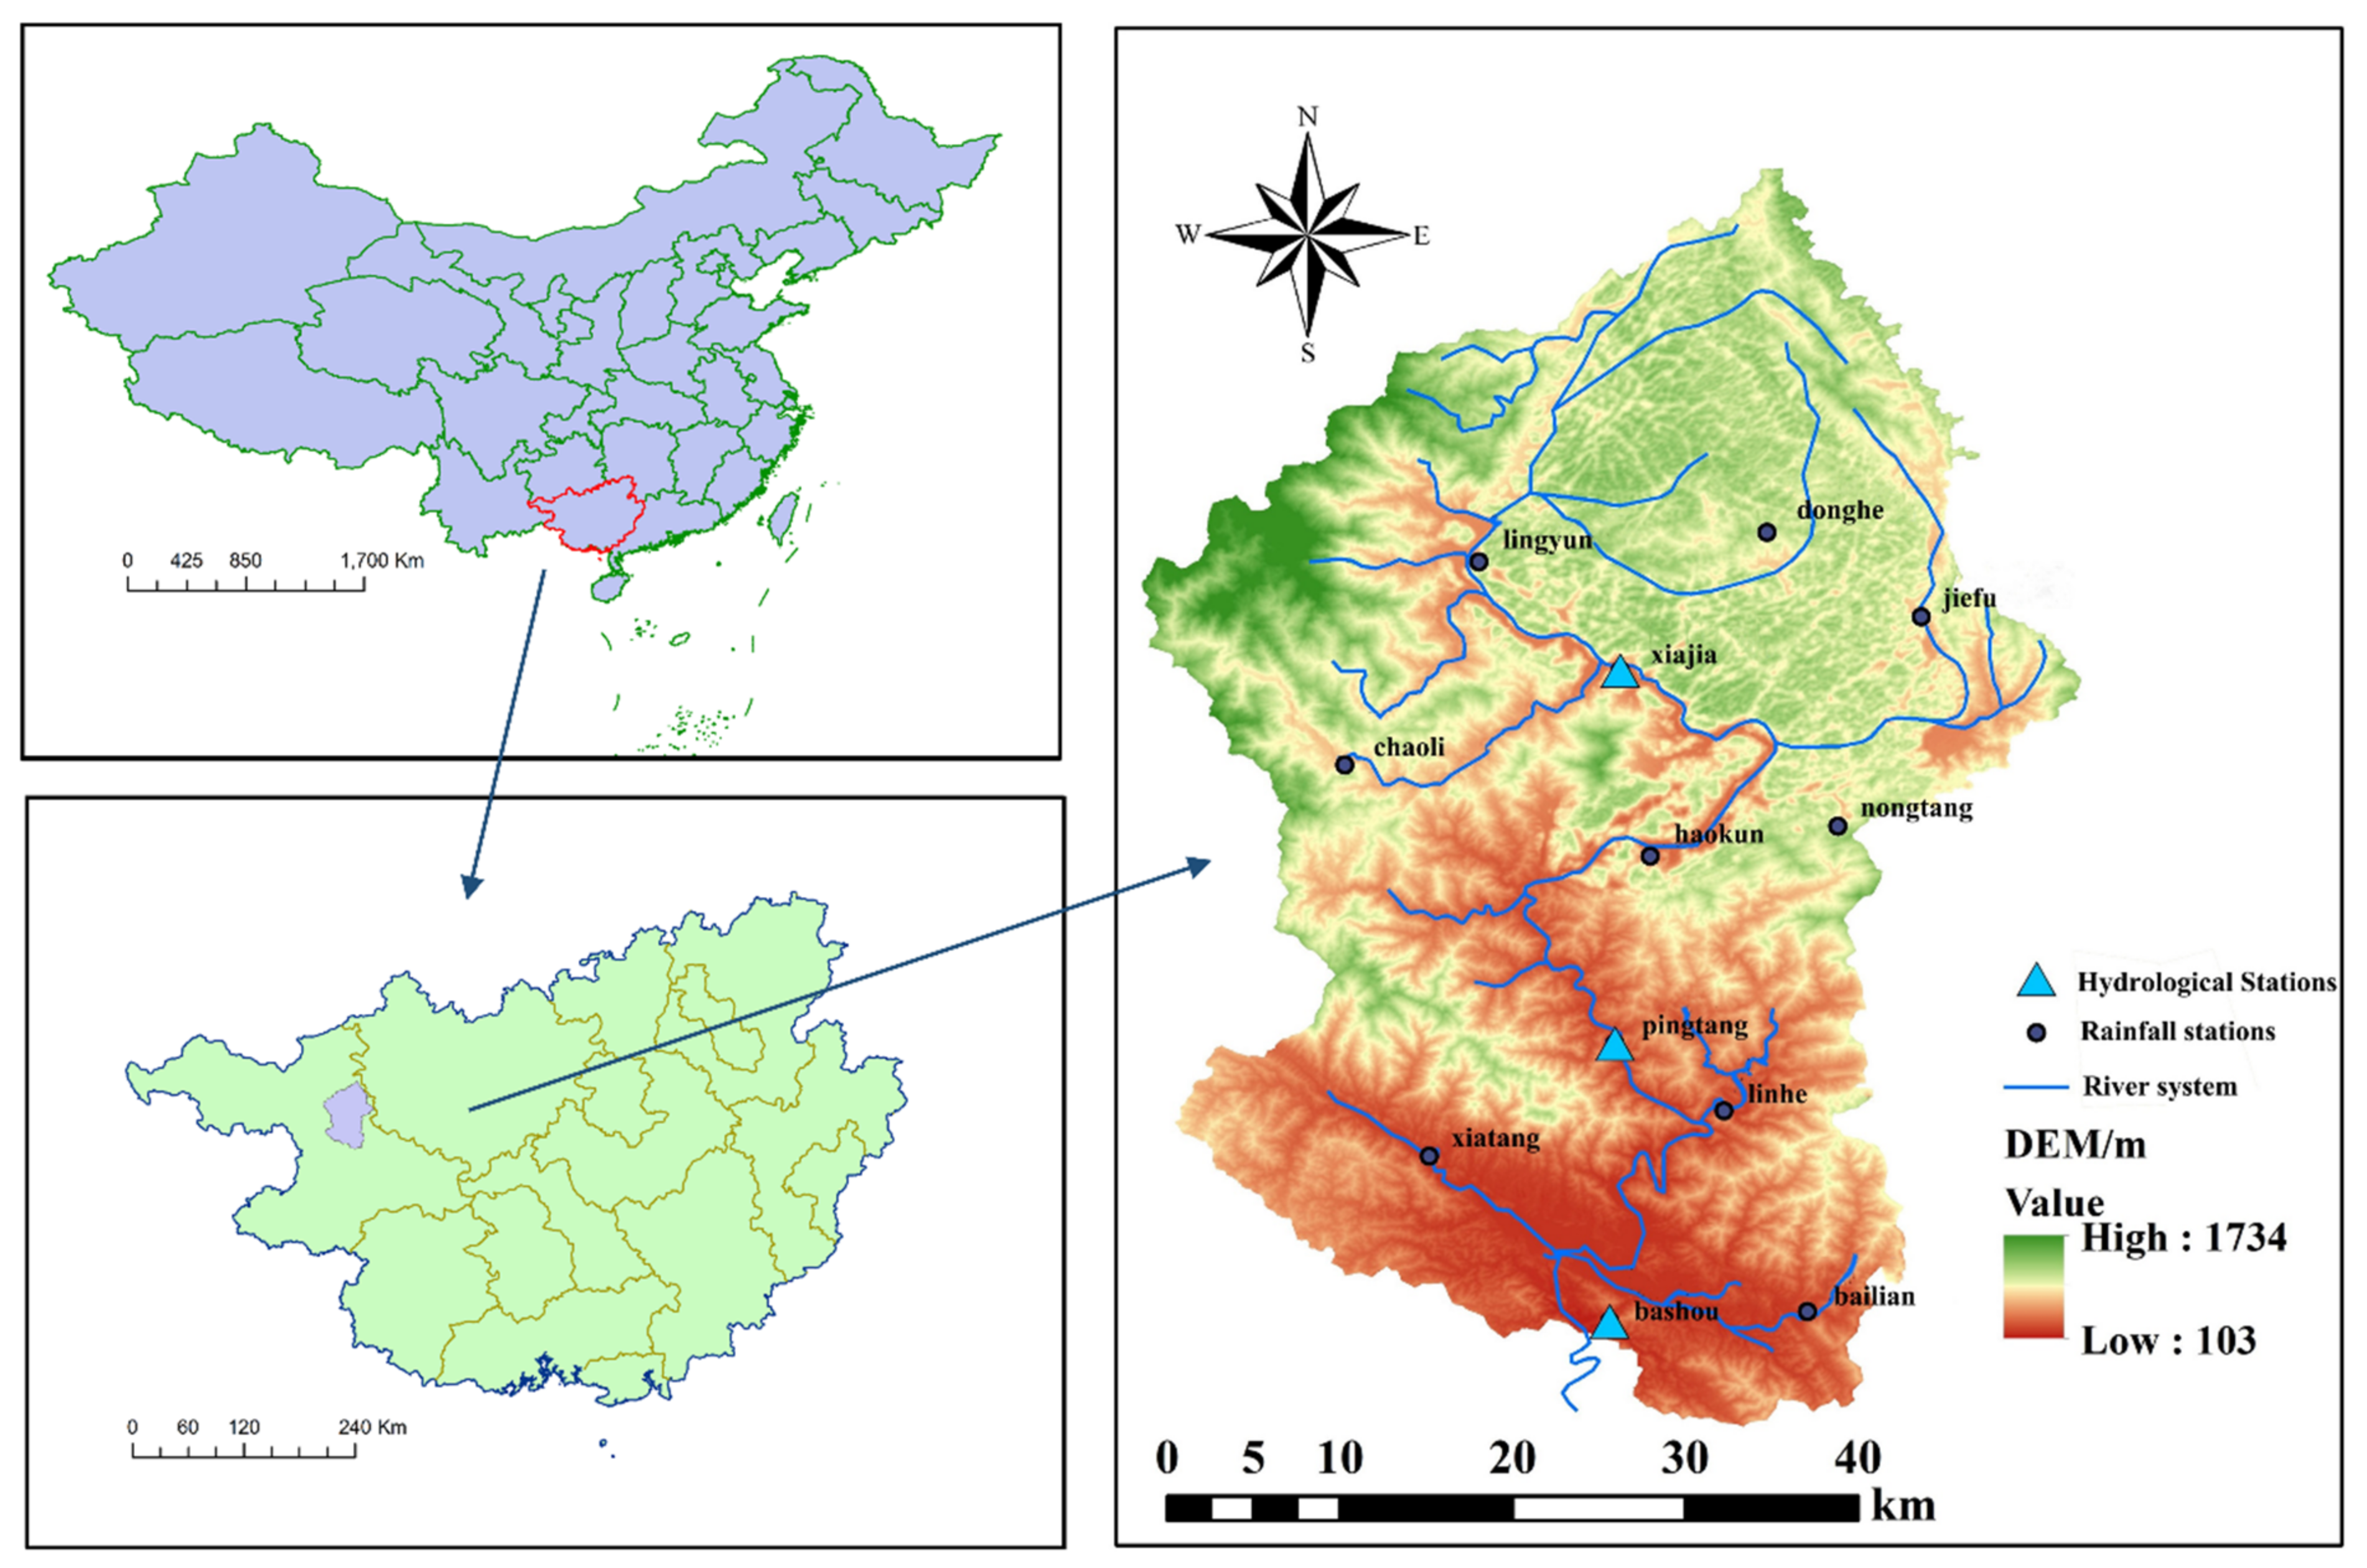
2.1. Study Area

The Chengbi River Basin is located in Baise City, northern Guangxi, which belongs to the Right River system of the Pearl River Basin. In the basin, bounded by Chaoli-Haokun-Nongtang, the north is a typical karst landform (such as Falling Water Cave, Skylight, Vuolian River, etc.) with shallow soil covered by low-permeability sandstone and shale bedrock [46], and the south is a hilly landform.
The climate in the basin is subtropical monsoonal, with high temperatures and rainfall in summer and low rainfall in winter. Precipitation from May to October accounts for about 87% of the annual rainfall, and the relative average humidity is 76%. In the context of climate change, the temperature in the flood season tends to increase [47], with an average annual rainfall and temperature of 1416.2 mm and 21.35 °C, respectively.
There are three hydrological stations and nine rainfall stations in the basin, and their distribution maps are shown in Figure 1. The measured precipitation data used in the article are all from the daily records of these 12 stations. Among these 12 stations, except for the annual precipitation of Bashou Station, Bailian Station, and Linhe Station, which showed a slightly decreasing trend, the annual precipitation of other stations showed an increasing trend. The specific location information of each station as well as the average, maximum, and minimum annual precipitation information are shown in Table 1. By comparing the altitude data with the average, maximum, and minimum precipitation data in the table, it can be seen that the precipitation roughly increases with the increase in altitude. Figure 2 shows the hypsometric curve of the Chengbi River Basin, which indicates the youthful stages of maturity of the landscape development. It can be seen from Figure 2 that, except for some stations at low elevation, the distribution of other stations on this curve is basically uniform, and the distribution of 12 stations in space is also uniform, as seen from the station distribution in Figure 1; thus, the precipitation of these 12 stations can basically represent the surface precipitation of the study area.

2.2. Data Sets

2.2.1. Satellite Data

So far, three different sets of IMERG satellite data have been released, namely IMERG-Early, IMERG-Late, and IMERG-Final. IMERG-Final data have been calibrated with reference to the monthly measured precipitation data from rainfall stations, and the data accuracy is better than the other two sets. In recent years, domestic and international studies have also proved that IMERG-Final data are better than IMERG-Early and IMERG-Late data [48]. The IMERG satellite precipitation data used in this study were downloaded from the final product from the official NASA website, corrected for monthly scales by ground rainfall stations, and the daily time scale was from 1 January 2002 to 31 August 2018.

2.2.2. DEM Data

The digital elevation model (DEM) data used in this study were downloaded from the geospatial data cloud GDEMV2 30 m, and the DEM of the Chengbi River Basin was obtained by stitching, cropping, and coordinate transformation using ArcGIS 10.6.

2.2.3. Measured Data
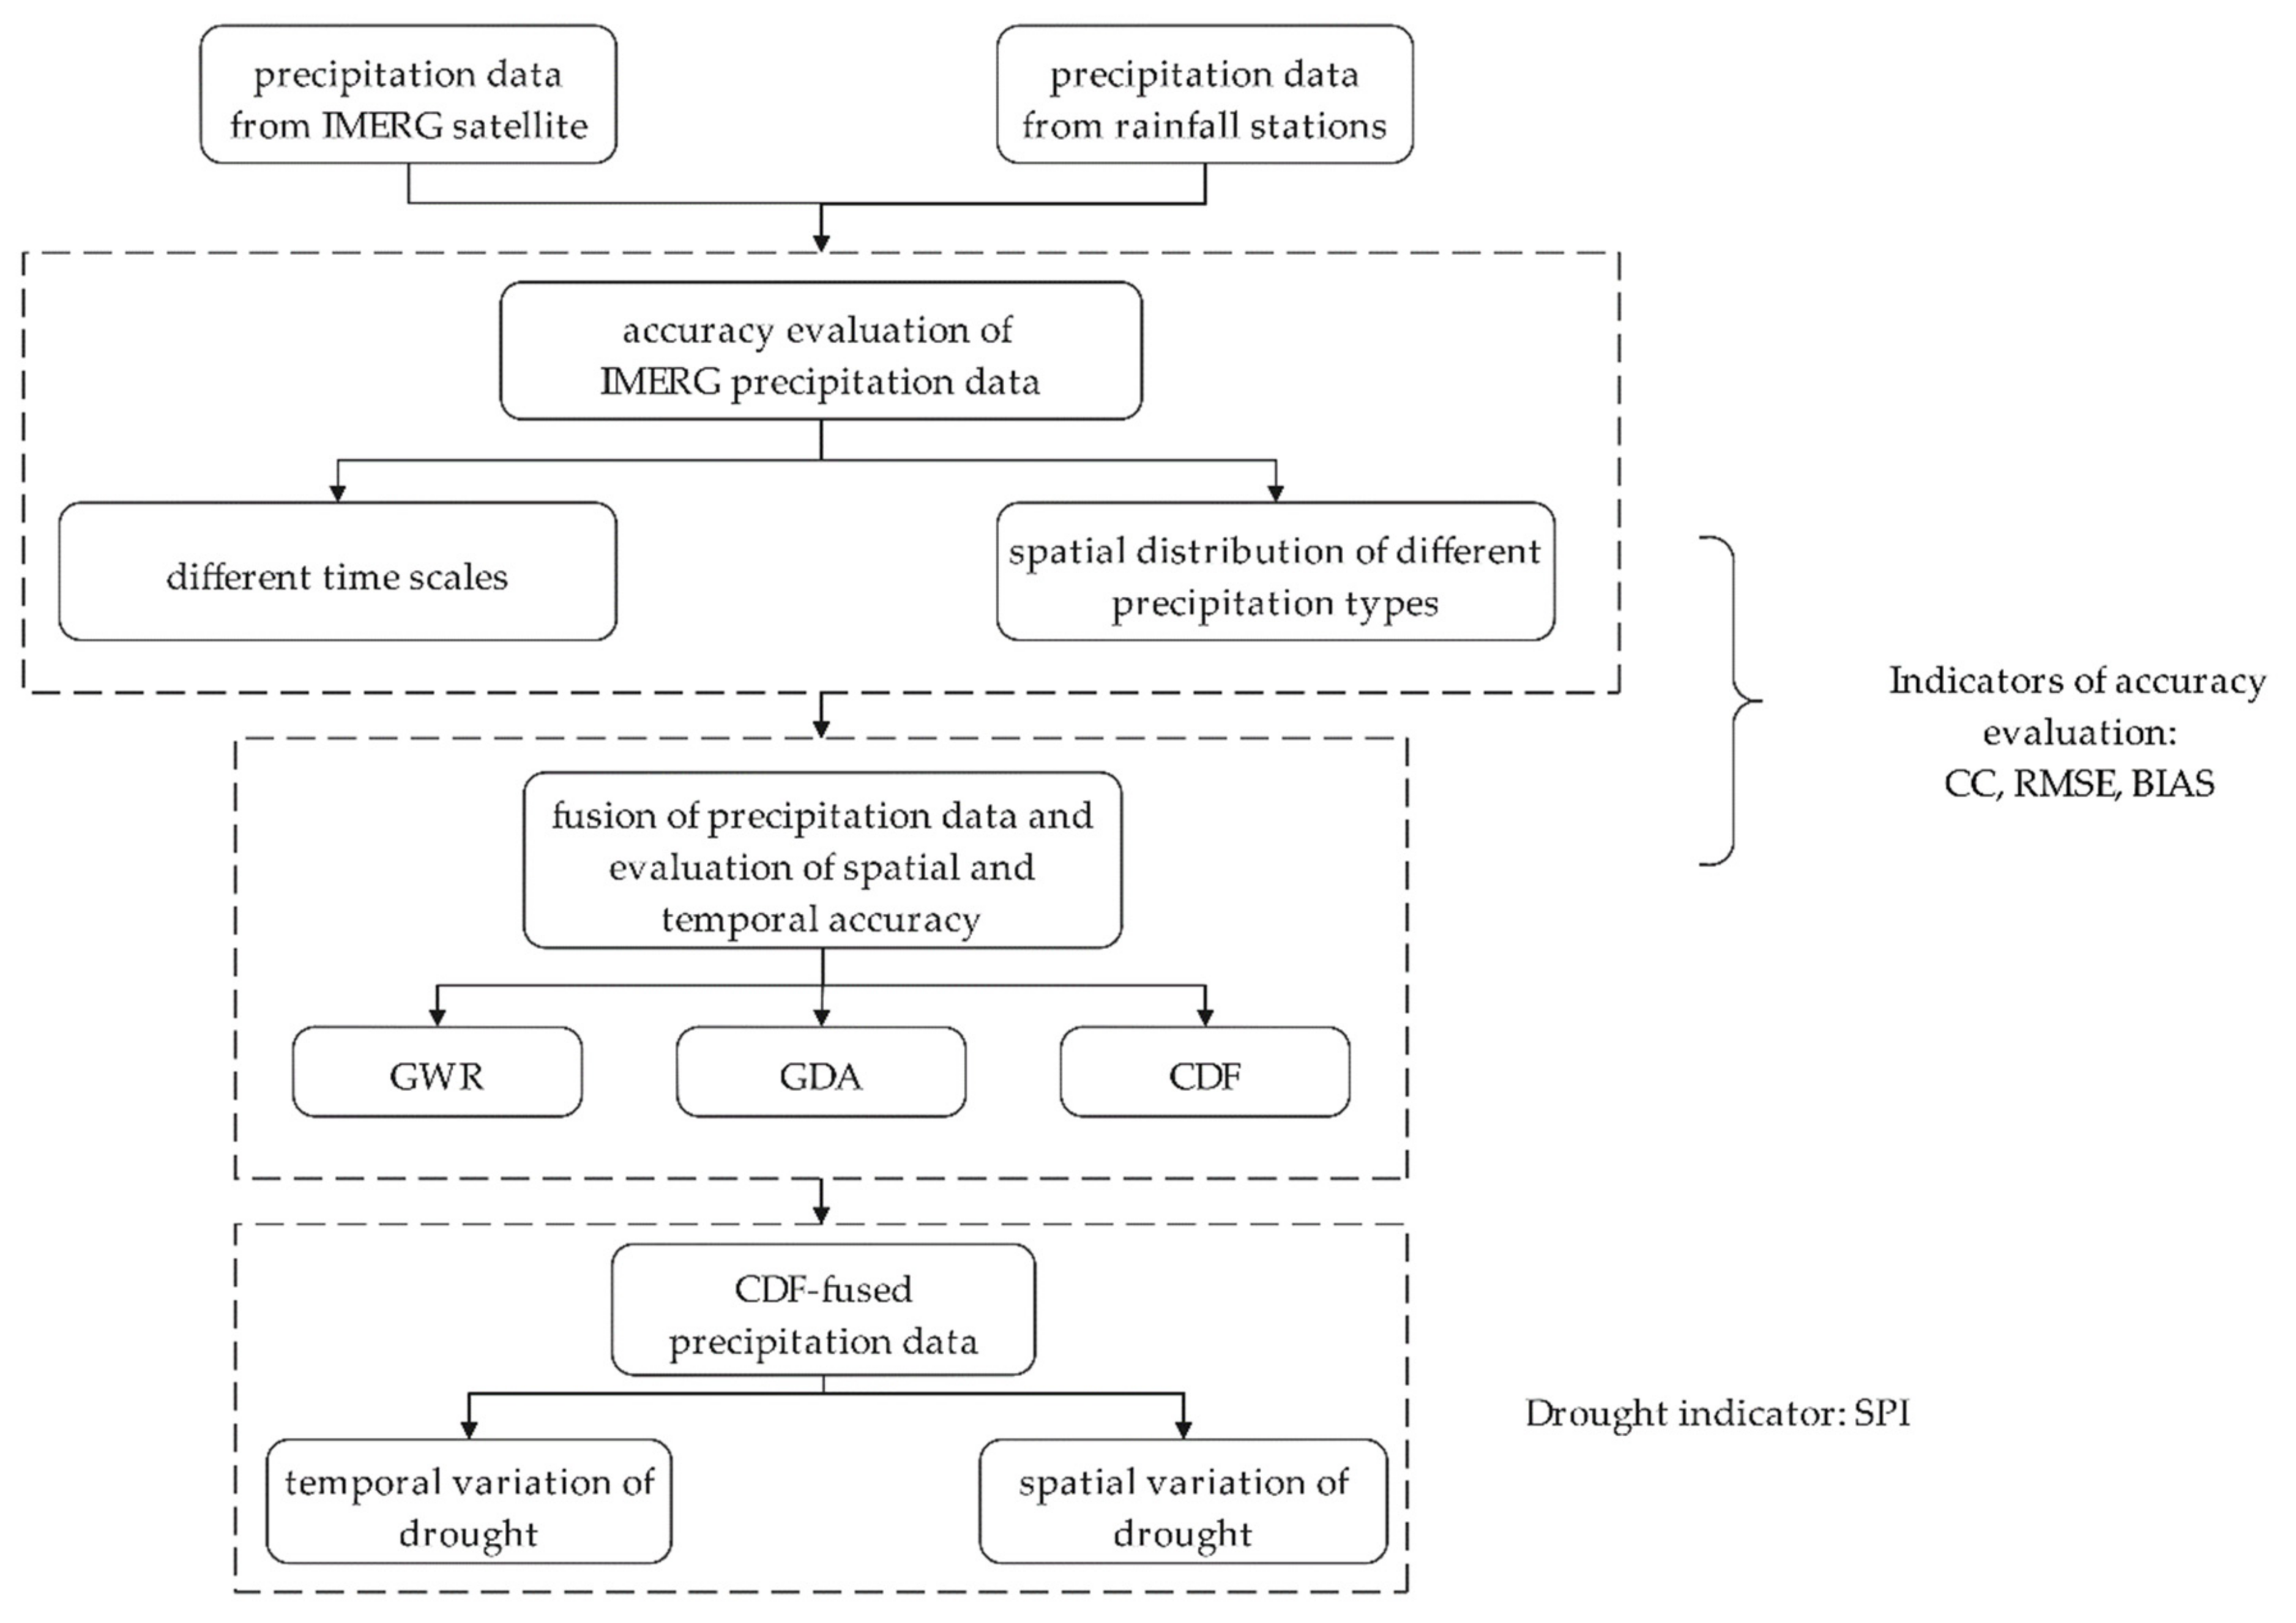
The measured precipitation data and temperature data were obtained from the daily records of each station in the basin; the rainfall measuring instruments used were all self-registering rain gauges.

3. Methodology

3.1. Evaluation Indicators

The correlation coefficient (CC) [49,50] reflects the degree of linear correlation between IMERG precipitation data and rainfall stations’ precipitation data. When CC is closer to 1, it indicates a higher positive correlation between the two; when CC is closer to −1, it indicates a higher negative correlation between the two; when CC is 0, it indicates no correlation between the two.
C C = i = 1 n x i x ¯ y i y ¯ i = 1 n x i x ¯ 2 y i y ¯ 2
The root mean square error (RMSE) [51] reflects the extent to which IMERG precipitation data deviate from the average error of rainfall data from stations, and is used to assess the stability of the error. The smaller the RMSE is, the higher the accuracy of IMERG precipitation data relative to the precipitation data from rainfall stations; conversely, the accuracy is poor.
R M S E = i = 1 n x i y i 2 n
Bias (BIAS) [52] reflects the ability of IMERG precipitation data to evaluate the precipitation data of rainfall stations. When BIAS > 0, IMERG precipitation data overestimate the precipitation data of rainfall stations; on the contrary, When BIAS < 0, IMERG precipitation underestimate the precipitation data of rainfall stations.
B I A S = i = 1 n y i i = 1 n x i i = 1 n x i
For Equations (1)–(3), x i and y i are the precipitation data of rainfall stations and IMERG precipitation data, respectively; x ¯ and y ¯ are the average values of precipitation data of rainfall stations and IMERG precipitation data, respectively; n is the number of all rainfall stations in the Chengbi River Basin ( n = 12 ); and i is the ranking of a particular rainfall station in the Chengbi River Basin ( i = 1 , 2 , 3 n ).
The probability of detection (POD) reflects the ability of a satellite to correctly detect daily precipitation events, and the value ranges from 0 to 1. The closer the POD is to 1, the greater the degree of hit of satellite on precipitation.
P O D = H H + M
The false alarm rate (FAR) reflects the ability of remote sensing satellites to detect daily precipitation events incorrectly, and the value ranges from 0 to 1. The closer the FAR is to 1, the greater the ability of satellites to falsely report precipitation.
F A R = F H + F
The Critical Success Index (CSI) reflects the proportion of daily precipitation events correctly detected by remote sensing satellites to the overall daily precipitation events, and the value ranges from 0 to 1. The larger the CSI value is, the higher the degree of successful precipitation detection by satellites.
C S I = H H + M + F
For Equations (4)–(6) [53], H is observed precipitation is correctly detected; M is observed precipitation is not detected or rain is detected but not observed; and F is neither observed nor detected precipitation. If the daily precipitation is greater than or equal to P t h = 0.1   mm / d , there is rain; otherwise, there is no rain.

3.2. Methodology of Precipitation Data Fusion

3.2.1. Geographically Weighted Regression (GWR)

GWR is a spatial regression model based on variable parameters, which is an improvement and extension of general linear regression, and it embeds spatial relationships into general linear regression, enabling GWR to study the spatial heterogeneity among variables [54]. The basic idea of fusing IMERG precipitation data with station precipitation data based on the GWR method is to first calculate the difference between the measured precipitation of 12 rainfall stations and the corresponding IMERG precipitation. Then, estimate the precipitation error of the 1 × 1 km separation rate satellite precipitation raster in the study area using the geographically weighted regression in the ARCGIS software. Finally, add the precipitation error obtained by GWR with the corresponding IMERG precipitation to obtain the fused precipitation value of the study area.
The differences between the IMERG observations and station measurements of precipitation at a given point are as follows.
e m = P G m P S m  
Using the error values obtained for each point, the precipitation error for the study area with a resolution of 1 × 1 km was obtained based on the GWR method.
e n = f P G 1 P S 1 , P G 2 P S 2 , P G i P S i  
The precipitation errors obtained by the GWR method are summed with the corresponding IMERG precipitation to obtain the GWR-fused precipitation.
P = P S m + e n  
For Equations (7)–(9), e m is the error value of precipitation at a point, P G m is the precipitation observation at a station, P S m is the IMERG precipitation observation at that location, e n is the precipitation error at a rate of 1 × 1 km, and P is the GWR-fused precipitation value.

3.2.2. Geographical Difference Analysis (GDA)

The geographical difference analysis (GDA) method is a residual-based analysis method proposed by Cheema and Bastiaanssen [55]. GDA gives better results than the usual regression analysis. The procedure for fusing IMERG precipitation with the station precipitation using GDA is as follows: at each station, the error between the station precipitation data and the IMERG precipitation data is calculated, the precipitation error for the study area is obtained by inverse distance weighting (IDW) interpolation, and the precipitation error is added to the corresponding IMERG precipitation data to obtain the fused precipitation value.
The differences between the IMERG observations and station measurements of precipitation at a given point are as follows.
e m = P G m P S m  
Using the error values obtained for each point, the precipitation error with a resolution of 1 × 1 km in the study area is obtained based on IDW interpolation.
e n = f P G 1 P S 1 , P G 2 P S 2 , P G i P S i  
The precipitation error obtained by interpolation using the IDW method is added to the corresponding IMERG precipitation to obtain the GDA-fused precipitation.
P = P S m + e n  
For Equations (10)–(12), e m is the error value of precipitation at a point, P G m is the precipitation observation at a station, P S m is the IMERG precipitation observation at that location, e n is the precipitation error at a rate of 1 × 1 km, and P is the GDA-fused precipitation value.

3.2.3. Cumulative Distribution Function (CDF)

CDF is the probability of a random variable falling within a certain interval. Its formula is the probability of occurrence of all values ≤ n for a random variable x, expressed as:
F n = P x n
This method was originally proposed by Calheiros and Zawadzki [56]. In this paper, the IMERG precipitation data are used as the reference value, and the rainfall station precipitation data are fused with the satellite precipitation data through the CDF method. That is, by adjusting the satellite precipitation data so that the adjusted satellite precipitation occurs with the same frequency as the station precipitation, the cumulative distribution curve of the satellite precipitation data is infinitely close to the cumulative distribution curve of the rainfall station precipitation data, in order for the precipitation data to have similar distribution shapes.
P G P P G d P G = P S P P S d P S  
where P P G and P P S are the probability density functions of station and satellite precipitation data, respectively.

3.3. Standardized Precipitation Index (SPI)

SPI, proposed by American scholars McKee et al. [57], indicates the probability of occurrence of precipitation at a certain time period and is used to characterize drought conditions at monthly scales and larger time scales in a region. SPI describes precipitation using Γ-distributed probabilities, calculates cumulative probabilities by probability density functions, and normalizes them. Finally, the standardized cumulative frequency distribution of precipitation is used to classify drought classes. In this paper, the SPI calculation program provided by the U.S. Drought Mitigation Center [4] was applied to calculate the SPI values for 1, 3, 6, and 12 months in the Chengbi River Basin, noted as SPI1, SPI3, SPI6, and SPI12, respectively (see Figure 3 for the article framework).

4. Results

The data used for accuracy evaluation in Section 4.1 and Section 4.2 are for the period from January 2014 to August 2018.

4.1. Data Accuracy of IMERG Precipitation Products

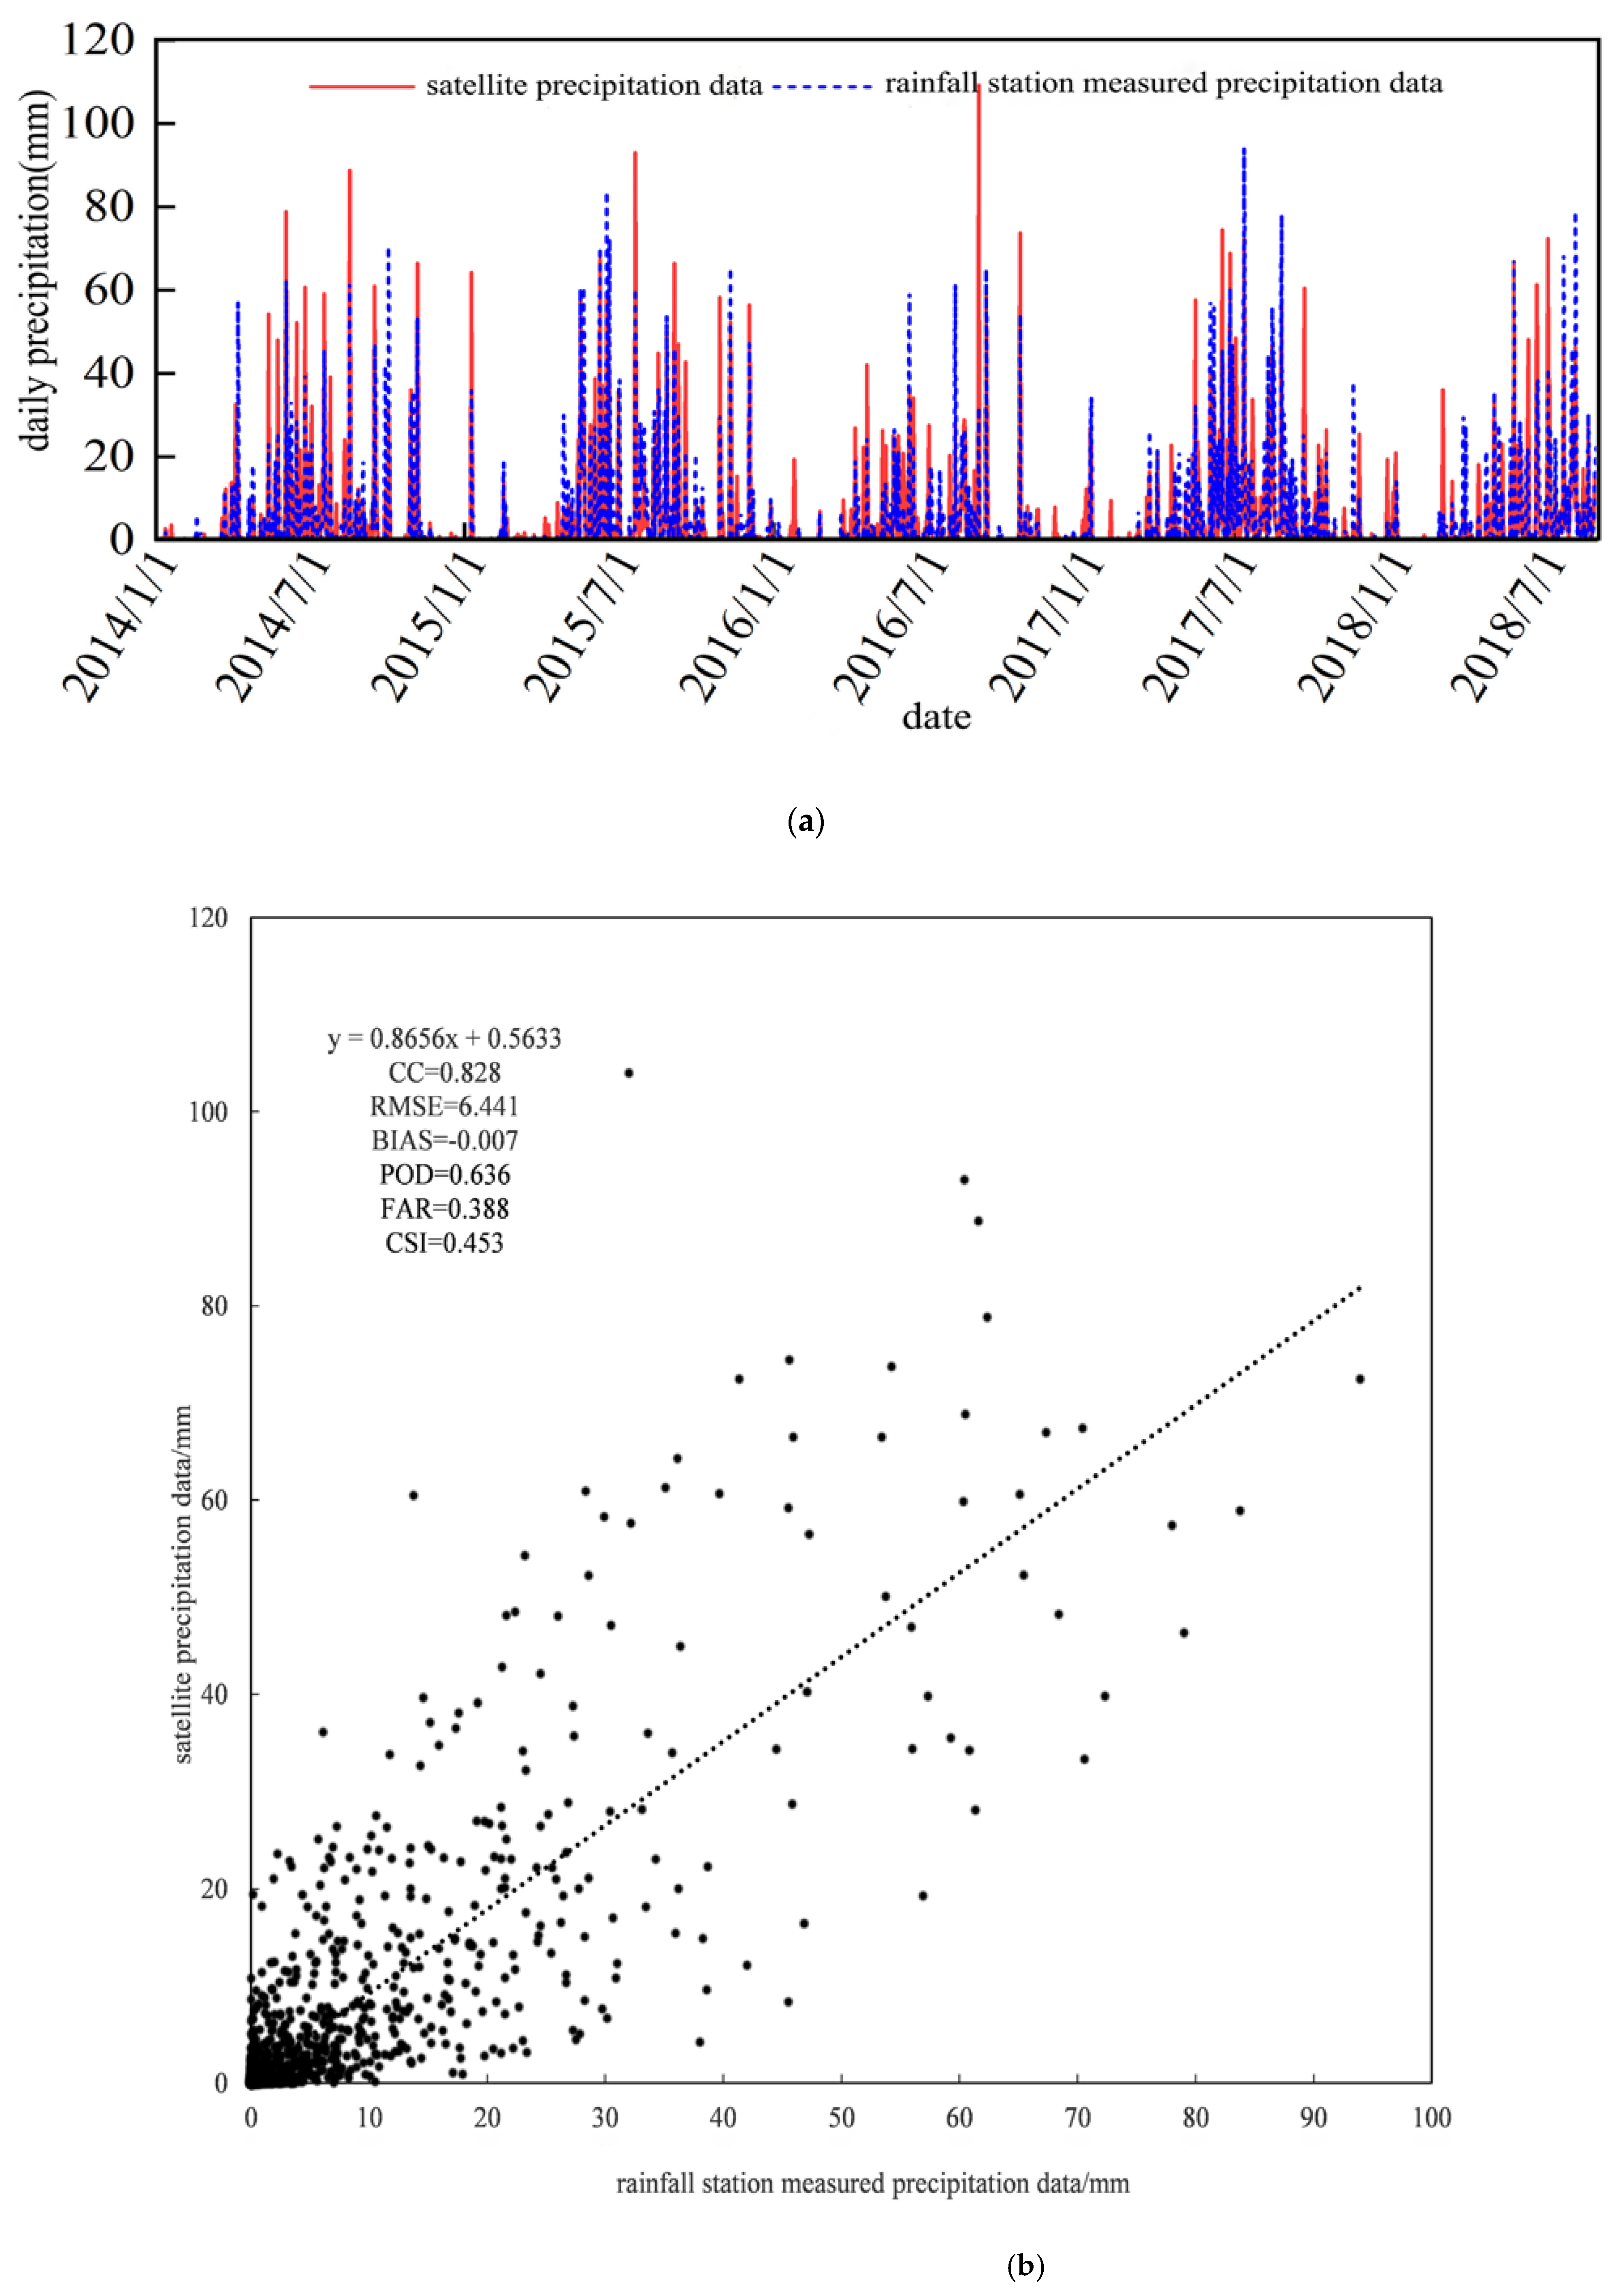
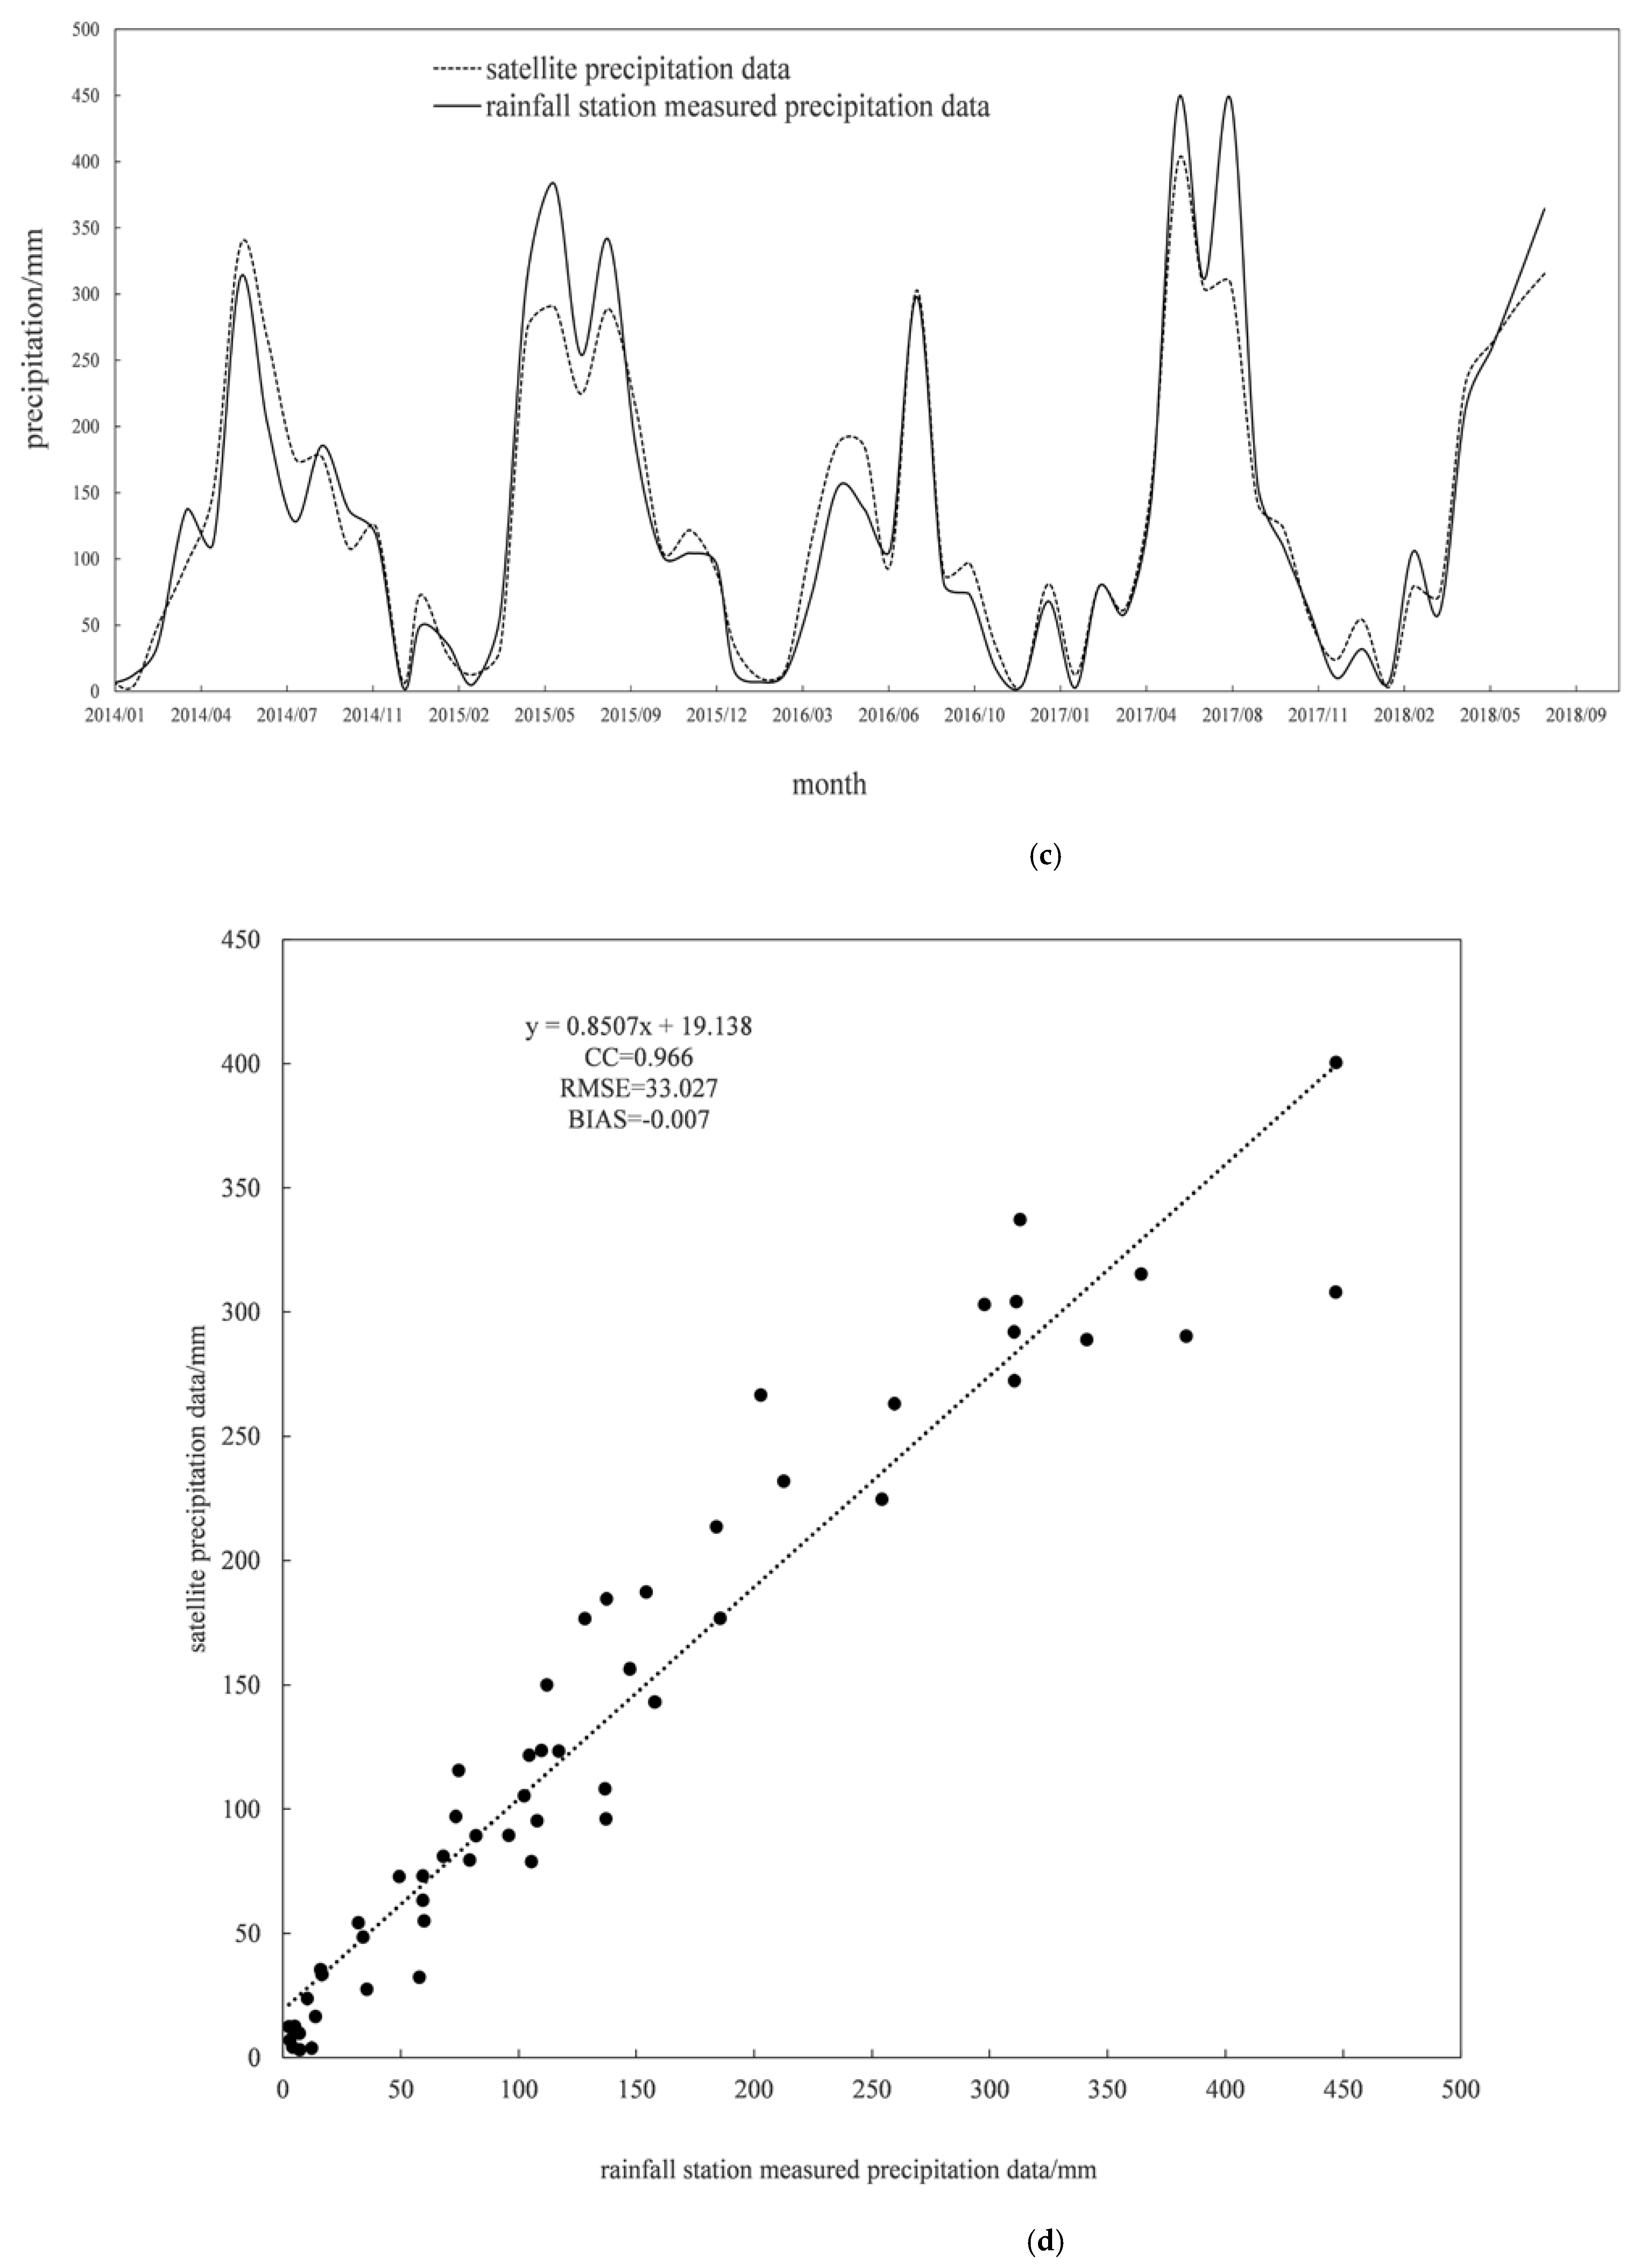
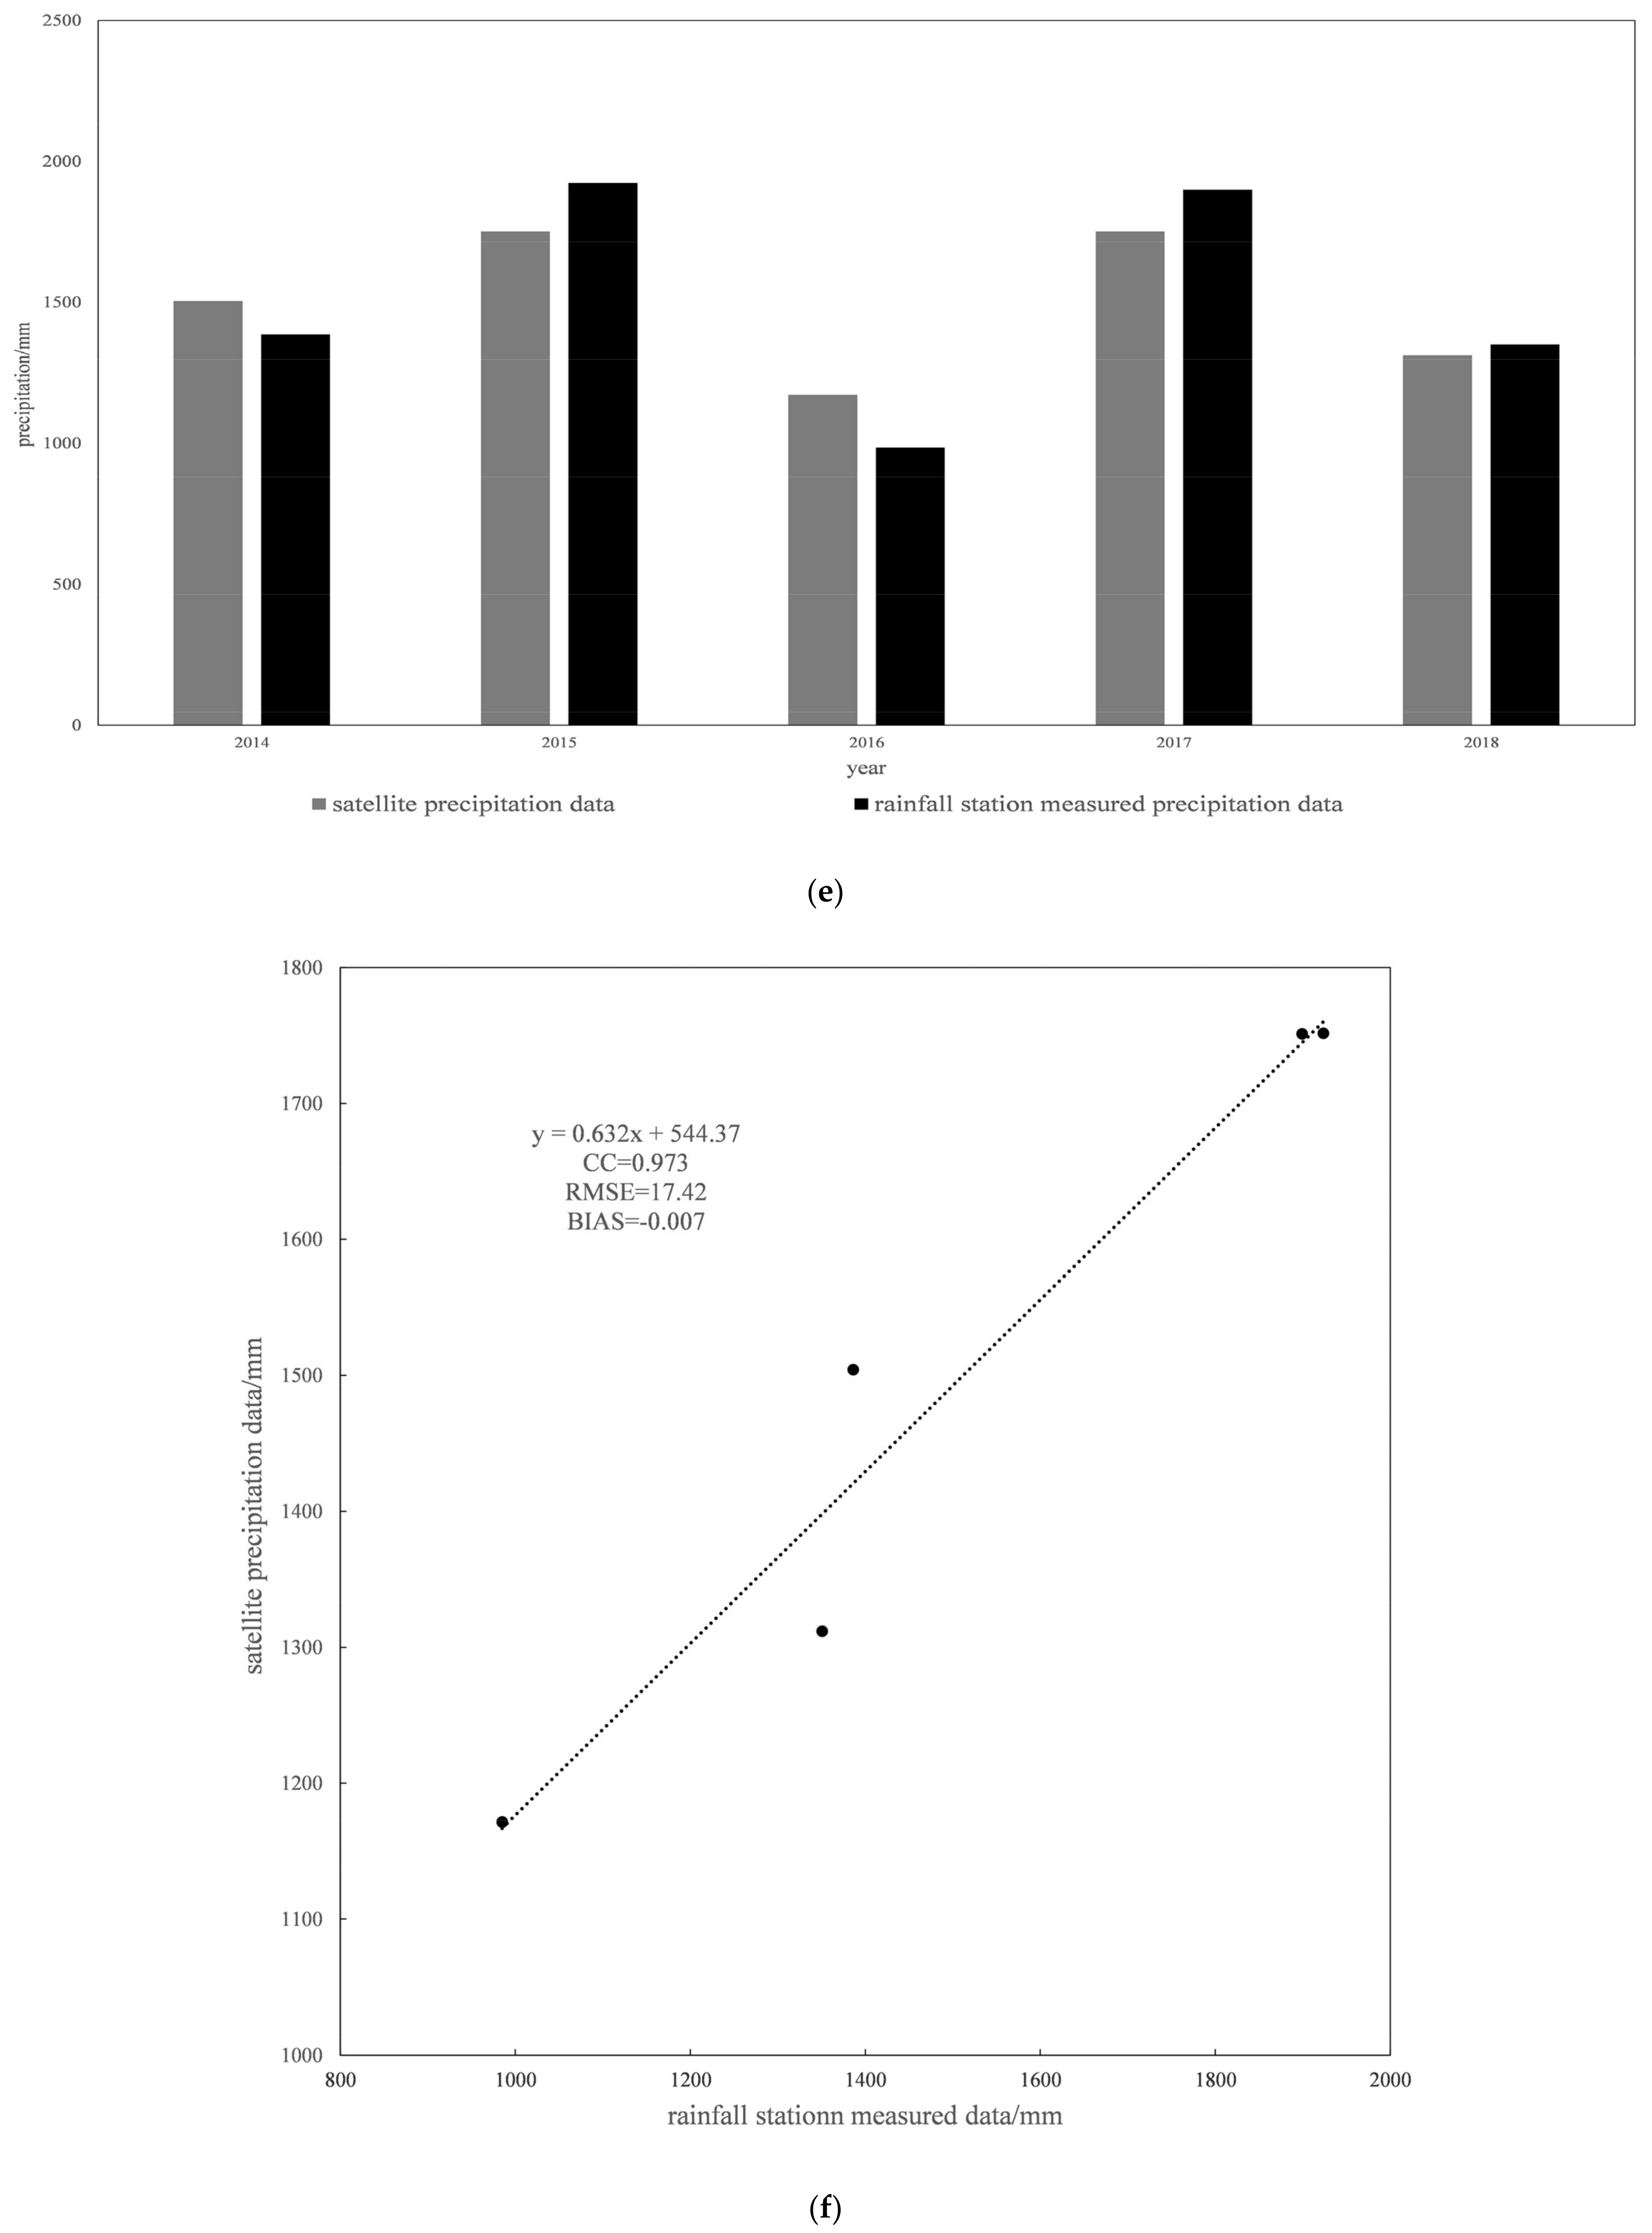
4.1.1. Data Accuracy in the Time Dimension

Although the satellite precipitation of each station has some errors, and there are different degrees of overestimation or underestimation compared with the station data, the trend of increase or decrease is basically the same, and all of them have obvious periodic characteristics and the overall error is stable. The satellite daily precipitation event of each station has the problem of missing and empty reports to some extent, but it can correctly detect most of the daily precipitation events at some stations and has a suitable estimation ability for the occurrence or not of precipitation events (Figure 4a,b and Table 2). Therefore, the IMERG daily precipitation data have some applicability in the Chengbi River Basin.
On the monthly scale, the monthly precipitation data from IMERG and the stations basically maintain the same trend in the time series with strong linear correlation and stable overall error. The BIAS values of all stations, except for Bashou, Linhe, and Bailian, are controlled within plus to minus 0.3., and the overall BIAS value of the basin is −0.007 (Figure 4c,d and Table 3). It can be seen that the accuracy of IMERG precipitation data on the monthly scale is well evaluated and has great applicability in the Chengbi River Basin.
On the annual scale, the overall error is stable and the trend is generally consistent, with slight overestimation or underestimation. The correlation coefficients are above 0.9 for all stations except Chaoli (western part of the basin), and the bias is maintained between −0.2 and 0.4 (Figure 4e,f and Table 4).

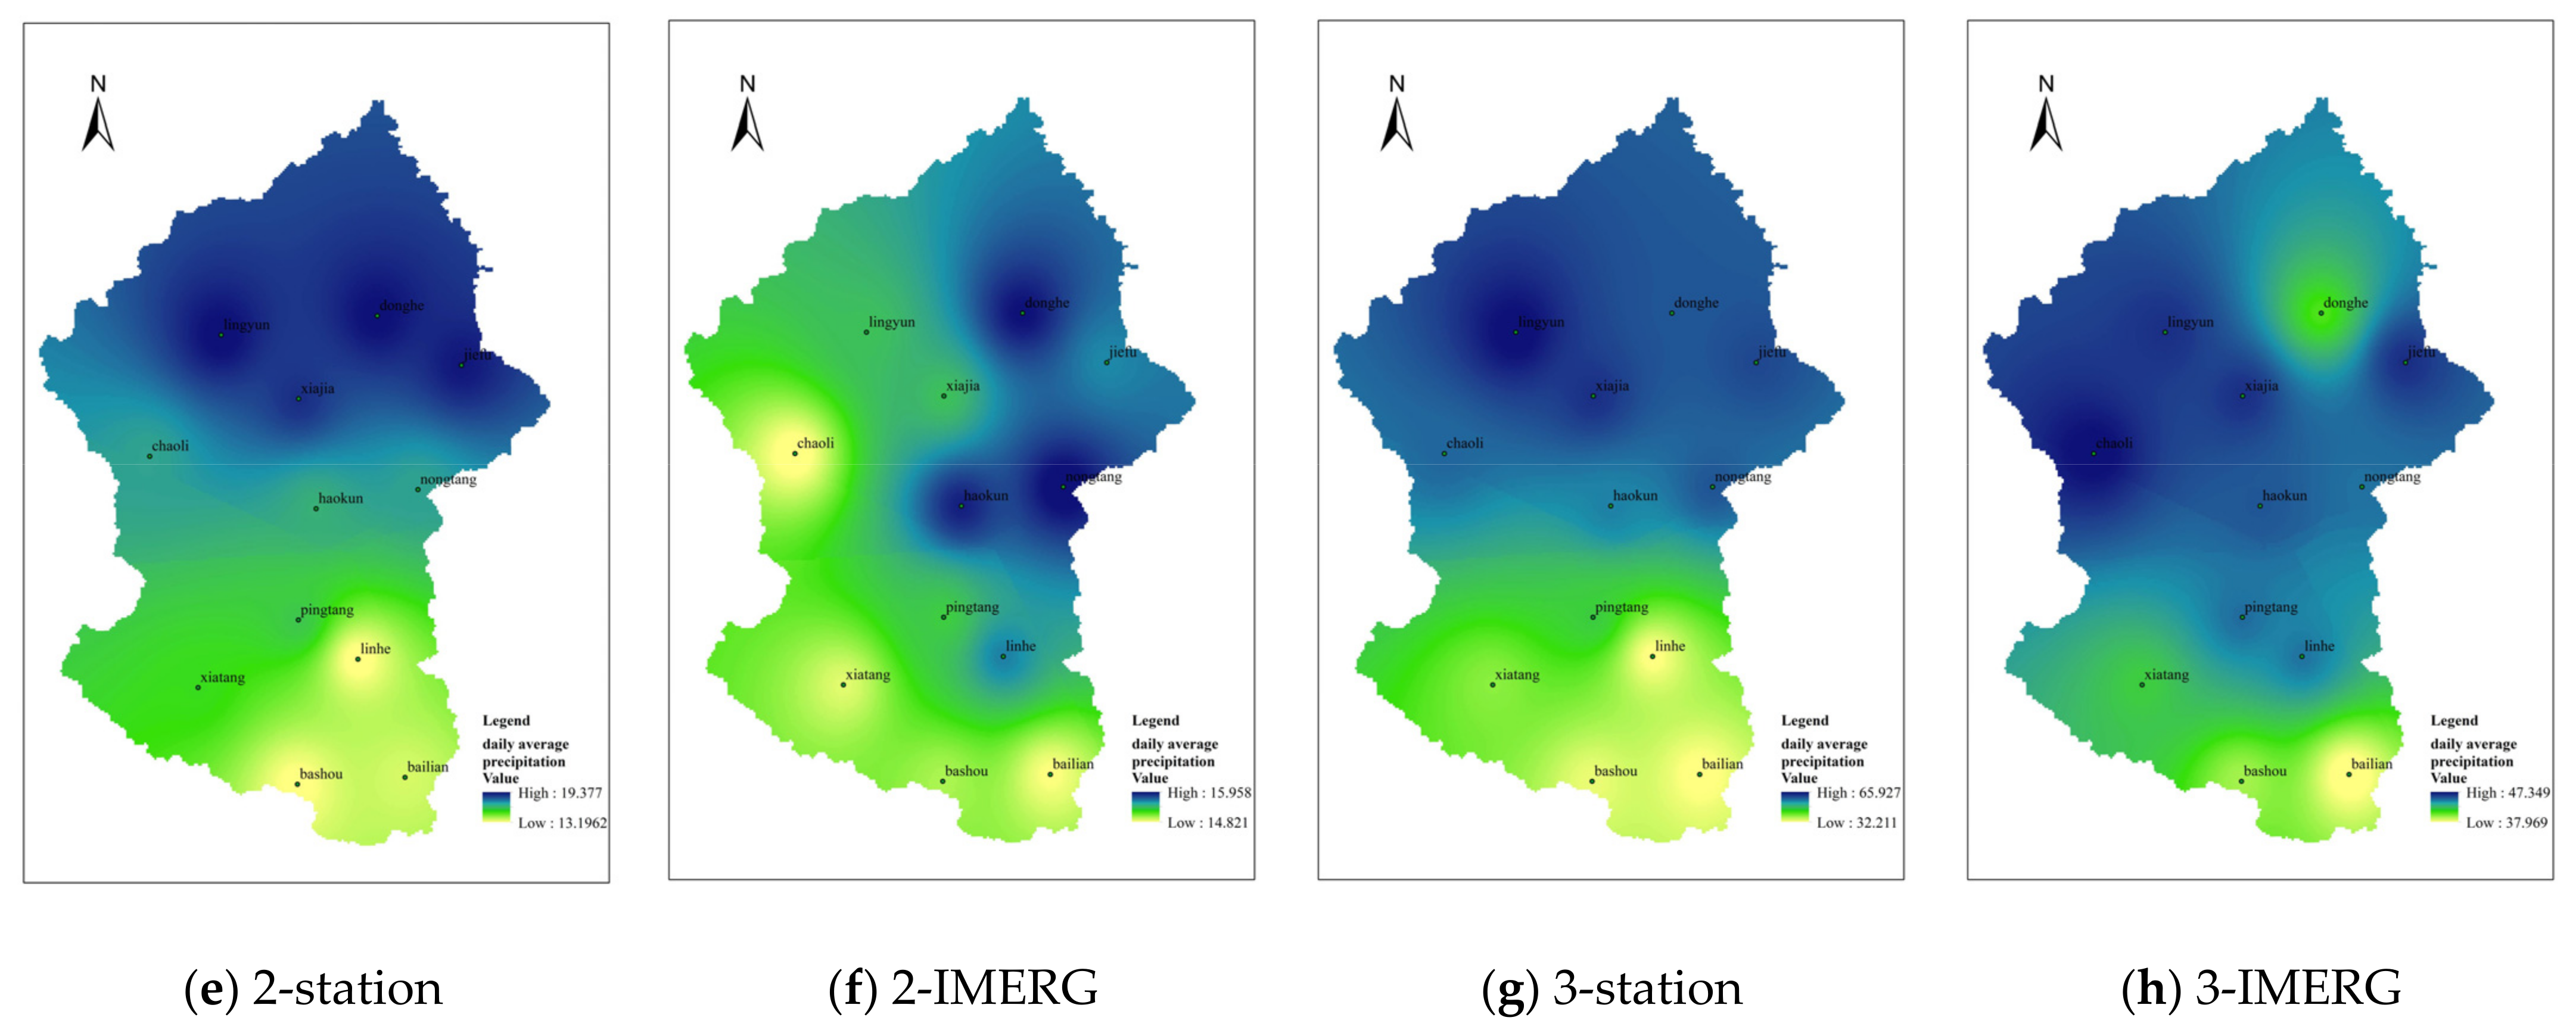
4.1.2. Data Accuracy in Spatial Dimension

The daily surface rainfall in the basin was calculated by the Tyson polygon, and based on the data values, using Gaussian mixture model, the daily precipitation data of rainfall stations were classified into four types, 0, 1, 2, and 3, representing the four cases of no precipitation, low precipitation, medium precipitation, and high precipitation, respectively. The frequencies and statistical parameters of each type of daily precipitation data are shown in Table 5 below.
The spatial distribution of the four types of precipitation was obtained by IDW interpolation (Figure 5).
There is an “overestimation of low rainfall and underestimation of high rainfall” when the satellite precipitation is compared with the station precipitation during the occurrence of low precipitation. The station precipitation ranges from 1.2 mm to 2.7 mm, generally increasing from south to north, while the average precipitation measured by the satellite ranges from 2.1 mm to 3.2 mm and is greater at the southernmost end of the basin. Comparing the two maps (Figure 5c,d), it can be observed that in the central and southern parts of the basin, the satellite overestimates the average precipitation at the rainfall stations, while in the northern part of the basin, the exact opposite is true.
Under moderate precipitation conditions, with Chaoli station–Haokun station–Nongtang station as the boundary (a virtual boundary dividing the basin into two parts, north and south), the station precipitation was more in the north and less in the south, with the highest precipitation of 19.4 mm in the north and the lowest precipitation of 13.2 mm in the south. Comparing the satellite-monitored precipitation, the average precipitation in the northeast is significantly higher than that in other areas, with a maximum of 16.0 mm, while the precipitation in other areas is slightly lower, with a minimum of 14.8 mm. As shown in Figure 5e,f, in the southern part of the basin, the satellite precipitation slightly overestimates the site precipitation, while the northern part underestimates the measured average precipitation, which is more severe in the northwestern part than in the northeastern part.
When high precipitation occurs, the spatial distribution of rainfall is more in the north and less in the south. The highest value of rainfall in the basin is 65.9 mm and the lowest value is 32.2 mm. Except for the lower precipitation value at Donghe station in the north, the satellite precipitation values generally showed a decreasing trend from north to south, with an average precipitation range of 38.0–47.3 mm. The phenomenon of “higher underestimation of precipitation in the north and lower overestimation of precipitation in the south” still exists when satellite precipitation is compared with station precipitation, as shown in Figure 5g,h.

4.2. Accuracy of Fused Precipitation Data

4.2.1. Data Accuracy in the Time Dimension

Using the station precipitation data as the reference value, three methods, GDA, GWR, and CDF, were used to correct the satellite precipitation data, and the correlation coefficient, root mean square error, and bias of the corrected data and the station data were calculated in seasonal units to explore the accuracy of the corrected data in the time dimension. The calculation results are shown in Table 6 below.
By comparing the changes in index values before and after correction, it can be seen that all three correction methods can improve the accuracy of the original satellite data, and the correction methods are largely better in the autumn and winter than in the spring and summer. Comparing these three methods, an interesting conclusion can be found that the CDF method outperforms the other two methods regardless of the season.

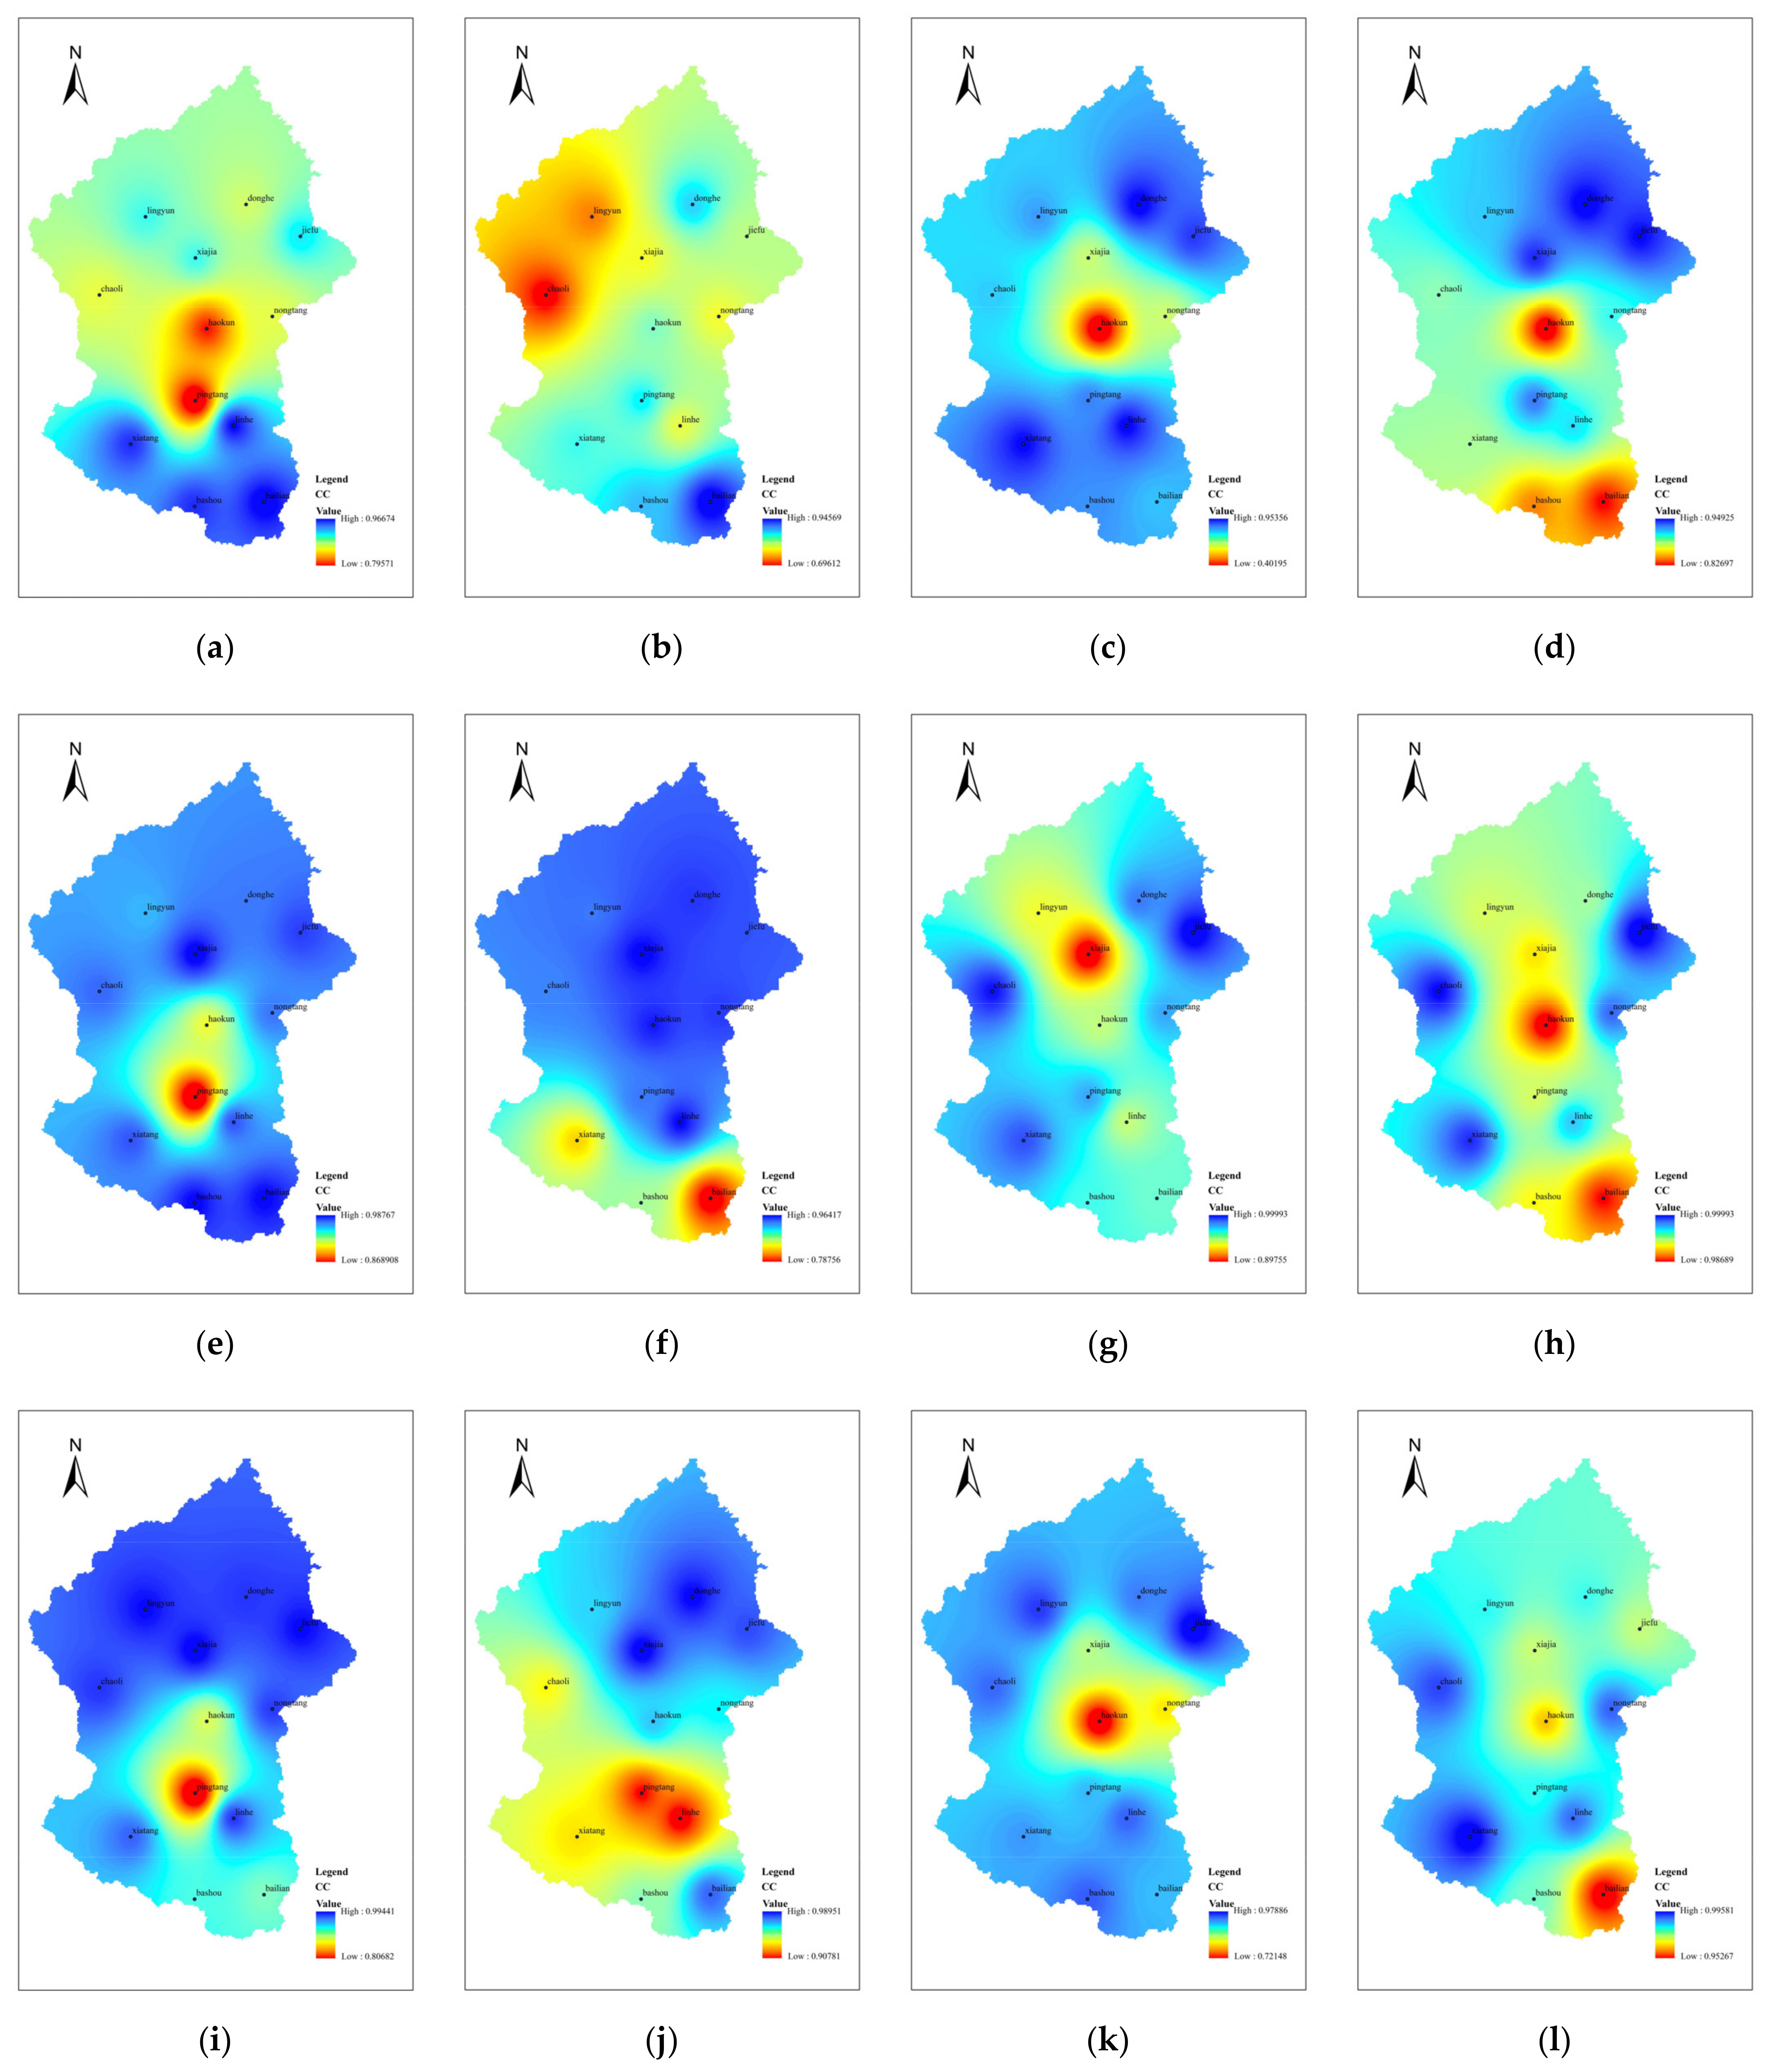
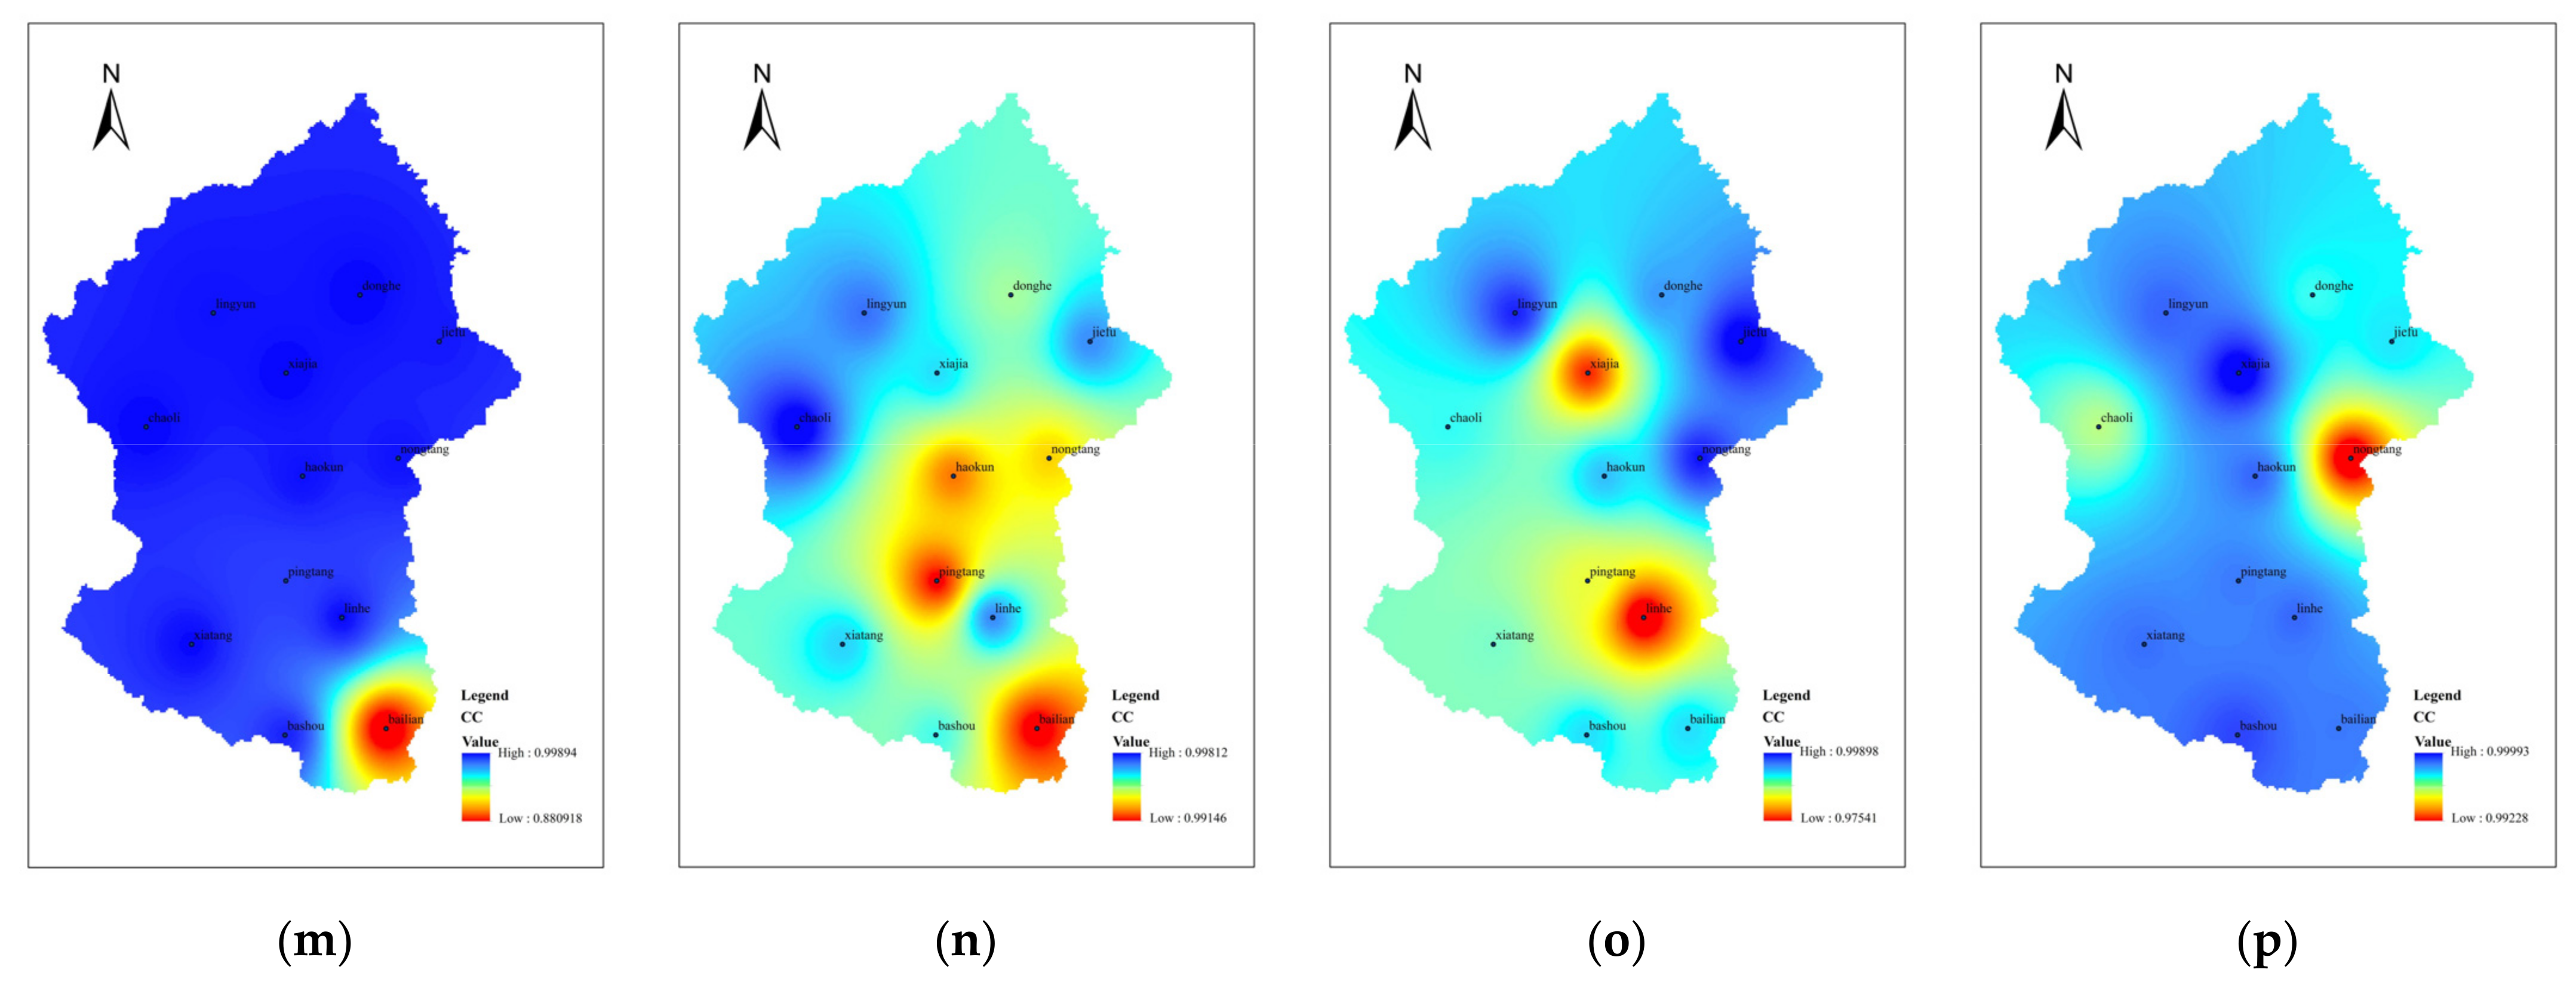
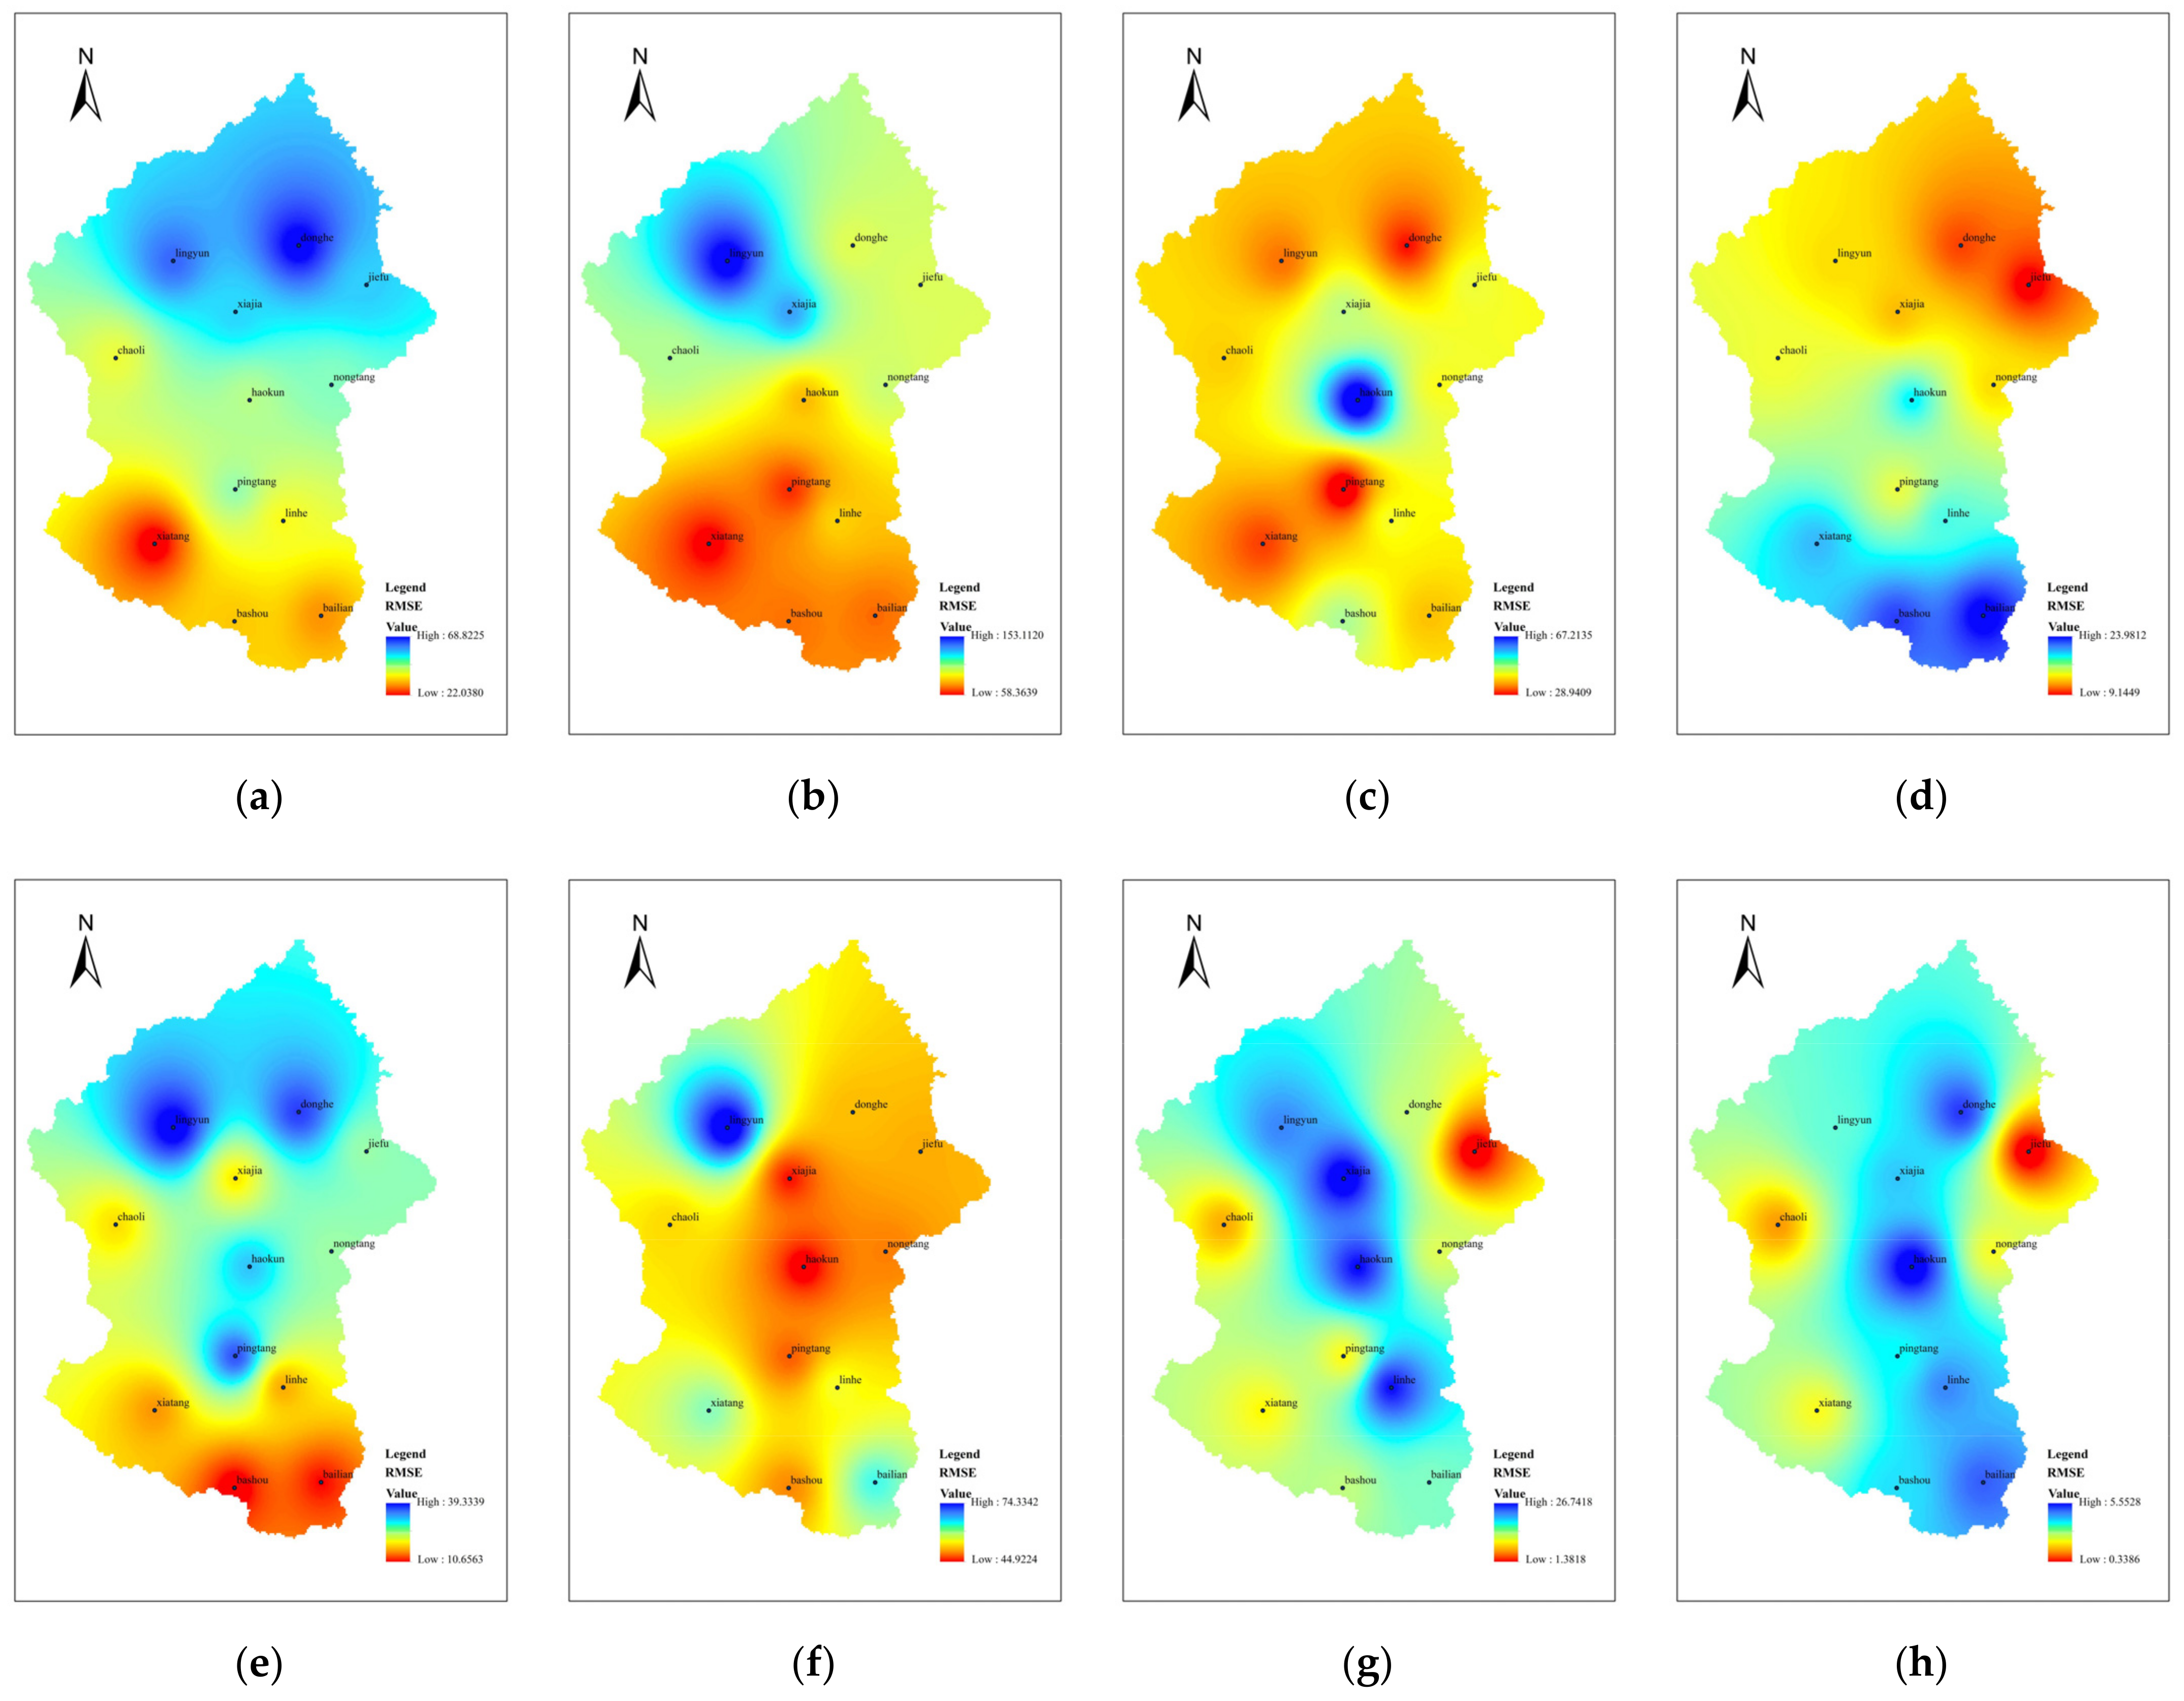
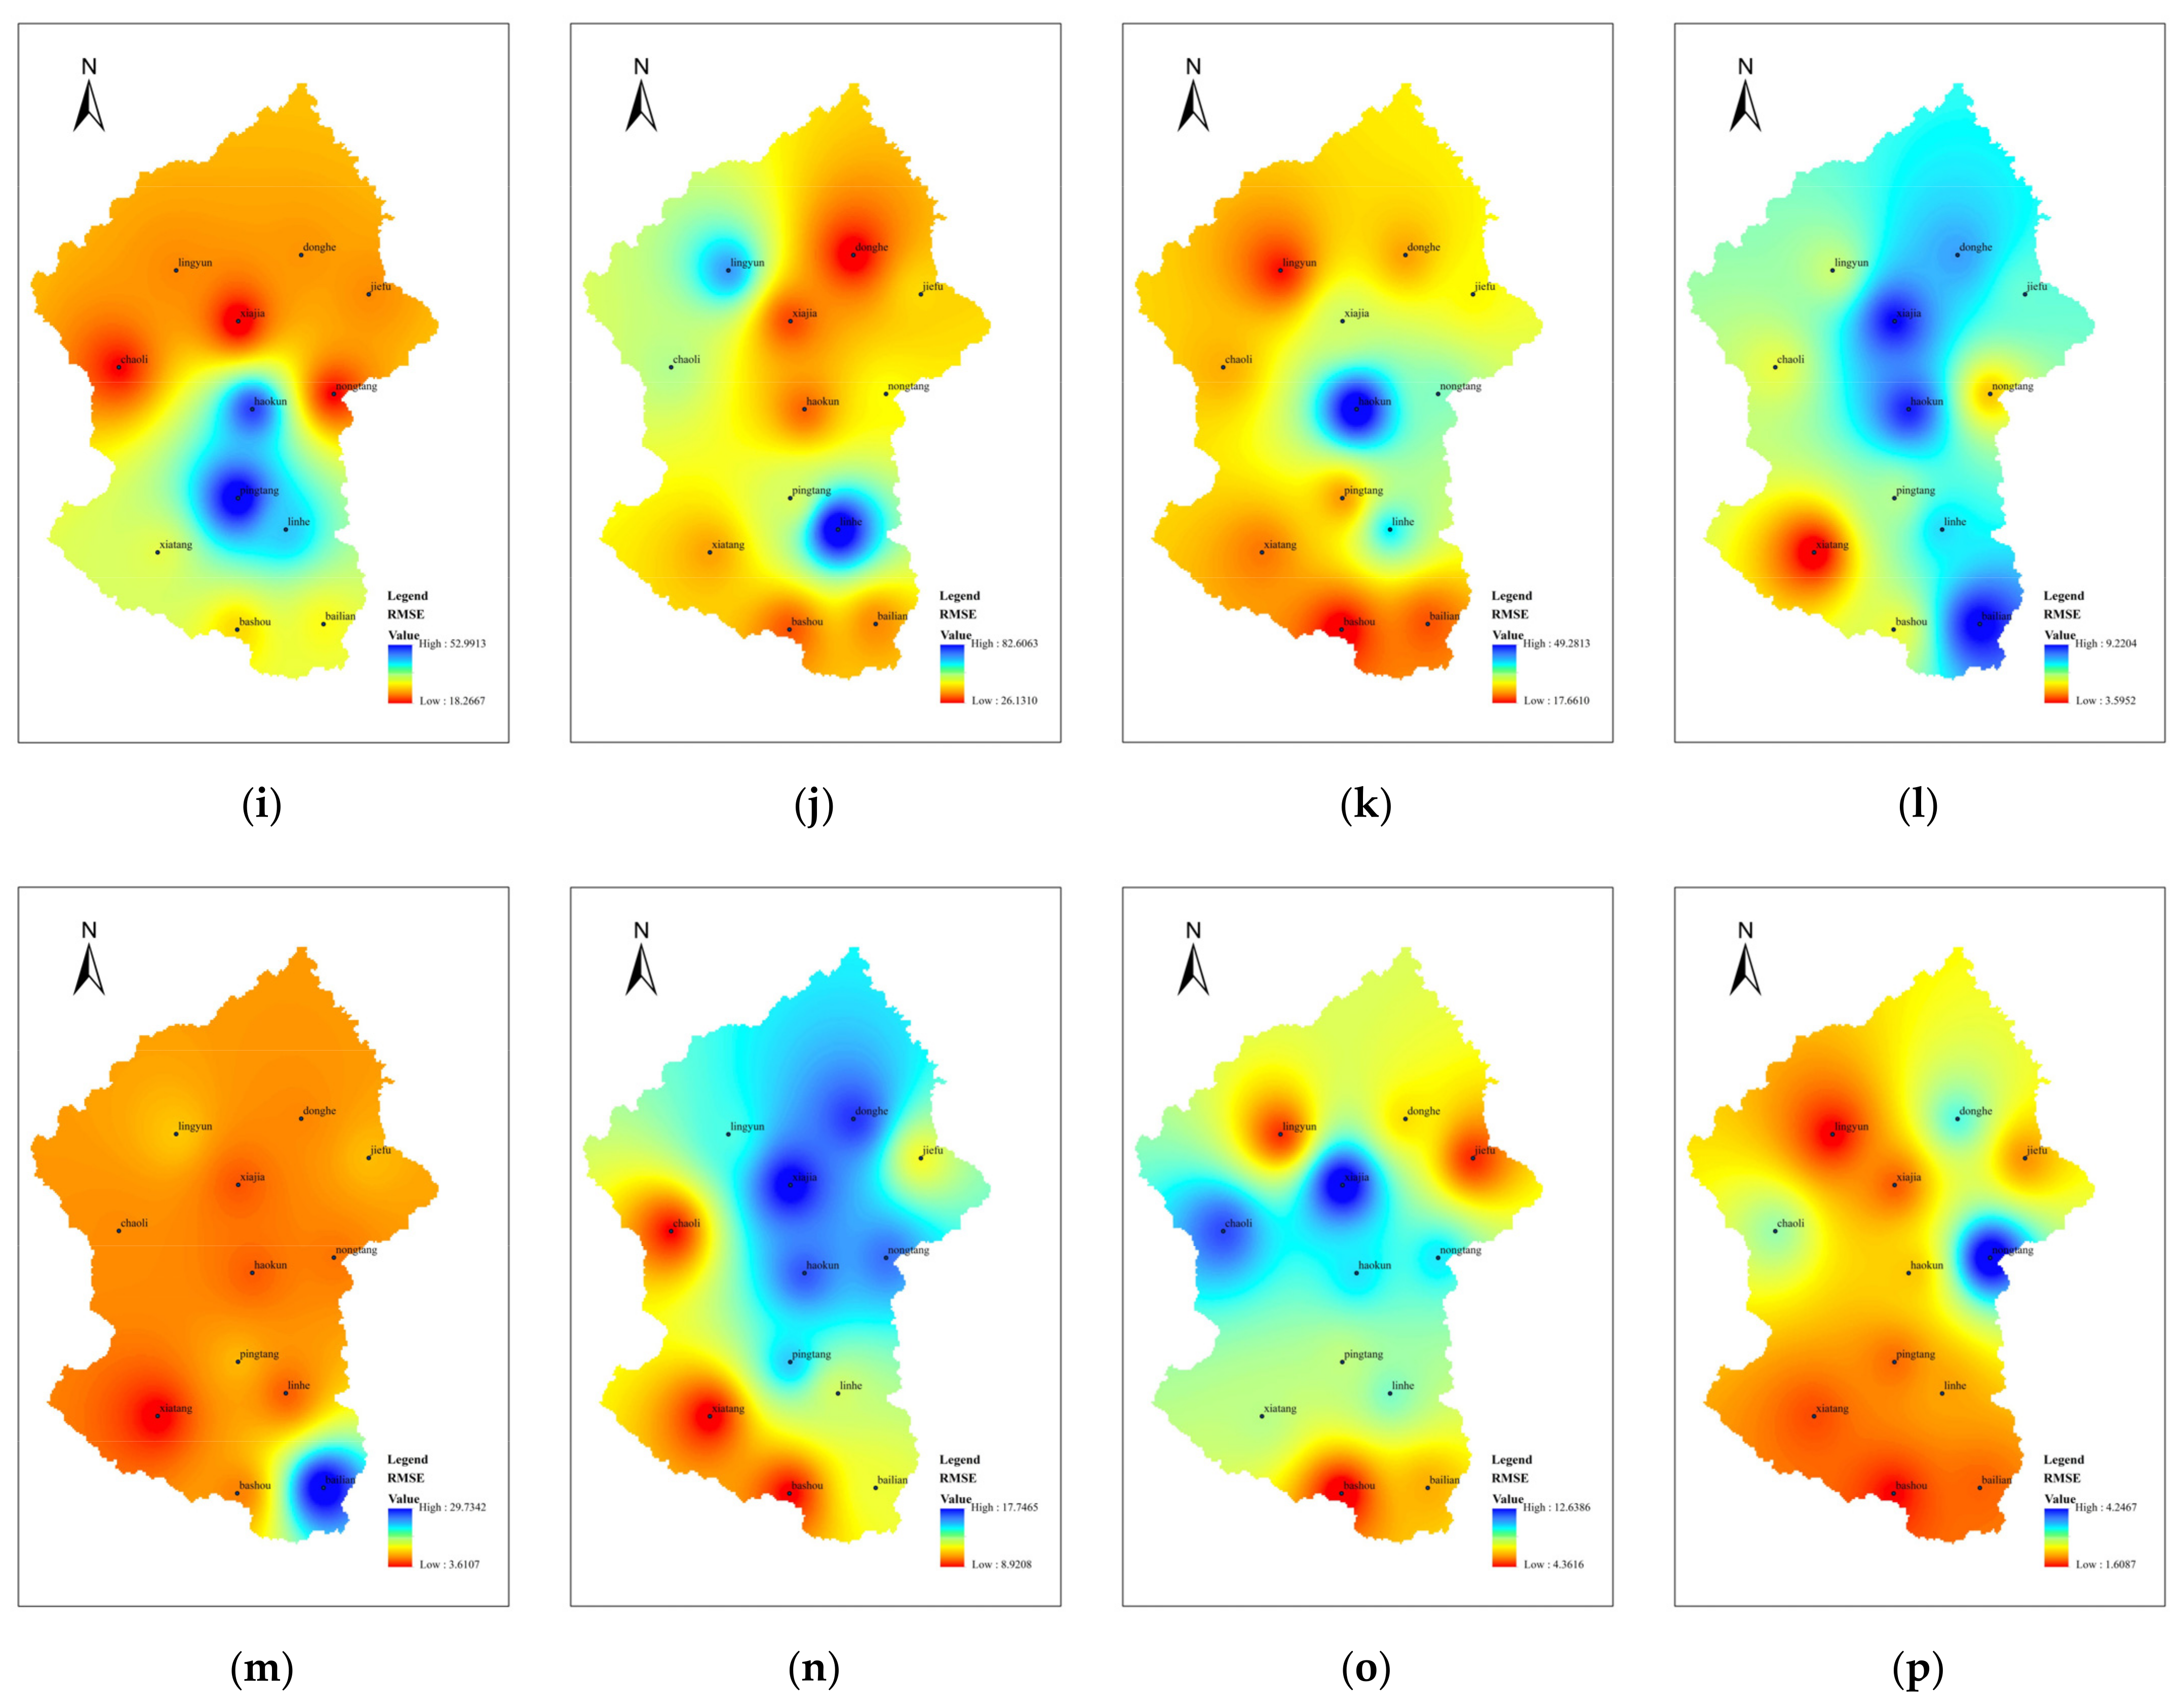
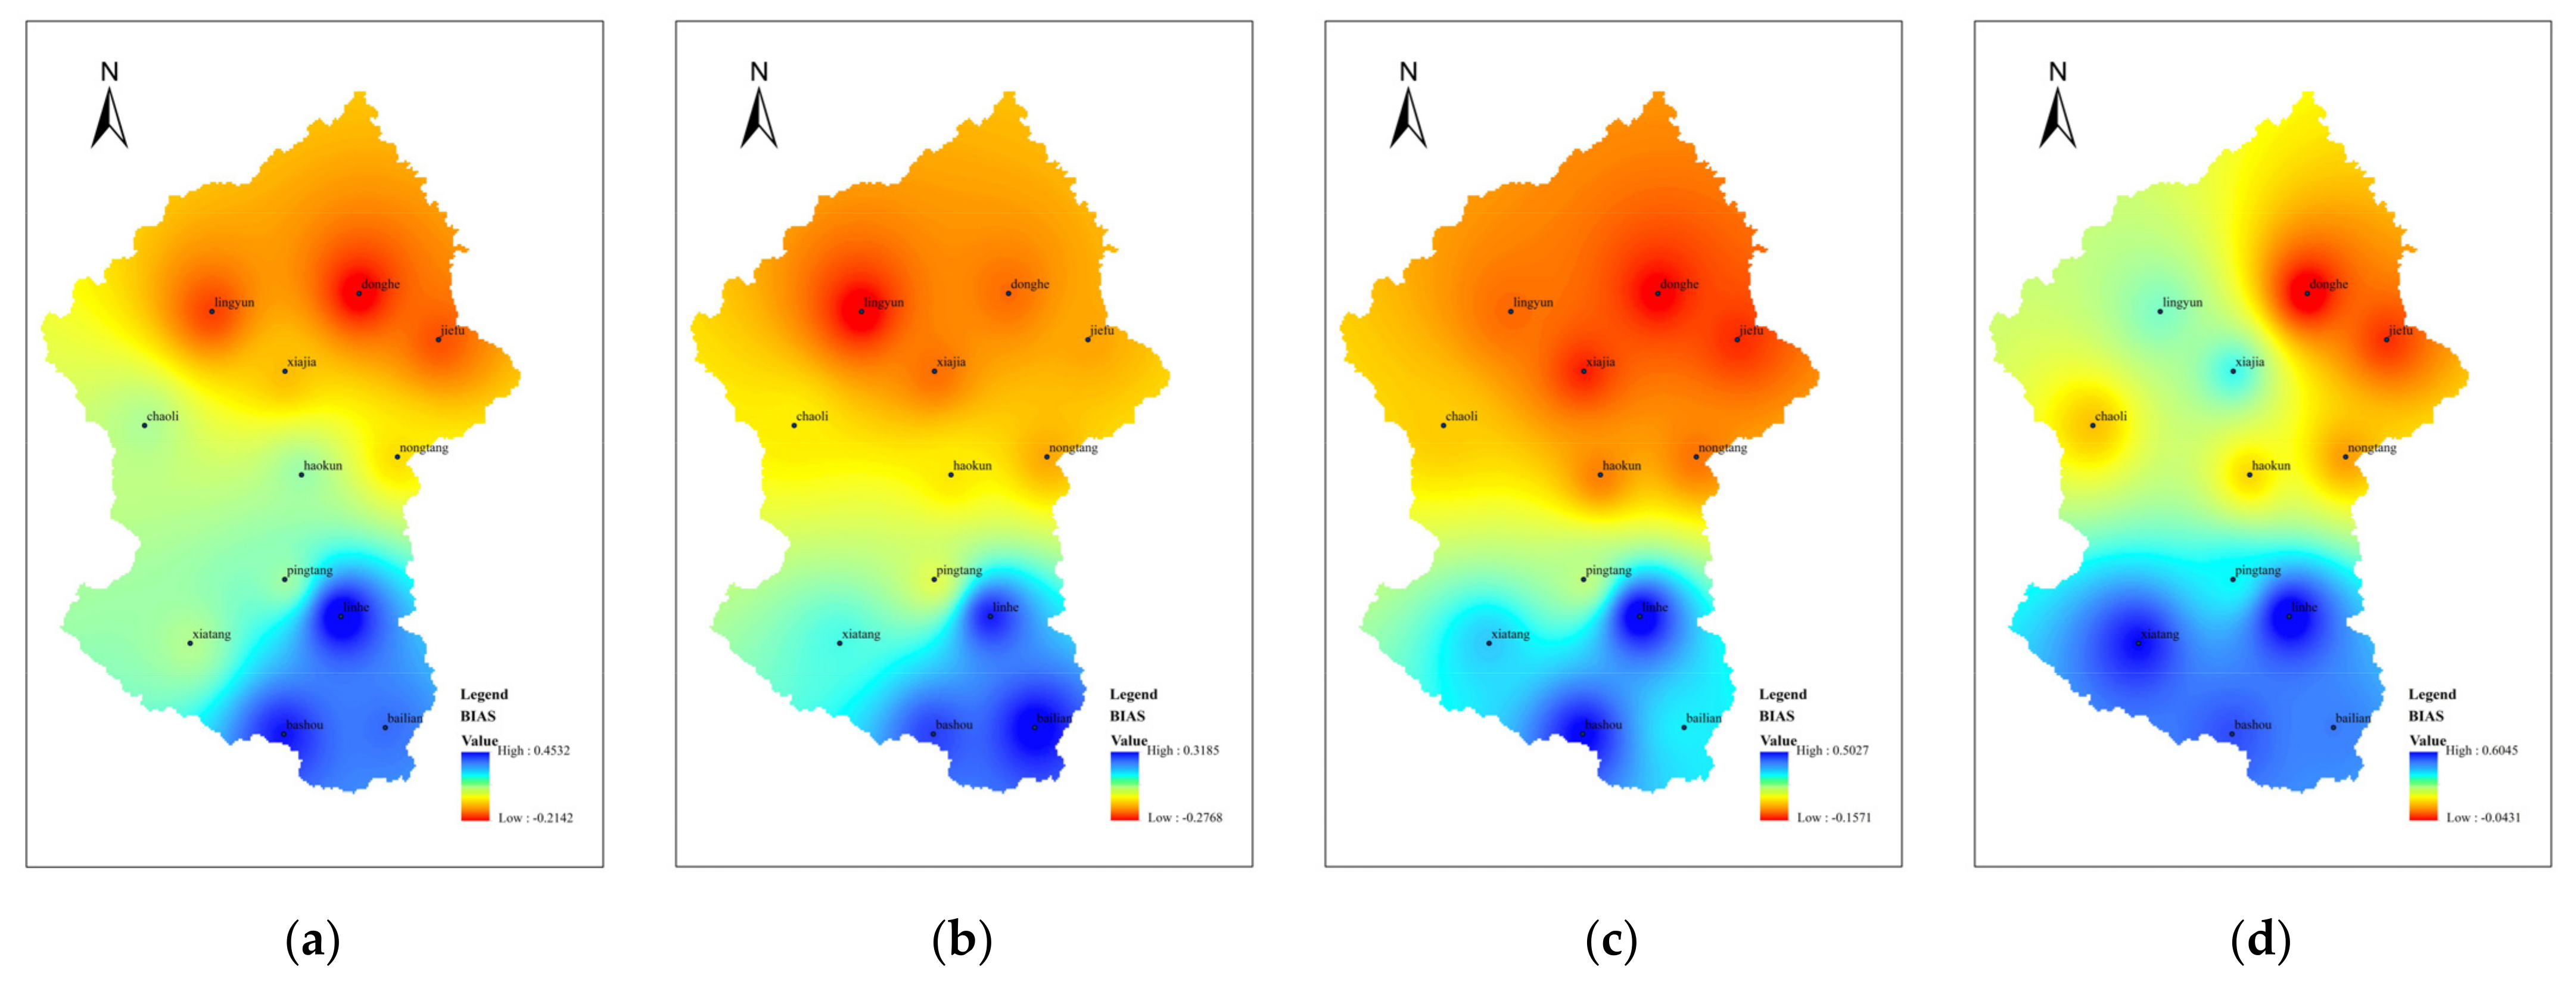
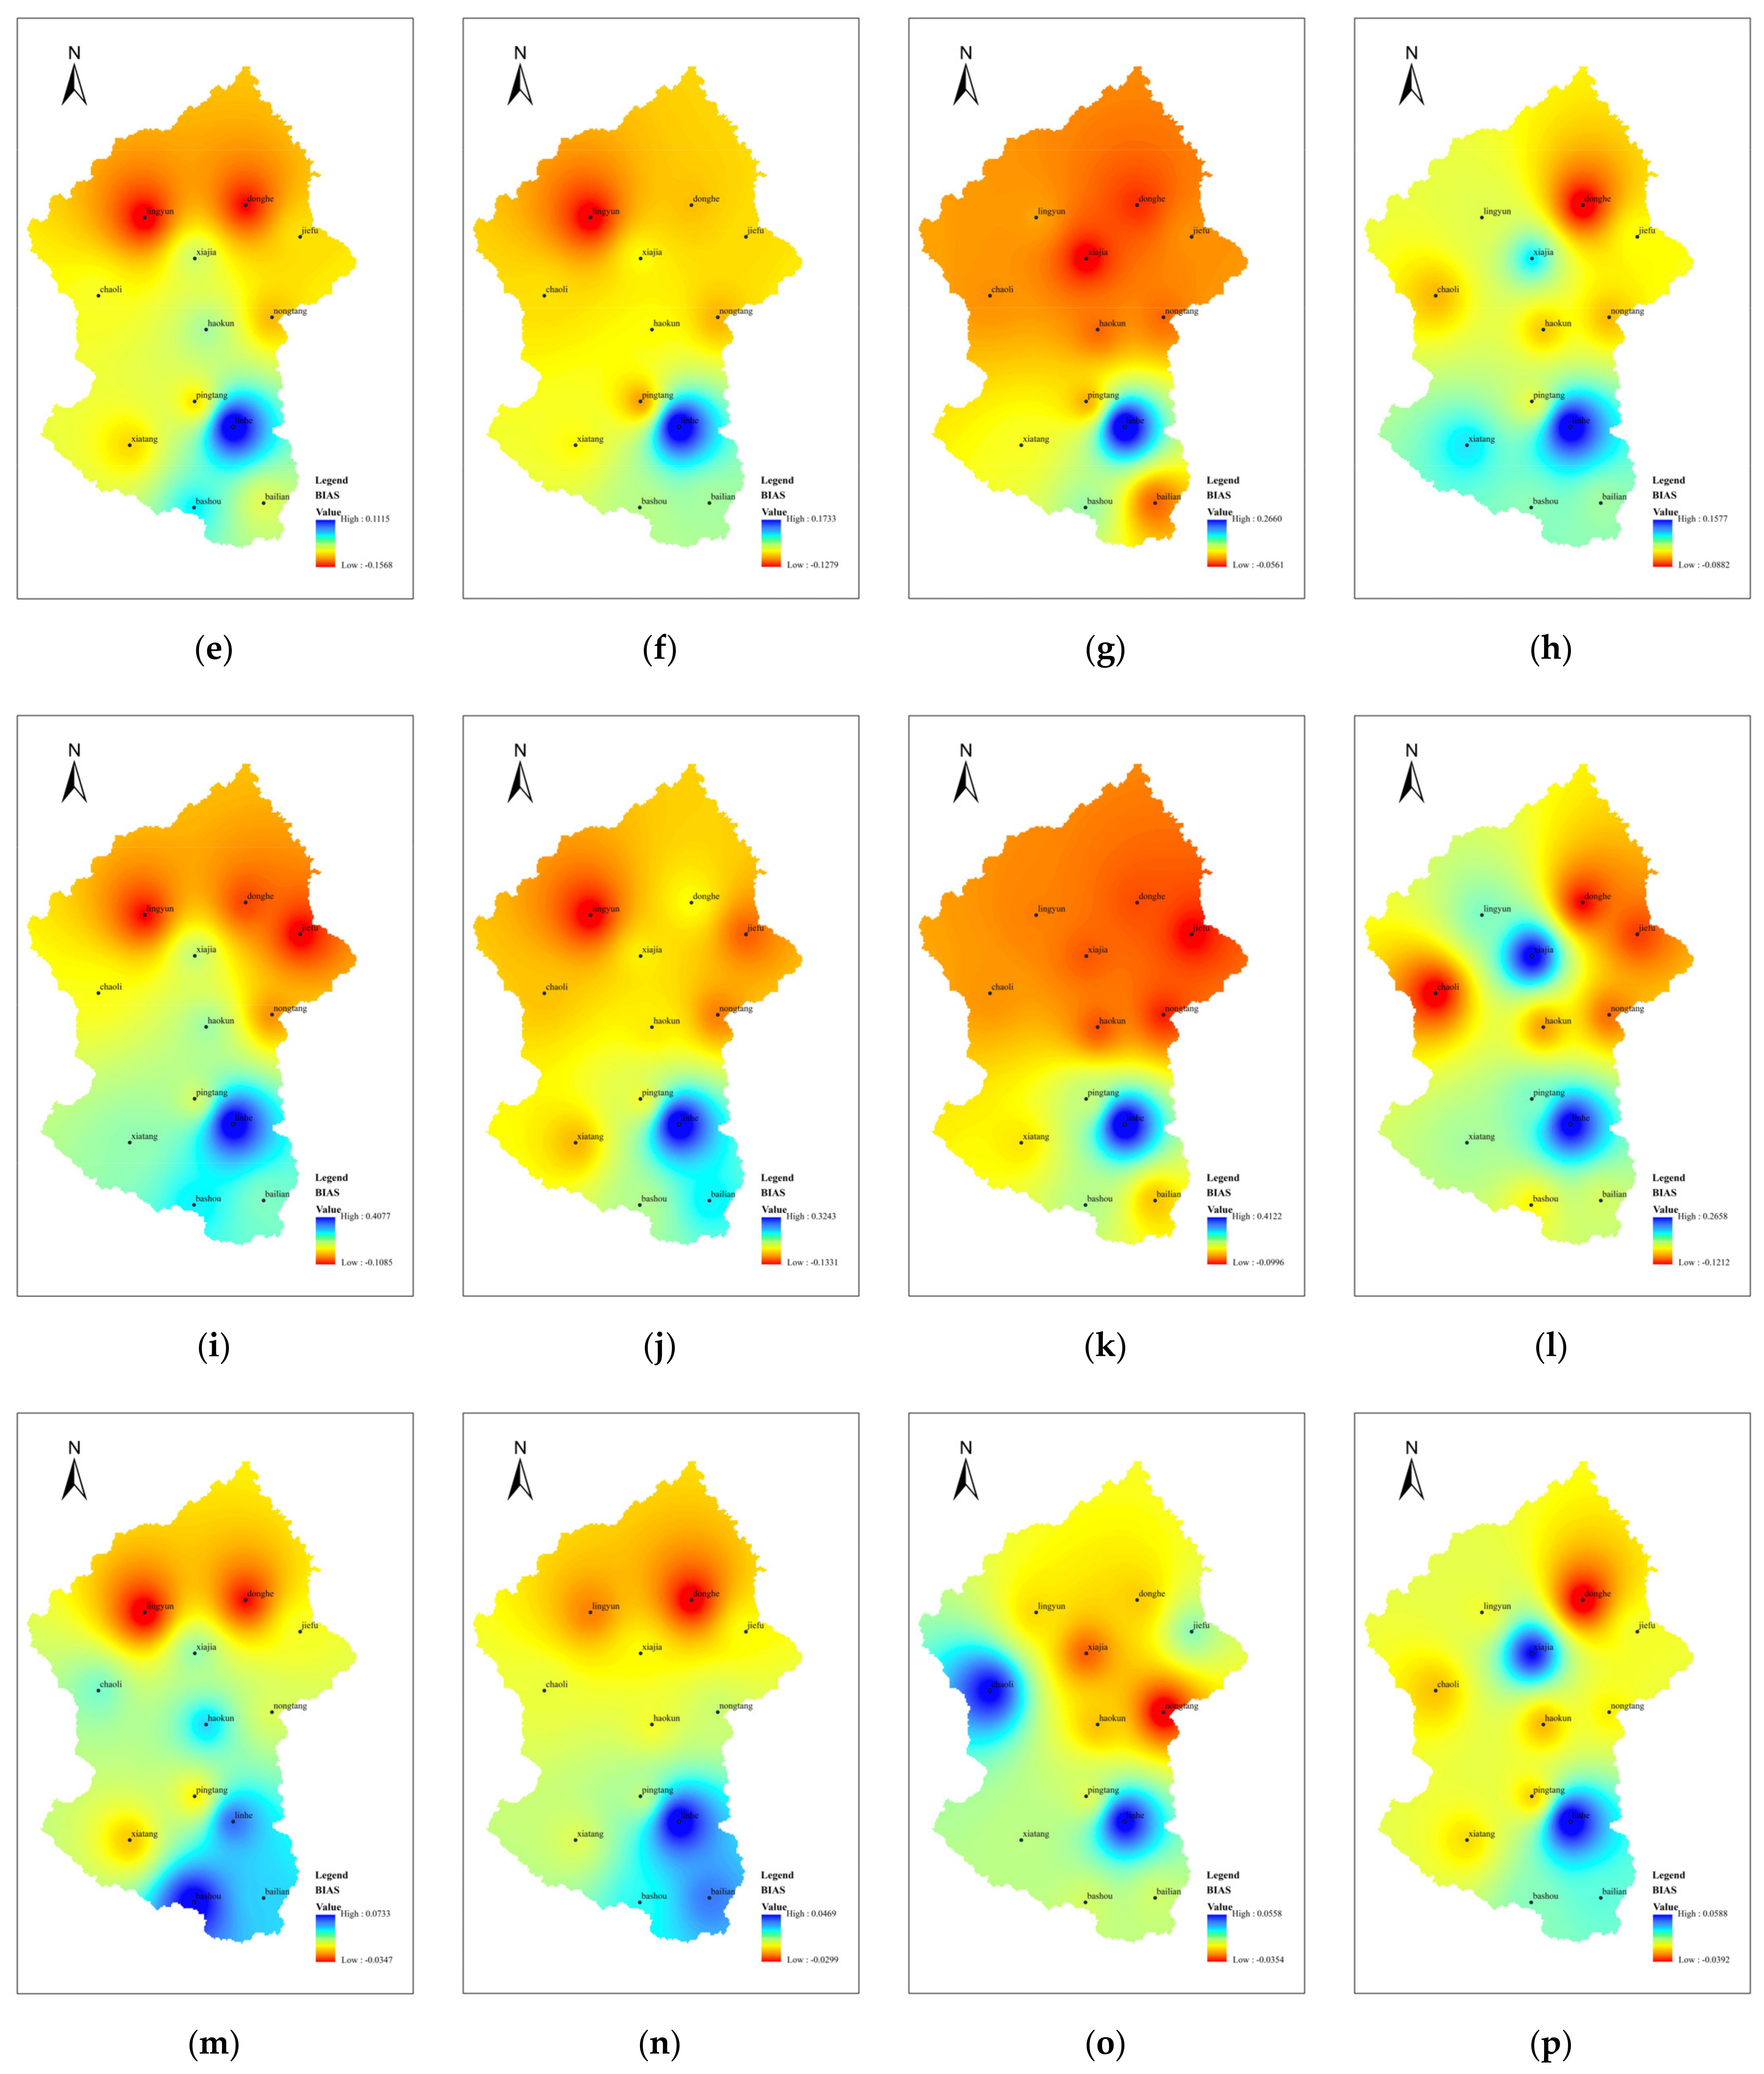
4.2.2. Data Accuracy in the Spatial Dimension

As shown in Figure 6, Figure 7 and Figure 8, IDW interpolation is used to plot the spatial distribution of CC, RMSE, and BIAS values.
Observing Figure 6, it can be found that the correlation between satellite precipitation and station precipitation is strong in all seasons, with upper limits of 0.94–0.97 and lower limits of 0.40–0.82, and the lowest value occurs at Haokun station (central part of the basin) in autumn. In general, the spatial distribution of CC has the best expressiveness in winter, followed by spring and summer, and the worst expressiveness in autumn. It is noteworthy that the CC is lowest in the central part except in summer, and generally shows a trend of increasing toward the north and south (see Figure 6a–d). The correlation between GDA-fused precipitation and station precipitation is strong in all seasons, with the lowest value of 0.787 occurring in summer at Bailian station (southeast of the basin). The spatial distribution of CC has the best expressivity in winter, followed by spring and autumn, and finally in summer (see Figure 6e–h). Compared with the original satellite data, the correlation between GWR-fused precipitation and station precipitation is significantly higher for each season, with the lowest value of 0.721 occurring at Haokun station (central part of the basin) in autumn. The spatial distribution of CC has the best performance in winter, followed by summer and spring, and finally in autumn (see Figure 6i–l). Compared with the original satellite precipitation and the first two types of fused precipitation, the correlation between CDF-fused precipitation and station precipitation in each season has significantly improved, with the lowest value of 0.88 occurring in spring at Bailian station (southeast of the basin). In general, the CC values of the CDF-fused precipitation data with the measured data perform well, and the lowest CC value can reach 0.97. Comparing the individual subplots in Figure 7, it can be seen that the upper limit of the RMSE values of satellite precipitation for each season ranges from 23.98 to 153.11 and the lower limit ranges from 9.14 to 58.36. The spatial distribution of RMSE values is best in winter, followed by spring and autumn, and worst in summer (see Figure 7a–d). The RMSE of GDA-fused precipitation with station precipitation has been reduced. The spatial distribution of RMSE by season has improved significantly compared to the original satellite data, with winter still performing the best, followed by autumn and spring, and finally summer (see Figure 7e–h). The RMSE of the GWR-fused precipitation is smaller than the original satellite precipitation in all seasons, and its performance is not significantly different from that of the GDA-fused data (see Figure 7i–l). Compared with the original satellite data and the first two fused data, the RMSE of CDF-fused precipitation is considerably lower, regardless of the season. The highest RMSE value is only 29.73, which occurs at Haokun station (central part of the basin) in summer (see Figure 7m–p).
The comparison of each part of Figure 8 shows that the overestimation or underestimation of station precipitation by satellite precipitation in each season is not high, with the highest value of 0.6045 occurring at Linhe (south of the central part of the basin) and Xiatang (southwest of the basin) stations in winter and the lowest value of −0.2768 occurring at Lingyun station (northwestern part of the basin) in summer, and there is no significant difference in the spatial distribution of BIAS in each season (see Figure 8a–d). The spatial distribution of RMSE values of the GDA-fused precipitation is better than that of the original satellite precipitation (see Figure 8e–h). The spatial distribution of RMSE values of GWR-fused precipitation and station data is more expressive than that of original satellite precipitation data, but less expressive than that of GDA-fused precipitation data (see Figure 8i–l). The RMSE of CDF-fused precipitation was significantly lower in each season compared to the original satellite precipitation and the first two fused precipitation, and the RMSE performed well in all four seasons (see Figure 8m–p).
An interesting phenomenon can be found that among the three fusion methods. CC, RMSE, and BIAS values show that the CDF-fused precipitation data have the best overall performance.

4.3. Drought Analysis

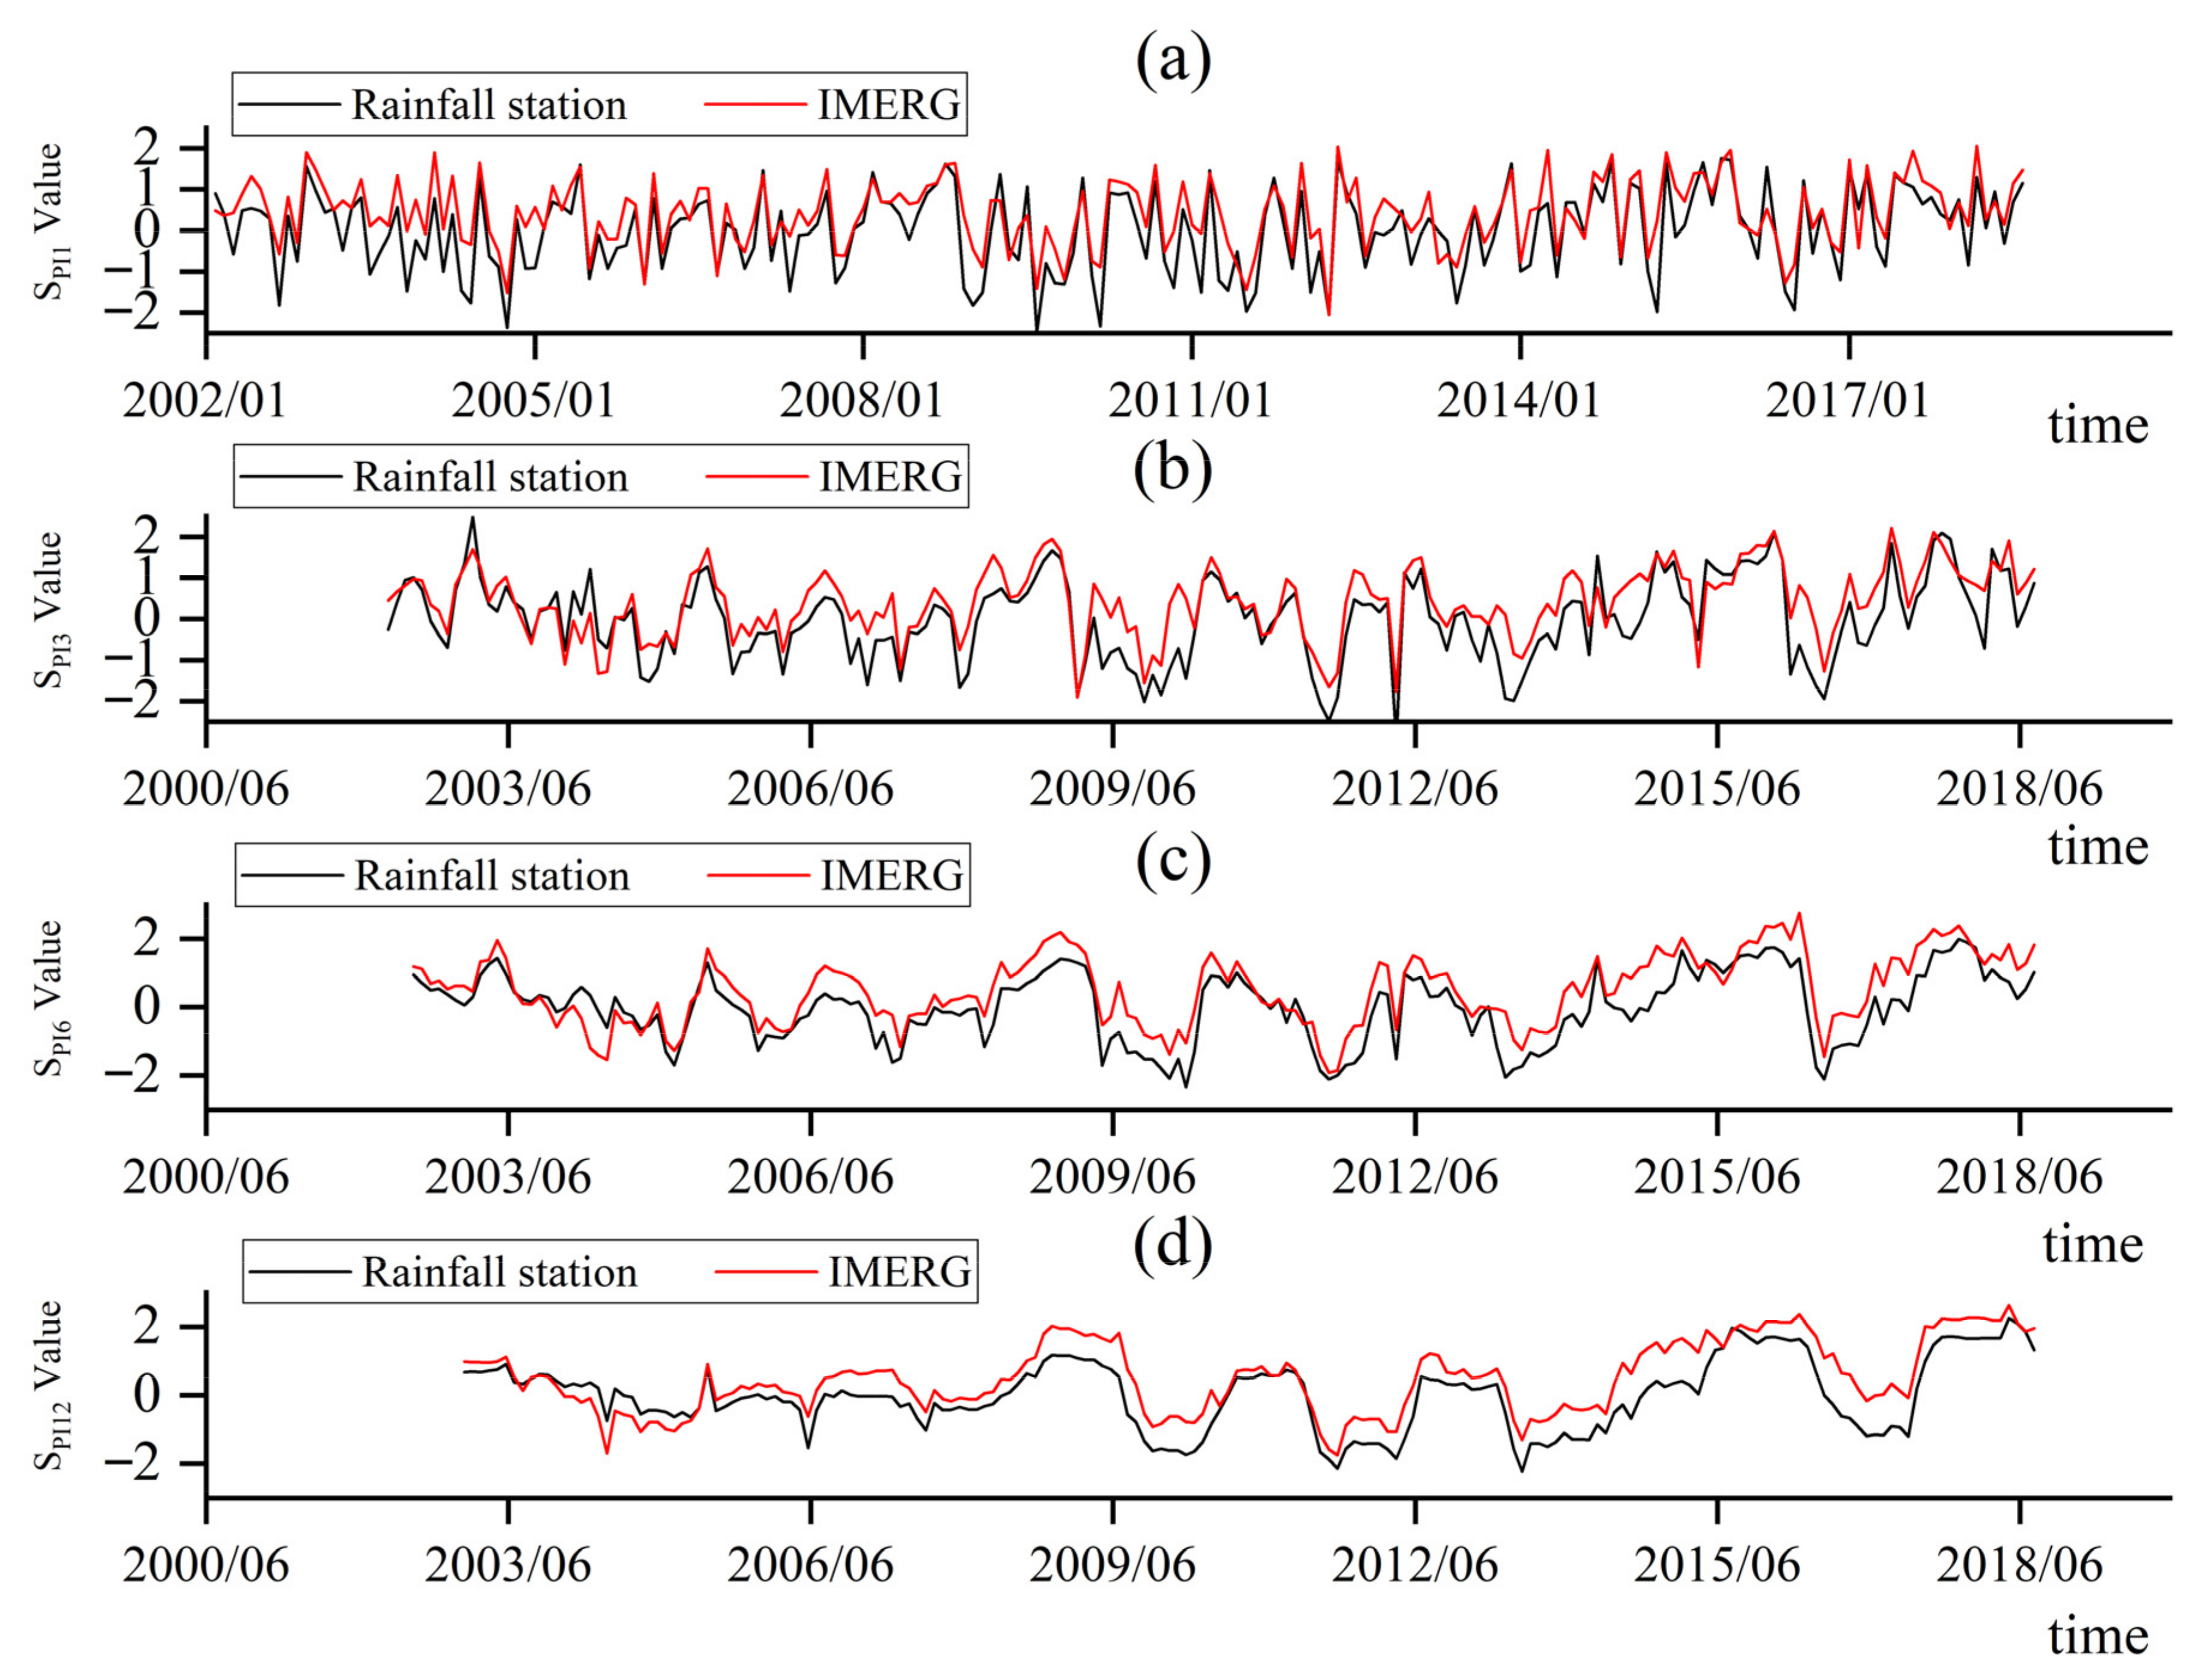
4.3.1. Temporal Evolutionary Characteristics of Droughts

The accuracy analysis of the fused precipitation data in Section 4.2 showed that the CDF-fused precipitation had the highest data accuracy, so the CDF-fused precipitation data from January 2002 to August 2018 were used for the drought analysis of the Chengbi River Basin.
The Tyson polygon method was used to calculate the surface rainfall in the basin, and then the SPI values at different time scales were calculated using the surface rainfall. Figure 9 shows the temporal variation of SPI at multiple time scales. It can be seen that the change trend of SPI curves is basically the same regardless of the time scale, indicating that the fused data can simulate the drought condition well. As the time scale increases, the correlation between the curves becomes higher (the CC values are 0.859, 0.855, 0.879, and 0.893, respectively), but the deviation between the curves (i.e., the distance between the two curves) also becomes larger. In addition, it can be seen from Figure 9 that the SPI values basically remain between +2 and −2, with a cyclical rise and fall, indicating that the Chengbi River Basin has an alternating pattern of droughts and floods during the year, with flooding periods mostly being the rainy seasons of each year, and winter and spring and other less rainy seasons mostly being dry periods with low SPI values.
Precipitation and air temperature affect the risk of drought events to some extent. Figure 10 shows the trends in air temperature and precipitation in the basin from 2002 to 2018, and it can be seen that both precipitation and air temperature show a strong intra-annual pattern, the precipitation and maximum air temperature show a small downward trend over the years, and the minimum air temperature shows a slight upward trend.

4.3.2. Spatial Distribution of Droughts

SPI was calculated and spatially interpolated for each station from October to December 2014 to analyze the spatial distribution of drought. Table 7 shows the drought scale and Table 8 shows the SPI3 values for each station for October to December 2014.
From Table 8, it can be seen that for both station precipitation and CDF-fused precipitation, at each station in the basin, the SPI3 values basically showed a gradual increasing trend between October and December, i.e., the drought condition was gradually relieved. Furthermore, it can be seen that in October, the basin was in a slight drought, with a few stations in a moderate drought; in November and December, the basin was basically in a normal state without drought or flooding.
Figure 11 shows a comparison of drought conditions in the Chengbi River Basin for three consecutive months, which shows that the basin is characterized by drought in the northeast and it is wet in the southwest. Comparing Figure 11a,b, the SPI values in Figure 11a range from −1.18 to 0.30, the drought center is located in the northeastern part of the basin, and the central part of the basin is wetter. The SPI values in Figure 11b range from −1.19 to 0.51, the drought center is the same as in Figure 11a, and the central and southern parts of the basin are wetter. Comparing Figure 11c,d, the SPI values of the Figure 11c plot range from −0.65 to 0.44, the drought center is located in the northeastern part of the basin, and the southwestern part of the basin is wetter. The SPI values of the Figure 11d plot range from −0.32 to 0.15. The drought center is in the eastern, northwestern, and southwestern part of the basin, and the central part of the basin is wetter. Comparing Figure 11e,f, the SPI values range from −0.23 to 0.65 in the Figure 11e plot, the drought center is located in the northeastern part of the basin, and the southwestern part of the basin is wetter. The SPI values in Figure 11f range from −0.26 to 0.03, the drought center is in the eastern part of the basin, and the central and western parts of the basin are wetter. It can be seen that the fused data slightly overestimate the intensity and area of drought under the normal condition of no drought and no flood in the basin. The SPI values obtained using the fused precipitation can reflect the overall drought conditions in the basin, except for some stations with large deviations.

5. Discussion

5.1. Explanation of Some Phenomena

In this study, the spatial and temporal accuracy of IMERG precipitation data from January 2014 to August 2018 in the Chengbi River Basin was evaluated using several evaluation metrics, and some interesting phenomena can be found.
(1) The correlation coefficients between satellite-monitored rainfall and measured rainfall increased with an increasing time scale, indicating that the consistency of the two rainfall data performed better at larger time scales.
(2) On the daily, monthly, and annual scales, the overall bias remains essentially at −0.007 and does not change with the increasing time scale. This indicates that the ability of the satellite to monitor rainfall in the basin is largely stable and there is a slight underestimation.
(3) By comparing the spatial distribution maps of high precipitation (Figure 5g,h), it can be seen that the maximum difference between station precipitation values and satellite precipitation values reaches 19 mm when high precipitation occurs, presumably due to the large deficiency of satellite monitoring for heavy rainfall.
(4) The reasons for the overestimation of low rainfall in the southern part of the basin are speculated: first, there is a large area of water in the southern part of the basin, i.e., the Chengbi River Reservoir. Although the water surface area of the Chengbi River Reservoir is only about 2% of the entire basin area, the large amount of evaporation from the 38.82 square kilometers of water surface area still cannot be ignored, and the large amount of evaporation causes the satellite to misjudge this part of water as precipitation, thus counting it as a precipitation event. Second, with high temperatures and strong evaporation ability in the southwest, when precipitation is low and of short duration, some precipitation is evaporated during the landing process, resulting in higher precipitation monitored by the satellite than that at the station.
(5) The reason for the underestimation of high rainfall in the northern part of the basin is speculated: the ability of the satellite to detect precipitation is strongly related to the regional topography, and in complex topography and high-altitude areas, the detection accuracy of the satellite sensors is greatly disturbed, resulting in the poor performance of IMERG precipitation products.
Generally, the accuracy of IMERG precipitation products in the Chengbi River Basin is related to the limitations of the satellite sensors and the topography, subsurface, evaporation intensity of the basin, and so on.

5.2. Comparison with Previous Results

The results of the accuracy evaluation of the original satellite precipitation showed that the precipitation data at the monthly scale have a high accuracy. This is confirmed by the results of Jiang et al. [60]. Satellite precipitation data at the monthly scale have the highest accuracy compared to the daily, seasonal, or annual scales.
Using three methods to fuse precipitation data from stations and satellites, the results showed that the CDF-fused precipitation data had the highest spatial and temporal accuracy and could better reflect the actual precipitation conditions in the Chengbi River Basin. The effectiveness of this method in the correction of precipitation data has also been investigated by Sheau Tieh et al. [61] and Lei et al. [62]. They used the quantile mapping method and the frequency matching method (the same principle as the CDF method) for bias correction of precipitation in Southeast Asia and the upper Heihe River in China, respectively, and both improved the bias of precipitation to a large extent.
Drought assessment of the Chengbi River Basin by standardized precipitation indices using CDF-fused data from stations and satellites from January 2002 to August 2018 showed that the CDF-fused data basically responded to the drought conditions in the Chengbi River Basin and that the basin is basically in a cyclical severe drought with severe flooding. The spatial analysis of droughts in October–December 2014 showed that only few areas in the Chengbi River Basin had moderate droughts, which is basically consistent with the findings of Gao et al. [63] on the spatial and temporal patterns of droughts in Guangxi—that is, “the frequency range of moderate and above droughts in northwest Guizhou is the smallest”.

5.3. Advantages and Disadvantages

The drought assessment index used in this study is the standardized precipitation index. Unlike the multi-factor index, its calculation formula is simple and only uses precipitation data, eliminating the tedious calculation of other parameters, and since the index does not involve specific drought mechanisms, it has strong spatial and temporal adaptability, and the formula has been widely used for drought assessment in different basins. Moreover, the research results on the accuracy evaluation and fusion correction of precipitation data in karst areas can provide useful references for other similar karst areas with more complex geological conditions. Furthermore, as the Chengbi River Basin is a small basin, and since previous studies on the application of satellite precipitation data are mostly based on large and medium-sized basins, this paper enriches the research on the application of satellite precipitation products in small basins.
Combining some shortcomings of this study, follow-up work is to be carried out in the following aspects: first, the spatially separate rate of IMERG precipitation data used in this paper is 0.1 ° × 0.1 ° . The next step should be to consider downscaling the resolution of the satellite data with a view to improve the quality of the satellite precipitation data. Second, linkage with other satellite products can be considered. Only one satellite precipitation product is used in this study, and other satellite products (CMORPH, PERSIANN) can be applied subsequently for comparative analysis, or the fusion correction method in this paper can be considered to improve the accuracy of other satellite precipitation products. In addition, it should be noted that due to the strong spatial and temporal variability of precipitation, the precipitation data fusion method has different applicability in different study areas, so the next step is to consider studying the accuracy of the fusion method in other similar small basins in karst areas, as well as to consider adding auxiliary factors such as topography and climate when performing data fusion to improve the credibility and accuracy of the study results.

5.4. Suggestions

From the accuracy evaluation results and data fusion results, the accuracy of IMERG monthly precipitation data is relatively high, and the CDF method is significantly better than the other two fusion methods. This result can provide valuable insights for the relevant developers of satellite algorithms to improve their algorithms, and can also help users to select satellite precipitation products with higher accuracy and better data fusion methods. From the results of the drought assessment, the Chengbi River Basin is in the midst of periodic droughts and floods. According to this rule, the relevant departments can take timely flood prevention measures and drought prevention measures during flood and drought periods to minimize various losses, including economic losses. In addition, drought is also closely related to agricultural conditions, and understanding the laws of drought can provide a timely basis for decision making at all levels of government and agricultural production departments.

6. Summary and Conclusions

In this study, we evaluated the spatial and temporal accuracy of IMERG satellite precipitation in the Chengbi River Basin. Secondly, IMERG satellite precipitation data and rainfall station precipitation data were fused and corrected based on three methods—geographically weighted regression (GWR), geographic difference analysis (GDA), and cumulative distribution function (CDF)—and the accuracy of the fused precipitation data was evaluated again. Finally, the fused data with the highest accuracy were selected for the drought analysis of the Chengbi River Basin. The following three main conclusions are drawn:
(1)
Temporally, the CC values of satellite precipitation and station precipitation increase with increasing time scale, the overall BIAS values remain basically the same, and the RMSE values are the smallest at the daily scale. Spatially, IMERG precipitation data overestimate actual precipitation in the southern part of the basin and underestimate actual precipitation in the northern part of the basin.
(2)
The quality of the CDF-fused precipitation data is better than the other two fusion methods, and the best values of CC, RMSE, and BIAS are 0.997, 4.222, and 0 in each season, respectively.
(3)
The drought analysis shows that the Chengbi River Basin is in a cycle of drought and flooding, with flooding occurring more often during the rainy season, while other periods show a dry state. In October–December 2014, the standardized precipitation index was mostly between +1 and −1, with spatial expressions of slight drought, normal conditions, and slight flooding.

Author Contributions

Conceptualization, Xuechen Meng and Yuli Ruan; Data curation, Xuechen Meng and Xingbi Lei; Formal analysis, Xuechen Meng and Yafang Wang; Funding acquisition, Chongxun Mo, Yuli Ruan, and Zhenxiang Xing; Investigation, Xuechen Meng and Xingbi Lei; Methodology, Xuechen Meng and Yuli Ruan; Project administration, Chongxun Mo and Shufeng Lai; Resources, Xuechen Meng and Xingbi Lei; Software, Xuechen Meng and Yafang Wang; Supervision, Zhenxaing Xing; Validation, Xuechen Meng and Yuli Ruan; Visualization, Xuechen Meng and Yafang Wang; Writing—original draft, Xuechen Meng and Yafang Wang; Writing—review and editing, Zhenxiang Xing. All authors have read and agreed to the published version of the manuscript.

Funding

This research was funded by the National Natural Science Foundation of China (grant numbers 51969004 and 51979038), the Guangxi Natural Science Foundation of China (grant number 2017GXNSFAA198361), and the Innovation Project of Guangxi Graduate Education (grant number YCBZ2019022).

Institutional Review Board Statement

Not applicable. This study did not involve humans or animals.

Informed Consent Statement

Not applicable. The study did not involve humans.

Data Availability Statement

Some or all data that support the findings of this study are available from the corresponding author upon reasonable request.

Conflicts of Interest

The authors declare no conflict of interest.

References

  1. Zhou, S.; Wang, Y.; Chang, J.; Guo, A.; Li, Z. Research on spatio-temporal evolution of drought patterns in the Yellow River Basin. J. Hydraul. Eng. 2019, 50, 1231–1241. [Google Scholar]
  2. Liu, T.; Krop, R.; Haigh, T.; Smith, K.H.; Svoboda, M. Valuation of Drought Information: Understanding the Value of the US Drought Monitor in Land Management. Water 2021, 13, 112. [Google Scholar] [CrossRef]
  3. Fowler, H.; Kilsby, C. A weather-type approach to analysing water resource drought in the Yorkshire region from 1881 to 1998. J. Hydrol. 2002, 262, 177–192. [Google Scholar] [CrossRef]
  4. Svoboda, M.D.; Fuchs, B.A.; Poulsen, C.C.; Nothwehr, J.R. The drought risk atlas: Enhancing decision support for drought risk management in the United States. J. Hydrol. 2015, 526, 274–286. [Google Scholar] [CrossRef] [Green Version]
  5. Rippey, B.R. The U.S. drought of 2012. Weather Clim. Extrem. 2015, 10, 57–64. [Google Scholar] [CrossRef] [Green Version]
  6. Mitra, S.; Srivastava, P. Comprehensive Drought Assessment Tool for Coastal Areas, Bays, and Estuaries: Development of a Coastal Drought Index. J. Hydrol. Eng. 2021, 26, 04020055. [Google Scholar] [CrossRef]
  7. Oh, K.; Yu, I.; Kim, H.; Kim, S.; Kim, L.-H.; Jeong, S. Drought assessment based on real-time drought index. Desalination Water Treat. 2014, 53, 3111–3117. [Google Scholar] [CrossRef]
  8. Shah, D.; Mishra, V. Integrated Drought Index (IDI) for Drought Monitoring and Assessment in India. Water Resour. Res. 2020, 56, e2019WR026284. [Google Scholar] [CrossRef]
  9. Sojka, M.; Jaskula, J.; Wielgosz, I. Drought Risk Assessment in the Kopel River Basin. J. Ecol. Eng. 2017, 18, 134–141. [Google Scholar] [CrossRef]
  10. Thomas, T.; Jaiswal, R.K.; Galkate, R.; Nayak, P.C.; Ghosh, N.C. Drought indicators-based integrated assessment of drought vulnerability: A case study of Bundelkhand droughts in central India. Nat. Hazards 2016, 81, 1627–1652. [Google Scholar] [CrossRef]
  11. Wickham, E.D.; Bathke, D.; Abdel-Monem, T.; Bernadt, T.; Bulling, D.; Pytlik-Zillig, L.; Stiles, C.; Wall, N. Conducting a drought-specific THIRA (Threat and Hazard Identification and Risk Assessment): A powerful tool for integrating all-hazard mitigation and drought planning efforts to increase drought mitigation quality. Int. J. Disaster Risk Reduct. 2019, 39, 101227. [Google Scholar] [CrossRef] [Green Version]
  12. Yang, J.; Wang, Y.M.; Chang, J.X.; Yao, J.; Huang, Q. Integrated assessment for hydrometeorological drought based on Markov chain model. Nat. Hazards 2016, 84, 1137–1160. [Google Scholar] [CrossRef]
  13. Perez, F.; De Stefano, M.; Disabato, F.; Vigna, R. The ITHACA Early Warning System for drought monitoring: First prototype test for the 2010 Sahel crisis. Ital. J. Remote Sens. 2012, 44, 181–195. [Google Scholar] [CrossRef]
  14. Saghafian, B.; Hamzekhani, F.G. Hydrological drought early warning based on rainfall threshold. Nat. Hazards 2015, 79, 815–832. [Google Scholar] [CrossRef]
  15. Wang, Y.T.; Jiang, M.X.; Zhang, H.X.; Huang, W.; Destech Publicat, I. Development of Guizhou Drought Monitoring and Early Warning and Disaster Evaluation System. In Proceedings of the 3rd International Conference on Green Materials and Environmental Engineering (GMEE), Beijing, China, 22–22 October 2017; pp. 61–66. [Google Scholar]
  16. McEvoy, D.J.; Hobbins, M.; Brown, T.J.; VanderMolen, K.; Wall, T.; Huntington, J.L.; Svoboda, M. Establishing Relationships between Drought Indices and Wildfire Danger Outputs: A Test Case for the California-Nevada Drought Early Warning System. Climate 2019, 7, 52. [Google Scholar] [CrossRef] [Green Version]
  17. Barrett, A.B.; Duivenvoorden, S.; Salakpi, E.E.; Muthoka, J.M.; Mwangi, J.; Oliver, S.; Rowhani, P. Forecasting vegetation condition for drought early warning systems in pastoral communities in Kenya. Remote Sens. Environ. 2020, 248, 111886. [Google Scholar] [CrossRef]
  18. Sharafi, L.; Zarafshani, K.; Keshavarz, M.; Azadi, H.; Van Passel, S. Drought risk assessment: Towards drought early warning system and sustainable environment in western Iran. Ecol. Indic. 2020, 114, 106276. [Google Scholar] [CrossRef]
  19. Van Ginkel, M.; Biradar, C. Drought Early Warning in Agri-Food Systems. Climate 2021, 9, 134. [Google Scholar] [CrossRef]
  20. Botterill, L.C.; Hayes, M.J. Drought triggers and declarations: Science and policy considerations for drought risk management. Nat. Hazards 2012, 64, 139–151. [Google Scholar] [CrossRef] [Green Version]
  21. Kulirova, P.; Vopravil, J.; Batysta, M.; Mendel Univ, B. Integrated Drought Management System in Central and Eastern Europe. In Proceedings of the International Conference on Soil—The Non-Renewable Environmental Resource, Brno, Czech Republic, 7–9 September 2015; pp. 159–168. [Google Scholar]
  22. Al-Faraj, F.A.M.; Scholz, M.; Tigkas, D.; Boni, M. Drought indices supporting drought management in transboundary watersheds subject to climate alterations. Water Policy 2015, 17, 865–886. [Google Scholar] [CrossRef]
  23. Hong, I.; Lee, J.H.; Cho, H.S. National drought management framework for drought preparedness in Korea (lessons from the 2014-2015 drought). Water Policy 2016, 18, 89–106. [Google Scholar] [CrossRef]
  24. Jéssica, G.N.; Daniel, A.; Helizani, C.B.; Christopher, M.U.N.; Sergio, N.D.; Anderson, L.R.; Ivo, Z.G. Evaluating the Latest IMERG Products in a Subtropical Climate: The Case of Paraná State, Brazil. Remote Sens. 2021, 13, 906. [Google Scholar]
  25. Chengcheng, M.; Xingguo, M.; Suxia, L.; Shi, H. Extensive evaluation of IMERG precipitation for both liquid and solid in Yellow River source region. Atmos. Res. 2021, 256, 105570. [Google Scholar]
  26. Zhu, S.; Shen, Y.; Ma, Z. A New Perspective for Charactering the Spatio-temporal Patterns of the Error in GPM IMERG over Mainland China. Earth Space Sci. 2021, 8, 1–16. [Google Scholar] [CrossRef]
  27. Mahmoud, M.T.; Mohammed, S.A.; Hamouda, M.A.; Mohamed, M.M. Impact of Topography and Rainfall Intensity on the Accuracy of IMERG Precipitation Estimates in an Arid Region. Remote Sens. 2020, 13, 13. [Google Scholar] [CrossRef]
  28. Tan, M.L.; Duan, Z. Assessment of GPM and TRMM Precipitation Products over Singapore. Remote Sens. 2017, 9, 720. [Google Scholar] [CrossRef] [Green Version]
  29. Prakash, S.; Mitra, A.K.; AghaKouchak, A.; Liu, Z.; Norouzi, H.; Pai, D.S. A preliminary assessment of GPM-based multi-satellite precipitation estimates over a monsoon dominated region. J. Hydrol. 2018, 556, 865–876. [Google Scholar] [CrossRef] [Green Version]
  30. Moazami, S.; Najafi, M. A comprehensive evaluation of GPM-IMERG V06 and MRMS with hourly ground-based precipitation observations across Canada. J. Hydrol. 2020, 594, 125929. [Google Scholar] [CrossRef]
  31. Ayat, H.; Evans, J.P.; Behrangi, A. How do different sensors impact IMERG precipitation estimates during hurricane days? Remote Sens. Environ. 2021, 259, 112417. [Google Scholar] [CrossRef]
  32. AghaKouchak, A.; Nakhjiri, N. A near real-time satellite-based global drought climate data record. Environ. Res. Lett. 2012, 7, 044037. [Google Scholar] [CrossRef] [Green Version]
  33. Hnilica, J.; Hanel, M.; Pus, V. Multisite bias correction of precipitation data from regional climate models. Int. J. Climatol. 2017, 37, 2934–2946. [Google Scholar] [CrossRef]
  34. Yilmaz, M. Drought analysis of Konya Closed Basin with the use of TMPA satellite-based precipitation data. J. Fac. Eng. Archit. Gazi Univ. 2017, 32, 541–549. [Google Scholar] [CrossRef] [Green Version]
  35. Katiraie-Boroujerdy, P.-S.; Naeini, M.R.; Asanjan, A.A.; Chavoshian, A.; Hsu, K.-L.; Sorooshian, S. Bias Correction of Satellite-Based Precipitation Estimations Using Quantile Mapping Approach in Different Climate Regions of Iran. Remote Sens. 2020, 12, 2102. [Google Scholar] [CrossRef]
  36. Le, X.-H.; Lee, G.; Jung, K.; An, H.-U.; Lee, S.; Jung, Y. Application of Convolutional Neural Network for Spatiotemporal Bias Correction of Daily Satellite-Based Precipitation. Remote Sens. 2020, 12, 2731. [Google Scholar] [CrossRef]
  37. Wei, L.; Jiang, S.; Ren, L.; Zhang, L.; Wang, M.; Duan, Z. Preliminary Utility of the Retrospective IMERG Precipitation Product for Large-Scale Drought Monitoring over Mainland China. Remote Sens. 2020, 12, 2993. [Google Scholar] [CrossRef]
  38. Montaseri, M.; Amirataee, B. Comprehensive stochastic assessment of meteorological drought indices. Int. J. Clim. 2016, 37, 998–1013. [Google Scholar] [CrossRef]
  39. Nasrollahi, M.; Khosravi, H.; Moghaddamnia, A.; Malekian, A.; Shahid, S. Assessment of drought risk index using drought hazard and vulnerability indices. Arab. J. Geosci. 2018, 11, 606. [Google Scholar] [CrossRef]
  40. Samantaray, A.K.; Singh, G.; Ramadas, M.; Panda, R.K. Drought hotspot analysis and risk assessment using probabilistic drought monitoring and severity-duration-frequency analysis. Hydrol. Processes 2019, 33, 432–449. [Google Scholar] [CrossRef]
  41. Shengle, C.A.O.; Yanling, W.; Ru’an, Y.U.N. Study on drought assessment and forecast method of Shandong Province. J. Shandong Univ. (Eng. Sci.) 2006, 36, 58–61. [Google Scholar]
  42. Guoqing, S. Drought Risk Assessment in the South-to-North Water Transferred Areas. South—North Water Transf. Water Sci. Technol. 2008, 6, 14–17. [Google Scholar]
  43. Xu, J.; Pan, D. Comprehensive Assessment of Drought Severity Based onIts Evolution Course Simulation. J. Yangtze River Sci. Res. Inst. 2014, 31, 16–22. [Google Scholar]
  44. Fernandez, C.; Vega, J.A.; Fonturbel, T.; Jimenez, E. Streamflow drought time series forecasting: A case study in a small watershed in North West Spain. Stoch. Environ. Res. Risk Assess. 2009, 23, 1063–1070. [Google Scholar] [CrossRef]
  45. Liu, Y.W.; Wang, W.; Hu, Y.M.; Liang, Z.M. Drought assessment and uncertainty analysis for Dapoling basin. Nat. Hazards 2014, 74, 1613–1627. [Google Scholar] [CrossRef]
  46. Mo, C.; Ruan, Y.; Xiao, X.; Lan, H.; Jin, J. Impact of climate change and human activities on the baseflow in a typical karst basin, Southwest China. Ecol. Indic. 2021, 126, 107628. [Google Scholar] [CrossRef]
  47. Mo, C.X.; Ruan, Y.L.; He, J.Q.; Jin, J.L.; Liu, P.; Sun, G.K. Frequency analysis of precipitation extremes under climate change. Int. J. Climatol. 2019, 39, 1373–1387. [Google Scholar] [CrossRef]
  48. Linfei, Y.; Guoyong, L.; Andre, P.; Jian, P. A Comprehensive Evaluation of Latest GPM IMERG V06 Early, Late and Final Precipitation Products across China. Remote Sens. 2021, 13, 1208. [Google Scholar]
  49. Yang, X.; Lu, Y.; Tan, M.L.; Li, X.; Wang, G.; He, R. Nine-Year Systematic Evaluation of the GPM and TRMM Precipitation Products in the Shuaishui River Basin in East-Central China. Remote Sens. 2020, 12, 1042. [Google Scholar] [CrossRef] [Green Version]
  50. Ren, M.; Xu, Z.; Pang, B.; Liu, W.; Liu, J.; Du, L.; Wang, R. Assessment of Satellite-Derived Precipitation Products for the Beijing Region. Remote Sens. 2018, 10, 1914. [Google Scholar] [CrossRef] [Green Version]
  51. Dezfooli, D.; Abdollahi, B.; Hosseini-Moghari, S.-M.; Ebrahimi, K. A comparison between high-resolution satellite precipitation estimates and gauge measured data: Case study of Gorganrood basin, Iran. J. Water Supply Res. Technol. -Aqua 2018, 67, 236–251. [Google Scholar] [CrossRef]
  52. Vasvari, V. Calibration of tipping bucket rain gauges in the Graz urban research area. Atmos. Res. 2005, 77, 18–28. [Google Scholar] [CrossRef]
  53. Bruster-Flores, J.L.; Ortiz-Gómez, R.; Ferriño-Fierro, A.L.; Guerra-Cobián, V.H.; Burgos-Flores, D.; Lizárraga-Mendiola, L.G. Evaluation of Precipitation Estimates CMORPH-CRT on Regions of Mexico with Different Climates. Water 2019, 11, 1722. [Google Scholar] [CrossRef] [Green Version]
  54. Foody, G.M. Geographical weighting as a further refinement to regression modelling: An example focused on the NDVI-rainfall relationship. Remote Sens. Environ. 2003, 88, 283–293. [Google Scholar] [CrossRef]
  55. Cheema, M.J.M.; Bastiaanssen, W.G.M. Local calibration of remotely sensed rainfall from the TRMM satellite for different periods and spatial scales in the Indus Basin. Int. J. Remote Sens. 2012, 33, 2603–2627. [Google Scholar] [CrossRef]
  56. Calheiros, R.V.; Zawadzki, I.I. Reflectivity-Rain Rate Relationships for Radar Hydrology in Brazil. J. Appl. Meteorol. 1987, 26, 118–132. [Google Scholar] [CrossRef]
  57. Mckee, T.B.; Doesken, N.J.; Kleist, J. The Relationship of Drought Frequency and Duration to Time Scales. In Proceedings of the 8th Conference on Applied Climatology, Anaheim, CA, USA, 17–22 January 1993. [Google Scholar]
  58. Dabanli, I.; Mishra, A.K.; Sen, Z. Long-term spatio-temporal drought variability in Turkey. J. Hydrol. 2017, 552, 779–792. [Google Scholar] [CrossRef]
  59. Wang, L.; Yu, H.; Yang, M.; Yang, R.; Gao, R.; Wang, Y. A drought index: The standardized precipitation evapotranspiration runoff index. J. Hydrol. 2019, 571, 651–668. [Google Scholar] [CrossRef]
  60. Jiang, X.; Liu, Y.; Wu, Y.; Wang, G.; Wu, W.; Jin, J.; He, R.; Liu, C. Research on the Quality Evaluation of GPM Satellite Precipitation Data Products -Taking the Yarlung Zangbo River as an Example. China Rural. Water Hydropower 2021, 6, 91–97. [Google Scholar]
  61. Sheau Tieh, N.; Tangang, F.; Juneng, L. Bias correction of global and regional simulated daily precipitation and surface mean temperature over Southeast Asia using quantile mapping method. Glob. Planet. Chang. 2017, 149, 79–90. [Google Scholar] [CrossRef] [Green Version]
  62. Lei, H.; Ma, J.; Li, H.; Wang, J.; Shao, D.; Zhao, H. Bias Correction of Climate Model Precipitation in the Upper Heihe River Basin based on Quantile Mapping Method. Plateau Meteorol. 2020, 39, 266–279. [Google Scholar]
  63. Gao, Y.; Liu, X.; Leng, X.; Zhang, Y.; Dong, J.; Fan, C. Spatio-temporal drought patterns in Guangxi Province based on principal component analysis. Acta Ecol. Sin. 2020, 40, 5591–5601. [Google Scholar]
Figure 1. The location of the Chengbi River Basin and the distribution of the stations.
Ijgi 11 00048 g001
Figure 2. This is the hypsometric curve of the Chengbi River Basin.
Ijgi 11 00048 g002
Figure 3. The structure chart of the article.
Ijgi 11 00048 g003
Figure 4. Comparison and scatter plots of satellite precipitation data and station precipitation data. (a) Comparison plot of daily precipitation; (b) scatter plot of daily precipitation; (c) comparison plot of monthly precipitation; (d) scatter plot of monthly precipitation; (e) comparison plot of annual precipitation; (f) scatter plot of annual precipitation.
Ijgi 11 00048 g004aIjgi 11 00048 g004bIjgi 11 00048 g004c
Figure 5. Spatial distribution of station and IMERG precipitation under each precipitation type. (a) Spatial distribution of the measured type 0 rainfall at the station. (b) Spatial distribution of type 0 rainfall monitored by satellite. (c) Spatial distribution of type 1 rainfall measured at the station. (d) Spatial distribution of type 1 rainfall monitored by satellite. (e) Spatial distribution of the measured type 2 rainfall at the station. (f) Spatial distribution of type 2 rainfall monitored by satellite. (g) Spatial distribution of measured type 3 rainfall at the station. (h) Spatial distribution of type 3 rainfall monitored by satellite. It is not difficult to find that satellite precipitation more or less overestimates the actual precipitation when no precipitation occurs, and the overestimation ranges from 0.1 mm to 0.4 mm, with the degree of overestimation increasing from the center to the north and south, respectively. The degree of overestimation is significantly higher in the south of the basin than in the north (a,b).
Ijgi 11 00048 g005aIjgi 11 00048 g005b
Figure 6. Spatial distribution of CC values. Note: The CC values in the figure all meet the significance level of 0.05. (a) IMERG-spring, (b) IMERG-summer, (c) IMERG-autumn, (d) IMERG-winter, (e) GDA-spring, (f) GDA-summer, (g) GDA-autumn, (h) GDA-winter, (i) GWR-spring, (j) GWR-summer, (k) GWR-autumn, (l) GWR-winter, (m) CDF-spring, (n) CDF-summer, (o) CDF-autumn, (p) CDF-winter.
Ijgi 11 00048 g006aIjgi 11 00048 g006b
Figure 7. Spatial distribution of RMSE values. (a) IMERG-spring, (b) IMERG-summer, (c) IMERG-autumn, (d) IMERG-winter, (e) GDA-spring, (f) GDA-summer, (g) GDA-autumn, (h) GDA-winter, (i) GWR-spring, (j) GWR-summer, (k) GWR-autumn, (l) GWR-winter, (m) CDF-spring, (n) CDF-summer, (o) CDF-autumn, (p) CDF-winter.
Ijgi 11 00048 g007aIjgi 11 00048 g007b
Figure 8. Spatial distribution of BIAS values. (a) IMERG-spring, (b) IMERG-summer, (c) IMERG-autumn, (d) IMERG-winter, (e) GDA-spring, (f) GDA-summer, (g) GDA-autumn, (h) GDA-winter, (i) GWR-spring, (j) GWR-summer, (k) GWR-autumn, (l) GWR-winter, (m) CDF-spring, (n) CDF-summer, (o) CDF-autumn, (p) CDF-winter.
Ijgi 11 00048 g008aIjgi 11 00048 g008b
Figure 9. Trends of the SPI values at different time scales. (a) 1-month SPI; (b) 3-month SPI; (c) 6-month SPI; (d) 12-month SPI.
Ijgi 11 00048 g009
Figure 10. Trends in precipitation, minimum, and maximum air temperature from 2002 to 2018. (a) Trend of monthly maximum and minimum temperatures. (b) Trend of monthly precipitation.
Ijgi 11 00048 g010
Figure 11. Comparison of three consecutive months of drought in the Chengbi River Basin. (a,b) The spatial distribution of drought obtained from the station-measured precipitation and CDF-fused precipitation in October 2014, respectively. (c,d) The spatial distribution of drought obtained from the station-measured precipitation and CDF-fused precipitation in November 2014, respectively. (e,f) The spatial distribution of drought obtained from the station-measured precipitation and CDF-fused precipitation in December 2014, respectively.
Ijgi 11 00048 g011
Table 1. Detailed information of each station in the Chengbi River Basin.
StationLatitude
(°)
Longitude
(°)
Altitude
(m)
Average
Annual Precipitation
(mm)
Maximum Annual Precipitation
(mm)
Minimum Annual Precipitation
(mm)
Bashou23.95106.64226310741422803
Pingtang24.094106.64531412501792805
Haokun24.192106.66340814242009816
Lingyun24.345106.57468916602381995
Xiatang24.036106.54820610931682743
Bailian23.955106.74527710981536671
Linhe24.059106.7012459751476554
Chaoli24.239106.50480114462087876
Xiajia24.289106.64859215002303905
Nongtang24.207106.76188314972123929
Jiefu24.316106.804689165923051068
Donghe24.36106.724100415732409956
Table 2. Accuracy evaluation index values of daily precipitation data.
StationCCRMSE (mm)BIASPODFARCSI
Bashou0.7567.9660.3340.4630.6650.241
Pingtang0.7248.9710.060.5260.6610.260
Haokun0.67610.379−0.0510.5310.6370.275
Lingyun0.70710.841−0.2060.5460.6100.295
Xiatang0.7338.3200.2010.4090.6070.251
Bailian0.7328.2480.3140.4200.6340.243
Linhe0.7168.9030.3910.4360.6690.232
Chaoli0.63611.123−0.0720.5300.6100.290
Xiajia0.70610.411−0.150.5450.6230.286
Nongtang0.65911.304−0.0940.5460.6100.295
Jiefu0.71410.293−0.1840.5450.5880.307
Donghe0.67410.638−0.1700.5520.5510.329
The CC values in the table all meet the significance level of 0.05.
Table 3. Accuracy evaluation index values of monthly precipitation data.
StationCCRMSE (mm)BIAS
Bashou0.95447.3840.334
Pingtang0.94140.9410.060
Haokun0.90057.837−0.051
Lingyun0.92482.958−0.206
Xiatang0.94741.3120.201
Bailian0.96345.1870.314
Linhe0.93853.9950.391
Chaoli0.90264.846−0.072
Xiajia0.92072.980−0.150
Nngtang0.92058.574−0.094
Jiefu0.94168.744−0.184
Donghe0.94560.421−0.170
The CC values in the table all meet the significance level of 0.05.
Table 4. Accuracy evaluation index values of annual precipitation data.
StationCCRMSE (mm)BIAS
Bashou0.904391.6030.334
Pingtang0.984136.0610.060
Haokun0.964173.531−0.051
Lingyun0.975460.281−0.206
Xiatang0.982268.5820.201
Bailian0.921374.0230.314
Linhe0.923434.9510.391
Chaoli0.834311.194−0.072
Xiajia0.959393.479−0.150
Nongtang0.933234.845−0.094
Jiefu0.947399.423−0.184
Donghe0.979396.214−0.170
The CC values in the table all meet the significance level of 0.05.
Table 5. Frequency and statistical parameters of various types of daily precipitation data.
TypeTimeFrequencyStation
Minimum Value (mm)Maximum Value (mm)
07460.43779300
16970.4090380.0477388.069297
22040.1197188.08527331.69781
3570.03345132.3666994.86293
Table 6. Calculation results of index values for each season.
Data TypesIndicatorsSpringSummerAutumnWinter
SatelliteCC0.5190.7350.6950.669
RMSE (mm)91.977239.69394.38831.439
BIAS0.039−0.0570.0460.271
GDACC0.8570.9570.9710.971
RMSE (mm)56.893102.98331.8127.231
BIAS−0.071−0.0350.0110.012
GWRCC0.8130.9510.9130.884
RMSE (mm)60.462101.25353.53413.781
BIAS0.0490.0070.0070.021
CDFCC0.9920.9970.9930.990
RMSE (mm)13.60725.35515.6634.222
BIAS0.0110.0010.0000.001
Note: The CC values in the table all meet the significance level of 0.05.
Table 7. Drought scale [58,59].
SPI ValueDrought and Flood ScaleSPI ValueDrought and Flood Scale
2.0 ≤ SPIextreme flood−1.0 < SPI ≤ −0.5slight drought
1.5 < SPI ≤ 2.0severe flood−1.5 < SPI ≤ −1.0moderate drought
1.0 < SPI ≤ 1.5moderate flood−2.0 < SPI ≤ −1.5severe drought
0.5 < SPI ≤ 1.0slight floodSPI ≤ −2.0extreme drought
−0.5 < SPI ≤ 0.5no drought or flood
Table 8. SPI3 values for each station.
Data TypesDateXiajiaLingyunDongheJiefuNongtangHaokun
October 2014−0.99−0.3−0.36−0.83−0.7−0.78
Station DataNovember 2014−0.130.440.27−0.230.360.08
December 2014−0.070.510.25−0.010.650.15
October 2014−0.57−0.51−0.54−0.67−0.66−0.75
Fused dataNovember 2014−0.23−0.17−0.24−0.3−0.31−0.27
December 2014−0.06−0.03−0.1−0.11−0.15−0.14
Data TypesDatePingtangXiatangChaoliLinheBailianBashou
October 2014−1.14−0.94−0.69−1.12−1.18−0.9
Station DataNovember 2014−0.210.03−0.07−0.26−0.650.1
December 20140.06−0.030.23−0.23−0.21−0.12
October 2014−1.04−1−0.65−1.19−1.12−1.11
Fused dataNovember 2014−0.22−0.19−0.15−0.32−0.27−0.27
December 2014−0.12−0.09−0.05−0.26−0.16−0.2
Publisher’s Note: MDPI stays neutral with regard to jurisdictional claims in published maps and institutional affiliations.

