1. Introduction
The emerging coronavirus (COVID-19) has caused a global pandemic [
1]. Most countries have taken urgent measures, including social distancing and lockdown measures, as well as administering newly developed COVID-19 vaccines to prevent and control the spread of COVID-19. However, with the continuous mutation of the COVID-19 virus, the COVID-19 pandemic is not likely to shortly disappear [
2]. While most countries still try to successfully control the spread of the delta virus domestically, most if not all still face a significant risk of importing COVID-19 from overseas [
3,
4]. For example, recent outbreaks of COVID-19 in China were reported, caused by COVID-19 cases imported overseas [
5].
Due to the large incoming and outcoming passenger flows, air transportation has attracted considerable consideration to prevent overseas imported cases. Recent local COVID-19 outbreaks in areas such as Shanghai, Nanjing, and other regions of China were mainly caused by COVID-19 cases imported through the air channel. Aviation overseas imported cases have drawn wide efforts from government health authorities and scholars. Zhang et al. [
6] and Nakamura et al. [
7] have, for instance, developed modelling and epidemiologic approaches that provide a close understanding of the infection risk coming from air transportation. However, COVID-19 can not only be transmitted from aerial transportation, but also by any transportation means, such as route or maritime networks. Shipping, the cornerstone of global trade, is likely to become another important gateway for COVID-19 inputs. The Yantian Wharf outbreak in Shenzhen, the XinfaDi outbreak in Beijing, and the Qingdao outbreak all demonstrate that the virus can not only be introduced through incoming maritime populations, but also and even through the international maritime logistics chain [
8,
9].
International shipping is characterized by its globality, high mobility, high aggregation, and high density. International-going ships usually visit many COVID-19-infected countries and regions. Ships probably became a possible carrier of COVID-19 which might play a significant role in the spread of COVID-19 worldwide. So far, there are several reports of COVID-19 outbreaks on cruise ships and cargo ships around the world [
10,
11]. In the context of a global COVID-19 pandemic, port crew shifts and cargo handling, especially cold-chain cargo handling, tend to cause front-line personnel infection and further local spread of the virus, thus possibly triggering a large epidemic [
12]. In order to strictly prevent the transmission and spread of the COVID-19 through maritime transportation, a few national seaports have adopted restriction measures, which include blocking ports, closing terminals, prohibiting ships from berthing, as well as crew embarkation and disembarkation, prohibiting cargo unloading and loading, and enforcing quarantine [
13,
14], but these measures considerably affect the efficiency and effectiveness of port production and seriously threaten the security of the global supply chain of essential goods. How to minimize the impact of COVID-19 prevention and control measures on port operations remains a very challenging task.
In recent years, with the significant improvement in the quality and coverage of maritime Automatic Identification System (AIS) data and recent maturity of large data technologies and infrastructures, it has become possible to combine such AIS trajectory data with machine learning algorithms to dynamically track COVID-19 risks [
15,
16]. Although the impacts of COVID-19 on maritime industry have drawn increasing attention, the infection risk of ships and seaports in the context of global COVID-19 pandemic is still not fully explored. Therefore, the purpose of this paper is to introduce an overseas port which imported a COVID-19 risk model based on ship trajectory data and global COVID-19 outbreak data. The principles behind this approach is to dynamically track the risk of overseas imported COVID-19 of ships and ports, with the aim to provide reliable data to optimize the port prevention and COVID-19 control measures.
The remainder of the paper is organized as follows.
Section 2 reviews previous works related to COVID-19 issues in the shipping domain.
Section 3 introduces the main research methodological framework and incoming datasets and develops the shipping network extraction process and the computational seaport risk model of overseas imported COVID-19.
Section 4 illustrates the potential of our method using global cruise ships as a case study. Finally, the main contributions and limitations of this study are discussed in the final
Section 5.
2. Related Research
In the face of the global pandemic of the COVID-19, preventing and controlling COVID-19 imported overseas is a challenging task that has drawn substantial research efforts. In the field of international aviation, Zhang et al. [
6] introduced a risk index to evaluate the risk of imported cases on inbound international flights, and that considers international aviation connectivity data and COVID-19 outbreak data as key variables. This risk index can measure the level of risk at the national, provincial, and even specific route levels. Nakamura et al. [
7] estimated the worldwide overall relative risk of imported and exported COVID-19 from airports based on global geographical data as well as differences between imported and exported cases. This study found that many airports in China, Iran, and European countries had higher global transmission capacity in exporting COVID-19 risk rather than importing COVID-19 risk. Daon et al. [
17] analyzed the risk of 1364 airports through simulated global air travel data and population density estimates from all over the world, and finally showed that airports in East Asia had the highest risk as sources of COVID-19 outbreaks.
When compared with similar COVID-19 risk models currently under development, the main peculiarity of our approach is that it is based on the number of ship passengers, the number of the confirmed COVID-19 cases in seaports and the connectivity between maritime transportation routes over the past 14 days. A main difference with international air transportation, for instance, is that much more precise data regarding daily flights and passenger flows are available. Passenger arrival and departure contamination tests are also nowadays widely processed; this makes COVID-19 risk evaluations much easier to evaluate [
18,
19].
The risk of importation of epidemics by sea is nonnegligible compared to air transport. With approximately 80% of global trade and over 70% of the value of goods transported by sea, maritime transport is critical to global trade [
20]. Regular ship movements in the maritime transportation network have become a possible vector for the spread of infectious diseases. Ports, ships, crews, and cargo may all be key nodes in the shipping network that are infected with COVID-19. Pang et al. [
8] traced the COVID-19 outbreak in the market of Xinfadi in Beijing in June 2020 and found that the outbreak may be caused by contaminated imported food transported from cargo ships through the cold chain. In the Qingdao epidemic, Liu et al. [
21] also reported that the COVID-19 was isolated from the surface swab samples of the cod outer packaging, suggesting that the global cold chain can also import COVID-19 by maritime transportation.
Cruise ships, which receive approximately 30 million passengers every year, are another important transmission medium of the COVID-19 due to important confinement while travelling [
22]. In early 2020, many passengers and crew of cruise ships were reported to be infected by the COVID-19 in Yokohama in Japan, Corfu in Greece, and Sydney in Australia [
23]. For example, the Diamond Princess cruise ship has reported that 712 people were infected with COVID-19 [
24]. By the end of the first quarter of 2020, more than 50 cruise ships had recorded confirmed cases of COVID-19, representing one-fifth of the global ocean cruise fleet [
10]. Ito et al. [
25] used AIS data to track all cruise ships worldwide from January 2020 to March 2020, whereby most of the passengers or workers infected on large cruise ships were found to have sailed from the same origin and destination ports within a week.
Lockdown and other prevention measures against COVID-19 reduced the operational efficiency of global ports, and caused severe congestion at major ports (such as the ports of Yantian in China, as well as Los Angeles and Long Beach in the United States), which also led to a shortage of global shipping capacity. Nwokedi et al. [
26] concluded that the COVID-19 pandemic and associated movement restrictions caused severe disruptions to container logistics and supply chains, particularly in the last mile corridor between seaports and hinterland markets in Nigeria. Narasimha et al. [
27] investigated the impact of the COVID-19 pandemic on the seaport transport and maritime supply chain sectors in India, and found that the total volume of goods transported declined significantly during the pandemic of the COVID-19. Overall, the global supply chain is severely disrupted by the COVID-19. Dealing with the impact of overseas imported COVID-19 on maritime ports has become a key issue for the sustainable development of global ports and shipping industries.
The assessment of the risk of overseas imported COVID-19 in ports should be of substantial value for developing and optimizing port policies and measures oriented to the prevention and control of COVID-19 spread. However, most current studies are focused on the field of land or air transport rather than maritime transportation. For example, Wu et al. [
15] accessed the risk of the imported COVID-19 cases through air transportation in various cities in the Zhejiang province, and also estimated the importation risks of source COVID-19 countries. Similarly, Hu et al. [
16] used the Baidu Migration and Immigration Index to calculate the cumulative risk of importation of COVID-19 in several cities of the Guangdong province and to assess the risk of COVID-19 importation. Wang et al. [
28] introduced a data-driven approach to dynamically assess the daily risk of a ship being infected by COVID-19, and derived 14-day cumulative ship exposure indices based on country-level data, such as population density, cumulative confirmed cases, and the increased rate of confirmed cases. However, risks were evaluated at the individual ship level, and the issue of addressing infection risks of imported COVID-19 at maritime ports is still not fully addressed.
3. Data and Methods
3.1. Overall Framework
The main purpose of this research is to construct a data-driven model to dynamically assess the COVID-19 infection risk of maritime ports, with the aim to prevent and control the spread of COVID-19 from overseas in maritime ports.
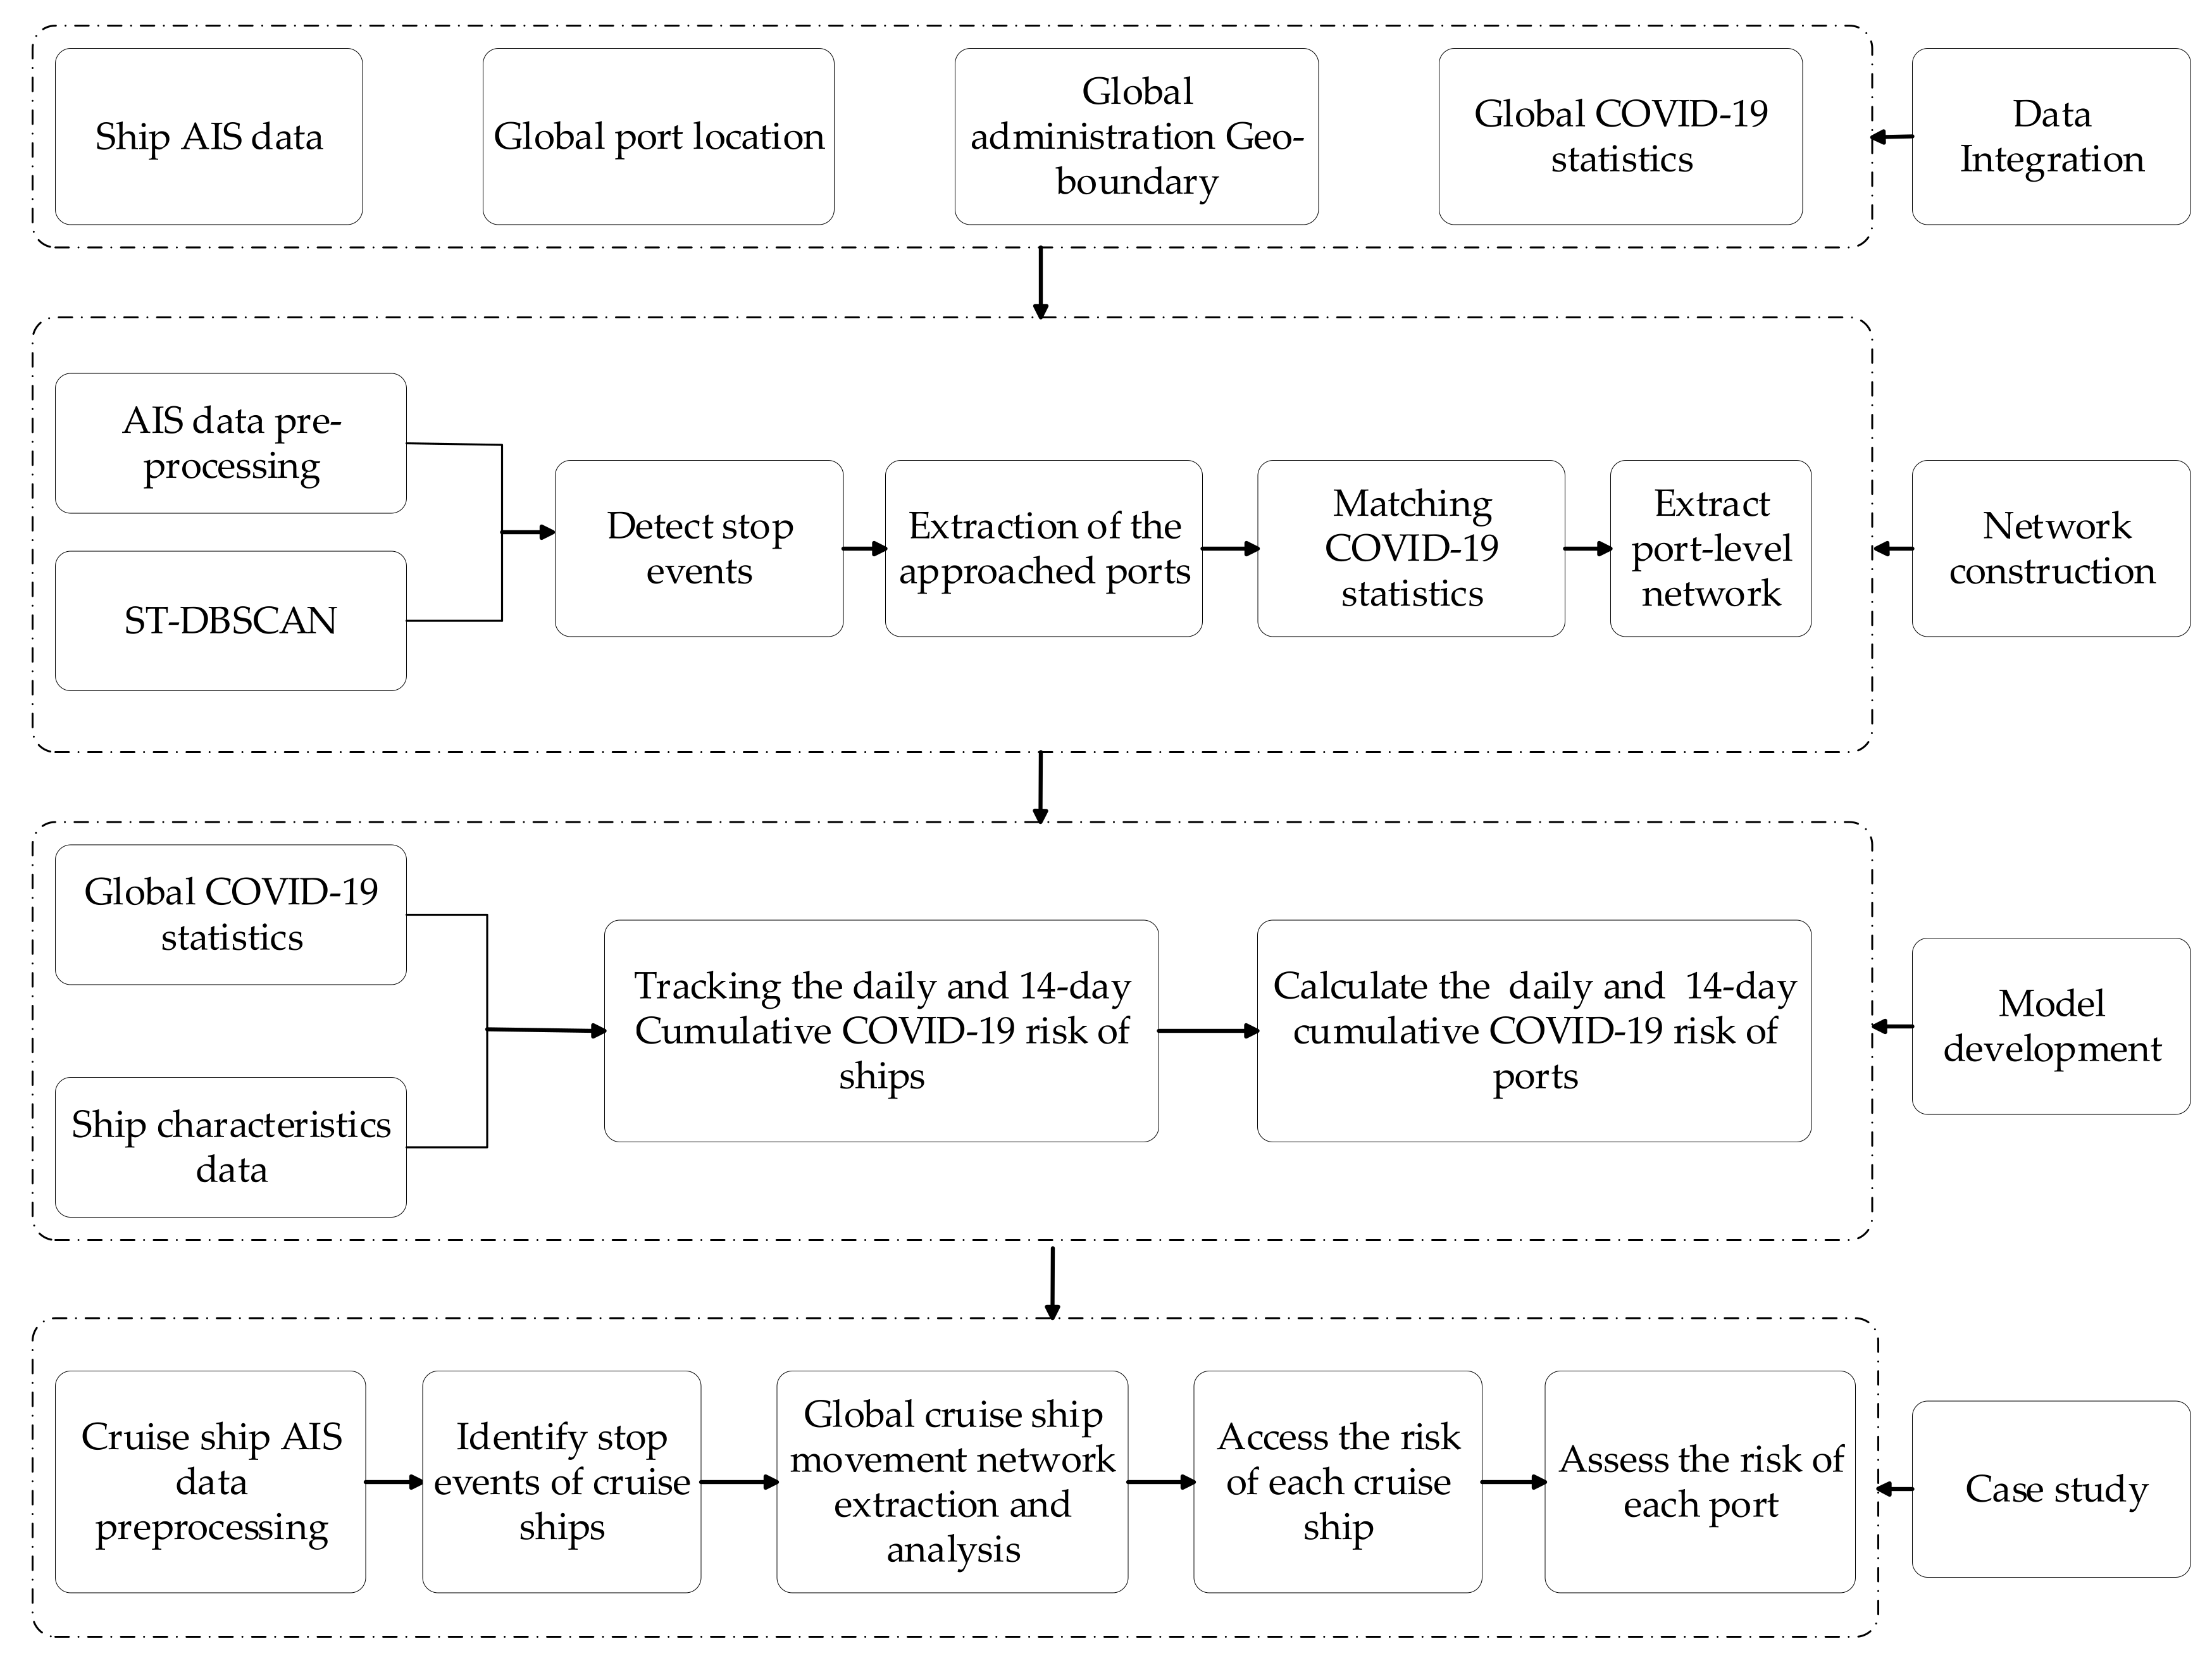
Figure 1 shows our overall research framework which is mainly divided into four complementary steps, including data integration, port-level shipping network extraction, port risk model development, and cruise ship case study.
As shown by
Figure 1, AIS ship data are first considered as an input to automatically identify ship stop events using the spatial–temporal density-based spatial clustering of applications with noise (ST-DBSCAN) algorithm. ST-DBSCAN is an unsupervised machine learning method based on spatial–temporal density that has been applied to the automatic identification of the berth stops of ships [
29]. Berth stops are further matched to the nearest ports and countries based on their distance to the port shoreline. As a result, the port call sequence and visit dates of each ship are extracted. By taking the ports as nodes, the direct travel between two ports as edges, and the travel frequency of each edge as the weight, a ship movement network is constructed.
Given the port call dates of each ship, the COVID-19-related statistics of the countries of the visited port could be matched. These data evaluate the severity of the pandemic of the COVID-19 in these countries. A daily COVID-19 risk index for the ship and a cumulative risk index for the past 14 days can be derived. By adding up the cumulative risk indices of all ships approaching the same port at a specific date, an index of the risk of overseas imported COVID-19 can be calculated.
Cruise ships are used as an example to validate the proposed method. AIS data of cruise ships are firstly extracted, and cluster analysis is performed using ST-DBSCAN to extract the stops of each cruise ship. Then, the approached port and countries of each ship are identified and matched with the COVID-19 data of each country based on the port call dates. The COVID-19 data of each country approached are used to calculate the overseas imported COVID-19 risk of ships and maritime ports.
3.2. Data Sources
This study requires four global-scale datasets, including the Global Cruise Ship AIS Dataset, the Global Major Port Location Dataset, the Global COVID-19 Infection Dataset, and the Global Administrative Boundary Dataset.
The first dataset is the worldwide ship AIS data, which is obtained from hifleet.com, an AIS data provider in Shanghai, China. All AIS data are stored in csv files with one file for an individual ship. The AIS data are primarily used as input to the ST_DBSCAN algorithm for identifying the berth position of each ship. A ship’s AIS point typically includes the ship’s maritime mobile service identity (MMSI), a timestamp of the time when the AIS message was generated, the latitude and longitude, and the speed over ground. AIS data are usually updated every few seconds or minutes in response to changes in speed and heading. Ship trajectories can be expressed as a series of AIS points arranged in chronological order.
The second dataset is a global dataset of approximately 3600 major maritime ports associated with geographic locations, which is maintained by the National Geospatial-Intelligence Agency (NGA) and publicly available. This port dataset mainly includes the port’s unique identification number, port name, its latitude and longitude, and the name of the country in which the port is located and many other features. This dataset helps to calculate the ports and countries visited by each ship.
The third dataset is the global COVID-19 statistics updated on a daily basis. This dataset is primarily derived from the global COVID-19 statistics maintained by the Center for Systems Science and Engineering (CSSE) at the Hopkins University in the United States, which is one of the most authoritative datasets available for COVID-19 studies. The dataset includes daily and cumulative numbers of confirmed, dead, and recovered cases of COVID-19 from 22 January 2020 up to now for each country worldwide. In addition, a publicly available R language package,
tidycovid19, offers functions to download COVID-19-related data. These data are developed to a standard resource for researchers interested in assessing the global spreading of the virus. The data are provided at country and sub-country levels [
30].
The final dataset concerns the global administrative boundaries. This dataset provides country-based geographical data, including data at the provinces or states, cities, districts, and counties levels with a high spatial resolution. The dataset is maintained primarily by the University of California and is freely available for academic and other non-commercial use. It includes 386,735 administrative areas worldwide, with a total data volume of 3.54 GB. This dataset is stored in gpkg format. In this study, this dataset can help identify global ship berth stop events.
3.3. Identification of Approached Ports and Countries
This section describes the detailed steps of the integration of AIS data and application of the ST-DBSCAN algorithm to identify the ports and countries approached by a ship. The main process is similar to the process proposed by Wang et al. (2020) [
28]. The main procedure to identify the approached ports and countries is shown in
Figure 2.
The first step is to automatically extract the stop events of a ship. A stop event refers to the location (e.g., berth, anchorage) where a ship will stay for several hours or even days. An AIS message is usually updated every 3 min when a ship is at a berth or an anchorage. However, it will be updated every 2–3 s when sailing at high speed. Therefore, the density of AIS points near stop locations is relatively higher than at other locations. Ship stop events can be detected by identifying these high-density areas. To identify the ship’s stopping location in both space and time, the ST_DBSCAN algorithm is applied to detect ship stops since it can consider both spatial and temporal properties. The ST-DBSCAN algorithm mainly consists of the following parameters: . The first parameter represents a set of trajectory points. and refer to the minimal distance of two points to form a cluster in space and time dimension, respectively. represents the minimal number of points within the and distances to form a cluster. After setting these parameters and running the ST-DBSCAN algorithm, a series of clusters of ship stops can be identified. The AIS trajectory points for each stop are then arranged in chronological order, and the timestamps of the first and last points are taken as the start and end time of each stop, respectively.
The next step distinguished a stop from berth stops and other stops. We firstly computed the shortest distance between a stop and the land coastline. If the distance is less than a distance threshold, the stop will be considered as a berth stop. The GADM dataset was used to calculate the shortest distance for each stop. Considering the berth locations typically closer to the coastline than these of anchorages, this study assumes that if the distance of a stop is less than 2 km, it will be a berth stop [
28]. After that, the global port dataset is employed to find the ports and countries that a stop may be associated with. We calculated the distances between all berth stops and ports. For a specific stop, the nearest port would be the one in which it is located. Thus, the ports and countries that the ship approached could be identified. It is important to consider a ship stopover duration of a given cruise in a given port, because a longer stopover leads to a higher risk for that port. We also calculate the stopover duration at each port.
Finally, the sequence of voyages of each ship can be considered as a small network, where the nodes denote the terminals, ports, or countries visited by the ship, and links denote the direct voyages between these ports. A port-level shipping network could be developed by integrating the port-level networks of all ships [
31].
3.4. Calculate the Port’s Overseas Imported COVID-19 Risk Index
The risk of the importation of the COVID-19 is influenced by several factors and could be computed in two steps. The first step is to calculate the daily and the 14-day cumulative indexes for each ship based on the COVID-19 statistics of approached countries. The second step is to compute the daily and 14-day cumulative indexes of a port at a specific date based on the risk indexes of all ships which visited the port at the same date. Wang et al. (2020) [
28] described in detail the calculation process of a container ship’s daily and 14-day accumulative risk index. In this paper, we mainly focus on the risk of the ports. We first introduce the model to access the risk of a ship being infected by the COVID-19, which is a little bit different from the model proposed by Wang et al. (2020) [
28] by taking the number of confirmed cases, the population of the approached countries, the deadweight tonnage (DWT) of the ship, and the increased rate of the confirmed cases into consideration. Equation (1) calculate the 14-day cumulative risk of ship
j at date
t:
takes into account the route of ship
j during the past 14 days. So when a ship makes a stopover in a given port for several days, the
will increase. The
denotes the 14-day cumulative risk index of ship
j at the date
. Equation (2) denotes the proportion between the new confirmed cases and country population, which is further normalized to a scale of 0–100. Equation (3) calculates the risk of ship
j at date
t:
where the
and
denote the total number of confirmed cases at the date
and
, respectively, and
denotes the number of the new confirmed cases at date
.
refers to the ratio of new confirmed case to country population in port
at date
. These data could be downloaded from the Johns Hopkins University CSSE Github via the R package tidycovid19 based on the country name and the date of visit.
indicates the population of the country in which the port
is located. As the population base of the city in which the port is located is not yet available, we use the country population instead. Given that the risk of infecting the COVID-19 is positively correlated with the number of passengers of a ship, the number of passengers is added to Equation (3).
indicates the number of passengers of the ship
and
indicates the maximum number of passengers of all ships.
The
refers to the adjustment factor of increase rate of the confirmed case at the date
t. We assume that the risk level of ships in a certain country with increasing confirmed cases is much higher than that with reducing confirmed cases. The
is then derived as Equation (4) [
28].
where
refers to one day before the date
and
is the number of new confirmed cases at the date
. If the number of confirmed cases decreases at
t, the value will be negative. According to the above formula, the ship COVID-19 exposure index can be dynamically calculated, with higher indexes indicating a higher risk of infection.
The risk of a port exposed to COVID-19 is represented by Equation (5), where the daily risk of port
i at the date
t, represented as
in the formula, is calculated by summing up the risk indexes of all of the ships visiting the port at the same date.
refers to the 14-day cumulative imported COVID-19 risk index for a port
at a date
, as shown in Equation (6).
With comparison purposes, the 14-day cumulative imported COVID-19 risk index of ports is further standardized based on the methods proposed by Hu et al. and Wu et al. [
15,
16]. As shown in Equation (7), the cumulative risk index is standardized to produce a sub-index score between 0 and 100, where each full point on the ordinal scale is equally spaced. Therefore, the port risk index
is normalized as follows.
where
is the cumulative epidemic risk index for a port
at the date
;
and
are the minimum and maximum risk index of each port for all assessment dates, respectively; and
is the normalized values of the imported COVID-19 risk of port
i at the date
t.
4. Case Study
In this section, we take cruise ships as examples to evaluate the proposed risk assessment model. AIS data and cruise ships data are obtained from hifleet.com. In 2020, 25,180,474 AIS data points of 421 cruise ships with a total data volume of 1.33 GB are used. A computer server with an Inter Xeon CPU of 2.60 GHZ, 16 cores, and 64 RAM are employed to parallelly process data.
The distribution of the gross tonnages of the cruise ships is shown in
Figure 3. As shown, almost half of the cruise ships are small cruise ships with the gross tonnage below 30,000 tons. In addition, there are 65 cruise ships located in the range of 30,000–70,000 tons, 78 cruise ships located in the range of 70,000–100,000 tons, and 72 giant cruise ships larger than 100,000 tons.
Not all AIS points have the same value in identifying cruise stops. Points with lower speed are more likely to denote a stop event. Therefore, AIS points with a speed of less than 1-knot are extracted for analysis. A total of 10,754,194 such trajectory points is selected and represents nearly half of the total data volume. These AIS points are used as input to the ST-DBSCAN algorithm to automatically identify ship stops. In order to improve the calculation speed of the ST-DBSCAN algorithm, AIS points for each ship are grouped into several subgroups and to keep the data volume of each subgroup small enough so that the ST_DBSCAN algorithm can quickly converge. We assume that, for an individual cruise ship, if the time interval between two trajectory points is greater than 5 h, they will be divided into two subgroups. The amount of data in each subgroup is counted. If the number of AIS points in a subgroup is greater than 10,000, this subgroup will be further divided into small groups until the number of each group is satisfied with the threshold of 10,000. The ST-DBSCAN algorithm then applies to each group to identify ship stops.
Considering that the distance between two consecutive AIS points is quite close when a ship stops at a terminal or anchorage, the length of a cruise ship is usually around a few hundred meters. This study set the second parameter eps1 to 0.005 degrees, approximately 500 m. Similarly, we set the value of the third parameter eps2 to 2 h, as the time interval between ship stops at two terminals is generally much greater than 2 h. This indicates that, when the time interval between two AIS points exceeds 2 h, the two points will not be in the same stop cluster. In order to identify ship stops at some locations with poor AIS signal coverage, we set the fourth parameter MinPts to 2. This means that two or more data points can form a stop event if the time interval between any two AIS points is less than 2 h and the distance between the two AIS points is less than 0.005 degrees. Although these stop events have been identified, it is still necessary to remove the anchorage stop events to identify the ports visited by the ships. Finally, we identified 127,830 berth stops for all cruise ships, with an average of 303 stops per cruise ship.
It is worth noting that a cruise ship may visit a port or country more than once, and there may be multiple stop events during a given visit. Therefore, the stopovers of each ship are ranked in chronological order. Stopovers during the same port call are grouped. Network edges and weight between two ports are extracted from ship travels between ports. As a result, a shipping network of cruise ships is developed with 477 port nodes and 2888 edges.
Figure 4 shows the global port-level network of 421 cruise ships identified in 2020, where the color of a port node refers to the total degree of the port and the thickness of an edge represents the scale of traffic volume between two ports. As shown in
Figure 4, Europe and North America, particularly the Caribbean, are the regions with the highest concentration of cruise ports and the densest set of itineraries.
Figure 5 shows a map of the local cruise ship movement network in western Europe.
Figure 6 shows the distribution of the standardized risk index of all cruise ports throughout the year. It indicates that most of the port risk values are between 40 and 80, peaking at 60, while only a few of them are located in the ranges of 0–40 and 80–100.
According to our calculation, the highest risk in the year of 2020 is November 16. Therefore, we take this date as an example to investigate the top risk ports and their geographic distribution.
Table 1 shows the top 20 ports with the highest standardized cumulative risk index ranging from 80 to 100 on 16 November 2020. These risk values, although quantitative, give a sort of general evaluation of COVID-19 infection risks at different times and port locations. Thus, they might be indeed mapped to qualitative values, such as moderate to high risks, accordingly. The high-risk ports are mainly located in Italy, France, Spain, United Kingdom, and the United States, which matches with national COVID-19 trends at that time.
Figure 7 shows the imported COVID-19 risks of cruise ports worldwide, as of 16 November 2020.
Five hundred and five ports with a null risk index are removed from the graph for visualization purposes. As seen from the graph, ports in the United States, Bahamas, and many European countries are at high risks of imported COVID-19 cases. For instance, the port of Civitavecchiain in Italy had the highest COVID-19 risk on 16 November. The continued increase in newly confirmed cases per day since autumn and winter in Italy, France, Spain, and United Kingdom contributes to the pandemic in this area. These European ports also show a medium to high risk due to a rebound of the COVID-19 in European countries. There is significant variation in the pandemic situation between regions over time.
Figure 8 compares the overseas imported COVID-19 risk at the local cruise ports in western Europe on 16 November 2020.
Figure 9 shows the evolution of imported COVID-19 risks of the port of Civitavecchia in Italy and the port of Miami in the United States over the year 2020. The port of Civitavecchia is a major cruise and ferry port, and the main starting point for sea connection from central Italy to Sardinia, Sicily, Tunis, and Barcelona. The port of Miami boasts the title “cruise capital of the world”, and is the busiest cruise/passenger port in the world. Over 5.5 million cruise passengers pass through the port each year. As shown in
Figure 9, COVID-19 risks in the port of Civitavecchia experienced a fluctuation in April–May 2020, due to the lockdown policy implemented by Italy at that time, and then continued to rise and peak for a year after mid-October. However, the pattern of the port of Miami is quite different from the pattern of the one of Civitavecchia; the risk grows sharply from March to April, maintains in a very high risk around 80, and peaks at July. After that, the risk goes down quickly to hit a local bottom at the end of July, gradually rebounds, peaks at October, and then maintains the risk level over the rest of the year.
5. Conclusions
As the key hubs of the global logistics and supply chain, ports are continuously exposed to the risk of overseas imported COVID-19 cases. This paper introduces a risk assessment model of ships and maritime ports based on ship movement data, global COVID-19 outbreak data, and ship characteristics data, which can dynamically track the risk of COVID-19 in ships as well as ports. The main contributions of this research are as follows: (1) the proposed model and method for assessing the risk of overseas imported COVID-19 cases in ports can effectively bridge the shortcomings of research on maritime COVID-19 prevention and control; (2) the estimated dynamic risk indexes of ships and ports have the potential to provide decision support to policymakers, shipping companies, port terminals, and customs in different countries, which might contribute to a better control the worldwide spread of COVID-19; (3) the proposed data-driven risk estimation method fully exploits the value of the global ship AIS data and COVID-19 infection data, which could track the risk of overseas imported COVID-19 of an individual ship, individual port, or even the whole shipping network, helping to reveal the global spread trend of the COVID-19 from the maritime perspective.
However, there are still many directions for further improvement in our modelling and computational approach. Firstly, the proposed risk assessment model of ships could be further improved by considering more detailed context-based data. COVID-19 ship infection risks may be related to prevention and control measures taken by the ports at the local level, the number of confirmed cases and the volume of cold-chain products on ships, and city-level confirmed cases and population. Our model could be further updated once when additional micro-level data are available.
Secondly, the methodology could be further extended to other ship types. While we mainly focused on estimating the risk of cruise ships and ports, the method can be also applied to other types of ships, such as container ships and bulk ships.
Thirdly, future research may emphasize investigating the dynamic risk of the global shipping networks by developing a dynamic network-level COVID-19 risk monitoring model, analyzing the global maritime risk transmission, and making COVID-19 prevention and control measures under different COVID-19 spread scenarios.
Finally, another related research direction left that can also take benefits of our modelling approach is to investigate the potential impact of the global COVID-19 pandemic on shipping CO2 emissions at the global and regional scales and at different time scales.


