Article

Spatial Patterns of Urban Innovation and Their Evolution from Perspectives of Capacity and Structure: Taking Shenzhen as an Example

1
School of Geography, Nanjing Normal University, Nanjing 210023, China
2
Key Laboratory of Virtual Geographic Environment, Ministry of Education, Nanjing Normal University, Nanjing 210023, China
3
Jiangsu Center of Collaborative Innovation in Geographical Information Resource Development and Application, Nanjing 210023, China
4
School of Resources and Environment, Anhui Agricultural University, Hefei 230036, China
*
Author to whom correspondence should be addressed.
ISPRS Int. J. Geo-Inf. 2022, 11(1), 7; https://doi.org/10.3390/ijgi11010007
Submission received: 3 November 2021 / Revised: 16 December 2021 / Accepted: 26 December 2021 / Published: 28 December 2021

Abstract

:
Innovation is a key factor for a country’s overall national strength and core competitiveness. The spatial pattern of innovation reflects the regional differences of innovation development, which can provide guidance for the regional allocation of innovation resources. Most studies on the spatial pattern of innovation are at urban and above spatial scale, but studies at urban internal scale are insufficient. The precision and index of the spatial pattern of innovation in the city needs to be improved. This study proposes to divide spatial units based on geographic coordinates of patents, designs the innovation capability and innovation structure index of a spatial unit and their calculation methods, and then reveals the spatial patterns of innovation and their evolutionary characteristics in Shenzhen during 2000–2018. The results show that: (1) The pattern of innovation capacity of secondary industry exhibited a pronounced spatial spillover effect with a positive spatial correlation. The innovation capacity and innovation structure index of the secondary industry evolved in a similar manner; i.e., they gradually extended from the southwest area to the north over time, forming a tree-like distribution pattern with the central part of the southwest area as the “root” and the northwest and northeast areas as the “canopy”. (2) The pattern of innovation capacity of tertiary industry also had a significant spatial spillover effect with a positive spatial correlation. There were differences between the evolutions of innovation capacity and innovation structure index of tertiary industry. Specifically, its innovation capacity presented a triangular spatial distribution pattern with three groups in the central and eastern parts of the southwest area and the south-eastern part of the northwest area as the vertices, while its innovative structure showed a radial spatial distribution pattern with the southwestern part of the southwest area as the source and a gradually sparse distribution toward the northeast. (3) There were differences between the evolution modes of secondary and tertiary industries. Areas with high innovation capacity in the secondary industry tended to be more balanced, while areas with high innovation capacity in the tertiary industry did not necessarily have a balanced innovation structure. Through the method designed in this paper, the spatial pattern of urban innovation can be more precise and comprehensive revealed, and provide useful references for the development of urban innovation.

1. Introduction

In the context of knowledge-based economies, innovation has become a major driving force for economic growth and improved living standards, playing a vital role in national economic development [1,2]. The spatial pattern of innovation refers to the spatial distribution or allocation of factors such as innovation subjects, activities, and resources, reflecting the regional differences in innovation development [3,4,5]. Research on the spatial patterns of innovation reveals the spatial distribution characteristics of innovation factors and can provide scientific guidance for the optimal allocation of innovation resources as well as promote the development of innovation and the construction of an innovative country.
According to the spatial scale of the study, existing studies on the spatial patterns of innovation are mainly carried out at the global scale, administrative scale, and intraurban scale [6,7,8]. Studies at the global scale usually take countries as research units [9,10], while studies at the administrative scale usually take administrative regions such as states (provinces), cities, and counties as research units [11,12,13,14]. Xu et al. studies the spatial pattern of collaborative innovation in the Yangtze River Delta urban agglomeration by county [15]. Most of these studies regard the research space unit as a whole and substitute the surface with the point to analyze from the macro perspective. A more microscopic spatial perspective is needed in the study of intraurban scale. Some studies on the spatial patterns of innovation at the intraurban scale take intraurban units (e.g., streets) as research units and use Thiessen polygons or grids for the unit division. Li et al. divides the city interior into several hexagonal grids of one square meter to analyze the spatial distribution of innovation activities in Shanghai [16]. Duan et al. divide the internal spatial scope of Beijing and Shanghai using Thiessen polygons based on urban postcodes, and study the spatial patterns and evolution pattern of innovation [17]. The above analysis shows that studies on the spatial pattern of innovation at urban interior scale is still insufficient, and the precision of the spatial pattern of innovation in urban interior needs to be improved.
In terms of the indicator, the spatial distribution differences of innovation capacity are usually used to describe the spatial patterns of innovation [18,19,20]. As one of the main outcomes of enterprise innovation activities, the number of patents is significantly correlated with innovation capacity and can reflect the innovation capacity of a region [21,22,23]. Moreno et al., based on the number of patents, found that European innovation activities between 1978 and 2001 were mainly concentrated in the northern and central regions, showing a trend of gradual evolution toward the south [11]. Brian studied the spatial pattern of industrial innovation in each continent of the United States based on patent data. The results show that from 1978 to 1998, the growth rate of industrial innovation capacity of the southern states in the United States grew faster than that of the northeastern states [12]. Paci et al. analyzed the pattern of innovation in Italy, concluding that there is an innovation spillover effect between cities and that local industrial innovation is influenced by the same industrial innovation activities in neighboring areas [15]. Gonçalves et al. developed an empirical model relating the number of patents per capita and innovation-related factors, through which they found that factors such as the industrial base, urban environment, and technological infrastructure have an important impact on the evolution of the spatial patterns of innovation in Brazil [16]. However, the innovation activities of enterprises in different industries are different [24,25,26,27]. Different industries combine and agglomerate spatially to form an innovative industrial cluster, which in turn characterizes the evolution mode of urban innovation development [28,29,30,31,32]. Therefore, it is necessary to comprehensively describe both the innovation capacity and the innovation structure in the study of innovation spatial pattern at any spatial scales.
To address the issues in the above studies, dividing the city interior and measuring the complexity of innovation industrial structures and the innovation capability of each industry within each research unit is a feasible approach. By taking Shenzhen, a typical innovation-oriented city in China, as the research area, this study divides its intraurban space into units based on geographic coordinates of patents and evaluates the innovation capacity and innovation structure of each unit based on the patent data as a design index. Using methods such as the Moran index and standard deviational ellipse, we reveal the spatial patterns of innovation capacity and innovation structure as well as their evolutions in various industries in Shenzhen from 2000 to 2018, compare the spatial patterns of the innovation capacity and innovation structure, and analyze the characteristics of the innovation evolution modes of different industries, with the goal of providing a new perspective for the study of the spatial pattern of innovation and offering a targeted reference for the spatial planning of innovation industrial clusters and innovation factors.

2. Data Description and Processing

2.1. Description of Data for Innovation Evaluation

This study takes Shenzhen as the research area. Shenzhen is situated in southern part of China’s Guangdong Province and adjacent to the Hong Kong Special Administrative Region of China, and it was the first special economic zone established in China. In the world ranking of innovative cities published by the Innovation Cities™ Index (2010–2018), Shenzhen was not ranked in the top 100 in the world in 2010, but rapidly rose to the 55th place in the world in 2018, with its innovation city level also upgraded from a node to a hub.
The patent data used in this study were derived from the Wanfang Data Knowledge Service Platform, which is a first-class publishing and service platform of digital information resources in China. The search resulted in a total of 414,055 patents from 11,259 enterprises in Shenzhen during 2000–2018. Each piece of patent data includes abstract, patent type, application date, classification number, applicant/patentee, inventor/designer, address of main applicant, country/province code, and other information. The address of main applicant describes spatial location information of patent. According to the industries of the patentees and referring to the Industrial Classification for National Economic Activities (GB/T 4754-2011), the enterprises with patents in Shenzhen are divided into three level-1 industries (the primary industry, secondary industry, and tertiary industry) and 76 level-2 industries. There are 111 patents in the primary industry, 306,925 patents in the secondary industry, and 107,119 patents in the tertiary industry. In view of the small number of patents in the primary industry, this study discusses only the innovation patterns and their evolution in the secondary and tertiary industries.
During 2000–2018, the numbers of patents in the secondary and tertiary industries in Shenzhen both showed an upward trend. In our analysis, we divide this period into four phases: In the period of 2000–2004, the numbers of patents in the secondary and the tertiary industries were small and did not differ much; in the period 2005–2009, the number of patents in the secondary industry increased and exceeded that in the tertiary industry; and in the period 2010–2018, the number of patents in the secondary industry increased rapidly and increased the gap with the number of patents in the tertiary industry. In terms of the number of patents in each subindustry, the subindustry of the secondary industry with the largest number of patents in each stage was the electronics manufacturing industry, for example, computer and communication equipment manufacturing. During 2010–2018, the proportion of the number of patents in the electronics manufacturing industry began to decrease, and regarding the evolution of the number of patents in the secondary industry, the gap between the numbers of patents in different industries gradually narrowed, and thus, the composition structure tended to be balanced. The subindustry of the tertiary industry with the largest number of patents in each stage was the software and information technology service industry. During 2005–2018, the overall number of patents in the tertiary industry increased continuously, and the proportion of the number of patents in the software and information technology service industry did not increase significantly. The number of patents linked to the Internet and related services grew significantly, and the proportions of the numbers of patents in other subindustries lagged far behind those of the first two subindustries (Figure 1).

2.2. Spatialization of Patent Data

In this study, the addresses of principal applicants or patentees in the patent information are geocoded to obtain the spatial coordinates. The geocoding process employs the web application programming interfaces provided by Amap. Amap is a well-known web map service provider in China, which can obtain geographic information of 80 percent of the data. Because the geocoding database of Amap is not updated in time, the geographic information of the new enterprise patent relies on manual acquisition of the nearest address which can be geocoded. The geocoded patent data are spatially represented as a large number of discrete points, which is not conducive to the analysis of spatial patterns. Hence, it is necessary to divide the study area into multiple areal spatial units according to certain rules and then to assign the discrete point data to the areal spatial units. In this paper, ArcGIS software is used to calculate the distance between patent points data and grid range coordinates, and patent points are allocated to the nearest grid. To select the unit size, the experience of spatial sampling optimization is referenced [33,34]. According to the size of the study area and the number of study data points, the size of the spatially divided grids is calculated using the following (Equation (1)):
I = 2 A r e a N u m
In Equation (1), I is the side length of the grid used for spatial division, Area is the area value of the study area, and Num is the number of discrete points.
The region under the jurisdiction of Shenzhen in 2019 had an area of 1997.47 km2, which is taken as the area value of the study area. A square grid with a side length of 600 m is used for the spatial division considering the study data of 11,259 enterprise points.

3. Method

3.1. Innovation Capacity Index of a Spatial Unit

The logarithm of the sum of the number of patents of each industry in a spatial unit is used as an index to measure the innovation capacity of the spatial unit. The larger the index value, the higher the innovation capacity of the spatial unit; conversely, the smaller the index value, the lower the innovation capacity of the spatial unit. This index is calculated as follows:
I C = ln ( i = 1 n P i + 1 )
In Equation (2), IC is the innovation capacity index of the spatial unit, n is the total number of industry types associated with the spatial unit, and Pi is the average annual number of patent outputs associated with industry i in this spatial unit.

3.2. Innovation Structure Index of a Spatial Unit

This study introduces the Shannon–Wiener index to design an innovation structure index to measure the complexity or diversity of the innovation industry structure [35,36]. The larger the index value is, the closer the innovation capacities of different industries in the spatial unit, and the more balanced the innovation industry structure. Conversely, the smaller the index value, the more different the innovation capacities of different industries in the spatial unit, and the more homogeneous the innovation industry structure. This index is calculated using the following Equation:
I S = i = 1 n R i ln ( 1 R i )
( R i = P i j = 1 n P j )
In Equations (3) and (4), IS is the innovation structure index of the spatial unit and Ri is the proportion of the average annual number of patents of industry i in the total average annual number of patents of that spatial unit.

3.3. Spatial Autocorrelation Analysis

Innovation has a spatial spillover effect; i.e., innovation capacity is influenced by the innovation activities in the surrounding regions, and there is spatial correlation, with certain characteristics of spatial agglomeration [37,38]. In this study, the spatial agglomeration patterns of innovation capacity in different stages are quantitatively evaluated by calculating the global Moran index, which can measure the spatial correlation of factors. The value range of the index is [−1.1]. The closer the value is to 1, the more the units with similar innovation capacity tend to agglomerate, reflecting positive spatial correlation. The closer the value is to 0, the lesser the degree of agglomeration and the more random the spatial distribution. The closer the value is to −1, the more the units with different innovation capacities tend to agglomerate, reflecting negative spatial correlation. The global Moran index is calculated as follows:
Moran s   I = i = 1 n j i n W i j Z i Z j σ 2 i = 1 n j i n W i j ,   ( Z i = I C i I C ¯ σ , P ¯ = 1 n i = 1 n I C i ,   σ = 1 n i = 1 n ( I C i I C ¯ ) 2 )
In Equation (5), n is the total number of regions, Wij is the spatial weight matrix, ICi is the innovation capacity index of unit i, and Zi and Zj are the normalized standard deviations of innovation capacity indexes ICi and ICj, respectively.
The local Moran index can identify the spatial agglomeration types of factors. In this study, the local Moran index is calculated based on the innovation capacity index of the spatial unit, and accordingly, the spatial units are classified into four agglomeration types, namely, high-high, high-low, low-high, and low-low. The high-high agglomeration type indicates that all the units in this region have a high innovation capacity, i.e., a cluster composed of spatial units with a high innovation capacity, which can be regarded as an innovation hotspot. The local Moran index is calculated as follows:
Local   Moran s   I = Z i W Z ,   ( W Z = j = 1 n W i j ( I i I ¯ ) σ )
In Equation (6), WZ is a spatial lag variable that reflects the degree of variation in the value of the area around the region from the mean.

3.4. Analysis of Spatial Distribution Characteristics

The standard deviational ellipse can reflect the spatial distribution characteristics of spatial factors [39,40]. The center of the ellipse is the weighted average center of the spatial factors and is calculated as follows:
X w ¯ = i = 1 n w i x i i = 1 n w i     Y w ¯ = i = 1 n w i y i i = 1 n w i
In Equation (7), where X w ¯ and Y w ¯ are the coordinates of the weighted average center, xi and yi are the coordinates of factor i, and wi is the weight of factor i.
The semimajor axis of the ellipse represents the direction of the data distribution. Its direction is based on the X-axis, with due north representing 0 degrees and clockwise rotation. This axis is calculated as follows:
tan θ = A + C B
A = i = 1 n x ˜ i 2 i = 1 n y ˜ i 2
B = 2 i = 1 n x ˜ i y ˜ i
C = A 2 + B 2
In Equations (8)–(11), x ˜ i and y ˜ i are the coordinate differences between the center of the ellipse and factor i.
The greater the difference between the lengths of the major axis and the minor axis, the flatter the ellipse is, indicating more directionality in the spatial distribution of the factors; the closer the lengths of the major axis and the minor axis, the rounder the ellipse is, indicating less directionality in the spatial distribution. The major axis and the minor axis are calculated as follows:
σ x = 2 i = 1 n ( x ˜ i cos θ y ˜ i sin θ ) 2 n
σ y = 2 i = 1 n ( x ˜ i sin θ + y ˜ i cos θ ) 2 n
In Equations (12) and (13), where σ x and σ y are the lengths of the major axis and minor axis of the ellipse, respectively.

4. Spatial Pattern of the Innovation Capacity and Its Evolution

4.1. Agglomeration Pattern of the Innovation Capacity and Its Evolution

During 2000–2018, the global Moran index for the innovation capacity of secondary industry was positive and thus indicated a positive spatial correlation. The index value increased rapidly during 2000–2014; during 2015–2018, the growth rate slowed, and the spatial correlation increased. Taking the center of the administrative region of Shenzhen (114.185, 22.651) as the origin, Shenzhen is divided into four areas: southwest, northwest, southeast, and northeast. The high-high agglomeration unit of the innovation capacity of the secondary industry showed an evolutionary process of rapid expansion from the southwest area as the origin to the northwest and northeast areas. This process can be divided into expansion and mature phases according to the agglomeration index and expansion rate (Figure 2).
The period 2000–2014 was the expansion phase of the innovation agglomeration pattern of the secondary industry, with the global Moran index rapidly increasing from 0.136 to 0.307. Meanwhile, influenced by the spillover effect of innovation, the low-low, low-high, and high-low agglomeration types were continuously transformed into the high-high agglomeration type. The high-high agglomeration groups composed of high-high agglomeration units increased rapidly in number and spread to the surrounding areas from the southwest area as the source. During 2000–2004, the high-high agglomeration units mainly appeared in the southwest area, constructing the initial form of the innovation core of the secondary industry of Shenzhen in the central part of the southwest area. During 2005–2009, the high-high agglomeration groups in the southwest area extended to the surrounding area, expanding southward to the southwestern corner of Shenzhen and crossing northward the boundary between the southwest and the northwest, and a small number of high-high agglomeration groups appeared in the northwest area. During 2010–2014, the gap between the numbers of high-high agglomeration groups in the southwest area and the northwest area narrowed significantly, and the agglomeration pattern showed a balanced distribution in the western area. During this period, a small number of high-high agglomeration groups also appeared in northeast area but far fewer than those in the northwest area, while no high-high agglomeration groups appeared in the southeast area, indicating that the innovation development of the secondary industry in Shenzhen was still dominated by that in the western area, and the distribution was characterized by being “strong in the west and weak in the east”.
During 2015–2018, the innovation agglomeration pattern of the secondary industry entered the mature phase. The global Moran index increased from 0.307 to 0.344, showing a significantly lower growth rate than that in the previous period of 2010–2014, and the number of high-high agglomeration groups basically stopped increasing, showing a gradually stabilizing agglomeration pattern. However, the groups still maintained the trend of growing to the surroundings, and the size and spatial continuity of the groups were enhanced. In the southwest and northwest areas, multiple high-high agglomeration groups gradually expanded and merged into new large groups. Only in this stage did the first high-high agglomeration group appear in the southeast area, lagging far behind other areas.
During 2000–2018, the global Moran index for the tertiary industry was positive and showed a positive spatial correlation. The global Moran index was low and weakly correlated during 2000–2004; after this, this index steadily increased, and its spatial correlation gradually increased. Different from the secondary industry, which showed the evolutionary trend of the rapid expansion of the high-high agglomeration units to the surrounding areas, the tertiary industry showed a high dependence on the central area and lacked the driving force to develop to the surrounding areas, and hence, it was difficult to form high-high agglomeration groups in areas far from the downtown of the southwest area (Figure 3).
During 2000–2004, only a few high-high agglomeration units existed in the center of the southwest area, and the rest of the areas were almost filled with low-low agglomeration units, indicating that during this period, the tertiary industry in Shenzhen existed almost exclusively in the center of the southwest area and that the innovation capacity of the tertiary industry in the rest of the areas was almost zero.
During 2005–2009, the low-low agglomeration units existed only at the boundary of Shenzhen, while the high-high agglomeration groups were still present in the center of the southwest area, surrounded by low-high agglomeration units and small in scale. Low-high agglomeration units were the most numerous agglomeration units.
During 2010–2014, low-low agglomeration units almost disappeared. Due to the innovation spillover effect, low-high agglomeration units were gradually converted to high-high agglomeration units, and the scale of high-high agglomeration groups in the central part of the southwest area expanded. In the northwest area near the north-south boundary and in the northeast area near the east-west boundary, there were individual high-high agglomeration units, but the high-high agglomeration groups were still mainly concentrated in the central part of the southwest area, lacking the driving force to develop in other areas. A large number of high-low agglomeration units appeared in the northwest area and were scattered in a dotted manner throughout the northwest area except its central part.
During 2015–2018, the high-high agglomeration units continuously encroached on the surrounding low-high agglomeration units, the scale of the high-high agglomeration groups in the southwest area continued to increase, and small-scale high-high agglomeration groups also appeared in the northwest area near the north-south boundary. The number of high-low agglomeration units in the northwest area increased, filling the previous gap in the central part of the northwest area. A small number of high-low agglomeration units also appeared in the northeast area near the east-west boundary. The southeast area was consistently dominated by low-high or low-low agglomeration units (Figure 3).

4.2. Evolution of the Innovation Capacities of Different Areas

The innovation capacity of the secondary industry exhibited the distribution characteristics of being “strong in the west and weak in the east”, and the southwest and northwest areas were always ahead of the northeast and southeast areas in terms of index value and growth rate. During 2000–2009, the average innovation capacity of the units was the highest in the southwest area, followed by those in the northwest area and northeast area, and was the lowest in the southeast area. During 2010–2014, the index value of each area increased rapidly, with that of the northwest area increasing the most and replacing the southwest area as the area with the highest average innovation capacity of the units. The index values of the southwest and northwest areas were much higher than those of the southeast and northeast areas, exhibiting the prominent distribution characteristics of being “strong in the west and weak in the east”. During 2015–2018, the index values of the northwest and southwest areas continued to increase, and the advantage of the western area over the eastern area became increasingly significant; in particular, the index value of the southeast area was far behind those of other areas (Figure 4).
The innovation capacity of the tertiary industry was significantly spatially polarized and consistently dominated by the southwest area by a large margin from 2000 to 2018. The average innovation capacity of the units in the northwest area increased each year and was higher than those of the northeast and southeast areas, which almost had no innovation capacity for the tertiary industry, and their average innovation capacities did not show a significant increase between 2000 and 2018 (Figure 5).

4.3. Spatial Distribution Pattern of the Innovation Capacity

The innovation capacity index of the secondary industry gradually extended from the southwest area to the northwest and eastern areas and exhibited an overall high innovation capacity in the west and weak innovation capacity in the east with a gradual decrease from south to north, forming a tree-like distribution pattern with the central part of the southwest area as the “root” and the northwest and northeast areas as the “canopy” (Figure 6).
In terms of extreme values, during 2000–2004, the extreme-value units for the innovation of the secondary industry appeared in the southwest area near the north-south boundary, while in 2005–2009, the extreme-value units shifted to the central part of the southwest area and formed a cluster-shaped extreme-value group, thus determining the location of the innovation core. During 2010–2018, the innovation core became increasingly advantageous relative to the surrounding units, and its size gradually expanded while its boundary became increasingly clear.
The mean center, with the innovation capacity as the weighting item, can reflect the evolution of the center of the spatial pattern of the innovation capacity. During 2000–2018, the mean center for the innovation capacity of the secondary industry showed a trend of continuous northward movement, gradually crossing the north-south boundary and moving from the southwest area to the northwest area, indicating that the innovation capacity of the northwest and northeast areas was continuously strengthened and that the innovation capacity of the northern area gradually caught up with and surpassed that of the southern area. However, the mean center was still far away from the north-south axis and located in the western area, indicating that the innovation capacity of the western area was always stronger than that of the eastern area.
In terms of spatial distribution characteristics, the area of the standard deviational ellipse of the innovation capacity of the secondary industry increased continuously, indicating that the units with innovation capacity were distributed over an increasingly large range. The ellipse gradually became flatter, indicating that the directional characteristics of the spatial distribution of the innovation capacity of the secondary industry became increasingly significant, with the major axis of the ellipse in the “southwest-northeast” direction during 2000–2009. During 2010–2018, the innovation capacity of the northwest and northeast areas increased; in particular, a large number of units with high innovation capacity appeared in the western part of the northwest area, the direction of the major axis of the ellipse gradually changed to be parallel to the east-west axis, and the distribution direction changed to “east-west”.
The innovation capacity of the tertiary industry was mainly concentrated in the southwest area, and the improvement in the overall innovation capacity mainly relied on the improvement in the innovation capacity of the existing units, lacking the driving force to develop to the surrounding areas. A triangular spatial distribution pattern was formed, with the mean center as the center and three groups in the central and eastern parts of the southwest area and the southeastern part of the northwest area as three vertices (Figure 7).
In terms of extreme values, during 2000–2018, the extreme-value units for the innovation of the tertiary industry all appeared in the southeastern part of the northwest area. These units were an isolated point during 2000–2009 and then gradually formed a group during 2010–2018. However, the scale and density of this group were much smaller than those of the two groups formed in the central and southeastern parts, respectively, of the southwest area. As a result, although extreme-value units with the highest innovation capacity were not formed in the southwest area, the average innovation capacity of the units in the southwest area was much higher than that in the northwest area.
The mean center of the innovation capacity of the tertiary industry did not move notably during 2000–2018 and was always located in the central part of the southwest area, indicating that the innovation capacity of the tertiary industry was inert spatially and temporally and was always dominated by that of the southwest area.
In terms of spatial distribution characteristics, the area of the standard deviational ellipse of the innovation capacity of the tertiary industry did not increase significantly and even decreased during 2005–2009, indicating that the innovation of the tertiary industry lacked the driving force to develop to the surroundings and that the units far from the center could not achieve high growth in innovation capacity. During 2000–2004, the major axis of the ellipse was in the “southwest-northeast” direction. During 2005–2018, the innovation capacity of the eastern part of the southwest area gradually increased, and the direction of the major axis of the ellipse rotated clockwise but still maintained the “southwest-northeast” direction.

5. Spatial Pattern of the Innovation Structure and Its Evolution

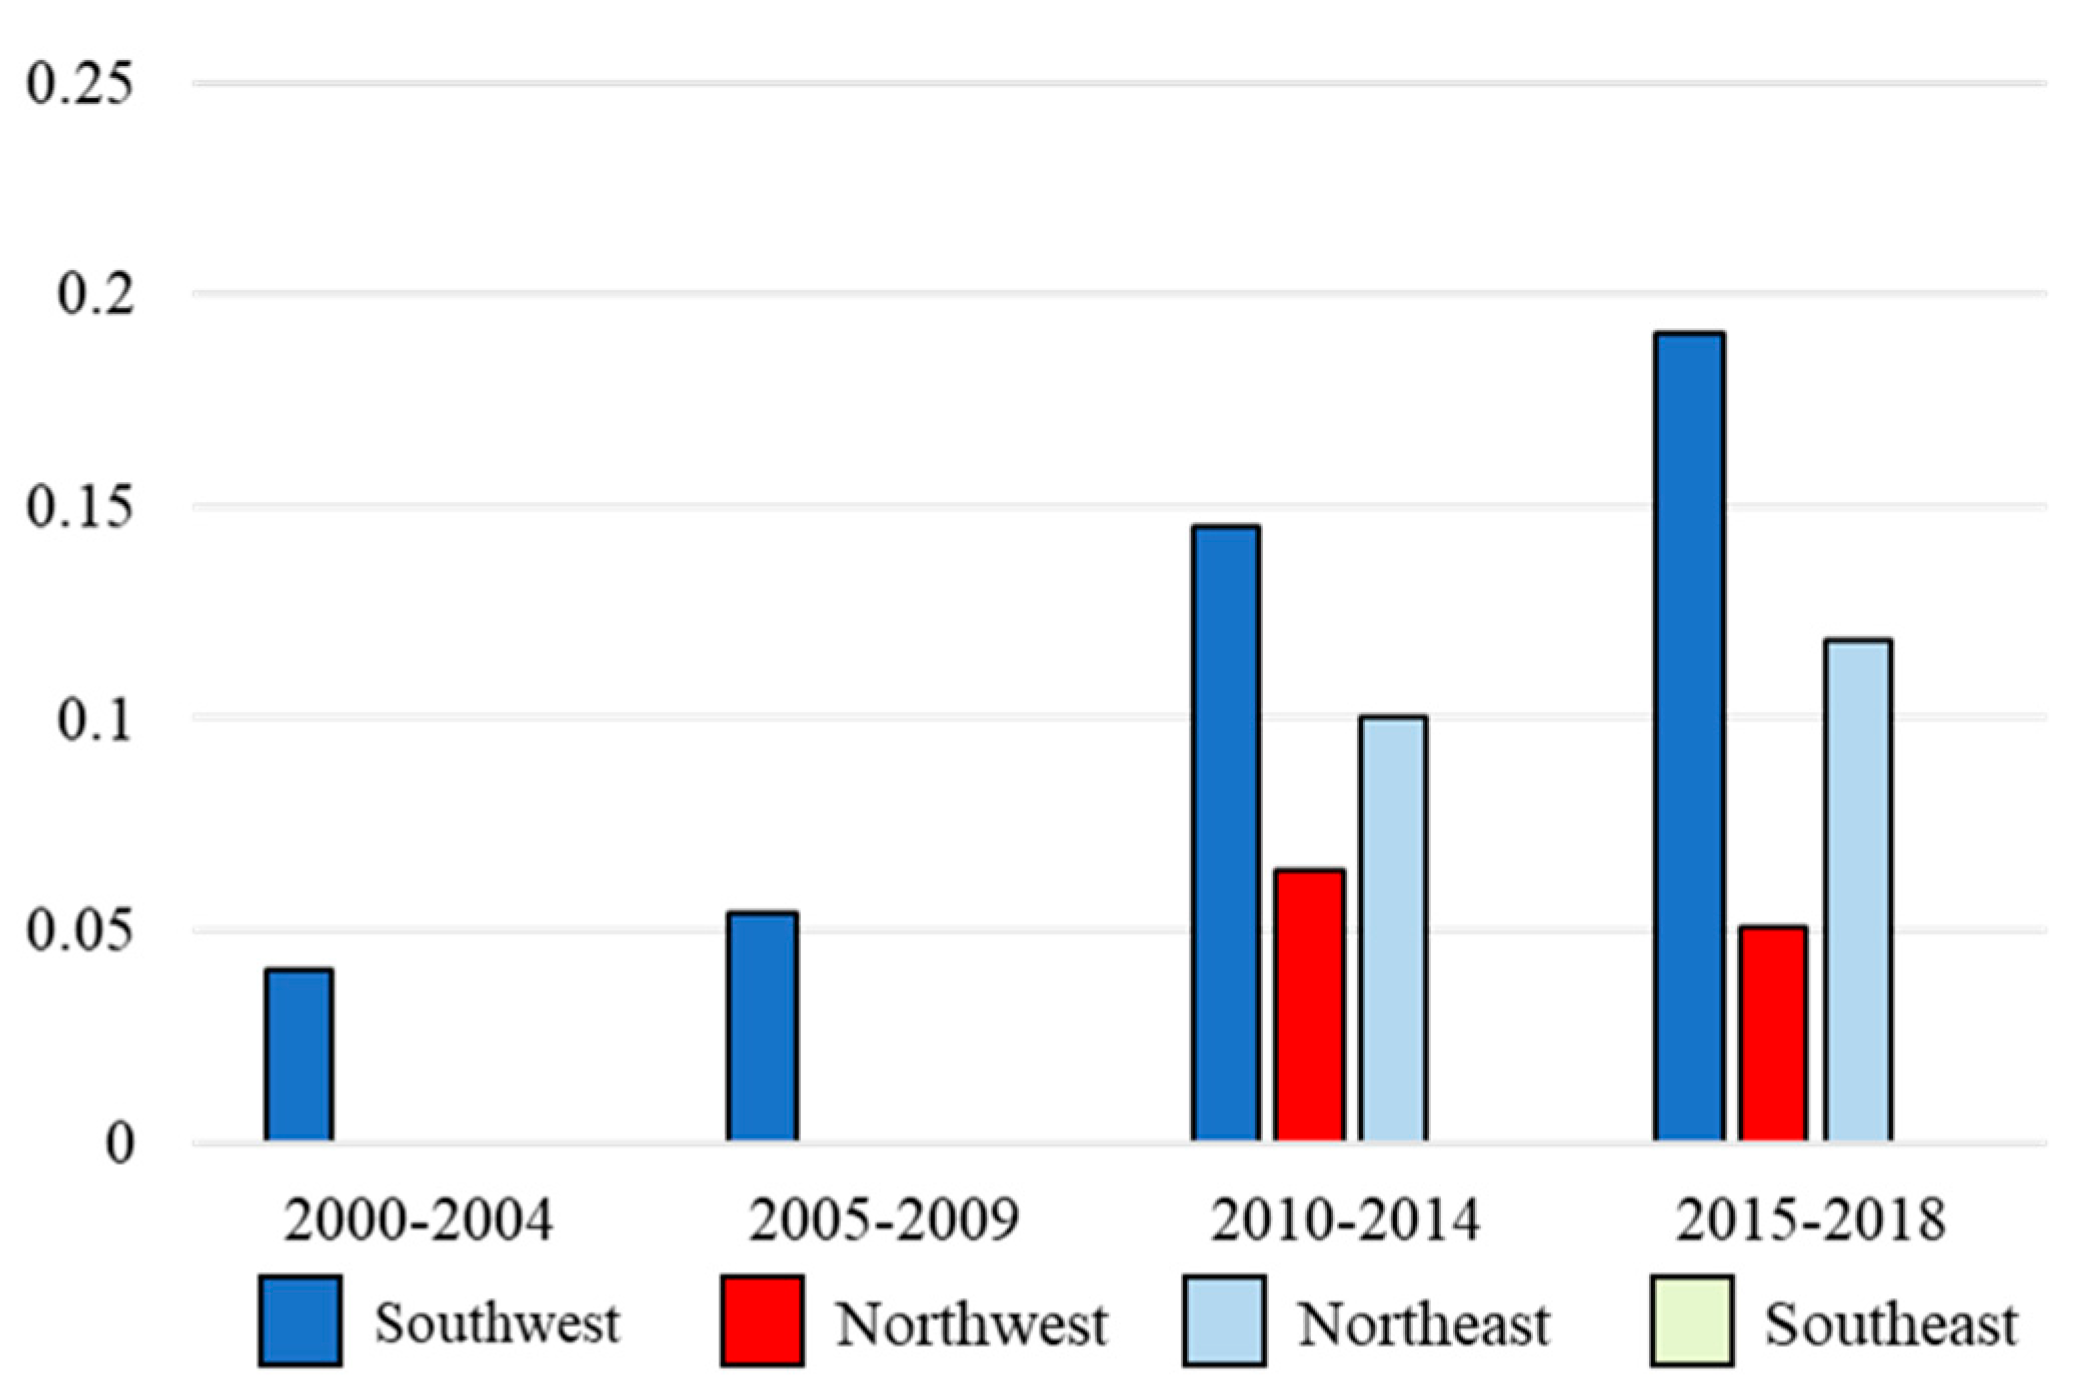
5.1. Evolution of the Innovation Structures of Different Areas

The innovation structure of the secondary industry exhibited the distribution characteristics of “balance in the west and homogeneity in the east”. The southwest area was always the area with the most balanced innovation structure, with a consistently leading innovation structure index. The innovation structure index of the northwest area grew rapidly, and the gap with that of the southwest area narrowed gradually, while the northeast and southeast areas lagged behind the northwest and southwest areas in terms of innovation structure index. During 2000–2004, the index value of the southwest area was only approximately 0.15, the index value of the northwest area was 0.05, and the average innovation structure index of the units in the northeast and southeast areas was 0, indicating that during this period, there was at most one type of industry with innovation capacity within a unit of the northeast and southeast areas and that the four areas each had a very homogeneous innovation structure. During 2005–2018, the index value of the southwest area increased steadily and eventually surpassed 0.4. The index value gap between the northwest area and the southwest area gradually decreased, and the index values reached approximately 0.35, indicating that the overall innovation structure of the west tended to be balanced. The index values of the northeast and southeast areas also gradually increased but not significantly, still not exceeding 0.2 during 2015–2018. Therefore, there was a significant difference in the innovation structures of the east and the west (Figure 8).
The innovation structure of the tertiary industry showed the distribution characteristics of being “relatively balanced in the southwest and extremely homogeneous in the rest of the areas”. During the evolution process, the innovation structure of the southwest and northeast areas tended to be balanced, while that of the northwest area tended to be homogeneous. During 2000–2009, the innovation structure indexes of the northwest, northeast, and southeast areas were all 0, and the average innovation structure index of the units in the southwest area was only approximately 0.075, indicating an extremely homogeneous innovation structure. During 2010–2014, the average innovation structure index of the units in the southwest area increased rapidly to approximately 0.15 and, meanwhile, the average innovation structure indexes of the units in the northwest and northeast area began to increase, with the most significant increase in the northeast area, reaching approximately 0.1. During 2015–2018, the values of the southwest and northeast areas increased steadily. The value of the northeast area increased to more than 0.1, while the value of the southwest area reached approximately 0.2. The extremely homogeneous innovation structure of the southwest area was improved to some extent, but it reached only the level of secondary industry in the northeast and southeast areas. The average innovation structure index of the units in the northwest area showed negative growth, with the index value dropping to approximately 0.5. Overall, the innovation structure of the tertiary industry was more homogeneous than that of the secondary industry (Figure 9).

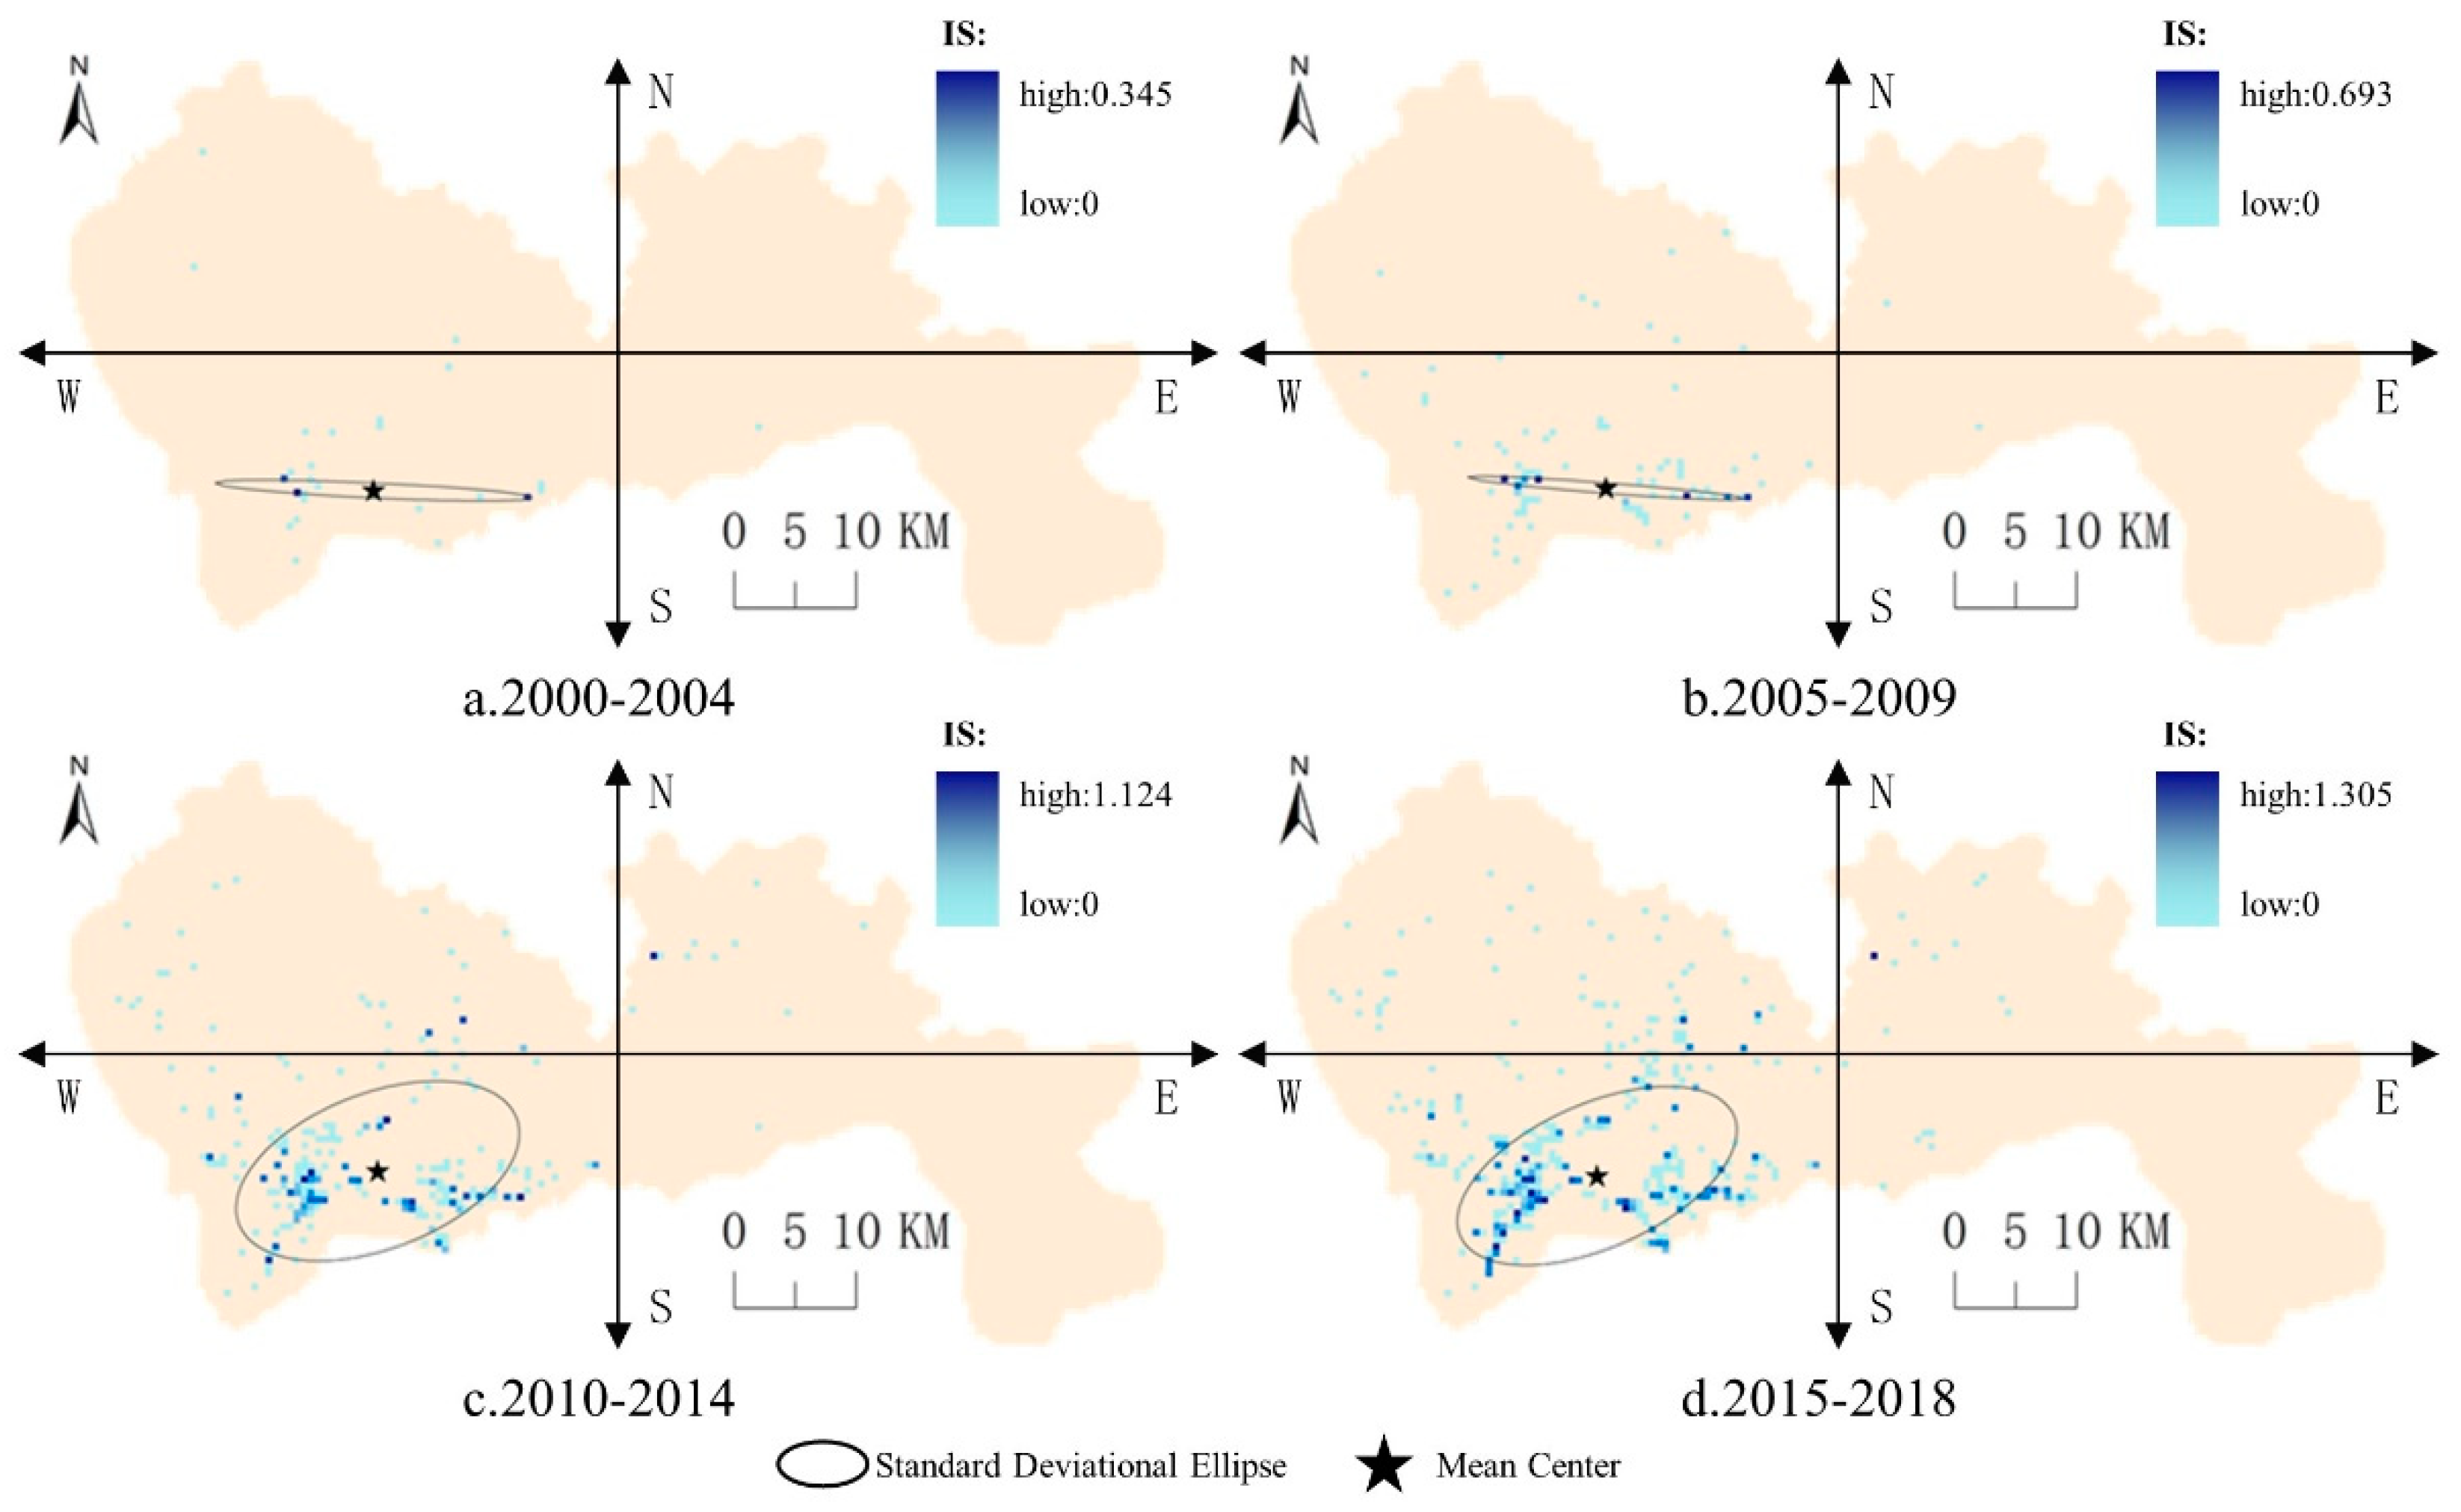
5.2. Spatial Distribution Pattern of the Innovation Structure

The spatial distribution pattern of the innovation structure of the secondary industry was similar to the tree-like distribution pattern of the innovation capacity but showed a stronger dependence on the core group, and the index value of the units far from the core increased slowly and even decreased for some, a phenomenon that was the most pronounced in the northeast area, where there was no obvious core (Figure 10).
In terms of extreme values, the extreme-value units of the innovation structure of the secondary industry appeared in the eastern part of the southwest area during 2000–2004 and then shifted to the central part of the southwest area during 2005–2018. During 2010–2018, two new extreme-value groups gradually formed in the western and central parts of the northwest area.
The mean center appeared in southwest area during 2000–2009, indicating that the innovation structure index was higher in the southern area during the early period. During 2010–2018, the mean center shifted northward to the vicinity of the north-south boundary, indicating that the gap between the innovation structure of the northern and southern areas narrowed, but the gap between those of the eastern and western areas was still significant.
In terms of spatial distribution characteristics, the area of the standard deviational ellipse increased continuously but was still smaller than that of the standard deviational ellipse of the innovation capacity, indicating that the innovation structure index was more sensitive to the distance from the center than the innovation capacity, and the innovation structure of units far from the center was more homogeneous. The ellipse of the innovative structure gradually flattened and clearly exhibited directional distribution characteristics, with the major axis of the ellipse being in the “southeast-northwest” direction during 2000–2004. During 2005–2009, the direction of the major axis of the ellipse gradually changed to “east-west” as the innovation structure index in the eastern area increased. During 2010–2014, with the emergence of new extreme-value groups in the western and central parts of the northwest area, the distribution of innovation structure in the northwest and southwest areas tended to be balanced, and the major axis direction shifted to “northwest-southeast”. During 2014–2018, an increasing number of units with high index values appeared in the western part of the northwest area, and the major axis rotated slightly in the clockwise direction.
There were differences in the spatial distribution patterns of the innovation structure and innovation capacity of the tertiary industry. Units with a high innovation capacity index could have a low innovation structure index. For example, the innovation structure index in the vicinity of the southeastern part of the northwest area, which had units with extreme values for innovation capacity, was low. There was a radial distribution pattern for the innovation structure index, with the southwestern part of the southwest area as the source, a high-valued dense distribution near the source, and a gradually sparse distribution toward the northeast (Figure 11).
In terms of extreme values, the extreme-value units of the innovation structure of the tertiary industry all appeared in the central part of the southwest area. During 2000–2009, only a few units had an innovation structure index higher than 0, and these extreme-value units appeared in the central and southeastern parts of the southwest area. During 2010–2018, an extreme-value zone extended southwestward from the cluster in the central part of the southwest area, while the cluster in the eastern part of the southwest area extended horizontally to form an extreme-value zone in the east-west direction.
The mean center of the spatial distribution pattern of the innovation structure of the tertiary industry appeared in the central part of the southwest area and basically remained stationary during 2000–2018, similar to the spatial distribution pattern of the innovation capacity.
In terms of spatial distribution characteristics, the spatial distribution pattern of the innovation structure of the tertiary industry reflected stronger directional characteristics. During 2000–2009, as the innovation structure index of only a few units was not 0, the ellipse area was very small and very flat, and the major axis was in the “northwest-southeast” direction. During 2010–2018, as the overall innovation structure tended to be balanced, the innovation structure index of an increasing number of units increased, and the ellipse area also increased, but the ellipse was still flat, and its major axis direction changed to “southwest-northeast”.

6. Conclusions and Discussion

Based on the enterprise patent output data of Shenzhen during 2000–2018, this study uses spatial units based on geographic coordinates of patents instead of administrative regions to reduce the influence of differences in administrative division on the spatial pattern analysis. This study also brings the innovation structure into the innovation evaluation system, designs the innovation capability and innovation structure index of a spatial unit and their calculation methods to analyze the spatial patterns of innovation and their evolution from a more microscopic perspective. Through the classification of the patents based on the industries to which the enterprises belong, the spatial pattern of the innovation structure of the units can now be analyzed while focusing on the spatial pattern of the innovation capacity of each industry. In the comparison of the differences in the evolution process of the spatial patterns of innovation of different industries, the innovation development modes of different industries can also be analyzed in depth.
The pattern of the innovation capacity of the secondary industry exhibited a pronounced innovation spillover effect, showing a positive spatial correlation, with high-high agglomeration units mainly appearing in the southwest and northwest areas and a few appearing in the northeast area. According to the changes in the global Moran index, the evolution of the spatial pattern of the secondary industry can be divided into the expansion phase from 2004 to 2014 and the mature phase from 2015 to 2018. The spatial patterns of the innovation capacity and innovation structure of the secondary industry were similar. Specifically, the index distributions of the innovation capacity and innovation structure were each characterized by high value in the west and low value in the east and a gradual decrease in the index value from south to north, forming a tree-like distribution pattern with the central part of the southwest area as the “root” and the northwest and northeast areas as the “canopy”. The pattern of the innovation capacity of the tertiary industry also had a significant innovation spillover effect, showing a positive spatial correlation. Almost all the high-high agglomeration units were concentrated in the southwest area, a small number appeared in the northwest area, and the global Moran index grew steadily. There were differences in the spatial patterns of the innovation capacity and innovation structure of the tertiary industry. The innovation capacity had a triangular spatial distribution pattern formed by the mean center as the center and the three groups in the central and eastern parts of the southwest area and the southeastern part of the northwest area as the three vertices. The innovation structure showed a radial spatial distribution pattern with the southwestern part of the southwest area as the source and a gradually sparse distribution toward the northeast.
There were differences in the evolution mode between the secondary and tertiary industries in terms of the comprehensive innovation capacity and innovation structure. The evolutions of the innovation capacity and innovation structure of the secondary industry were similar, and areas with a high innovation capacity tended to have a more balanced innovation structure, indicating that the improvement in innovation capacity of the secondary industry could attract more industries to participate in innovation and that, accordingly, the innovation structure tended to be balanced. Therefore, for the innovation of the secondary industry, the introduction of enterprises with high innovation capacity could drive improvement in the innovation capacity and the balancing of the innovation structure in the areas, thus promoting the innovation collaboration of industrial clusters and enhancing the competitiveness. There were obvious differences between the evolutions of the innovation capacity and innovation structure of the tertiary industry. The innovation structure of areas with high innovation capacity was not necessarily balanced. Although the eastern part of the northwest area had units with the highest innovation capacity index, they still could not drive the surrounding areas to improve and form a group with a high innovation structure index. The spatial distribution of the innovation structure index was more dependent on the location conditions. The innovation structure of the central part of the southwest area located in the city center and the southeastern part of the southwest area near Hong Kong was more balanced than that of other areas, and the group with extreme values of innovation structure index showed an evolutionary trend of growing in the direction toward Hong Kong (in the south). Therefore, for the innovation of the tertiary industry, it is necessary to give full play to the location advantage of the city center and, in the meantime, to strengthen the exchange and cooperation with Hong Kong to attract more industries to participate in innovation activities.
Although patent data can reflect the capacity of enterprises to carry out innovation to a large extent, the investment in innovation activities, the amount of innovative talent, and the patent transformation ability are all important indicators for evaluating the innovation capacity of enterprises. However, it is very difficult to collect data related to innovation at the enterprise level. If the relevant data are made public, the innovation capacity evaluation method can be further improved. In this study, an innovation structure index is designed to evaluate the innovation structure of each unit. Different classification standards have different focuses on industry types; hence, different analysis results may be obtained. This study classifies industries based on China’s Industrial Classification for National Economic Activities. However, there are a variety of classification standards for industry types. For example, they can be divided into labor-intensive, capital-intensive, and technology-intensive industries in terms of production factors. Innovation structure patterns under different classification standards can be compared in future research. Therefore, designing a more reasonable and accurate innovation evaluation system that can reflect both the changes in the innovation capacity of a unit and the combination and interaction of different industries within the unit as well as characterize the spatial pattern of intraurban innovation and its evolution is the key to studying the innovation development mode of a city, a topic worthy of in-depth investigation.

Author Contributions

Erjie Hu designed the research flow and wrote the manuscript. Di Hu contributed significantly to the conception of the study and constructive discussion. Handong He performed the data analysis of the study. All authors have read and agreed to the published version of the manuscript.

Funding

This work is supported by the National Natural Science Foundations of China (No. 41771421, 42071365).

Acknowledgments

We would like to express our sincere thanks to the anonymous reviewers, editors and Tian Lan from University College London for their valuable comments and suggestions for this paper.

Conflicts of Interest

The authors declare that they have no conflict of interest.

References

  1. Li, G.; Wei, W. Financial development, openness, innovation, carbon emissions, and economic growth in China. Energy Econ. 2021, 97, 105194. [Google Scholar] [CrossRef]
  2. Goetz, S.J.; Han, Y. Latent innovation in local economies. Res. Policy 2020, 49, 103909. [Google Scholar] [CrossRef]
  3. Wang, J.; Liu, N.; Ruan, Y. Influence Factors of Spatial Distribution of Urban Innovation Activities Based on Ensemble Learning: A Case Study in Hangzhou, China. Sustainability 2020, 12, 1016. [Google Scholar] [CrossRef] [Green Version]
  4. Tang, S.; Zhang, J.; Niu, F. Spatial-Temporal Evolution Characteristics and Countermeasures of Urban Innovation Space Distribution: An Empirical Study Based on Data of Nanjing High-Tech Enterprises. Complexity 2020, 2, 2905482. [Google Scholar] [CrossRef]
  5. Wang, C.; Lin, G. The growth and spatial distribution of China’s ICT industry: New geography of clustering and innovation. Issues Stud. 2008, 44, 145–192. [Google Scholar]
  6. Zhou, R.; Zhang, Y.; Gao, X. The Spatial Interaction Effect of Environmental Regulation on Urban Innovation Capacity: Empirical Evidence from China. Int. J. Environ. Res. Public Health 2021, 18, 4470. [Google Scholar] [CrossRef] [PubMed]
  7. Neulndtner, M. An Empirical Agent-Based Model for Regional Knowledge Creation in Europe. Int. J. Geo-Inf. 2020, 9, 477. [Google Scholar] [CrossRef]
  8. Li, T.; Fu, W. Spatial processes of regional innovation in Guangdong Province, China: Empirical evidence using a spatial panel data model. Asian J. Technol. Innov. 2016, 23, 304–320. [Google Scholar] [CrossRef]
  9. Crescenzi, R.; Rodríguez-Pose, A.; Storper, M. The territorial dynamics of innovation: A Europe-United States comparative analysis. J. Econ. Geogr. 2007, 7, 673–709. [Google Scholar] [CrossRef]
  10. Usai, S.; Moreno, R.; Paci, R. Spatial spillovers and innovation activity in European regions. Soc. Sci. Electron. Publ. 2005, 37, 1793–1812. [Google Scholar]
  11. Wang, Y.; Wang, C.; Mao, X.; Liu, B.; Zhang, Z.; Jiang, S. Spatial Pattern and Benefit Allocation in Regional Collaborative Innovation of the Yangtze River Delta, China. Chin. Geogr. Sci. 2021, 31, 900–914. [Google Scholar] [CrossRef]
  12. Ceh, B. Regional innovation potential in the United States: Evidence of spatial transformation. Pap. Reg. Sci. 2001, 80, 297–316. [Google Scholar] [CrossRef]
  13. Paci, R.; Usai, S. Externalities, Knowledge Spillovers And The Spatial Distribution Of Innovation. GeoJournal 1999, 49, 381–390. [Google Scholar] [CrossRef]
  14. Gonçalves, E.; Almeida, E. Innovation and spatial knowledge spillovers: Evidence from Brazilian patent data. Reg. Stud. 2009, 43, 513–528. [Google Scholar] [CrossRef]
  15. Xu, W.X.; Liu, C. The Spatial Pattern and Driving Force of Innovation of Industrial Cluster and County Urbanization Coupled Coordination in Zhejiang Province. Sci. Geogr. Sin. 2015, 29, 1597–1605. [Google Scholar]
  16. Li, L.; Zhang, X. Spatial evolution and critical factors of urban innovation: Evidence from Shanghai, China. Sustainability 2020, 12, 938. [Google Scholar] [CrossRef] [Green Version]
  17. Duan, D.; Du, D.B.; Liu, C.L. Spatial-temporal evolution mode of urban innovation spatial structure:A case study of Shanghai and Beijing. Acta Geogr. Sin. 2015, 70, 1911–1925. [Google Scholar]
  18. Vasta, M.; Nuvolari, A. The geography of innovation in Italy, 1861-1913: Evidence from patents data. Eur. Rev. Econ. Hist. 2017, 21, 326–356. [Google Scholar]
  19. Kryukov, V.A.; Tokarev, A. Spatial trends of innovation in the Russian oil and gas sector: What does patent activity in Siberia and the Arctic reflect? Reg. Sci. Policy Pract. 2021, 6, 1–20. [Google Scholar] [CrossRef]
  20. Bai, Y.; Chou, L.C.; Zhang, W.H. Industrial innovation characteristics and spatial differentiation of smart grid technology in China based on patent mining. J. Energy Storage 2021, 43, 103289. [Google Scholar] [CrossRef]
  21. Acs, Z.J.; Audretsch, D.B. Patents as a Measure of Innovative Activity. Kyklos 1989, 42, 171–180. [Google Scholar] [CrossRef]
  22. Cheng, C.Y.; Kung, L.C. Evaluation of innovation risk through patent risk factors: An empirical approach. Queen Mary J. Intellect. Prop. 2019, 9, 414–429. [Google Scholar] [CrossRef]
  23. Klein, M.A. Secrecy, the Patent Puzzle and Endogenous Growth. Eur. Econ. Rev. 2020, 126, 103445. [Google Scholar] [CrossRef]
  24. Li, W.; Wang, J.; Chen, R.; Xi, Y.; Liu, S.Q.; Wu, F.; Masoud, M.; Wu, X. Innovation-driven industrial green development: The moderating role of regional factors. J. Clean. Prod. 2019, 222, 344–354. [Google Scholar] [CrossRef]
  25. Castellacci, F.; Natera, J.M. The dynamics of national innovation systems: A panel cointegration analysis of the coevolution between innovative capability and absorptive capacity. Res. Policy 2013, 42, 579–594. [Google Scholar] [CrossRef] [Green Version]
  26. Wei, G.J.; Economics, S.O.; University, F.N. Study on the knowledge generation of industries in innovation and route switch in China (in Chinese). Stud. Sci. Sci. 2018, 36, 1036–1047. [Google Scholar]
  27. Wang, J.; Sun, Y.T.; Liu, F.C. Study on the Double Main Carriers Position of Chinese Enterprises’ Technological Innovation. China Soft Sci. 2012, 9, 146–153. [Google Scholar]
  28. Hong, J.; Zheng, R.; Deng, H.; Zhou, Y. Green supply chain collaborative innovation, absorptive capacity and innovation performance: Evidence from China. J. Clean. Prod. 2019, 241, 118377.1–118377.13. [Google Scholar] [CrossRef]
  29. Zhang, K.; Qian, Q.; Feng, Z. Distribution Patterns and Multilevel Factors of the Innovation Activities of China’s New Energy Vehicle Industry. ISPRS Int. J. Geo-Inf. 2021, 10, 385. [Google Scholar] [CrossRef]
  30. Wang, M. Research on the Sustainable Synergetic Development of Chinese Urban Economies in the Context of a Study of Industrial Agglomeration. Sustainability 2020, 12, 1122. [Google Scholar] [CrossRef] [Green Version]
  31. Goldstein, G.S.; Gronberg, T.J. Economies of scope and economies of agglomeration. J. Urban Econ. 1984, 16, 91–104. [Google Scholar] [CrossRef]
  32. Tauchen, H.; Witte, A.D. An Equilibrium Model of Office Location and Contact Patterns. Environ. Plan. A 1983, 15, 1311–1326. [Google Scholar] [CrossRef]
  33. Van Groenigen, J.W.; Stein, A.; Zuurbier, R. Optimization of environmental sampling using interactive GIS. Soil Technol. 1997, 10, 83–97. [Google Scholar] [CrossRef]
  34. Li, X.; Gao, B.; Bai, Z.; Pan, Y.; Gao, Y. An Improved Parallelized Multi-Objective Optimization Method for Complex Geographical Spatial Sampling: AMOSA-II. Int. J. Geo-Inf. 2020, 9, 236. [Google Scholar] [CrossRef]
  35. Yang, S.Z.; Mao, Z.P.; Liu, C.; Wang, S.Y.; Cheng, D.S.; Wang, L.; Wu, J.P.; Du, Y.L. An aquatic ecoregion delineation approach based on GIS and spatial environmental data in Heihe River Basin, Northwestern China. Quat. Int. 2015, 380, 272–281. [Google Scholar]
  36. Cornelis, J.; Hermy, M. Biodiversity relationships in urban and suburban parks in Flanders. Landsc. Urban Plan. 2004, 69, 385–401. [Google Scholar] [CrossRef]
  37. Zhu, Y.; Wang, Z.; Qiu, S.; Zhu, L. Effects of Environmental Regulations on Technological Innovation Efficiency in China’s Industrial Enterprises: A Spatial Analysis. Sustainability 2019, 11, 2186. [Google Scholar] [CrossRef] [Green Version]
  38. Li, B.; Wu, S. Effects of local and civil environmental regulation on green total factor productivity in China: A spatial Durbin econometric analysis. J. Clean. Prod. 2016, 153, 342–353. [Google Scholar] [CrossRef]
  39. Fischer, M.M.; Getis, A. Handbook of Applied Spatial Analysis: Software Tools, Methods and Applications; Taylor & Francis, Inc.: Abingdon, UK, 2011. [Google Scholar]
  40. Wong, D.W.S. Several fundamentals in implementing spatial statistics in GIS: Using centrographic measures as examples. Geogr. Inf. Sci. 1999, 2, 163–173. [Google Scholar]
Figure 1. Numbers of patents in the secondary and tertiary industries in Shenzhen from 2000 to 2018.
Ijgi 11 00007 g001
Figure 2. Evolution of the innovation agglomeration pattern of the secondary industry in Shenzhen from 2000 to 2018.
Ijgi 11 00007 g002
Figure 3. Evolution of the innovation agglomeration pattern of the tertiary industry in Shenzhen from 2000 to 2018.
Ijgi 11 00007 g003
Figure 4. Evolution of the average innovation capacity of the secondary industry of the units in each area in Shenzhen from 2000 to 2018.
Ijgi 11 00007 g004
Figure 5. Evolution of the average innovation capacity of the tertiary industry of the units in each area in Shenzhen from 2000 to 2018.
Ijgi 11 00007 g005
Figure 6. Spatial distribution of the innovation capacity of the secondary industry in Shenzhen.
Ijgi 11 00007 g006
Figure 7. Spatial distribution of the innovation capacity of the tertiary industry in Shenzhen.
Ijgi 11 00007 g007
Figure 8. Evolution of the average innovation structure index of the secondary industry of the units in each area.
Ijgi 11 00007 g008
Figure 9. Evolution of the average innovation structure index of the tertiary industry of units in each area.
Ijgi 11 00007 g009
Figure 10. Spatial distribution of the innovation structure of the secondary industry in Shenzhen.
Ijgi 11 00007 g010
Figure 11. Spatial distribution of the innovation structure of the tertiary industry in Shenzhen.
Ijgi 11 00007 g011
Publisher’s Note: MDPI stays neutral with regard to jurisdictional claims in published maps and institutional affiliations.

