


Multi-Source Spatio-Temporal Data-Based Tourism Structure Analysis of Demonstration City for Global Tourism: Case Study of Liyang, China

Abstract
:1. Introduction
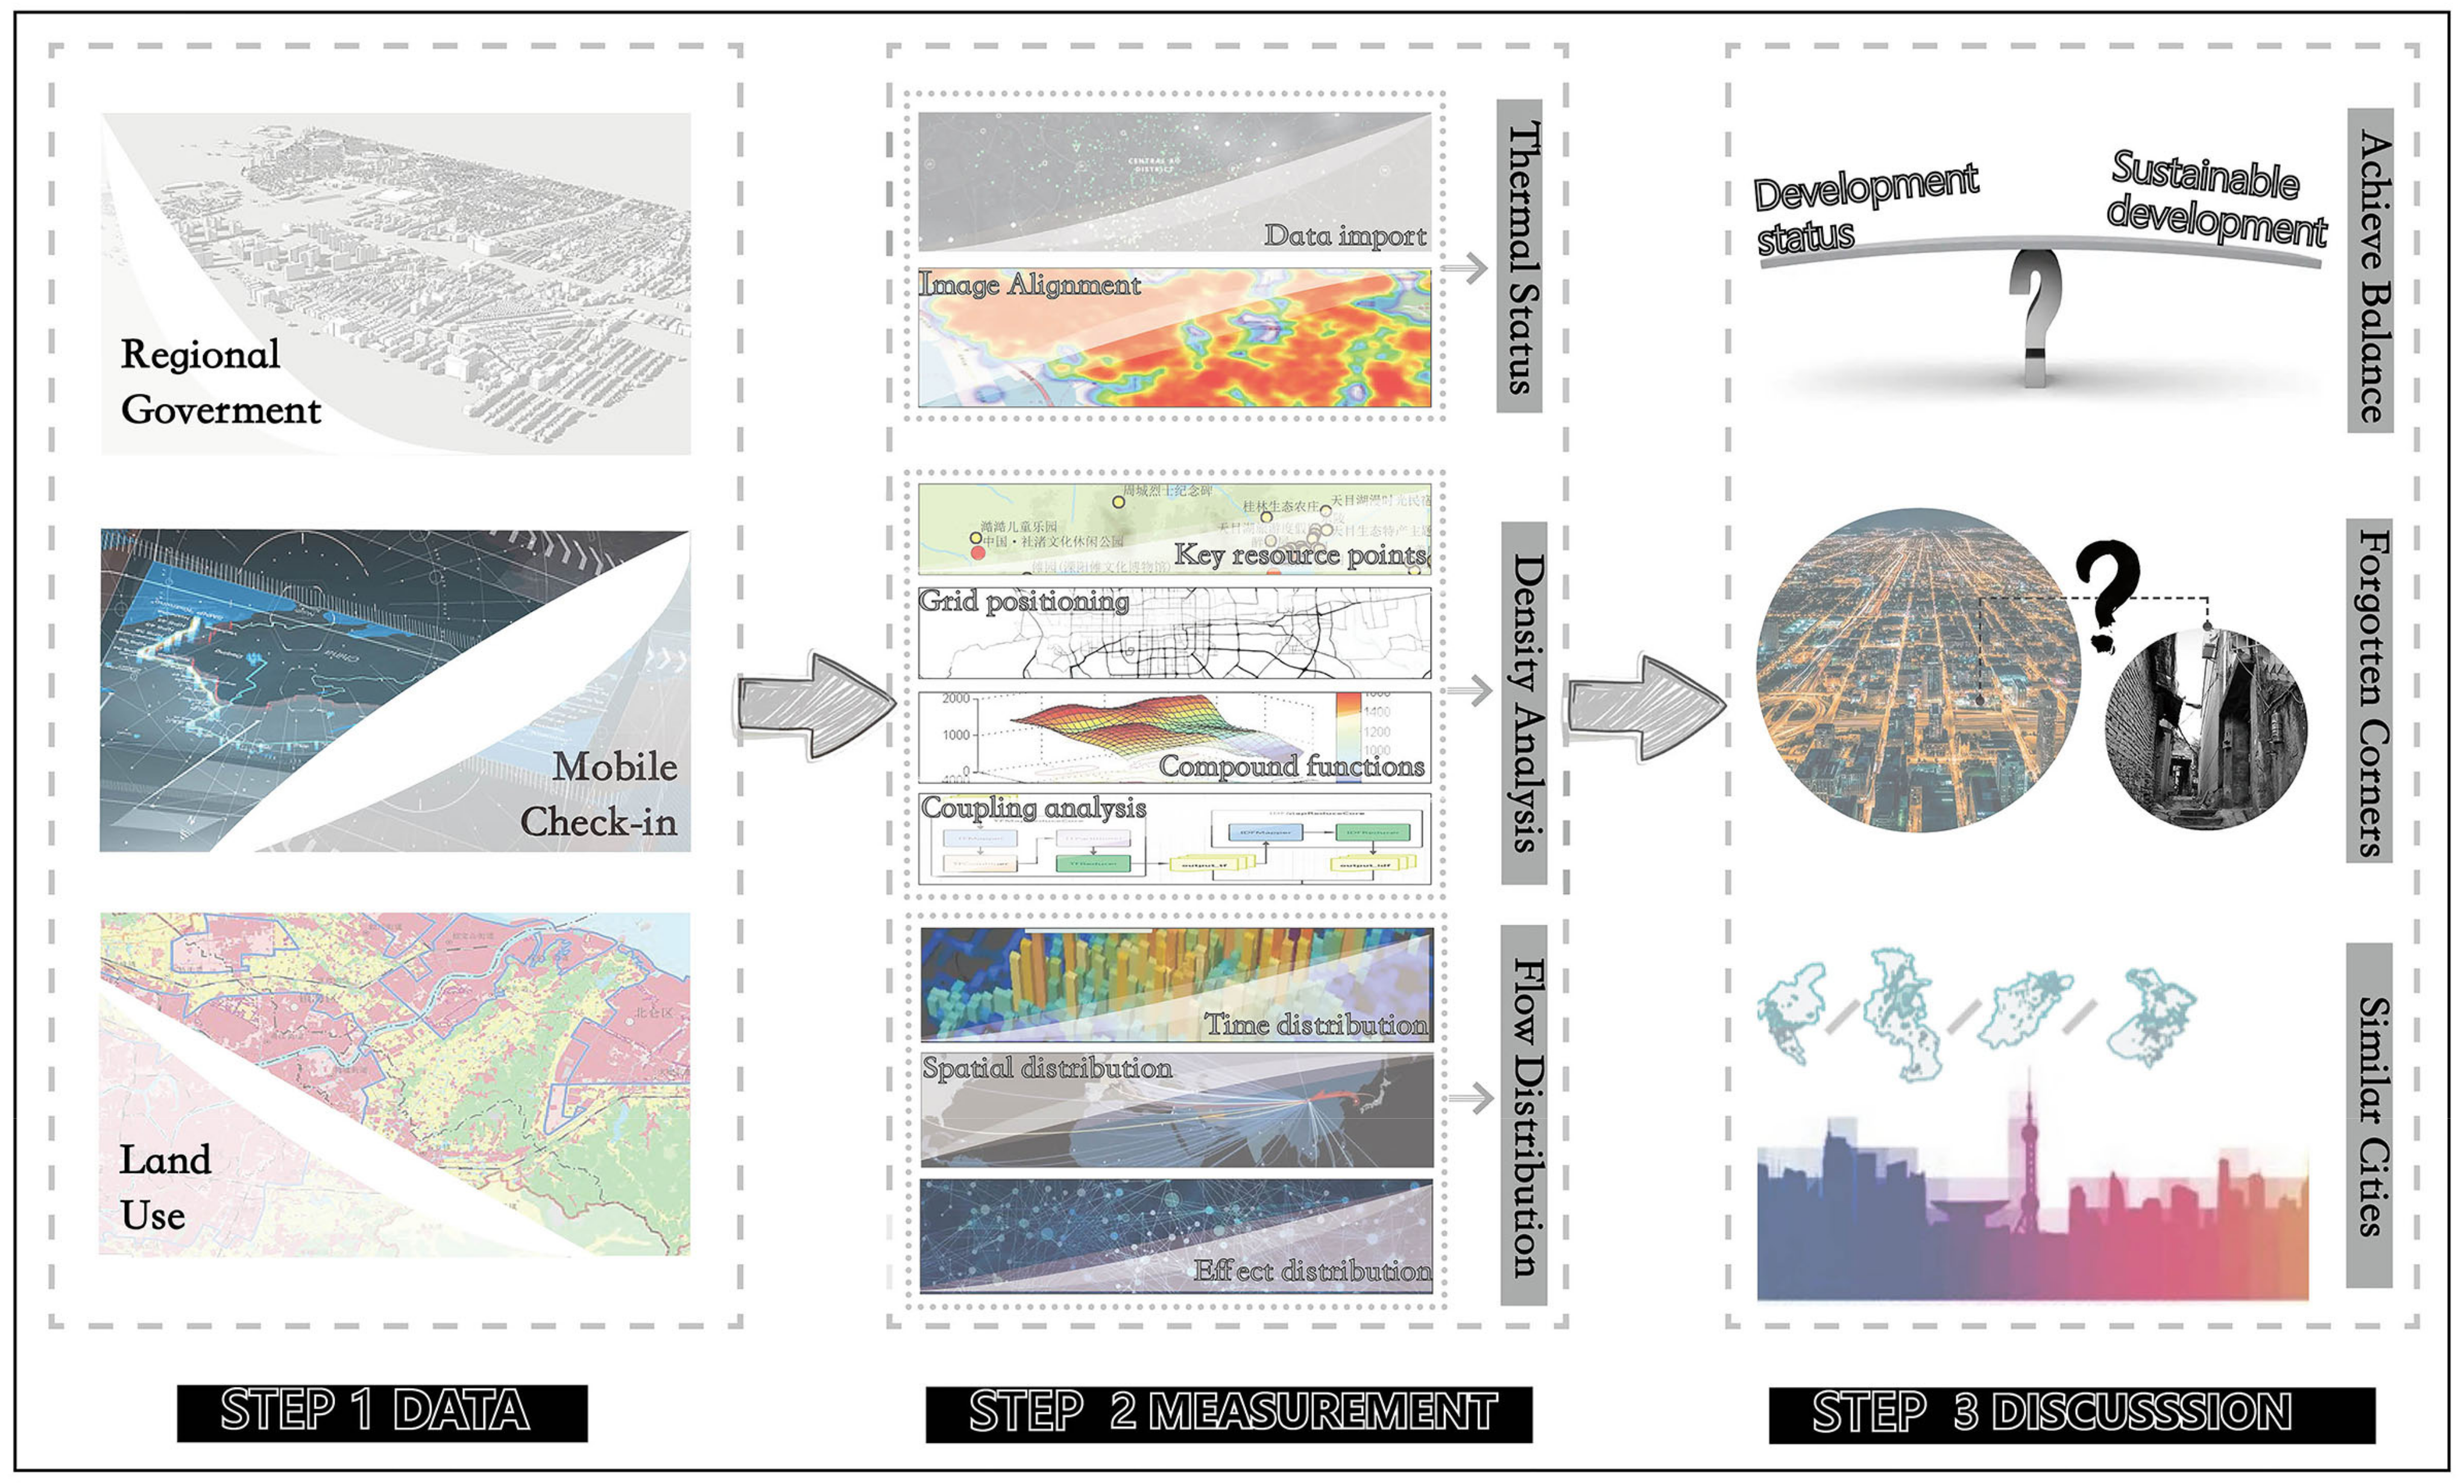
2. Analytical Framework
2.1. Measurement of Dynamic Thermal Status of Tourist Areas
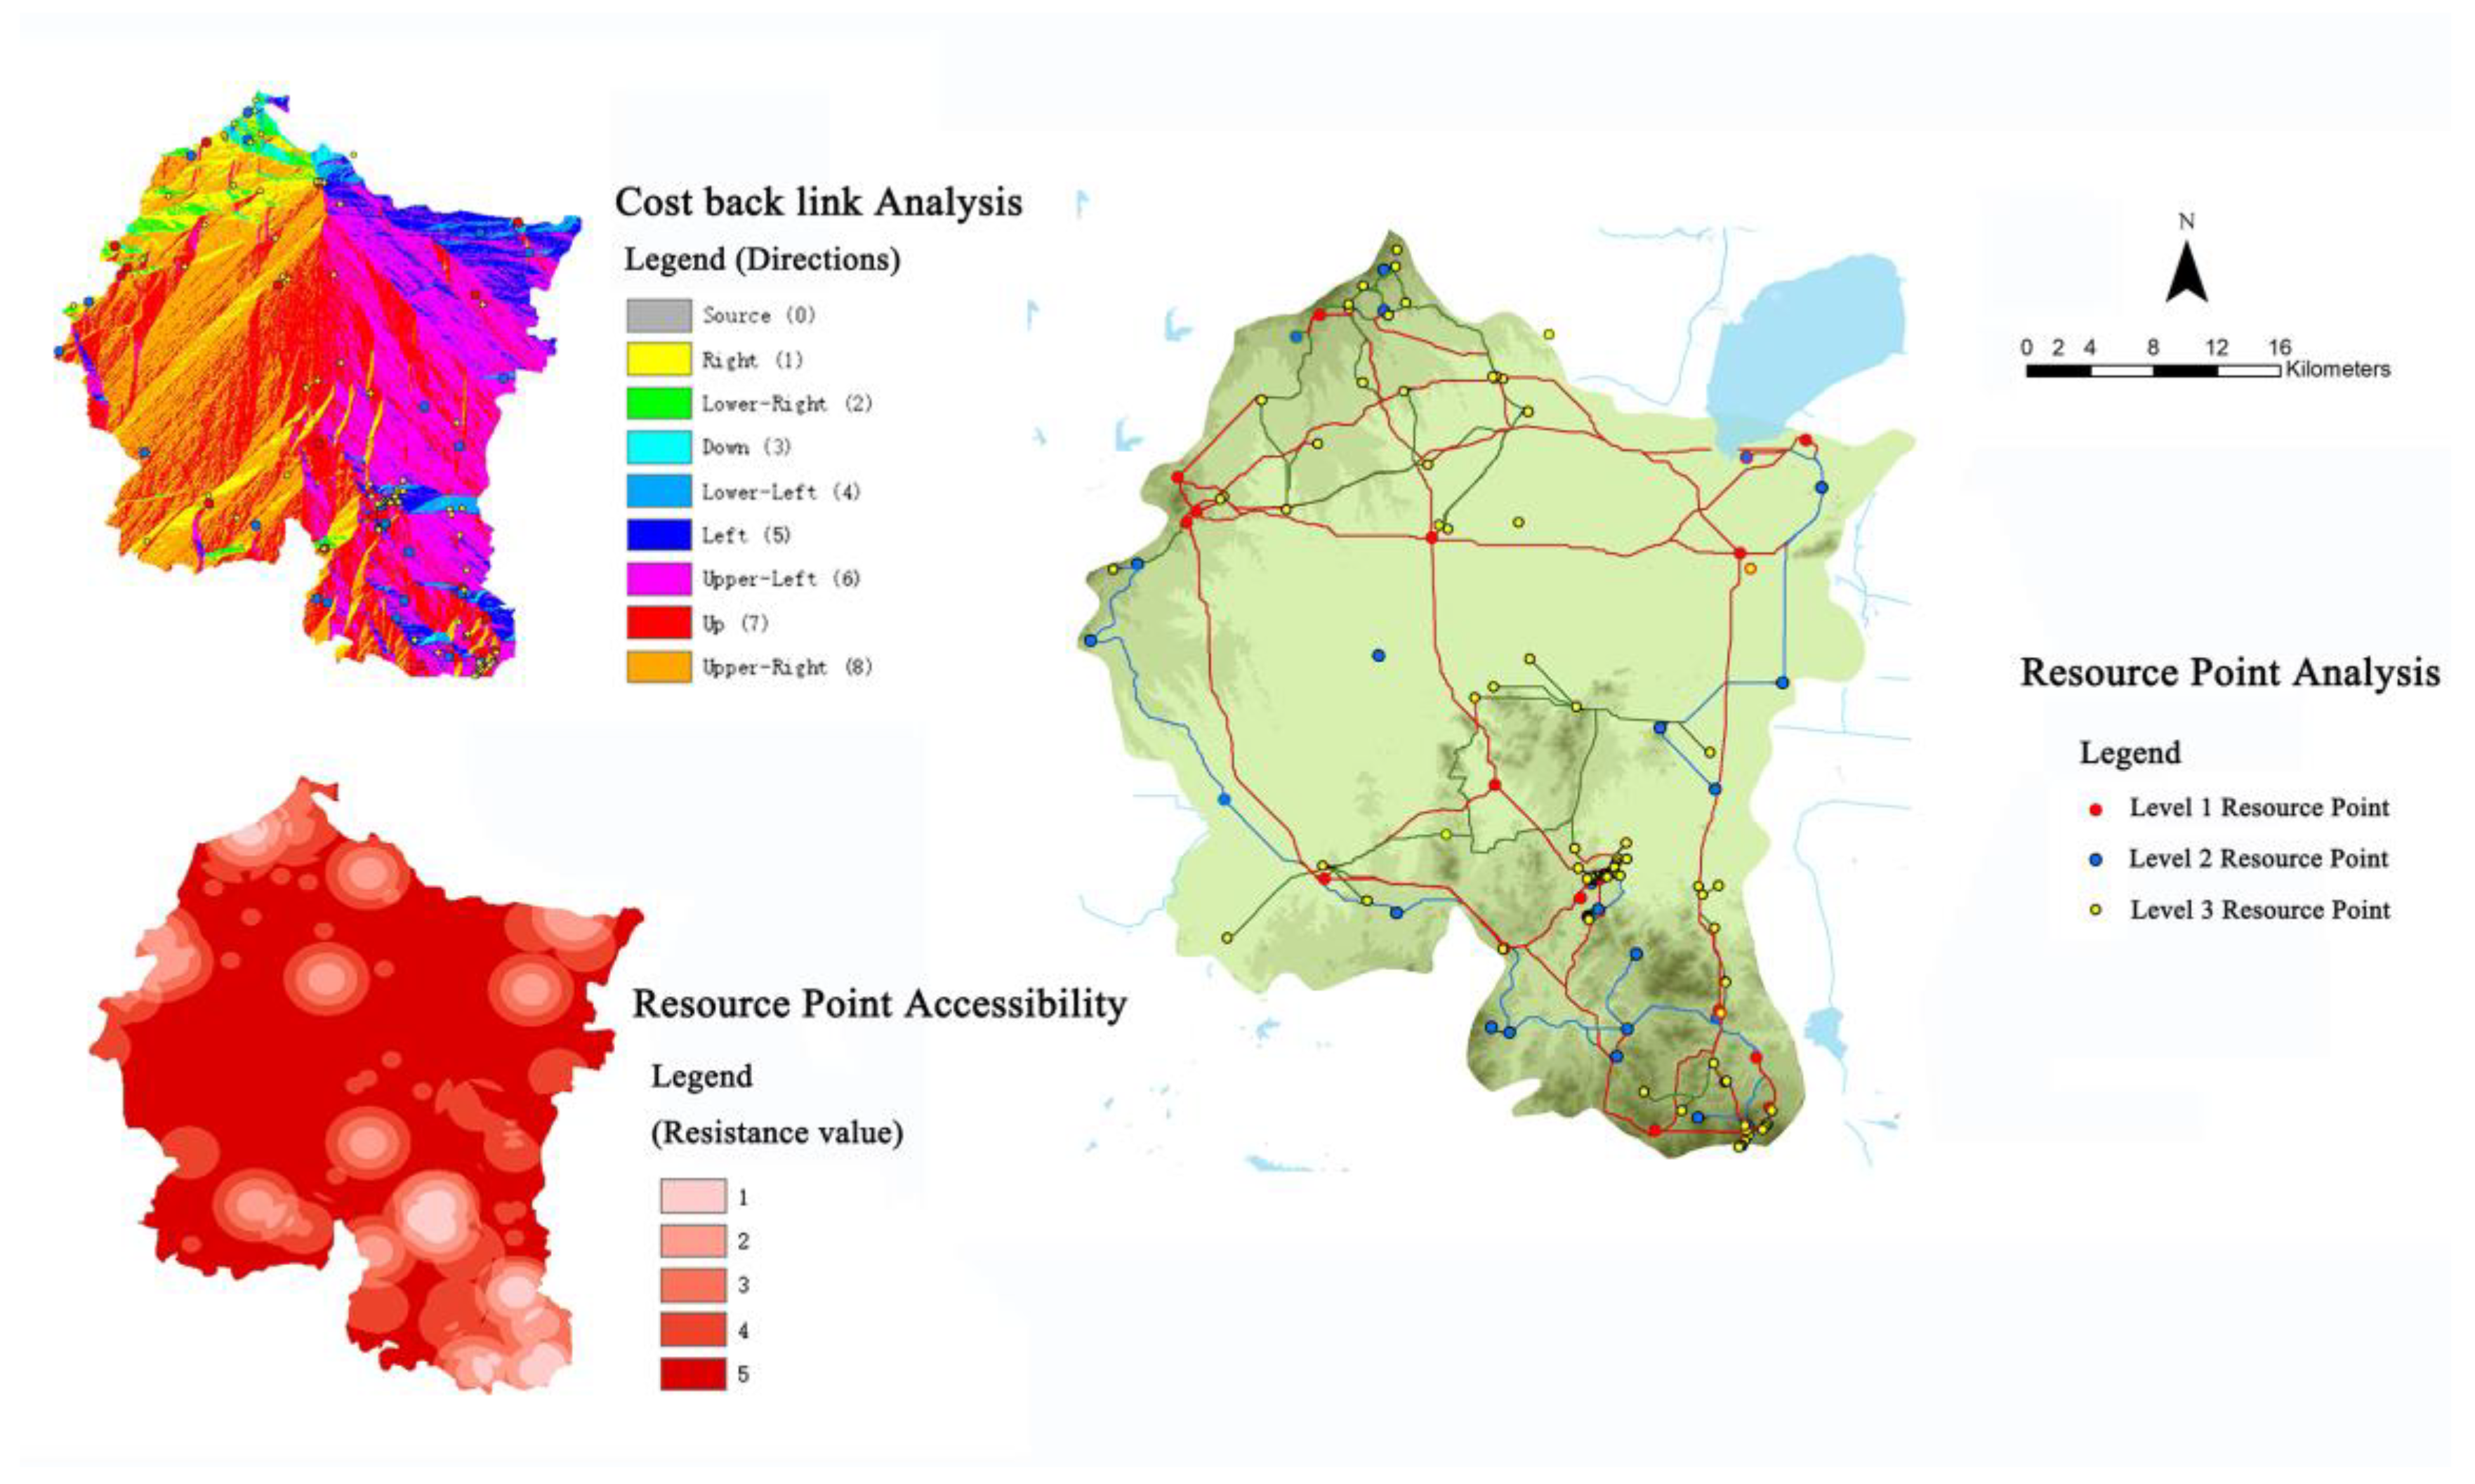
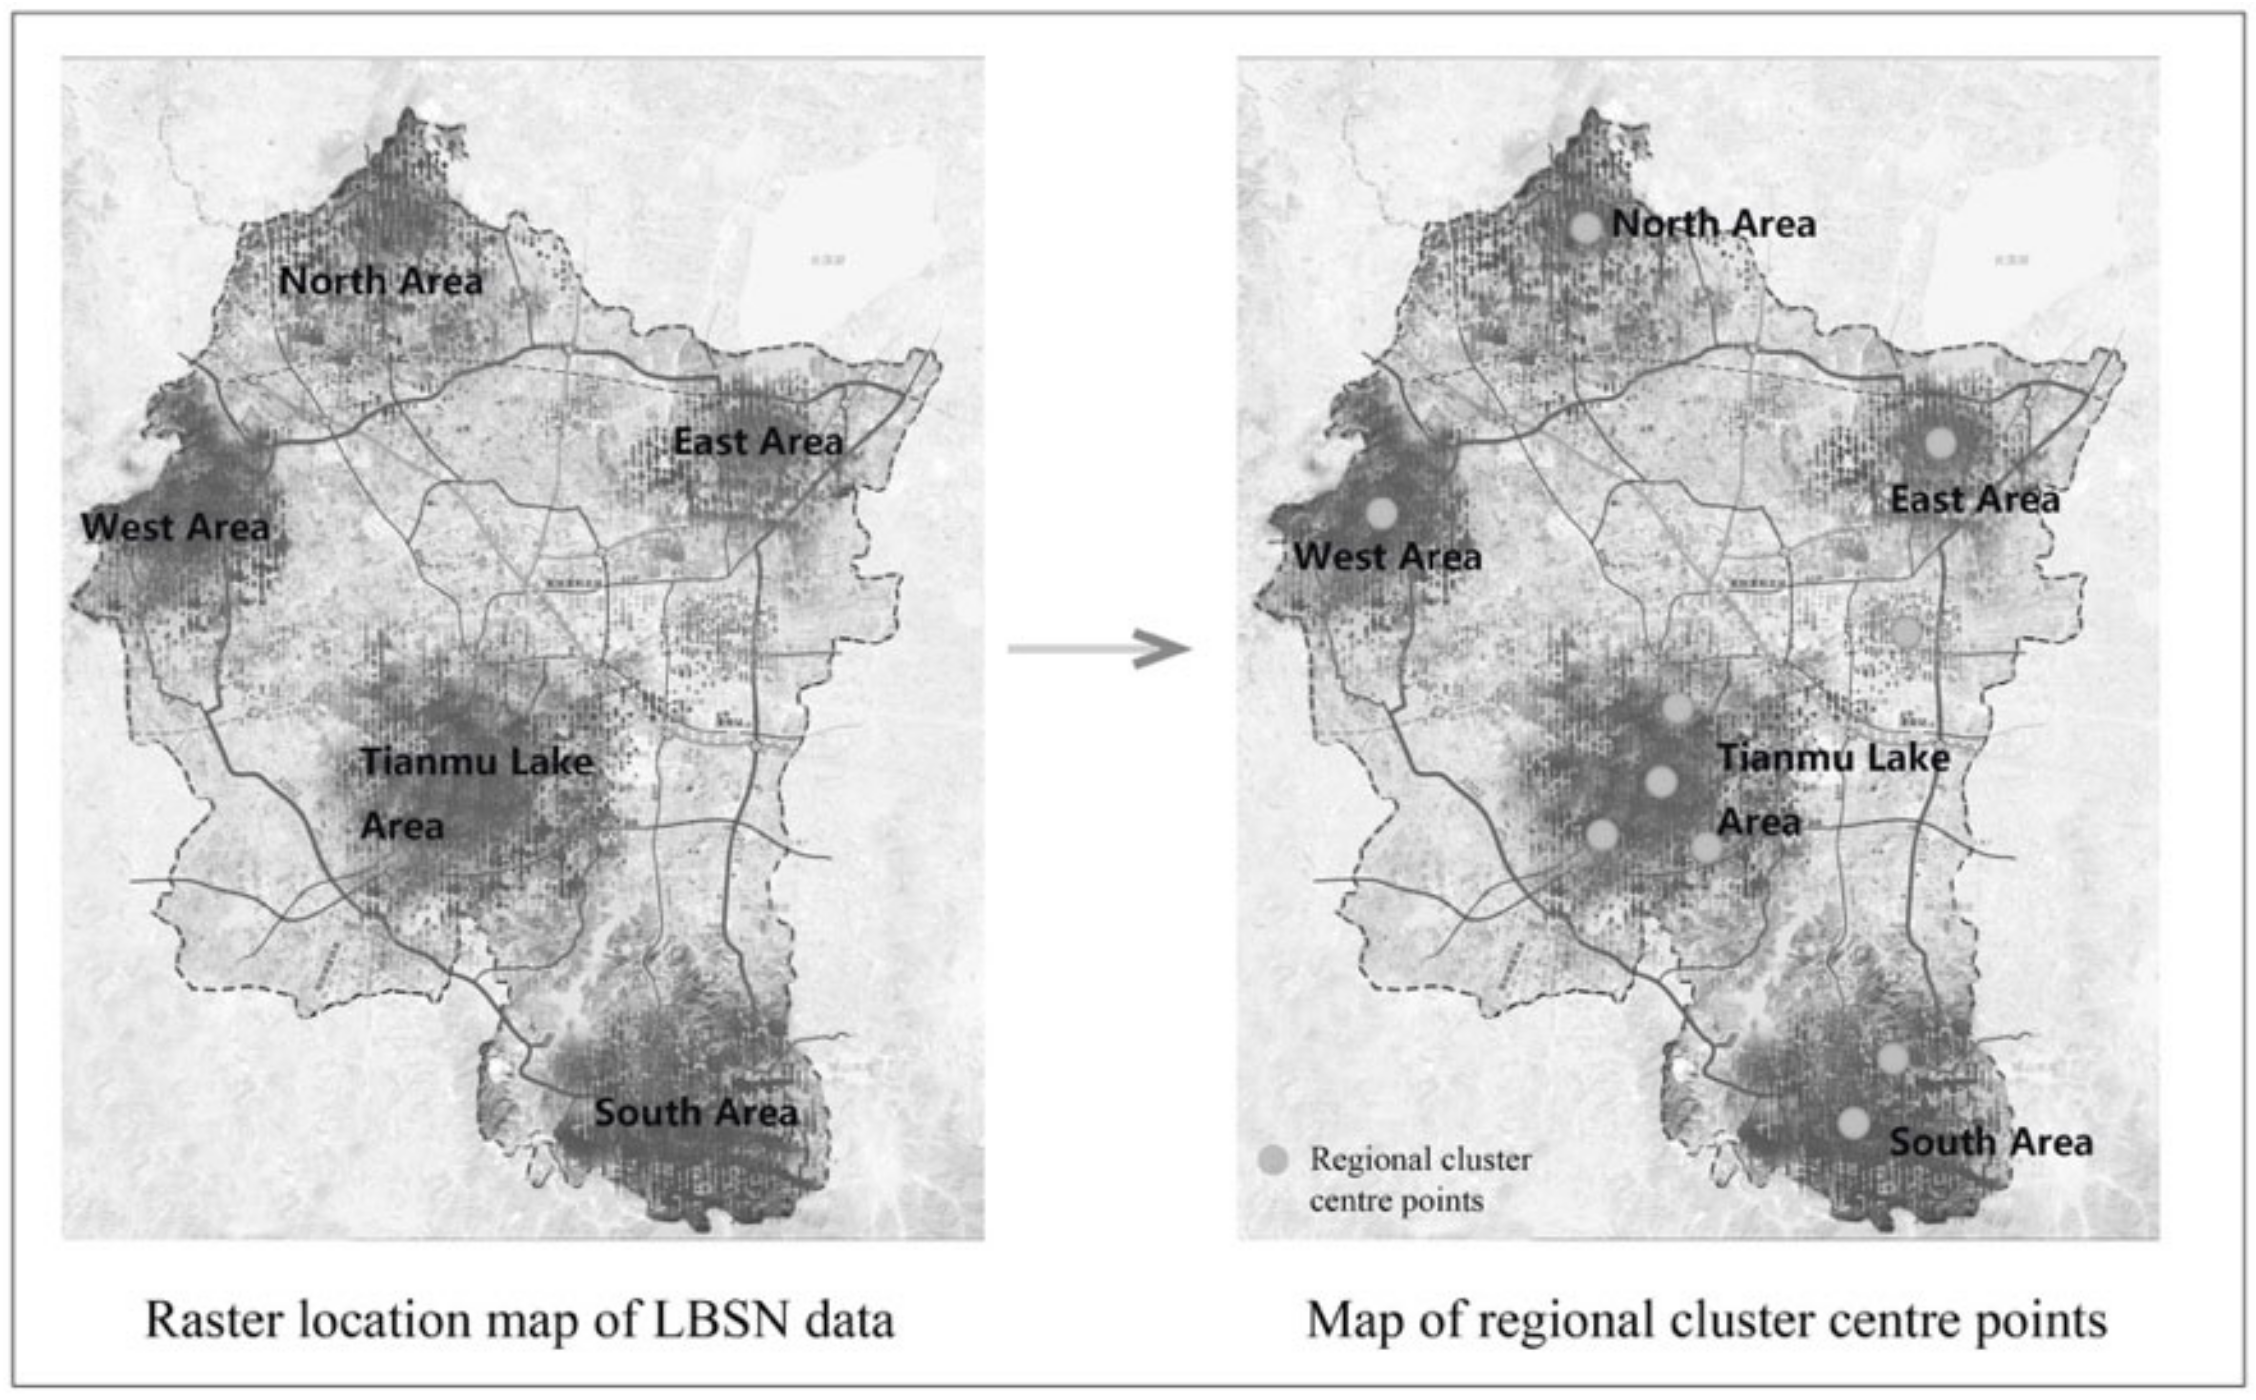
2.2. Measurement of Tourism Area Density Analysis
2.3. Measurement of Regional Tourism Flow Distribution Characteristics
2.4. Empirical Strategies
3. Case Study
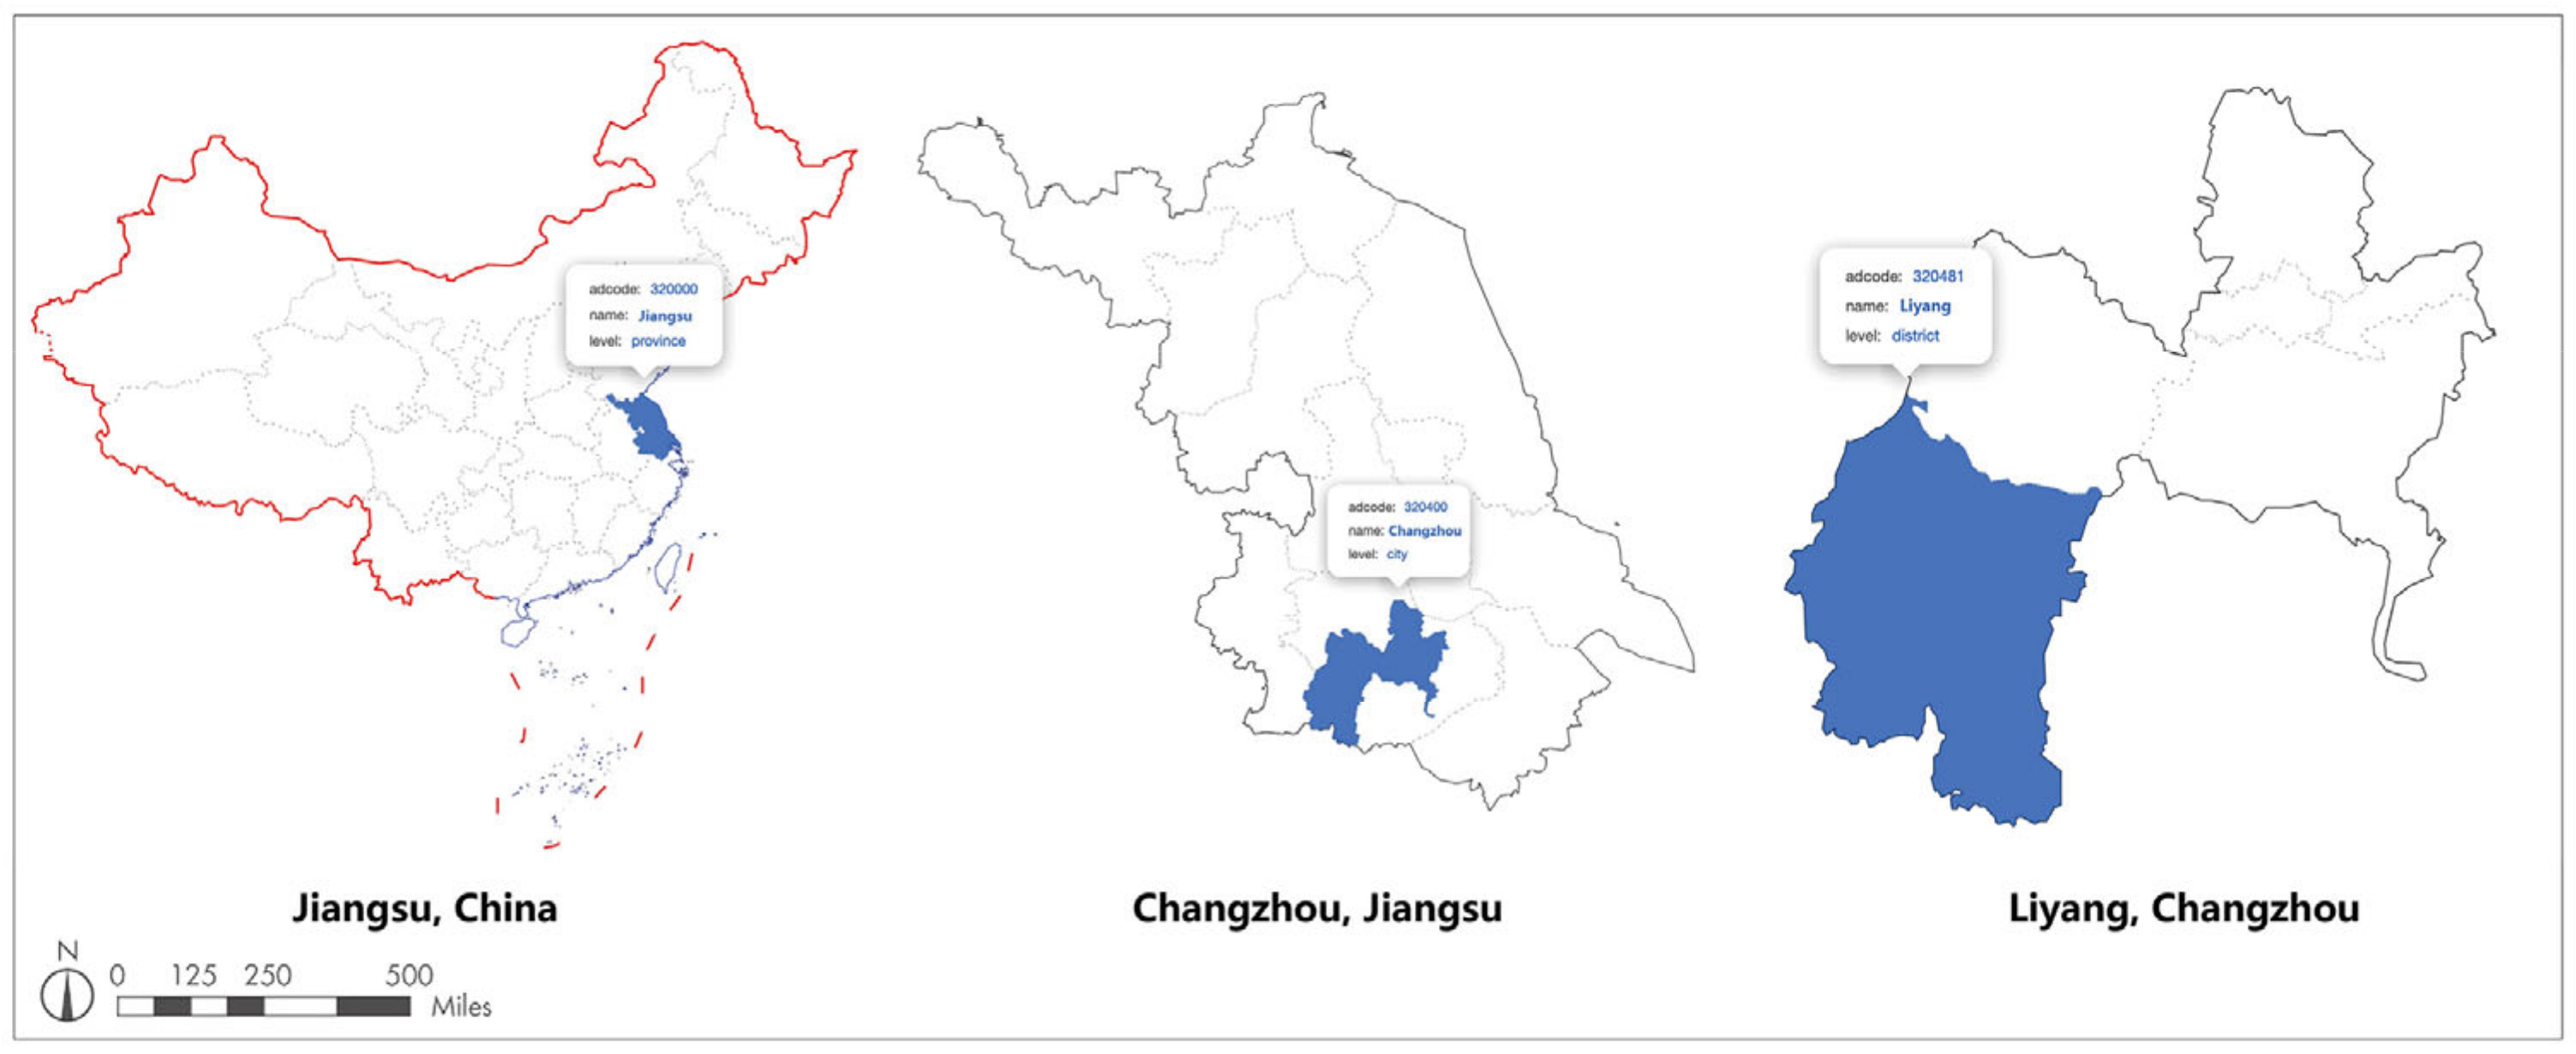
3.1. Study Area
3.2. Data Sources
3.2.1. Regional Government Planning Data
3.2.2. Mobile Terminal Background Check-in Data
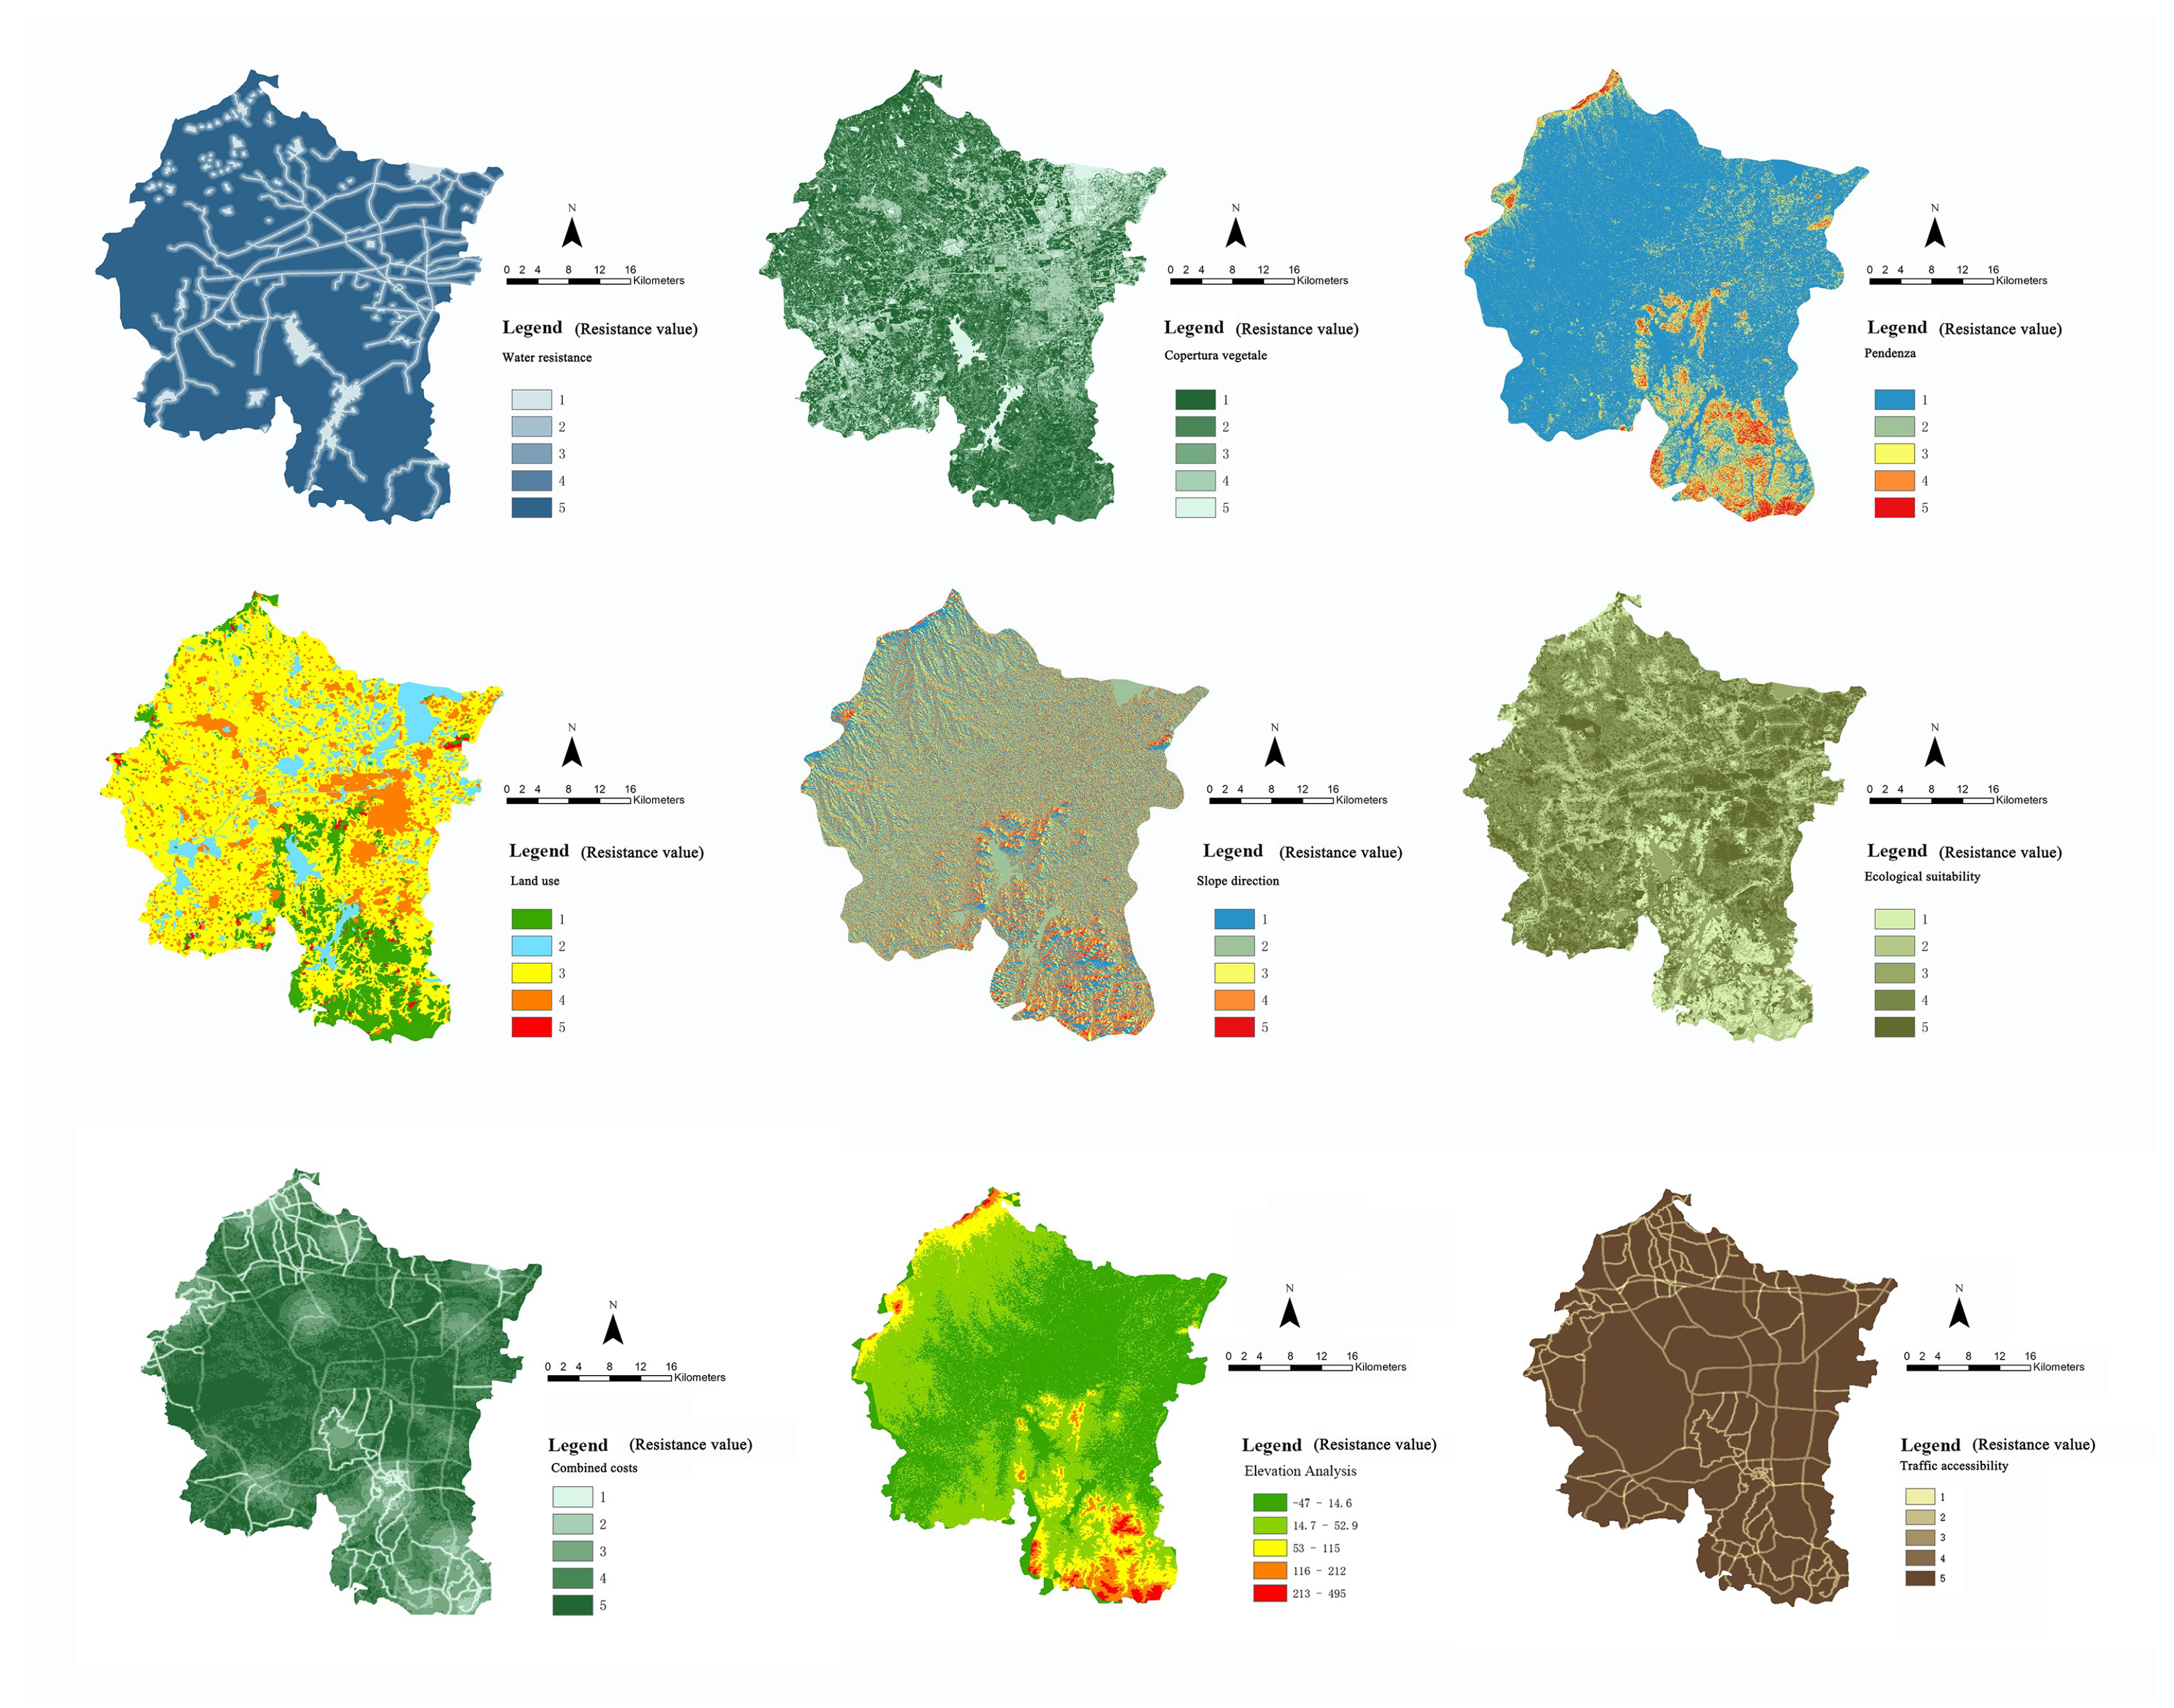
3.2.3. Land Use Data
4. Results
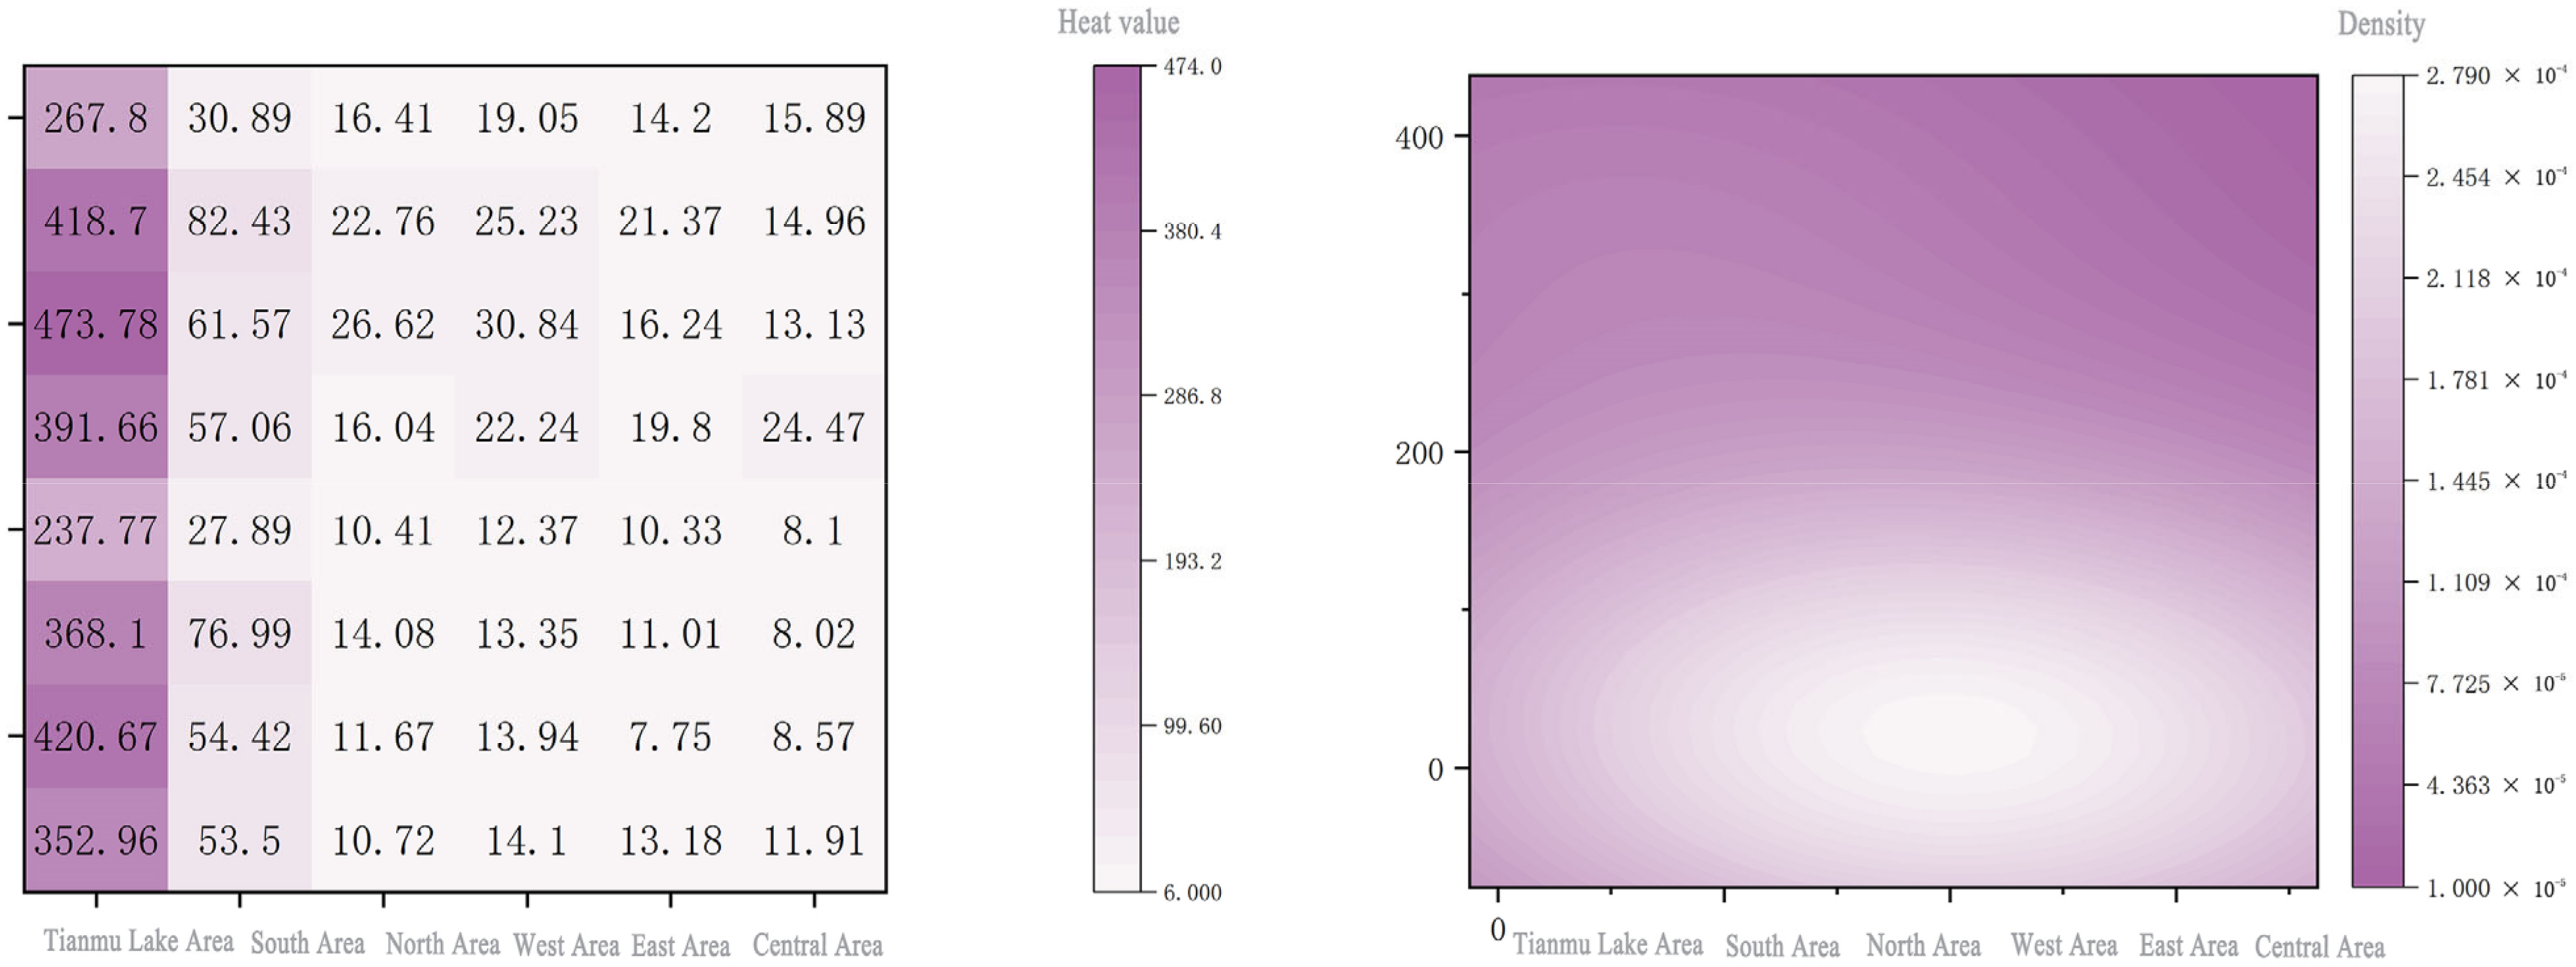
4.1. Dynamic Thermal Status Results of Tourist Areas
4.2. Density Results of Tourist Areas
4.3. Regional Tourism Flow Distribution Characteristics
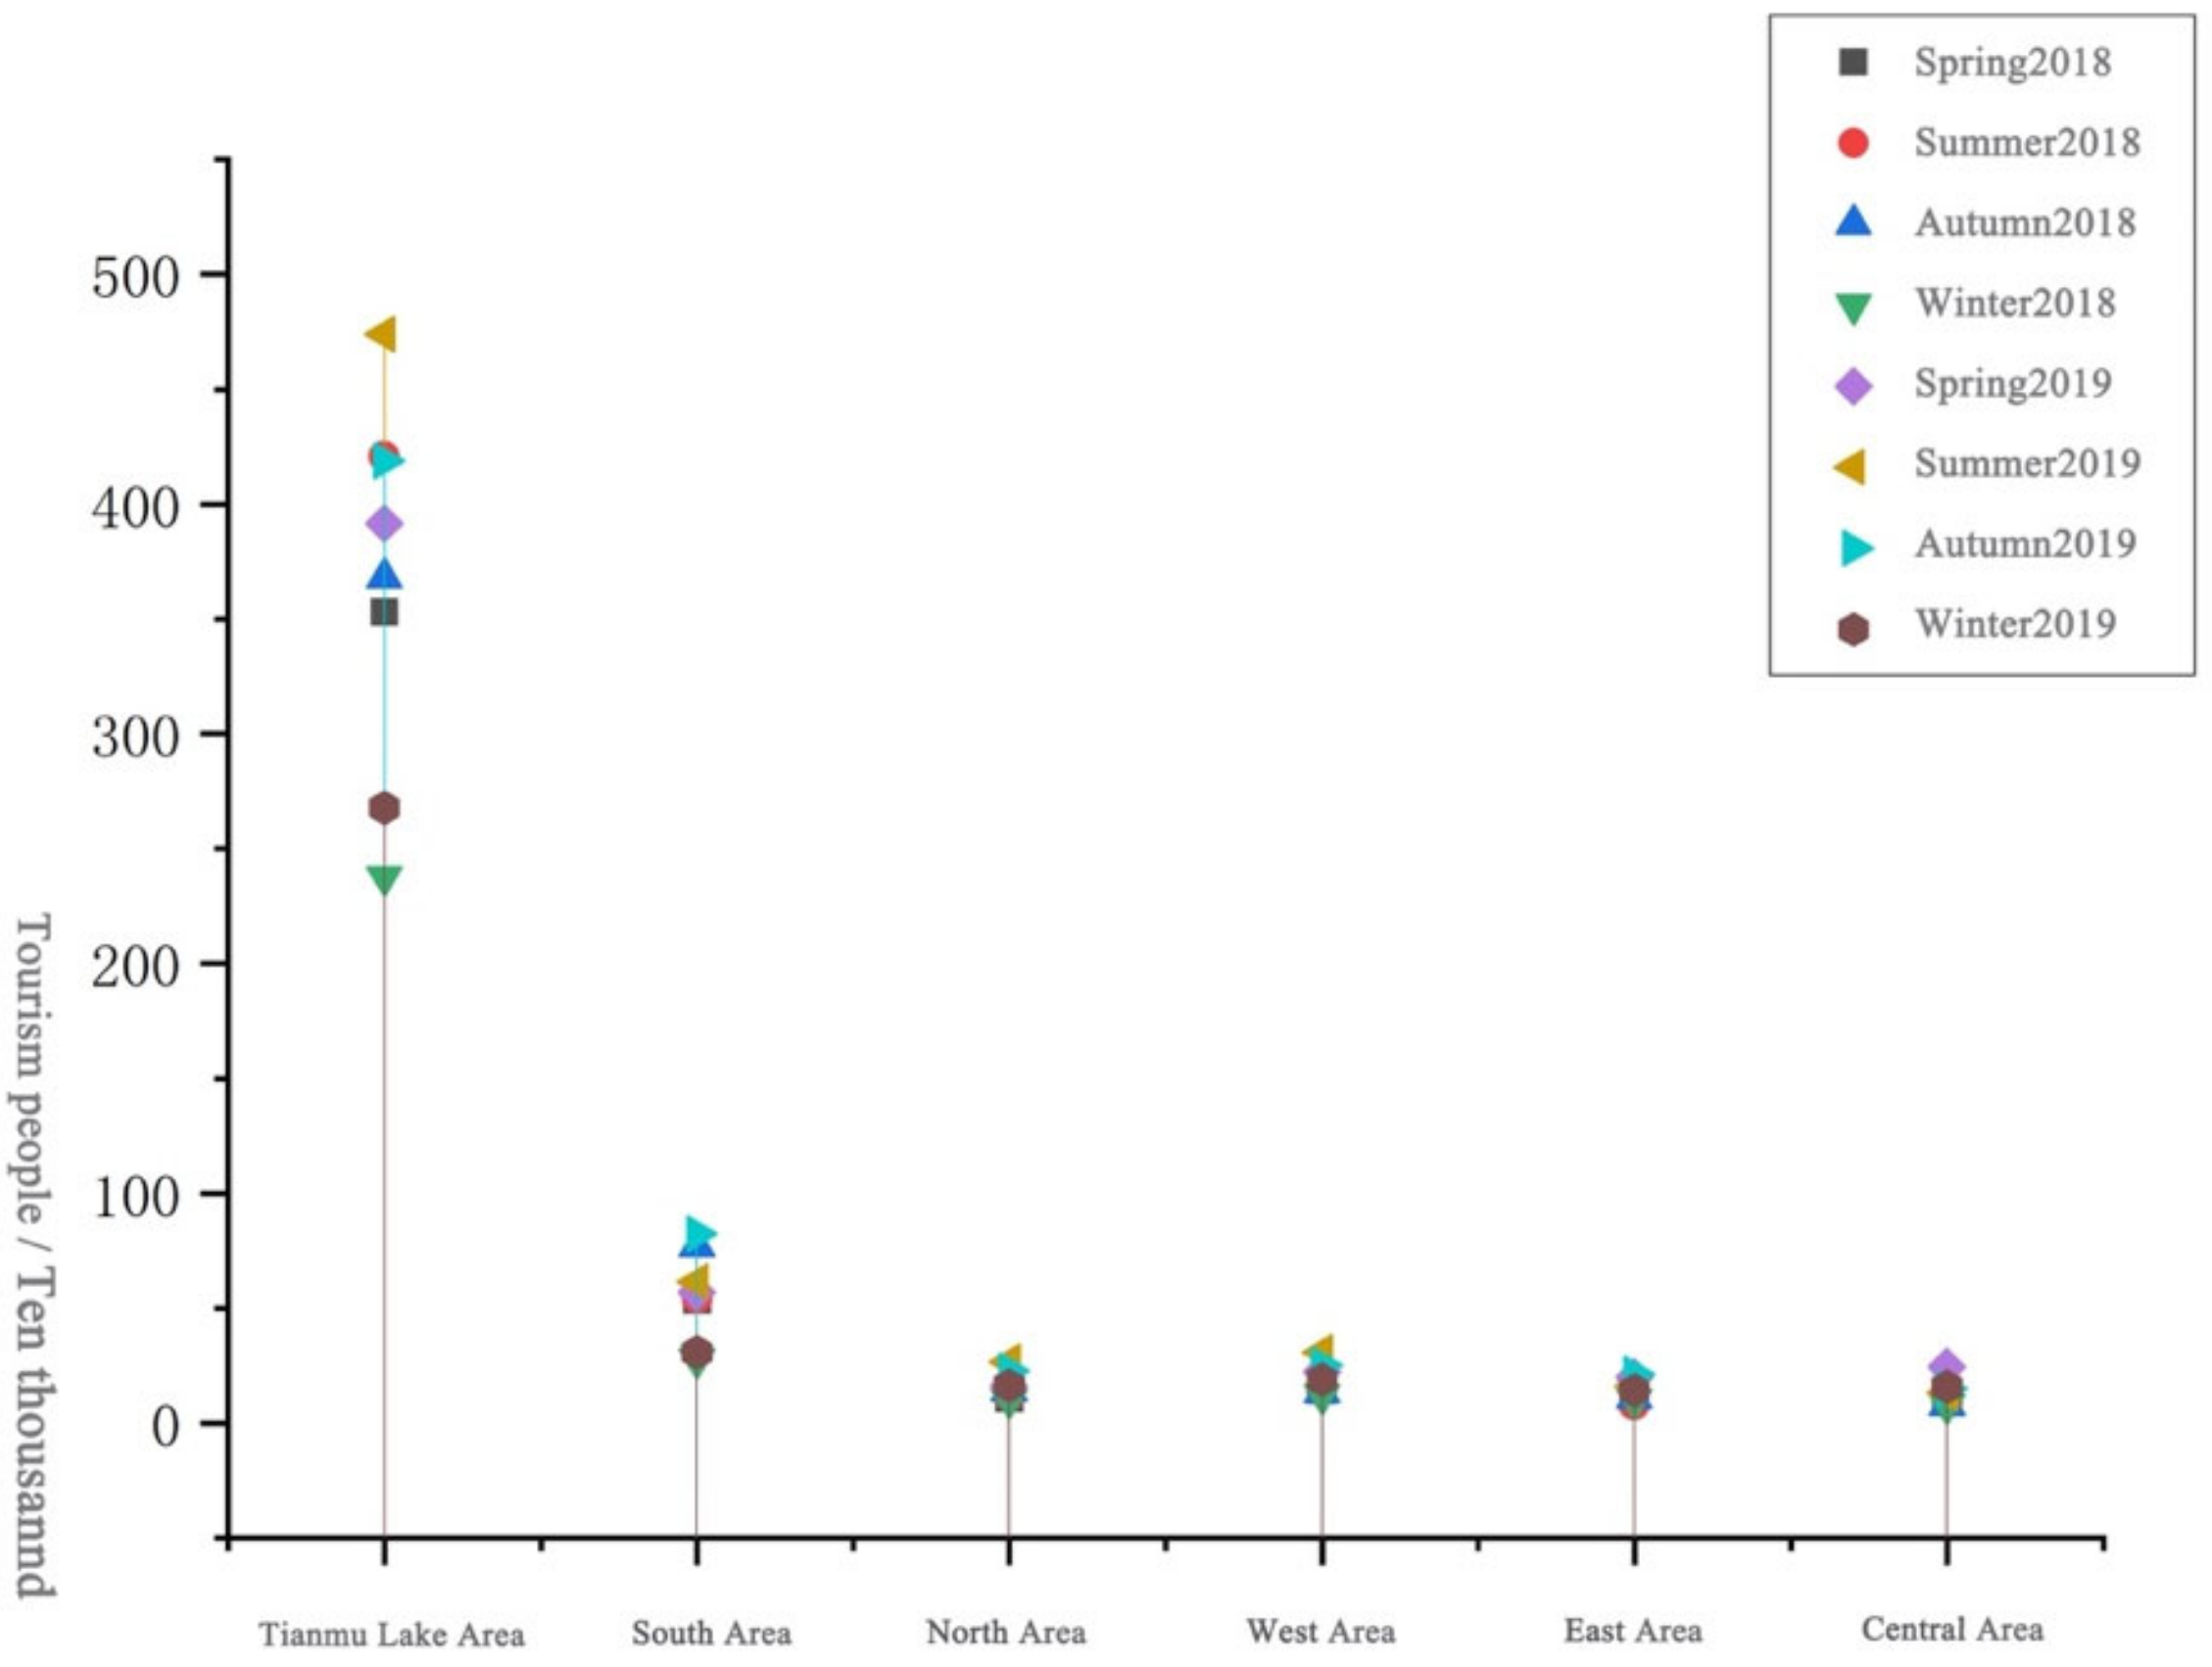
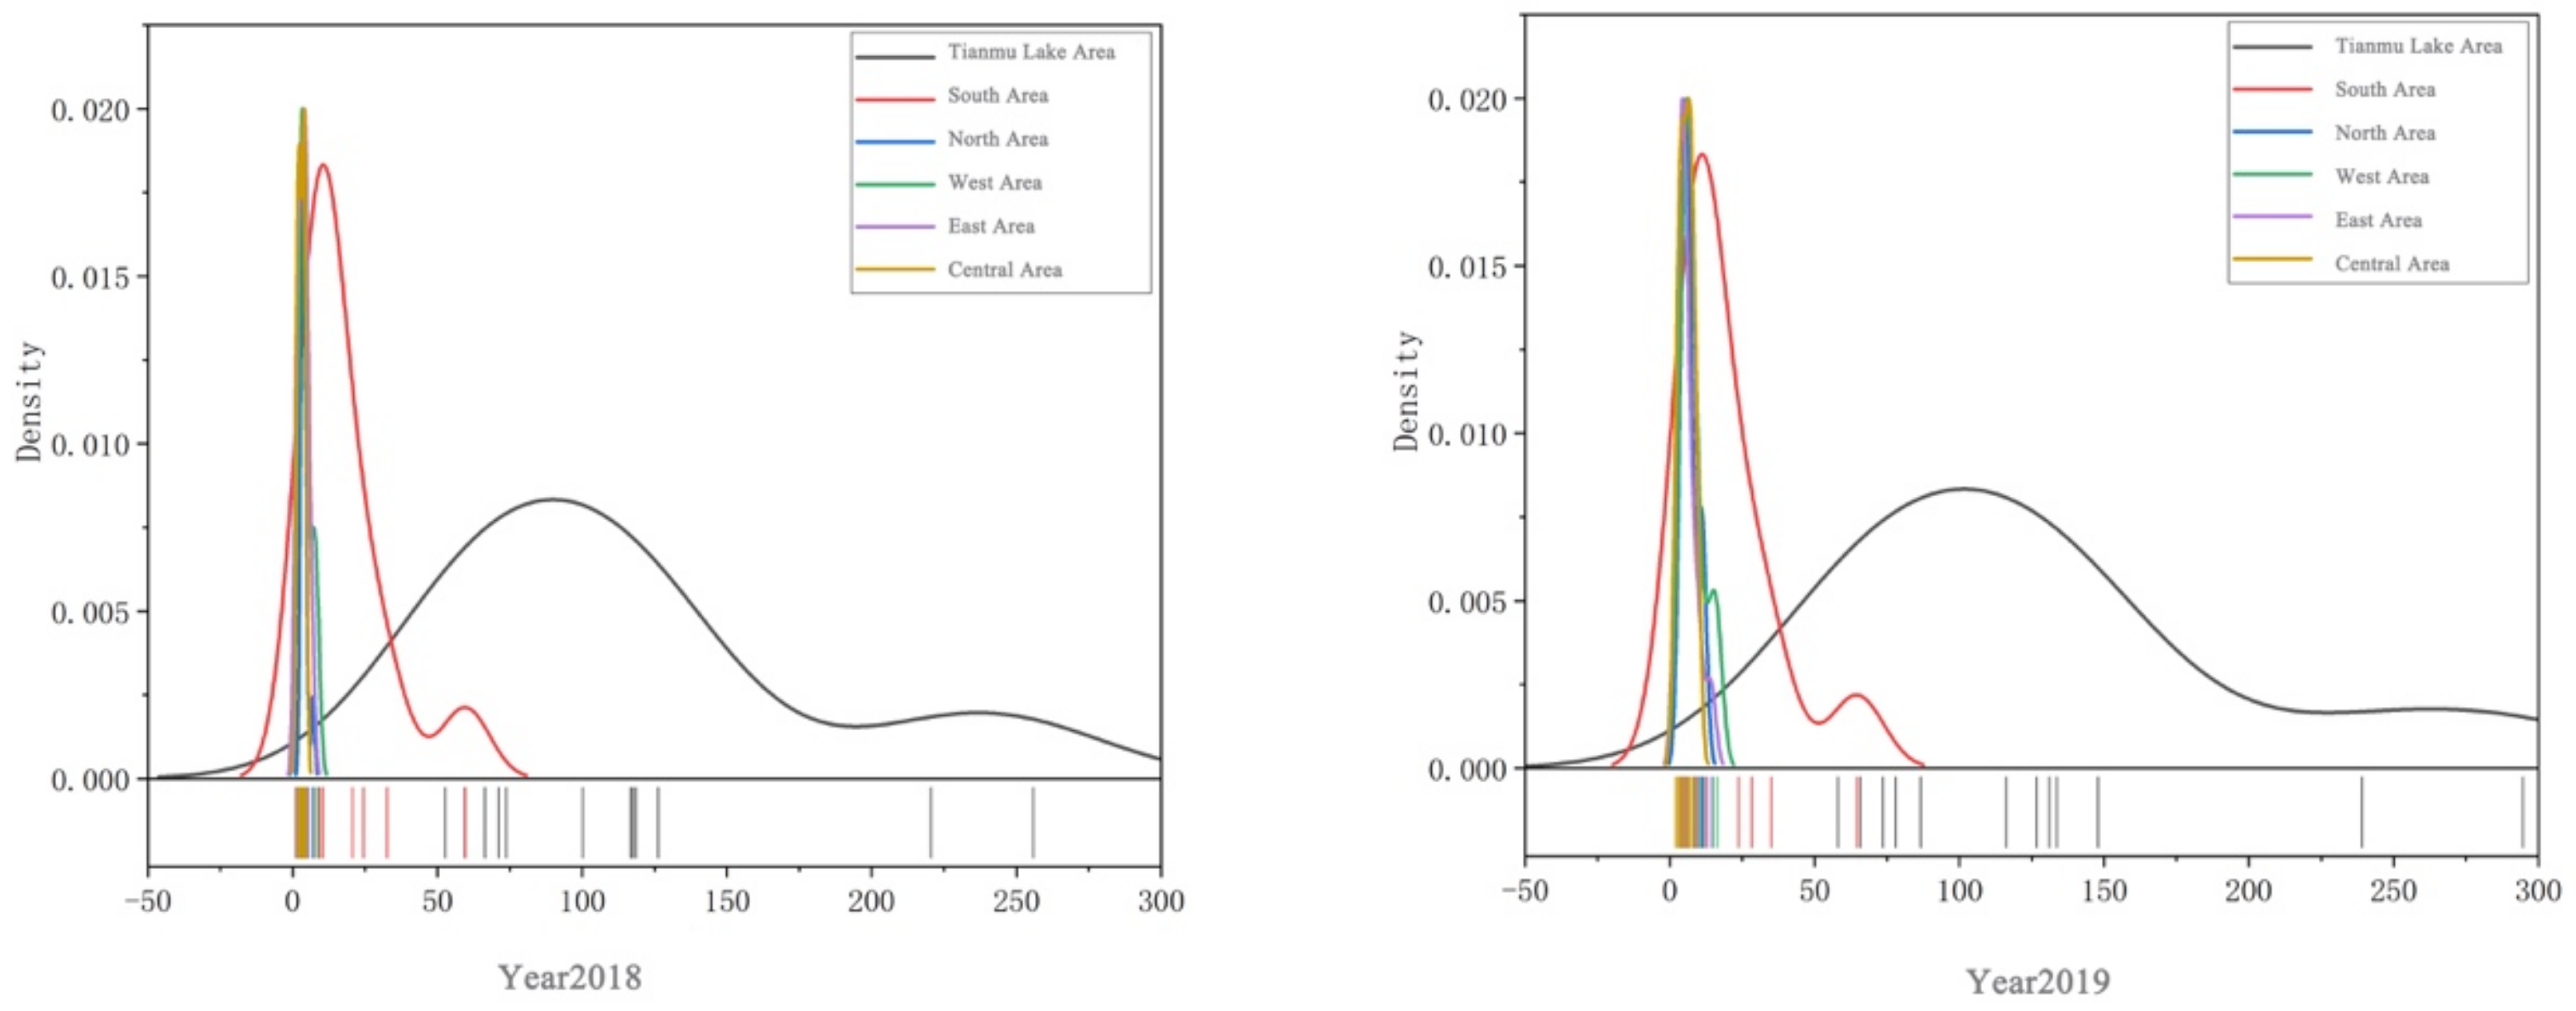
4.3.1. Regional Tourism Flow Time Distribution Characteristics
4.3.2. Regional Tourism Flow Spatial Distribution Characteristics
4.3.3. Regional Tourism Flow Effect Distribution Characteristics
5. Discussion
5.1. Is There a Healthy Trend towards Sustainable Regional Tourism Development?
5.2. How Can Truely Global Tourism Be Achieved?
5.3. Can This Study Be Applied to Other Similar Cities?
6. Conclusions
Author Contributions
Funding
Data Availability Statement
Conflicts of Interest
References
- McGehee, N.G. Volunteer Tourism: Evolution, Issues and Futures. J. Sustain. Tour. 2014, 22, 847–854. [Google Scholar] [CrossRef]
- Weaver, D.B.; Moyle, B.; McLennan, C.J. The Citizen within: Positioning Local Residents for Sustainable Tourism. J. Sustain. Tour. 2022, 30, 897–914. [Google Scholar] [CrossRef]
- Jamal, T.; Camargo, B.; Sandlin, J.; Segrado, R. Tourism and Cultural Sustainability: Towards an Eco-Cultural Justice for Place and People. Tour. Recreat. Res. 2010, 35, 269–279. [Google Scholar] [CrossRef]
- Li, X.; Zhang, L.; Cui, L. Global Tourism: A Conceptual Innovation for Building a World-Class Tourism Destination—The Case of Beijing. Cult. Geogr. 2013, 28, 130–134. [Google Scholar]
- Lv, J. Liaoning Coastal Economic Zone “Territorial Tourism” Development Study. Econ. Res. Ref. 2013, 52–56. [Google Scholar]
- Wang, D. Research on Folklore Tourism Development Model—A Practice-Based Exploration of Folklore Resource Development and Utilization Model. Folk. Res. 2003, 51–58. [Google Scholar]
- Wang, J.; Wei, J.; Wu, Z. Global Tourism: Concept Development and Rational Reflection. Tour. Guide 2018, 2, 66. [Google Scholar]
- Zhou, J.; Zhou, X.; Huang, Y. A Study of the Connotations of Global Tourism in Ganzi. Tour. Overv. 2015, 10, 99. [Google Scholar]
- Lojo, A. Chinese Tourism in Spain: An Analysis of the Tourism Product, Attractions and Itineraries Offered by Chinese Travel Agencies. Cuad. Tur. 2016, 243–268. [Google Scholar] [CrossRef] [Green Version]
- Zhang, Y.; Pu, S.; Shui, W.; Ma, W.; Zheng, S. Global Tourism: Background, Research Content and Prospects. Product. Res. 2018, 22–27. [Google Scholar]
- Zhao, L.; Liu, M. Review and Prospect of the Development of “Global Tourism”—A Dual Perspective of Theory and Practice. Bus. Econ. Res. 2018, 183–185. [Google Scholar]
- Cao, L.; Zhao, D.; Wei, X. A Study on the Measurement and Spatial and Temporal Evolution of the Development Level of Provincial Global Tourism in China. Resour. Dev. Mark. 2019, 4. [Google Scholar]
- Meng, X. Dissecting the Global Tourism Development Model. Tour. Overv. 2016, 4, 12–13. [Google Scholar]
- Tian, W. Study on the Development of Global Tourism in Shou County. 2019. [Google Scholar]
- Wei, X.; Zhang, L.; Fu, L.; Wang, Q.; Zhao, H. Leisure Standards and Urban Settlement. Stand. China 2014, 11. [Google Scholar]
- Li, Q. An Overview of the Theoretical Construction and Practical Experience of Global Tourism. Theatregoers 2020. [Google Scholar]
- Li, Z. Changes and Changes in the Era of Global Tourism. Tour. J. 2016, 31, 26–28. [Google Scholar]
- Shi, P. Knowing and Understanding “Global Tourism”. West. Dev. 2016, 102–104. [Google Scholar]
- Pi, C.; Zheng, X. A Study on the Safety Management System of the Global Tourism Based on the Perspective of Domain Change. J. Henan Univ. Soc. Sci. Ed. 2018, 58, 37–44. [Google Scholar]
- Zhang, H.; Yue, Y. Rational Thinking on Global Tourism. J. Tour. 2016, 31, 15–17. [Google Scholar]
- Griffin, K.; Stacey, J. Towards a ‘Tourism for All’Policy for Ireland: Achieving Real Sustainability in Irish Tourism. Curr. Issues Tour. 2011, 14, 431–444. [Google Scholar] [CrossRef]
- Sebele, L.S. Community-Based Tourism Ventures, Benefits and Challenges: Khama Rhino Sanctuary Trust, Central District, Botswana. Tour. Manag. 2010, 31, 136–146. [Google Scholar] [CrossRef]
- Wang, K.; Wu, G. Research on the Development and Protection of Ancient Villages in Anhui Province—A Field Survey Based on Xidi Town, Yixian County. Tour. Overv. 2018, 6. [Google Scholar]
- Zheng, X.; Yang, Z. A Study of Value Co-Creation in Tourism Services—A Perspective Based on Service Dominant Logic. Soc. Sci. 2016, 103–107. [Google Scholar]
- Bao, J.; Gan, M. Analysis of Changes in the Status of Urban Tourism Destinations in China since the Reform and Opening up and Factors. Geogr. Sci. 2004, 24, 365–371. [Google Scholar]
- Garrod, B.; Fyall, A. Beyond the Rhetoric of Sustainable Tourism? Tour. Manag. 1998, 19, 199–212. [Google Scholar] [CrossRef]
- Kitchin, R. The Real-Time City? Big Data and Smart Urbanism. GeoJournal 2014, 79, 1–14. [Google Scholar] [CrossRef] [Green Version]
- Saito, K.; Said, I.; Shinozaki, M. Evidence-Based Neighborhood Greening and Concomitant Improvement of Urban Heat Environment in the Context of a World Heritage Site-Malacca, Malaysia. Comput. Environ. Urban Syst. 2017, 64, 356–372. [Google Scholar] [CrossRef]
- Yang, Z.; Pan, Y. Are Cities Losing Their Vitality? Exploring Human Capital in Chinese Cities. Habitat Int. 2020, 96, 102104. [Google Scholar] [CrossRef]
- Yue, Y.; Zhuang, Y.; Yeh, A.G.O.; Xie, J.-Y.; Ma, C.-L.; Li, Q.-Q. Measurements of POI-Based Mixed Use and Their Relationships with Neighbourhood Vibrancy. Int. J. Geogr. Inf. Sci. 2017, 31, 658–675. [Google Scholar] [CrossRef] [Green Version]
- An, J. A Study on Crowd Gathering in Urban Scenic Areas Based on Heat Map Big Data—Taking Nanchang City’s Main Urban Area as an Example. Inf. Comput. 2020, 32, 143–145. [Google Scholar]
- Zhou, Y.; Yang, J.; Zhou, J.; Zhou, P.; Liu, H. A Study on the Measurement of Service Area Vitality of Rail Transit Stations Based on Heat Map Data—Shenzhen Metro as an Example. Peking Univ. J. 2020, 56, 875–883. [Google Scholar]
- Paskins, J.; Bell, S. Imagining the Future City: London 2062; Ubiquity Press: London, UK, 2013; ISBN 978-1-909188-18-1. [Google Scholar]
- De Nadai, M.; Staiano, J.; Larcher, R.; Sebe, N.; Quercia, D.; Lepri, B. The Death and Life of Great Italian Cities: A Mobile Phone Data Perspective. In Proceedings of the 25th International Conference on World Wide Web, Montréal, QC, Canada, 11 April 2016; pp. 413–423. [Google Scholar]
- Zarin, S.Z.; Niroomand, M.; Heidari, A.A. Physical and Social Aspects of Vitality Case Study: Traditional Street and Modern Street in Tehran. Procedia Soc. Behav. Sci. 2015, 170, 659–668. [Google Scholar] [CrossRef] [Green Version]
- Ewing, R.; Cervero, R. Travel and the Built Environment: A Meta-Analysis. J. Am. Plan. Assoc. 2010, 76, 265–294. [Google Scholar] [CrossRef]
- Zhen, F. Innovation in Urban Research and Planning Methods Based on Big Data; China Architecture & Building Press: Beijing, China, 2015; ISBN 7-112-18419-3. [Google Scholar]
- Wu, Z.; Ye, C. A Study of Urban Spatial Structure Based on Baidu Map Heat Map—An Example of Shanghai Central City. Urban Plan. 2016, 33–40. [Google Scholar]
- Jin, Z.; Zhou, L.; Zou, W.; Shi, C. A Study on the Identification and Evaluation Index System of Public Activity Centres in Megacities Based on Multi-Source Data—Shanghai as an Example. Urban Plan. J. 2019, 6. [Google Scholar]
- Wang, M. Polycentric Urban Development and Urban Amenities: Evidence from Chinese Cities. Environ. Plan. B Urban Anal. City Sci. 2021, 48, 400–416. [Google Scholar] [CrossRef]
- He, X. Research on User Feature Extraction and Behaviour Patterns in Location-Based Social Networks. Master’s Thesis, Nanjing University of Posts and Telecommunications, Nanjing, China, 2019. [Google Scholar]
- Gong, X.; Pei, T.; Sun, J.; Luo, M. Advances in Spatio-Temporal Trajectory Clustering Methods. Adv. Geosci. 2011, 30, 522–534. [Google Scholar]
- Liu, S. Research and Implementation of Spatial Data Clustering Analysis Algorithm. Master’s Thesis, China University of Geosciences, Wuhan, China, 2011. [Google Scholar]
- Kaufman, L.; Rousseeuw, P.J. Finding Groups in Data: An Introduction to Cluster Analysis; John Wiley & Sons: Hoboken, NJ, USA, 2009; ISBN 0-470-31748-5. [Google Scholar]
- Guha, S.; Rastogi, R.; Shim, K. CURE: An Efficient Clustering Algorithm for Large Databases. ACM Sigmod Rec. 1998, 27, 73–84. [Google Scholar] [CrossRef]
- Karypis, G.; Han, E.-H.; Kumar, V. Chameleon: Hierarchical Clustering Using Dynamic Modeling. Computer 1999, 32, 68–75. [Google Scholar] [CrossRef] [Green Version]
- Zhang, T.; Ramakrishnan, R.; Livny, M. BIRCH: An Efficient Data Clustering Method for Very Large Databases. ACM Sigmod Rec. 1996, 25, 103–114. [Google Scholar] [CrossRef]
- Ankerst, M.; Breunig, M.M.; Kriegel, H.-P.; Sander, J. OPTICS: Ordering Points to Identify the Clustering Structure. ACM Sigmod Rec. 1999, 28, 49–60. [Google Scholar] [CrossRef]
- Ester, M.; Kriegel, H.-P.; Sander, J.; Xu, X. A Density-Based Algorithm for Discovering Clusters in Large Spatial Databases with Noise. In Proceedings of the KDD’96: Proceedings of the Second International Conference on Knowledge Discovery and Data Mining, Portland, OR, USA, 2–4 August 1996; Volume 96, pp. 226–231. [Google Scholar]
- Hinneburg, A.; Keim, D.A. An Efficient Approach to Clustering in Large Multimedia Databases with Noise. In Proceedings of the KDD’98: Proceedings of the Fourth International Conference on Knowledge Discovery and Data Mining, New York, NY, USA, 27–31 August 1998; Volume 98, pp. 58–65. [Google Scholar]
- Zhao, J.; Tang, J.; Shi, A.; Fan, T.; Xu, L. Improved Density Peaks Clustering Based on Firefly Algorithm. Int. J. Bio Inspired Comput. 2020, 15, 24–42. [Google Scholar] [CrossRef]
- Agrawal, R.; Gehrke, J.; Gunopulos, D.; Raghavan, P. Automatic Subspace Clustering of High Dimensional Data for Data Mining Applications. ACM SIGMOD Rec. 1998, 27, 94–105. [Google Scholar] [CrossRef]
- Sheikholeslami, G.; Chatterjee, S.; Zhang, A. Wavecluster: A Multi-Resolution Clustering Approach for Very Large Spatial Databases. In Proceedings of the VLDB’98: Proceedings of the 24rd International Conference on Very Large Data Bases, New York, NY, USA, 24–27 August 1998; Volume 98, pp. 428–439. [Google Scholar]
- Wang, W.; Yang, J.; Muntz, R. STING: A Statistical Information Grid Approach to Spatial Data Mining. In Proceedings of the VLDB’97: Proceedings of the 23rd International Conference on Very Large Data Bases, Athens, Greece, 25–29 August 1997; Volume 97, pp. 186–195. [Google Scholar]
- He, C.; Wu, S.; Zhao, Y.; Li, Z.; Zhang, Y.; Le, J.; Wang, L.; Wan, S.; Li, C.; Li, Y. Social Media–Promoted Weight Loss among an Occupational Population: Cohort Study Using a WeChat Mobile Phone App-Based Campaign. J. Med. Internet Res. 2017, 19, e7861. [Google Scholar] [CrossRef]
- Dai, W.; Ding, L.; Wu, C.; Liu, P.; Zhang, W. A Study on the Spatial and Temporal Distribution Characteristics of Tourism Flows Based on Big Data—Taking Nanjing as an Example. Mod. Urban Res. 2019, 2. [Google Scholar]
- Ma, B.; Chen, X.; Chen, F. Multi-Scale Spatio-Temporal Variation of Dunhuang Tourism Flows Based on Social Big Data. Econ. Geogr. 2021. [Google Scholar]
- Lowry, J.H.; Lowry, M.B. Comparing Spatial Metrics That Quantify Urban Form. Comput. Environ. Urban Syst. 2014, 44, 59–67. [Google Scholar] [CrossRef]
- Tang, X.; Zhang, A.; Chu, J.; Yan, T. Density Peaking Clustering Algorithm Based on Natural Nearest Neighbours. Comput. Sci. 2021, 48, 151–157. [Google Scholar]
- Rodriguez, A.; Laio, A. Clustering by Fast Search and Find of Density Peaks. Science 2014, 344, 1492–1496. [Google Scholar] [CrossRef] [Green Version]
- Yang, F.; Cao, J.; Zhou, K.; Zhang, P.; Wang, Y. An Adaptive Clustering Algorithm Based on CFSFDP. In Proceedings of the 2018 33rd Youth Academic Annual Conference of Chinese Association of Automation (YAC), Nanjing, China, 18–20 May 2018; pp. 404–408. [Google Scholar]
- Bai, E.; Luo, K.; Luo, X. Density Peaking Clustering Algorithm Combining Natural and Shared Nearest Neighbours. Comput. Sci. Explor. 2020, 15, 931–940. [Google Scholar]
- Guo, S.; Tang, J.; Liu, H.; Gu, X. Study on Landscape Architecture Model Design Based on Big Data Intelligence. Big Data Res. 2021, 25, 100219. [Google Scholar] [CrossRef]
- Wu, J.; Lu, Y.; Gao, H.; Wang, M. Cultivating Historical Heritage Area Vitality Using Urban Morphology Approach Based on Big Data and Machine Learning. Comput. Environ. Urban Syst. 2022, 91, 101716. [Google Scholar] [CrossRef]
- Zhang, X. Research on the Development Strategies of Rural Tourism in Suzhou Based on SWOT Analysis. Energy Procedia 2012, 16, 1295–1299. [Google Scholar] [CrossRef] [Green Version]
- Lu, L.; Tang, Y. Spatial Behaviour Patterns of Domestic Travellers in the Pearl River Delta Metropolitan Area. Geogr. Sci. 2014, 34, 10–18. [Google Scholar]
- Shi, P. The Path Mode of Tourism Theory Innovation in the New Era—A Discussion on the Scientific Principles and Theoretical System of Global Tourism. Nankai Manag. Rev. 2018, 21, 222–224. [Google Scholar]
- Su, M. Sustainable Tourism and Community Development in Tourist Destinations. Tour. J. 2014, 29, 8–9. [Google Scholar]
- Tosun, C. Expected Nature of Community Participation in Tourism Development. Tour. Manag. 2006, 27, 493–504. [Google Scholar] [CrossRef]


| Author (Year), Study Area | Data Source and Method | Advantages | Disadvantages |
|---|---|---|---|
| [33] London, UK | Web-based open source multi-genre data | Study using multiple types of data for the first time. Objective and realistic analysis. | The cost of data collection is too high to promote its use. |
| [34] Six cities, Italy | Mobile Wi-Fi location data | A detailed analysis of the dynamic thermal can be carried out on a macro-scale. 9i | Subjective with a human starting point. Some Wi-Fi access points (e.g., private Wi-Fi) are excluded and some groups (e.g., people who do not use mobile phones) are ignored. |
| [35] Tehran, Iran | Questionnaire and linear regression analysis methods | The factors influencing dynamic thermal status can be analyzed in terms of traffic. | Traffic represents only one particular aspect of heat. Traffic data are not free from their inherent biases. |
| [30,36] U.S. and Singapore | Google Street View Images, Expert scoring and GIS | Data are easy to access and are a powerful way of reflecting the thermal status of the city. | Only the area during the departure and arrival of the Street View camera can be captured and the data are not accurate. |
| [37]China | Big data | Four dimensions—national, Yangtze River Delta, city, and street space—are used to complete the theoretical framework for urban thermal analysis. | Parts of the data are not disclosed to the public and access to the dataset is difficult. |
| [38] Shanghai, China | Baidu map Heat map | Helps overcome the ambiguity of spatio-temporal data by moving from a ‘time-space’ perspective to a point of view. | The intuitiveness of spatial perspective analysis is ignored. |
| [39] Shanghai, China | Commercial facility building base volumes, cellular signaling data and POI data | The spatial resources are evaluated in different dimensions and the results can be used to facilitate urban planning. | It is difficult to obtain this dataset for the building base of commercial facilities and the dimensional selection is small. |
| [40] Beijing and Guangzhou, China | POI data obtained by open API services of Dianping | Data are easy to access and are a powerful way of reflecting the urban pattern. | Unable to take into account the contribution of each point to the heat. |
| Types of Clustering Algorithms | Major Clustering Algorithm Models | Advantages and Disadvantages |
|---|---|---|
| Delineated clustering algorithm | K-means Algorithm, K-medoids Algorithm, Expectation Maximization Algorithm [44] | Easy to understand and implement. |
| Hierarchical clustering algorithms | BIRCH Algorithm, CURE algorithm, CHAMELEON Algorithm [45,46,47] | Less flexible; need to be used in conjunction with other methods. |
| Density clustering algorithm | DPC Algorithm, DBSCAN Algorithm, OPTICS Algorithm, DENCLUE Algorithm [48,49,50,51] | High accuracy; any shape of clustering can be found. |
| Grid clustering algorithm | STING Algorithm, CLIQUE Algorithm, WAVE-CLUSTER Algorithm [52,53,54] | Fast processing speed; low volume of data. |
| Model clustering algorithms | COBWEB Algorithm, Competitive Learning Algorithm [43,55] | Selected results are representative. |
| Other clustering algorithms | FCM Algorithm, Quantum Algorithm, SVM Algorithm, etc. [43] | Immature; low feasibility. |
| Area Names | Positioning | Development Ideas |
|---|---|---|
| North Area | Meditation Eco Resort | Waya Mountain as the core, Jizo culture and meditation culture as the characteristics, leisure sports system construction as the focus |
| South Area | Bamboo Forest Tea Village Wellness Resort | Relying on the mountains, water, bamboo, forest, hot springs, tea country, etc., in the Nanshan area tourism elements, implanting Deshou culture |
| West Area | Longevity Slow City Resort | Create an international slow city with local characteristics that integrates ecology, culture, and recuperation |
| East Area | Water leisure experience Resort | Relying on the Changdang Lake National Wetland Park and the Chinese Ape Geopark, forming a three-dimensional tour space of water, land and air |
| Tianmu Lake Area | Liyang City Card | Using Tianmu Lake tourism resort resources as a basis to create a city tourism brand Using Tianmu Lake tourism resort resources as a basis to create a city tourism brand |
| Central Area | Tourism Auxiliary Service Center | Providing tourism services such as catering, accommodation, transportation, entertainment and shopping, and undertaking functions such as tourism information consultation in Liyang. |
| Year | Planning Policy | Policy Content |
|---|---|---|
| 2016–2030 | Liyang Municipal Comprehensive Transportation Planning | Developing diversified urban transportation system and building a global tourism leisure corridor. |
| 2016–2030 | Liyang Municipal Tourism Traffic Planning | Planning landscape paths and tourist public transport to establish internal and external tourist transport organization and promote the development of global tourism in a comprehensive manner. |
| 2016–2030 | Liyang Tourism Planning | Use road networks to connect tourism resources across the region, linking the various tourism sub-regions, with ‘global tourism’ as the core, realizing the scenery across the city and strengthening the global pattern. |
| 2016–2030 | Liyang Municipal Industry Layout Planning | Accelerating industrial transformation, focusing on creating leisure and vacation tourism, and emphasizing the integration of development among the three industries. The emphasis is on creating leisure and holiday tourism and promoting the development of supporting services for global tourism. |
| Number | Coordinate | location Names | Number of Raster Points |
|---|---|---|---|
| 1 | 119°25′48′′ E, 31°17′24′′ N | Tianmu Lake | 26,757 |
| 2 | 119°31′12′′ E, 31°10′48′′ N | Nanshan Zhuhai | 15,783 |
| 3 | 119°18′0′′ E, 31°39′0′′ N | Wawu Shan | 9856 |
| 4 | 119°12′0′′ E, 31°31′48′′ N | Qicai Caoshan | 10,674 |
| 5 | 119°31′12′′ E, 31°29′24′′ N | Shihou Temple | 7325 |
| 6 | 119°30′0′′ E, 31°25′12′′ N | Gao Jing Yuan | 5639 |
| Area Name | 2018 (Million People) | 2019 (Million People) | Total (Million People) |
|---|---|---|---|
| Tianmu Lake Area | 1379.5 | 1551.94 | 2931.44 |
| South Area | 212.8 | 231.95 | 444.75 |
| North Area | 46.88 | 81.83 | 128.71 |
| West Area | 53.76 | 97.36 | 151.12 |
| East Area | 42.27 | 71.61 | 113.88 |
| Central Area | 36.6 | 68.45 | 105.05 |
| Area Name | 2018 Spring | 2018 Summer | 2018 Autumn | 2018 Winter | 2019 Spring | 2019 Summer | 2019 Autumn | 2019 Winter |
|---|---|---|---|---|---|---|---|---|
| Tianmu Lake Area | 352.96 | 420.67 | 368.1 | 237.77 | 391.66 | 473.78 | 418.7 | 267.8 |
| South Area | 53.5 | 54.42 | 76.99 | 27.89 | 57.06 | 61.57 | 82.43 | 30.89 |
| North Area | 10.72 | 11.67 | 14.08 | 10.41 | 16.04 | 26.62 | 22.76 | 16.41 |
| West Area | 14.1 | 13.94 | 13.35 | 12.37 | 22.24 | 30.84 | 25.23 | 19.05 |
| East Area | 13.18 | 7.75 | 11.01 | 10.33 | 19.8 | 16.24 | 21.37 | 14.2 |
| Central Area | 11.91 | 8.57 | 8.02 | 8.1 | 24.47 | 13.13 | 14.96 | 15.89 |
| Area/Month | Tianmu Lake Area | South Area | North Area | West Area | East Area | Central Area |
|---|---|---|---|---|---|---|
| January | 100.24 | 10.22 | 3.56 | 3.77 | 3.79 | 3.07 |
| February | 71.19 | 8.69 | 2.98 | 3.12 | 2.56 | 2 |
| March | 116.78 | 10.45 | 3.46 | 3.56 | 4.08 | 3.78 |
| April | 117.56 | 10.38 | 3.25 | 3.55 | 4.12 | 3.99 |
| May | 118.62 | 32.67 | 4.01 | 6.99 | 4.98 | 4.14 |
| June | 73.77 | 9.19 | 2.68 | 2.96 | 1.34 | 1.99 |
| July | 126.34 | 20.68 | 4.66 | 3.44 | 1.07 | 2.56 |
| August | 220.56 | 24.55 | 4.33 | 7.54 | 5.34 | 4.02 |
| September | 59.52 | 8.66 | 3.54 | 2.3 | 2.34 | 1.77 |
| October | 255.87 | 59.66 | 6.99 | 8.65 | 6.77 | 4.68 |
| November | 52.71 | 8.67 | 3.55 | 2.4 | 1.9 | 1.57 |
| December | 66.34 | 8.98 | 3.87 | 5.48 | 3.98 | 3.03 |
| Area/Month | Tianmu Lake Area | South Area | North Area | West Area | East Area | Central Area |
|---|---|---|---|---|---|---|
| January | 116.19 | 12.68 | 6.13 | 6.53 | 5.03 | 6.43 |
| February | 78.06 | 9.01 | 3.52 | 4.25 | 3.32 | 4.03 |
| March | 126.78 | 11.12 | 5.13 | 5.91 | 4.95 | 6.76 |
| April | 131.12 | 10.84 | 4.32 | 5.11 | 5.4 | 7.98 |
| May | 133.76 | 35.1 | 6.59 | 11.22 | 9.45 | 9.73 |
| June | 86.67 | 9.42 | 5.69 | 6.63 | 3.35 | 2.01 |
| July | 147.87 | 23.82 | 10.01 | 7.8 | 4.07 | 4.35 |
| August | 239.24 | 28.33 | 10.92 | 16.41 | 8.82 | 6.77 |
| September | 65.79 | 8.76 | 6.53 | 4.48 | 4.39 | 3.54 |
| October | 294.74 | 64.67 | 11.72 | 14.89 | 14.01 | 8.36 |
| November | 58.17 | 9 | 4.51 | 5.86 | 2.97 | 3.06 |
| December | 73.55 | 9.2 | 6.76 | 8.27 | 5.85 | 5.43 |
| Area/ Off–High–Flat | Tianmu Lake Area | South Area | North Area | West Area | East Area | Central Area |
|---|---|---|---|---|---|---|
| 2018 off season | 190.24 | 26.34 | 10.4 | 11 | 8.44 | 6.6 |
| 2018 flat season | 486.25 | 71.35 | 16.94 | 19.36 | 16.86 | 15.67 |
| 2018 high season | 703.01 | 115.11 | 19.54 | 23.4 | 16.97 | 14.33 |
| 2019 low season | 209.78 | 27.21 | 14.79 | 18.38 | 12.14 | 12.52 |
| 2019 flat season | 544.12 | 75.24 | 28.26 | 33.35 | 27.54 | 30.02 |
| 2019 high season | 798.04 | 129.5 | 38.78 | 45.63 | 31.93 | 25.91 |
| Area Names | Industry Type | Industry Positioning | Trends |
|---|---|---|---|
| North Area | Secondary industry Tertiary industry | Mountain scenery Air travel | Down |
| South Area | Tertiary industry Primary industry | Landscape tourism Eco-tourism agriculture | Up |
| West Area | Secondary industry Tertiary industry | Food processing Metal building materials | Down |
| East Area | Primary industry Tertiary industry | Efficient aquaculture Wetland tourism area | Down |
| Tianmu Lake Area | Primary industry Tertiary industry | City card Tourism industry derivation | Up |
| Central Area | Tertiary industry | Urban modern service industry Tourism distribution center | Down |
Publisher’s Note: MDPI stays neutral with regard to jurisdictional claims in published maps and institutional affiliations. |
© 2022 by the authors. Licensee MDPI, Basel, Switzerland. This article is an open access article distributed under the terms and conditions of the Creative Commons Attribution (CC BY) license (https://creativecommons.org/licenses/by/4.0/).
Share and Cite
Wu, H.; Chen, Z.; Yan, J.; Tang, X. Multi-Source Spatio-Temporal Data-Based Tourism Structure Analysis of Demonstration City for Global Tourism: Case Study of Liyang, China. ISPRS Int. J. Geo-Inf. 2022, 11, 547. https://doi.org/10.3390/ijgi11110547
Wu H, Chen Z, Yan J, Tang X. Multi-Source Spatio-Temporal Data-Based Tourism Structure Analysis of Demonstration City for Global Tourism: Case Study of Liyang, China. ISPRS International Journal of Geo-Information. 2022; 11(11):547. https://doi.org/10.3390/ijgi11110547
Chicago/Turabian StyleWu, Haoqi, Zhenan Chen, Jun Yan, and Xiaolan Tang. 2022. "Multi-Source Spatio-Temporal Data-Based Tourism Structure Analysis of Demonstration City for Global Tourism: Case Study of Liyang, China" ISPRS International Journal of Geo-Information 11, no. 11: 547. https://doi.org/10.3390/ijgi11110547