Article

Field Cognitive Styles on Visual Cognition in the Event Structure Design of Bivariate Interactive Dorling Cartogram—The Similarities and Differences of Field-Independent and Field-Dependent Users

1
School of Mechanical Engineering, Southeast University, Nanjing 211189, China
2
School of Design Art and Media, Nanjing University of Science and Technology, Nanjing 210014, China
3
School of Art and Design, Nanjing University of Technology, Nanjing 210031, China
4
School of Art Design and Media, East China University of Science and Technology, Shanghai 200237, China
*
Author to whom correspondence should be addressed.
ISPRS Int. J. Geo-Inf. 2022, 11(11), 574; https://doi.org/10.3390/ijgi11110574
Submission received: 7 September 2022 / Revised: 11 November 2022 / Accepted: 14 November 2022 / Published: 17 November 2022

Abstract

:
As a simple, discontinuous, surface deformation statistical map, Dorling cartograms are effective means with which to characterize the geographic distribution of event data attributes. According to existing research, behavioral differences exist in the visual cognition of individuals with different cognitive field styles in the spatial task of switching layers in a two-dimensional electronic map. However, there are few studies that compare the visual cognitive ability of individuals with different cognitive field styles in the cross-layer structure design of Dorling cartogram event information. This paper uses the visual behavior measurement method to analyze the similarities and differences in the visual cognitive ability of two types of individuals, namely, field-independent and field-dependent individuals, in the cross-layer event structure design of Dorling cartograms. We recruited 40 subjects to perform visualization tasks on Dorling cartograms designed with two event structures, and we recorded the visual cognition data for the two types of subjects in both tasks. The results show that the subjects with the field-independent style perform better in the cognition of the Dorling cartogram event structure than the subjects with the field-dependent style, and the “S-T” event structure design is generally more user-friendly than the “T-S” event structure design. Our findings help to provide some references for the event structure design of human-centered Dorling cartograms.

1. Introduction

The development of the information age has brought about electronic deformation of statistical maps, which have become an effective visualization method to express the distribution of geographic data attributes [1]. As a carrier for the visualization of multivariate data attributes, Dorling cartograms can facilitate the users of these features in obtaining helpful event information [2]. However, in the current research on user-centered map design, in order to better establish the characteristics of the user’s cognition of spatiotemporal information relationships, map information visualization is being sought that better matches the user’s individual cognitive characteristics [3].
Cognitive styles are long-term, stable, distinct characteristics of individuals used to process information, affecting how they process information when interacting with computer systems [4,5]. The division of cognitive styles is multi-dimensional, and the division of field-style dimensions was first proposed by Witkin et al. [6]. It indicates whether individuals rely on external or internal clues when looking for information clues in the environment. To date, field-independent and field-dependent dimensions have been widely studied in many research fields, such as geography, computer science, and education [7,8,9]. There have been some discussions on the characteristics or differences in the visual cognition of electronic map information based on cognitive field style. Still, most studies focus on explicit visualization problems, such as transformation in map space and map navigation design performance [10,11]. In contrast, few studies focus on how the event information structure design impacts the visual cognition of individuals with different field cognitive styles.
In this paper, we study the differences in the visual cognitive abilities of individuals with field-independent and field-dependent style types, using a Dorling cartogram event structure design. We collected visual behavioral cognition data from 40 undergraduate and master’s students from different majors. For an objective evaluation, we used the response time and correct rate, and for a subjective evaluation, we used cognitive load. We then measured the visual cognitive abilities of the individuals with field-independent and field-dependent cognitive styles to determine trend changes comparing simple and complex event information in a Dorling cartogram.
The rest of this paper is structured as follows: In Section 2, we introduce the related research on individual cognitive styles and deformation statistical map event structure design, and we summarize the subjective and objective visual cognitive behavior measurement methods for individuals with different cognitive style dimensions in existing electronic maps. In Section 3, we describe the experimental design, including subjects, experimental materials, and experimental procedures. In Section 4, we introduce data processing methods, discuss both subjective and objective experimental results, and provide a general discussion. In Section 5, we provide a comprehensive discussion of the results and suggestions for potential future work.

2. Related Work

2.1. Related Research on Field Cognitive Style in Interactive Electronic Map Cognition

Cognitive style refers to the thinking mode employed by individuals in the cognitive processing of real-world information, so there are significant differences in ability between different styles [12]. In visual perception, the most representative cognitive style dimensions studied in various fields are field-independent and field-dependent styles [13]. The American psychologist Herman Witkin was the first to propose the notion of field cognitive styles, with the concept of “field” referring to the objective external environment in which an individual lives [14]. Field cognitive styles reflect the differences in an individual’s perception and processing of the objective external environment. Previous studies have shown that individuals with the field-dependent (FD) cognitive style are generally needing to rely on environmental information to make cognitive responses. Individuals with the field-independent (FI) cognitive style, showing behavioral characteristics as making cognitive responses based on their perceptions [15,16,17]. Choi and Jeong’s [18] research shows that field cognitive styles can be effectively applied in research on information-seeking behavior processes and provides a practical research reference for refining user-centered information design.
A number of scholars have researched the relationship between different cognitive styles and electronic map cognition. Lugli et al. [19] explored the search behavior strategies of individuals with landmark style (LS), route style (RS), and survey style (SS), on the Internet. The result showed that, compared to individuals with the route style (RS) and the survey style (SS), individuals with the landmark style (LS) are more inclined to use analytical strategies to obtain spatial correlation information, and their search trajectory mainly focuses on related targets. Furthermore, while individuals with the survey style (SS) are more inclined to use an overall strategy to obtain spatial correlation information, their search trajectory is more extensive. Gianacola et al. [20,21] compared the cognitive styles of military pilots and individuals with no flying experience in the advanced space map, and the results showed that military pilots mainly use the survey style (SS) for navigation cognition. In contrast, individuals without flying experience mainly use the route style (RS) for navigational recognition.
In the existing research on the influence of field cognitive style on the visual cognition of electronic maps, Rodes and Gugerty et al. [22] studied the interaction effects of different cognitive styles individual performance, and map navigation displays. The results showed that, compared with the field-dependent style individuals, the field-independent style individuals had a higher psychological rotation ability. Compared with track-up maps, north-up maps are more beneficial for navigational tasks. Therefore, realizing high-performance navigation tasks requires synergy between the map’s optimal configuration and the individual’s spatial cognition ability. Based on visual path arrangement experiments, Bocchi et al. [23] showed that different field cognitive styles individuals’ preferences in the map-space paths’ cognition, and response time performance are affected by information display.Boccia et al. [24] showed that the level of field independence significantly correlates with the Group Embedded Figures Test (GEFT). In map space cognition, compared with individuals with the field-dependent style, individuals with the field-independent style tend to use navigation strategies that are separate from the map environment, and they have a preference for global and complex spatial design representations. Angeli [25] compared the similarities and differences in the abilities of individuals with field-independent, field-mixed, and field-dependent cognitive styles to solve complex problems when using computer affordance modeling tools. The experimental subjective and objective behavioral measurement results showed that there is no difference in the three types of subjective cognitive load, but in the interactive behavior performance of objective problem solving, the field-independent, field-mixed, and field-dependent styles, showed a decreasing trend.
Above studies have compared the visual cognitive abilities of individuals with different cognitive styles in the electronic map information space, providing evidence for the design of map information space for individuals with different cognitive types.

2.2. Related Research on the Event Structure Design of Dorling Cartograms

Cartograms are mainly divided into distance comparison statistical maps (distance cartograms) and area comparison attribute maps (area cartograms). As an effective technique used to visually express the geographic distribution of data, cartograms break through the visual interference caused by the unreasonable use of traditional map space, thereby helping users effectively understand information [2,26]. Area comparison statistical maps express statistical data by changing the area of the different areas on the original map, and these mainly include contiguous area cartograms, non-contiguous area cartograms, and circle cartograms. Typical circular attribute maps are Dorling attribute maps, which use circles to illustrate the area, proposed by the British geographer D. Dorling [27,28]. Compared with contiguous area cartograms and non-contiguous area cartograms, circle attribute cartograms are more convenient for the comparison of area size while maintaining the adjacent positions of various regions [26]. Users are often accompanied by various tasks in the exploration of digital map information [2]. Nusrat et al. [29,30] showed that it is easier to transmit data patterns on circular cartograms due to their advantages, such as enabling an intuitive statistical comparison and the multi-attribute superposition of colors. The user has a short response time and low error rate during operation.
However, two-dimensional map spaces are limited, and coding information trends in the hierarchical space and effectively representing is the visualization task key in the Dorling cartogram. Peña-Araya et al. [31] compared three geospatial–temporal visualization techniques based on visualization tasks, namely, (1) Dorling cartograms as small multiples, (2) proportional symbols (circles) on maps as small multiples, and (3) proportional symbols (bar charts) on a single map, in terms of the effectiveness of conveying spatiotemporal data correlations; the results showed that the effectiveness of visualizations is highly dependent on the granularity of the task. Nusrat et al. [32] described a technique based on a bivariate interactive Dorling cartogram. Compared with previous methods, interactive Dorling cartograms can effectively realize the bivariate in the same field, and they are useful for the identification of geographic statistical patterns, trends, and outliers. Elmer [33] examined how bivariate visual encoding supports users’ attentional choice and behavioral performance in a cross-layer map search task in a difference map. Hullman et al. [34,35] researched the influence of the visualization data structure construction method on user preference and intention perception and explored the optimal sequence design support for the transformation relationship between “global” and “local” structures.
Due to their prominent attribute comparison advantage, Dorling cartograms can effectively visualize event information through multi-dimensional information coding, and they have an irreplaceable intuitive statistical mode. However, most of the Dorling cartogram visualization coding is still at the explicit level, and the interactive structure display in the information space is more inclined to technical realization research. Therefore, studies exploring how to use multiple visual coding to effectively construct the invisible spatial structure cross-layer in Dorling cartograms and to conform to the visual cognition of users with different personality characteristics are yet to be carried out.

2.3. Related Research on Visual Cognitive Behavior Measurement in Electronic Map Design

Many previous studies have investigated visual cognition’s subjective and objective behavioral performance evaluation in electronic maps. Boccia et al. [36] used the Group Embedded Figures Test (GEFT) and the Santa Barbara Sense of Direction (SBSOD) to evaluate the level of field-independent style in order to measure the degree of individual embeddedness in the environmental “field”, which was used to study user’s field style ability to orientate in the predicted environment space. Nusrat et al. [31] used the average completion time and error rate to measure performance in the objective evaluation of a Dorling cartogram visualization task. In the subjective evaluation, they measured preference using a Likert scale, and based on the measurement results, they provided improvements for bivariate Dorling cartogram coding designs. Bocchi et al. [37] used response time to evaluate the cognitive performance of individuals with three different spatial cognitive styles, the landmark style (LS), the route style (RS), and the survey style (SS), in different key search tasks of map navigation. Tascón et al. [38] analyzed the behavioral performance of males and females when performing three different spatial memory tasks under the condition of different cognitive needs. The objective behavioral measures were mainly recorded by the time spent and the number of errors. Nisiforou et al. [39,40] used eye-tracking technology to study the visual cognition differences in the field-dependent (FD), field-neutral (FN), and field-independent (FI) three types of cognitive styles users when using different complexity graphic web pages. As the visual complexity of the page increased, there were significant differences in task completion times, with FD individuals showing more disorientation and disorganized eye movement, and FN and FI individuals producing more gaze and glance. Elmer [33] compared the ability of differential knowledge backgrounds to extract information from cross-layer map information by recording the accuracy, response time, and preference of users performing reading tasks on eight different bivariate map types. Hullman et al. [34] recorded the user’s subjective evaluation of the clarity and validity of sequence designs composed of different geographic views using a five-point Likert scale.
It can be seen that the quantitative measurement of objective behavior combined with the qualitative measure of subjective cognitive load is a mature visual cognitive performance method, and it provides a comprehensive technique that can be used in our research to reveal the behavior of individuals with different field styles when examining Dorling cartograms with a cross-layer structural design.

3. Methods

3.1. Participants

We publish the recruitment advertisement on the advertisement board of the college at the research university. Participants need to frequently use the Internet, proficiency in computers, and have the basic knowledge and experience of reading digital maps. A total of 60 undergraduate and graduate students (30 females and 30 males) from various research universities, who had healthy vision or corrected vision, had no color blindness or color weakness, and were between the ages of 20 and 30, volunteered to participate in the experiment, and all participates had basic knowledge and experience in reading digital maps. According to the participant’s performance on the “Group Embedded Figures Test (GEFT)”, 26 were classified as having a field-independent cognitive style, while the remaining 34 were classified as having a field-dependent cognitive style. We randomly selected 20 participants with the field-independent (FI) cognitive style and 20 participants with the field-dependent (FD) cognitive style from the two groups. Each participant voluntarily participated and received commemorative gifts for the experiment.

3.2. Apparatus

The experiment content was presented using an offline web page platform for operations. The web page was coded using the Webstorm software and generated by combining D3 and Protovis with the front-end language. The experimental display device was an AOC brand 24-inch monitor, which ensures the matching and screen compatibility of the experimental page and the tested device. The experiment was conducted as a human performance experiment in the human factor engineering lab at Southeast University with sufficient light and no noise.

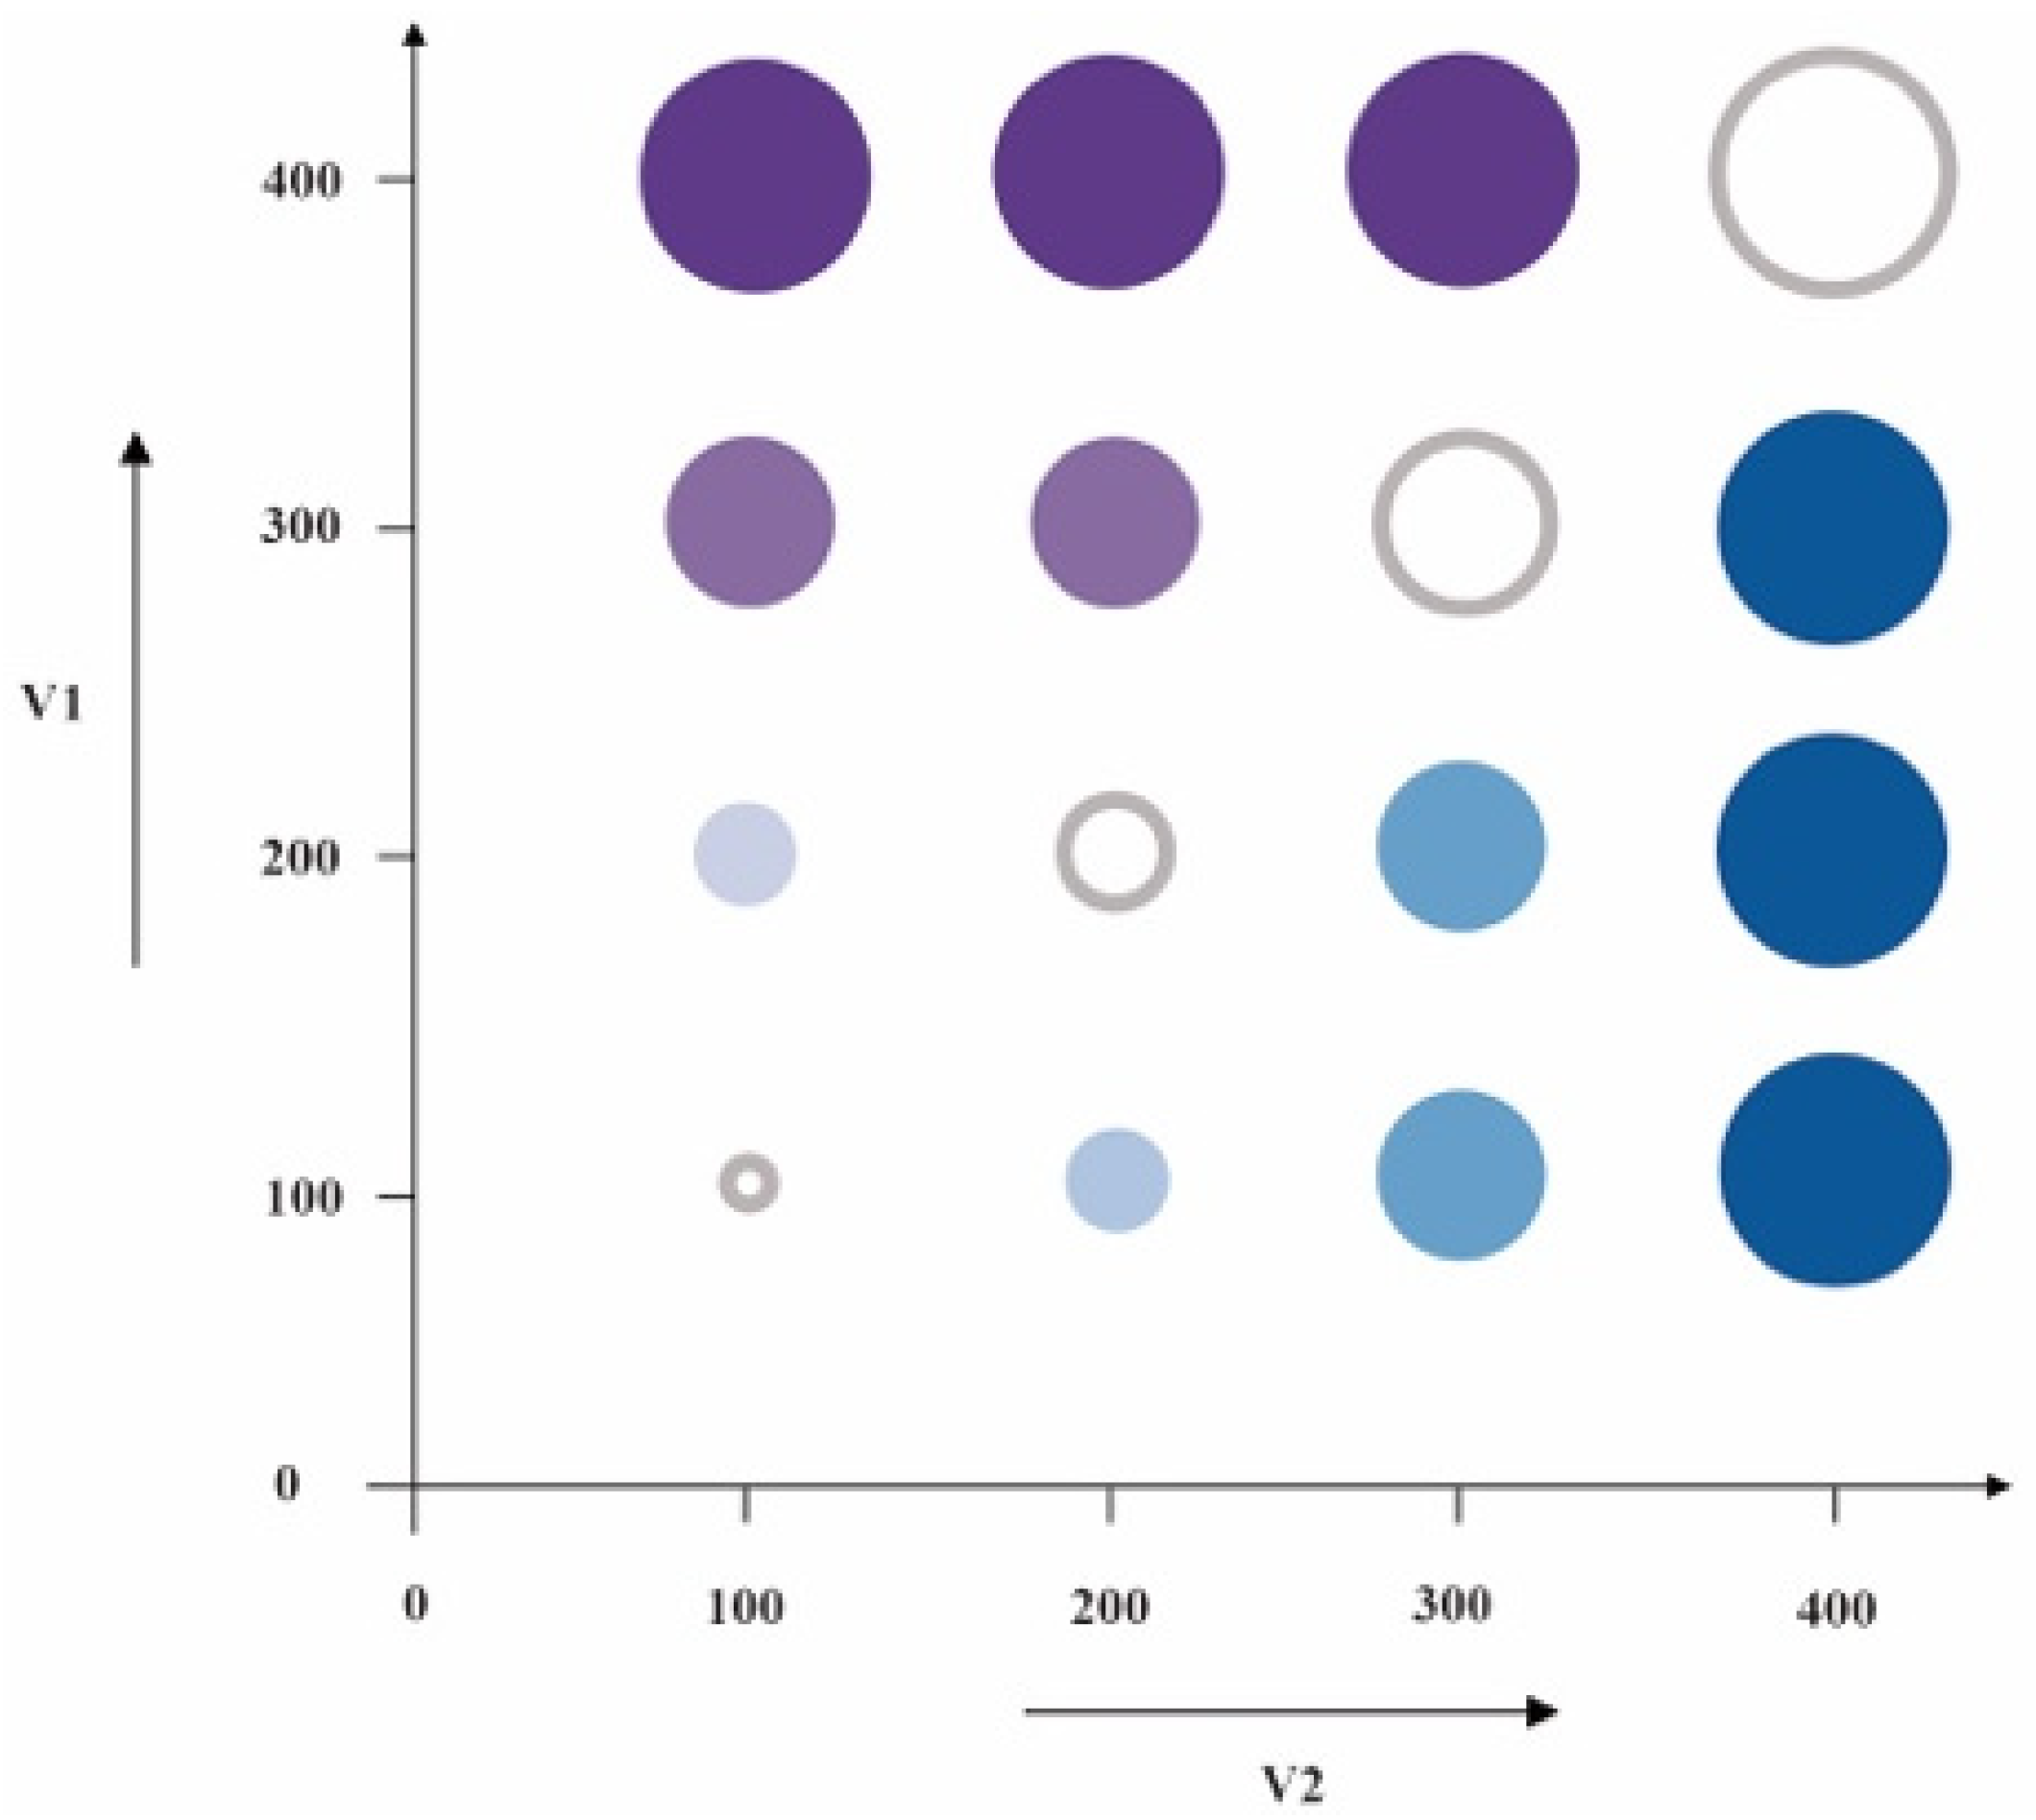
3.3. Experimental Materials

Based on geographic event information, we selected time and space, two typical types of data sources, with a global layer and a local layer as the primary and secondary structural relationships, and we combined them into two forms of visual exploration structures in a Dorling cartogram. For the first visual exploration structure, we took “space” as the global exploration layer and “time” as the local exploration layer, forming the “S-T” structure design. For the second visual exploration structure, we took “time” as the global exploration layer and “space” as the local exploration layer, forming the “T-S” structure design.
We used a US map prototype as the geographic application context to create a more reliable and realistic visual experiment sequence. The event information was based on two datasets on the relationship between the U.S. air quality index and chronic obstructive pulmonary disease published by the National Center for Chronic Disease Prevention and Health Promotion in the United States in the last decade. Spatiotemporal source data were grouped (https://www.cdc.gov/copd/data.html) (accessed on 8 August 2021). In this experiment, subjects unfamiliar with the trend change data were selected to reduce the influence of familiarity on the experiment. We removed Alaska and Hawaii, making the density and distribution of the remaining 48 states relatively uniform. In terms of space division, imaginary X and Y lines divided 48 states into 6 blocks, ensuring that each block contained 8 states. In terms of time setting, the span of the overall time was set to 6 years, resulting in 6 times nodes, and the interval between each time node was the same. For spatiotemporal data, we chose two variables, hue (in common colors) and graphic size, for visual coding. The color coding represents the air quality index, and the graphic size coding represents the prevalence of chronic obstructive pulmonary disease. We referred to Rosling’s Gapminder to extract the source data, a relational approach to encode graphics for the visual presentation of Dorling cartograms (see Figure 1 and Figure 2).

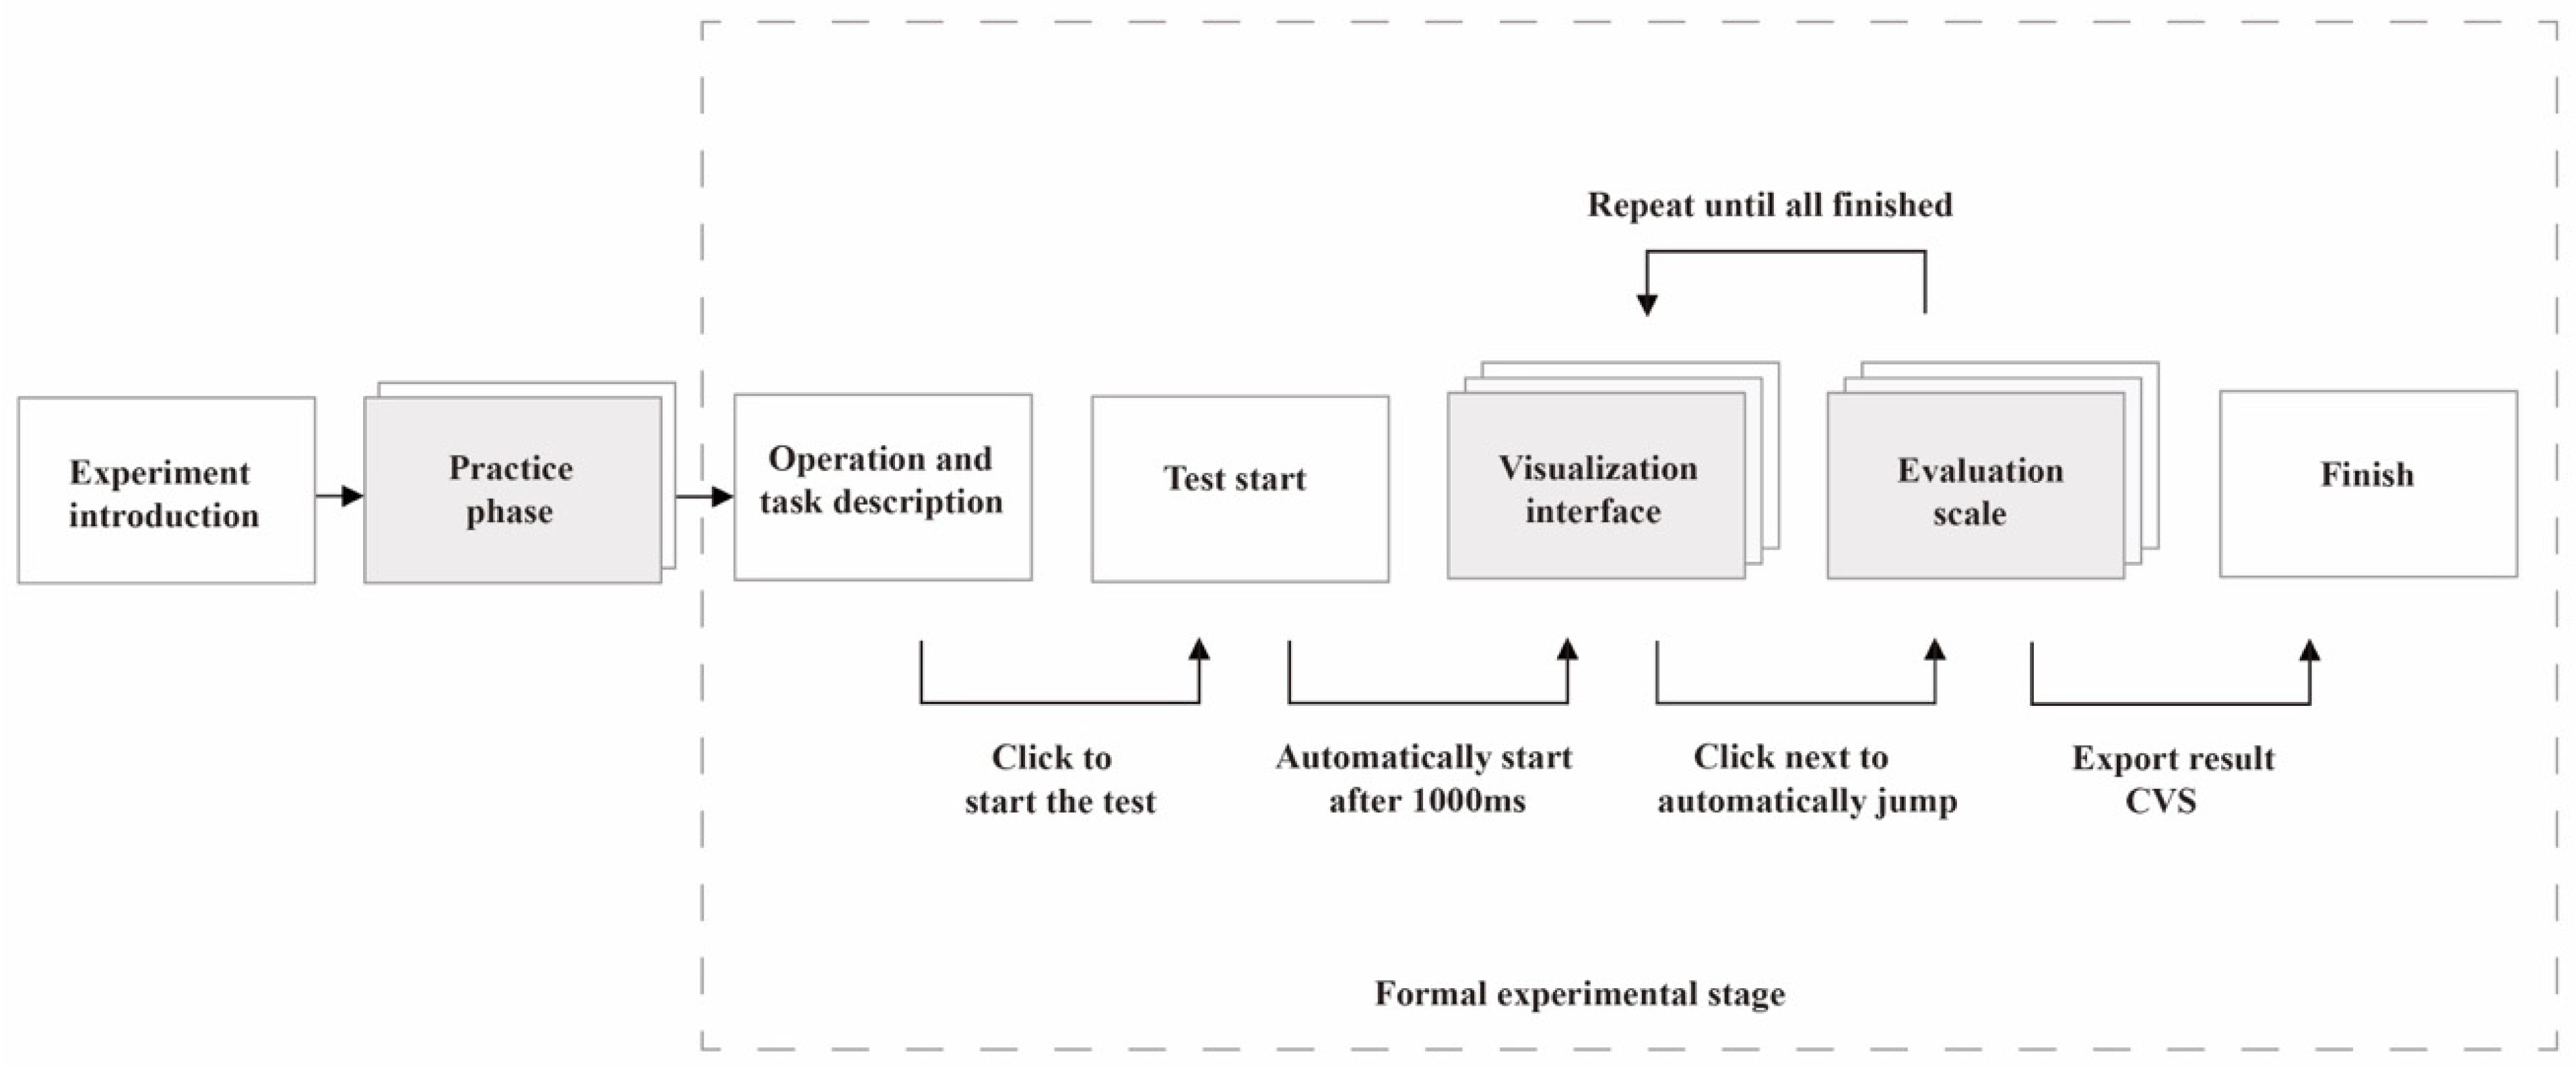
3.4. Experimental Procedure

In the introduction and pre-experiment, the subjects were introduced to the web interface and operation process used in the experiment through documentation. We set up two typical tasks for the viewing of cross-layer event information in the Dorling cartogram for the experimental design. After reading the documentation, the subjects needed to complete 2 questions based on each task in order to familiarize themselves with the operation process. In the pre-experiment, the subjects could ask the experimenter any question, but not in the formal experiment. The pre-experiment aimed to avoid or reduce the generation of invalid data due to improper operation by familiarizing the subjects with the testing process.
In the formal experiment, the test automatically started 1000 ms after the subjects clicked to begin the trial. The test consisted of 2 task types and 24 mixed questions, and the subjects needed to interact with the visual interface using a mouse according to the task requirements. As shown in Figure 3, the upper left of the experiment operation interface shows the progress bar of this experiment, and the left side of the interface is the display area for the visualization of the event information structure of the multi-order statistical map. The subjects could switch the six global labels from the left horizontally and two toggle buttons from the horizontal to the right in order to explore the visual sequence. Questions were displayed in the area on the right side of the interface. Participants could answer the questions at any time while exploring the left side and had to click the confirm button to submit their answer. At this time, a 5-level Likert scale popped up on the layer for the subjects to choose the subjective evaluation level, and the confirmation was completed. Then, they entered the following test interface. After all the subjects were tested, Export Results was clicked (see Figure 4 and Figure 5).
The following is a detailed description of the eight tasks across the two task types:
  • Type 1: Event information structure single-trend judgment
Task 1: What is the trend of the proportion of chronic obstructive pulmonary disease in LD regions from 2015 to 2020 in the “T-S” structure visualization?
Task 2: What is the trend of the air quality index in the LU region from 2015 to 2020 in the “T-S” structure visualization?
Task 3: What is the trend of the proportion of chronic obstructive pulmonary disease in the RD region from 2015 to 2020 in the “S-T” structure visualization?
Task 4: What is the trend of the air quality index in the MU region from 2015 to 2020 in the “S-T” structure visualization?
  • Type 2: Event information structure relevance-trend judgment
Task 5: What is the trend of the correlation between the air quality index and the proportion of chronic obstructive pulmonary disease in the RU region from 2015 to 2020 in the “T-S” structure visualization?
Task 6: What is the trend of the correlation between the air quality index and the proportion of chronic obstructive pulmonary disease in the LU region from 2015 to 2020 in the “T-S” structure visualization?
Task 7: What is the trend of the correlation between the air quality index and the proportion of chronic obstructive pulmonary disease in the MD region from 2015 to 2020 in the “S-T” structure visualization?
Task 8: What is the trend of the correlation between the air quality index and the proportion of chronic obstructive pulmonary disease in the LD region from 2015 to 2020 in the “S-T” structure visualization?
In tasks 1–4, the subjects were asked to determine the trend of the air quality index and the proportion of chronic obstructive pulmonary disease in the six-year Dorling cartogram, and they were asked to judge whether the change in the single trend was “an increase”, “a decrease”, or “no significant change”. This task was primarily used to compare the visual cognitive abilities between the field styles of the subjects when performing a simple trend task in the two structural designs.
In tasks 5–8, the subjects were asked to determine the trend of the air quality index and the proportion of chronic obstructive pulmonary disease on the six-year Dorling cartogram layer, and they were asked to judge whether the change in the correlation trend was “better at the same time”, ”worse at the same time”, or ”first at the same time worse, then at the same time better or no significant change”. This task was primarily used to compare the visual cognitive abilities of the field styles of the subjects when performing complex trend tasks in the two structural designs.
The two hypotheses of the experiment were given:
Hypothesis 1. 
Compared with field dependent style users, field independent style users have better visual cognitive performance in response time, accuracy, and cognitive load when performing two types of tasks.
Hypothesis 2. 
Compared with “T-S” structure design, field style users have better visual cognitive performance in response time, accuracy, and cognitive load when performing two types of tasks in “S-T” structure design.

3.5. Experimental Measurement Metrics

To compare the differences in the visual cognitive abilities of the subjects with two types of field cognitive styles in the Dorling cartogram event information structure, this experiment used subjective and objective behavioral measurement methods to analyze the whole process of the subjects’ visual cognition and interactive operation. The objective behavioral measures include response time (in milliseconds), representing the time required for the subject to complete the task, and the average value of 3 repeated experiments, used to measure the speed at which the subject participates in completing the task to obtain the results. The correct answer rate represents the cognitive performance of the subjects in the task, and the average value of the 3 repeated experiments is used to measure the speed of the subjects participating in the task to obtain the results. The subjective behavioral measures include cognitive load scores (5-point Likert scale: very difficult to understand, difficult to understand, average, easy to understand, and very easy to understand). The corresponding calculation score from “very difficult to understand” to “very easy to understand” is 1 to 5 points. The results were obtained by calculating the average value of the 3 repeated experiments to measure the cognitive load of the subjects involved in completing the task.
We used the SPSS version 22.0 package (IBM, Armonk, NY, USA) for a statistical analysis of the experimental data. There were no significant outliers in the response time, correct rate, or cognition study data, and there was a non-normal distribution in some groups, so the Mann–Whitney U test was used to judge the difference or similarity of subjects with different cognitive styles. In addition to this, we also calculated the η² effect size.

4. Results

4.1. Visual Cognitive Response Time of Subjects with Different Field Styles Based on Two Types of Dorling Cartogram Event Structures

We used the Mann–Whitney U test to determine whether there is a difference in the visual cognitive response time between the FI-style subjects and the FD-style subjects for the two types of event structures. In the “S-T” event structure single-trend task, the visual cognitive response time of the FI-style subjects was 22,551.833 s, and the median visual cognition accuracy of the FD-style subjects was 27,491 s. The test results showed that there was a statistically significant difference between the two types of subjects in the single-trend visual cognitive response time (U = 126, Z = −2.002, p = 0.045, η² = 0.103). In the “T-S” event structure single-trend task, the visual cognitive response time of the FI-style subjects was 25,454 s, and the visual cognitive response time of the FD-style subjects was 31,492.83 s. The test results showed that there was a statistically significant difference between the two types of subjects in the single-trend visual cognitive response time (U = 110, Z = −2.435, p = 0.015, η² = 0.152). In the “S-T” event structure correlation-trend task, the visual cognitive response time of the FI-style subjects was 27,089.667 s, and the visual cognitive response time of the FD-style subjects was 33,447.333 s. The test results showed that there was a statistically significant difference between the two types of subjects in the correct rate of correlation visual cognition (U = 118, Z = −2.218, p = 0.027, η² = 0.126). In the “T-S” event structure correlation trend task, the visual cognitive response time of the FI-style subjects was 32,086.667 s, and the visual cognitive response time of the FD-style subjects was 37,997.167 s. The test results showed a statistically significant difference between the two types of subjects in the correct rate of correlation visual cognition (U = 109, Z = −2.462, p = 0.014, η² = 0.155) (see Table 1).
In Figure 6, we can see the response times of the two types of tasks performed by the subjects with different field styles in the two types of structures: Consistent with H1 about response time, whether in the “S-T” or “T-S” type structure, and when performing simple tasks or complex tasks, compared with the FI subjects, the FD subjects spend more time overall making decisions about cross-layer sequence information. When performing simple tasks in both types of structures, the two types of subjects have a longer response time in the T-S structure than in the S-T structure, and there was a slight difference in the two structures. Performing complex tasks in the two types of structures results in a longer response time than in the simple tasks. Both types of subjects have longer response times in the “T-S” structure than in the “S-T” structure; the differences between the two types of subjects in the two structures are obvious. The results show that H2 about response time are correct.

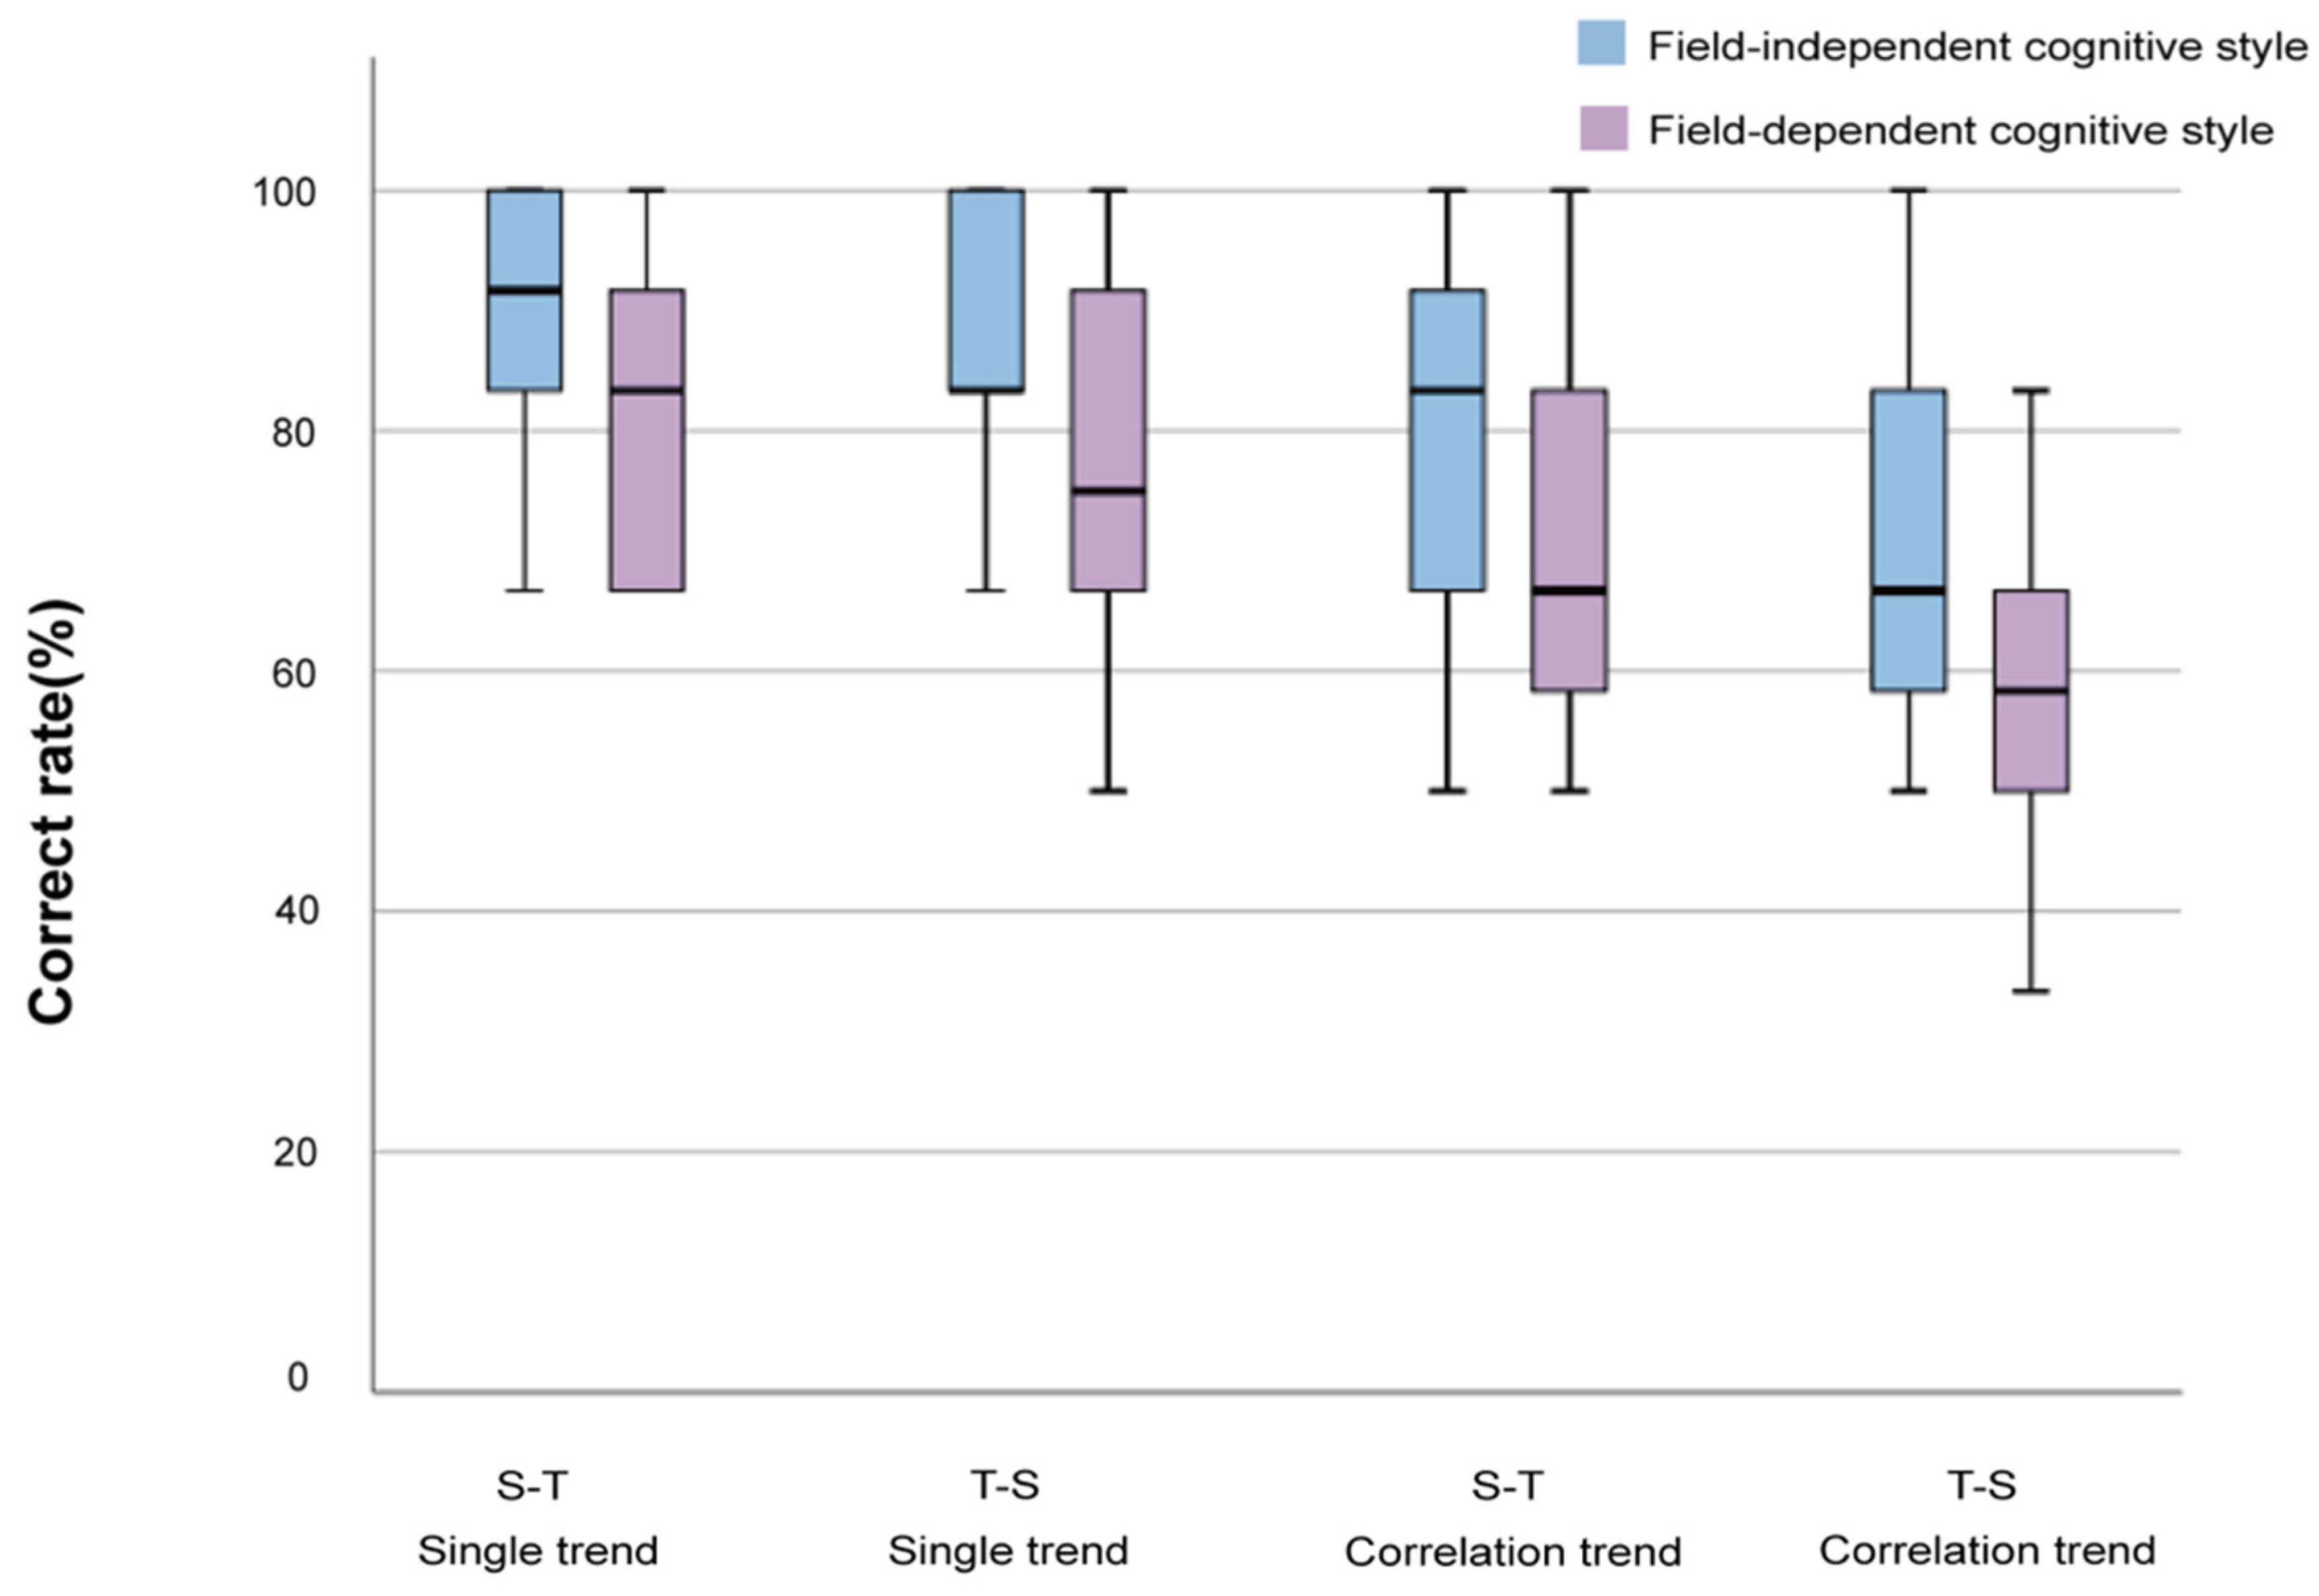
4.2. Visual Cognitive Correct Rate of Subjects with Different Field Styles Based on Two Types of Dorling Cartogram Event Structures

We used the Mann–Whitney U test to determine whether there was a difference in the visual recognition accuracy of the two types of event structures between the FI-style subjects and FD-style subjects. In the “S-T” event structure single-trend task, the median visual cognition accuracy rate of the FI-style subjects was 91.69%, and the median visual cognition accuracy rate of the FD-style subjects was 83.33%. The test results showed that there was no statistical difference between the two types of subjects in the accuracy rate of single-trend visual cognition (U = 137.5, Z = −1.803, p = 0.071, η² = 0.083). In the “T-S” event structure in the single-trend task, the median visual cognition accuracy of the subjects with the field-independent style was 83.33%, and the median visual cognition accuracy of the subjects with the field-dependent style was 75%. The test results showed that there was no statistically significant difference between the two types of subjects in the correct rate of single-trend visual cognition (U = 134, Z = −1.901, p = 0.057, η² = 0.093). In the “S-T” event structure correlation trend task, the median value of the correct rate of visual cognition of the subjects with the field-independent style was 83.33%, and the median value of the correct rate of visual cognition of the subjects with the field-dependent style was 66.67%. The test results showed that there was no statistical difference between the two types of subjects in the correct rate of correlation visual cognition (U = 132, Z = −1.93, p = 0.054, η² = 0.096). In the “T-S” event structure correlation trend task, the correct rate of correlation visual cognition of the subjects with the field-independent style was 66.67%, and the correct rate for the subjects with the field-dependent style in correlation visual cognition was 58.34%. The results of the Mann–Whitney U test showed a statistically significant difference between the two types of subjects in relative visual cognition accuracy (U = 109.5, Z = −2.579, p = 0.01, η² = 0.171) (see Table 2).
In Figure 7, we can see the response times of the two types of tasks performed by the subjects with different field styles in the two types of structures: Consistent with H1 about correct rate, whether in the “S-T” or “T-S” type structure, and when performing simple tasks or complex tasks, the FD subjects have a lower rate of correct operation on the cross-layer sequence information than the FI subjects. When performing simple tasks in the two types of structures, the correct rate of the two types of subjects in the “T-S” structure is lower than that in the “S-T” structure, but the difference is not obvious between the two structures. When performing complex tasks in the two types of structures, the correct rate is lower than that of the simple tasks. Both types of subjects have a lower correct rate in the “T-S” structure than in the “S-T” structure. The difference between the two types of users in the two structures is obvious. The results show that H2 about correct rate are correct.

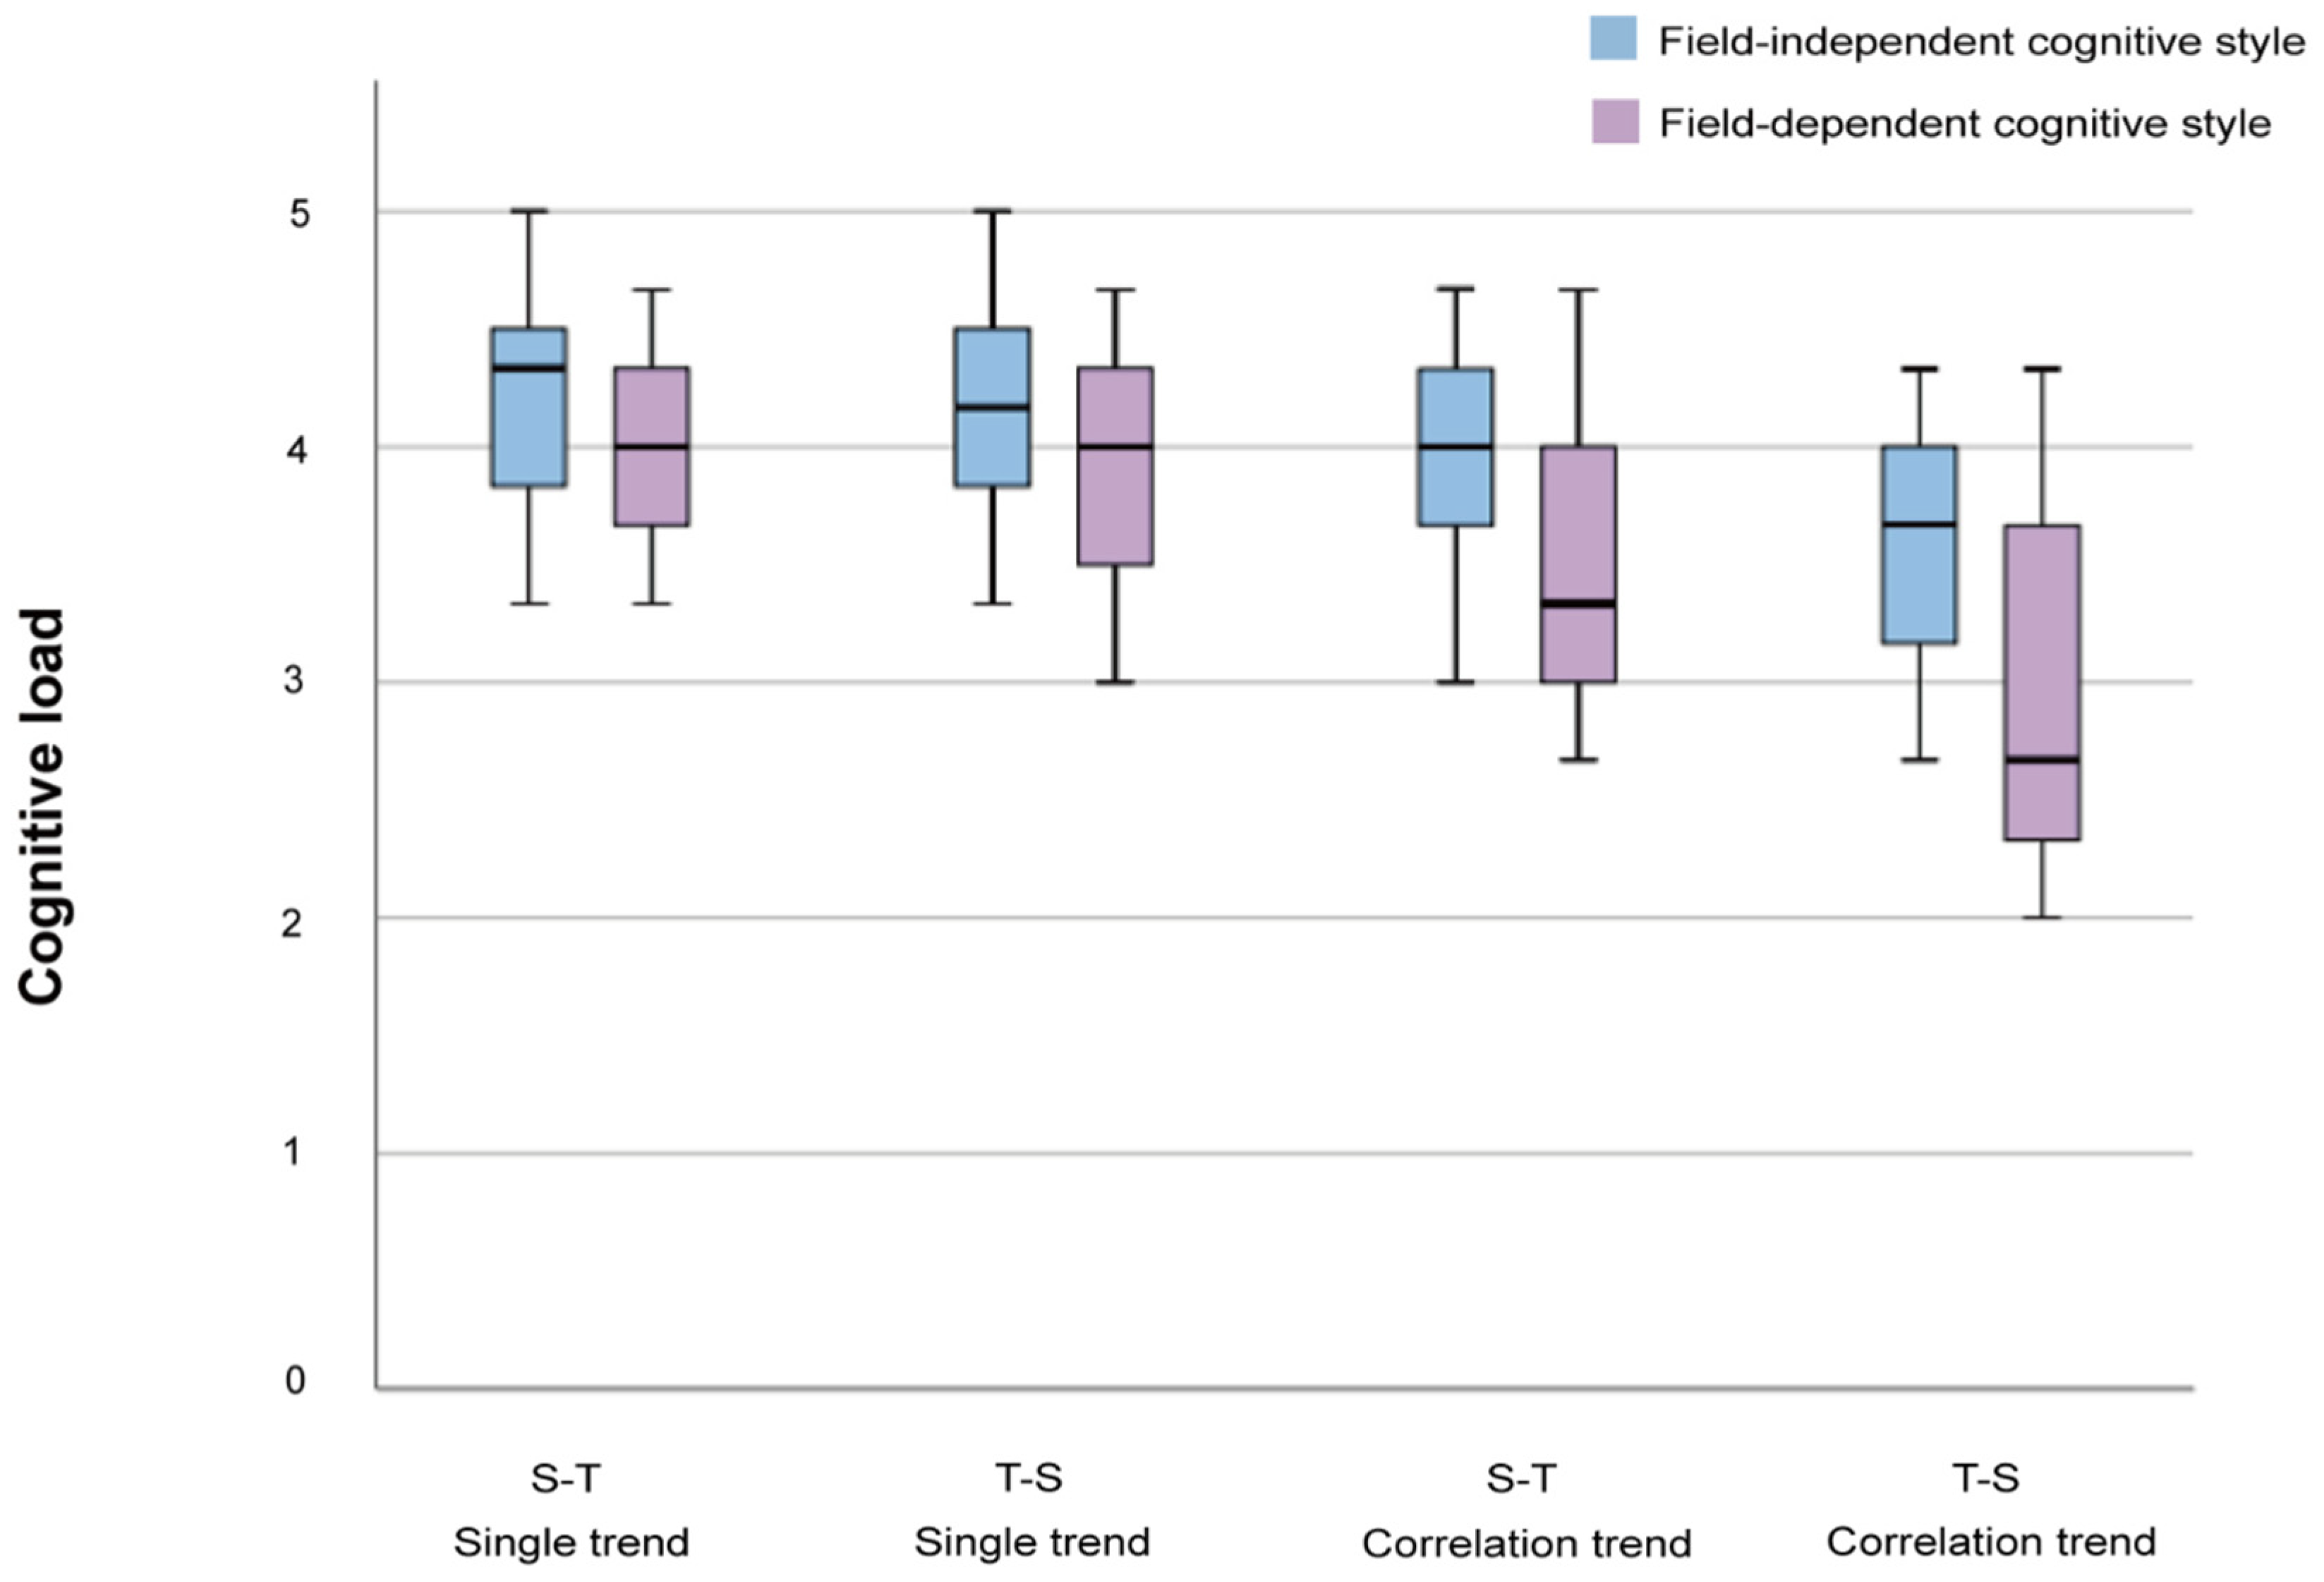
4.3. Visual Cognitive Load of Subjects with Different Field Styles Based on Two Types of. Dorling Cartogram Event Structures

We used the Mann–Whitney U test to determine whether there is a difference in the cognitive load of the “T-S” event structure between the subjects with an FI style and those with an FD style. In the “S-T” event structure single-trend task, the median cognitive load of the FI-style subjects was 4.33, and the median cognitive load of the FD-style subjects was 4. The results of the Mann–Whitney U test showed that there was no significant difference in the cognitive load between the FI-style subjects and the FD-style subjects in the “S-T” event structure single-trend task (U = 149, Z = −1.41, p = 0.159, η² = 0.051). In the “T-S” event structure single-trend task, the median cognitive load of the subjects with the field-independent style was 4.17, and the median cognitive load of the FD-style subjects was 4. The Mann–Whitney U test results showed that there was no significant difference in the cognitive load between the FI-style subjects and the FD-style subjects in the “T-S” event structure single-trend task (U = 146, Z = −1.487, p = 0.137, η² = 0.057). In the “S-T” event structure dual-trend task, the median cognitive load of the FI-style subjects was 4, and the median cognitive load of the FD-style subjects was 3.33. The Mann–Whitney U test results showed that there was no statistical difference in the cognitive load between the FI-style subjects and the FD-style subjects in the T-S event structure single-trend task (U = 120, Z = −2.203, p = 0.028, η² = 0.124). In the “T-S” event structure dual-trend task, the median cognitive load of the FI-style subjects was 3.67, and the median cognitive load of the FD-style subjects was 2.67. The Mann–Whitney U test results showed that there was no significant difference in the cognitive load between the FI-style subjects and the FD-style subjects in the “T-S” event structure single-trend task (U = 115, Z = −2.339, p = 0.019, η² = 0.140) (see Table 3).
In Figure 8, we can see the cognitive load of the two types of tasks performed by the subjects with the different field styles in the two types of structural designs: Consistent with H1 about cognitive load, whether in the “S-T” or “T-S” type structure, and when performing simple tasks or complex tasks, the FD subjects have a higher cognitive load on the cross-layer sequence information than the FI subjects. When performing simple tasks in the two types of structures, the cognitive load of the two types of subjects in the “T-S” structure is lower than that in the “S-T” structure, but the difference is not obvious between the two structures. When performing complex tasks in the two types of structures, the cognitive load is higher than that of the simple task. In the “S-T” structure, the difference between the two types of users is not obvious, but the difference between the two types of users is obvious in the “T-S” structure. The results show that H2 about cognitive load are correct.

4.4. General Discussion

This study focused on comparing the cognitive differences in the visual behavior of individuals using two Dorling cartogram designs based on spatiotemporal data, and it discussed the results of subjective and objective behavioral measures of visual cognition. To the best of our knowledge, there is no previous research on Dorling cartogram structure designs based on visual cognition.
In the response time measurement part of the map visualization design, in simple tasks, subjects with two types of field styles tracked only single-cue encoded information in the cross-layer structure design. For the FI subjects, the visual cognitive load was low, and there was a slight difference in response time. For the FD subjects, the cognitive load of the “T-S” sequence was more significant than that of the “S-T” sequence, so there was a certain difference in response time. However, as the task’s difficulty increased, the two types of subjects with different cognitive field styles needed to track the change and judgment trend of dual-cue encoding in the cross-layer structure design. The allocation of attention resources leads to a more significant visual cognitive load than single-cue encoded information. FI individuals are better at filtering out invalid inputs, using their own information cue reference frame for cognitive reorganization and making judgments, so their response ability is relatively faster [41]. However, because the “S-T” sequence was more friendly to visual cognition in complex tasks, the response time of the FI subjects also produced differences in the two types of structural designs. FD individuals rely more on external information cues for structural visual cognition, so they need to allocate more visual attention. In dual cues, the responsiveness was significantly weakened in the trend change of the information structure cross-layers, especially in the complex task of the “T-S” sequence. This is consistent with the study in [38] in solid space, indicating that FI individuals have strong visual responsiveness in spatial cognition and that cognitive performance is regulated by the complexity of the environment [42].
In the accuracy measurement part of map visualization design, in simple tasks, the interaction between the subjects with two different cognitive styles in the interactive operation of the differential structure design did not have a significant impact on the performance of the process. However, on the one hand, in complex tasks, the differential structure design can influence user interaction. On the other hand, an FD individual’s dependence on external information occupies more working memory space, and information clues are used in switching from the front to back layers for matching, resulting in greater cognitive costs upon conversion. They take more time to respond and are more likely to have higher error rates in logic line reasoning. This effect also exists in games with the number of events, where game scores positively correlate with the FI type [43]. In mathematical spatial reasoning tasks, FD-type students need more time to ask questions and need more guidance in the environment to build in connection with thinking [44,45]. In multimedia program learning, FI-type individuals can effectively use different information formats for education and better recognize visual cues [46,47].
In the cognitive load measurement part of the map visualization design, whether in the Dorling map designed with a “T-S” structure or a “S-T” structure, and whether for simple or complex tasks, the FI subjects performed better than the FD subjects. The subjects showed a lower cognitive load, which is consistent with previous studies on subjective measures in multiple domains [48]. In fuzzy perception, visual-spatial expression, and creative expression tasks, EEG signals reveal from the endogenous nerves perspective that the field cognitive style user’s difference in perceptual awareness and information processing ability. That is, field dependent cognitive style users, perform worse in bistable image stimulate observation and have a higher cognitive load [49].
The limitation of this study is that it only compared the differences between FI and FD for the correlation task in the Dorling map dynamic structure visualization design. There are many common methods to measure field cognitive style, such as the Rod and Frame Test (RFT), the Embedded Figures Test (EFT), and the Grouped Embedded Figures Test (GEFT) in the bipolar one-dimensional measurement method. Only the more complex GEFT is selected in this experiment. In addition, GEFT only defines two levels of cognitive styles according to their scores. In fact, some scholars have proposed that field dependent cognitive style users can be divided into more than two types within a two-dimensional framework. In actual tasks, there must be more visualization tasks. Therefore, future work needs to be carried out to determine whether these two types or other cognitive styles have the same or different results for other tasks. Nevertheless, before moving toward the presentation of personalized adaptive Dorling maps, it is not easy to quickly distinguish the characteristics of users with different cognitive styles. Combining advanced artificial intelligence technologies, such as machine learning, for model training is necessary to locate and match users more accurately. In addition, this study only selected subjective and objective behavioral measurement methods among the measurement methods. In future work, eye-tracking or brain physiological measurement indicators can also be used to reveal visual behavioral patterns from an endogenous perspective. Finally, only 40 subjects are selected to participate in this experiment. Future research can expand and refine the classification of field user groups to promote user-centered map design methods.

5. Conclusions and Future Work

This study examines the behavioral differences between individuals with FI and FD cognitive styles in two structural designs of interactive Dorling cartograms. Overall, the results show that individuals with the FI cognitive style generally have better subjective and objective cognitive performance than individuals with the FD cognitive style, and the “S-T” structure design of a multi-level statistical map is more visually and cognitive friendly than the “T-S” structure design, especially in Dorling cartograms with multiple levels of complexity.
Our research results fill in the gaps in the research of individuals with different field cognitive styles in the design of interactive Dorling cartogram structures. These findings can help improve human-centered electronic map structure design, especially for today’s more demanding personalized services and adaptive presentations. As a next step, we suggest researching the color or shape of reference thresholds, which provide a structured representation of matching event information in the hierarchical switching design of interactive maps. We expect single or combined coding methods to provide effective visual cue anchors in map event information recognition, thereby reducing the cognitive load on users, especially field-dependent users, in hierarchical structure switching.
To sum up, previous studies based on the field-cognitive style in maps did not involve the design of Dorling cartogram visualization structures. Our study is consistent with previous studies, and individuals with different field cognitive styles have differences in spatial cognition. For users with the FD cognitive style, designers should provide more external information and structural cues in electronic map structure cognition to assist users in better decision-making performance. By considering the differences in individual characteristics, we expect to provide some usability design suggestions for the development of two-dimensional and multi-dimensional user-centered adaptive Dorling cartograms.

Author Contributions

Conceptualization, Yanfei Zhu and Jie Gu; Methodology, Yanfei Zhu and Jie Gu; Software, Yanfei Zhu and Mo Chen; Validation, Mo Chen and Xiaoxi Du; Formal analysis, Yun Lin and Xiaoxi Du; Investigation, Yanfei Zhu, Jie Gu and Yun Lin; Resources, Chengqi Xue; Data curation, Mo Chen and Qi Guo; Writing—original draft, Yanfei Zhu; Writing—review & editing, Yanfei Zhu and Qi Guo; Visualization, Yanfei Zhu and Yun Lin; Supervision, Chengqi Xue; Project administration, Chengqi Xue; Funding acquisition, Chengqi Xue. All authors have read and agreed to the published version of the manuscript.

Funding

The paper is supported jointly by Natural Science Foundation of China (No. 71871056, 52205264, 52005251), and the Jiangsu Province Graduate Scientific Research Innovation Project (KYCX18_0069), Shanghai Pu Jiang Program (21PJC032).

Institutional Review Board Statement

Not applicable.

Informed Consent Statement

Informed consent was obtained from all subjects involved in the study.

Data Availability Statement

The data are contained within the article.

Conflicts of Interest

The authors declare no conflict of interest.

References

  1. Latif, S.; Beck, F. Interactive map reports summarizing bivariate geographic data. Vis. Inform. 2019, 3, 27–37. [Google Scholar] [CrossRef]
  2. Sun, H.; Li, Z. Effectiveness of Cartogram for the Representation of Spatial Data. Cartogr. J. 2010, 47, 12–21. [Google Scholar] [CrossRef]
  3. Du, P.; Li, D.; Liu, T.; Zhang, L.; Yang, X.; Li, Y. Crisis Map Design Considering Map Cognition. ISPRS Int. J. Geo-Inf. 2021, 10, 692. [Google Scholar] [CrossRef]
  4. Messick, S. The nature of cognitive styles: Problems and promise in educational practice. Educ. Psychol. 1984, 19, 59–74. [Google Scholar] [CrossRef]
  5. Kinley, K.; Tjondronegoro, D.; Partridge, H.; Edwards, S. Human-Computer Interaction: The Impact of Users’ Cognitive Styles on Query Reformulation Behaviour during Web Searching. In Proceedings of the 24th Australian Computer-Human Interaction Conference on—OzCHI’12, Melbourne, VIS, Australia, 26–30 November 2012; ACM Press: New York, NY, USA, 2012; pp. 299–307. [Google Scholar]
  6. Witkin, H.A.; Moore, C.A.; Goodenough, D.; Cox, P.W. Field-Dependent and Field-Independent Cognitive Styles and Their Educational Implications. Rev. Educ. Res. 1977, 47, 1–64. [Google Scholar] [CrossRef]
  7. Nori, R.; Boccia, M.; Palmiero, M.; Piccardi, L. The Contribution of Field Independence in Virtual Spatial Updating. Curr. Psychol. 2021. [Google Scholar] [CrossRef]
  8. Li, H.; Zhang, Y.; Wu, C.; Mei, D. Effects of Field Dependence-Independence and Frame of Reference on Navigation Performance Using Multi-Dimensional Electronic Maps. Pers. Individ. Differ. 2016, 97, 289–299. [Google Scholar] [CrossRef]
  9. Ge, Y. A Study on the Correlation among FD-FI Cognitive Style, Working Memory Capacity and English Reading Performance among College EFL Learners. JCER 2021, 5, 1–13. [Google Scholar] [CrossRef]
  10. Hsu, Y.C.; Chen, S.Y. Associating Learners’ Cognitive Style with Their Navigation Behaviors: A Data-Mining Approach. In Proceedings of the International Conference on Human-Computer Interaction. Users and Applications, Orlando, FL, USA, 9–14 July 2011; pp. 27–34. [Google Scholar]
  11. Piccardi, L.; De Luca, M.; Nori, R.; Palermo, L.; Iachini, F.; Guariglia, C. Navigational Style Influences Eye Movement Pattern during Exploration and Learning of an Environmental Map. Front. Behav. Neurosci. 2016, 10, 140. [Google Scholar] [CrossRef] [Green Version]
  12. Chinien, C.A.; Boutin, F. Cognitive Style FD/I: An Important Learner Characteristic for Educational Technologists. J. Educ. Technol. Syst. 1993, 21, 303–311. [Google Scholar] [CrossRef]
  13. Evans, C.; Richardson, J.T.E.; Waring, M. Field Independence: Reviewing the Evidence. Br. J. Educ. Psychol. 2013, 83, 210–224. [Google Scholar] [CrossRef]
  14. Witkin, H.A.; Goodenough, D.R. Field Dependence and Interpersonal Behavior. Psychol. Bull. 1977, 84, 661–689. [Google Scholar] [CrossRef]
  15. Ikegulu, P.R.; Ikegulu, T.N. The Effectiveness of Window Presentation Strategy and Cognitive Style of Field Dependence Status on Learning from Mediated Instructions, 1st ed.; ERIC, Clearinghouse: Washington, DC, USA, 1999; pp. 3–22. [Google Scholar]
  16. Hayes, J.; Allinson, C.W. Cognitive Style and the Theory and Practice of Individual and Collective Learning in Organizations. Hum. Relat. 1998, 51, 847–871. [Google Scholar] [CrossRef]
  17. Al-Saai, A.J.; Dwyer, F.M. The Effect of Visualization on Field-Dependent and Field-Independent. Int. J. Structional Media 1993, 20, 226–274. [Google Scholar]
  18. Choi, M.J.; Jeong, D.Y. A Study on Effect of the Cognitive Style of Field Dependence/Independence to the Information-Seeking Behavior of Undergraduate Students. J. Korean Soc. Libr. Inf. Sci. 2013, 47, 125–147. [Google Scholar]
  19. Lugli, L.; Ragni, M.; Piccardi, L.; Nori, R. Hypermedia Navigation: Differences between Spatial Cognitive Styles. Comput. Hum. Behav. 2017, 66, 191–200. [Google Scholar] [CrossRef]
  20. Giancola, M.; Verde, P.; Cacciapuoti, L.; Angelino, G.; Piccardi, L.; Bocchi, A.; Palmiero, M.; Nori, R. Does the High Level of Navigational Strategy Depend On the Number of Flight Hours or on an Innate Predisposition? The Case of Military Pilots. Soc. Sci. 2021. [Google Scholar] [CrossRef]
  21. Giancola, M.; Verde, P.; Cacciapuoti, L.; Angelino, G.; Piccardi, L.; Bocchi, A.; Palmiero, M.; Nori, R. Do Advanced Spatial Strategies Depend on the Number of Flight Hours? The Case of Military Pilots. Brain Sci. 2021, 11, 851. [Google Scholar] [CrossRef]
  22. Rodes, W.; Gugerty, L. Effects of Electronic Map Displays and Individual Differences in Ability on Navigation Performance. Hum. Factors 2012, 54, 589–599. [Google Scholar] [CrossRef]
  23. Bocchi, A.; Giancola, M.; Piccardi, L.; Palmiero, M.; Nori, R.; D’Amico, S. How Would You Describe a Familiar Route or Put in Order the Landmarks along It? It Depends on Your Cognitive Style! Exp. Brain Res. 2018, 236, 3121–3129. [Google Scholar] [CrossRef]
  24. Boccia, M.; Piccardi, L.; D’Alessandro, A.; Nori, R.; Guariglia, C. Restructuring the Navigational Field: Individual Predisposition towards Field Independence Predicts Preferred Navigational Strategy. Exp. Brain Res. 2017, 235, 1741–1748. [Google Scholar] [CrossRef] [PubMed]
  25. Angeli, C. Examining the Effects of Field Dependence–Independence on Learners’ Problem-Solving Performance and Interaction with a Computer Modeling Tool: Implications for the Design of Joint Cognitive Systems. Comput. Educ. 2013, 62, 221–230. [Google Scholar] [CrossRef]
  26. Nusrat, S.; Kobourov, S. The State of the Art in Cartograms. Comput. Graph. Forum 2016, 35, 619–642. [Google Scholar] [CrossRef] [Green Version]
  27. Henriques, R.; BaÇão, F.; Lobo, V.S. Carto-SOM: Cartogram creation using self-organizing maps. Int. J. Geogr. Inf. Sci. 2019, 23, 483–511. [Google Scholar] [CrossRef]
  28. Inoue, R. A New Construction Method for Circle Cartograms. Cartogr. Geogr. Inf. Sci. 2013, 38, 146–152. [Google Scholar] [CrossRef]
  29. Nusrat, S.; Alam, J.; Kobourov, S. Evaluating Cartogram Effectiveness. IEEE Trans. Visual. Comput. Graph. 2018, 24, 1077–1090. [Google Scholar] [CrossRef] [Green Version]
  30. Nusrat, S.; Alam, J.; Kobourov, S. Recognition and Recall of Geographic Data in Cartograms. In Proceedings of the International Conference on Advanced Visual Interfaces, Salerno, Italy, 28 September 2020; pp. 1–9. [Google Scholar]
  31. Peña-Araya, V.; Pietriga, E.; Bezerianos, A. A Comparison of Visualizations for Identifying Correlation over Space and Time. IEEE Trans. Visual. Comput. Graph. 2019, 26, 375–385. [Google Scholar] [CrossRef] [Green Version]
  32. Nusrat, S.; Alam, M.J.; Scheidegger, C.; Kobourov, S. Cartogram Visualization for Bivariate Geo-Statistical Data. IEEE Trans. Visual. Comput. Graph. 2018, 24, 2675–2688. [Google Scholar] [CrossRef]
  33. Elmer, M.E. Symbol Considerations for Bivariate Thematic Maps. Ph.D. Thesis, Master-University of Wisconsin-Madison, Madison, WI, USA, 2012. [Google Scholar]
  34. Hullman, J.; Kosara, R.; Lam, H. Finding a Clear Path: Structuring Strategies for Visualization Sequences. Comput. Graph. Forum 2017, 36, 365–375. [Google Scholar] [CrossRef]
  35. Hullman, J.; Drucker, S.; Riche, N.H.; Lee, B.; Fisher, D.; Adar, E. A Deeper Understanding of Sequence in Narrative Visualization. IEEE Trans. Vis. Comput. Graph. 2013, 19, 2406–2415. [Google Scholar] [CrossRef]
  36. Boccia, M.; Piccardi, L.; Di Marco, M.; Pizzamiglio, L.; Guariglia, C. Does Field Independence Predict Visuo-Spatial Abilities Underpinning Human Navigation? Behavioural Evidence. Exp. Brain Res. 2016, 234, 2799–2807. [Google Scholar] [CrossRef]
  37. Bocchi, A.; Palmiero, M.; Nori, R.; Verde, P.; Piccardi, L. Does Spatial Cognitive Style Affect How Navigational Strategy Is Planned? Exp. Brain Res. 2019, 237, 2523–2533. [Google Scholar] [CrossRef]
  38. Tascón, L.; Di Cicco, C.; Piccardi, L.; Palmiero, M.; Bocchi, A.; Cimadevilla, J.M. Sex Differences in Spatial Memory: Comparison of Three Tasks Using the Same Virtual Context. Brain Sci. 2021, 11, 757. [Google Scholar] [CrossRef]
  39. Nisiforou, E.A.; Michailidou, E.; Laghos, A. Using Eye Tracking to Understand the Impact of Cognitive Abilities on Search Tasks. In Proceedings of the International Conference on Human-Computer Interaction. Design for All and Accessibility Practice, Creta Maris, Heraklion, Crete, Greece, 22–27 June 2014. [Google Scholar]
  40. Nisiforou, E.A.; Laghos, A. Field Dependence–Independence and Eye Movement Patterns: Investigating Users’ Differences Through an Eye Tracking Study. Interact. Comput. 2016, 28, 407–420. [Google Scholar] [CrossRef]
  41. Jia, S.; Zhang, Q.; Li, S. Field Dependence–Independence Modulates the Efficiency of Filtering out Irrelevant Information in a Visual Working Memory Task. Neuroscience 2014, 278, 136–143. [Google Scholar] [CrossRef]
  42. Tascón, L.; Boccia, M.; Piccardi, L.; Cimadevilla, J.M. Differences in Spatial Memory Recognition Due to Cognitive Style. Front. Pharmacol. 2017, 8, 550. [Google Scholar] [CrossRef] [Green Version]
  43. Hong, J.-C.; Hwang, M.-Y.; Tam, K.-P.; Lai, Y.-H.; Liu, L.-C. Effects of Cognitive Style on Digital Jigsaw Puzzle Performance: A GridWare Analysis. Comput. Hum. Behav. 2012, 28, 920–928. [Google Scholar] [CrossRef]
  44. Zaini, Z. Mathematical Reasoning Abilities of Students in Terms of Field Dependence (Fd) Cognitive Style in Problem-solving. Multica Sci. Technol. 2021, 1, 1–5. [Google Scholar] [CrossRef]
  45. Nisak, A.R.Z.; As’ari, A.R.; Rahardi, R.; Subanji, S. The Relationship of Student’s Algrebraic Thinking and Cognitive Learning Style. IndoMath Indones. Math. Educ. 2020, 3, 70–77. [Google Scholar]
  46. Liu, H.-C. Investigating the Impact of Cognitive Style on Multimedia Learners’ Understanding and Visual Search Patterns: An Eye-Tracking Approach. J. Educ. Comput. Res. 2018, 55, 1053–1068. [Google Scholar] [CrossRef]
  47. Suryani, D.R.; Nengsih, L.W.; Sianturi, M.; Nur ‘Aini, K.D.; Meirista, E. An Analysis of Grade IV’s Error on Whole Number Based on Newman Procedure’s Cognitive Style. In Proceedings of the International Conference on Science and Technology, Bali, Indonesia, 19–20 October 2018; pp. 849–852. [Google Scholar]
  48. Alharthi, S.A.; Raptis, G.E.; Katsini, C.; Dolgov, I.; Nacke, L.E.; Toups, Z.O. Investigating the Effects of Individual Cognitive Styles on Collaborative Gameplay. ACM Trans. Comput.-Hum. Interact. 2021, 28, 1–49. [Google Scholar] [CrossRef]
  49. Farmaki, C.; Sakkalis, V.; Loesche, F.; Nisiforou, E.A. Independence Cognitive Abilities Through EEG-Based Bistable Perception Processing. Front. Hum. Neurosci. 2019, 13, 1–18. [Google Scholar] [CrossRef] [PubMed]
Figure 1. Color and size of bivariate plot.
Ijgi 11 00574 g001
Figure 2. A portion of the US map converted to a corresponding Dorling cartogram.
Ijgi 11 00574 g002
Figure 3. Experimental interface.
Ijgi 11 00574 g003
Figure 4. Experimental background sequence architecture. (a) The “S-T” sequence uses Space as a global exploration layer and Time as a local exploration layer. (b) The “T-S” sequence uses Time as a global exploration layer and Space as a local exploration layer.
Ijgi 11 00574 g004aIjgi 11 00574 g004b
Figure 5. Experimental process.
Ijgi 11 00574 g005
Figure 6. Percentage distribution of response time of subjects with different field styles in different structural designs and different trend tasks.
Ijgi 11 00574 g006
Figure 7. Percentage distribution of correct rate of subjects with different field styles in different structural designs and different trend tasks.
Ijgi 11 00574 g007
Figure 8. Percentage distribution of cognitive load of subjects with different field styles in different structural designs and different trend tasks.
Ijgi 11 00574 g008
Table 1. M–W test of subjects with different field styles in response time in single-trend and correlation-trend tasks.
TaskStructural DesignCognitive StyleMedian (ms)ZPη²
Single trendS-TFI
FD
22,551.833
27,491.000
−2.0020.045 *0.103
T-SFI
FD
25,454.000
31,492.830
−2.4350.015 *0.152
Double trendS-TFI
FD
27,089.667
33,447.333
−2.2180.027 *0.126
T-SFI
FD
32,086.667
37,997.167
−2.4620.014 *0.155
* p ≤ 0.05.
Table 2. M–W test of correct rate of subjects with different field styles in single-trend and correlation-trend tasks.
TaskStructural DesignCognitive StyleMedian (%)ZPη²
Single trendS-TFI
FD
91.665
83.330
−1.8030.0710.083
T-SFI
FD
83.330
75.000
−1.9010.0570.093
Double trendS-TFI
FD
83.330
66.670
−1.9300.0540.096
T-SFI
FD
66.670
58.335
−2.5790.010 *0.171
* p ≤ 0.05.
Table 3. M–W test of cognitive load of subjects with different field styles in single-trend and correlation-trend tasks.
TaskStructural DesignCognitive StyleMedianZPη²
Single trendS-TFI
FD
4.333
4.000
−1.4100.1590.051
T-SFI
FD
4.167
4.000
−1.4870.1370.057
Double trendS-TFI
FD
4.000
3.333
−2.2030.028 *0.124
T-SFI
FD
3.670
2.670
−2.3390.019 *0.140
* p ≤ 0.05.
Publisher’s Note: MDPI stays neutral with regard to jurisdictional claims in published maps and institutional affiliations.

