Abstract
Mapping slums is vital for monitoring the Sustainable Development Goal (SDG) indicators. In the absence of reliable data, Remote Sensing (RS)-based approaches, particularly the Deep Learning (DL) methods, have gained recognition and high accuracies for slum mapping. However, using RS alone has its limitation in complex urban environments. Previous studies showed the added value of combining ground-level information with RS. Therefore, this research aims to integrate Remote Sensing Imagery (RSI) and Street View Images (SVI) for slum mapping. Jakarta city is the study area representing the challenge of distinguishing between slum and non-slum kampungs, and these kampungs accommodate approximately 60% of the population of Jakarta. This research compares the mapping results obtained by four DL networks: FCN-DK6 used only RSI, a VGG16 used only SVI, and two networks combined RSI and SVI (FCN-DK6-i and Modified FCN-DK6). Further, the Modified FCN-DK6 network was explored by integrating SVI at each convolutional layer, i.e., Modified FCN-DK6_1, Modified FCN-DK6_2, Modified FCN-DK6_3, Modified FCN-DK6_4, and Modified FCN-DK6_5. Experimental results demonstrate that combining RSI and SVI improves the accuracy, depending on how and at what level in the FCN network they are integrated. The Modified FCN-DK6_2 outperforms the rest in Modified FCN-DK6 experiments and FCN-DK6-i.
1. Introduction
The global population living in urban areas is increasing rapidly due to overall population growth as well as increasing urbanization rates [1]. More than half of the population currently lives in urban areas, and this proportion is estimated to be as high as 68% by 2050 [2]. Adequate city planning in the face of such rapid expansion is difficult and inadequate response to the growth often leads to inadequate infrastructure, services and houses, as well as an increase in slums and slum dwellers. This challenge is particularly relevant for the Global South. Indeed, the population living in slums is estimated to be above one billion people [3].
Slums and informal settlements across the world share some similar physical characteristics [4,5]. According to the most widespread definition, a household must meet at least one of the following conditions to be considered a slum: (1) absence of tenure security, (2) lack of housing durability, (3) insufficient living spaces, (4) lack of access to water, and (5) lack of access to sanitation [4]. However, it should be noted that some, albeit few, informal settlements may be relatively wealthy and have sufficient living conditions. When a group of slum households forms an unplanned layout in high-density urban areas, it is called a slum area. Slum areas are dynamic, i.e., physical characteristics within slums change over time in terms of density of structures, location, building size, height, and arrangement, making slum identification extremely complex using Remote Sensing (RS).
Identifying and characterizing slum areas using RS can help to understand and update the current situation to support slum development policies and plans [6]. Updated spatial information on the location and characteristics of slum areas in official records is often missing or incomplete [7,8]. Generating up-to-date slum maps and providing them to local governments supports them in their efforts to target interventions and upgrade slum areas efficiently.
Approaches for mapping slums can be broadly divided into three categories: survey-based, participatory and RS-based [9]. Survey-based and participatory approaches require extensive human resources, whereas RS-based approaches require fewer resources for field work but do require expert knowledge in RS in order to interpret the images [10]. The benefits of utilizing RS data include that it can be regularly updated and, as it is taken from above, it provides information on areas that are not accessible from the ground [11].
In recent years, many researchers have developed different methods to map slums due to the increasing availability of Very High Resolution (VHR) Remote Sensing Imagery (RSI) [9]. RS-based slum mapping can be done through visual image interpretation, where an expert manually delimits slum areas. The resulting slum maps can have high accuracy [12]. However, this manual process is very slow, the obtained accuracy depends greatly on how the expert perceives slums and the identified boundaries tend to differ among experts [13,14]. Nevertheless, in the absence of up-to-date and consistent official slum boundaries, visual interpretation is often used as reference data to cross-check slum boundaries obtained through other methods.
Automatic Machine Learning (ML) methods are an alternative approach for delineating slum boundaries in RSI. Object-Based Image Analysis (OBIA) is a sub-group of ML methods used for this purpose [15]. These methods first segment an image by grouping neighboring pixels into “objects” that represent meaningful objects in the imagery (e.g., houses, trees), and characteristics such as size and shape can be computed for each of these objects [16], which is used to identify slum areas, i.e., the primary set is to define a rule set to identify slums using RSI [9,17]. Yet designing the rule set criteria is extremely challenging as the appearance of slums, and thus their morphological characteristics, show a great variation across cities and within a single city [18]. OBIA can also be combined with traditional ML methods, such as Random Forest (RF), to classify image objects in complex urban environments. The traditional ML methods extract spatial features from RSI to map slums [19] and can obtain better results than the rule-set-based OBIA approach [15].
Deep Learning (DL) approaches have recently gained popularity in various image classification tasks, including the classification of RSI. For example, Fully Convolutional Networks (FCNs) consist of different layers that can be trained to automatically extract relevant features from the imagery, thus extracting more accurate information and often achieving higher accuracy than other ML methods [19]. Indeed, studies have recently shown that FCNs can also achieve high accuracies for mapping using RSI [20].
All methods of generating slum maps require a clear conceptualization of the characteristics of slums [21]. Due to the large variation in slum appearances across different contexts, there is no universal definition of slums; the definitions change over time and space and also depends on the official definitions adopted by governmental organizations. Therefore, it is a good practice to start any slum mapping exercise by incorporating local and contextual knowledge into the conceptualization of a slum [22].
RSI gives a bird’s eye view of an area, but it does not reflect the detailed ground-level information in order to understand the complexity of slum areas, such as non-durable wall construction materials or the number of floors of a building, or the presence of uncovered or open drainage elements in the neighborhood. Rather, such information should be obtained from the ground through field surveys, interviews, focus groups, or Street View Images (SVI), i.e., photographs of a neighborhood obtained from the ground level. Yet very few studies have used SVI to identify slums [23,24]. Furthermore, using SVI alone has limitations because it provides only point-wise information or information along an easily accessible roadway, but it cannot produce a spatially complete slum map. For example, if we want to map a region only accessible by foot, in that case, we cannot use SVI alone because SVI are often photographed by people accessing the areas using automobiles.
Although previous studies [23,24,25] have integrated ground-level information with RSI, none of the researchers directly integrated SVI and RSI for slum mapping. Therefore, our study aims to analyze whether combining RSI with SVI using the DL approach leads to higher accuracy in slum mapping (compared to both methods individually). Based on a case study in Jakarta, experiments compare slum classifications using only SVI, only RSI, a simple combination, and a novel combination network presented here.
2. Study Area
Jakarta is one of the most densely populated provinces of Indonesia and growing rapidly [26]. It is the country’s economic center and its work opportunities attract people from many other regions. The increasing population and urbanization overcome the availability of affordable housing [14], resulting in the growth of informal settlements.
The 2030 Sustainable Development Goals (SDGs) and other global development agendas are recognized by the Indonesian national government and incorporated into various planning programs such as the National Medium-Term Development Plan (RPJMN) [27]. For example, Improving the quality of housing and settlements and Clean Water and Sanitation have been included in the RPMJN 2020–2024 [27], which explicitly plans for a 100-0-100 (i.e., 100% access to clean water with zero slums and 100% access to sanitation) policy. Keeping track of slum reduction is key to monitoring the success of this initiative. However, two main reasons make slum monitoring difficult in Jakarta. First, various definitions of slums are used by national, regional and local governmental institutions in Indonesia, which makes it challenging to conceptualize and map slums uniformly. Using the different definitions of slums also leads to delineating different slum boundaries. Second, the characteristics of kampungs in Jakarta complicate the accurate mapping of slum areas. Around 50 years ago, Jakarta faced rapid urbanization leading to developing low-income housing called kampungs. The housing sector was under pressure due to the increasing population, affordable housing was lacking and many people were forced to live in substandard housing. This caused a gradual growth in the size of kampungs which also housed middle-class income groups. Kampungs grew to accommodate around 60% of the city’s population [14]. Figure 1 shows Jakarta’s location with the regional administrative boundary and selected study area.
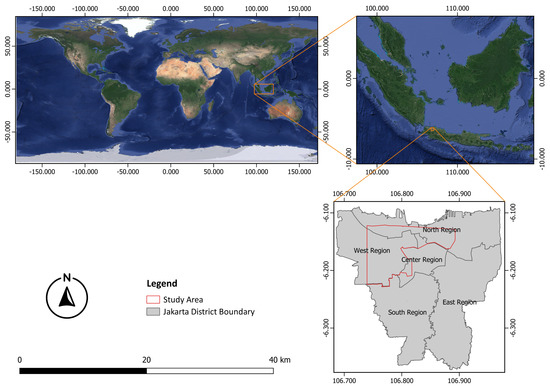
Figure 1.
Maps of Jakarta’s location with respective regional administrative boundaries and selected study area.
3. Materials and Methods
In this section, we first give an overview of the data used in this research. In the second section, a methodological workflow is presented.
3.1. Datasets
3.1.1. Slum Reference Map
Official slum boundaries were provided by the local government of Jakarta in 2017 (RW Kumuh). These slum boundaries are divided into four categories: heavy (Berat), medium (Sedang), light (Ringan), and very light (Sangat Ringan). Figure 2 displays these official boundaries and the four categories. As discussed in Section 1 and Section 2, the definition of slums varies from place to place and person to person. For this research, therefore, we combined important slum indicators formulated and utilized by governmental institutions and academic literature to create a single definition of slum and a corresponding set of slum indicators. Further, the official reference map was modified according to this definition, as discussed in the Data Preparation Section below and used as reference data to measure the accuracy of slum maps derived using RSI and SVI through the DL network.
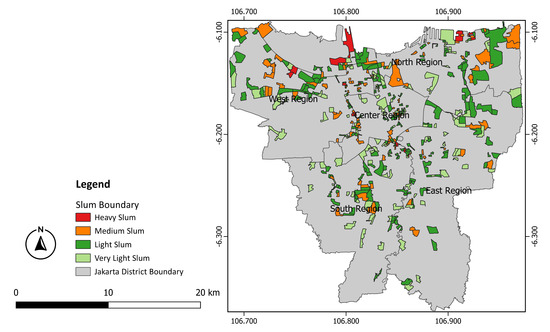
Figure 2.
Official slum boundaries from 2017 showing heavy, medium, light and very light slums.
3.1.2. Remote Sensing Imagery
The European Space Agency (ESA) granted 125 km2 of GeoEye mission satellite VHR imagery for the study. It was not possible to obtain satellite imagery from the same year as the official slum boundaries (2017). Therefore, imagery from 2018 with less than 10% cloud cover was procured due to constraints on obtaining recent data. The procured pan-sharpened multi-spectral (red, green, blue and near-infrared bands) imagery has a spatial resolution of 0.4 m.
3.1.3. Ancillary Data
Ancillary data included road networks, building footprints, and zoning data, which were available as shapefiles on the official website of Jakarta’s government (https://jakartasatu.jakarta.go.id/portal/apps/sites/#popup) (accessed on 7 February 2021). Note that these datasets were utilized to modify the reference data. They were not used as direct inputs for the deep learning algorithms.
The first ancillary dataset was the road network. This data consists of a shapefile with an attribute table containing the road class (kelas jala) and information (keterangan). The road class (attribute) information was used to identify minor roads (local) and branch roads (environment), which in turn helped select the locations to download the SVI. The information (attribute) describes road class information used to identify dirt roads (unpaved roads) for modifying the slum reference layer in this research.
The second ancillary dataset was the building footprint. The shapefile contains information on the area of each building (shape area). This attribute was used to filter out buildings of less than 60 m2 area for modifying the slum reference layer. A threshold of 60 m2 was utilized after visually comparing the building footprint data with the official slum reference map of 2017. These are slums as per the local government and as also confirmed by one of the co-authors (Mr. Jati Pratomo) with local expertise.
The third ancillary dataset was zoning data which contains information on the type of zone (zona). Zone types include green belt (zona jalur hijan), city park (zona tamon kota/ lingkungan), waterway (zona terbuka biru), cemetery (zona permakaman) and industrial and warehouse area (zona industri dan pergudangan). The zoning data was utilized to modify the slum reference layer. Green belts, city parks, waterways and cemeteries are areas where other infrastructural development, such as construction, cannot take place. These were, thus, used to flag zones that do not have a legal occupation. Therefore, residential buildings in these areas are likely to form informally to create larger slums.
3.1.4. Street View Imagery
A regular grid was generated to list the latitude and longitude in meters in order to query the SVI; thus, using these coordinates (latitude and longitude), images were obtained from Google Street View Static API in all four cardinal directions (north, south, east and west). Figure 3 shows the SVI captured in the cardinal direction at one of the slum locations in western Jakarta according to the official slum reference map of 2017.
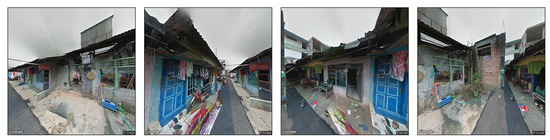
Figure 3.
SVI captured in the cardinal directions at one slum location according to official slum reference map of 2017.
Random points were generated along the minor road and branch road network, with an approximately equal number divided into slum and non-slum areas of the modified slum reference data using “random points along line” tool in QGIS. Any points that fell on boundaries between slum and non-slum areas were excluded to avoid confusing the DL classifier, i.e., any point which contains slums in the SVI directed east and non-slums in the SVI directed west would hamper the algorithm from learning features to distinguish the different classes. We eventually arrived at 6903 random points for slum areas and 7339 random points for non-slum areas, as shown in Figure 4.
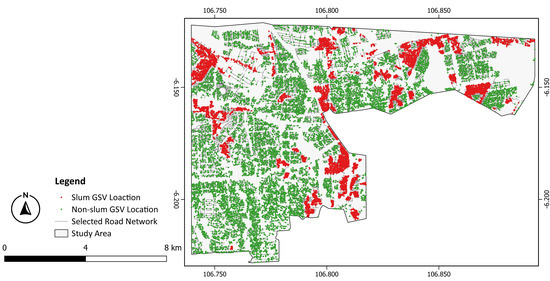
Figure 4.
Random point locations on roadways in both slum and non-slum areas (green are non-slum point and red are slum point).
This set of randomly generated point locations is called Google Street View (GSV) locations. A total of 19,796 images for slums and 24,596 for non-slum areas were obtained, and no GSV images were present at a few GSV locations. Each of the SVI downloaded was manually inspected for anomalies. For example, pictures that were completely dark or taken from inside buildings were removed from the dataset. The final set then contained 19,748 images for slum and non-slum areas.
3.2. Methodology
The research workflow consists of three phases (Figure 5). First is the identification stage, which characterizes slums in the study area and updates the reference slum map using RSI, SVI and ancillary data. Second comes the implementation phase, consisting of (i) data preprocessing and (ii) experimental design and running models. In the third and final stage, the accuracy values obtained for different models are compared.
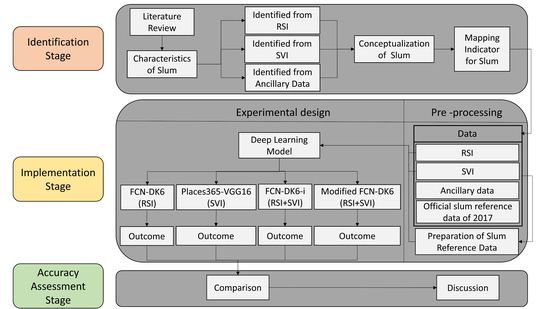
Figure 5.
An overview of the methodological workflow shown over three stages: identification, implementation and accuracy assessment.
3.2.1. Identification Stage
Slum characteristics were identified through a literature review. This review included identifying the indicators defined by global, national (Indonesia) and local (Jakarta) governmental organizations to identify slum characteristics and academic literature at the local level (Jakarta) in order to understand slum definitions in Jakarta’s kampungs using local characteristics. Additionally, one of the co-authors has considerable local expertise and greatly supported the understanding of slum characteristics in Jakarta in the local context. Based on these findings and the discussion with the local expert, an overview was made of slum characteristics that can be identified using RSI or SVI or ancillary data. These characteristics were used to conceptualize the concept of a slum for the purposes of this research. Table 1 demonstrates the conversion of chosen characteristics of slums into mapping indicators.

Table 1.
Conversion of chosen characteristics of slums into mapping indicators 1 in order to modify the 2017 official reference map of slum Source: [28].
3.2.2. Implementation Stage
Data Preparation
There are two steps to the preprocessing. The official slum reference map from 2017 was updated in the first stage using slum characteristics explained in Table 1. The dataset for training and subsequently, testing the results was generated in the second stage.
In the first step of data preprocessing, some regions in the 2017 official slum reference map did not fit the definition of slums used in this study. In the official reference map, certain highly developed areas, green spaces, tall residential structures and warehouse and industrial areas are categorized as slums. This misalignment may be caused by the temporal gap between the input data used for the classification, which was acquired in 2018, and the slum reference data, which was acquired in 2017. Therefore, the modification of the official reference slum map of 2017 was carried out according to the slum definition using the indicators presented in Table 1. In this process, a few localities were not classified as slums, as originally in the official slum reference map of 2017. Yet they exhibit the characteristics of slums as per the knowledge of local experts and slum definition used in this research. Therefore, the localities mentioned above were classified as an unknown category of slum. In this study, this updated and modified slum map was used to produce high-quality training and testing datasets for further analysis. The modified slum reference map used in this study is depicted in Figure 6.
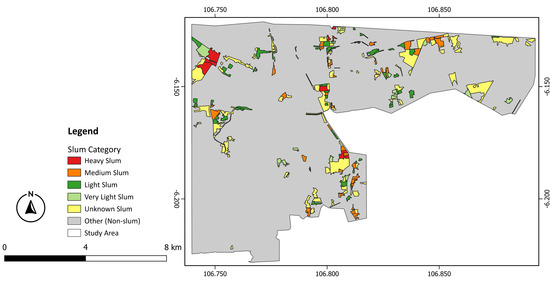
Figure 6.
Modified slum reference map created for this study using mapping indicators.
The second step of data preprocessing concerns preparing the data for the deep learning workflow, i.e., the FCN network. The study area was divided into 12 tiles of 2000 × 2000 pixels, each covering an area of 800 × 800 m. The tiles were selected in such a way to balance the classes (slum and other) within the tiles and ensure a diverse representation of both classes. Thus, 12 RSI and ground truth tiles were created, of which 10 were utilized for training and 2 for testing the FCN networks that were suggested in the study.
Fully Convolutional Neural Network
Persello and Stein [29] introduced a Fully Convolutional Neural Network-Dilated Kernel (FCN-DK) network for slum mapping. More specifically, FCN-DK6 performs better than all other FCN-DKs networks. Therefore, the FCN-DK6 network was used to identify slums using RSI alone and the combination of RSI and SVI. The researchers in [24] classify urban land use by combining the RSI with SVI through the FCN-VGG16 network. The disadvantage of selecting FCN-VGG16 or any other network is that it has a higher computational cost than FCN-DK6. In addition, FCN-DK uses the dilated convolution technique in order to increase the respective field while limiting the number of learnable parameters and reducing the risk of overfitting [30]. Furthermore, FCN-DK6 is an unexplored network when it comes to fusing two different levels of datasets, i.e., RSI (bird’s eye view level) and SVI (ground-level images).
Classification Using Only RSI
Each training tile was split into 125 × 125 pixels of non-overlapping patches. The FCN-DK6 was trained using the network set-up depicted in Table 2, with initial weights chosen at random. The number of training epochs was initially set to 300 and the validation accuracy was monitored by using Early Stopping methods from the Keras library with patience of 10 epochs, i.e., the model stops training if it does not find an increase in validation accuracy over the previous 10 epochs. The model ran until 300 epochs without stopping because the validation accuracy did not say constant for 10 successive epochs.
Table 2.
Network configuration used for training FCN-DK6, FCN-DK6-i and the Modified FCN-DK6 in this research.
Classification Using Only SVI
It can take a lot of time, resources, and access to a sizable database to train CNN from scratch. Therefore, to identify urban scenes from SVI, a pre-trained VGG16 network on the Places365 dataset was fine-tuned specifically for Jakarta. Using the same network set-up presented in Table 2, the Places365-VGG16 network was fine-tuned by freezing the five convolutional blocks and fine-tuning only the final classification block. The weights are initiated with Places365 weights. The Keras library’s Early Stopping method was used to track validation accuracy over a period of 10 epochs.
Classification Using an Integration of SVI with RSI
In order to combine information contained in SVI from discrete locations with RSI in a raster format, SVI feature maps were generated. The geographical area covered by GSV images depends on the mobility of automobiles, such as cars or bikes along the roadway, which helps to capture the picture of the urban environment at various GSV locations, i.e., “The GSV images capture the scenes of areas in the proximity instead of single dots in the space” [24]. Hence, it is essential to interpolate the point-wise ground-level information from GSV images into spatially continuous feature maps, which can be combined with the RSI. The feature maps are created in three steps: (i) feature extraction from GSV images, (ii) generating new points around each GSV location and (iii) interpolation of extracted feature spatially. To distinguish between slum and non-slum locations, the fine-tuned Places365-VGG 16 network was used to derive the features from GSV images. For each GSV image, 128 features were retrieved from the dense layer (dimensionality of 128) prior to the final fully connected layer in fine-tuned Places365-VGG16 network. However, integrating all 128 features into the FCN-DK would greatly increase the dimensionality of the data and computational time. Therefore, a feature reduction approach was applied to (i) minimize training time and (ii) minimize the FCN-DK network’s overfitting. Principal Component Analysis (PCA) was utilized to minimize the feature dimensionality. With the help of linear algebra, PCA converts the dataset into a compact representation [31], where the greatest variability is shown by PC’s first transformed component. The advantage of implementing PCA is that we can choose limited features while still capturing the greatest possible variability in the data. For this study, the first 32 PCA components were selected, which represented 58.35% of the total variance of 128 features. Further, for each GSV location, one point was generated in each direction (north, south, east and west) at a distance of 0.5 cm, shown in Figure 7. Then the 32 features (reduced features) for each GSV image were appended in accordance with their GSV location and the pertinent direction. These reduced features were converted from point features (i.e., the CNN features of the street view image at a defined location) to a continuous spatial grid through Inverse Distance Weighted (IDW) spatial interpolation. Finally, 32 feature maps were produced. Thus the number of feature maps produced was determined by the number of features added to each point. Figure 8 demonstrates the process used to create the feature maps. These feature maps can be integrated with RSI because they share the same spatial dimensions as RSI because, while generating feature maps using IDW interpolation, the extent and resolution were kept the same as the RSI.
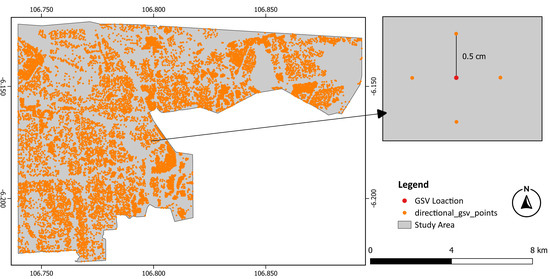
Figure 7.
At a distance of 0.5 cm from each GSV location, additional points were created in the cardinal direction (red are GSV locations and yellow are newly generated points).
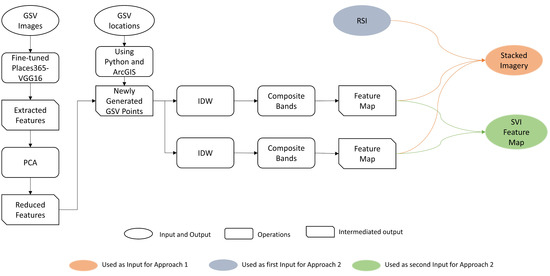
Figure 8.
Preparing feature maps and the input data for Approaches 1 and 2 (this figure only demonstrates the procedure for creating two feature maps; likewise, 32 feature maps can be generated).
Two approaches were used to integrate RSI with the SVI feature maps. The first approach is FCN-DK6-i, where RSI was directly stacked with the SVI feature maps using layer stacking functionality in ArcGIS. This stacked imagery (RSI + SVI feature maps) was given as input to FCN-DK6 for classifying slums. The FCN-DK6, which uses stacked imagery as input, is referred to as FCN-DK6-i from this point forward through the manuscript in order to avoid misunderstanding with the FCN-DK6 network, which uses RSI alone as an input. The training of FCN-DK6-i was carried out the same way as FCN-DK6, as discussed in Section Section 3.2.2—Classification Using only RSI.
The second approach is a Modified FCN-DK6. This research proposes a novel method for leveraging the FCN-DK6 network with six convolutional blocks to integrate RSI with the SVI feature map at deeper layers of the FCN-DK network. The FCN-DK6 network was modified to generate a single classification output using two individual inputs which is called Modified FCN-DK6. However, the SVI feature map is fused with each convolutional block separately in the Modified FCN-DK6 network, i.e., if the SVI features are concatenated at the 1st convolution block, it is called Modified FCN-DK6_1 similarly, SVI features were concatenated with the 2nd, 3rd, 4th, and 5th convolution block then they are called as FCN-DK6_2, FCN-DK6_3, FCN-DK6_4, and FCN-DK6_5, respectively, and collectively they are called Modified FCN-DK6 experiments from now on in this manuscript to avoid lengthy names for the networks. The Modified FCN-DK6_2 network used for this study is depicted in Figure 9.
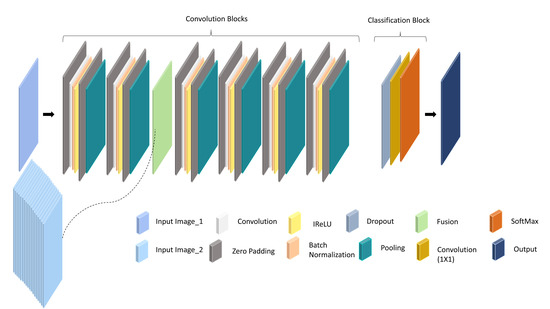
Figure 9.
Suggested network architecture of Modified FCN-DK6_2 for combining RSI and SVI feature map at 2nd convolution block (RSI is Input-Image_1 and stacked feature map of SVI is Input-Image_2.
As shown in Figure 9, the first input was routed via the 1st and 2nd convolution block, and the output from the 2nd convolution block was fused with the second input at the fusion and created a fused layer. After that, the fused layer was fed to the remaining convolution blocks, i.e., 3rd, 4th, 5th, and 6th, respectively, the output from the 6th convolution block was passed to the classification block, and the final classification map was generated using the Modified FCN-DK6_2 network. In this process, the first input is RSI and the second input is a stacked SVI feature map. Similarly, fusion was done at each convolutional block, i.e., 1st, 3rd, 4th, and 5th individually, and the final classified output was generated using Modified FCN-DK6_1, Modified FCN-DK6_3, Modified FCN-DK6_4, and Modified FCN-DK6_5 network. The network parameters during the training phase were the same as for FCN-DK6 (see Table 2).
3.2.3. Accuracy Evaluation
In this study, the model’s accuracy was evaluated using the testing tile prediction accuracy. Several accuracy metrics, including recall, precision, F1 score, IoU, overall accuracy (OA), and kappa coefficient, have been explored in previous slum mapping research. The kappa coefficient cannot be used to evaluate the model accuracy for a problem like an image classification [32]. Similarly, OA can also give deceptive results when a class imbalance is present. For example, a higher OA value does not always indicate better performance of the model, as is the case for slum mapping, where non-slum areas predominate over slum areas. As a result, the model outcomes were evaluated in this study using recall(R), precision (P), F1 score, and IoU. Equations (1)–(4) show how the recall, precision, F1 score, and IoU are calculated.
In the equations above: P = precision, R = recall, TP = true positive, FP = false positive, and FN = false negative. Furthermore, the accuracy was calculated for each slum category present in the modified slum reference data.
Thus, instead of comparing precision, recall, F1 score, and IoU for accuracy comparison among the proposed networks, we explored F1 score and IoU in detail because the F1 score is the combination of precision and recall, whereas IoU is a standard accuracy metric used in computer vision challenges such as PASCAL VOC challenge [33].
4. Result
The accuracy metrics for the eight slum classification networks used in this research are provided in Table 3. Results indicate that using only RSI, i.e., FCN-DK6 (IoU = 61.65) outperforms using only SVI, i.e., Places365-VGG16 (IoU = 55.46), and few networks that integrate RSI and SVI, i.e., Modified FCN-DK6_1 (IoU = 56.63), Modified FCN-DK6_3 (IoU = 58.05), and Modified FCN-DK6_4 (IoU = 54.8) in this case study. The FCN-DK6-i, which integrates both RSI and SVI, obtains accuracies approximately equal to that of FCN-DK6 and Modified FCN-DK6_5. However, the Modified FCN-DK6_2 achieves the highest F1 Score and IoU. This is mainly due to an increase in the recall by 2.9% compared to FCN-DK6-i, 3.3% compared to Modified FCN-DK6_5, and 3.5% compared to FCN-DK6.
Table 3.
Accuracy metrics for the eight different experimental set-ups. Results in bold indicate the highest values.
The accuracy assessment can also be disaggregated according to the types of slums identified in the modified slum reference map, where the class “unknow slum” refers to parts of the RSI that were visually identified as slums according to the characteristics labeled in Table 1 but not officially classified as slum in the provided reference data (see Section 3.2.2—Data Preparation on how the reference data was modified). The result for Modified FCN-DK6_2 is presented in Table 4 and Figure 10 depicts the outcome generated by Modified FCN-DK6_2 on tile-12. Similarly, Figure A1 depicts the outcome generated by Modified FCN-DK6_2 on tile-3 in annexure-A.
Table 4.
The Modified FCN-DK6_2 cumulated confusion matrix, which includes various slum categories and non-slum (other).
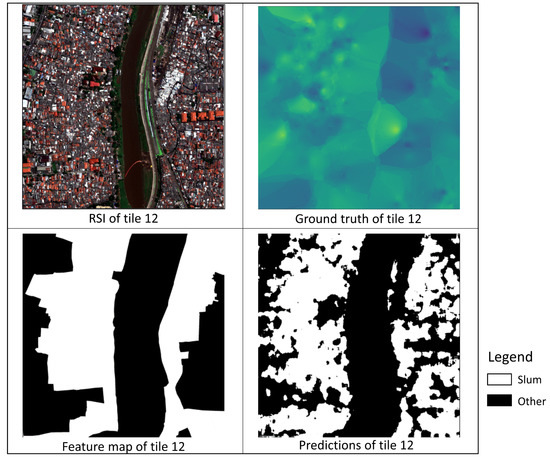
Figure 10.
Outcome generated for tile-12 using Modified FCN-DK6_2,white color represents slum areas and black shows other areas (non-slum).
We wanted to analyze how different combinations of input datasets affect the understanding of the DL model for various categories of slums. Therefore FCN-DK6, Places365-VGG16, FCN-DK6-i, and Modified FCN-DK6_2 were selected. Only Modified FCN-DK6_2 was selected from Modified FCN-DK6 experiments as it performs better than others. The predicted outcome generated using FCN-DK6, Places365-VGG16, FCN-DK6-i, and Modified FCN-DK6_2 was further broken down into various categories of slums, as shown in Figure 11.

Figure 11.
The outcome generated by FCN-DK6, Places365-VGG16, FCN-DK6-i and Modified FCN-DK6_2 networks is compared across the various slum categories.
Figure 11 demonstrates that Places365-VGG16 can more accurately identify heavy, medium and very light slums than other FCN-DK6 networks used in this research, but it performed poorly at detecting light and unknown categories of slums. Compared to FCN-DK6-i and FCN-DK6, the Modified FCN-DK6_2 is more accurate at classifying the various types of slums, whereas, when it comes to classifying light and unknown slum categories, Modified FCN-DK6_2 outperforms Places365-VGG16.
5. Discussion
The results of these experiments indicate that including information from SVI can increase the accuracy of slum classification rather than using RSI alone, but it also depends on how and at what level SVI is integrated into the FCN-DK network. The simple stacking of RSI and SVI for FCN-DK6-i did not improve on using only RSI as input, whereas integrating SVI through the more sophisticated Modified FCN-DK6 experiments did lead to an improvement. Modified FCN-DK6_2 and Modified FCN-DK6_5 perform better than FCN-DK6 and Places365-VGG16 network, as shown in Table 3.
We have compared the result produced by FCN-DK6 and Modified FCN-DK6_2 because this research aims to compare the result generated by the combination of RSI and SVI over RSI. As discussed in Section 1, the slum map cannot be generated using SVI alone, therefore the result generated using the combination of RSI and SVI was not compared with that generated through SVI alone. Figure 12 compares the output generated for tile-12 by Modified FCN-DK6_2 and FCN-DK6. Similarly, Figure A2 compares the output generated for tile-3 by Modified FCN-DK6_2 and FCN-DK6 in annexure-A. Compared to FCN-DK6, Modified FCN-DK6_2 demonstrates a more accurate prediction. The SV potential to provide ground-level information that helps understand slums in an urban setting increases the Modified FCN-DK6_2 prediction accuracy. Thus, the red circle in Figure 12 indicates that the Modified FCN-DK6_2 outperforms the FCN-DK6 in places where SVI are available. Figure 13 illustrates the classification results generated by FCN-DK6 and Modified FCN-DK6_2 for detecting slum regions. It includes (a) the actual image of a slum area with GSV locations and (b) and (c) the results generated by FCN-DK6 and Modified FCN-DK6. The area demarked by yellow circle indicates the misclassification of a slum area as non-slum due to the lack of availability of SVI and the absence of slum characteristics, particularly in the roofing material; both networks produce approximately the same outcome. In contrast, the area demarked by magenta indicates that the availability of SVI plays a vital role in identifying slums while using Modified FCN-DK6_2.
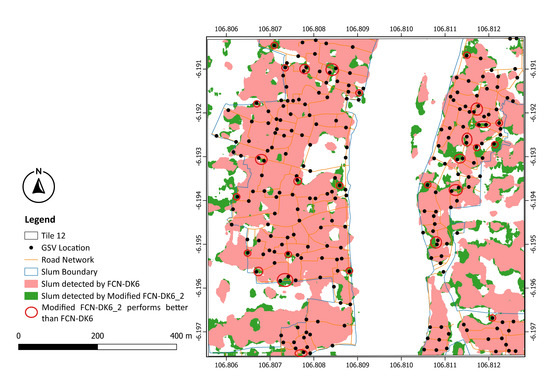
Figure 12.
The outcome generated by Modified FCN-DK6_2 and FCN-DK6 for tile-12 (location highlighted by red circle represent those places where Modified FCN-DK6_2 perform better than FCN-DK6 because of the availability of GSV location).
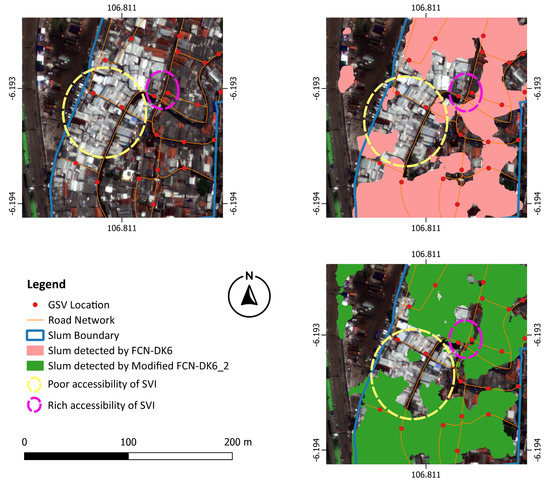
Figure 13.
Classification using FCN-DK6 and Modified FCN-DK6_2 for detecting slum areas (area highlighted in yellow, where Modified FCN-DK6_2 and FCN-DK6 performs poorly because access to the GSV location was limited and area highlighted in magenta where Modified FCN-DK6_2 perform better than FCN-DK6 because access to the GSV location was rich).
As shown in Figure 11, integrating SVI also improves the identification of the different slum categories. Thus, the SVI capture visible characteristics of slums that are not visible in RSI (such as building construction materials, open drainage, etc.). Furthermore, the fine-tuned Places365-VGG16 network is more appropriate for differentiating between slum categories, such as heavy and medium slums. Upon further investigations of the Places365-VGG16 network, we observed that the images of slums on which Places365-VGG16 was pre-trained are more similar to the slum images that fall into the category of heavy and medium slums in our case study. This may be why the fine-tuned Places365-VGG16 particularly improved the recall of these two slum categories.
Although the inclusion of SVI with RSI is promising for slum classification applications, further research is needed to optimize this integration. Firstly, the coverage of SVI is not consistent in slum areas and there are many areas with no SVI available. This is because the information along the road is only captured in SVI [24]. Furthermore, there are streets with no SVI. This research used IDW interpolation to generate the SVI feature maps. Further research could find more sophisticated ways of dealing with this inconsistent coverage to better interpolate the SVI features spatially. For example, techniques that explicitly deal with missing data could be investigated. Alternatively, ancillary data, such as road networks or city blocks [34] available through OpenStreetMap, could be used to interpolate the SVI more meaningfully.
Secondly, the SVI feature maps were generated with the first 32 principal compo-nents of the 128 Places365-VGG16 features. These 32 components only explain 58% of the variance of all of the features, yet it is not computationally efficient if one tries to generate feature maps for all 128 features and integrate them all as layers into the Modified FCN-DK6_2. Further research could investigate ways of generating feature maps that capture more information from the SVI without generating too many spatial layers to include in the Modified FCN-DK6_2.
Finally, it is important to remember the conceptualization of slums is highly depend-ent on the local context [34]. As a result, conceptualizing the slum based on the local con-text is highly valued when generating slum maps.
6. Conclusions
Over the past two decades, RSI has shown increasing promise for identifying slums and creating slum maps. This information can be crucial for policymakers in planning urban upgrading projects. However, physical characteristics captured through RSI are limited to understanding the urban environment, e.g., building size, density, roof material and road network pattern. However, other characteristics related to living conditions—such as building construction material and open drainage—are important to identify slums, yet very difficult to capture in RSI. This gap can be filled by SVI, in particular, integrating SVI and RSI. For a case study in Jakarta, the use of RSI and SVI data together performed better than either RSI or SVI data alone. Our results also demonstrated that the network architecture is crucial in increasing accuracy. A novel Modified FCN-DK6_2 network presented here showed a large improvement in Recall, F1 score and IoU. More research is needed to explore a more optimized way of integration. Another important point for further research is to find an efficient way to spatially interpolate the information obtained from the SVI classification, which is limited to point-wise observations at coordinates where the SVI was taken, with the continuous spatial coverage provided by the RSI.
Author Contributions
Conceptualization, Abbas Najmi; Methodology, Abbas Najmi; Writing—original draft, Abbas Najmi; Writing—review & editing, Caroline M. Gevaert, Monika Kuffer and Jati Pratomo; Supervision, Caroline M. Gevaert, Divyani Kohli, Monika Kuffer and Jati Pratomo; Project administration, Divyani Kohli. All authors have read and agreed to the published version of the manuscript.
Funding
The author acknowledges the European Space Agency (ESA) providing the grant (Category-1 Proposal “D 65316” “Integrating remote sensing and street view images to map slums using a deep learning” “approach”) for acquiring the GeoEye mission satellite imagery of the study area for this research.
Data Availability Statement
The data will be uploaded to the DANS EASY platform in accordance with the regulations of the University of Twente. Requests for access should be sent to the corresponding author.
Acknowledgments
The authors would like to acknowledge the faculty of ITC for providing the CRIB platform for computation and the technical support provided by Serkan Girgin regarding the CRIB issues. We also thank Claudio Persello for providing the FCN-DK6 network and the authors of”Places: A 10 million Image Database for Scene Recognition” article for providing the open source pre-tarin places365—VGG 16 model on Github. Further, Google Maps provided the necessary google street view images of the study area, and the Jakarta local government provided slum reference data and ancillary such as road network, building footprint, and zoning data via https://jakartasatu.jakarta.go.id/portal/apps/sites/#popup (accessed on 7 February 2021).
Conflicts of Interest
The authors declare no conflict of interest.
Appendix A

Figure A1.
Outcome generated for tile-3 using Modified FCN-DK6_2, where white stands for slum area and black for other areas (non-slum).
Figure A1.
Outcome generated for tile-3 using Modified FCN-DK6_2, where white stands for slum area and black for other areas (non-slum).


Figure A2.
Comparison of the outcome generated by Modified FCN-DK6_2 and FCN-DK6 for tile-3. (Location highlighted by red circle represents those places where Modified FCN-DK6_2 performs better than FCN-DK6 because of the availability of GSV location).
Figure A2.
Comparison of the outcome generated by Modified FCN-DK6_2 and FCN-DK6 for tile-3. (Location highlighted by red circle represents those places where Modified FCN-DK6_2 performs better than FCN-DK6 because of the availability of GSV location).

References
- World Urbanization Prospects. 2018. Available online: https://population.un.org/wup/ (accessed on 4 September 2022).
- World Urban Population. Available online: https://statisticstimes.com/demographics/world-urban-population.php (accessed on 4 September 2022).
- Sachs, J.; Schmidt-Traub, G.; Kroll, C.; Lafortune, G.; Fuller, G. Sustainable Development Report 2020; Cambridge University Press: Cambridge, UK, 2021. [Google Scholar]
- UN-Habitat. Metadata on SDGs Indicator 11.1.1 Indicator Category: Tier I; UN-Habitat: Nairobi, Kenya, 2018. [Google Scholar]
- UN-Habitat. Slum ALMANAC 2015–2016, Tracking Improvement in the Lives of Slum Dwellers; UN-Habitat: Nairobi, Kenya, 2016. [Google Scholar]
- Duque, J.C.; Patino, J.E.; Ruiz, L.A.; Pardo-Pascual, J.E. Measuring Intra-Urban Poverty Using Land Cover and Texture Metrics Derived from Remote Sensing Data. Landsc. Urban Plan. 2015, 135, 11–21. [Google Scholar] [CrossRef]
- Nijman, J. Against the Odds: Slum Rehabilitation in Neoliberal Mumbai. Cities 2008, 25, 73–85. [Google Scholar] [CrossRef]
- Carr-Hill, R. Missing Millions and Measuring Development Progress. World Dev. 2013, 46, 30–44. [Google Scholar] [CrossRef]
- Mahabir, R.; Croitoru, A.; Crooks, A.; Agouris, P.; Stefanidis, A. A Critical Review of High and Very High-Resolution Remote Sensing Approaches for Detecting and Mapping Slums: Trends, Challenges and Emerging Opportunities. Urban Science 2018, 2, 8. [Google Scholar] [CrossRef]
- Kuffer, M.; Thomson, D.R.; Boo, G.; Mahabir, R.; Grippa, T.; Vanhuysse, S.; Engstro, R.; Ndugwa, R.; Makau, J.; Darin, E.; et al. The Role of Earth Observation in an Integrated Deprived Area Mapping System for Low-to-Middle Income Countries. Remote Sens. 2020, 12, 982. [Google Scholar] [CrossRef]
- Hofmann, P.; Strobl, J.; Blaschke, T.; Kux, H. Chapter 6.1 Detecting Informal Settlements from QuickBird Data in Rio de Janeiro Using an Object-Based Approach. In Object-Based Image Analysis; Springer: Berlin/Heidelberg, Germany, 2008; pp. 531–553. [Google Scholar]
- Taubenbock, H.; Kraff, N.J. The Physical Face of Slums a Structural Comparison of Slums in Mumbai India Based on Remotely Sensed Data. J. Hous. Built Environ. 2013, 29, 15–38. [Google Scholar] [CrossRef]
- Pratomo, J.; Kuffer, M.; Kohli, D.; Martinez, J. Application of the Trajectory Error Matrix for Assessing the Temporal Transferability of OBIA for Slum Detection. Eur. J. Remote Sens. 2018, 51, 838–849. [Google Scholar] [CrossRef]
- Pratomo, J.; Kuffer, M.; Martinez, J.; Kohli, D. Coupling Uncertainties with Accuracy Assessment in Object-Based Slum Detections, Case Study: Jakarta, Indonesia. Remote Sens. 2017, 9, 1164. [Google Scholar] [CrossRef]
- Kuffer, M.; Pfeffer, K.; Sliuzas, R. Slums from Space-15 Years of Slum Mapping Using Remote Sensing. Remote. Sens. 2016, 8, 455. [Google Scholar] [CrossRef]
- Blaschke, T.; Hay, G.J.; Kelly, M.; Lang, S.; Hofmann, P.; Addink, E.; Queiroz Feitosa, R.; van der Meer, F.; van der Werff, H.; van Coillie, F.; et al. Geographic Object-Based Image—nalysis—Towards a New Paradigm. ISPRS J. Photogramm. Remote Sens. 2014, 87, 180–191. [Google Scholar] [CrossRef]
- Mahabir, R.; Agouris, P.; Stefanidis, A.; Croitoru, A.; Crooks, A.T. Detecting and Mapping Slums Using Open Data: A Case Study in Kenya. Int. J. Digit. Earth 2020, 13, 683–707. [Google Scholar] [CrossRef]
- Kuffer, M.; Wang, J.; Nagenborg, M.; Pfeffer, K.; Kohli, D.; Sliuzas, R.; Persello, C. The Scope of Earth-Observation to Improve the Consistency of the SDG Slum Indicator. ISPRS Int. J. Geo-Inf. 2018, 7, 428. [Google Scholar] [CrossRef]
- Mboga, N.; Persello, C.; Bergado, J.R.; Stein, A. Detection of Informal Settlements from VHR Images Using Convolutional Neural Networks. Remote Sens. 2017, 9, 1106. [Google Scholar] [CrossRef]
- Ajami, A.; Kuffer, M.; Persello, C.; Pfeffer, K. Identifyin “a Slum” Degree of Deprivation from VHR Images Using Convolutional Neural Networks. Remote Sens. 2019, 11, 1282. [Google Scholar] [CrossRef]
- Leonita, G.; Kuffer, M.; Sliuzas, R.; Persello, C. Machine Learning-Based Slum Mapping in Support of Slum Upgrading Programs: The Case of Bandung City, Indonesia. Remote Sens. 2018, 10, 1522. [Google Scholar] [CrossRef]
- Verma, D.; Jana, A.; Ramamritham, K. Transfer Learning Approach to Map Urban Slums Using High and Medium Resolution Satellite Imagery. Habitat Int. 2019, 88, 101981. [Google Scholar] [CrossRef]
- Workman, S.; Zhai, M.; Crandall, D.J.; Jacobs, N. A Unified Model for Near and Remote Sensing. In Proceedings of the 2017 IEEE International Conference on Computer Vision (ICCV), Venice, Italy, 22–29 October 2017. [Google Scholar]
- Cao, R.; Zhu, J.; Tu, W.; Li, Q.; Cao, J.; Liu, B.; Zhang, Q.; Qiu, G. Integrating Aerial and Street View Images for Urban Land Use Classification. Remote. Sens. 2018, 10, 1553. [Google Scholar] [CrossRef]
- Barbierato, E.; Bernetti, I.; Capecchi, I.; Saragosa, C. Integrating Remote Sensing and Street View Images to Quantify Urban Forest Ecosystem Services. Remote Sens. 2020, 12, 329. [Google Scholar] [CrossRef]
- Martinez, R.; Masron, I.N. Jakarta A City of Cities; Elsevier: Amsterdam, The Netherlands, 2020. [Google Scholar]
- Sustainable Development Knowledge Platform. Available online: https://sustainabledevelopment.un.org/vnrs/ (accessed on 4 September 2022).
- Najmi, A. Integrating Remote Sensing and Street View Images to Map Slums Using Deep Learning Approach. Master’s Thesis, University of Twente, Enschede, The Netherlands, August 2021. Available online: http://essay.utwente.nl/88704/ (accessed on 1 September 2022).
- Persello, C.; Stein, A. Deep Fully Convolutional Networks for the Detection of Informal Settlements in VHR Images. IEEE Geosci. Remote. Sens. Lett. 2017, 14, 2325–2329. [Google Scholar] [CrossRef]
- Yu, F.; Koltun, V. Multi-Scale Context Aggregation by Dilated Convolutions. arXiv 2015, arXiv:1511.07122. [Google Scholar]
- Jolliffe, I.T. Principal-Component-Analysis-2002; Springer: Berlin/Heidelberg, Germany, 2002. [Google Scholar]
- Hossin, M.; Sulaiman, M.N. A Review on Evaluation Metrics for Data Classification Evaluations. Int. J. Data Min. Knowl. Manag. Process 2015, 5, 1–11. [Google Scholar]
- Liu, Q.; Salberg, A.-B.; Jenssen, R. A Comparison of Deep Learning Architectures for Semantic Mapping of Very High Resolution Images. In Proceedings of the IGARSS 2018-2018 IEEE International Geoscience and Remote Sensing Symposium, Valencia, Spain, 22–27 July 2018. [Google Scholar]
- Kohli, D.; Sliuzas, R.; Kerle, N.; Stein, A. An Ontology of Slums for Image-Based Classification. Comput. Environ. Urban Syst. 2012, 36, 154–163. [Google Scholar] [CrossRef]


Publisher’s Note: MDPI stays neutral with regard to jurisdictional claims in published maps and institutional affiliations. |
© 2022 by the authors. Licensee MDPI, Basel, Switzerland. This article is an open access article distributed under the terms and conditions of the Creative Commons Attribution (CC BY) license (https://creativecommons.org/licenses/by/4.0/).