Possibilities for Assessment and Geovisualization of Spatial and Temporal Water Quality Data Using a WebGIS Application
Abstract
:1. Introduction
- To develop an analytical web tool to determine and geovisualize water quality indices,
- To map water quality and the degree of contamination across the settlement by using exported and calculated water quality data,
- To assess the spatial and temporal water quality changes for the period 2011–2019,
- To determine how different indices, categorize water samples based on the same input data.
2. Materials and Methods
2.1. Development of Geovisualization Tool
2.2. Determination and Evaluation of Indices
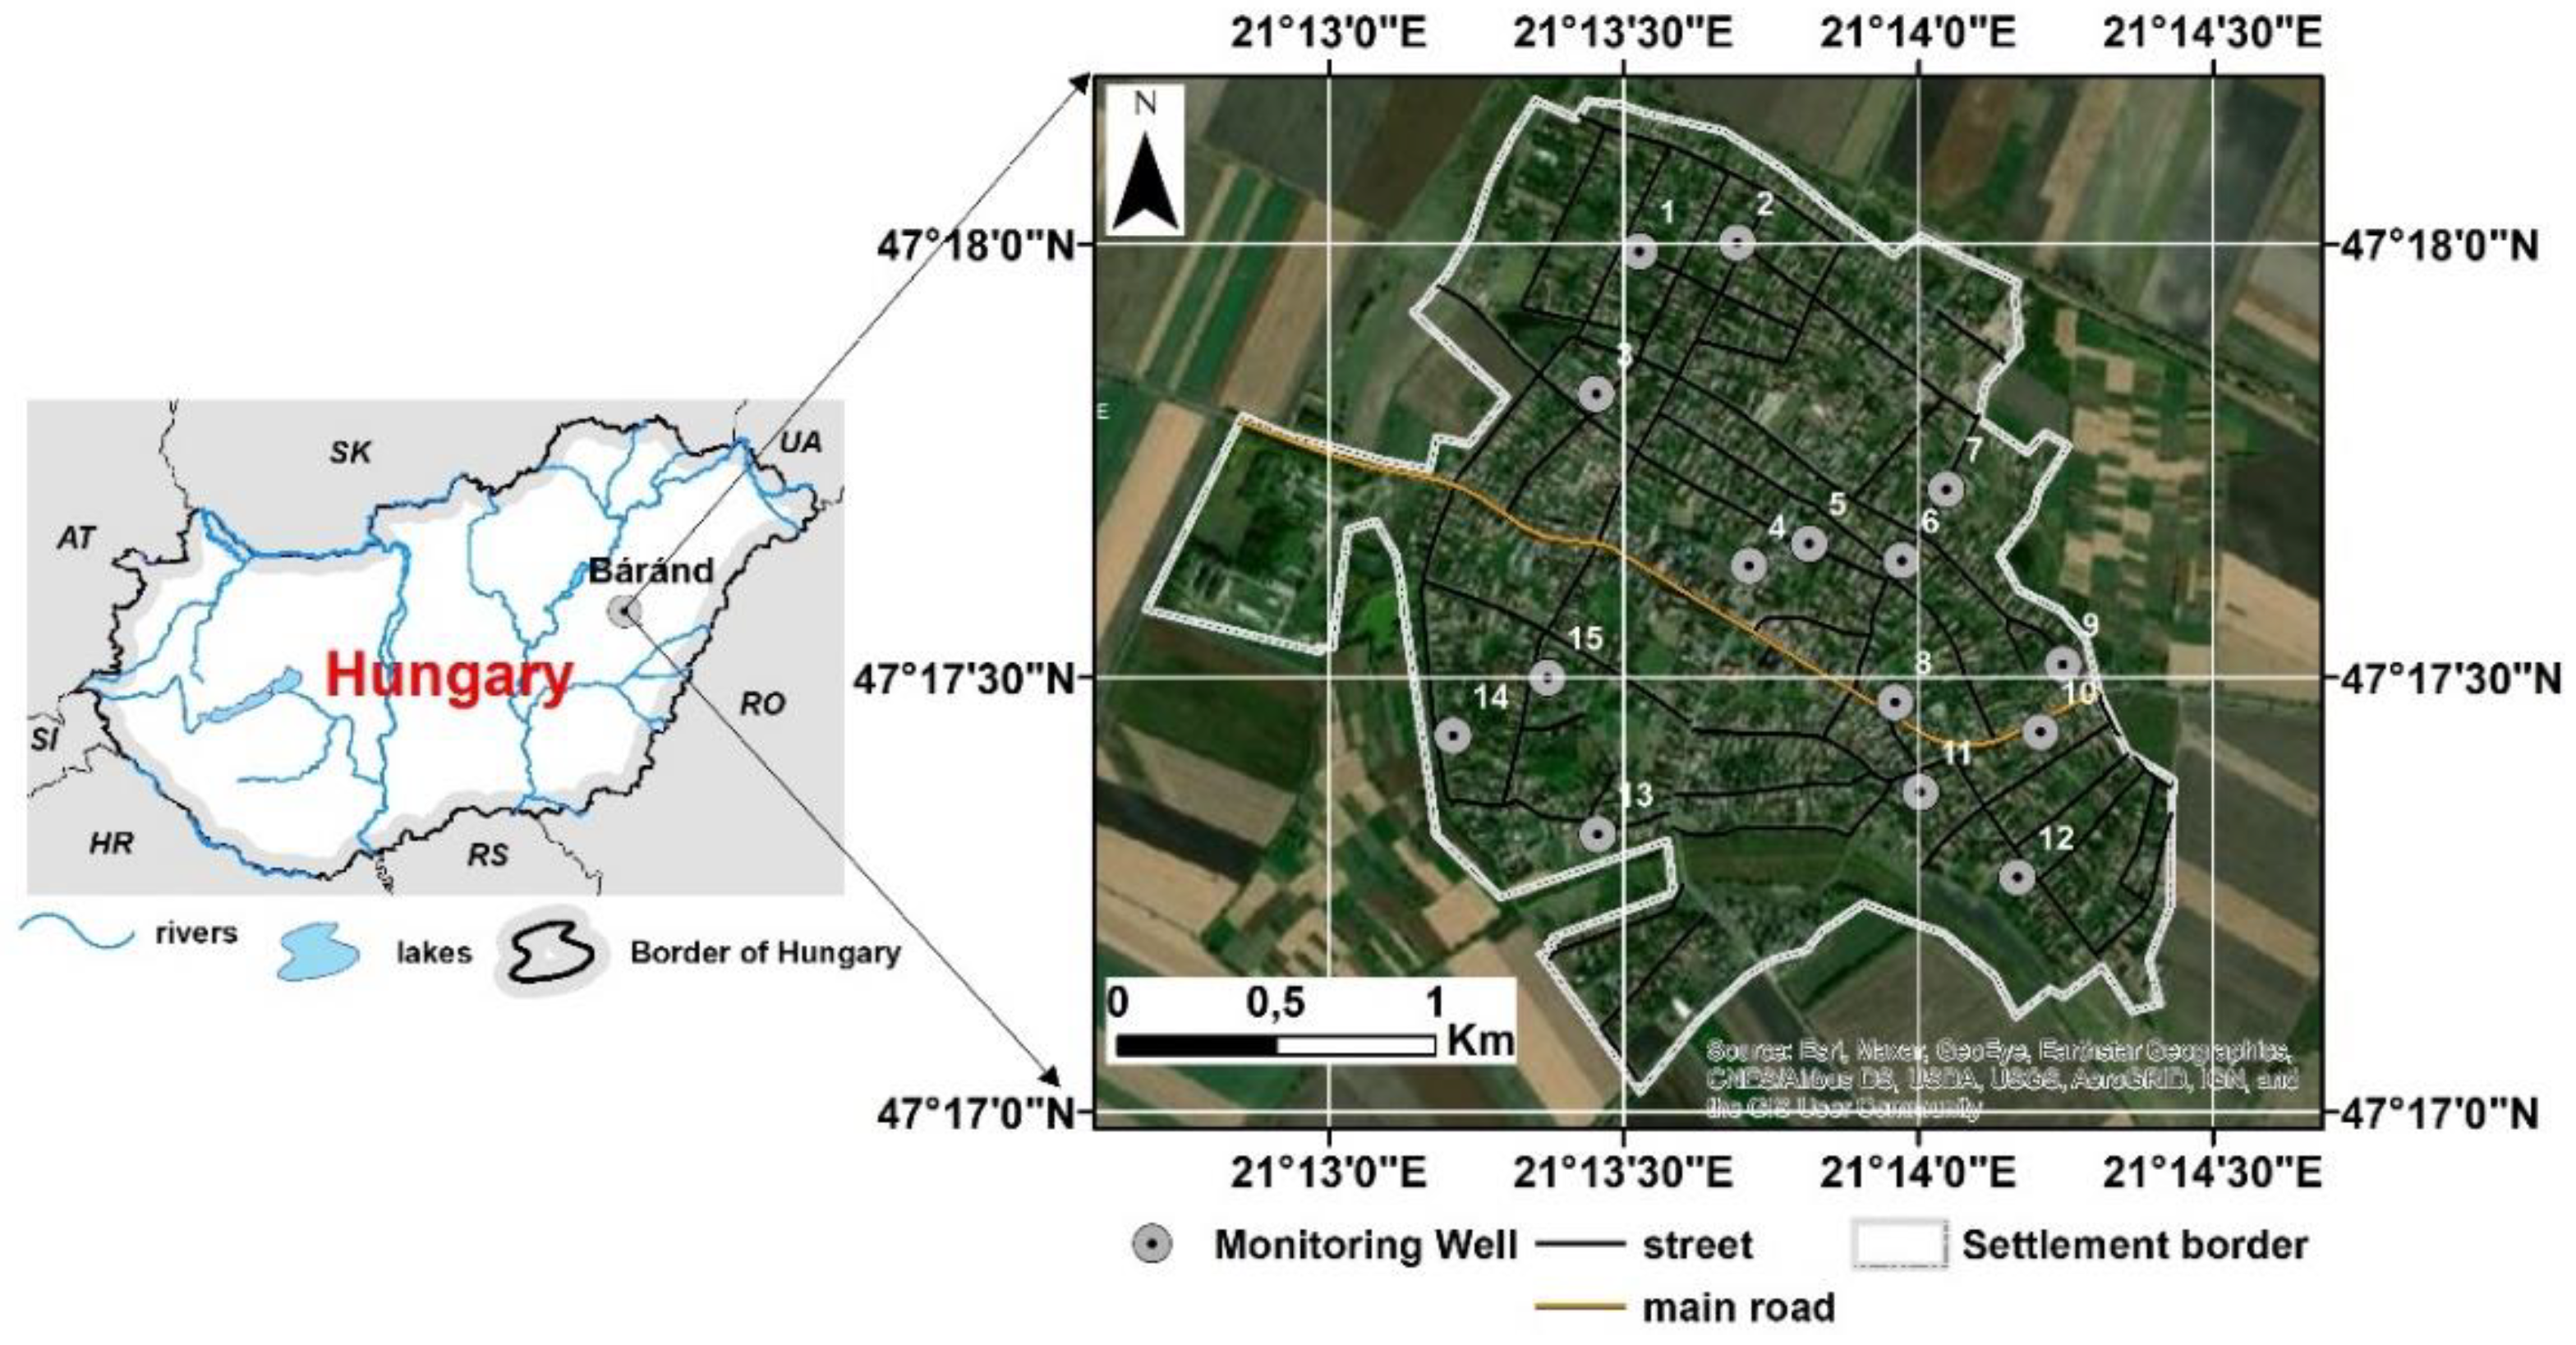
2.3. Description of Study Area
2.4. Water Sampling and Laboratory Measurements
2.5. Statistical Analysis
3. Results
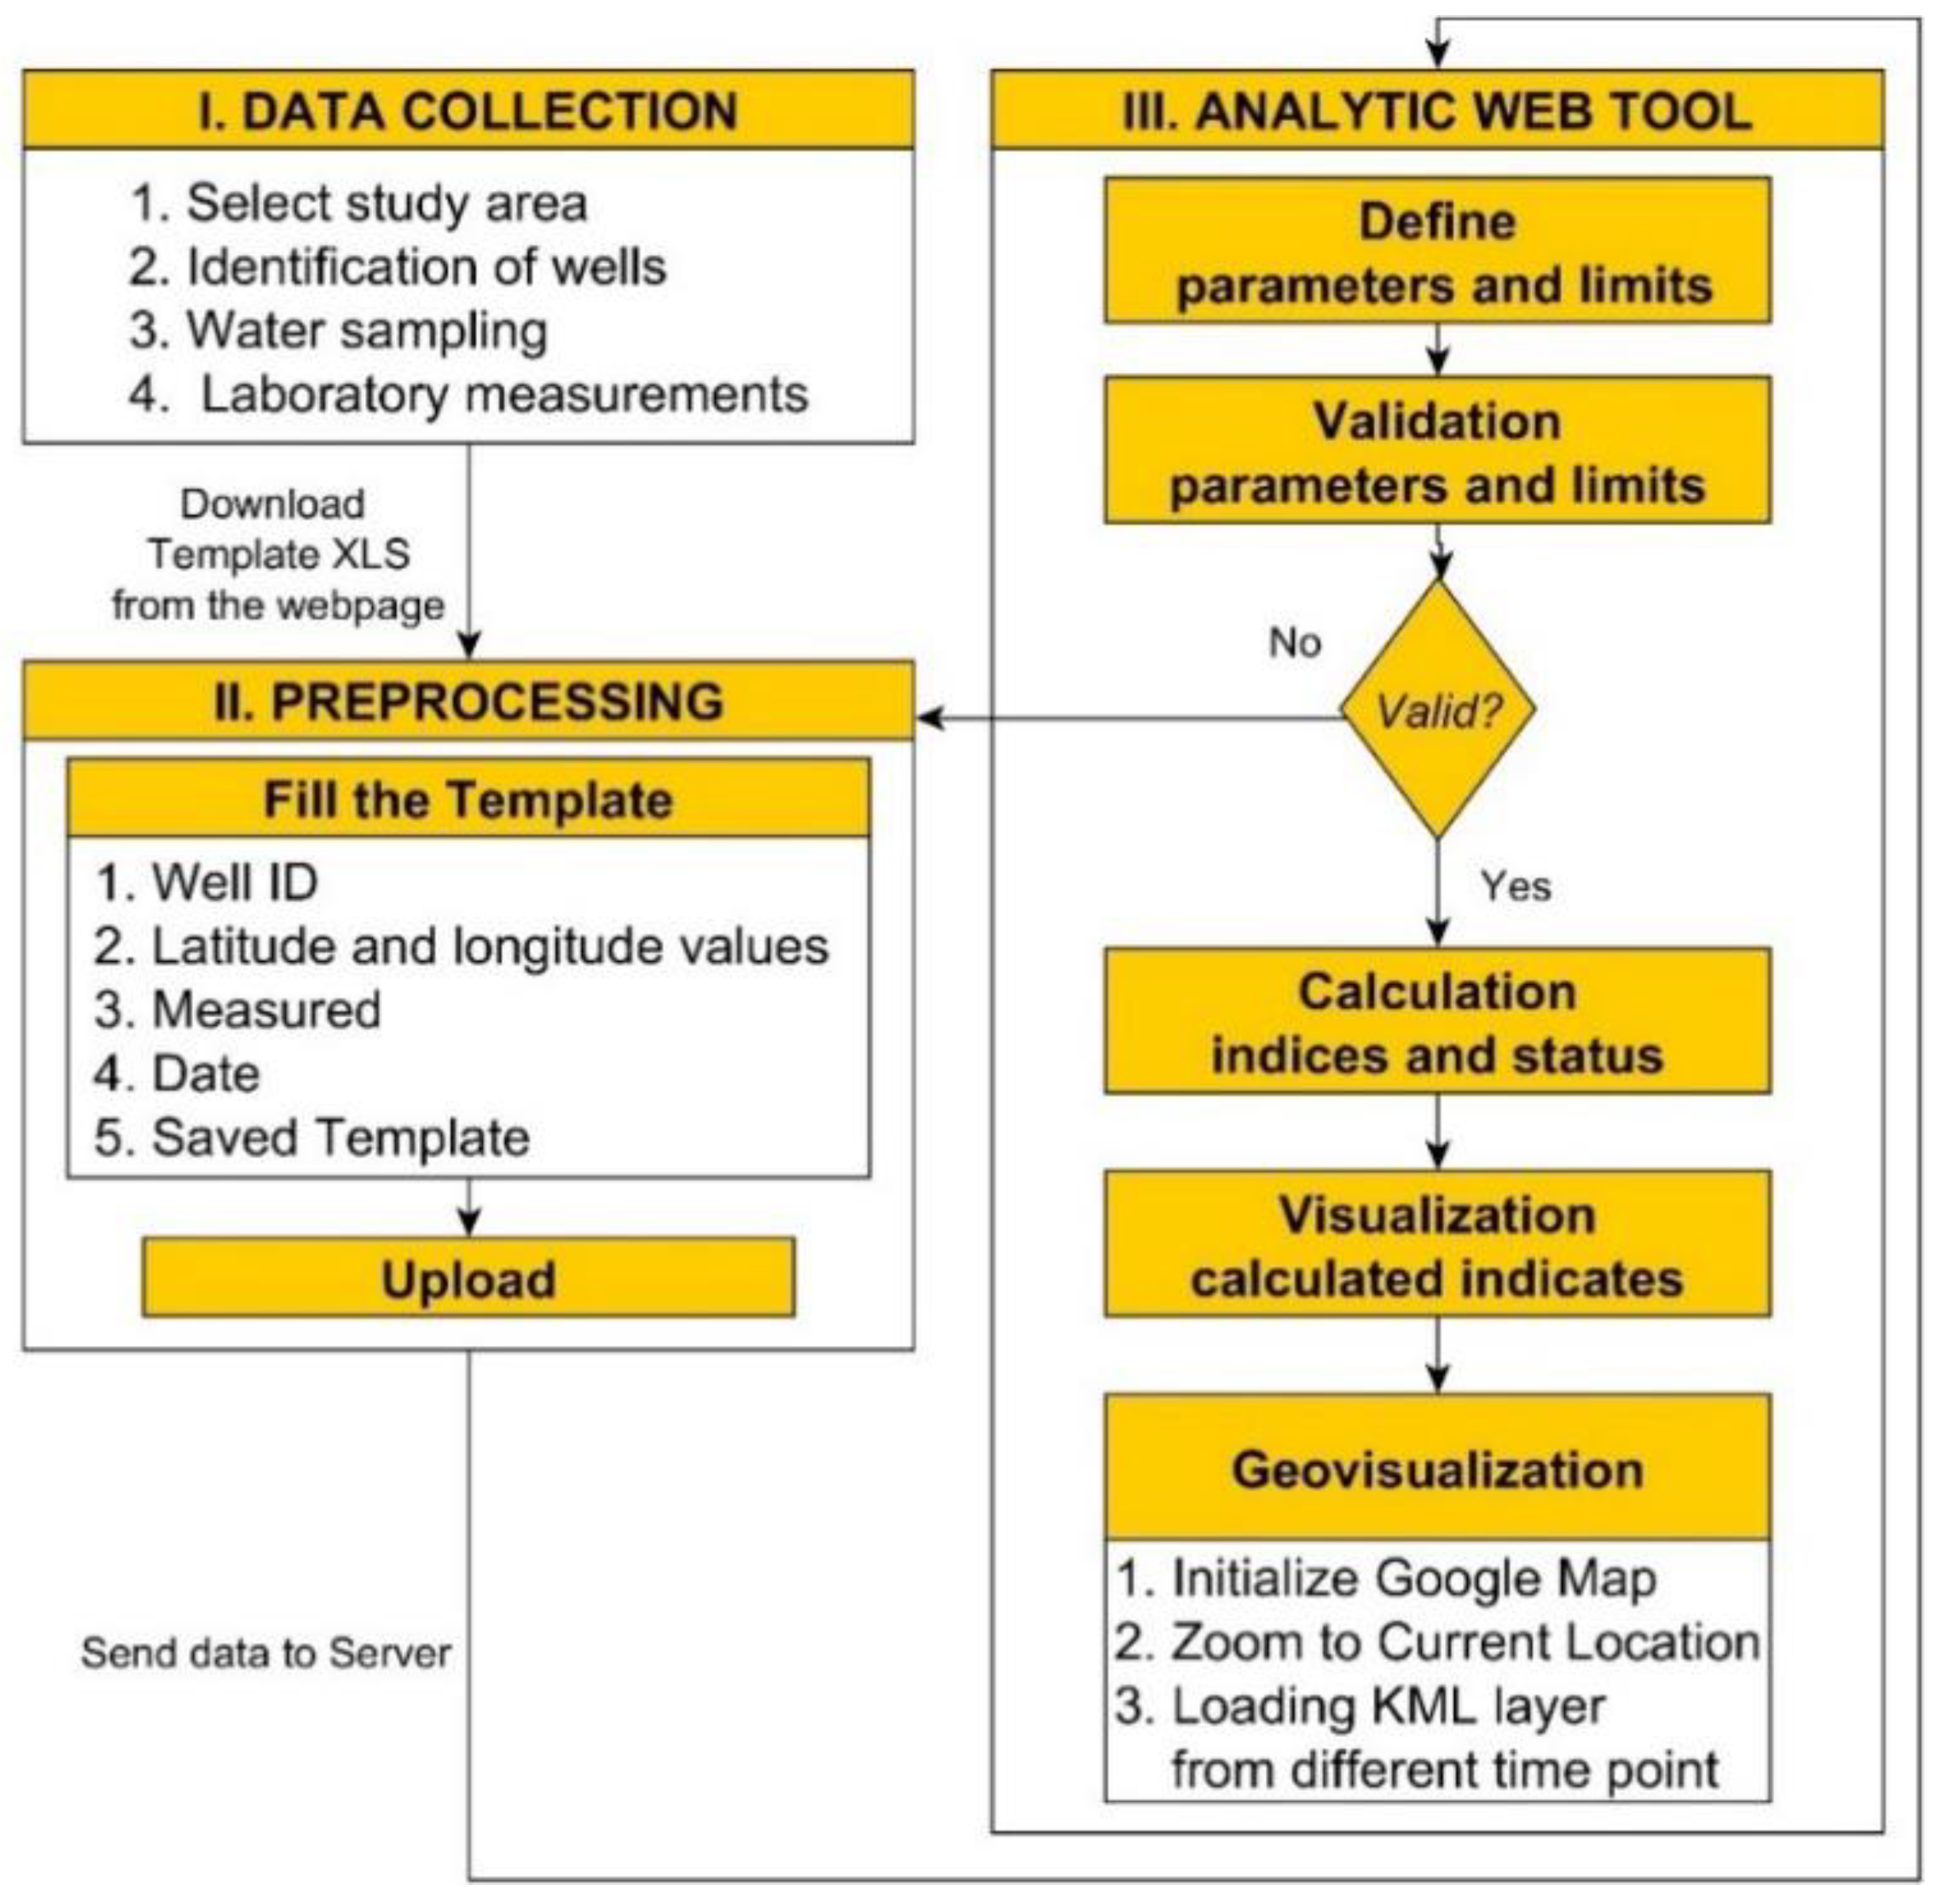
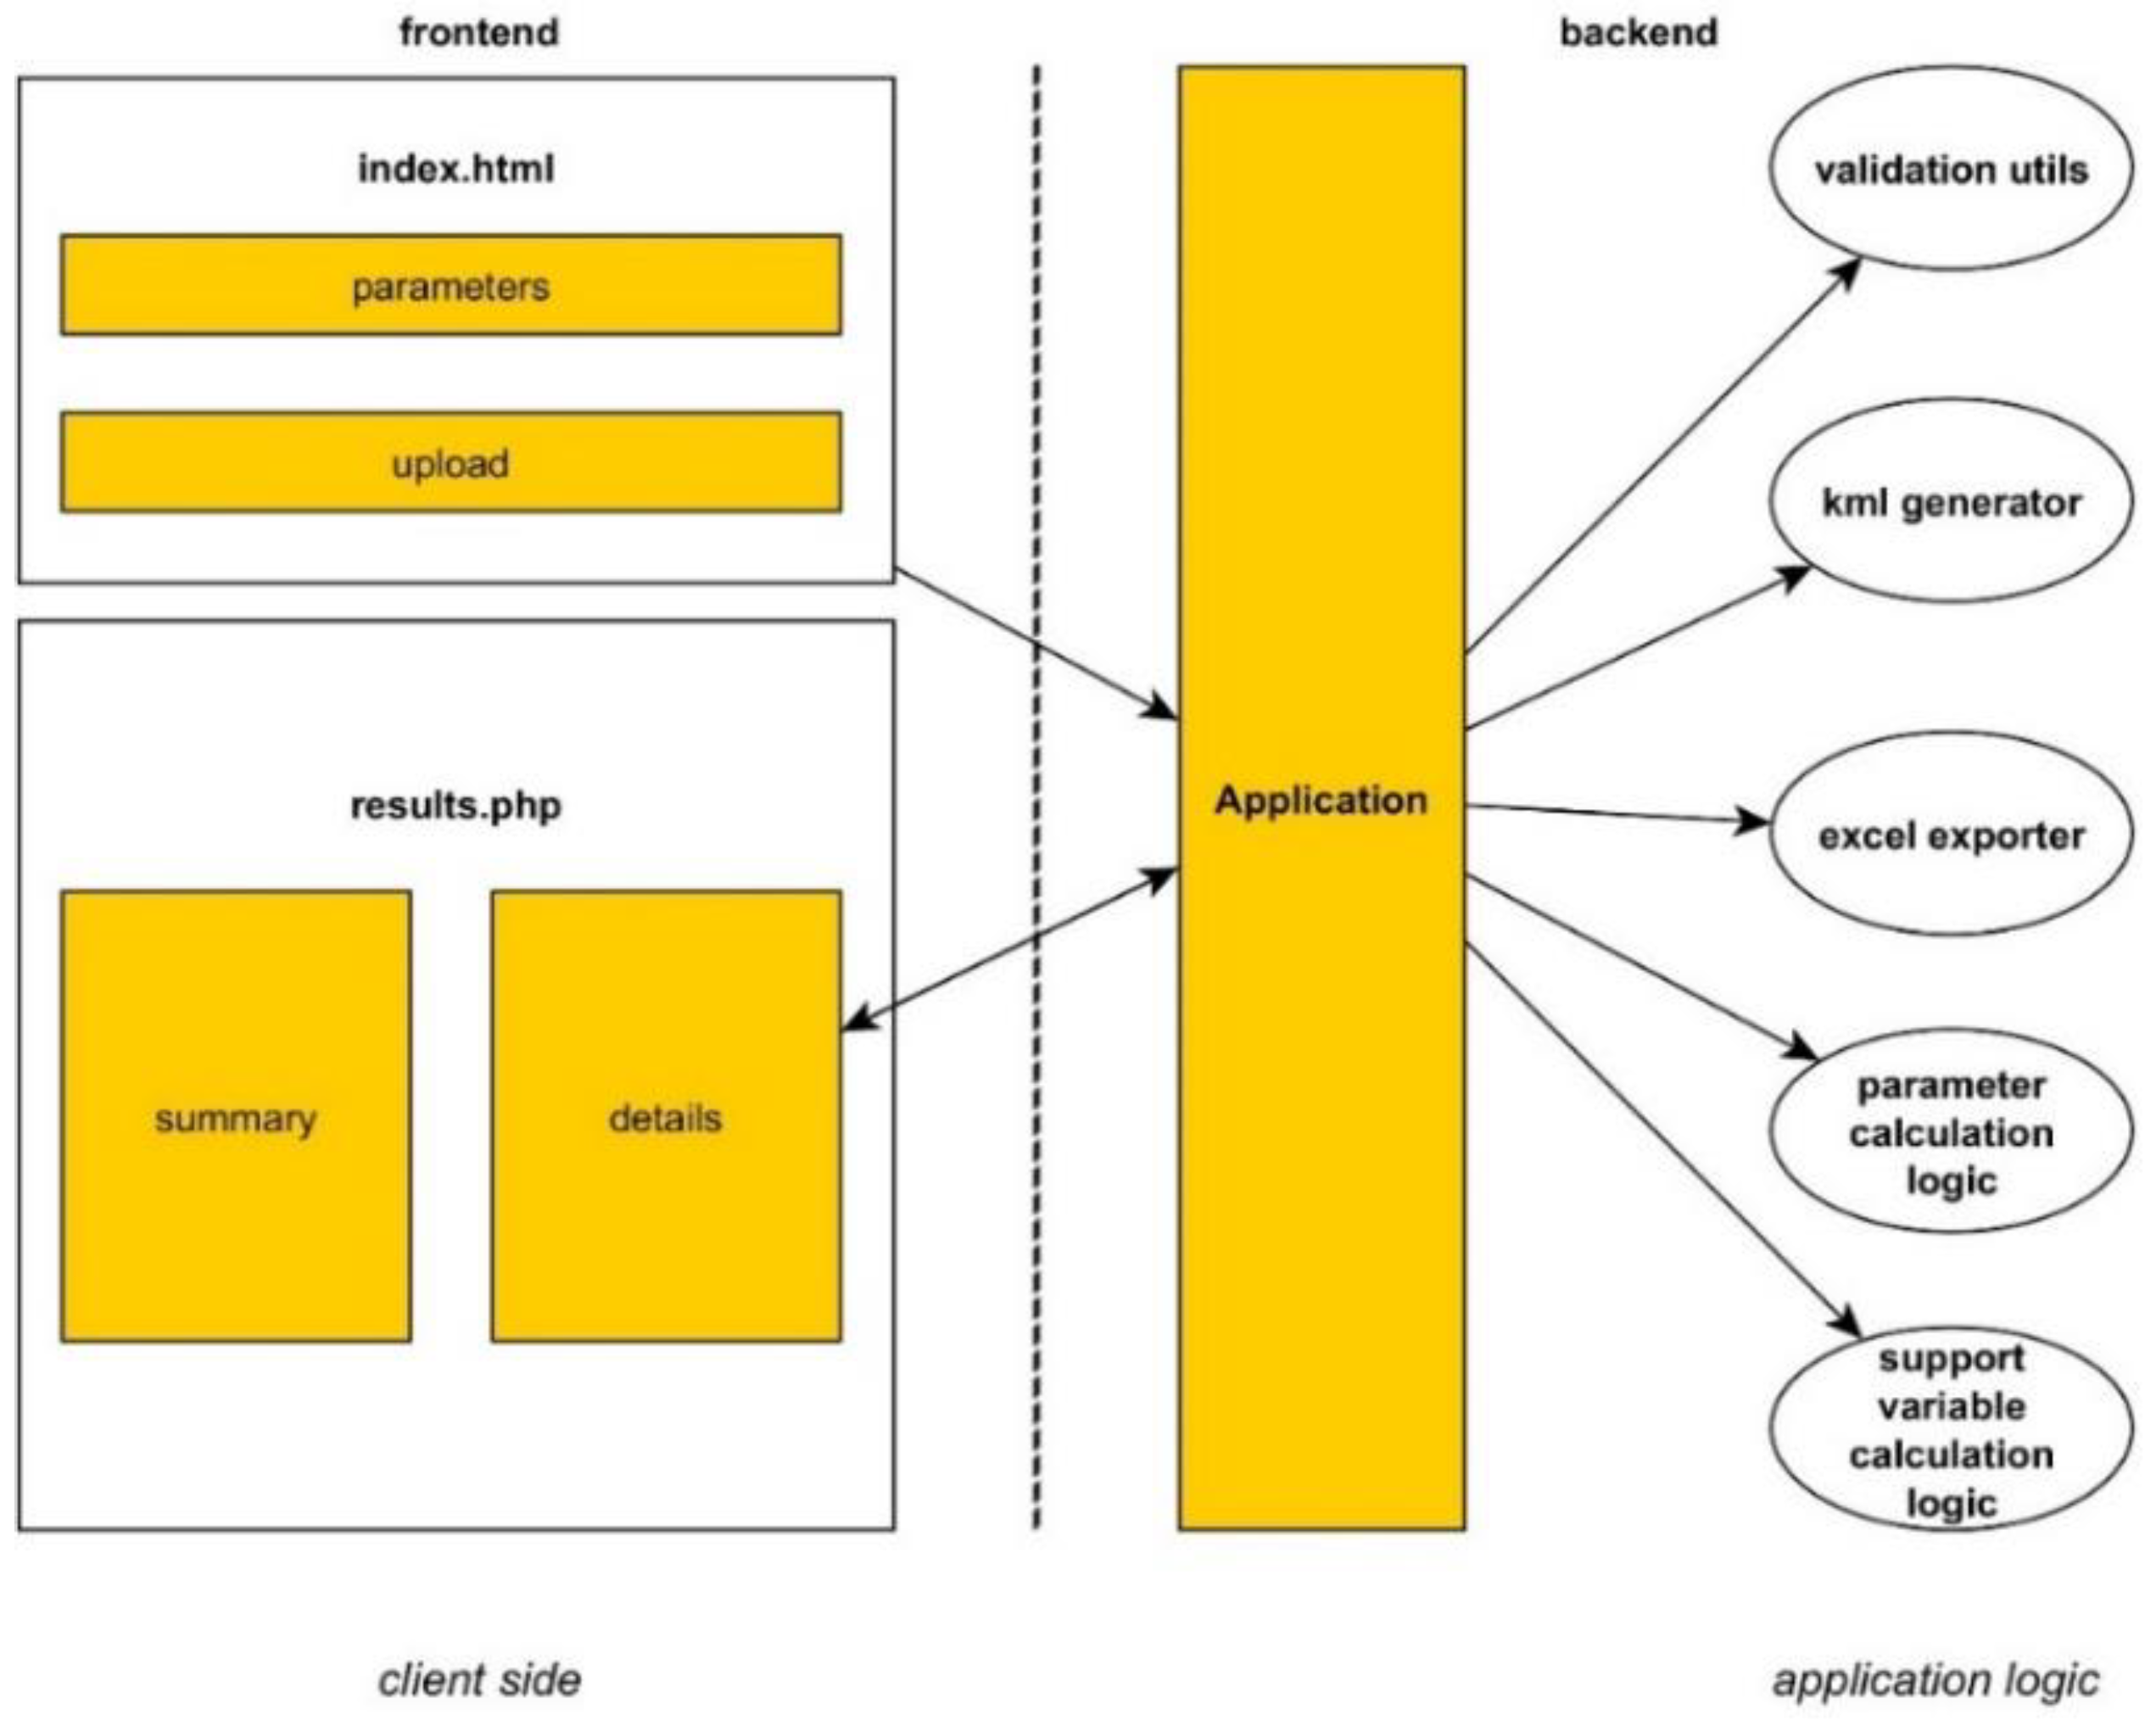
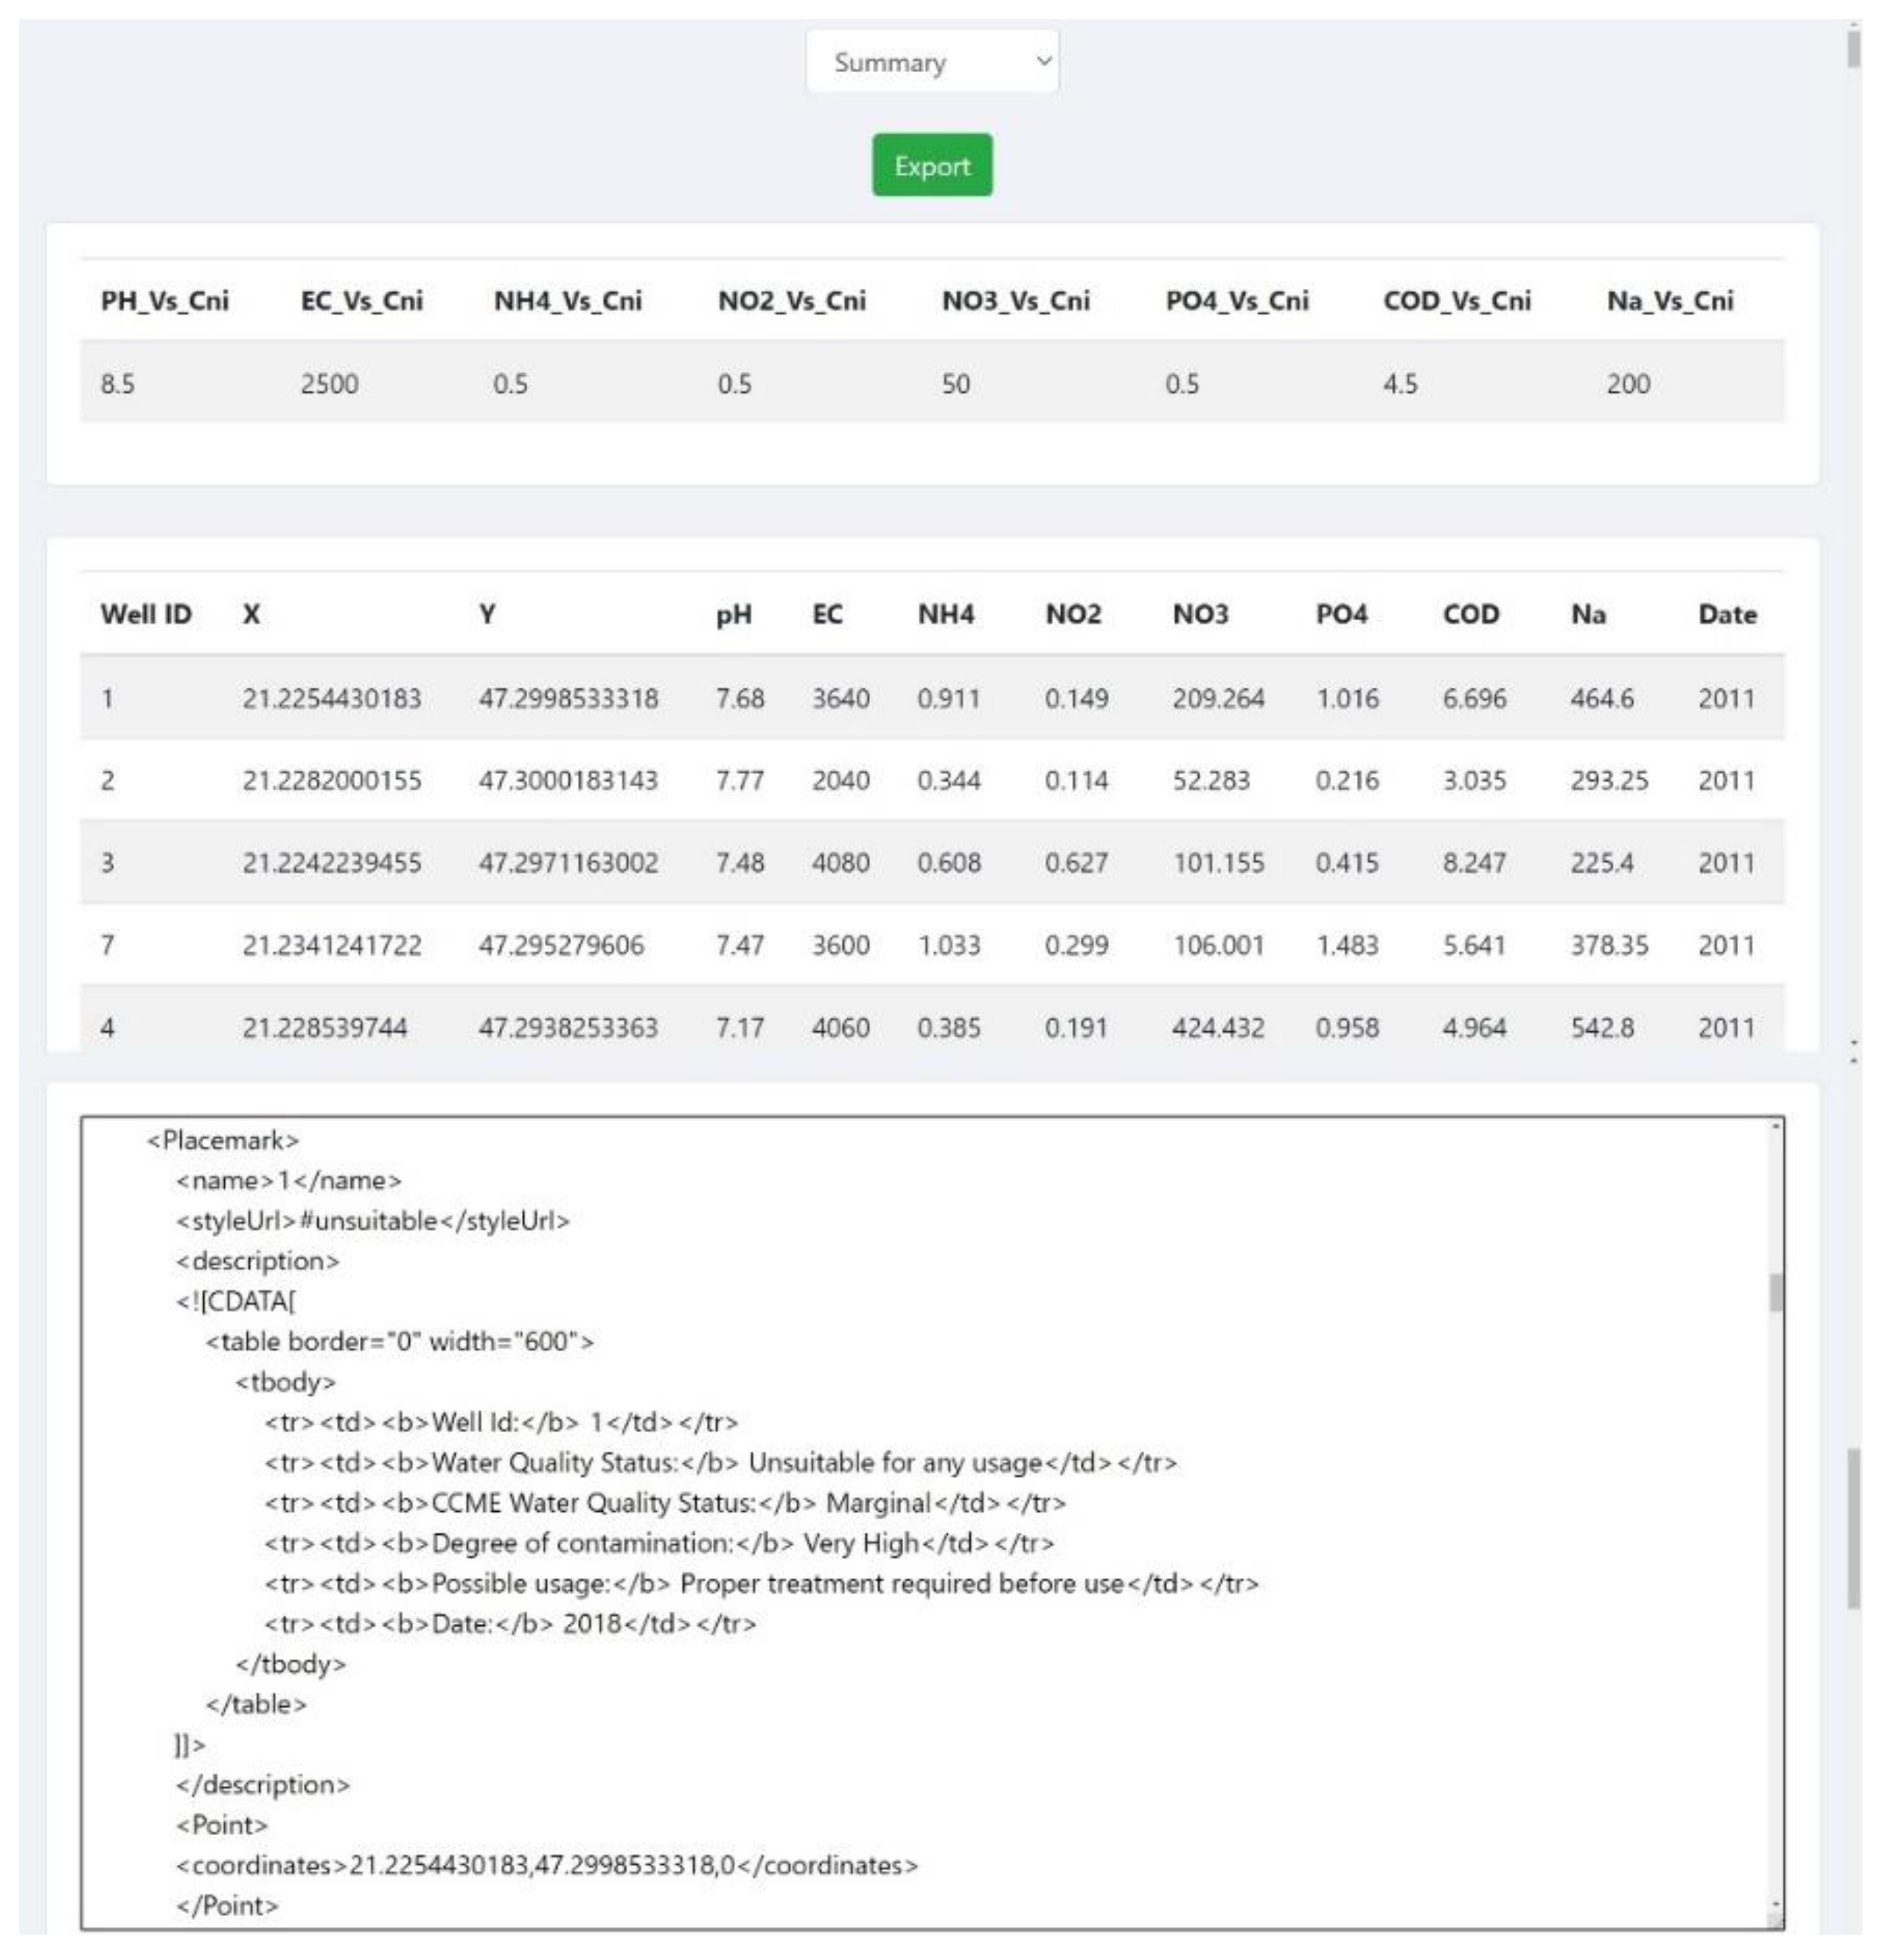
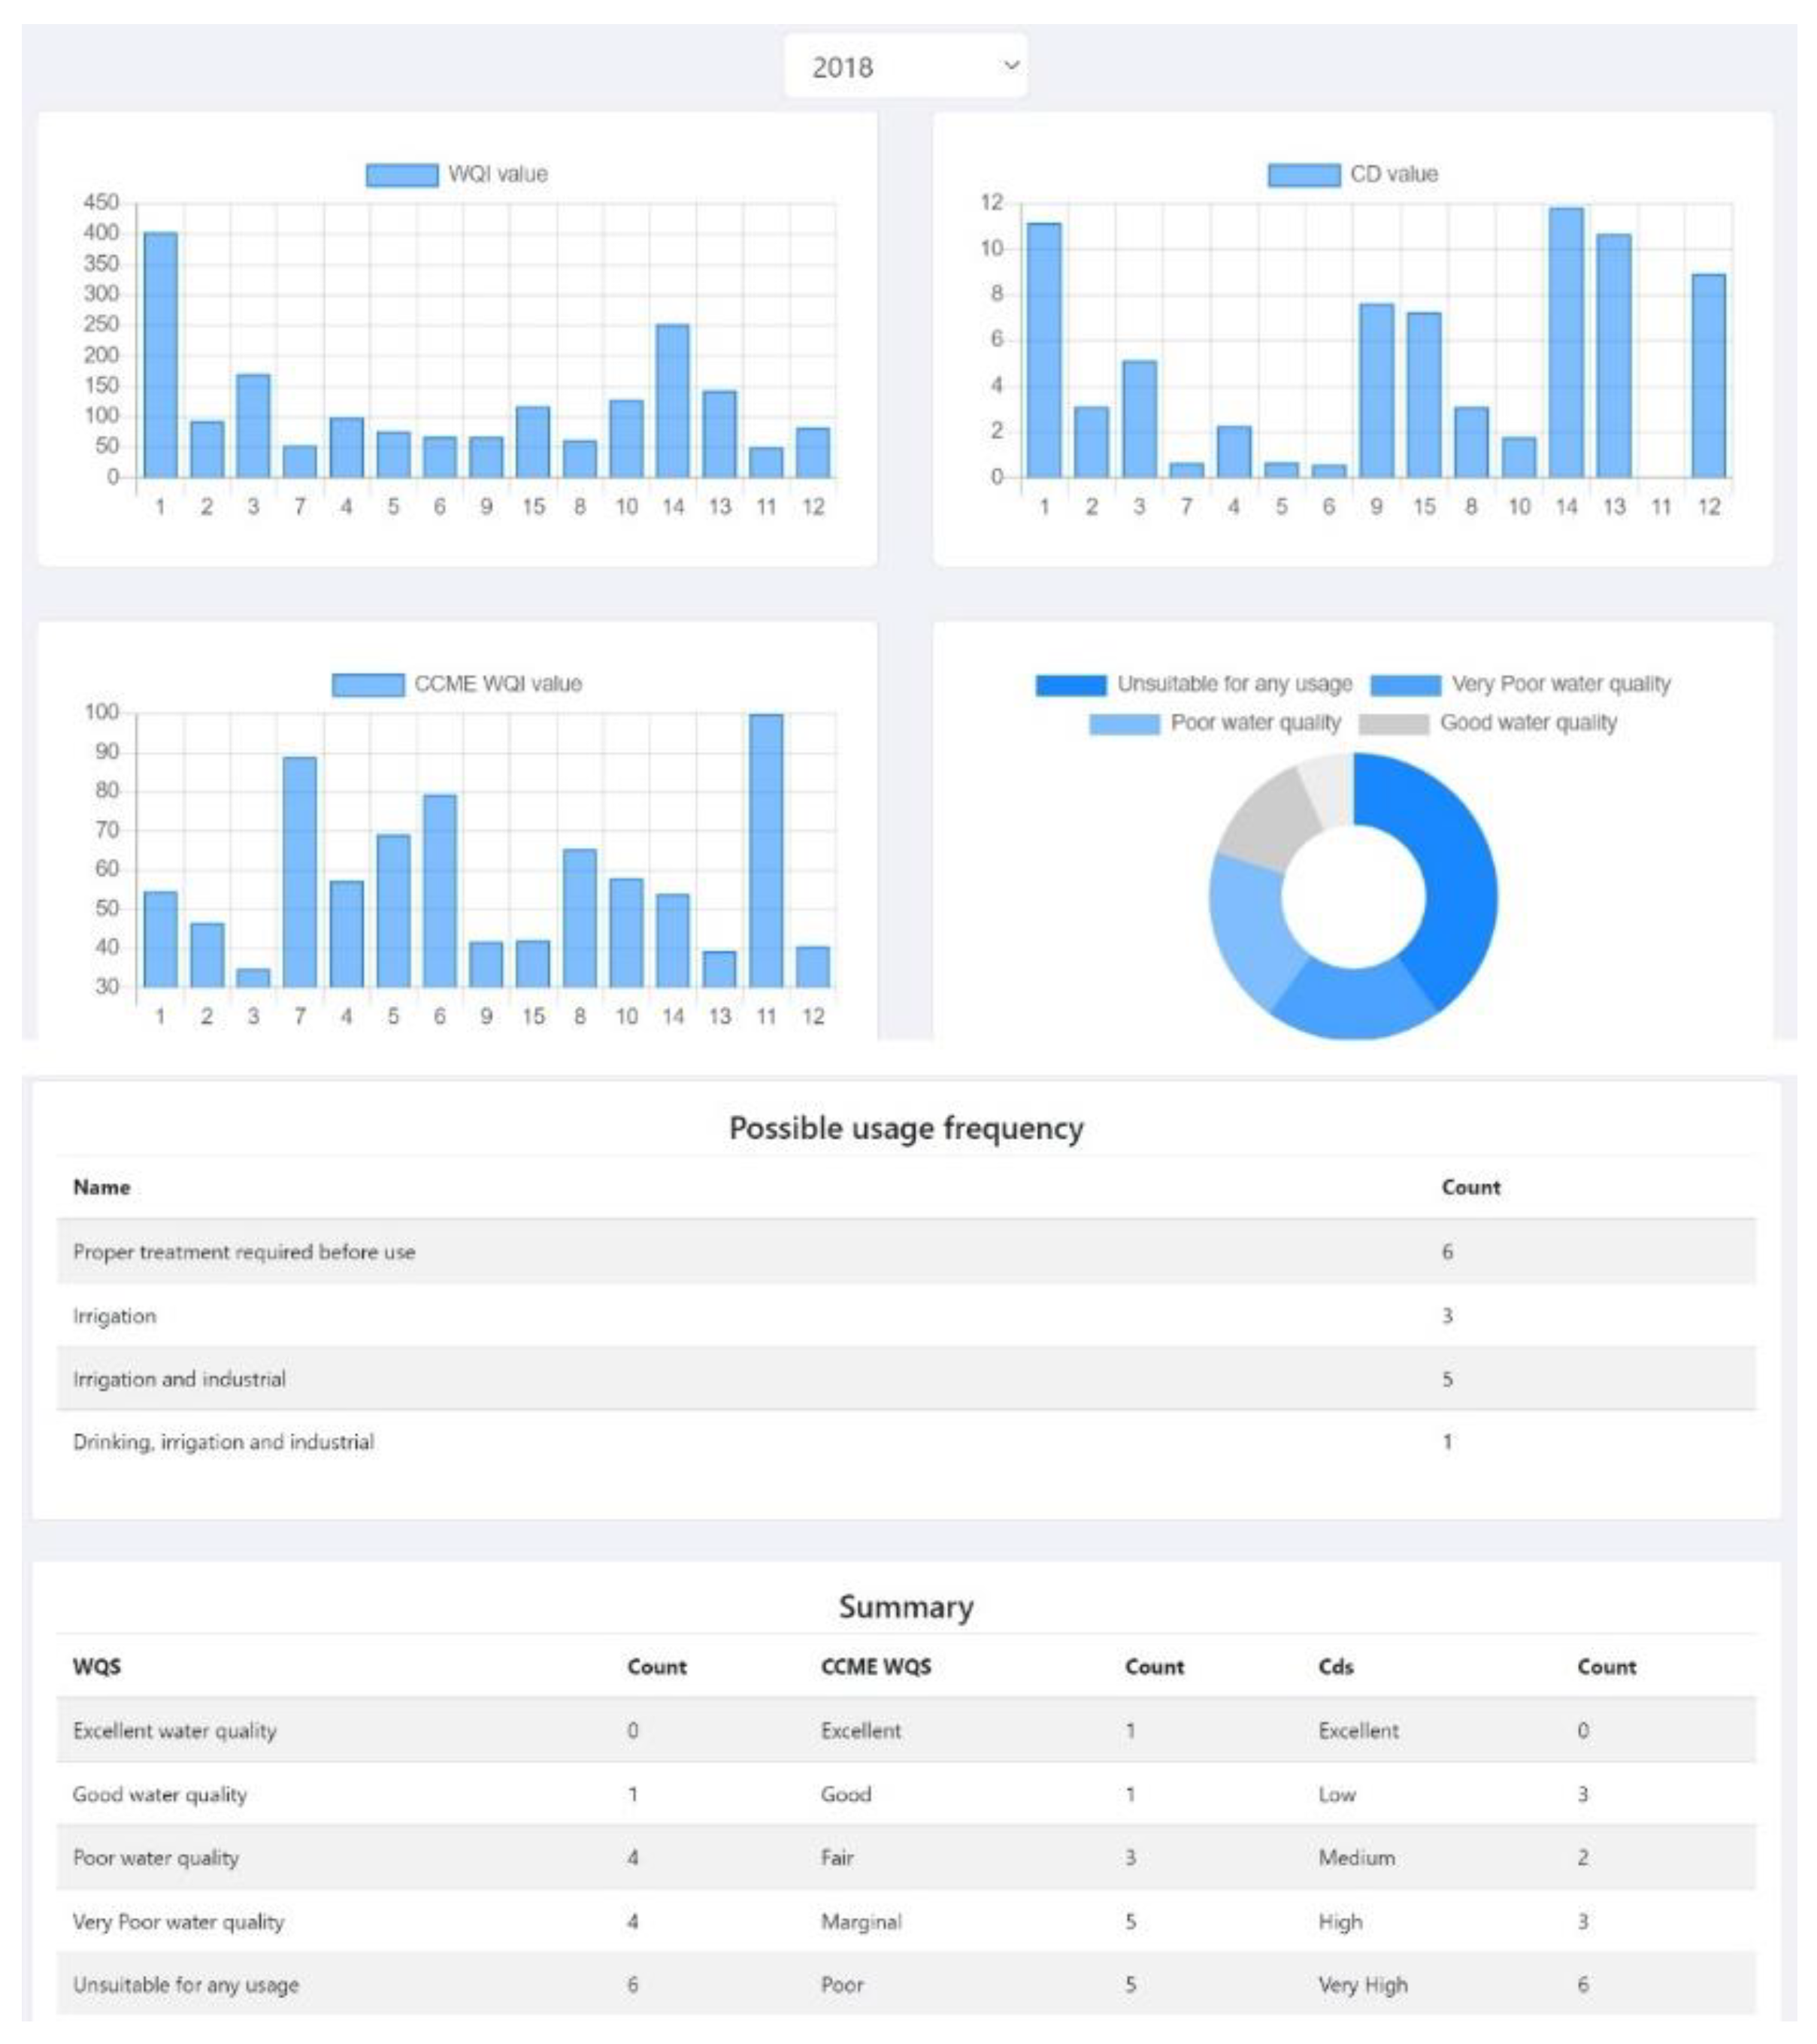
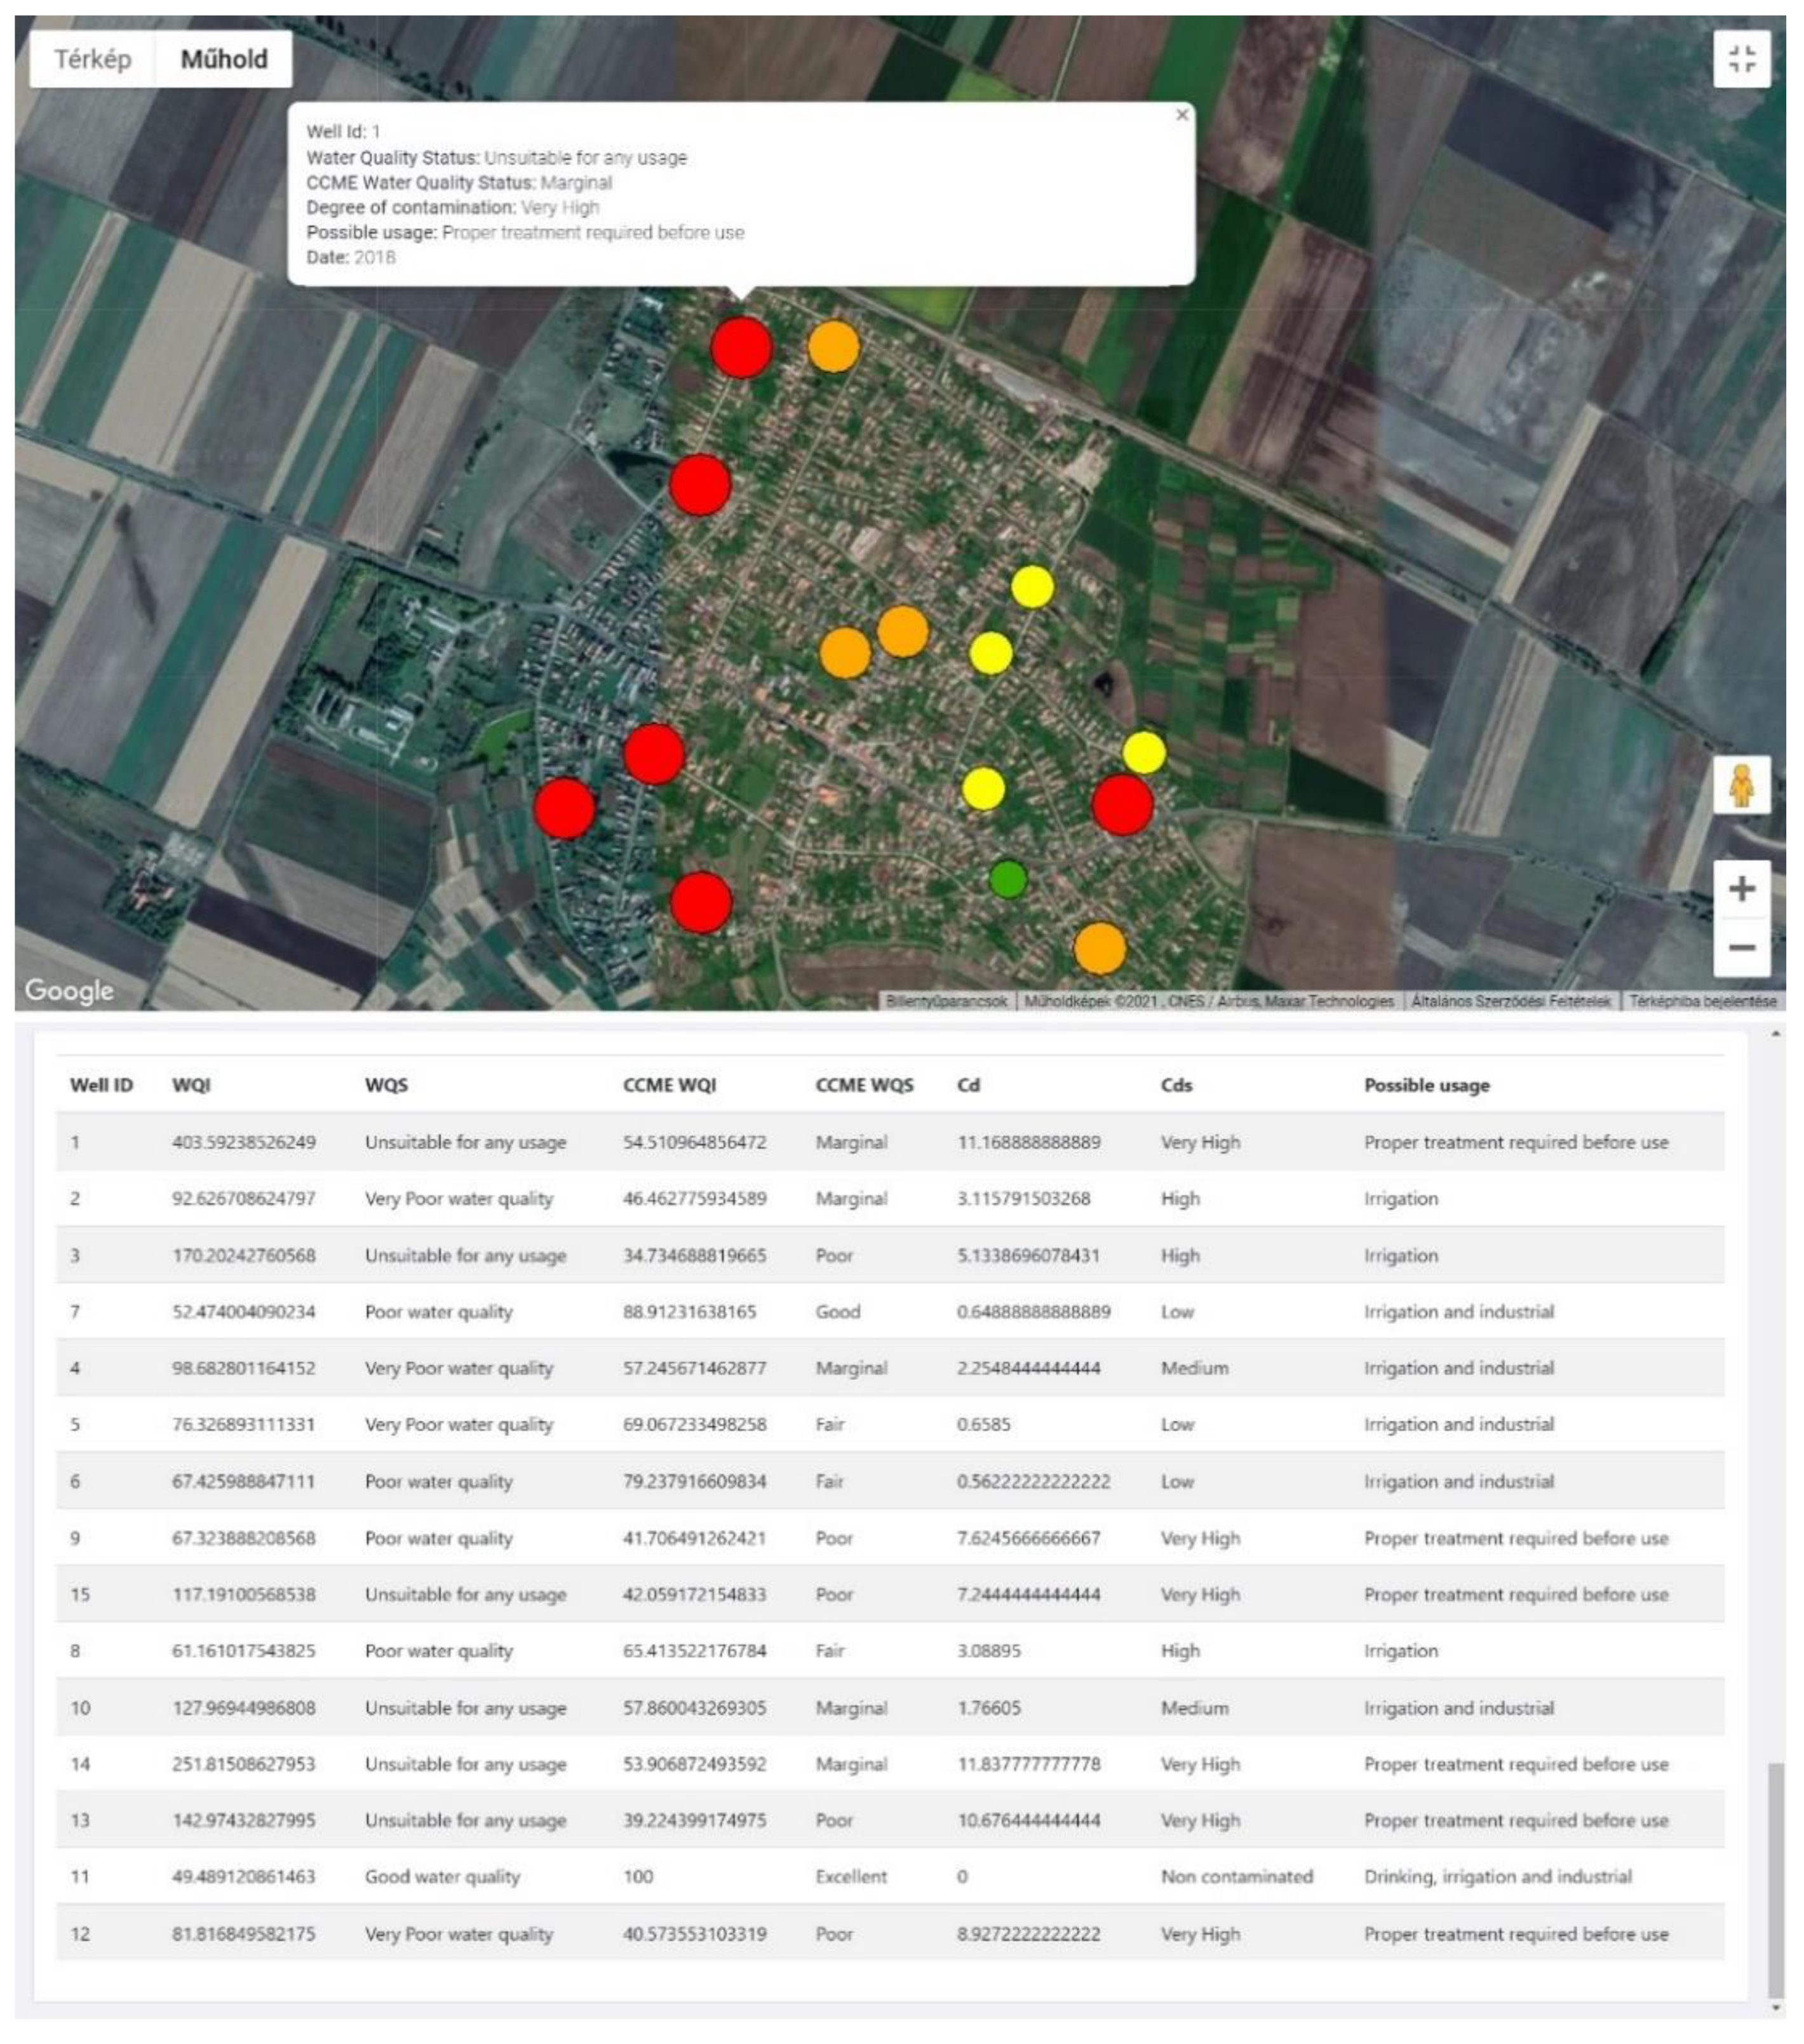
3.1. Description of Geovisualization Tool
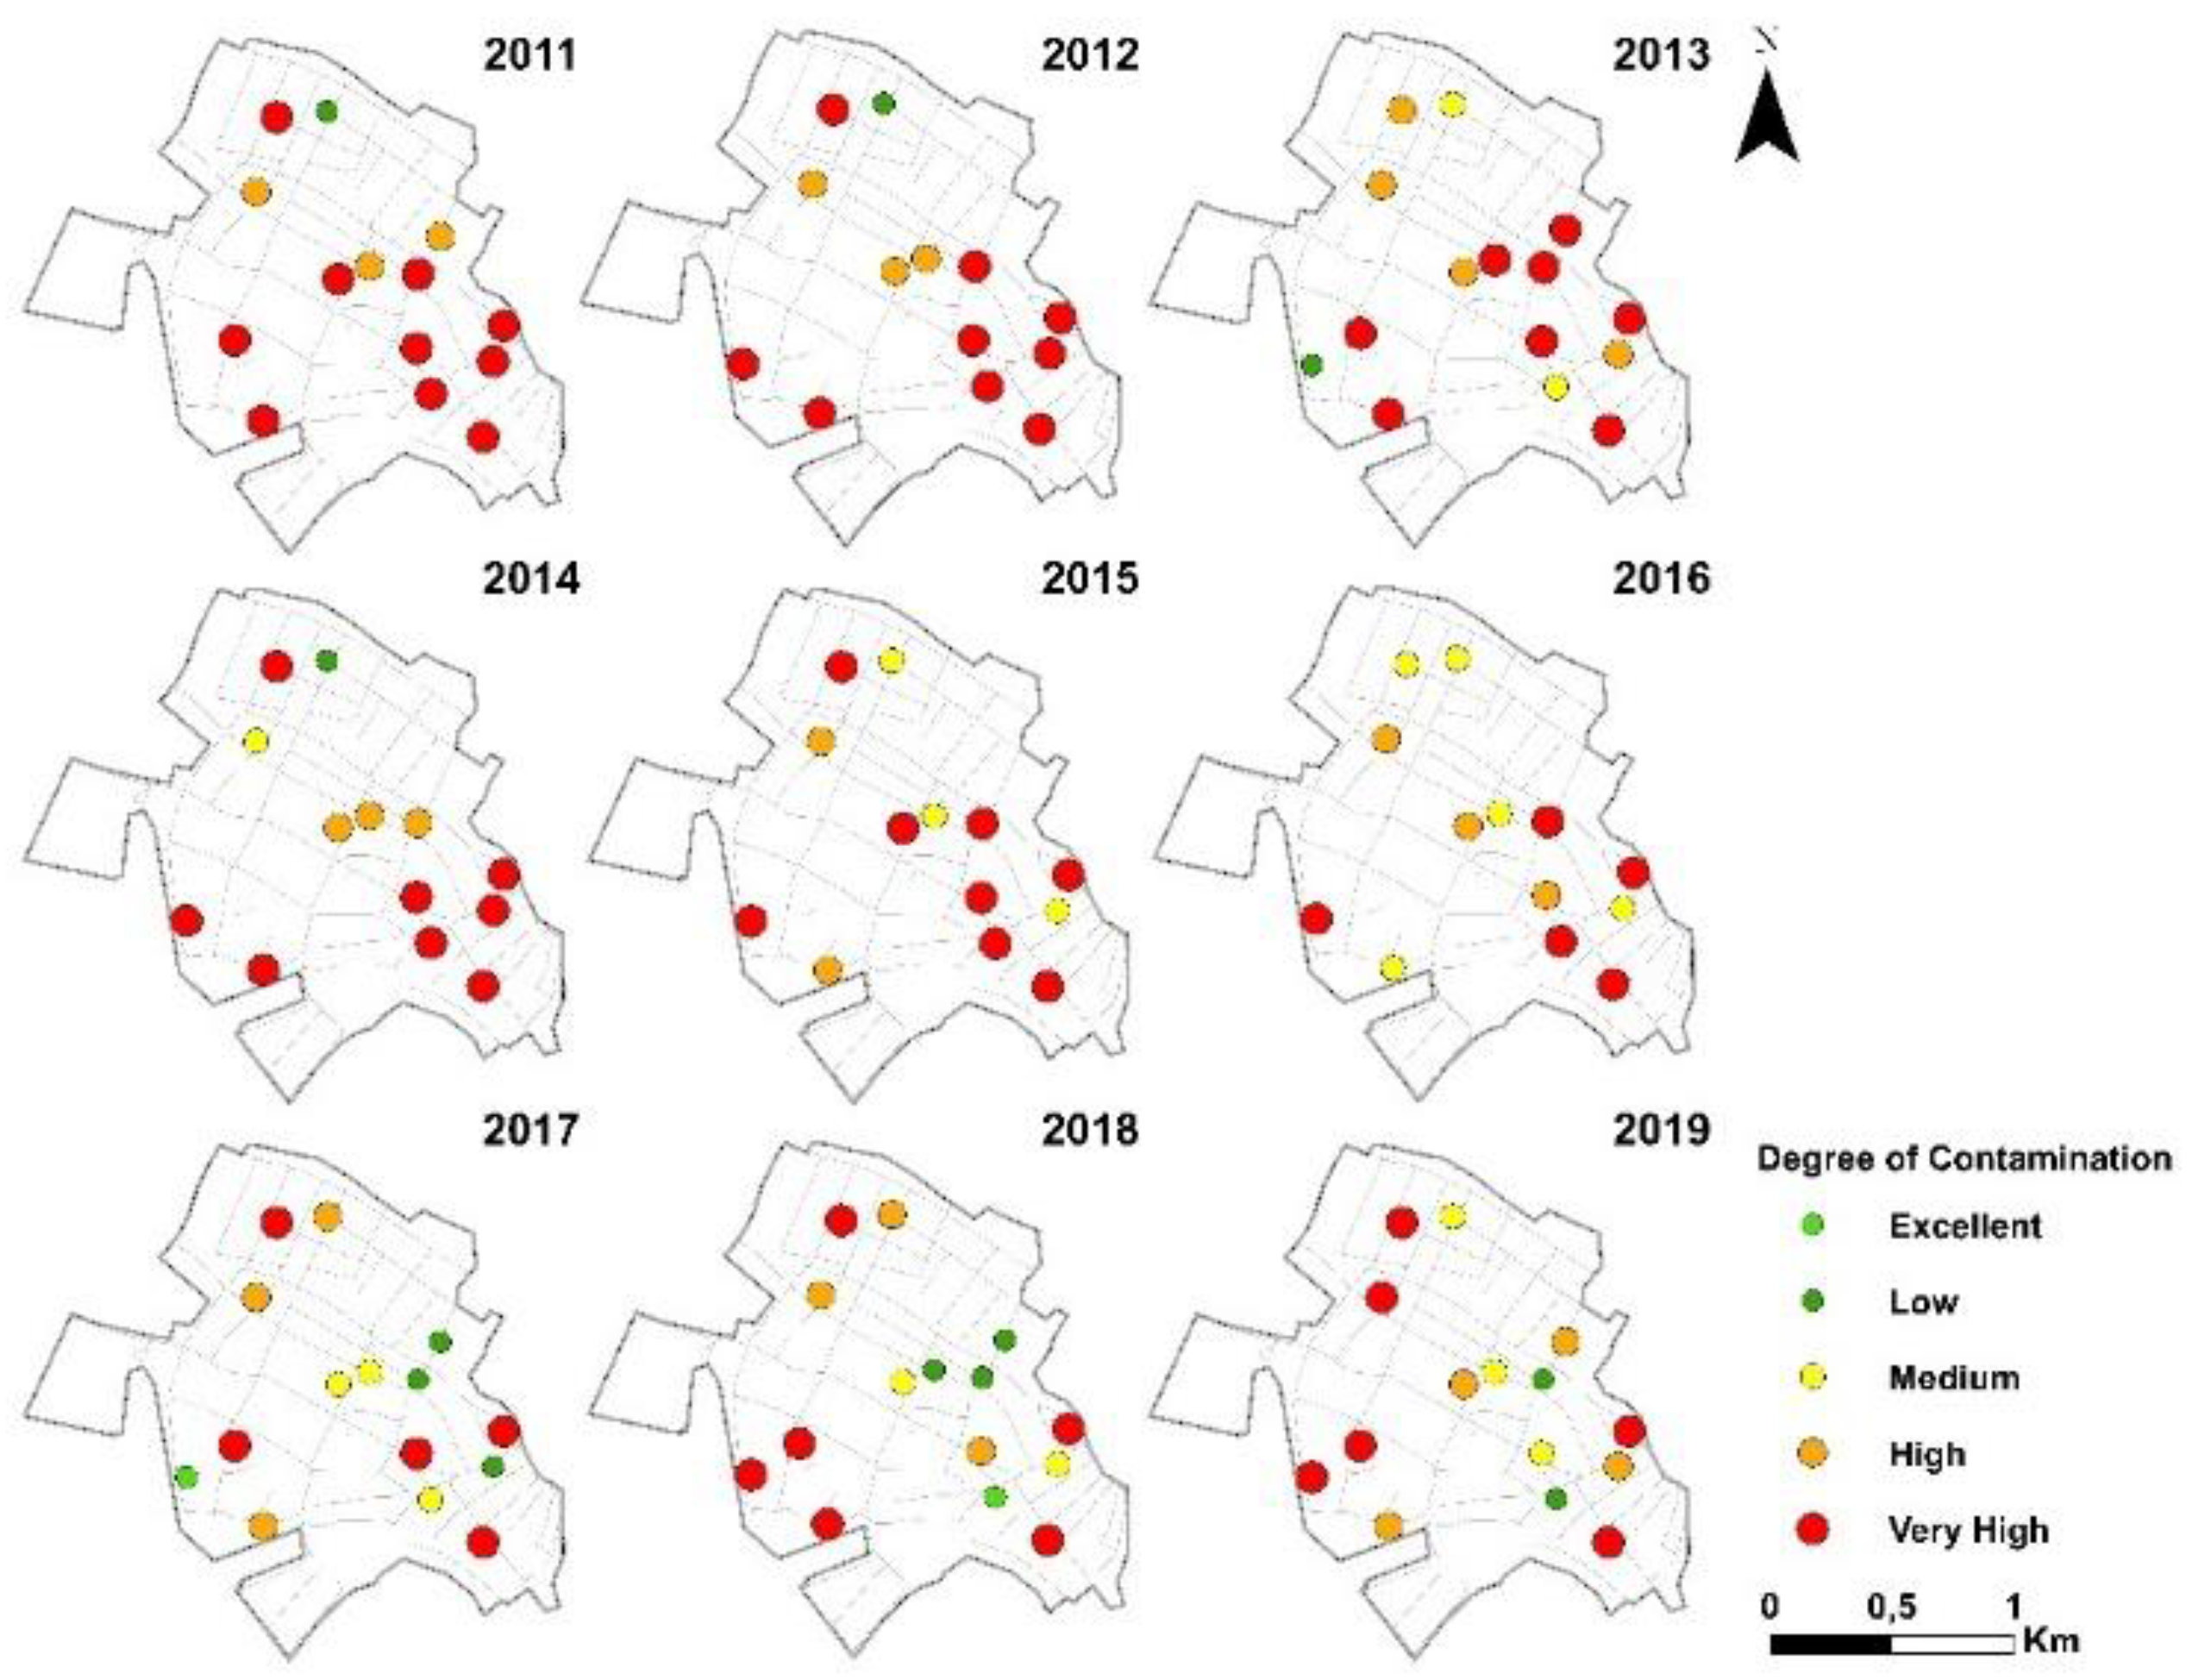
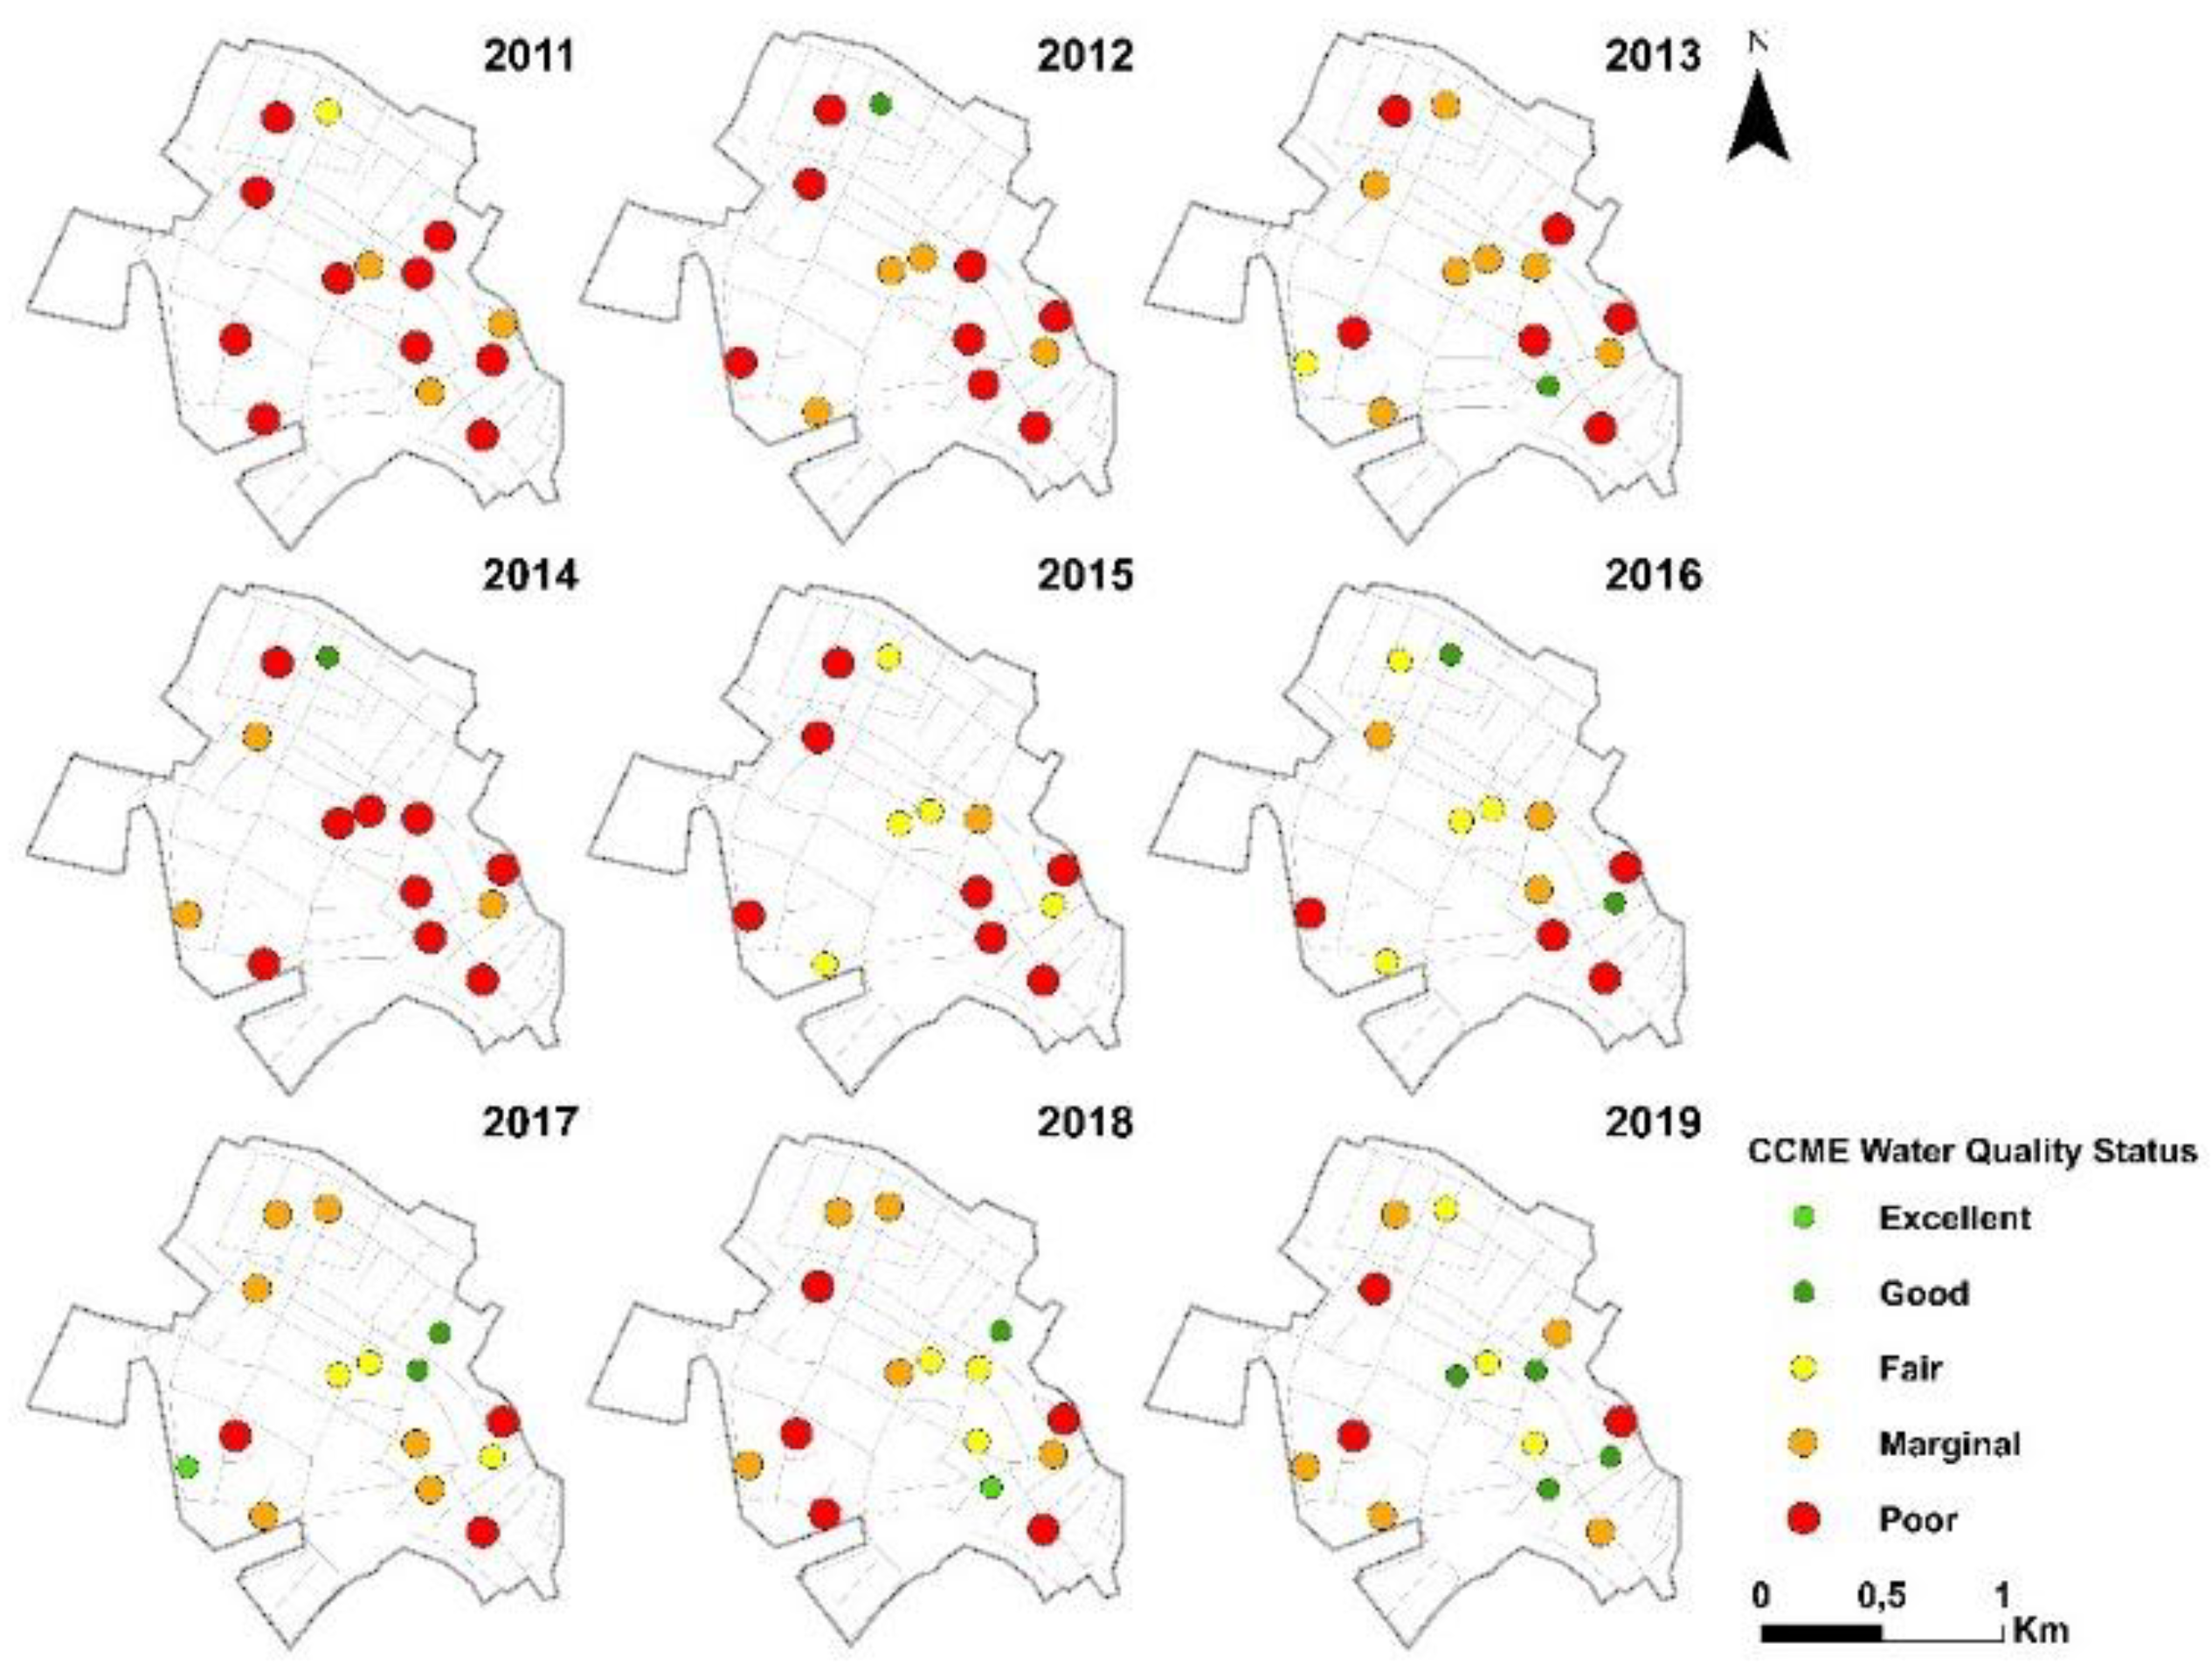
3.2. Spatial and Temporal Distribution of Groundwater Quality
3.3. Assesment of Spatial and Temporal Changes of Water Quality
4. Discussion
5. Conclusions
- The most important advantage of developed geovisualization tools is the visualized spatial environmental data, which makes valuable information understandable for both the public and decisionmakers.
- Revealing relationships between the investigated wells and the location became easier after geovisualization.
- Geovisualization facilitates the capturing of the spatial pattern of the distribution of different water quality indices at different times.
- The general cognitive perception of digital data is supported. The more parameters are used, a greater need can be identified for supporting the appropriate interpretation of the data.
Author Contributions
Funding
Data Availability Statement
Acknowledgments
Conflicts of Interest
References
- Azzellino, A.; Colombo, L.; Lombi, S.; Marchesi, V.; Piana, A.; Andrea, M.; Alberti, L. Groundwater diffuse pollution in functional urban areas: The need to define anthropogenic diffuse pollution background levels. Sci. Total Environ. 2019, 656, 1207–1222. [Google Scholar] [CrossRef] [PubMed]
- Jumma, A.J.; Mohd, E.T.; Noorazuan, M.H. Groundwater pollution and wastewater management in Derna City, Libya. Int. Environ. Res. J. 2012, 6, 50–54. [Google Scholar]
- Ravikumar, P.; Somashekar, R.K. Assessment and modelling of groundwater quality data and evaluation of their corrosiveness and scaling potential using environmetric methods in Bangalore South Taluk, Karnataka state, India. Water Resour. 2012, 39, 446–473. [Google Scholar] [CrossRef]
- Machiwal, D.; Jha, M.K. Identifying sources of groundwater contamination in a hard-rock aquifer system using multivariate statistical analyses and GIS-based geostatistical modeling techniques. J. Hydrol. Reg. Stud. 2015, 4, 80–110. [Google Scholar] [CrossRef] [Green Version]
- Smoroń, S. Quality of shallow groundwater and manure effluents in a livestock farm. J. Water Land Dev. 2016, 29, 59–66. [Google Scholar] [CrossRef]
- Adimalla, N.; Qian, H. Groundwater chemistry, distribution and potential health risk appraisal of nitrate enriched groundwater: A case study from the semi-urban region of South India. Ecotoxicol. Environ. Saf. 2020, 207, 111277. [Google Scholar] [CrossRef]
- Backman, B.; Bodiš, D.; Lahermo, P.; Rapant, S.; Tarvainen, T. Application of a groundwater contamination index in Finland and Slovakia. Environ. Earth Sci. 1998, 36, 55–64. [Google Scholar] [CrossRef]
- Rotaru, A.; Răileanu, P. Groundwater contamination from waste storage works. Environ. Eng. Manag. J. 2008, 7, 731–735. [Google Scholar] [CrossRef]
- Devic, G.; Djordjevic, D.; Sakan, S. Natural and anthropogenic factors affecting the groundwater quality in Serbia. Sci. Total Environ. 2014, 468–469, 933–942. [Google Scholar] [CrossRef]
- Nemčić-Jurec, J.; Singh, S.K.; Jazbec, A.; Gautam, S.K.; Kovač, I. Hydrochemical investigations of groundwater quality for drinking and irrigational purposes: Two case studies of Koprivnica-Križevci County (Croatia) and district Allahabad (India). Sustain. Water Resour. Manag. 2017, 5, 467–490. [Google Scholar] [CrossRef]
- Khorasani, H.; Kerachian, R.; Aghayi, M.M.; Zahraie, B.; Zhu, Z. Assessment of the impacts of sewerage network on groundwater quantity and nitrate contamination: Case study of Tehran. In World Environmental and Water Resources Congress 2020: Groundwater, Sustainability, Hydro-Climate/Climate Change, and Environmental Engineering, Henderson, NV, USA, 17–21 May, 2020; American Society of Civil Engineers: Reston, VA, USA, 2020; pp. 53–66. [Google Scholar] [CrossRef]
- Payne, S.M.; Woessner, W.W. An Aquifer Classification System and Geographical Information System-Based Analysis Tool for Watershed Managers in the Western U.S. J. Am. Water Resour. Assoc. (JAWRA) 2010, 46, 1003–1023. [Google Scholar] [CrossRef]
- Lowe, M.; Wallace, J.; Kneedy, J.L. Ground-Water Recharge-Area and Water Quality-Classification Mapping for Cedar Valley, Southwestern Utah–Tools for Land-Use Planning. In Proceedings of the GSA Rocky Mountain 54th Annual Meeting, Denver, CO, USA, 7–9 May 2002. [Google Scholar]
- Reisenhofer, E.; Adami, G.; Barbieri, P. Using chemical and physical parameters to define the quality of karstic freshwaters (Timavo River, North-eastern Italy): A chemometric approach. Water Res. 1998, 32, 1193–1203. [Google Scholar] [CrossRef]
- Horton, R.K. An index number system for rating water quality. J. Water Pollut. Control Fed. 1965, 37, 300–306. [Google Scholar]
- Ball, R.O.; Church, R.L. Water Quality Indexing and Scoring. J. Environ. Eng. Div. 1980, 106, 757–771. [Google Scholar] [CrossRef]
- Bouslah, S.; Djemili, L.; Houichi, L. Water quality index assessment of Koudiat Medouar Reservoir, northeast Algeria using weighted arithmetic index method. J. Water Land Dev. 2017, 35, 221–228. [Google Scholar] [CrossRef]
- Brown, R.M.; McClelland, N.I.; Deininger, R.A.; Tozer, R.G. A Water Quality Index: Do We Dare? Water Sew. Work. 1970, 117, 339–343. [Google Scholar]
- Lumb, A.; Halliwell, D.; Sharma, T. Application of CCME Water Quality Index to Monitor Water Quality: A Case Study of the Mackenzie River Basin, Canada. Environ. Monit. Assess. 2006, 113, 411–429. [Google Scholar] [CrossRef]
- Stigter, T.Y.; Ribeiro, L.; Dill, A.C. Application of a groundwater quality index as an assessment and communication tool in agro-environmental policies—Two Portuguese case studies. J. Hydrol. 2006, 327, 578–591. [Google Scholar] [CrossRef]
- Liou, S.-M.; Lo, S.-L.; Wang, S.-H. A Generalized Water Quality Index for Taiwan. Environ. Monit. Assess. 2004, 96, 35–52. [Google Scholar] [CrossRef]
- Bora, M.; Goswami, D.C. Water quality assessment in terms of water quality index (WQI): Case study of the Kolong River, Assam, India. Appl. Water Sci. 2017, 7, 3125–3135. [Google Scholar] [CrossRef] [Green Version]
- Roba, C.; Balc, R.; Creta, F.; Andreica, D.; Padurean, A.; Pogacean, P.; Chertes, T.; Moldovan, F.; Mocan, B.; Rosu, C. Assessment of groundwater quality in NW of Romania and its suitability for drinking and agricultural purposes. Environ. Eng. Manag. J. 2021, 20, 435–447. [Google Scholar] [CrossRef]
- Zessner, M. Monitoring, Modeling and Management of Water Quality. Water 2021, 13, 1523. [Google Scholar] [CrossRef]
- Aljanabi, Z.Z.; Al-Obaidy, A.-H.M.J.; Hassan, F.M. A brief review of water quality indices and their applications. IOP Conf. Ser. Earth Environ. Sci. 2021, 779, 102088. [Google Scholar] [CrossRef]
- Soltan, M.E. Evaluation Of Ground Water Quality In Dakhla Oasis (Egyptian Western Desert). Environ. Monit. Assess. 1999, 57, 157–168. [Google Scholar] [CrossRef]
- Štambuk-Giljanović, N. Water quality evaluation by index in Dalmatia. Water Res. 1999, 33, 3423–3440. [Google Scholar] [CrossRef]
- Pesce, S.F. Use of water quality indices to verify the impact of Córdoba City (Argentina) on Suquía River. Water Res. 2000, 34, 2915–2926. [Google Scholar] [CrossRef]
- Rapant, S.; Vrana, K.; Bodis, D. Geochemical Atlas of Slovak Republic: Groundwater; Geofond: Bratislava, Slovakia, 1995; Volume 1. [Google Scholar]
- Sha, J.; Li, X.; Zhang, M.; Wang, Z.-L. Comparison of Forecasting Models for Real-Time Monitoring of Water Quality Parameters Based on Hybrid Deep Learning Neural Networks. Water 2021, 13, 1547. [Google Scholar] [CrossRef]
- Hajji, S.; Yahyaoui, N.; Bousnina, S.; Ben Brahim, F.; Allouche, N.; Faiedh, H.; Bouri, S.; Hachicha, W.; Aljuaid, A.M. Using a Mamdani Fuzzy Inference System Model (MFISM) for Ranking Groundwater Quality in an Agri-Environmental Context: Case of the Hammamet-Nabeul Shallow Aquifer (Tunisia). Water 2021, 13, 2507. [Google Scholar] [CrossRef]
- Guasmi, I.; Hadji, F.; Yebdri, L. Quality assessment of reclaimed water for irrigation purpose and aquatic life protection in the Mekerra sub-watershed (NW Algeria). Model. Earth Syst. Environ. 2021, 1–14. [Google Scholar] [CrossRef]
- Schütze, E. Current State of Technology and Potential of Smart Map Browsing in Web Browsers. Master’s Thesis, Bremen University of Applied Sciences, Osnabrück, Germany, 2007. [Google Scholar]
- Muhammad, Y.R.; Rabiah, A.K.; Mohamad, T.I.; Azlina, A. A Review on Flood Modelling Tools for Transformation of Spatial and Non-Spatial Data to 3D Geo visualization. Int. J. Adv. Sci. Technol. 2019, 28, 197–206. [Google Scholar]
- MacEachren, A.M.; Gahegan, M.; Pike, W.; Brewer, I.; Cai, G.; Hardisty, F. Geovisualization for knowledge construction and decision support. IEEE Comput. Graph. Appl. 2004, 24, 13–17. [Google Scholar] [CrossRef] [PubMed] [Green Version]
- Dykes, J.; MacEachren, A.M.; Kraak, M.J. (Eds.) Exploring Geovisualization; Elsevier: Amsterdam, The Netherlands, 2005. [Google Scholar]
- Zichar, M. Geovisualization based upon KML. J. Agric. Inform. 2012, 3, 19–26. [Google Scholar] [CrossRef] [Green Version]
- Pődör, A.; Szabó, S. Geo-tagged environmental noise measurement with smartphones: Accuracy and perspectives of crowdsourced mapping. Environ. Plan. B Urban Anal. City Sci. 2021, 48, 2399808320987567. [Google Scholar] [CrossRef]
- Farkas, G. Applicability of open-source web mapping libraries for building massive Web GIS clients. J. Geogr. Syst. 2017, 19, 273–295. [Google Scholar] [CrossRef]
- Brown, M. Hacking Google Maps and Google Earth; Wiley Publishing Inc.: Indianapolis, IN, USA, 2006; pp. 1–401. [Google Scholar]
- Udell, S. Beginning Google Maps Mashups with Mapplets, KML, and GeoRSS: From Novice to Professional (Expert’s Voice in Web Development); Apress: Berkeley, CA, USA, 2009. [Google Scholar]
- Wernecke, J. The KML Handbook; Addison-Wesley: Boston, MA, USA, 2009. [Google Scholar]
- OGC07-147r2; OGC KML. OpenGeospatialConsortium, Inc.: Arlington, VA, USA, 2008; pp. 1–251.
- Haklay, M.; Singleton, A.; Parker, C. Web Mapping 2.0: The Neogeography of the GeoWeb. Geogr. Compass 2008, 2, 2011–2039. [Google Scholar] [CrossRef]
- Muhammad, Y.R.; Rabiah, A.K.; Mohamad, T.I.; Azlina, A. An Evaluation on Flood Modelling Tools for Transformation of Spatial and Non-Spatial Data to 3D Geo visualization. Test Eng. Manag. 2019, 81, 3351–3360. [Google Scholar]
- Molnar, A.; Lovas, I.; Domozi, Z. Practical Application Possibilities for 3D Models Using Low-resolution Thermal Images. Acta Polytech. Hung. 2021, 18, 199–212. [Google Scholar] [CrossRef]
- Jiang, B.; Li, Z. Geovisualization: Design, Enhanced Visual Tools and Applications. Cartogr. J. 2005, 42, 3–4. [Google Scholar] [CrossRef] [Green Version]
- McCormick, B.H.; DeFanti, T.A.; Brown, M.D. (Eds.) Visualization in Scientific Computing. Computer Graphics; ACM SIGGRAPH: New York, NY, USA, 1987; Volume 21, pp. 1–63. [Google Scholar]
- MacEachren, A.M.; Kraak, M.-J. Research Challenges in Geovisualization. Cartogr. Geogr. Inf. Sci. 2001, 28, 3–12. [Google Scholar] [CrossRef]
- Pődör, A.; Zentai, L. Educational aspects of crowdsourced noise mapping. In Advances in Cartography and GIScience, Proceedings of the International Cartographic Conference, Washington, DC, USA, 2–7 July 2017; Springer: Cham, Switzerland, 2017; pp. 35–46. [Google Scholar] [CrossRef]
- Evangelidis, K.; Ntouros, K.; Makridis, S.; Papatheodorou, C. Geospatial services in the Cloud. Comput. Geosci. 2014, 63, 116–122. [Google Scholar] [CrossRef] [Green Version]
- La Guardia, M.; D’Ippolito, F.; Cellura, M. Construction of a WebGIS Tool Based on a GIS Semiautomated Processing for the Localization of P2G Plants in Sicily (Italy). ISPRS Int. J. Geo-Inf. 2021, 10, 671. [Google Scholar] [CrossRef]
- Mariotto, F.P.; Antoniou, V.; Drymoni, K.; Bonali, F.; Nomikou, P.; Fallati, L.; Karatzaferis, O.; Vlasopoulos, O. Virtual Geosite Communication through a WebGIS Platform: A Case Study from Santorini Island (Greece). Appl. Sci. 2021, 11, 5466. [Google Scholar] [CrossRef]
- KML Tutorial. Available online: https://developers.google.com/kml/documentation/kml_tut (accessed on 21 October 2021).
- Google APIs Explorer. Available online: https://developers.google.com/apis-explorer (accessed on 21 October 2021).
- Chart.js. Available online: https://www.chartjs.org (accessed on 9 January 2022).
- Boostrap. Available online: https://getbootstrap.com/ (accessed on 9 January 2022).
- Bootstrap Custom File Input. Available online: https://github.com/Johann-S/bs-custom-file-input (accessed on 9 January 2022).
- SimpleXLSX PHP. Available online: https://github.com/shuchkin/simplexlsx (accessed on 9 January 2022).
- PHP XLSX Writer. Available online: https://github.com/mk-j/PHP_XLSXWriter (accessed on 9 January 2022).
- Balla, D.; Zichar, M.; Kiss, E.; Karancsi, G.; Mester, T. Analytic web tool for calculating and geovisualizing water quality based on different indices. In Proceedings of the 4th International Conference on Geo-IT and Water Resources, Al-Hoceima, Morocco, 11–12 March 2020; pp. 1–5. [Google Scholar] [CrossRef]
- Hungarian Central Statistical Office (HSCO). Available online: http://www.ksh.hu/docs/hun/xstadat/xstadat_eves/i_zrk006b.html (accessed on 21 October 2021).
- Mester, T.; Balla, D.; Karancsi, G.; Bessenyei, É.; Szabó, G. Effects of nitrogen loading from domestic wastewater on groundwater quality. Water SA 2019, 45, 349–358. [Google Scholar] [CrossRef] [Green Version]
- HS ISO 7150-1:1992; Hungarian Standard Water Quality—Determination of Ammonium—Part 1: Manual Spectrophotometric Method. Hungarian Standards Institution: Budapest, Hungary. 2009. Available online: http://www.mszt.hu (accessed on 20 August 2021).
- HS 1484-13; Hungarian Standard Water Quality—Part 12: Determination of Nitrate and Nitrite—Content by Spectrophotometric Method. Hungarian Standards Institution: Budapest, Hungary. 2009. Available online: http://www.mszt.hu (accessed on 20 August 2021).
- HS 448-18; Hungarian Standard Water Quality—Part 18: Drinking Water Analysis—Determination of Orthophosphate and Total Phosphorus Using Spectrophotometric Method. Hungarian Standards Institution: Budapest, Hungary. 2009. Available online: http://www.mszt.hu (accessed on 20 August 2021).
- Wilcoxon, F. Individual comparisons by ranking methods. In Breakthroughs in Statistics; Springer: New York, NY, USA, 1992; pp. 196–202. [Google Scholar]
- Fuhrmann, S.; Pike, W. User-centered design of collaborative geovisualization tools. In Exploring Geovisualization; Elsevier: Amsterdam, The Netherlands, 2015; pp. 591–609. [Google Scholar] [CrossRef]
- Hildebrandt, D. A Software Reference Architecture for Service-Oriented 3D Geovisualization Systems. ISPRS Int. J. Geo-Inf. 2014, 3, 1445–1490. [Google Scholar] [CrossRef] [Green Version]
- Wirkus, L. An Open Source WebGIS Application for Civic Education on Peace and Conflict. ISPRS Int. J. Geo-Inf. 2015, 4, 1013–1032. [Google Scholar] [CrossRef] [Green Version]

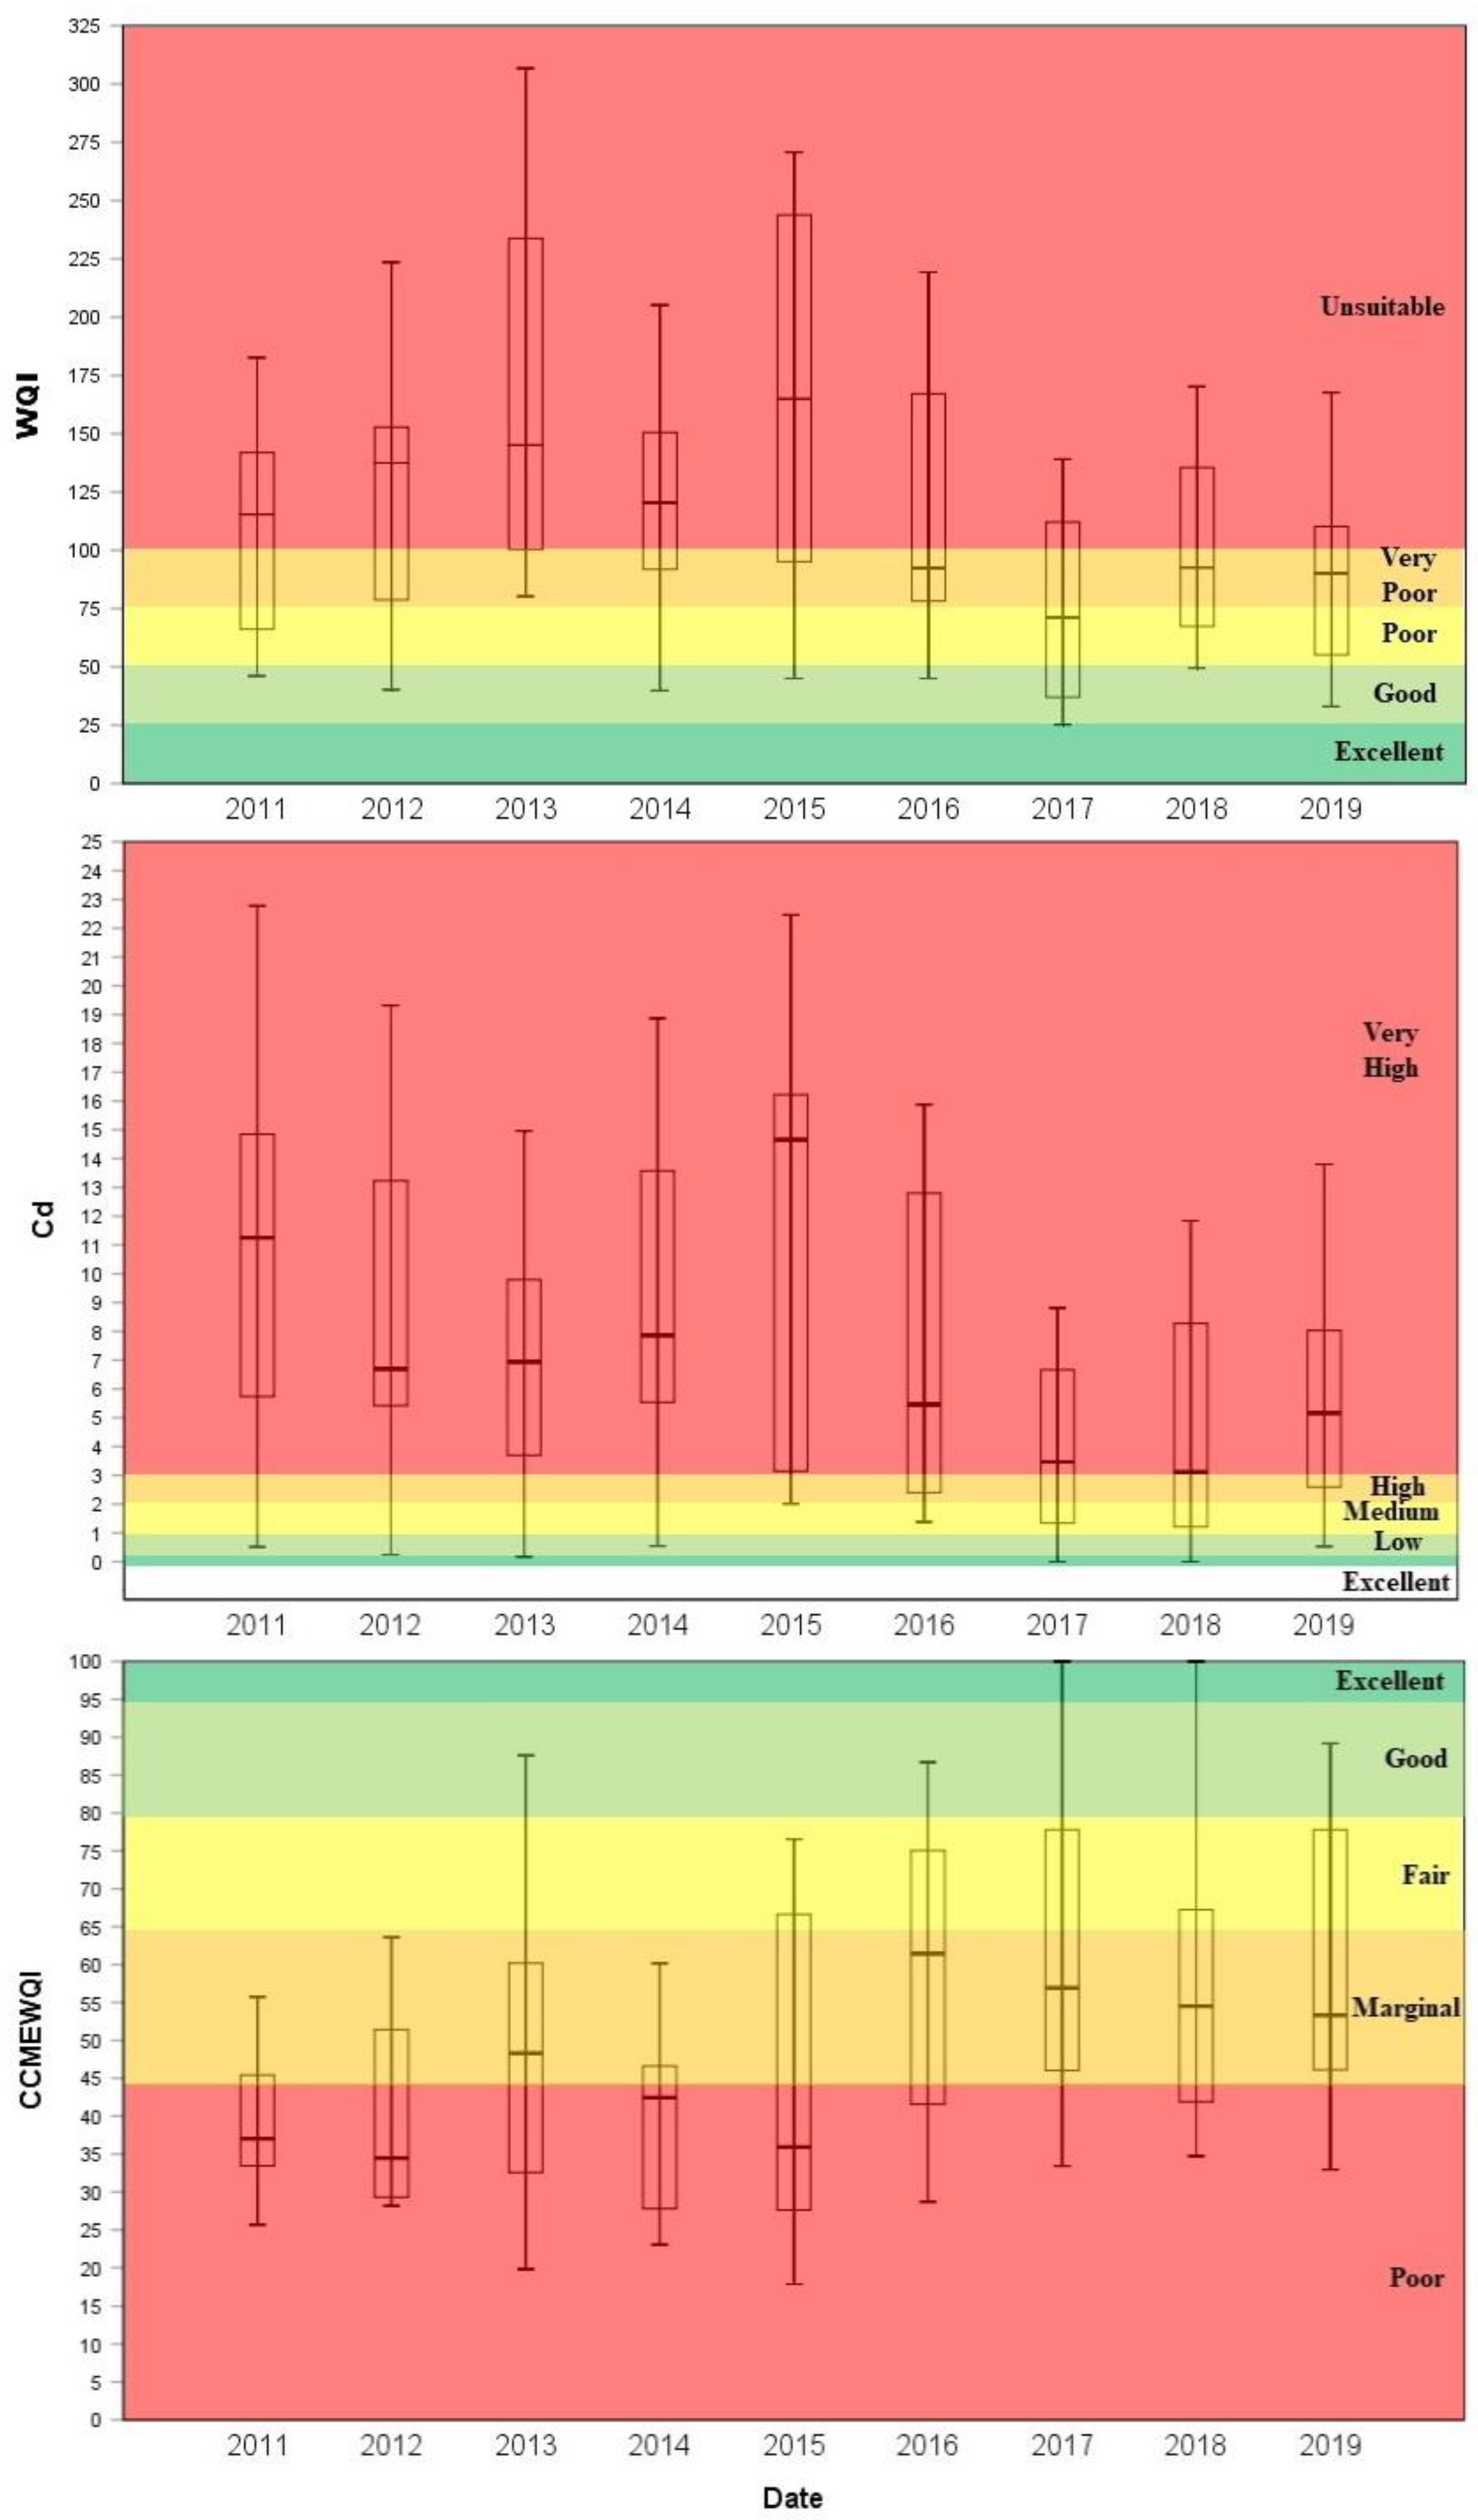
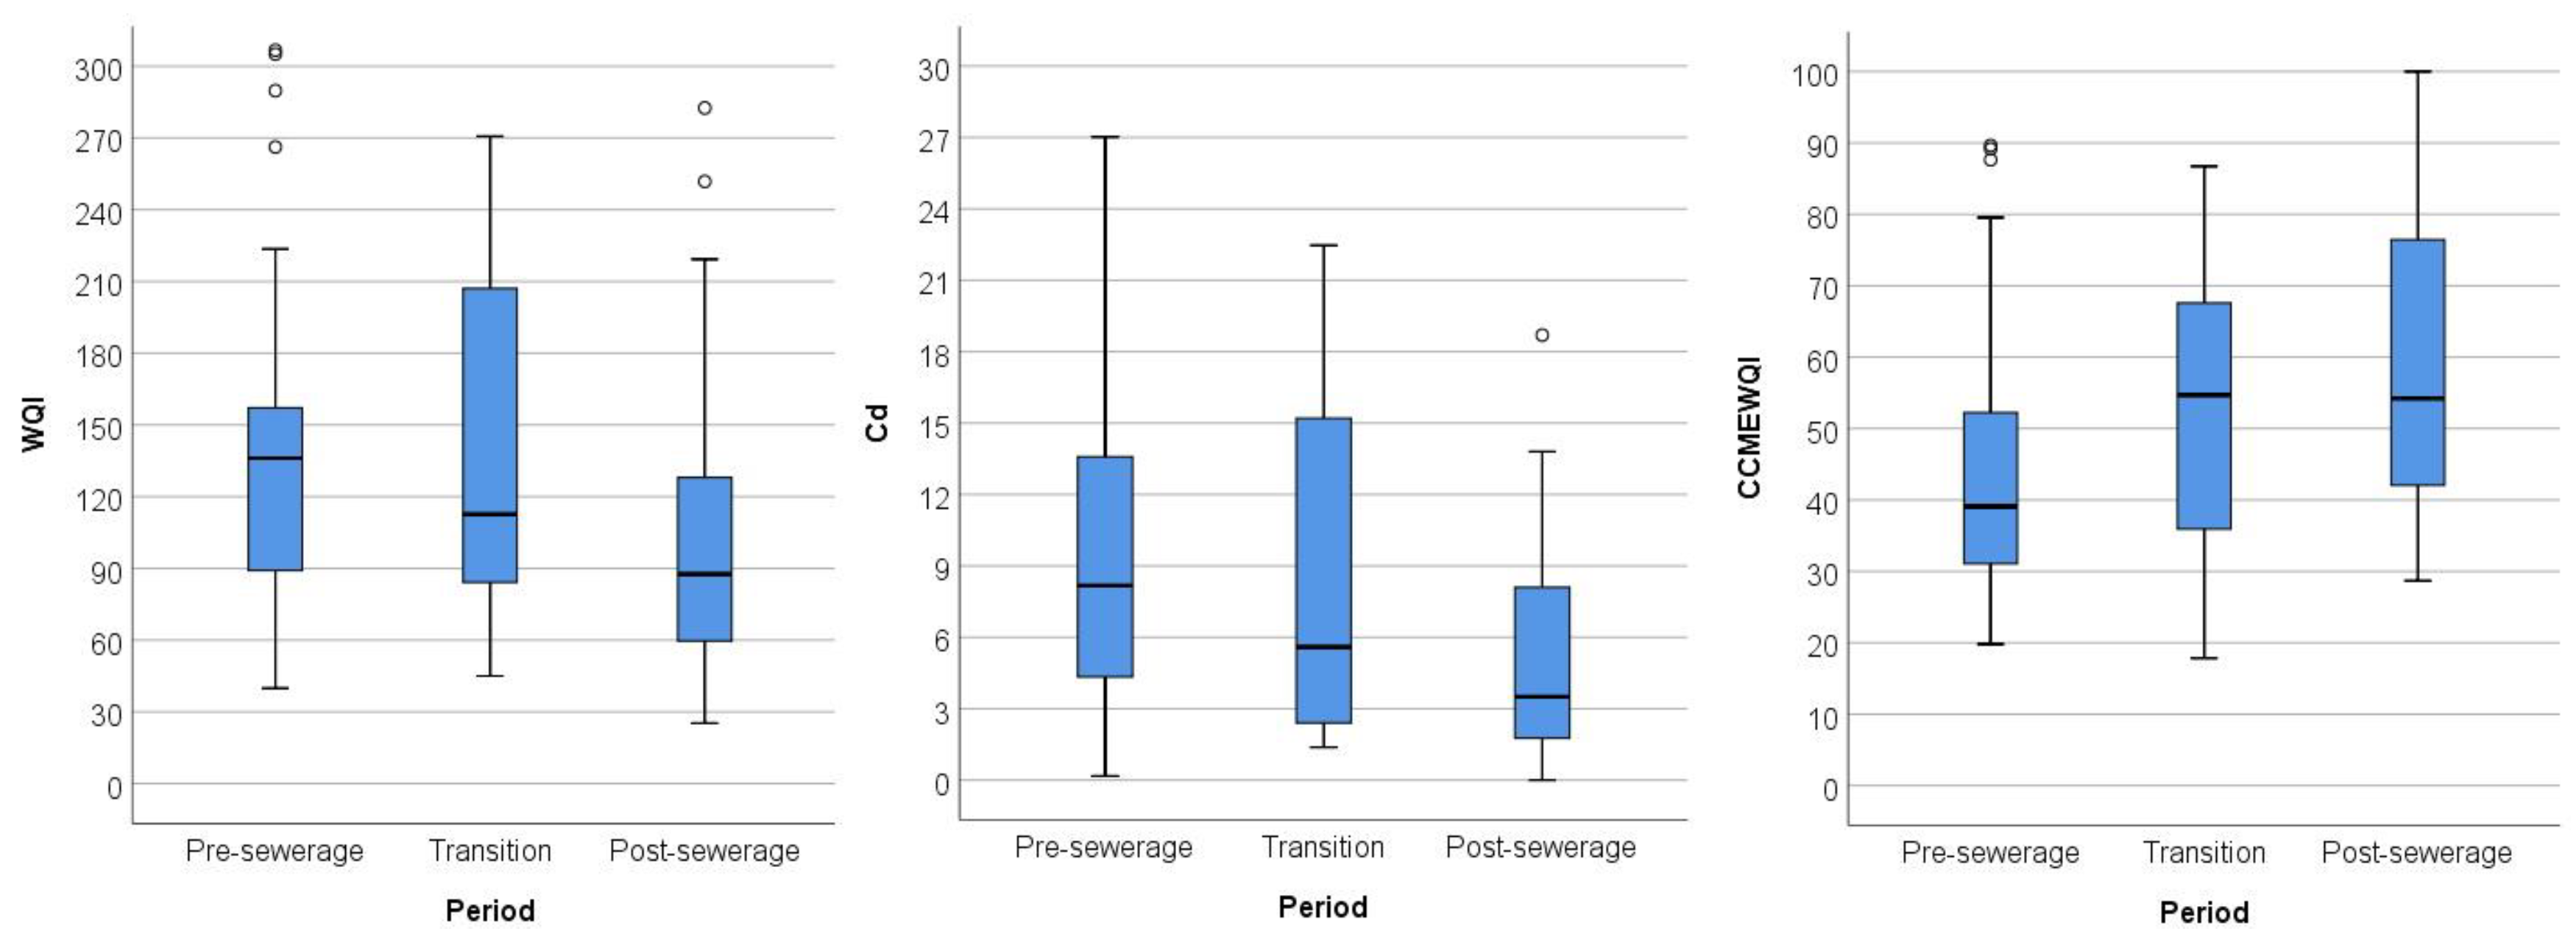
| Rank | WQI | Water Quality Status (WQS) | CCME WQI | CCME Water Quality Status (WQS) | Cd | Cd Status | Possible Use |
|---|---|---|---|---|---|---|---|
| R1 | 0–25 | Excellent water quality | 95–100 | Excellent | 0 | Excellent | Drinking, irrigation and industrial |
| R2 | 26–50 | Good water quality | 80–94 | Good | <1 | Low | Irrigation and industrial |
| R3 | 51–75 | Poor water quality | 65–79 | Fair | 3–1 | Medium | Irrigation and industrial |
| R4 | 76–100 | Very poor water quality | 45-64 | Marginal | 6–3 | High | Irrigation |
| R5 | Above 100 | Unsuitable for any use | 0–44 | Poor | >6 | Very High | Proper treatment required before use |
| WQI | Cd | CCMEWQI | ||||||||||||||
|---|---|---|---|---|---|---|---|---|---|---|---|---|---|---|---|---|
| Date | N | Min. | Max. | Mean | Q 25 | Q 75 | Min. | Max. | Mean | Q 25 | Q 75 | Min. | Max. | Mean | Q 25 | Q 75 |
| 2011 | 14 | 46.1 | 182.7 | 113 | 64.9 | 143 | 0.5 | 22.8 | 11.3 | 5.3 | 15.9 | 25.7 | 79.3 | 41 | 33.3 | 47.3 |
| 2012 | 13 | 40.2 | 223.6 | 129.5 | 76.5 | 157.2 | 0.2 | 19.3 | 9.1 | 4.8 | 13.9 | 28.2 | 89.7 | 43 | 29.1 | 53 |
| 2013 | 15 | 80.2 | 306.7 | 172.8 | 96.2 | 266.2 | 0.2 | 15 | 7 | 3.6 | 9.9 | 19.8 | 87.6 | 48.1 | 28.5 | 63.5 |
| 2014 | 13 | 39.8 | 205.2 | 118.6 | 87.8 | 150.9 | 0.5 | 27 | 10 | 5.1 | 14.6 | 23 | 89.2 | 42.9 | 26.2 | 50.2 |
| 2015 | 13 | 45.1 | 560.4 | 209.9 | 93.3 | 257.3 | 2.0 | 22.5 | 10.8 | 2.8 | 16.4 | 17.8 | 76.5 | 44.9 | 27.6 | 66.9 |
| 2016 | 13 | 45 | 449.3 | 136.2 | 69.8 | 169.8 | 1.4 | 15.9 | 6.9 | 2.2 | 13.2 | 28.7 | 86.7 | 58.8 | 39.5 | 75.3 |
| 2017 | 15 | 25.2 | 282.5 | 90.3 | 37 | 116.6 | 0 | 18.7 | 4.6 | 0.6 | 6.7 | 33.4 | 100 | 62 | 46 | 79.1 |
| 2018 | 15 | 49.5 | 403.6 | 124.1 | 67.3 | 143 | 0 | 11.8 | 5 | 0.7 | 8.9 | 34.7 | 100 | 58.1 | 41.7 | 69.1 |
| 2019 | 15 | 33.1 | 367.9 | 105.8 | 50.7 | 112.1 | 0.5 | 13.8 | 5.7 | 2.5 | 8.9 | 32.9 | 89.2 | 60.6 | 45.2 | 80.2 |
| WQS | Cds | CCMEWQS | ||||||||||||||
|---|---|---|---|---|---|---|---|---|---|---|---|---|---|---|---|---|
| Date | N | R1 | R2 | R3 | R4 | R5 | R1 | R2 | R3 | R4 | R5 | R1 | R2 | R3 | R4 | R5 |
| 2011 | 14 | 0 | 1 | 3 | 0 | 10 | 0 | 1 | 0 | 3 | 10 | 0 | 0 | 1 | 3 | 10 |
| 2012 | 13 | 0 | 1 | 2 | 1 | 9 | 0 | 1 | 0 | 3 | 9 | 0 | 1 | 0 | 4 | 8 |
| 2013 | 15 | 0 | 0 | 0 | 4 | 11 | 0 | 1 | 2 | 4 | 8 | 0 | 1 | 1 | 7 | 6 |
| 2014 | 13 | 0 | 2 | 0 | 4 | 7 | 0 | 1 | 1 | 3 | 8 | 0 | 1 | 0 | 3 | 9 |
| 2015 | 13 | 0 | 1 | 1 | 2 | 9 | 0 | 0 | 3 | 2 | 8 | 0 | 0 | 5 | 1 | 7 |
| 2016 | 13 | 0 | 1 | 2 | 4 | 6 | 0 | 0 | 5 | 3 | 5 | 0 | 2 | 4 | 3 | 4 |
| 2017 | 15 | 1 | 3 | 4 | 2 | 5 | 1 | 3 | 3 | 3 | 5 | 1 | 2 | 3 | 6 | 3 |
| 2018 | 15 | 0 | 1 | 4 | 4 | 6 | 1 | 3 | 2 | 3 | 6 | 1 | 1 | 3 | 5 | 5 |
| 2019 | 15 | 0 | 4 | 2 | 3 | 6 | 0 | 2 | 3 | 4 | 6 | 0 | 4 | 3 | 5 | 3 |
| CCME_after-CCME_before | WQI_after-WQI_before | Cd_after-Cd_before | |
|---|---|---|---|
| Z | –3.279b | –2.726c | –2.636c |
| Asymp. Sig. (2-tailed) | 0.001 | 0.006 | 0.008 |
Publisher’s Note: MDPI stays neutral with regard to jurisdictional claims in published maps and institutional affiliations. |
© 2022 by the authors. Licensee MDPI, Basel, Switzerland. This article is an open access article distributed under the terms and conditions of the Creative Commons Attribution (CC BY) license (https://creativecommons.org/licenses/by/4.0/).
Share and Cite
Balla, D.; Zichar, M.; Kiss, E.; Szabó, G.; Mester, T. Possibilities for Assessment and Geovisualization of Spatial and Temporal Water Quality Data Using a WebGIS Application. ISPRS Int. J. Geo-Inf. 2022, 11, 108. https://doi.org/10.3390/ijgi11020108
Balla D, Zichar M, Kiss E, Szabó G, Mester T. Possibilities for Assessment and Geovisualization of Spatial and Temporal Water Quality Data Using a WebGIS Application. ISPRS International Journal of Geo-Information. 2022; 11(2):108. https://doi.org/10.3390/ijgi11020108
Chicago/Turabian StyleBalla, Dániel, Marianna Zichar, Emőke Kiss, György Szabó, and Tamás Mester. 2022. "Possibilities for Assessment and Geovisualization of Spatial and Temporal Water Quality Data Using a WebGIS Application" ISPRS International Journal of Geo-Information 11, no. 2: 108. https://doi.org/10.3390/ijgi11020108
APA StyleBalla, D., Zichar, M., Kiss, E., Szabó, G., & Mester, T. (2022). Possibilities for Assessment and Geovisualization of Spatial and Temporal Water Quality Data Using a WebGIS Application. ISPRS International Journal of Geo-Information, 11(2), 108. https://doi.org/10.3390/ijgi11020108


