Article

Repertoire and Efficiency of Students’ Strategies for General-Reference Maps

Centre for Geographical and Environmental Education, Department of Social Geography and Regional Development, Faculty of Science, Charles University, 12800 Prague, Czech Republic
*
Author to whom correspondence should be addressed.
ISPRS Int. J. Geo-Inf. 2022, 11(2), 138; https://doi.org/10.3390/ijgi11020138
Submission received: 30 December 2021 / Revised: 10 February 2022 / Accepted: 11 February 2022 / Published: 15 February 2022
(This article belongs to the Special Issue Eye-Tracking in Cartography)

Abstract

:
Maps are not just powerful tools to communicate spatial information; they also have significant educational potential to develop students’ knowledge, skills, and thinking. To fully exploit this potential, deep research is needed into map-use processes considering the variability of map types and the cognitive complexity of map operations. Whereas research on map reading is relatively common, the research into cognitively more demanding operations is lacking. Therefore, this study employed an eye-tracking experiment combined with a follow-up questionnaire with 20 upper-secondary students to examine the strategies students choose when analyzing general-reference maps. Specifically, attention is paid to the strategy repertoire, distribution, efficiency, and adaptiveness of strategy choice. Subsequently, the study is focused on students’ perception of strategies. According to the results, participants used a rich repertoire of strategies (although many of them unconsciously) and adapted the strategy choice to task demands. The solution efficiency varied among task demands, as did the efficiency of individual strategies and their combinations. The research design allowed a comparison with earlier studies on strategies for thematic map use. The results should be of interest to cartographers (to design effective educational tools) and educators (to educate map users complexly and effectively).

1. Introduction

One of the traditional definitions of cartography states that it aims to collect and analyze data and measurements of the Earth’s various patterns and represent them graphically on such a reduced scale that the elements of these patterns are clearly visible [1]. The language of maps is used to communicate spatial information from the cartographer to the map user [2,3,4]. Phillips [5] accentuates that when the information is presented in a map, there is no longer any need to store the raw information. With the clarity of spatial data visualization and the current availability of mapping applications, this fact makes maps more popular than ever [6].
Maps are powerful tools to communicate spatial information, but they also have significant educational potential that should be exploited by high-quality cartography education. Cartography education at the primary and secondary levels should not elementally focus on “producing” effective mapmakers [7], but rather skilled map users with a developed understanding of cartographic concepts. Moreover, map users must be educated not only to simply decode the information that cartographers encoded in the map but also to analyze and interpret this information, inter alia, in relation to other information displayed on the map and in a broader context [8,9]. In this regard, maps (and cartography education in general) serve as tools of spatial thinking development [10,11].
Nakos, Filippakopoulou and Michaelidou [3] consider the why (its purpose and importance), how (teaching methods and strategies) and what (content to be taught) of quality cartography education. To increase the efficacy (and, therefore, the quality) of cartography education in its what component, it is crucial to know not only what level of map skills students have acquired [3], but also how students use maps (the map use processes). Research into processes and ways, i.e., strategies, that students use when dealing with maps in different situations (to solve various types of problems/tasks) is therefore vital to the design of a quality cartography curriculum.
When researching map-use processes, it is necessary to consider the variability of map types. Different types of maps call for employment of different map skills and various cognitive processes [12]. Although the thematic map share has increased in school cartography in recent decades, traditional general-reference maps are still one of the predominant types in primary and secondary levels of cartography education [12,13]. This is somewhat in contrast with research attention devoted to the investigation of general-reference map use. More precisely, studies aimed at simple map reading (e.g., color/symbol/value search and decoding or location finding) are relatively common (e.g., [14,15]; for a more detailed overview see [16]). In contrast, studies focusing on cognitively demanding operations (extraction of spatial patterns, identification of spatial relationship, use of scale, map critical evaluation, formulation of generalizations or predictions, etc.) with this type of map are still lacking. Moreover, Krassanakis and Cybulski [17] consider studies on cognitively more demanding map use and evaluating the appropriateness of eye-tracking technology for research in the field as one of the future cartographic challenges.
Considering this research deficiency, the study investigates the strategies that students choose when analyzing general-reference maps by addressing the following research questions:
  • Which strategies do students use to analyze general-reference maps?
  • When (and how frequently) is each strategy used?
  • How is strategy choice adapted to specific conditions?
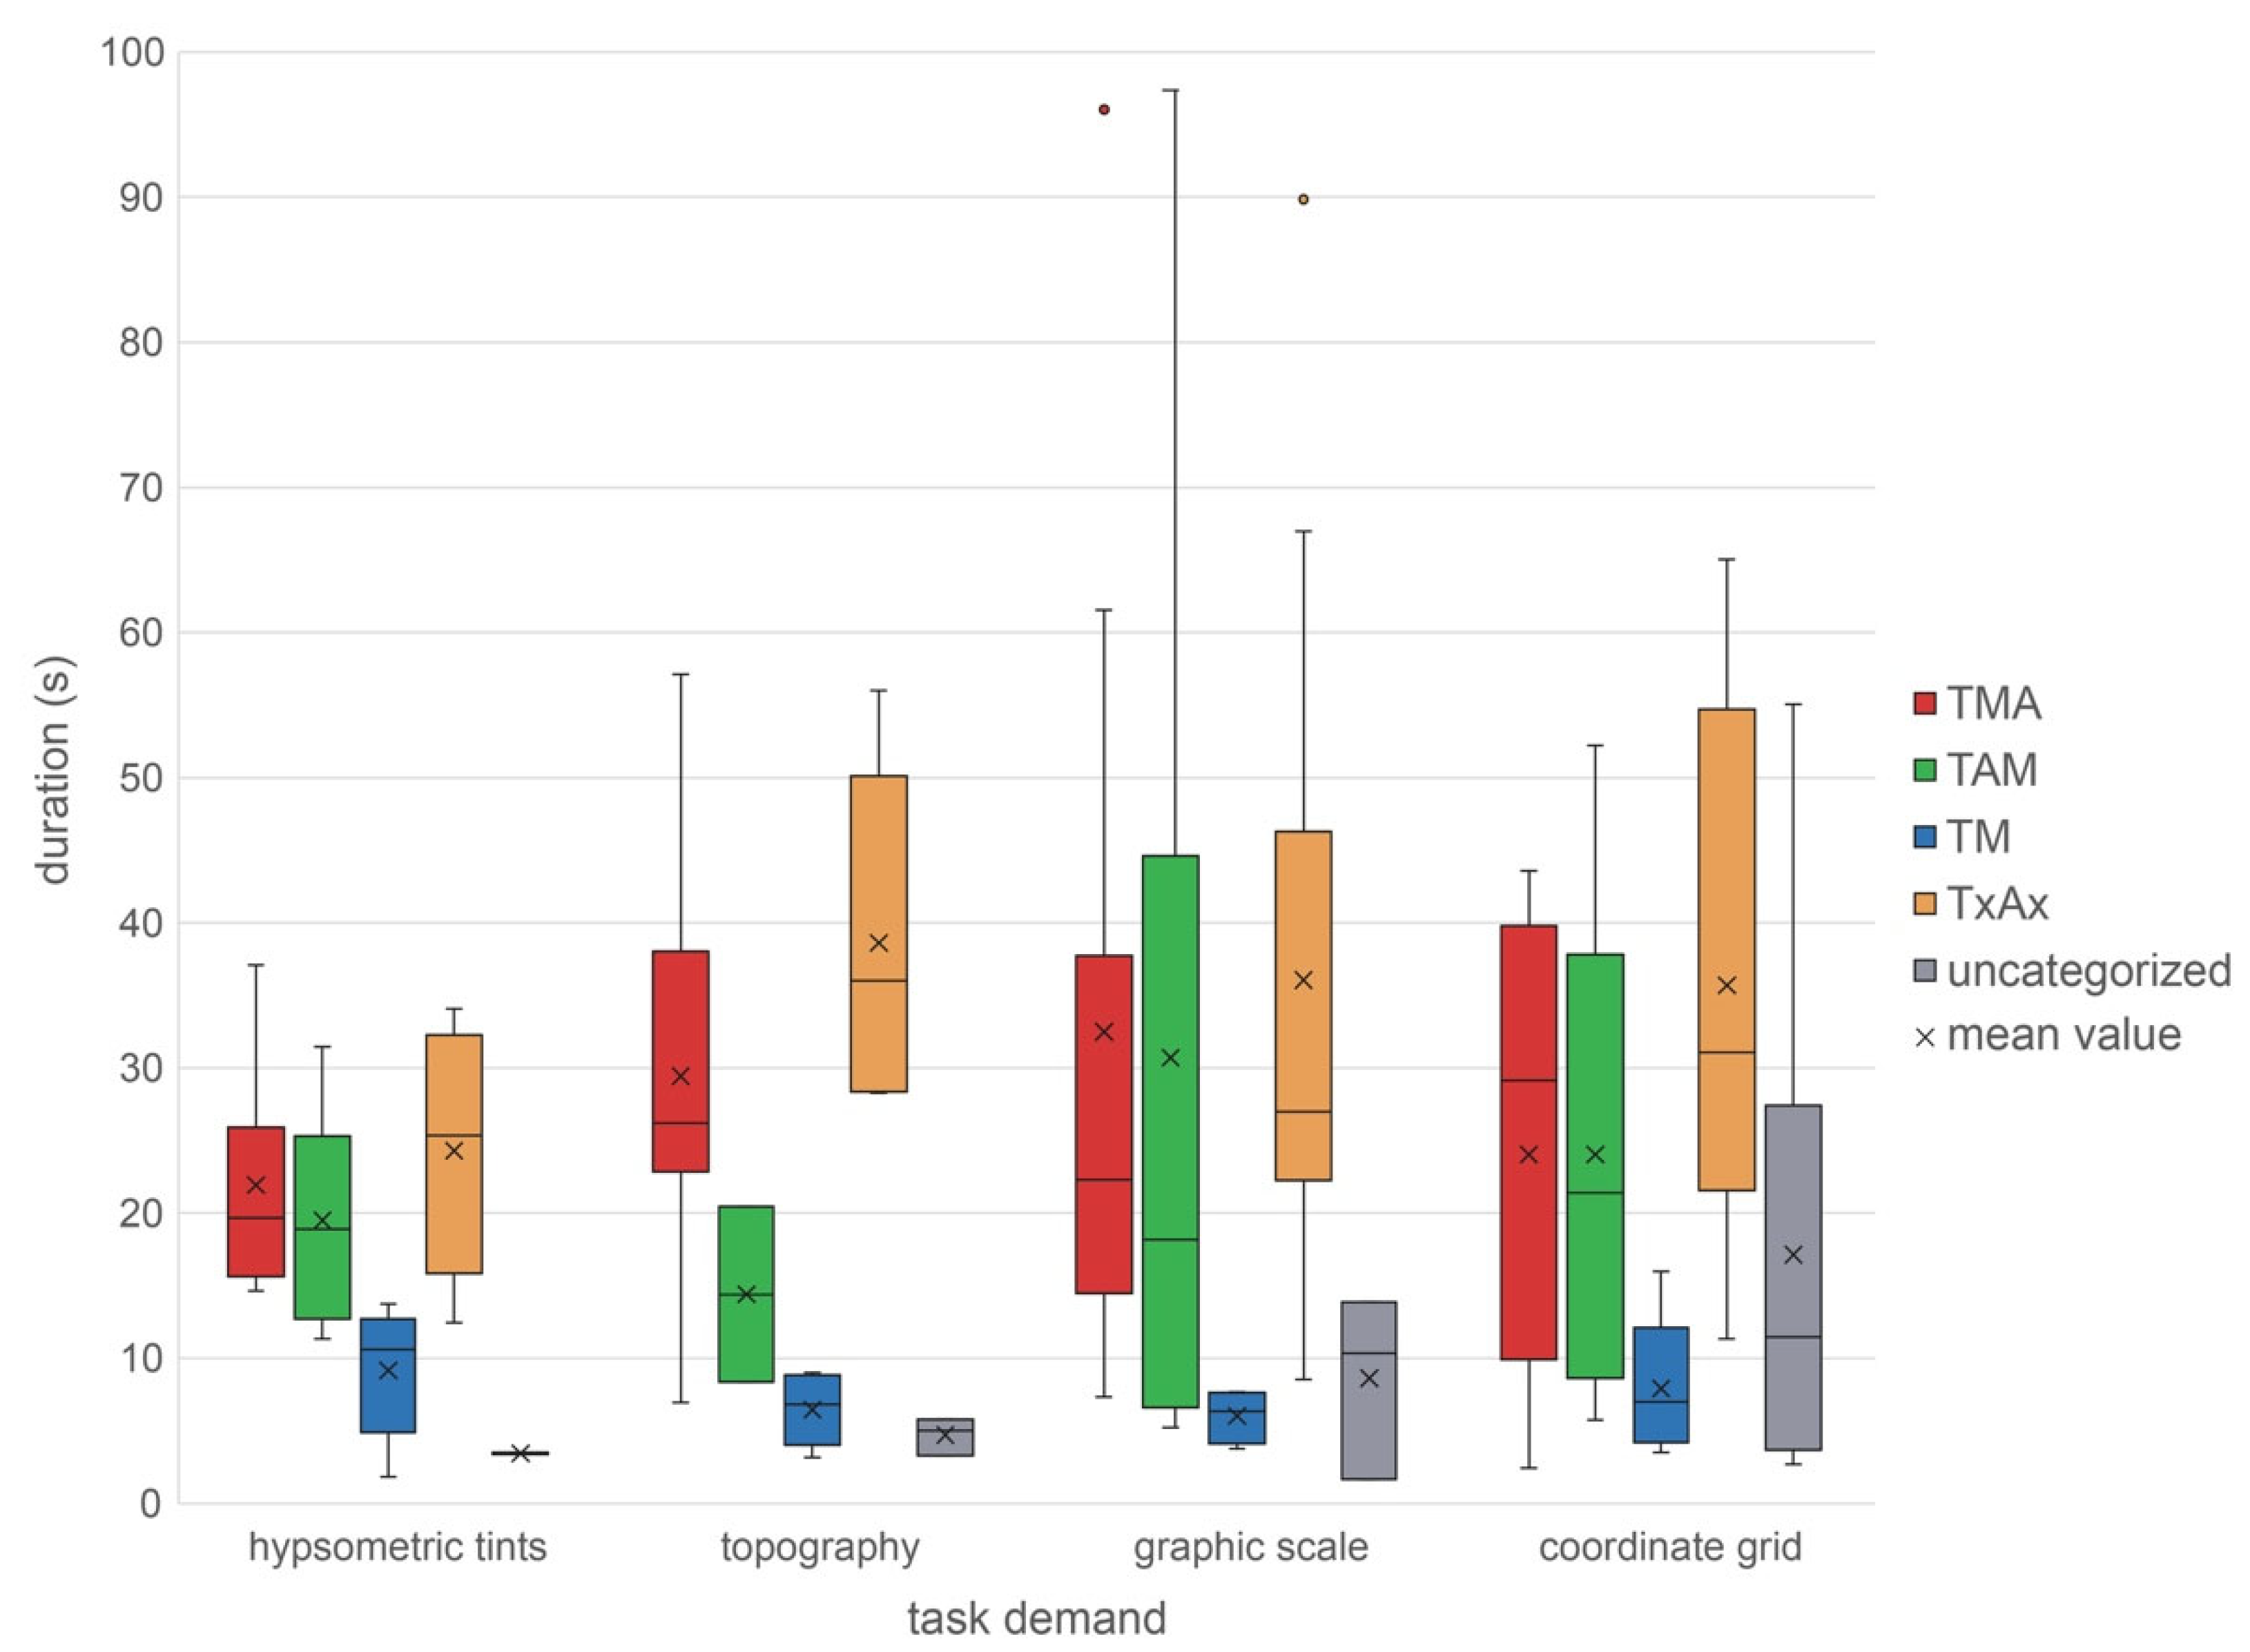
  • How efficiently (accurate and quickly) is each strategy executed?
To answer the questions, the study employed eye-tracking technology in combination with the general-reference map analysis test and a questionnaire for an in-depth experiment with 20 upper-secondary students. The results should be of interest to cartographers and educators dealing with school cartography. Cartographers should reflect these findings in their educational products such as the school maps (in textbooks, school atlases, or as wall maps). The ways in which spatial information is portrayed in these products should be influenced by the educational research findings in order to design as effective educational tools as possible [3]. Educators in cartography should be aware of the strategy repertoire, distribution, efficiency, and adaptiveness of strategy choice in order to effectively develop these dimensions in their students and educate future map users complexly.

1.1. Cognitive Variability of Map Use

When working with maps, users employ their knowledge of maps (elementary cartographic concepts) and map skills [18]. Among these skills, map design skills referring to the design of a map and map use skills engaging with a previously designed map can be distinguished according to the nature of the map work processes. Subsequently, map use skills can be divided into map reading, map analysis and map interpretation according to the cognitive complexity of individual map skills [8]. While map reading consists of cognitively simple operations, map analysis and interpretation are considered cognitively demanding skills. Moreover, increased complexity of map use skills can be observed, which means that the less complex skills are a prerequisite for the more complex ones [19].
This study focuses on strategies used when analyzing a general-reference map—specifically, when extracting and comparing the spatial distribution and spatial relationships between depicted phenomena.

1.2. Strategies of Map Analysis

To understand more complexly how students apply their map skills, it is crucial to be cautious of the strategies used to solve map tasks. Strategies can be understood as the sequences of operations in which an individual processes a given cognitive task [20] and makes a reasonable decision, i.e., actively and gradually differentiates one alternative from other available alternatives. According to the Diff Con theory, Svenson [21] discriminates five phases of the decision-making process: problem recognition, gathering relevant information, evaluation of information, selection of the superior alternative, and consolidation of the decision.
Integrating Svenson’s five phases of decision-making with the eye-mind hypothesis [22], it can be concluded that users pay attention to specific elements of the task in each phase. Notably, the task assignment, the map (and its specific elements: map face, legend, scale, north arrow, and coordinate grid), and decision alternatives in multiple-choice tasks can be identified as the users’ areas of interest (AOI). When compiling map use strategies as sequences of AOIs, it should be considered that a new strategy always starts with reading the task assignment as an expression of recognizing and familiarizing oneself with the problem (i.e., phase 1 in decision-making according to Svenson [21]).
Based on this assumption and the subsequent order of other areas of interest, four general types of strategies used to solve the close-ended (multiple choice) map tasks can be distinguished (according to [11,23,24]):
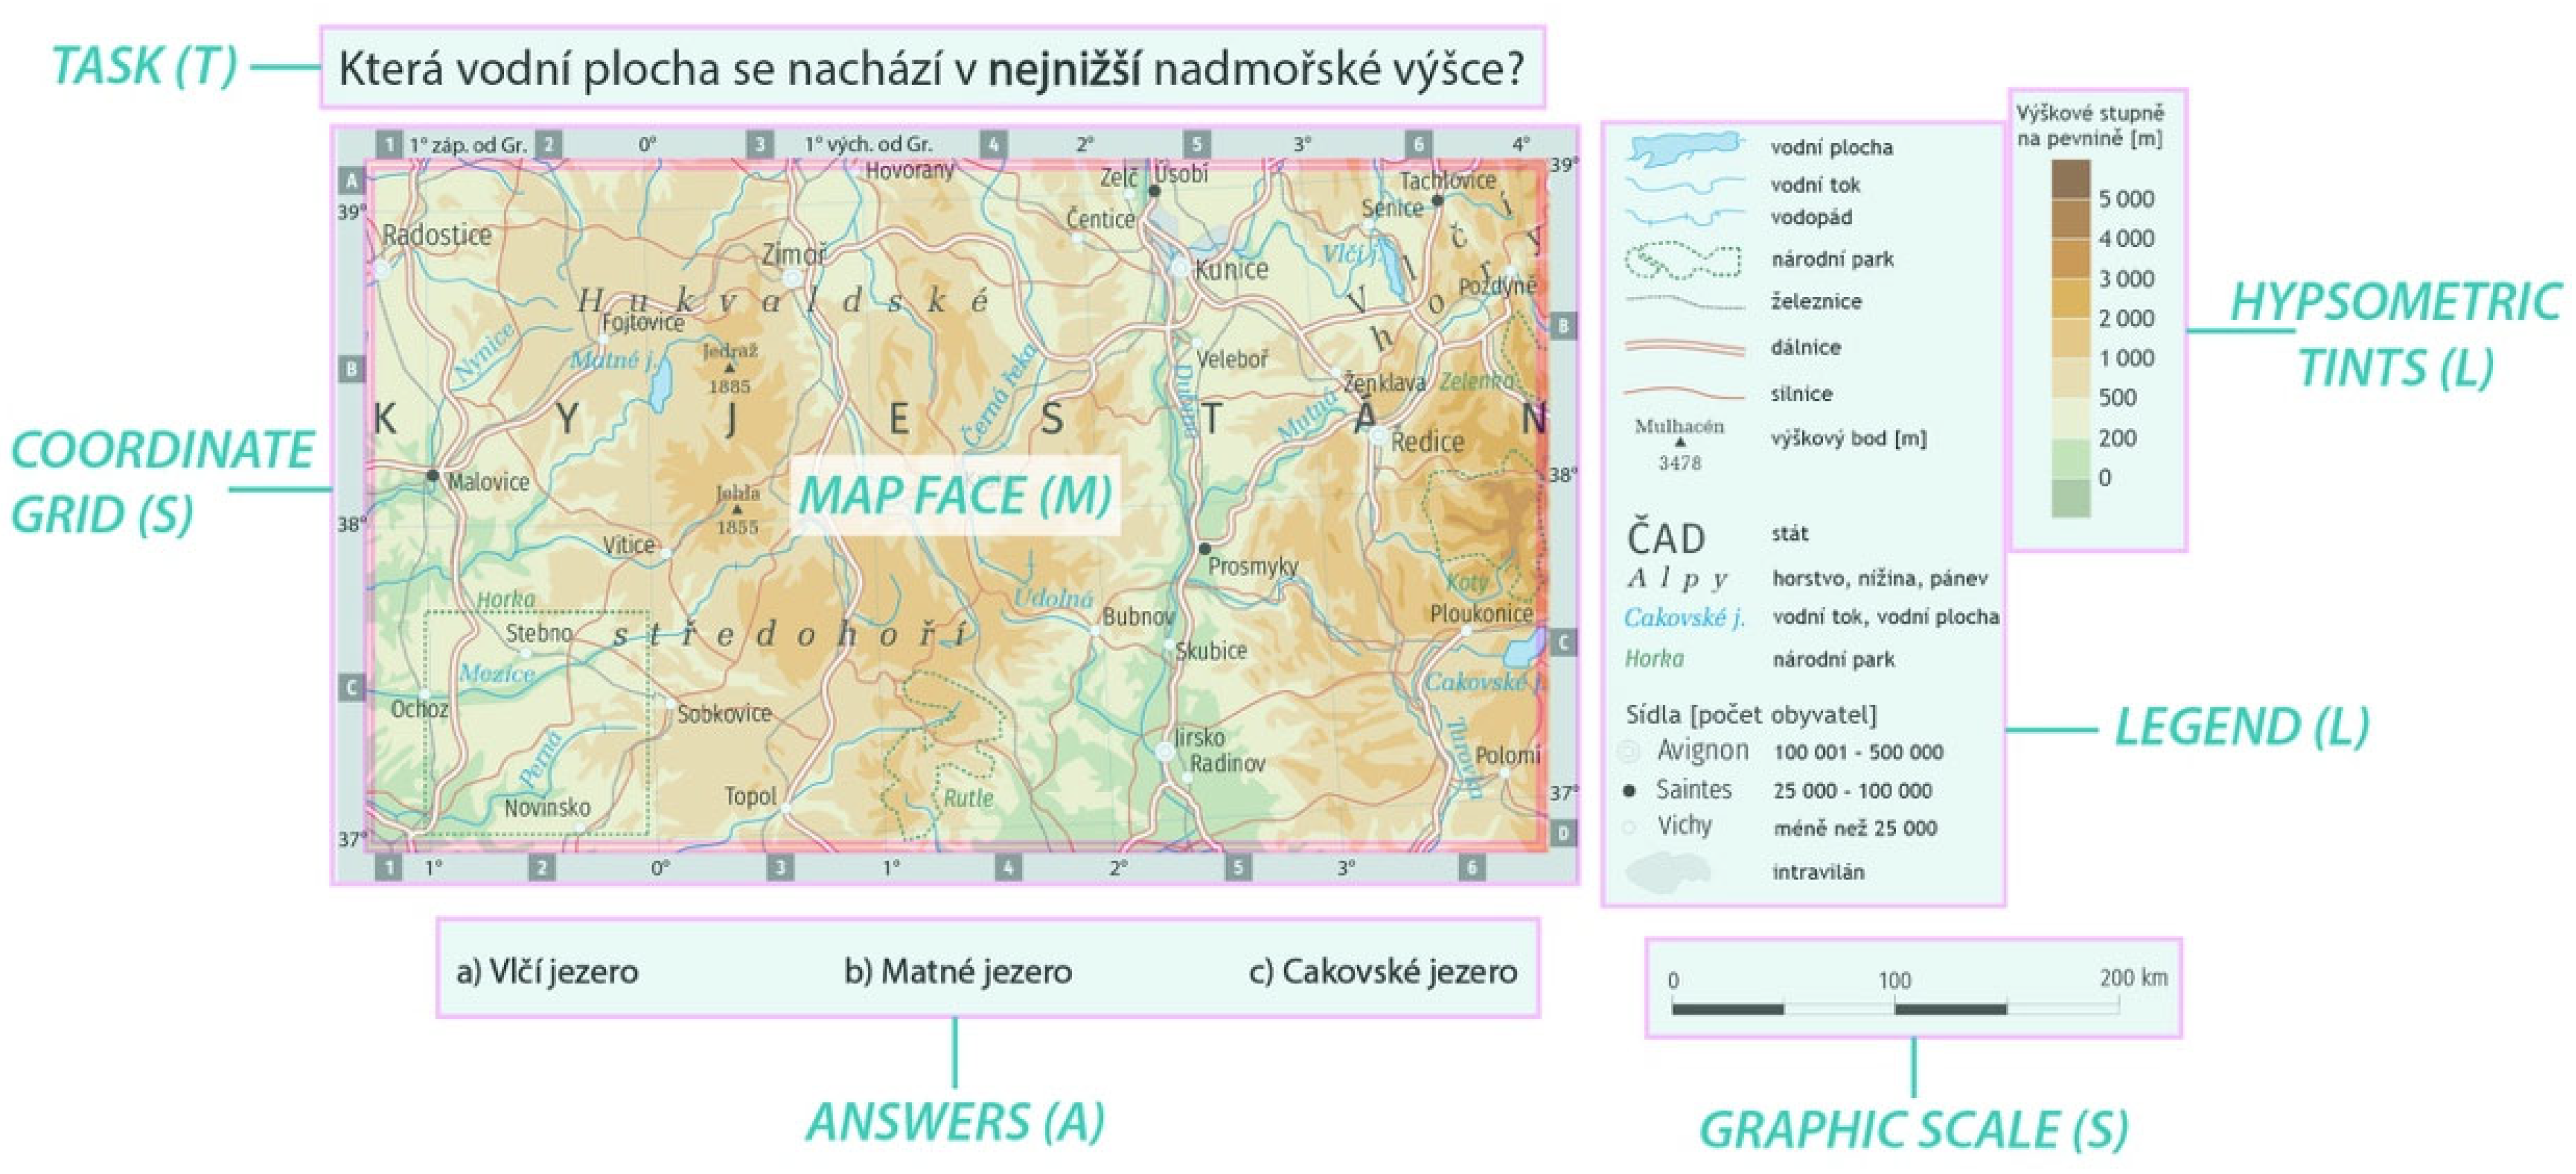
  • TMA—the map user reads the task assignment (T), gathers and evaluates information from the map and solves the task (M), then compares the solution with the given alternatives (A).
  • TAM—after reading the task, the user considers the given alternatives and solves the problem by verifying each alternative using the information from the map.
  • TxAx—after recognizing the problem in the task assignment, the user starts solving it using the information from the map (x—from map face, legend, scale, or coordinate grid), then checks the given alternatives (A) and completes the solution by verifying them with the map (x—with a different segment of map than in previous x step). To be classified as a TxAx strategy, the user must use the map face in one of the “x steps”.
  • TM—the user studies the task assignment and then solves the task using relevant information from the map without paying attention to the given alternatives.
In addition to the four distinguished strategy types, Havelková and Hanus stressed the need to introduce an “uncategorized” strategy type that contains strategies that could not be assigned to any of the previously defined types. These are especially incomplete/partial strategies with no use of the map face [11]. Users’ preferences of the strategy types to solve diverse map tasks can vary according to the type of task, its cognitive complexity, specific map layout, users’ experience etc.
Using these theoretical assumptions, this study employs the spatiotemporal theory-driven approach to meet the set goal, i.e., to identify the strategies used (see Havelková and Hanus [23] for details). However, to better understand how students develop and use their map skills, it is necessary to consider the strategies’ variability, the appropriateness of their use, adaptiveness, etc. Focusing on the specific dimensions of strategies yields a more differentiated picture of map use than would otherwise be possible. Lemaire and Siegler [25] recommend distinguishing among four dimensions of strategies, changes in any one of which can yield overall improvements in accuracy or speed of the strategy.
  • Strategy repertoire—involves the list of strategies used to solve a task. In many domains, multiple strategies can be used to solve a single task [26,27,28,29]. Changes in the repertoire include the acquisition of new strategies and the abandonment of old ones.
  • Strategy distribution—involves both the relative frequencies of each strategy and the types of tasks on which the strategy is used [25,30].
  • Adaptiveness of strategy choice—refers to the adaptiveness of strategy choices and involves decisions about which strategy (from the strategy repertoire) to use on each task [25,30].
  • Strategy efficiency—involves quantitative and qualitative features of performance. Mainly, it concerns the accuracy and speed of strategy execution [25,30].

1.3. Related Studies

The study is part of the step-by-step systematic research into strategies used when solving tasks with maps and is grounded in the findings of authors’ previous studies [11,12,23,24].
First, research into the influence of map type/mapping method on students’ level of map reading, analysis and interpretation was performed [12]. As statistically significant differences in map skill levels between map types were observed, subsequent research focused on the strategies used to solve tasks using different map types. Prior to this, a pilot study was executed on the three basic methodological approaches (spatial data-driven, spatiotemporal data-driven, and spatiotemporal theory-driven) suitable for analyzing strategies, using eye-tracking technology, for cognitively demanding tasks with maps [23].
Subsequently, attention was primarily paid to the strategies for using various thematic maps. The first study compared expert and novice map users and identified the most common bottlenecks (e.g., improper use of the legend, inability to focus on relevant map elements) resulting in task-solving failures [24]. The following study investigated the repertoire, distribution, efficiency, and adaptiveness of strategy choice of the upper-secondary students’ strategies when analyzing various thematic maps [11]. Considering the different nature of the general-reference map, this study complements and extends the findings of the previous studies and, especially, allows the comparison of students’ strategies applied when using thematic and general-reference maps.
Moreover, the study background is formed by a combination of knowledge related mainly to user aspects of maps, cognitive strategies for working with visualizations, and specifics of general-reference maps. Ory et al. [31] emphasize the critical role of cartographic symbols in reading maps and interpreting spatial patterns. The impact of used cartographic symbols, together with the map scale and background complexity, on the users’ level of general reference map analysis skills was proved to be significant [13]. Michaelidou et al. [13] stress the need to focus specifically on the influence of hypsographic tints, direction determination, and the use of both small- and large-scale general-reference maps. However, it is necessary to investigate the cognitive aspects of processing visual information to understand the process of general-reference map analysis complexly [32,33]. Specifically, the investigation of employed visual analytics strategies for pattern recognition and comparison, analytical reasoning, decision making, etc., is needed [34,35]. Cöltekin et al. [34] found that users mostly follow the expected hypothetical strategies with diverse efficiency. When working with visuospatial representations, users’ performance might be affected by many variables, e.g., characteristics of the representation [36,37], task demand, and familiarity with the area depicted on the representation [38]. Moreover, educational variables, such as teachers’ personal teaching concepts [9], teachers’ and students’ various methods of map use [15], visual search training [35] etc., can significantly influence the process.

2. Materials and Methods

2.1. Study Design

The research methods were chosen with regard to the main goal of this study, with an eye-tracking experiment as the main source of data. The data from the eye-tracking experiment were backed by a follow-up questionnaire (Figure 1). The study design thus enabled to compare participants’ used strategies and their perception of used strategies (for similar research design see, e.g., [39,40,41]). The methodology of both the experiment and the questionnaire was based on authors’ previous studies [23,24] and was adjusted to the study specifics (chosen task type, task demands, and map type).

2.2. Participants

To ensure that enough participants would take part in this study, we contacted geography teachers from Central Bohemia and Prague. We selected teachers in upper-secondary grammar schools where geography is taught to all students for at least three years. The invitation included basic information about the experiment, requirements, and a registration link. The requirements related to the students’ ages and thus completion of compulsory geographical education, and to selected vision disorders that could potentially affect the quality of data acquired using the eye-tracking technology.
All 20 participants (10 males and 10 females, aged 17 to 20) were in the final year of grammar school or were former students in the first year of university unrelated to geography. Students from seven different schools signed up. All participants had normal or corrected-to-normal vision and they completed the experiment independently. Each student participated voluntarily, provided written informed consent, and received a reward for their contribution.

2.3. Materials

A suitable general-reference map for the experiment was chosen from a Czech school atlas (i.e., without an easily recognizable area, in an appropriate scale for on-screen view, etc.). An editable vector copy of the map was acquired from the publishers. The map was adjusted using Adobe Illustrator CC with regard to the study aims and methods used (see Figure 2).
Specifically, the original map labels (e.g., city, river, or national park names) were substituted with fictional ones. Consequently, participants were unable to recognize the originally depicted area and were not influenced by their previous knowledge. Furthermore, the readability of all cartographic signs on the map face was checked and fixed with regard to the general complexity of general-reference maps and the required distance between participant and monitor during the eye-tracking experiment.
The eye-tracking experiment consisted of 12 test tasks focused on analysis of the general-reference map (see Table 1). Individual tasks were presented in a fixed order to all participants, and were divided in a total of four task demands (each consisting of three tasks). Each task demand focused on work with a different map element or part of the map content specific to general-reference maps (coordinate grid, graphic scale, hypsometric tints, and topography). Each task was presented as one stimulus together with the map identical for all of them (map face, legend, scale, and coordinate grid) and three possible answers (see Figure 2). One of the given answers was correct and two were distractors. To confirm that the created tasks were appropriate for this experiment and its goals, the validity of each task was checked by experts in the field related to this study. Moreover, the task formulations were adjusted according to the results of the pilot study carried out on 173 students in their final year of upper-secondary grammar school or first year of university. The success rate of each task was checked along with subjective task intelligibility.
The follow-up questionnaire was divided into four distinct parts (see Supplementary Materials). In the first part, the participants stated their perceived difficulty of the whole experiment and of each task type. They were asked if the task difficulty varied and why. Then they compared the answers they gave in the test tasks with the correct answers and were asked for their opinions regarding why they chose the wrong solution if they did not solve all tasks correctly. In the third part, participants indicated which of the elements or map content they used frequently, and which were connected only to the specific task demand. The final part of the questionnaire was aimed at the strategies used. The participants were asked about their strategy choice and also if, from their perspective, their strategies differed based on the task type and thus they worked with different elements or map content.

2.4. Eye-Tracking Apparatus and Setting

During the eye-tracking experiment, the SMI RED 250 system with a sampling rate of 250 Hz was used in combination with a 15.6-inch monitor with a screen resolution of 1920 × 1080 pixels. Appropriately lit separate rooms without any disruptions were prepared for the eye-tracking experiment and the follow-up questionnaire. The experiment was prepared in SMI Experiment Center.

2.5. Procedure

The study was introduced to each participant and instructions for the eye-tracking experiment were provided. The participants were asked to complete the informed consent form and provide some personal information (age, gender, school attended).
The experimental session started when they were seated correctly at a viewing distance of 60 (±5) cm from the eye tracker. Before the first stimulus was revealed, a 13-point full-screen calibration was carried out. The calibration threshold was set to 0.5° of visual angle. A brief repetition of key instructions was followed by a one-minute-long stimulus that displayed the map alone. The purpose of this stimulus was to familiarize participants with the map before the first test task to ensure that the duration and success rate of the first task would not be influenced by unfamiliarity with the map. To verify that the participants understood the instructions, they solved a training task prior to the test. Since participants responded verbally, the control of the stimuli and recording of the response was up to the researcher. In between all stimuli a fixation cross was displayed for 600 ms. After the experiment, the correct answers were shared with the participants and they filled in the follow-up questionnaire. A copy of the map used was made available to them while they completed the questionnaire. At the end of the experiment each participant received a reward.

2.6. Data Analysis

The recorded data were converted from SMI BeGaze to the open-source application OGAMA using the SMI2OGAMA convertor (http://eyetracking.upol.cz/smi2ogama, accessed on 11 November 2021). For data conversion to OGAMA we used settings recommended by Popelka (fixation threshold 80 ms; dispersion radius 50 pixels) [42]. Before further data analysis began, data quality was checked using OGAMA software. During this process, a file containing data loss and samples out of monitor that could not be recorded was exported from OGAMA. First, the percentage of data loss was checked for possible elimination of participants with low quality data. The limit for further quality check was set at 10% data loss, which occurred in only one participant and task. This task record was reviewed and found to be eligible for qualitative analysis. The same process was repeated with the percentage of samples out of monitor with the same limit without the need for further examination.
OGAMA was used for qualitative analysis of the collected data using the GazeReplay method, which enables analysis of video recordings of participants’ eye movements. All strategies used in the recordings were coded independently by the first and second authors following a coding scheme developed by Havelková and Hanus [23]. In cases of uncertainty, the authors reviewed the recordings together until they reached agreement on the strategies used. The coding scheme was used as in previous research, which is based on theoretically set strategies (see Section 1.2) that are expressed as strings of used AOIs during the task solving. In this case, 10 AOIs were defined for the strategy identification (see Figure 2). Each stimulus contained all AOIs: task (T—used in the abbreviations of the strategies), map face (M), legend (L), possible answers (A), map scale and coordinate grid (S).
The task-solving process can be divided into solving cycles and thus can consist of more strategies used in combination or one strategy used multiple times (each solving cycle is equivalent to one strategy). Each cycle starts by familiarization with a problem, thus a new solving cycle can be distinguished by rereading the task assignment, followed by work with map elements that define a chosen strategy. When a participant used more than one strategy to solve a task, the strategy combination was divided into pairs of strategies for further analysis, e.g., a combination of TM, TLMA and TMAS strategies was equal to three pairs of strategies (TM + TLMA, TM + TMAS, TLMA + TMAS).

3. Results

The results section is structured according to the research questions set out in the introduction. These questions are associated with the four dimensions of strategies in the Lemaire and Siegler model [25].
Given the high number of identified strategies, the repertoire, distribution, efficiency, and adaptiveness of participants’ strategies were evaluated mainly from the viewpoint of the strategy types.

3.1. Which Strategies Are Used?

Each of the 20 participants solved 12 tasks during the eye-tracking experiment (240 records in total). Altogether, the participants used 43 different strategies while solving the tasks (Table 2). Some participants used strategy types more equally than others. All strategy types were used by 15 participants. The strategy type that was missing from the repertoire of five participants was TM. On the other hand, the TMA strategy type (without combination with other types) was used by 30% of the participants in at least half of the tasks.
The answers from the follow-up questionnaire showed a much narrower repertoire than the data from the eye-tracking experiment (see Table 3). With one exception, participants stated only strategies involving the use of possible answers and, specifically, mainly various strategies from the TMA and the TAM-type.

3.2. How Is Each Strategy Used?

Exactly 367 cycles were extracted from 240 records. For the purpose of frequency analysis, pairs of solving cycles in combinations were created (e.g., a combination of TM, TMA, and TMLA strategies was rewritten as three pairs of strategies, i.e., TM and TMA, TM and TMLA, and TMLA and TMA). The strategy types used the most overall were TMA (40.6%) and TxAx (26.2%), followed by TAM (15.3%) and TM (10.9%). However, the order of strategy types changed slightly when focusing on the strategy types used only in combination (See Table 2).
When considering the most used combinations of strategy types, TMA type with TMA type leads (Table 4). It is not surprising that TM-type strategies were mostly used in combination with the TMA type as the TM strategy type can be referred as to an unfinished TMA type strategy. Overall, the TM, TxAx and TAM strategy types were more frequently used with the TMA type strategy than with any other.
The most used strategy overall was TMA with a frequency of 15.5% followed by TMAS (10.6%) and TMLA (10.4%). Both the first and third most used strategies were out of the type TMA, however the second most used strategy, TMAS, was from the TxAx strategy type.
Even though 41% of the tasks were solved using more cycles consisting of more strategies or repetition of one strategy, solving a task using only one cycle (i.e., indicated by the absence of rereading the task assignment) was common. The average number of cycles was 1.5. Exactly 16 participants used a single cycle in half or more tasks of the experiment. The most single used strategies were from the TMA strategy type (49.0%) and TxAx type (47.9%). Of these strategy types, the TMAS strategy was used the most followed by TMLA and TMA. The data showed that strategies from TM type and uncategorized strategies were among the least used when it came to solving the task without rereading the task assignment.
Data from the follow-up questionnaire shows that students’ perceived strategies and their frequency differ from the real strategies used during the test (See Table 3). Namely, the perceived frequency of the TAM strategy type exceeded the real frequency of the TAM strategy type. On the other hand, the frequency of the TM type and uncategorized was higher during the test compared to the perceived ones. Similarly, the perceived individual strategies stated the most are different from the real ones. The TMA and TAM strategies had the highest usage during the test from their types, but the strategies stated the most in the follow-up questionnaire out of TMA and TAM types were TMSA and TAML, respectively.

3.3. How Is Strategy Choice Adapted?

Even though the dominance of some strategy types was identified, the strategies and their types were not evenly distributed throughout the experiment and thus changes in participants’ chosen strategies were detected. The main reason for changing a solving strategy was a task demand that was differentiated by the need to use different map elements or parts of the map content specific to the general-reference maps (coordinate grid, graphic scale, hypsometric tints, and topography). This assumption is consistent with the recorded data as well as the follow-up questionnaire, where some of the participants (30%) stated that their strategies changed when working with the different task demands. According to other answers in the follow-up questionnaire, some participants changed their strategies later in the experiment when they realized that knowing the possible answers earlier is more efficient.
The TMA type was the most used strategy type (either alone or in combination with other strategy types) during the tasks focused on hypsometric tints and topography (see Table 2). On the other hand, in the tasks focused on graphic scale and coordinate grid, the TxAx strategy type was used more frequently than the TMA type.
When working with additional map elements, participants introduced working with a graphic scale or coordinate grid into the chosen strategy regardless of the strategy type. For that reason, TMSA, TSMA, TAMS and TASM strategies were more frequently used than the TMA or TAM strategy in the tasks focused on graphic scale and coordinate grid. The use of strategies that contained all the elements (e.g., TMLSA, TALMS, TLAMS) was also identified in tasks that required working with the map scale or coordinate grid.
The highest frequency of use of the legend was recorded in tasks focused on topography (68). On the other hand, the lowest use of the legend occurred in coordinate grid task demand (14). The tasks focused on the hypsometric tints and the graphic scale also required less interaction with the legend than the topography tasks (H—38, S—31). In the topography tasks, working with the legend was required by the task even though it was not totally necessary in all cases to solve the task. A high number of legend use was not recorded in the first task demand focused on hypsometric tints, which also fell into the legend AOI (see Figure 2).
Uncategorized strategies were frequently used when participants worked with the coordinate grid. This higher use is mainly the result of the task C1 (50%). Here participants did not need to use the map face at all to correctly solve it (see Table 1 with the list of task assignments), and therefore they were able to solve the task using only the TAS or the TSA strategy (S means using the coordinate grid in this task). But even in this scenario, only two participants used it as the single strategy and solved the task without rereading the assignment. More often they at least needed to use uncategorized strategies repeatedly to solve the task or used them in combinations with strategies from one or more preset strategy type.
The task demand is not the only thing that affected the used strategies. The task formulation itself can also play a role in the chosen strategy for solvers. Participants more likely used the graphic scale early in the strategy (TSMA, TLSMA, TSA, etc.) if the distance was part of the task formulation. On the other hand, when they had to determine the distance themselves, participants used the graphic scale later or as the last task element in their chosen strategy (TMAS, TAMS, TMALS, etc.).

3.4. How Efficiently Is Each Strategy Executed?

Efficiency was evaluated by reviewing the accuracy and duration of the task-solving process.
The most successful tasks were those focused on the coordinate grid (see Table 5). In contrast, the participants were the least successful when solving tasks focused on the topography. Nevertheless, the difference is insubstantial and it can be said that all task demands have a balanced success rate from the point of view of the test.
To evaluate the strategy efficiency from the accuracy perspective, the success rates were assigned separately to the specific strategy type combinations used to solve a task and to the solely used strategy types (i.e., tasks that were solved with the single cycle or multiple cycles of the same strategy type; see Table 5). To avoid skewing the results, only strategies and combinations of strategies that were used at least twice in the experiment were counted. In general, the TMA strategy type had the highest success rate and it remains high across all task demands. On the other hand, when the strategy type TMA was combined with other strategy type(s), its success rate decreased in all tasks apart from the tasks focused on the coordinate grid. Even though the success rate of the TAM type was similar to the success rate of the TMA type, when combinations with other strategy types were absent the average success rate of the TAM type was distinctly lower. The participants that used the TAM type when solving tasks focused on the graphic scale and the coordinate grid failed more often. Participants that used the TxAx strategy type were more successful than those using the TMA type mainly in the hypsometry tasks and topography task demand. This strategy type alone turned out to be less successful in tasks focused on the coordinate grid, but participants who used it in combinations with other strategies were substantially more successful.
The highest average success rate out of combinations of strategy types was seen in the uncategorized with the TAM type and the uncategorized with the TxAx type. Both of these combinations were among the less used ones, with a usage of three times and seven times, respectively. Overall, the average success rate of strategies that are considered unfinished (TM and uncategorized) in combination with strategy/strategies from other strategy types was higher than combinations of other strategy types. The only exception here was the combination of TxAx and TMA types (see Table 5).
When analyzing the duration of individual strategies, the durations of each recorded cycle and thus the strategy were measured. The average duration of one cycle was 26.4 s. When it comes to average time spent solving the task, i.e., total time of all cycles used for solving the task, the participants spent on average 40.6 s to solve a task. The time needed to solve a task varied among different task demands and among different strategy types used (Figure 3) even though the same map face was used for the whole experiment.
Participants solved the hypsometric tints task the fastest with an average duration of 32.3 s. The students stated in the follow-up questionnaire that this task demand was easy or moderately difficult and some added that they did not need to use the hypsometric tints legend because they already knew the color scheme. The average solving duration increased in the rest of the task demands.
Another important point of view provides the duration of each strategy type and their relationship to the task demand (Figure 3). The solving process with the use of the TxAx strategy type was longer on average than with the rest strategy types. On the contrary, time spent using the TM strategy type and an uncategorized type was shorter than the rest of the strategy types as they did not provide a complete solution and were mostly used in combination (Table 2).
Figure 4 shows a metric combining task-solving duration and accuracy of task answers for strategy types, i.e., a time-based efficiency [43]. A value of the time-based efficiency in this case expresses the speed of task-solving by successful participants vs. all participants using a given strategy type or a combination of strategy types. Thus, a higher value indicates a higher efficiency of a strategy type as more tasks can be successfully solved in a set time using it. It is clear from the graph that combinations of different strategy types frequently extended the solving duration.
The task demand focused on hypsometric tints had a better average success rate and took less time to solve when strategies from the same strategy type were used, i.e., was more efficient (Figure 4). Moreover, more participants used this approach than combinations of different strategy types in this task demand.
In topography tasks, the results did not show a distinct difference in time-based efficiency between tasks solved by combinations of more strategy types and one strategy type. However, combinations of more than two strategy types negatively affected the task-solving efficiency.
Higher efficiency of using one strategy type showed in graphic scale task demand, however, not as substantial as in the tasks focused on hypsometric tints. For instance, the efficiency of the TAM strategy type in tasks focused on the graphic scale fell behind combinations such as TM with TAM and TMA with TAM.
However, the combination of TM with TAM strategy type did not prove to be successful in the coordinate grid tasks, where this combination showed to be the least efficient (Figure 3). Contrary to that, the Figure 3 shows uncategorized strategies as the most efficient for a coordinate grid task demands which is caused by a specifics of the task C1 (see Table 1).
When it comes to comparison of the time-based efficiency of strategy types and their combinations for all tasks, the highest values, apart from uncategorized strategies and its combination with TAM type, had TMA, TAM types and combination of TM with TxAx type. In general, the use of a single strategy type was relatively more efficient than the use of strategy type combinations and mainly the use of more than two different strategy types.

4. Discussion and Conclusions

This study follows up and builds on our previous research focused on strategies that users of different ages and expertise choose for thematic map analysis [11,23,24]. Given that one of these studies was also aimed at upper-secondary students [11], it is possible to compare all four dimensions of strategies that students at the end of this educational level use for analysis of thematic maps with those they use for analysis of general-reference maps.

4.1. Strategy Repertoire

The results showed that overall the repertoire of students’ strategies for solving multiple choice tasks requiring analysis of a general-reference map is very similar in terms of its broadness and the specific strategies it comprises when compared to the strategy repertoire for thematic map analysis [11]. In this study, six fewer strategies were identified, which may be due to the lower number of students tested (20 vs. 51) and thus does not capture the full diversity of possible strategies. Nevertheless, these strategies were not used frequently by students during the analysis of thematic maps. The one with the highest frequency, TLMSA, was used in only 3.3% of solving cycles. In this study, strategies not found in our previous studies were identified as well. However, these were mainly strategies that did not fall into any of the four set strategy types, thus they were incomplete strategies that are appropriate only for very specific tasks that do not require use of the map face (e.g., TAS and TSA).

4.2. Strategy Distribution

Despite the general similarity of strategy repertoires for thematic and general-reference maps, the distribution of both strategy types and specific strategies differs quite substantially for these map types (cf. with [11]). When analyzing general-reference maps, the participants did not use the strategies from the TM type as often (it was the least used type), and instead they more frequently chose strategies from the TxAx type. It is most likely that this difference is in close relation to a considerably lower average number of solving cycles needed to solve the tasks (1.5 vs. 2.7 solving cycles). In the experiment focused on analysis of thematic maps, participants often had to use supplementary solving cycle(s) that were mainly targeted at becoming familiar with a map legend or a map face prior to focusing on task solving or in the middle of task solving.
As these supplementary cycles consisting of TM-type strategies were not common in this study, it is apparent that students have more experience with general-reference maps from geography lessons. They are familiar with them, know commonly used cartographic signs on them, and might even be more used to solving map analysis tasks with them (see also [11]). The lower number of solving cycles needed might also be a result of the nature of thematic maps, mainly those displaying quantitative data, where the use of a legend is often unavoidable even though the map type is already known to its user. Therefore, these two aspects outweighed the overall higher complexity and graphic map load of the general-reference map used in this eye-tracking experiment.
Partially in contrast with previous studies are also the most used specific strategies. The most frequently used strategy in general, TMA, and the one used in tasks solved in a single cycle, TMAS, do not contain the legend. As the participants’ average success rate was sufficiently high, the results confirm that upper-secondary students know the cartographic mean of representation often used on general-reference maps. The third most frequently used strategy in general, TMLA, once again supports this conclusion as the participants did not pay attention to the legend until they found an unfamiliar cartographic sign during the map face exploration. Whereas, during the analysis of thematic maps participants more often paid attention to the legend prior to working with the map face.
The most widely used strategy type, TMA, nevertheless stayed the same and was even used with almost the same relative frequency (38.8% vs. 41.6%; [11]). A similar task layout, as chosen for our experiment, is often used by teachers in lessons and in national tests as well [44]. It is, therefore, likely that the identified strategy distribution in our studies well reflects the students’ commonly used strategies.

4.3. Adaptiveness of Strategy Choice

Similarly to the results of the previous study focused on thematic map analysis [11], the majority of the participating upper-secondary students showed expert-like behavior from the perspective of adapting the strategy choice to the specific demands of the tasks (cf. with [24]). Some participants (3) truly proved that they reason as experts when they did not pay attention to the map face in one of the tasks as they are used to doing, but they correctly decided that it did not contain relevant information for the given task solving. It is apparent that at least some of the upper-secondary students think about the appropriate strategy for a given task-solving prior to starting the solving process. In other words, they are able to understand the deep structure of the task/problem and, based on the identified task demand, they self-regulate their strategies [32,33].
Identically to the thematic map analysis [11,24], in the tasks requiring the use of the map scale the TxAx type was used more often than for other task demands. This strategy type was more frequently chosen even than the TMA type in this study. Thanks to the design of the previous experiment [11] it can be excluded that the identified change in strategy distribution is caused mainly by participants changing their strategy choice during the test, and it can be concluded that it is most likely caused by a necessity to combine information from more task elements, specifically map elements, than in other task demands. The prevalence of the TxAx type was also identified in the tasks requiring the use of the coordinate grid. It is thus apparent that whereas students are able to describe the spatial pattern on thematic maps by means of cardinal points without looking at the north arrow [11], the use of the coordinate grid on the general-reference map is essential for this task demand.
The above-mentioned relatively scarce use of the legend during the task-solving process was only less apparent in the tasks focused primarily on topography. Given that, the participants were more familiar with the color gradient of the hypsometric tints than with the cartographic signs for city population or waterfalls. This is consistent with how these cartographic means of representations (can) differ across various general-reference maps, which also influence how associative these cartographic signs are [31,45]. This result should be of interest also to publishers of (Czech) school atlases. According to this study, it is more necessary to provide students with a legend explaining the specific cartographic signs used for city population, national parks, and other objects depicted than with a color scale for terrain visualization. In the current version of the most widely used Czech school atlas of the world [46], the situation is the opposite, as only the colors used for hypsometric tints are displayed directly on the same page as each of the general-reference maps and the legend for other cartographic signs is placed only on the atlas cover.

4.4. Strategy Efficiency

In contrast to previous studies [11,23], the learning effect is not apparent from this study’s results. The participants did not gradually become more successful and faster during the task solving. They even solved the first tasks in less time than the rest of the test. As the first tasks required working with hypsometric tints, the results once again showed how this terrain visualization is clear to students. Nevertheless, as the average success rate did not differ substantially among task demands, it can generally be said that students are able to analyze general-reference maps and geography teachers should take advantage of this during the lessons.
Non-demonstration of the learning effect also confirms that students are more influenced by the task demand than by the map type when choosing and adapting strategies [11,38]. Therefore, despite using an identical map for all the test tasks and only changing the specific (type of) information needed for its analysis, the strategy efficiency did not gradually improve. This result can be of use to teachers as it shows, together with the results of previous studies [9,11], that it is more appropriate to teach students individual skills and efficient strategy/strategies for tasks requiring the use of these skills one by one and by using various maps than to teach students how to use each map (type) separately and all skills necessary for fulfilling the potential of this map (type).
In general, this study is in accordance with the previous study in the efficiency of combinations of various strategy types. Similar to inefficiency of combinations of three and more strategy types for analysis of thematic maps, for the analysis of general-reference maps the combinations of two and more strategy types were often inefficient. The shift in the number of combined types is given by the lower number of solving cycles needed for general-reference map analysis. Given the identified inefficiency, it is likely that combinations of various strategy types are mainly used by less experienced students (i.e., by novices) who do not know which strategy is appropriate to use or who do not know how to solve the tasks but make an effort to find a solution. In contrast with other participants with a lower average success rate due to not knowing how to solve a task, they immediately pay attention to the possible answers given and choose the one that seems to be the most probable. The lower accuracy of the TAM and TxAx types might be a result of their task-solving behavior and might not mean that these strategy types are generally less efficient for map-analysis tasks.
These two distinguished groups of less successful participants might also be why the relation between the strategy type accuracy and its duration of execution was ambiguous, as in the previous study [11].

4.5. Students’ Perception of Their Strategies

With the combination of two research methods, i.e., an eye-tracking experiment and a follow-up questionnaire that partially played the role of a retrospective thinking aloud protocol, a comparison of participants’ used strategies and their perception of used strategies was possible.
The data from the follow-up questionnaire (see the Supplementary Materials) indicated that participants were probably unaware of many of the strategies that they used, i.e., of the broadness of their repertoire. Moreover, some participants only stated strategies with which it would be impossible or at least very challenging to solve the given task, e.g., TMA, TAM, and TLAM for tasks requiring the use of a scale or a coordinate grid (AOIs marked as “S” in our study). On the level of strategy types, the low frequency of the TxAx type mentions in the questionnaire may be due to participants’ perception of their task-solving process as smoother and more straightforward [39,41]. In reality, many of them often flitted among task elements.
The difference between repertoires might be explained not only by the participants’ unconscious use of certain strategies but also by an unconscious adaptation of the commonly used strategy [40,47,48]. This assumption would also explain the infrequent mentions of the TxAx type in comparison with the frequency of its use. According to Svenson’s theory of decision-making [21], we could conclude that a transition from the TMA to the TxAx type during the test indicates that participants realized that the possible answers given were a key source of relevant information for solving the task and that the answers should not just be used for the final decision regarding which of the found solutions is the superior one (i.e., matches the answers given).
From the questionnaire findings, it is apparent that gaining familiarity with possible answers while gathering (relevant) information was frequently carried out unconsciously, but only a few of the participants realized that this strategy type could be more efficient for the task-solving. Nevertheless, based on the psychological theories [32,33], the use of backward or clueing strategies, i.e., strategies in which learners solve tasks using the answers offered, might not always be beneficial. Given that, learners using them often do not focus on the deep structure of the task solved and thus do not set a relevant sequence of goals to be achieved for finding the correct solution [32,33]. Instead, they rely on generation and testing of various hypotheses that are based on the offered possible answers, and many of them might be irrelevant to the task being solved or may even inappropriately influence learners’ problem perception [33].
The difference between actual and perceived dimensions of strategies and mainly a lower level of thoroughness and precision of participants’ statements confirmed the value of eye-tracking technology for learner strategy research that in the past was entirely dependent on learners’ ability to express their thinking processes and was affected by the questionable validity of learners’ responses [49,50]. Nevertheless, without another, preferably qualitative, research method, it is challenging for researchers to interpret the eye-tracking data and especially to understand why a particular learner chooses a given strategy and if this choice is conscious and purposeful [41]. Moreover, the comparison of actual and perceived strategies might be of use to researchers and educators aiming to develop/improve students’ task-solving strategies.
For comparing the used and perceived strategies, not only a mixed methods design of the study but also the choice of the theory-driven approach for strategy identification was crucial. Given that, this approach enabled the task-solving process to be described more generally than the data-driven approach. Thus, its nature was closer to participants’ perception of their solving process. When identifying strategies based on the data-driven approach (see, e.g., [15,24,34,36]), the key characteristics of learners’ strategies might be lost in the mass of unimportant details. These negligible differences, the amount of which is raised by more time needed for solving cognitively demanding tasks, would also hinder the use of existing algorithmic methods (e.g., string-edit-distance or MultiMatch of scanpaths) for categorization of learners’ strategies [37,51].

4.6. Recommendations for Future Studies

Apart from the use of a mixed methods study design and consideration of theory-driven approaches for strategy identification and comparison, it is possible to suggest other recommendations for future studies based on our results.
The prevalence of the TMA type for solving tasks requiring map analysis might be, at least partially, a result of the used task/stimuli layout (see Figure 2). As vertical processing from top to bottom was frequently identified as common in various user studies [26,52,53], the sequence of task-solving process from the task assignment, map face to possible answers might favor the TMA type. It should therefore be verified in future studies if the strategies falling into the TMA type would remain the most frequently used when various task layouts would be applied, e.g., possible answers displayed directly under the task assignment.
Similarly, future studies should verify our interpretation of the relatively scarce use of the map legend. Students might not be sufficiently familiar with the cartographic means of representation used on general-reference maps, but they might use other specific strategies to find a correct answer. For example, when the task assignment informs students not only which type(s) of objects (e.g., towns, national parks, and rivers) they should focus on but also the name of the specific object(s), they may search the map face for the respective label (name) independently of which cartographic sign is used for the given object type.
In general, the results of this study revealed that even slight changes in the task assignment can caused a change in the concrete prevailingly used strategy. Therefore, instead of focusing on overall characterization of students’ map-analysis strategies, it is possible to specifically aim for an in-depth understanding of the strategies students choose when the tasks require the use of coordinate grids and how this choice is influenced by the information given and their order in the task assignment.
On the one hand, the multiple choice task format enables identification of higher variability of students’ strategies for solving tasks requiring the use of maps. On the other hand, this task format may falsely show a higher success rate, thus hiding some of the students’ bottlenecks during the map use. They might use a backward, clueing or guessing strategy or may retry finding the correct solution, and thus rethink their strategy, when the first found answer is not one of the provided options. This possible use of testwiseness, therefore, must be taken into account when interpreting the participants’ successfulness and task difficulty. Given this, future research should also pay attention to students’ strategies used for solving open-ended tasks requiring spatial pattern recognition and comparison (i.e., map analysis). Moreover, this research focus would enable a valuable comparison of different task formats and confirmation/refutation of the hypothesis that during multiple choice tasks, students more frequently verify the correctness of their answers, i.e., use self-checking strategies.
For easier application of the research results regarding students’ strategies to educational practice, it would also be useful to identify, apart from the appropriate distribution, adaptiveness, and efficiency of general strategy types, these dimensions for each specific strategy. To reach this goal, both large participant samples and a very narrow focus of the studies is needed, thus eliminating the influence of all but one or two independent variables at most. The evaluation of strategy, and even strategy type, efficiency is also difficult because of the frequent combination of strategies/strategy types when cognitively demanding tasks are being solved. To sufficiently describe this strategy dimension, the experiment would have to be, for example, based on developing a given strategy in a group of participants and then ordering them to use it to solve the tasks (for more details see, e.g., [30,35,54]).

Supplementary Materials

The following supporting information can be downloaded at: https://www.mdpi.com/article/10.3390/ijgi11020138/s1, File S1: Questionnaire used in the experiment.

Author Contributions

Conceptualization, David Trokšiar, Lenka Havelková and Martin Hanus; methodology, David Trokšiar, Lenka Havelková and Martin Hanus; validation, Martin Hanus and Lenka Havelková; analysis, David Trokšiar and Lenka Havelková; writing—original draft preparation, David Trokšiar, Lenka Havelková and Martin Hanus; writing—review and editing, David Trokšiar, Lenka Havelková and Martin Hanus; visualization, David Trokšiar. All authors have read and agreed to the published version of the manuscript.

Funding

This study has been supported by Charles University Research Centre program, project no. UNCE/HUM/024.

Institutional Review Board Statement

The study was carried out in accordance with the recommendations provided by the ethical committee of the Faculty of Science, Charles University where authors are affiliated with written informed consent from all subjects.

Informed Consent Statement

Informed consent was obtained from all subjects involved in the study.

Data Availability Statement

The data presented in this study are available on request from the corresponding author. The data are not publicly available due to privacy.

Conflicts of Interest

The authors declare no conflict of interest. The funders had no role in the design of the study; in the collection, analyses, or interpretation of data; in the writing of the manuscript, or in the decision to publish the results.

References

  1. Raisz, E. General Cartography; McGraw-Hill Book Company: New York, NY, USA, 1948; ISBN 978-0-07-051149-1. [Google Scholar]
  2. Koláčný, A. Cartographic Information—A Fundamental Concept and Term in Modern Cartography. Cartogr. J. 1969, 6, 47–49. [Google Scholar] [CrossRef]
  3. Nakos, B.; Filippakopoulou, V.; Michaelidou, E. The Interaction of the Didactic of Cartography and Geography. In Proceedings of the 19th International Cartographic Conference, Ottawa, QC, Canada, 14–21 August 1999. [Google Scholar]
  4. MacEachren, A.M. How Maps Work: Representation, Visualization, and Design; Guilford Press: New York, NY, USA, 1995; ISBN 978-1-57230-040-8. [Google Scholar]
  5. Phillips, R.J. Are Maps Different from Other Kinds of Graphic Information? Cartogr. J. 1989, 26, 24–25. [Google Scholar] [CrossRef]
  6. Ooms, K.; De Maeyer, P.; Dupont, L.; Van der Veken, N.; Van de Weghe, N.; Verplaetse, S. Education in Cartography: What Is the Status of Young People’s Map-Reading Skills? Cartogr. Geogr. Inf. Sci. 2015, 43, 134–153. [Google Scholar] [CrossRef] [Green Version]
  7. Bertin, J.; Gimeno, R. The Cartography Lesson in Elementary School. In Graphic Communication and Design in Contemporary Cartography; Taylor, D.R.F., Ed.; John Wiley & Sons, Ltd.: Chichester, UK, 1983; pp. 231–256. ISBN 0-471-10316-0. [Google Scholar]
  8. Wiegand, P. Learning and Teaching with Maps; Routledge: New York, NY, USA, 2006; ISBN 978-1-134-38384-9. [Google Scholar]
  9. Hanus, M.; Havelková, L. Teachers’ Concepts of Map-Skill Development. J. Geogr. 2019, 118, 101–116. [Google Scholar] [CrossRef]
  10. National Research Council. Learning to Think Spatially; The National Academies Press: Washington, DC, USA, 2006; ISBN 978-0-309-09208-1. [Google Scholar]
  11. Havelková, L.; Hanus, M. Upper-Secondary Students’ Strategies for Spatial Tasks. J. Geogr. 2021, 120, 176–190. [Google Scholar] [CrossRef]
  12. Havelková, L.; Hanus, M. The Impact of the Map Type on the Level of Student Map Skills. Cartographica 2018, 53, 149–170. [Google Scholar] [CrossRef]
  13. Michaelidou, E.; Nakos, B.; Filippakopoulou, V. The Ability of Elementary School Children to Analyse General Reference and Thematic Maps. Cartographica 2004, 39, 65–88. [Google Scholar] [CrossRef] [Green Version]
  14. Incoul, A.; Ooms, K.; De Maeyer, P. Comparing Paper and Digital Topographic Maps Using Eye Tracking. In Modern Trends in Cartography; Brus, J., Vondráková, A., Voženílek, V., Eds.; Springer International Publishing: Cham, Switzerland, 2015; pp. 339–356. [Google Scholar]
  15. Beitlova, M.; Popelka, S.; Vozenilek, V. Differences in Thematic Map Reading by Students and Their Geography Teacher. ISPRS Int. J. Geo-Inf. 2020, 9, 492. [Google Scholar] [CrossRef]
  16. Krassanakis, V.; Cybulski, P. A Review on Eye Movement Analysis in Map Reading Process: The Status of the Last Decade. Geod. Cartogr. 2019, 68, 191–209. [Google Scholar] [CrossRef]
  17. Krassanakis, V.; Cybulski, P. Eye Tracking Research in Cartography: Looking into the Future. ISPRS Int. J. Geo-Inf. 2021, 10, 411. [Google Scholar] [CrossRef]
  18. Kwan, T.Y. Teachers’ Perceptual Understanding of Mapwork and Their Styles of Mapwork Teaching at Forms 1-3 Levels in Hong Kong. Asian Geogr. 1994, 13, 75–94. [Google Scholar] [CrossRef]
  19. Gagné, R.M. The Conditions of Learning; Holt, Rinehart and Winston: New York, NY, USA, 1977; ISBN 978-0-03-089965-2. [Google Scholar]
  20. Eme, P.-E.; Marquer, J. Individual Strategies in a Spatial Task and How They Relate to Aptitudes. Eur. J. Psychol. Educ. 1999, 14, 89–108. [Google Scholar] [CrossRef]
  21. Svenson, O. Differentiation and Consolidation Theory of Human Decision Making: A Frame of Reference for the Study of Pre- and Post-Decision Processes. Acta Psychol. 1992, 80, 143–168. [Google Scholar] [CrossRef]
  22. Just, M.A.; Carpenter, P.A. Eye Fixations and Cognitive Processes. Cogn. Psychol. 1976, 8, 441–480. [Google Scholar] [CrossRef]
  23. Havelková, L.; Hanus, M. Research into Map-Analysis Strategies: Theory- and Data-Driven Approaches. Geografie 2019, 124, 187–216. [Google Scholar] [CrossRef]
  24. Havelková, L.; Gołębiowska, I.M. What Went Wrong for Bad Solvers during Thematic Map Analysis? Lessons Learned from an Eye-Tracking Study. ISPRS Int. J. Geo-Inf. 2019, 9, 9. [Google Scholar] [CrossRef] [Green Version]
  25. Lemaire, P.; Siegler, R.S. Four Aspects of Strategic Change: Contributions to Children’s Learning of Multiplication. J. Exp. Psychol. Gen. 1995, 124, 83–97. [Google Scholar] [CrossRef] [PubMed]
  26. Matheson, I.A.; MacCormack, J. Avoiding Left-to-Right, Top-to-Bottom: An Examination of High School Students’ Executive Functioning Skills and Strategies for Reading Non-Linear Graphic Text. Read. Psychol. 2020, 42, 1–21. [Google Scholar] [CrossRef]
  27. Zhang, Z.; Russwinkel, N.; Prezenski, S. Modeling Individual Strategies in Dynamic Decision-Making with ACT-R: A Task Toward Decision-Making Assistance in HCI. Procedia Comput. Sci. 2018, 145, 668–674. [Google Scholar] [CrossRef]
  28. Ghosh, S.; Verbrugge, R. Studying Strategies and Types of Players: Experiments, Logics and Cognitive Models. Synthese 2018, 195, 4265–4307. [Google Scholar] [CrossRef] [Green Version]
  29. Piccardi, L.; De Luca, M.; Nori, R.; Palermo, L.; Iachini, F.; Guariglia, C. Navigational Style Influences Eye Movement Pattern during Exploration and Learning of an Environmental Map. Front. Behav. Neurosci. 2016, 10, 140. [Google Scholar] [CrossRef] [PubMed] [Green Version]
  30. Torbeyns, J.; Verschaffel, L.; Ghesquière, P. Strategic Competence: Applying Siegler’s Theoretical and Methodological Framework to the Domain of Simple Addition. Eur. J. Psychol. Educ. 2002, 17, 275. [Google Scholar] [CrossRef]
  31. Ory, J.; Christophe, S.; Fabrikant, S.I.; Bucher, B. How Do Map Readers Recognize a Topographic Mapping Style? Cartogr. J. 2015, 52, 193–203. [Google Scholar] [CrossRef]
  32. Anderson, J.R. The Architecture of Cognition; Harvard University Press: Cambridge, MA, USA, 1983; ISBN 978-0-8058-2233-5. [Google Scholar]
  33. Bonner, S.M. Mathematics Strategy Use in Solving Test Items in Varied Formats. J. Exp. Educ. 2013, 81, 409–428. [Google Scholar] [CrossRef]
  34. Çöltekin, A.; Fabrikant, S.I.; Lacayo, M. Exploring the Efficiency of Users’ Visual Analytics Strategies Based on Sequence Analysis of Eye Movement Recordings. Int. J. Geogr. Inf. Sci. 2010, 24, 1559–1575. [Google Scholar] [CrossRef]
  35. Blacker, K.J.; Peltier, C.; McKinley, R.A.; Biggs, A.T. What Versus How in Visual Search: Effects of Object Recognition Training, Strategy Training, and Non-Invasive Brain Stimulation on Satellite Image Search. J. Cogn. Enhanc. 2020, 4, 131–144. [Google Scholar] [CrossRef]
  36. Popelka, S.; Vondráková, A.; Hujňáková, P. Eye-Tracking Evaluation of Weather Web Maps. ISPRS Int. J. Geo-Inf. 2019, 8, 256. [Google Scholar] [CrossRef] [Green Version]
  37. Doležalová, J.; Popelka, S. ScanGraph: A Novel Scanpath Comparison Method Using Visualisation of Graph Cliques. J. Eye Mov. Res. 2016, 9, 1–13. [Google Scholar] [CrossRef]
  38. Kim, K.; Kim, M. Effects of Task Demand and Familiarity with Scenes in Visuospatial Representations on the Perception and Processing of Spatial Information. J. Geogr. 2018, 117, 193–204. [Google Scholar] [CrossRef]
  39. Gosling, S.D.; John, O.P.; Craik, K.H.; Robins, R.W. Do People Know How They Behave? Self-Reported Act Frequencies Compared with on-Line Codings by Observers. J. Pers. Soc. Psychol. 1998, 74, 1337–1349. [Google Scholar] [CrossRef]
  40. Thevenot, C.; Castel, C.; Fanget, M.; Fayol, M. Mental Subtraction in High- and Lower Skilled Arithmetic Problem Solvers: Verbal Report versus Operand-Recognition Paradigms. J. Exp. Psychol. Learn. Mem. Cogn. 2010, 36, 1242–1255. [Google Scholar] [CrossRef] [PubMed]
  41. Guan, Z.; Lee, S.; Cuddihy, E.; Ramey, J. The Validity of the Stimulated Retrospective Think-Aloud Method as Measured by Eye Tracking. In Proceedings of the SIGCHI Conference on Human Factors in Computing Systems, Montreal, QC, Canada, 22–27 April 2006; Association for Computing Machinery: New York, NY, USA, 2006; pp. 1253–1262. [Google Scholar]
  42. Popelka, S. Optimal Eye Fixation Detection Settings for Cartographic Purposes. In Proceedings of the 14th SGEM GeoConference on Informatics, Geoinformatics and Remote Sensing, Albena, Bulgaria, 17–26 June 2004; STEF92 Technology Ltd.: Sofie, Bulgaria, 2014; pp. 17–26. [Google Scholar]
  43. Sergeev, A. Efficiency. Available online: http://ui-designer.net/usability/efficiency.htm (accessed on 8 February 2022).
  44. CERMAT Tests and Assignments. Available online: https://maturita.cermat.cz/menu/testy-a-zadani-z-predchozich-obdobi (accessed on 26 December 2021).
  45. Kent, A.J.; Vujakovic, P. Cartographic Language: Towards a New Paradigm for Understanding Stylistic Diversity in Topographic Maps. Cartogr. J. 2011, 48, 21–40. [Google Scholar] [CrossRef]
  46. Beitlová, M.; Popelka, S.; Voženílek, V.; Fačevicová, K.; Janečková, B.A.; Matlach, V. The Importance of School World Atlases According to Czech Geography Teachers. ISPRS Int. J. Geo-Inf. 2021, 10, 504. [Google Scholar] [CrossRef]
  47. Siegler, R.S.; Stern, E. Conscious and Unconscious Strategy Discoveries: A Microgenetic Analysis. J. Exp. Psychol. Gen. 1998, 127, 377–397. [Google Scholar] [CrossRef]
  48. Luwel, K.; Torbeyns, J.; Verschaffel, L. The Relation between Metastrategic Knowledge, Strategy Use and Task Performance: Findings and Reflections from a Numerosity Judgement Task. Eur. J. Psychol. Educ. 2003, 18, 425–447. [Google Scholar] [CrossRef]
  49. Stone, A.A.; Bachrach, C.A.; Jobe, J.B.; Kurtzman, H.S.; Cain, V.S. The Science of Self-Report: Implications for Research and Practice; Lawrence Erlbaum Associates: Mahwah, NJ, USA, 1999; ISBN 978-1-135-67741-1. [Google Scholar]
  50. Zhang, L.J.; Zhang, D. Think-Aloud Protocols. In The Routledge Handbook of Research Methods in Applied Linguistics; Routledge: New York, NY, USA, 2019; ISBN 978-0-367-82447-1. [Google Scholar]
  51. Jarodzka, H.; Holmqvist, K.; Nyström, M. A Vector-Based, Multidimensional Scanpath Similarity Measure. In Proceedings of the 2010 Symposium on Eye-Tracking Research & Applications, Austin, TX, USA, 22–24 March 2010; Association for Computing Machinery: New York, NY, USA, 2010; pp. 211–218. [Google Scholar]
  52. Figl, K.; Strembeck, M. On the Importance of Flow Direction in Business Process Models. In Proceedings of the 9th International Conference on Software Engineering and Applications, Vienna, Austria, 29–31 August 2014; Science and Technology Publications: Vienna, Austria, 2014; pp. 132–136. [Google Scholar]
  53. Ares, G.; Etchemendy, E.; Antúnez, L.; Vidal, L.; Giménez, A.; Jaeger, S.R. Visual Attention by Consumers to Check-All-That-Apply Questions: Insights to Support Methodological Development. Food Qual. Prefer. 2014, 32, 210–220. [Google Scholar] [CrossRef]
  54. Li, H.; Hua, X.; Yang, Y.; Huang, B.; Si, J. How Does Task Switching Affect Arithmetic Strategy Use in Children with Low Mathematics Achievement? Evidence from Computational Estimation. Eur. J. Psychol. Educ. 2020, 35, 225–240. [Google Scholar] [CrossRef]
Figure 1. Experiment design. Note: Color gradient represents consecutive steps in the experiment.
Ijgi 11 00138 g001
Figure 2. Stimulus example with depicted areas of interest (AOIs).
Ijgi 11 00138 g002
Figure 3. The duration of strategy types by the task demand.
Ijgi 11 00138 g003
Figure 4. Time-based efficiency of strategy types and their combinations by task demand.
Ijgi 11 00138 g004
Table 1. List of tasks used in the achievement test.
Task IDTask Assignment
H1Which water body is located at the highest altitude?
H2Which river has the highest elevation difference?
H3Which area is in the highest altitude?
T1How many towns have more than 25,000 inhabitants?
T2Which town has the most types of direct transport connection with Malovice?
T3Which river has the most waterfalls?
S1Which towns are 200 km apart?
S2What is the distance from Jirsko to Úsobí on a highway?
S3What is the approximate area of Horka national park?
C1In which hemispheres is the majority of the map located?
C2In which field of the coordinate grid are most towns located?
C3Which coordinates correspond to Veleboř?
Note: The number in the task ID indicates the order of the tasks for the given task demand. Abbreviations used: H—hypsometric tints, T—topography, S—graphic scale, C—coordinate grid.
Table 2. Repertoire and distribution of strategies based on eye-tracking data.
Strategy Type/StrategyTotal Frequency of UseSingle UseSingle Use (% of Total Use)Use in CombinationStructure of Combination (%)Task Demand
HTSC
TMA1497349.07633.444542427
TMA572035.13717.8291657
TMLA382360.5156.1122411
TMSA18950.093.400810
TLMA171376.541.831400
TSMA13646.272.80058
TMLSA4125.030.90040
TSMLA100.010.60001
TLSMA11100.000.00010
TAM562035.73617.22041715
TAM25624.01910.117431
TAMS13753.863.10058
TASM6350.031.50015
TAML6350.030.92040
TALM300.030.91020
TASML100.010.30001
TAMLS11100.000.00010
TALMS100.010.30010
TM4012.53916.991588
TM2200.0229.23865
TML10110.094.65311
TLM500.052.11400
TMS100.010.30001
TSM100.010.30001
TMLS100.010.30010
TxAx964647.95020.212183432
TMAS392461.5155.5002019
TMAL20630.0146.191100
TLAM10330.072.83700
TSAM6466.720.90015
TMALS7457.130.90061
TLAMS200.021.20011
TMASL200.020.90002
TMLAS3133.320.60021
TSMAL2150.010.60011
TMSAL2150.010.30002
TLMAS2150.010.30020
TLASM11100.000.00010
uncategorized2627.72412.326315
TL600.063.41410
TAS500.053.10005
TSA5120.041.50014
TS300.031.80003
TA200.021.20101
TSAL2150.010.30002
TLA100.010.31000
TAL100.010.30100
TASL100.010.30010
Total36714238.7225100.087978697
Note: Abbreviations used: H—hypsometric tints tasks, T—topography tasks, S—graphic scale tasks, C—coordinate grid tasks. Grey rows combine all individual strategies from a given strategy type.
Table 3. Students’ perception of their strategy repertoire and distribution.
Strategy Type/StrategyTotal Frequency Relative Frequency (%)Task Demand
HTSC
TMA3440.08998
TMSA1112.90065
TMA78.24201
TLMA67.12400
TMLA55.92300
TSMA55.90032
TAM3440.010879
TAML1011.85500
TAMS910.60054
TAM89.45012
TASM44.70013
TALM33.50300
TM11.20100
TLM11.20100
TxAx1517.63444
TSAM78.20034
TLAM67.13210
TMAL22.40200
uncategorized11.20001
TSA11.20001
Total85100.021222022
Note: Abbreviations used: H—hypsometric tints tasks, T—topography tasks, S—graphic scale tasks, C—coordinate grid tasks. Grey columns combine all individual strategies from a given strategy type.
Table 4. Relative structure of combinations of strategy types.
Strategy TypeTMATAMTMTxAxUncategorized
TMA23.310.414.113.55.5
TAM10.47.44.36.16.1
TM14.14.37.46.11.8
TxAx13.56.16.19.84.9
uncategorized5.56.11.84.96.1
Note: The table shows the structure of combinations (in % of all combinations used) for each strategy type (in rows) with other types (in columns). The sum of all numbers equals 200% as pairs of strategies were used for the calculation.
Table 5. Success rates of the strategy types and strategy types in combinations by task demand.
Strategy Types/Strategy Types in CombinationSuccess Rate by Task DemandTotal Success RateNumber of Use
HTSC
TMA0.780.750.780.830.7884
TxAx0.830.780.760.550.7353
TAM0.78 0.560.500.6122
uncategorized1.00 1.001.005
TM + TMA0.170.670.671.000.6316
TxAx + TMA0.500.670.781.000.7414
TM + TxAx 0.830.837
TMA + TAM0.33 0.75 0.547
uncategorized + TxAx 1.000.75 0.887
TxAx + TAM 0.25 0.256
TM + TAM 1.000.500.756
uncategorized + TAM 1.001.003
uncategorized + TMA + TAM 0.50 0.503
average success rate0.740.670.730.800.78233
Abbreviations used: H—hypsometric tints tasks, T—topography tasks, S—graphic scale tasks, C—coordinate grid tasks. Note: The success rate by task demand is indicated only in cases where strategy types and combinations of strategy types occurred at least two times. The average success rate and total success rate are calculated for all used strategies and combinations, including those used less than two times.
Publisher’s Note: MDPI stays neutral with regard to jurisdictional claims in published maps and institutional affiliations.

