Article

Spatial Patterns of the Spread of COVID-19 in Singapore and the Influencing Factors

1
School of Resource and Environmental Sciences (SRES), Wuhan University, 129 Luoyu Road, Wuhan 430079, China
2
Surveying and Mapping Geographic Information Institute of Ningxia Hui Autonomous Region, 25 Yinjiaqu Street, Yinchuan 750002, China
3
Institute of Smart Perception and Intelligent Computing, School of Resource and Environmental Sciences (SRES), Wuhan University, 129 Luoyu Road, Wuhan 430079, China
*
Author to whom correspondence should be addressed.
ISPRS Int. J. Geo-Inf. 2022, 11(3), 152; https://doi.org/10.3390/ijgi11030152
Submission received: 16 December 2021 / Revised: 14 February 2022 / Accepted: 20 February 2022 / Published: 22 February 2022

Abstract

:
Exploring the spatial patterns of COVID-19 transmission and its key determinants could provide a deeper understanding of the evolution of the COVID-19 pandemic. The goal of this study is to investigate the spatial patterns of COVID-19 transmission in different periods in Singapore, as well as their relationship with demographic and built-environment factors. Based on reported cases from 23 January to 30 September 2020, we divided the research time into six phases and used spatial autocorrelation analysis, the ordinary least squares (OLS) model, the multiscale geographically weighted regression (MGWR) model, and dominance analysis to explore the spatial patterns and influencing factors in each phase. The results showed that the spatial patterns of COVID-19 cases differed across time, and imported cases presented a random pattern, whereas local cases presented a clustered pattern. Among the selected variables, the supermarket density, elderly population density, hotel density, business land proportion, and park density may be particular fitting indicators explaining the different phases of pandemic development in Singapore. Furthermore, the associations between determinants and COVID-19 transmission changed dynamically over time. This study provides policymakers with valuable information for developing targeted interventions for certain areas and periods.

1. Introduction

The COVID-19 pandemic has evolved into an unprecedented global public health crisis that poses a serious threat to human health. Since the World Health Organization (WHO) declared the COVID-19 outbreak a pandemic on 11 March 2020 [1], the number of globally confirmed cases has exceeded 231 million, with 4.7 million deaths as of 28 September 2021 [2], and these numbers are rising every day. The COVID-19 pandemic has put immense pressure and challenges on the public health security of all countries, and various governments have implemented different national strategies to curb the spread of the virus.
In the early stage of the pandemic, non-pharmaceutical interventions (such as social distancing and lockdown) and their combinations could be effective ways to mitigate the spread of the virus [3]. The focus of these measures is to reduce people’s mobility to prevent the spread of the virus among people. To achieve this goal, it is necessary to understand the spatial pattern of the virus distribution over time [4]. Previous studies have demonstrated that geographical factors play a crucial role in the spread of diseases, presenting some spatiotemporal distribution patterns and indicating various influencing factors in different areas [5,6,7].
The analysis of spatiotemporal patterns of disease has been very helpful for identifying disease clusters and predicting the transmission risk of disease, which is a key process of targeted interventions [8,9]. However, although some countries or regions may have showed similar transmission patterns in the early stage of the pandemic [10], with the change of intervention measures, the spread of the virus presents different spatial patterns. For instance, the spread of COVID-19 in Italy began in several northern provinces and then spread to the remaining provinces along the Boot rather than following a unified pattern across Italian territory [11]. In Germany, COVID-19 incidence presented two distinct spatial patterns, and the strong gradient of incidence from south to north aided in dividing all federal states into two epidemiological divisions [9]. In China, the intercity spatial diffusion process of COVID-19 mainly followed geographical patterns of adjacent, relocation, hierarchical, and corridor diffusion [6], and the spatial clusters with high incidence rates in Hubei Province were concentrated in the Wuhan metropolitan area [12], while in Chongqing, a significant clustering pattern was observed at the residential community scale, with different clustering hotspots for imported and local cases [13].
Evaluating the relationship between COVID-19 transmission and various environmental factors not only provides insights into the distribution patterns and spatial variability of COVID-19, but also provides information for improving the ability of epidemiological models to predict the risk of future outbreaks [5]. Recent studies have found that multiple factors significantly affect the spatial patterns of the spread of COVID-19, such as the total population [14], population density [15], elderly population [16,17], population mobility [3,18,19], race [20], income [14,20], poverty [14], regional GDPs [19], among others. In addition to sociodemographic factors, healthcare factors such as hospital beds, diabetes rates [17], proportion of nurse practitioners [20], and COVID-19 testing rates [16] may potentially explain the spatial variability of COVID-19 cases or mortality. Besides that, the urban built environment (e.g., spatial configuration and urban facilities) significantly affects human activities and social interactions, which are closely related to the spread of infectious diseases [21]. Earlier related studies observed that the severity of COVID-19 was mainly attributed to the following factors: construction land area proportion, hospital density [22], land-use mixture, urban growth, commercial facilities [23], commercial land density [21], transport facilities density [24], and green space [25,26]. As COVID-19 is mainly transmitted through close contact among people, the close contact that occurs in relatively closed and confined indoor spaces, such as restaurants, hotels, and grocery stores, may increase the risk of infection, and this risk may vary with time and policies [27]. In a word, the studies from different countries, regions, and cities show that sociodemographic, built-environment factors, and other factors are associated with the spread of COVID-19, and that these associations are spatially nonstationary, meaning that they could vary over space.
However, as a pandemic develops, the associations between environmental factors and COVID-19 transmission may change over time, indicating that such associations may exist temporal nonstationarity, that is, the associations between environmental factors and health outcomes vary over time [28]. A study on the first wave of COVID-19 pandemic in the United States observed that due to the change in people’s activities after the reopening, some factors (e.g., mobility index and average daily PM 2.5) were only significantly correlated with COVID-19 incidence during the reopening, but not during the lockdown [29]. Similarly, the impact of the natural and human environments on the spread pattern of COVID-19 in China differed before and after Wuhan’s shutdown [30]. In addition, a recent study found that during the four waves of the pandemic in Hong Kong, the associations between the built-environment and sociodemographic features with the spread of COVID-19 changed in space and time, possibly due to the change in non-pharmaceutical interventions over time [28]. Therefore, investigating the dynamic changes in the associations between environmental factors and COVID-19 transmission is helpful evaluating the temporal evolution of disease, identifying the key factors during specific periods, and developing targeted interventions.
Singapore, a city-state located at the southern tip of the Malay Peninsula in maritime Southeast Asia, was one of the earliest countries in Southeast Asia to be affected by COVID-19. Its aggressive response measures to prevent the spread of COVID-19, such as temperature screening, border controls, and contact tracing and testing, have been upgraded and calibrated since the first confirmed case was announced on 23 January 2020. The international community recognized the government’s early response and success during the pandemic [31,32]. At the beginning of April, however, outbreaks in foreign worker dormitories revealed a societal blind spot in terms of political capacity [33], resulting in the government announcing a nationwide lockdown beginning on 7 April 2020. Nevertheless, the number of dormitory cases continued to rise rapidly; as of 30 September 2020, there were 57,765 confirmed cases and 27 deaths in a population of 5.7 million.
Several studies on the COVID-19 pandemic in Singapore have been conducted and have addressed different aspects, such as modeling COVID-19 transmission [34], investigating infection clusters [35,36], exploring potential exposure risk [37,38], and evaluating the COVID-19 control policy [39]. However, there are few results on the question of which sociodemographic, built-environment factors, or region-specific factors are associated with the spread of COVID-19. Furthermore, considering the rapid evolution of COVID-19 and the difference in its spatial distribution patterns in different countries or regions, a longer time series should be conducted to identify the characteristics of its spread in specific locations as well as the temporal nonstationarity of its associations with environmental factors. Thus, this study fills the abovementioned gap by using a long-time series of COVID-19 case data to investigate the spatial patterns of COVID-19 transmission in Singapore, as well as the associated demographic and built-environment factors. First, this study divides the evolution of the COVID-19 pandemic in Singapore into time segments and analyzes the spatial patterns by using spatial autocorrelation analysis. Second, it examines the demographic and built-environment factors associated with COVID-19 transmission and identifies the important influencing factors in different periods using a three-stage analytical approach. The results reveal the changes of the spatial patterns of COVID-19 transmission and the differences in related factors in space and time, which provide key insights for formulating timely public health measures in specific periods and risk regions.

2. Materials and Methods

2.1. Study Area and Data Collection

The study area of this research is Singapore, a city-state with a total land area of approximately 728.3 km2 and a population of 7.5 million as of the end of December 2020. Singapore is organized into five regions, 55 planning areas, and 332 subzones, according to the 2019 Master Plan. The regions include the central region, east region, north-east region, north region, and west region. Our study focused on subzone-level data, with region (as auxiliary data) [40] and subzone data [41] obtained from the website of the Government Technology Agency of Singapore.
The confirmed COVID-19 cases and the COVID-19 density incidence at the subzone level were the outcome variables of interest. The data on confirmed COVID-19 cases were collected from the Ministry of Health, Singapore (MOH) [42]. It included some demographic information (e.g., gender, age, and nationality), the links between cases, and the geographical location of individual or infection clusters. The confirmed cases were categorized into imported cases and local cases, with local cases including community and dormitory cases. Due to the increasing number of confirmed cases, the MOH reported only the location of infection clusters since mid-March 2020, rather than the location of infected individuals. From 23 January to 30 September 2020, 54,258 confirmed cases (including individual cases and cases linked to infection clusters) were obtained, accounting for approximately 94 percent of the total confirmed cases (57,765). The confirmed COVID-19 cases were used to investigate the changes in spatial patterns of COVID-19 transmission, particularly the spatial patterns of different types of cases. Furthermore, because cases of foreign workers living in dormitories accounted for a large proportion of total confirmed cases, and subzone population data only included Singapore residents (Singapore citizens and permanent residents), non-residents (foreigners who are working, studying, or living in Singapore but not granted permanent residence) were not counted. To avoid the deviation caused by the incidence rate calculated by population, the COVID-19 incidence density, calculated by dividing the number of confirmed cases by the total area in each subzone, was used as a dependent variable of regression models to examine potential influencing factors associated with COVID-19 transmission.
In this study, the factors related to demographics and the built environment were considered based on previous studies and available data. Demographic data included the population density and elderly population density (aged 65 and above), both of which have been proven to be important demographic factors. Built-environment data involved two aspects: variables related to land use included the proportions of residential land, commercial land, business land, open space, and green space; variables related to urban facilities included the density of hospitals, pharmacies, schools, supermarkets, eldercare facilities, hotels, eateries, transportation stations, and parks. To some extent, these data may reflect different aspects of human activities. The definitions, descriptive statistics, and sources of the above variables are provided in Table S1, and ArcMap 10.5 (http://www.esri.com/arcgis; accessed on 12 December 2021) was used to calculate each variable.

2.2. Methods

2.2.1. Spatial Autocorrelation Analysis

Spatial autocorrelation is a measure of spatial dependence that refers to the correlation of the observations in different positions. There are two types of indicators: global indicators and local indicators. Global spatial autocorrelation describes the overall distribution of a phenomenon in spatial units and assesses whether clustered, dispersed, and random patterns exist. If the phenomenon is spatially nonstationary, the local difference is described using local spatial autocorrelation [43]. First, we investigated the spatial patterns of COVID-19 cases at the subzone level using the global Moran’s I statistic, which is a widely used measure of global spatial autocorrelation [44]. The value of global Moran’s I ranges from −1 to 1. If the value approaches 1, it indicates that the distribution of COVID-19 cases is clustered. A discrete pattern is observed when the value is close to −1. If the value is close to or equal to 0, the COVID-19 cases are distributed randomly. Then, Getis-Ord Gi*, a local spatial autocorrelation indicator, was applied to explore the correlation of COVID-19 cases in different spatial units by identifying statistically significant spatial clusters of high (hot spot) and low (cold spot) values.

2.2.2. Variable Selection and Modeling

To determine significant factors affecting COVID-19 incidence density, the analytical approach was divided into three stages. First, the stepwise forward regression method was used to select variables. The selected variables in this stage were the elderly population density, the proportion of commercial and business land, and the density of hospitals, schools, pharmacies, supermarkets, hotels, eateries, and parks, which will be used in the following models. Simultaneously, the variance inflation factor (VIF) and tolerance were used to verify multicollinearity. All VIF values among filtered variables were less than 3, signifying that there was no significant multicollinearity.
Second, the ordinary least squares (OLS) model and the multiscale geographically weighted regression (MGWR) model were conducted to examine the association between the influencing factors and COVID-19 incidence density in different periods. The OLS model is the most common and widely used global regression model, it is frequently used to assess the overall effectiveness of each explanatory variable, and its regression parameters are kept constant in geospatial space. The MGWR model is a geographically weighted regression (GWR) extension that allows studying the relationships between dependent variables and independent variables at varying spatial scales [45]. It more accurately captures the spatial nonstationarity by capturing the scale effect in spatial process [20], which has been used to assess the determinants of obesity [46] and COVID-19 transmission [17,20,47].
Finally, the dominance analysis method was applied to identify the most important influencing factors. Dominance analysis is a relative importance analysis method that estimates the relative contribution of independent variables by examining the change in R2 caused by adding an independent variable in all possible subset regression models [48]. This method could overcome the limitation of importance estimation when predictors are correlated, so it is often used as an important supplement in regression analysis.
The spatial autocorrelation analysis was performed using GeoDa 1.16 software (http://geodacenter.github.io; accessed on 12 December 2021), and a spatial weight matrix based on first-order Queen’s contiguity was chosen to express the potential for interaction between observations at each pair of spatial units. Descriptive statistics of the variables and stepwise forward regression were performed in SPSS V22. The OLS model was run in ArcMap 10.5, while the MGWR model was implemented in MGWR2.2 software developed by Oshan, et al. [49]. To approximate the kernel bandwidth and calculate the variable bandwidth for MGWR, the adaptive bi-square spatial kernel and the golden bandwidth search method were applied, respectively, and the corrected Akaike Information Criterion (AICc) was used to select the best bandwidth. Before running the model, all variables were standardized to have a mean of zero and a variance of one so that the MGWR bandwidths would be unaffected by the dimension of the explanatory variables [49]. The dominance analysis was performed with Stata 16.0.

3. Results

3.1. The Six-Phase Division of the Studied Time Duration

The COVID-19 spread in Singapore from 23 January 2020 to 30 September 2020 can be divided into six phases. The dividing point was selected based on the key moments of the Singapore pandemic and the implementation of critical policies. Figure 1 shows six phases from 23 January to 30 September 2020, corresponding to the critical moments in the Singapore pandemic (Table S2 for details). Phase A can be considered as a period of imported cases with Chinese travel history. Phase B started on 4 February, the date Singapore announced the appearance of local transmission clusters, indicating the start of a new stage of limited community transmission in Singapore. Phase C began on 11 March, the day when the WHO declared the COVID-19 outbreak a pandemic, and extended until 7 April, when the government implemented the lockdown policy (‘Circuit Breaker’, a series of social distancing measures implemented by the Singapore government). This phase was a period of increasing numbers of imported cases with travel histories from the United Kingdom, United States, and other countries or regions. Phase D can be considered as the lockdown period, as well as the outbreak period of dormitory cases due to the dramatic increase in the number of dormitory cases. Following the Circuit Breaker, Singapore progressively resumed activities in three stages: ‘Safe Re-opening’, ‘Safe Transition’, and ‘Safe Nation’ [50]. During the Safe Re-opening (2 June to 18 June), some activities with low transmission risk, such as some workplaces, schools, and medical care, were resumed, whereas during the Safe Transition (from 19 June), with a few exceptions, most activities, such as catering, shopping malls, and parks, were resumed, so we chose June 19 as the start date of phase E. Phase F started on 11 August, the date when the Singapore Ministry of Manpower (MOM) declared that all dormitories had been cleared of COVID-19, implying that the testing of all workers in the dormitories had been completed. The division of these six phases approximately corresponded to the trend of Singapore’s Government Response Stringency Index evaluated from the Oxford COVID-19 Government Response Tracker [51].

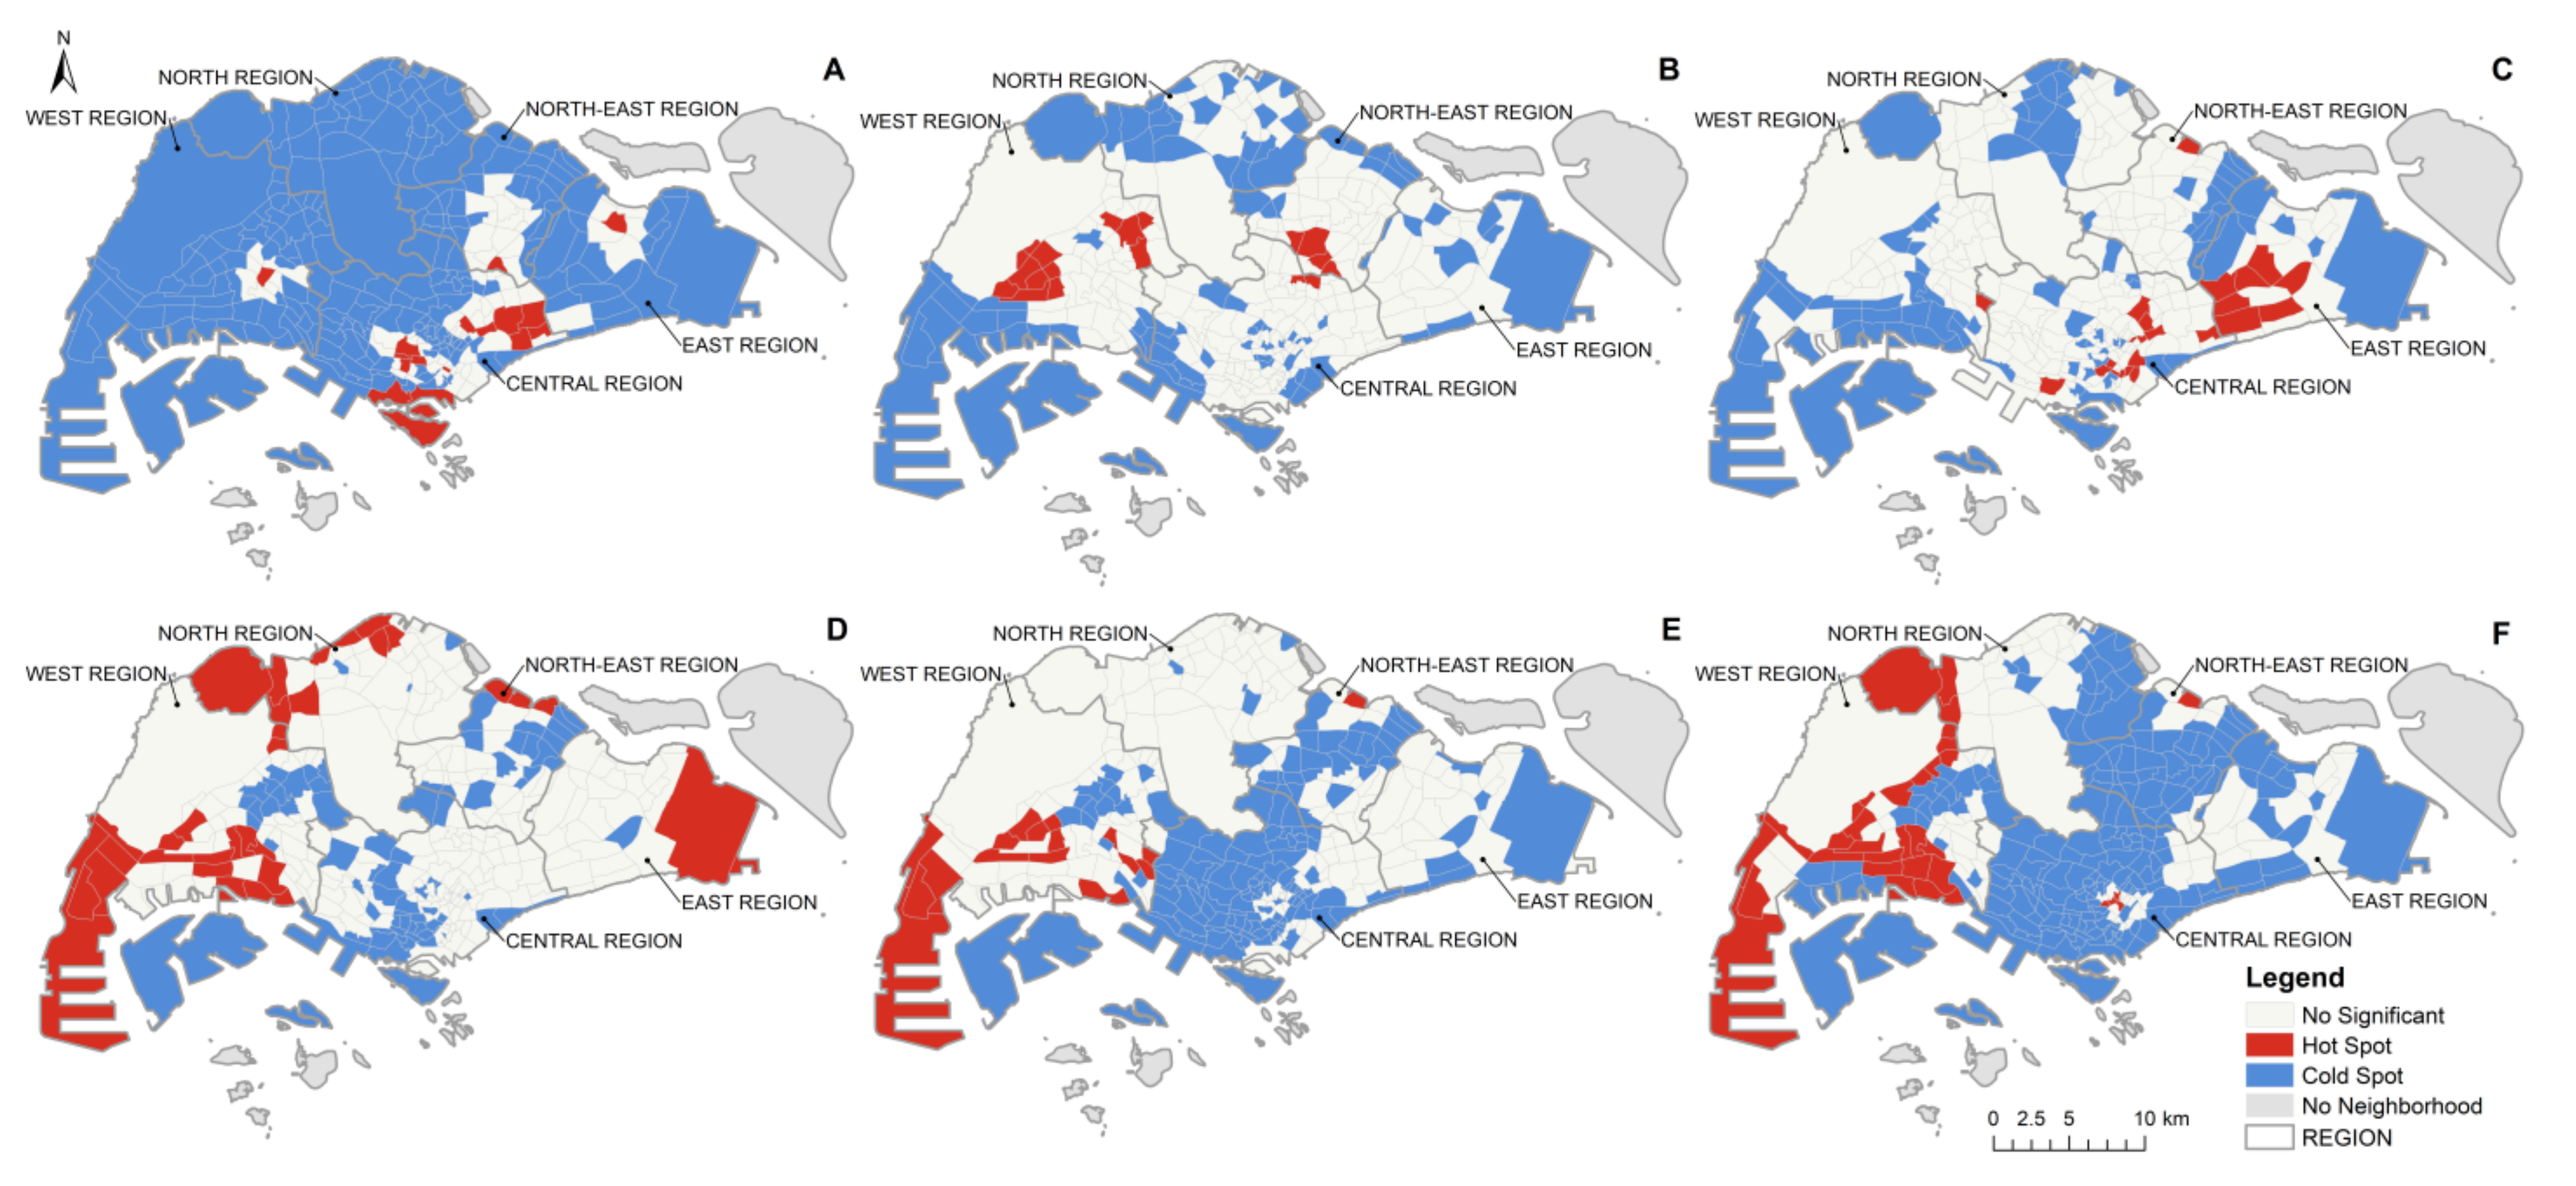
3.2. Spatial Distribution Patterns of the COVID-19 Pandemic in Singapore

In the six phases, the global Moran’s I values were −0.008 (p = 0.454), 0.077 (p = 0.018), −0.012 (p = 0.430), 0.202 (p = 0.001), 0.075 (p = 0.026), and −0.007 (p = 0.359), as shown in Table 1. The values of Moran’s I in phases B, D, and E passed the 5% significance test after 999 permutations. This means that the COVID-19 cases in these phases had significant spatial autocorrelation, with a positive correlation. Notably, COVID-19 cases were clustered in phases B, D, and E and randomly distributed in phases A, C, and F, indicating that the spatial patterns of the COVID-19 pandemic in Singapore shifted over time. Meanwhile, Moran’s I values showed that the aggregation degree was highest in phase D, that is, the lockdown period, which conflicted with studies in some countries or regions that observed that the aggregation degree should be reduced during the lockdown period [52]. This is due to the fact that there are a large number of dormitory worker clusters in this phase. However, the aggregation degree in phase F was obviously lower than that in phase D, indicating that the measures (such as isolation and detection) implemented for dormitory cases may have a positive impact.
We further analyzed the spatial autocorrelation of local cases and imported cases in phases A, B, and C. The results are shown in Table 2. Because there were so few local cases in phase A, only imported cases were investigated. The Moran’s I value of local cases in phase B was 0.089, with p values less than 0.05, indicating a clustered pattern of local cases. However, the distribution patterns for imported cases were all random during these three phases. When combined with the clustering pattern in phase D (fewer than 50 cases were imported during the lockdown period), it can be shown that the distribution patterns of local and imported cases may be quite different. Overall, the influence of the dominant cases in each phase largely determined the spatial pattern of the six phases, and the intervention measures may be the primary reason for the change in the dominant cases in each phase. In phase A, the cases were mostly imported, and the spatial pattern was random. As border restrictions were implemented, the number of imported cases decreased, and local cases became the dominant cases in phase B, resulting in aggregated transmission. The spatial pattern was random in phase C due to the large increase in imported cases from other pandemic areas, such as Europe and the United States, whereas after the lockdown, the number of imported cases dropped drastically, and a large number of local cases caused the spatial spread to show an obvious clustered pattern during phase D. The clustered pattern in phase E may be related to the government’s detection of asymptomatic and self-healing foreign worker cases; in phase F, there were no prominent dominant cases, and sporadic cases were transmitted at random. As a result, intervention measures may be the most important factor in changing the spatial patterns of COVID-19 transmission, and the change in the spatial patterns with time also indicated the effectiveness of policy implementation indirectly.
The results map of hot spot analysis (Getis-Ord Gi*) is presented with a 95 percent confidence level. As illustrated in Figure 2, during the six phases of the COVID-19 pandemic in Singapore, the hot spots mainly appeared in the middle, south, and east of the central region during phase A. In phase B, the hot spots were concentrated at the junction of the central and northeast regions and the central and eastern parts of the west region, and in phase C they moved eastward, with the majority aggregating in the east region and a few scattered in the central region. In phase D, hot spots were widespread in the southern and southwestern parts of the west region, while in the north region, they were located along the north region-west region boundary, as well as subzones along the northern edge. There were also cluster areas near Pulau Punggol Timor in the northeast region and Changi Airport in the east region. During phase E, the hot spots were mainly in the southwest, middle, and east of the west region. The hot spots in phase F were concentrated in the southern and southwestern areas of the west region. The cluster areas near the junction of the west and north region resembled those seen in phase D. The Getis-Ord Gi* analysis showed that there were high-value and low-value spatial clusters in different phases of the pandemic, and the location of hot spots was not constant and changed as the pandemic evolved. These hotspots were the critical areas for COVID-19 prevention and control. Furthermore, the general trend of hotspot movement was from the central region to the outside, with the majority of hotspots concentrated in the west region and the northern part of the north region, which could point to a possible trend of infection spreading from the prosperous central region to other remote areas (such as industrial areas).

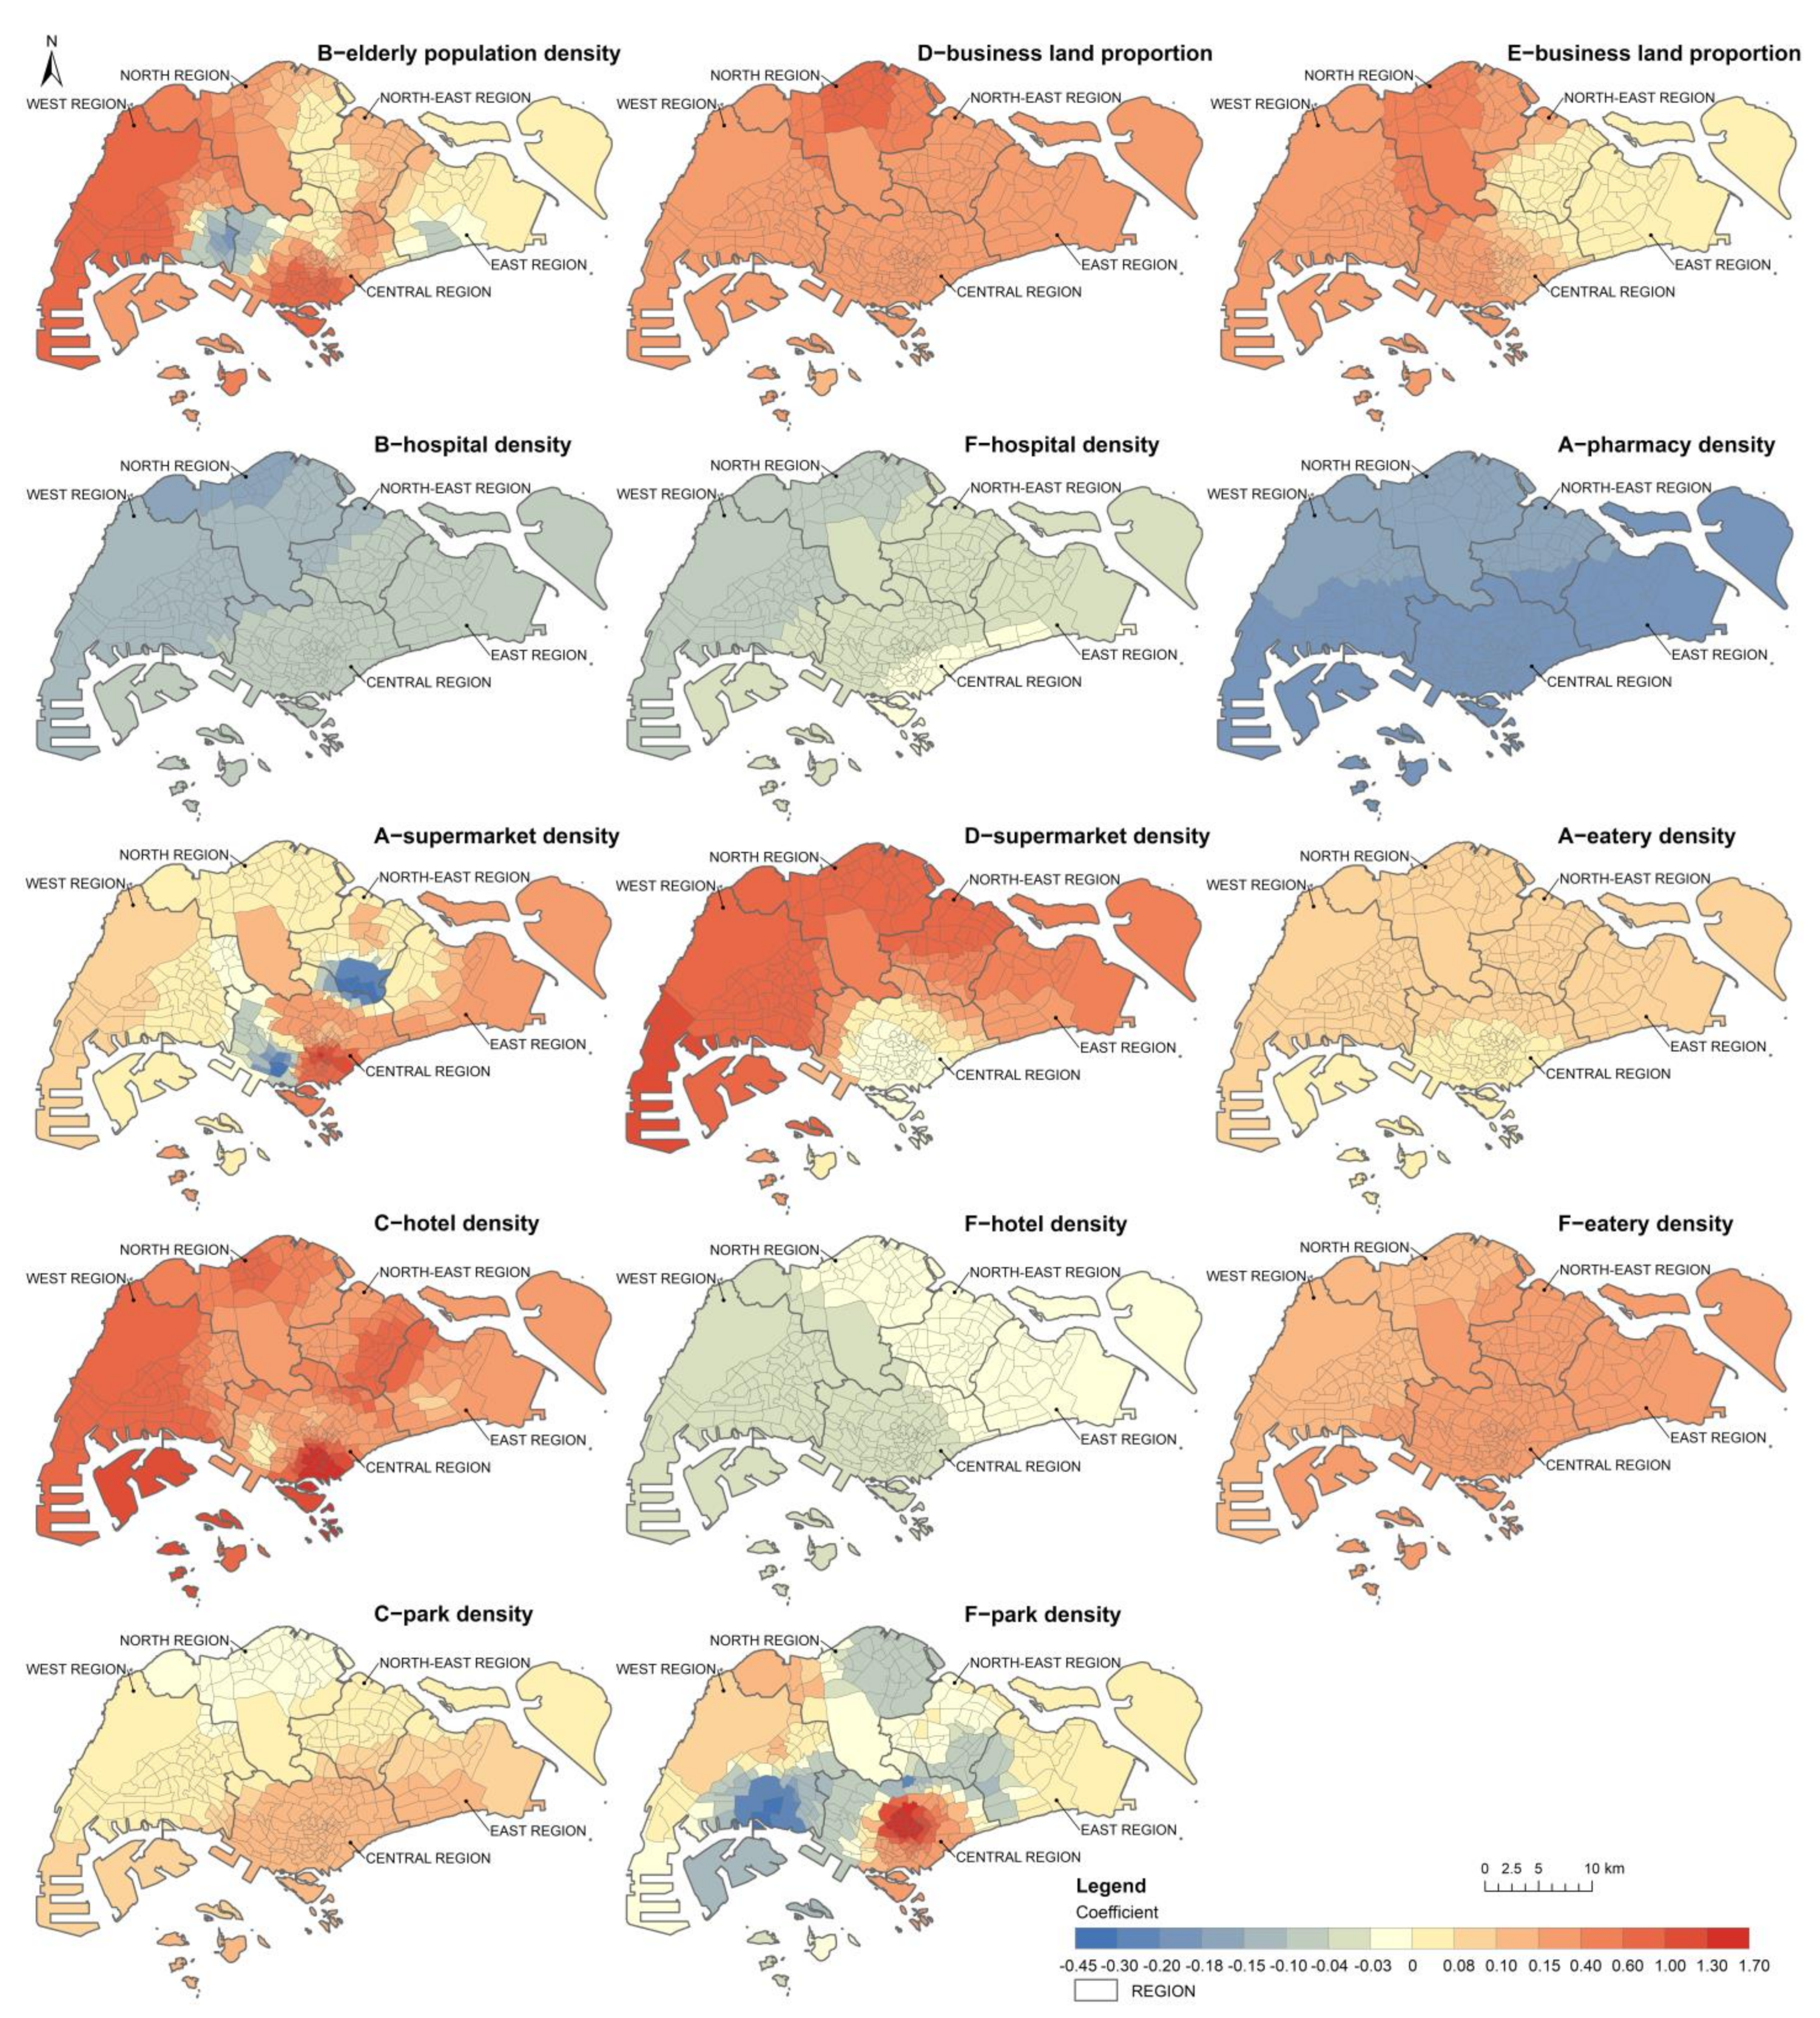
3.3. The Associations between Demographic and Built-Environment Factors with the COVID-19 Incidence Density

Table 3 illustrates the OLS model results over six phases, which investigated the associations between selected variables and the COVID-19 incidence density. In phase A, supermarket density and eatery density presented significantly positive correlations with higher incidence density, whereas pharmacy density presented a negative correlation. In phase B, the elderly population density was positively correlated with the incidence density, while hospital density was negatively correlated, indicating that increasing hospital density decreased the incidence density accordingly. Hotel density and park density had positive associations with the incidence density in phase C, whereas business land proportion and supermarket density had positive associations with the incidence density in phase D. In phase E, business land proportion had a positive association with the incidence density. In phase F, the density of eateries and parks correlated positively with incidence density, while density of hospitals and hotels correlated negatively with incidence density.
Following the OLS model, the MGWR model was utilized to assess the local spatial variation in the relationships with COVID-19 incidence density. To compare the model’s performance, the adjusted R2 and AICc were used. The higher the adjusted R2 of a regression model was, the greater its explanatory power, and the lower its AICc was, the better the fit with the observed data. The performance of the OLS and MGWR models over the six phases is provided in Table 4. The OLS model produced a relatively low adjusted R2 in each phase, ranging from 0.030 to 0.275, implying that the partial incidence density of COVID-19 in the six phases could not be adequately explained, possibly due to local changes yet to be captured. However, the results of the OLS model served as a baseline for the local models.
In comparison to the global model estimates, the MGWR model showed a better fit. According to the data in Table 4, the MGWR model improved the values of adjusted R2 in each phase; the MGWR model’s adjusted R2 was approximately two to three times that of the OLS model. In both models, the highest adjusted R2 was observed in phase C, and the lowest value was observed in phase E. In terms of AICc, all of the values in the MGWR model decreased significantly. Overall, after accounting for the factors of spatial nonstationarity, the MGWR model can better capture the spatial variations of relationships in the model.
The mapping coefficients of MGWR for the significant variables are shown in Figure 3, which intuitively reflected the difference in spatial associations between the different variables and COVID-19 incidence density. The elderly population density was an influential factor in explaining the variation in the incidence density of the west of the west region and the south of the central region in phase B, particularly in the Phillip and Raffles Place subzones. The influence of the business land proportion on the incidence density began to decline from phases D to E, which was especially noticeable in the east region and the northern part of the north region.
The coefficient of hospital density in phases B and F showed the same upward trend from southeast to northwest, whereas the coefficient of pharmacy density in phase A was relatively high throughout Singapore’s southern region. In general, the spatial difference between the coefficients of these two factors was not significant. In terms of the supermarket density, the areas with a higher positive correlation coefficient were concentrated in the southeast of the central region, whereas the negative areas were located in the west of the central region and the south of the northeast region. In phase D, the areas with high coefficients were distributed in the west region, as well as the northern part of the north region and the northeast region. From phases A to D, the positive association between supermarket density and COVID-19 incidence density extended from the southeast to the northwest.
In phase C, the hotel density coefficient range was positive, and the areas with higher coefficients were distributed in the south of the central region, the west of the west region, the north of the north region, and the east of the northeast region, indicating a strong positive association between hotel density and COVID-19 incidence density in these regions. However, the coefficient became negative in phase F, and the values in southwestern and southern Singapore were slightly higher than those in other regions. The association between eatery density and incidence density in phase F was significantly stronger than that in phase A, especially in the southern part of the study area. In phase C, the distribution of park density coefficients increased from north to south. However, there was a clear spatial difference in phase F: higher positive values were associated with higher incidence density in the middle of the central region, whereas in some areas, such as the south of the west region, lower negative values were associated with lower incidence density.
The results of the dominance analysis over six phases are shown in Table 5. Supermarket density, elderly population density, hotel density, and park density were the variables with the highest percentage contributions in phases A, B, C, and F, respectively, while the business land proportion had the highest percentage contribution in phases D and E. Except for elderly population density and park density, the contribution percentage of all other variables exceeded 50%, and the contribution percentage of hotel density reached 77.86%. According to the findings, these variables were the most important explanatory variables in each phase, implying that they were the dominant factors of spatial variation in COVID-19 incidence density in Singapore.
These results indicated that demographic and built-environment factors have significant associations with COVID-19 incidence density and that these associations can explain the spatial patterns at specific phases. Specifically, a higher elderly population density was associated with a significant increase in incidence density, which was consistent with findings in other studies [17,53]. This association only appeared in Singapore during phase B. One possible explanation was that many confirmed cases during this period were linked to social activities and gatherings for elderly people, as was the case for the SAFRA Jurong cluster [54].
In terms of the built-environment, the business land proportion, a related land use factor, highlighted its close relationship with the incidence density during the outbreak period of dormitory cases (phases D and E). Meanwhile, the associations between different types of urban facilities and incidence density demonstrated their different impacts on disease transmission. Pharmacy density and hospital density were negatively associated with the incidence density, implying that they may have played a role in slowing the spread of the virus. In the early stages of the pandemic, pharmacies provided basic medical resources, and their convenient location may provide self-care advice to individuals with particular minor diseases nearby, reducing the risk of infection when people visit or transport to hospitals. As a protective factor, hospital density had a significant impact only in some phases, while in other phases, especially during the outbreak period, when faced with a rapidly increasing number of infected people, medical resources may be insufficient to deal with the COVID-19 pandemic.
Eatery density and supermarket density were positively associated with incidence density, indicating that they may increase the possibility of COVID-19 transmission. A crowded and poorly ventilated closed environment may prolong the virus’s short-range aerosol transmission, especially in restaurants [55]. It should be noted that despite the implementation of Circuit Breaker, the influence of the supermarket remained significant, which could be attributed to residents’ panic hoarding and buying behavior after the government announced that the lockdown order would be implemented. The association between hotel density and incidence density was especially strong in phase C, which was related to the government’s implementation of the Stay-Home Notice (SHN) in cooperative hotels in late March to deal with a large number of imported cases. Interestingly, the association became negative in phase F, implying that hotels may have positive impact on reducing the risk of COVID-19 transmission. In terms of park density, previous research found that the odds of visiting green space in Singapore increased 31.9 percent from stage 0 (16 December 2019 to 2 February 2020) to stage 2 (9 March to 29 March 2020) [25], which could explain why park density emerged as a significant correlation factor in phase C. In phase F, the association between park density and incidence density was positive in some areas and negative in others, with significant spatial heterogeneity, indicating that parks have both positive effects on COVID-19 transmission, that is, they improve people’s health, and negative effects, that is, their high accessibility and the need for daily exercise may make them a potential cause of virus transmission.
Furthermore, the influence of these determinants on COVID-19 incidence density not only varied in space, but also played various roles at different phases in Singapore, indicating that the associations between these factors and incidence density were dynamic over space and time. This meant that there was temporal nonstationarity in the associations between demographic and built environment factors with COVID-19 transmission.

4. Discussion

COVID-19 has been spreading for more than a year, and many regions and countries are still experiencing serious outbreaks. Currently, the total number of cases in Singapore has reached 267,916, and the continuous emergence of new virus variants poses a greater challenge for pandemic control. This study, which investigated the spread of COVID-19 in Singapore from 23 January 2020 to 30 September 2020, aimed to explore its spatial patterns as well as the spatial-temporal changes in the associations between demographic and built-environment factors with COVID-19 transmission. It can provide information for specific countries’ and cities’ public health policies, as well as contribute new cases and knowledge to COVID-19’s research on space transmission.
The results showed that the spread of COVID-19 in Singapore mainly presented the characteristics of random pattern-clustered patterns alternating with time, which may be influenced by the intervention measures implemented in different phases. Meanwhile, the transmission mode, which was classified as imported and local transmission, was quite important in Singapore [56]. The results further showed that imported cases tended to be scattered, but local cases tended to be clustered. Generally, random diffusion and contagion played a major role in the early stages of the pandemic [57]; however, imported cases may increase the randomness of disease transmission, while also increasing the risk of local case outbreaks. For Singapore, some imported cases may be the cause for the large cluster outbreaks among foreign workers living in dormitories [58]. As a result, early control of imported cases is critical to preventing large-scale spread. Furthermore, different spatial hotspots have been observed at different periods, which may indicate a potential trend, that is, the infection always spreads from the prosperous central area (or urban area) to the remote areas (or rural areas).
The analysis of the associations between demographic and built-environment factors with COVID-19 transmission further indicates the key factors shaping the COVID-19 landscape in Singapore. Among the factors significantly related to the spread of COVID-19, supermarket density, elderly population density, hotel density, business land proportion, and park density were the most important influencing factors in different phases. Elderly population density, supermarket density, and park density were the factors that had been validated by the existing literature in other countries or regions, while business land proportion and hotel density may be specific factors affecting the spread of COVID-19 in Singapore. The majority of foreign workers live in purpose-built dormitories (PBDs) or dormitories converted from disused industrial sites. As a result of the large-scale infection of dormitory workers, the association between business land and the spread of COVID-19 became very significant. Meanwhile, hotels have received little attention for their role in COVID-19 transmission as isolation facilities for inbound travelers or close contacts, whereas our findings better captured the close spatial association between hotels and COVID-19 transmission. Notably, under the loose restrictive policy, the association between park density and COVID-19 transmission may exhibit more complicated patterns. Parks, as part of public green space, have a positive impact on improving people’s health. However, people’s behavior in visiting green spaces has changed as a result of the pandemic, and there is a greater demand for visiting green space [26], which may make green space a risk place for people to gather and spread diseases, thus having a negative impact on curbing the spread of the pandemic. In general, places with a high population density, particularly vulnerable people, such as elderly gatherings or crowded living environments for foreign workers, are more likely to generate clustered transmission patterns, whereas places with a high population mobility, such as supermarkets, eateries, and parks, are more likely to generate random transmission patterns. Additionally, a reasonable time division is the key to revealing these potential influencing factors.
This study is important because it was the first to use a long time series to investigate the driving factors of COVID-19 transmission in Singapore, and it also provided evidence that the associations between the driving factors and COVID-19 transmission are temporally nonstationary. Some studies have shown that the associations between sociodemographic and built-environment factors with the spread of COVID-19 vary across different waves [28]. Our findings further showed that the association between the same factor and the spread of COVID-19 could change over time. This change could be due to intervention measures or people’s behavioral changes in dealing with infection risks and policies, which make the association stronger or weaker, or it could be the transition from positive to negative association, as seen in this study’s association between hotel density and COVID-19 transmission, or in some hospitals with nosocomial infection.
This study provides some suggestions for formulating non-pharmaceutical interventions to control the spread of COVID-19. First, because the spatial patterns of imported cases differ from those of local cases, policymakers should implement targeted or combined measures for different transmission modes, such as implementing travel restrictions and social distance measures concurrently, to effectively prevent the local transmission chain caused by imported cases. Second, since the relationships between influencing factors and COVID-19 transmission change over time and space, policymakers should recognize that developing targeted interventions in certain periods and risk areas could improve the effectiveness of non-pharmaceutical interventions. For instance, when the lockdown plan is implemented, limiting supermarket population capacity and establishing emergency goods distribution centers could reduce the risk of infection caused by residents hoarding and buying daily necessities, and risk control should be implemented in restaurants, parks, and other places during the reopening period, which could help to adjust social distance measures and achieve dynamic management of specific areas. Meanwhile, our findings also call on policymakers to make efforts to reduce the impact of social inequality on vulnerable groups. Migrant workers’ living spaces are so overcrowded that they are unable to practice social distancing, and they may not receive equal medical care or social support, making them more vulnerable to the pandemic [59]. As a result, vulnerable people’s lives and well-being should be continuously improved to reduce the risk of future outbreaks of infectious diseases.
Nevertheless, this study has several limitations. Based on data availability, the variables considered in this study were limited; some key factors (e.g., socioeconomic factors, spatial structure of cities) may also play an important role in the spread of COVID-19, and the lack of appropriate data for these variables may pose some restrictions to our analysis. Thus, more factors should be considered in future research, as well as the influence of confounding factors such as age and race/ethnic distribution. Another limitation is that the relationship between the different types of cases and the influencing factors has not been fully determined, and different age groups’ use of certain services or places (such as medical services or parks) may result in differences in the correlation between age groups and some variables. Furthermore, the study was conducted at the subzone level, which was inevitably influenced by the modifiable areal unit problem (MAUP) when individual data were aggregated into area units. As a result, more accurate classification data and community or individual level data are needed for further investigation of the risk factors on a finer scale, which will aid in finely managing the risk of COVID-19 transmission.

5. Conclusions

This study investigated the spatial patterns of the COVID-19 pandemic in Singapore from 23 January to 30 September 2020, as well as the associations between demographic and built-environment factors with the spread of COVID-19. The results revealed that the spatial distribution of COVID-19 cases changed over time and primarily exhibited two kinds of patterns: random and clustered. Furthermore, the spatial patterns differed between imported and local cases, with imported cases having a random pattern and local cases having a clustered pattern. Meanwhile, among the variables considered in this study, supermarket density, elderly population density, hotel density, business land proportion, and park density were the most important factors influencing the spread of COVID-19 in Singapore, with business land proportion and hotel density being significant variables that have not been widely recognized in other countries or regions. The findings also implied that the associations between demographic and built-environment factors with COVID-19 transmission changed dynamically over time and that the spatial variability across subzones reflected different trends in COVID-19 incidence density in response to the selected influencing factors. This study is useful not only in developing and improving intervention strategies for certain areas and periods during the current pandemic, but also in preparing regions, countries, and cities to respond flexibly to future public health crises.

Supplementary Materials

The following supporting information can be downloaded at: https://www.mdpi.com/article/10.3390/ijgi11030152/s1, Table S1: The definition, descriptive statistics, and sources of the demographic and built-environment variables in Singapore, Table S2: Key events to determine the pandemic phases in this study.

Author Contributions

Conceptualization, Jianfang Ma, Haihong Zhu, and Lin Li; Data curation, Zhenwei Luo and Meihui Zhang; Investigation, Haihong Zhu and Peng Li; Methodology, Jianfang Ma and Lin Li; Software, Jianfang Ma; Validation, Chengcheng Liu and Feng Li; Writing—original draft, Jianfang Ma; Writing—review and editing, Lin Li. All authors have read and agreed to the published version of the manuscript.

Funding

This research was funded by the National Key R&D Program of China (2017YFB0503701).

Institutional Review Board Statement

Not applicable.

Informed Consent Statement

Not applicable.

Data Availability Statement

All data or materials used are public accessed as illustrated in the article.

Acknowledgments

The authors would like to thank the editors and the anonymous reviewers for their valuable comments and suggestions.

Conflicts of Interest

The authors declare no conflict of interest. The funders had no role in the design of the study; in the collection, analyses, or interpretation of data; in the writing of the manuscript, or in the decision to publish the results.

References

  1. World Health Organization. WHO Director-General’s Opening Remarks at the Media Briefing on COVID-19. Available online: https://www.who.int/director-general/speeches/detail/who-director-general-s-opening-remarks-at-the-media-briefing-on-covid-19---11-march-2020 (accessed on 31 December 2020).
  2. World Health Organization. Coronavirus Disease 2019 (COVID-19): Situation Report. Weekly Epidemiological Update on COVID-19—28 September 2021. Available online: https://www.who.int/publications/m/item/weekly-epidemiological-update-on-covid-19—28-september-2021 (accessed on 15 October 2021).
  3. Tian, H.; Liu, Y.; Li, Y.; Wu, C.-H.; Chen, B.; Kraemer, M.U.G.; Li, B.; Cai, J.; Xu, B.; Yang, Q.; et al. An investigation of transmission control measures during the first 50 days of the COVID-19 epidemic in China. Science 2020, 368, 638–642. [Google Scholar] [CrossRef] [PubMed] [Green Version]
  4. Carballada, A.M.; Balsa-Barreiro, J. Geospatial Analysis and Mapping Strategies for Fine-Grained and Detailed COVID-19 Data with GIS. ISPRS Int. J. Geo-Inf. 2021, 10, 602. [Google Scholar] [CrossRef]
  5. Franch-Pardo, I.; Napoletano, B.M.; Rosete-Verges, F.; Billa, L. Spatial analysis and GIS in the study of COVID-19. A review. Sci. Total Environ. 2020, 739, 140033. [Google Scholar] [CrossRef] [PubMed]
  6. Wang, J.; Du, D.; Wei, Y.; Yang, H. The development of COVID-19 in China: Spatial diffusion and geographical pattern. Geogr. Res. 2020, 39, 1450–1462. [Google Scholar]
  7. Huang, Z. Spatiotemporal Evolution Patterns of the COVID-19 Pandemic Using Space-Time Aggregation and Spatial Statistics: A Global Perspective. ISPRS Int. J. Geo-Inf. 2021, 10, 519. [Google Scholar] [CrossRef]
  8. Caprarelli, G.; Fletcher, S. A brief review of spatial analysis concepts and tools used for mapping, containment and risk modelling of infectious diseases and other illnesses. Parasitology 2014, 141, 581–601. [Google Scholar] [CrossRef]
  9. Scarpone, C.; Brinkmann, S.T.; Grosse, T.; Sonnenwald, D.; Fuchs, M.; Walker, B.B. A multimethod approach for county-scale geospatial analysis of emerging infectious diseases: A cross-sectional case study of COVID-19 incidence in Germany. Int. J. Health Geogr. 2020, 19, 32. [Google Scholar] [CrossRef]
  10. Kwok, K.O.; Lai, F.Y.L.; Wei, V.W.I.; Tsoi, M.T.F.; Wong, S.Y.S.; Tang, J.W.T. Comparing the impact of various interventions to control the spread of COVID-19 in twelve countries. J. Hosp. Infect. 2020, 106, 214–216. [Google Scholar] [CrossRef]
  11. Giuliani, D.; Dickson, M.M.; Espa, G.; Santi, F. Modelling and predicting the spatio-temporal spread of COVID-19 in Italy. BMC Infect. Dis. 2020, 20, 700. [Google Scholar] [CrossRef]
  12. Yang, W.; Deng, M.; Li, C.; Huang, J. Spatio-Temporal Patterns of the 2019-nCoV Epidemic at the County Level in Hubei Province, China. Int. J. Environ. Res. Public Health 2020, 17, 2563. [Google Scholar] [CrossRef] [Green Version]
  13. Chen, X.; Huang, Y.; Li, J.; Wang, S.; Pei, T. Clustering characteristics of COVID-19 cases and influencing factors in Chongqing Municipality. Prog. Geogr. 2020, 39, 11. [Google Scholar] [CrossRef]
  14. Sannigrahi, S.; Pilla, F.; Basu, B.; Basu, A.S.; Molter, A. Examining the association between socio-demographic composition and COVID-19 fatalities in the European region using spatial regression approach. Sust. Cities Soc. 2020, 62, 102418. [Google Scholar] [CrossRef]
  15. Zheng, A.; Wang, T.; Li, X. Spatiotemporal Characteristics and Risk Factors of the COVID-19 Pandemic in New York State: Implication of Future Policies. ISPRS Int. J. Geo-Inf. 2021, 10, 627. [Google Scholar] [CrossRef]
  16. Zhang, C.H.; Schwartz, G.G. Spatial Disparities in Coronavirus Incidence and Mortality in the United States: An Ecological Analysis as of May 2020. J. Rural Health 2020, 36, 433–445. [Google Scholar] [CrossRef]
  17. Mansour, S.; Al Kindi, A.; Al-Said, A.; Al-Said, A.; Atkinson, P. Sociodemographic determinants of COVID-19 incidence rates in Oman: Geospatial modelling using multiscale geographically weighted regression (MGWR). Sust. Cities Soc. 2021, 65, 102627. [Google Scholar] [CrossRef] [PubMed]
  18. Liu, J.; Hao, J.; Sun, Y.; Shi, Z. Network analysis of population flow among major cities and its influence on COVID-19 transmission in China. Cities 2021, 112, 103138. [Google Scholar] [CrossRef]
  19. Liu, Y.; He, Z.; Zhou, X. Space-Time Variation and Spatial Differentiation of COVID-19 Confirmed Cases in Hubei Province Based on Extended GWR. ISPRS Int. J. Geo-Inf. 2020, 9, 536. [Google Scholar] [CrossRef]
  20. Mollalo, A.; Vahedi, B.; Rivera, K.M. GIS-based spatial modeling of COVID-19 incidence rate in the continental United States. Sci. Total Environ. 2020, 728, 138884. [Google Scholar] [CrossRef] [PubMed]
  21. Kan, Z.; Kwan, M.-P.; Wong, M.S.; Huang, J.; Liu, D. Identifying the space-time patterns of COVID-19 risk and their associations with different built environment features in Hong Kong. Sci. Total Environ. 2021, 772, 145379. [Google Scholar] [CrossRef]
  22. You, H.; Wu, X.; Guo, X. Distribution of COVID-19 Morbidity Rate in Association with Social and Economic Factors in Wuhan, China: Implications for Urban Development. Int. J. Environ. Res. Public Health 2020, 17, 3417. [Google Scholar] [CrossRef] [PubMed]
  23. Li, X.; Zhou, L.; Jia, T.; Peng, R.; Fu, X.; Zou, Y. Associating COVID-19 Severity with Urban Factors: A Case Study of Wuhan. Int. J. Environ. Res. Public Health 2020, 17, 6712. [Google Scholar] [CrossRef] [PubMed]
  24. Huang, J.; Kwan, M.-P.; Kan, Z.; Wong, M.S.; Kwok, C.Y.T.; Yu, X. Investigating the Relationship between the Built Environment and Relative Risk of COVID-19 in Hong Kong. ISPRS Int. J. Geo-Inf. 2020, 9, 624. [Google Scholar] [CrossRef]
  25. Lu, Y.; Zhao, J.; Wu, X.; Lo, S.M. Escaping to nature during a pandemic: A natural experiment in Asian cities during the COVID-19 pandemic with big social media data. Sci. Total Environ. 2021, 777, 146092. [Google Scholar] [CrossRef]
  26. Pan, J.; Bardhan, R.; Jin, Y. Spatial distributive effects of public green space and COVID-19 infection in London. Urban For. Urban Green. 2021, 62, 127182. [Google Scholar] [CrossRef] [PubMed]
  27. Chang, S.; Pierson, E.; Koh, P.W.; Gerardin, J.; Redbird, B.; Grusky, D.; Leskovec, J. Mobility network models of COVID-19 explain inequities and inform reopening. Nature 2021, 589, 82–87. [Google Scholar] [CrossRef] [PubMed]
  28. Huang, J.; Kwan, M.-P.; Kan, Z. The superspreading places of COVID-19 and the associated built-environment and socio-demographic features: A study using a spatial network framework and individual-level activity data. Health Place 2021, 72, 102694. [Google Scholar] [CrossRef]
  29. Wang, L.; Zhang, S.; Yang, Z.; Zhao, Z.; Moudon, A.V.; Feng, H.; Liang, J.; Sun, W.; Cao, B. What county-level factors influence COVID-19 incidence in the United States? Findings from the first wave of the pandemic. Cities 2021, 118, 103396. [Google Scholar] [CrossRef]
  30. Wu, X.; Yin, J.; Li, C.; Xiang, H.; Lv, M.; Guo, Z. Natural and human environment interactively drive spread pattern of COVID-19: A city-level modeling study in China. Sci. Total Environ. 2021, 756, 143343. [Google Scholar] [CrossRef]
  31. Niehus, R.; De Salazar, P.M.; Taylor, A.R.; Lipsitch, M. Using observational data to quantify bias of traveller-derived COVID-19 prevalence estimates in Wuhan, China. Lancet Infect. Dis. 2020, 20, 803–808. [Google Scholar] [CrossRef]
  32. Anderson, R.M.; Heesterbeek, H.; Klinkenberg, D.; Hollingsworth, T.D. How will country-based mitigation measures influence the course of the COVID-19 epidemic? Lancet 2020, 395, 931–934. [Google Scholar] [CrossRef]
  33. Capano, G.; Howlett, M.; Jarvis, D.S.L.; Ramesh, M.; Goyal, N. Mobilizing Policy (In)Capacity to Fight COVID-19: Understanding Variations in State Responses. Policy Soc. 2020, 39, 285–308. [Google Scholar] [CrossRef]
  34. Koo, J.R.; Cook, A.R.; Park, M.; Sun, Y.; Sun, H.; Lim, J.T.; Tam, C.; Dickens, B.L. Interventions to mitigate early spread of SARS-CoV-2 in Singapore: A modelling study. Lancet Infect. Dis. 2020, 20, 678–688. [Google Scholar] [CrossRef] [Green Version]
  35. Tariq, A.; Lee, Y.; Roosa, K.; Blumberg, S.; Yan, P.; Ma, S.; Chowell, G. Real-time monitoring the transmission potential of COVID-19 in Singapore, March 2020. BMC Med. 2020, 18, 166. [Google Scholar] [CrossRef]
  36. Pung, R.; Chiew, C.J.; Young, B.E.; Chin, S.; Chen, M.I.C.; Clapham, H.E.; Cook, A.R.; Maurer-Stroh, S.; Toh, M.P.H.S.; Poh, C.; et al. Investigation of three clusters of COVID-19 in Singapore: Implications for surveillance and response measures. Lancet 2020, 395, 1039–1046. [Google Scholar] [CrossRef]
  37. Yi, H.; Ng, S.T.; Farwin, A.; Low, P.T.A.; Chang, C.M.; Lim, J. Health equity considerations in COVID-19: Geospatial network analysis of the COVID-19 outbreak in the migrant population in Singapore. J. Travel Med. 2020, 28, taaa159. [Google Scholar] [CrossRef]
  38. Jiang, P.; Fu, X.; Fan, Y.V.; Klemes, J.J.; Chen, P.; Ma, S.; Zhang, W. Spatial-temporal potential exposure risk analytics and urban sustainability impacts related to COVID-19 mitigation: A perspective from car mobility behaviour. J. Clean Prod. 2021, 279, 123673. [Google Scholar] [CrossRef] [PubMed]
  39. Woo, J.J. Policy capacity and Singapore’s response to the COVID-19 pandemic. Policy Soc. 2020, 39, 345–362. [Google Scholar] [CrossRef]
  40. Government Technology Agency of Singapore. Master Plan 2019 Region Boundary (No Sea). Available online: https://geo.data.gov.sg/ura-mp19-region-no-sea-pl/2019/12/23/kml/ura-mp19-region-no-sea-pl.kml (accessed on 1 December 2020).
  41. Government Technology Agency of Singapore. Master Plan 2019 Subzone Boundary (No Sea). Available online: https://geo.data.gov.sg/ura-mp19-subzone-no-sea-pl/2019/12/23/kml/ura-mp19-subzone-no-sea-pl.kml (accessed on 1 December 2020).
  42. Ministry of Health, Singapore. Updates on COVID-19 (Coronavirus Disease 2019) Local Situation. Available online: https://www.moh.gov.sg/covid-19 (accessed on 15 November 2020).
  43. Getis, A.; Ord, J.K. The Analysis of Spatial Association by Use of Distance Statistics. Geogr. Anal. 1992, 24, 189–206. [Google Scholar] [CrossRef]
  44. Moran, P.A.P. The Interpretation of Statistical Maps. J. R. Stat. Soc. Ser. B Methodol. 1948, 10, 243–251. [Google Scholar] [CrossRef]
  45. Fotheringham, A.S.; Yang, W.; Kang, W. Multiscale Geographically Weighted Regression (MGWR). Ann. Am. Assoc. Geogr. 2017, 107, 1247–1265. [Google Scholar] [CrossRef]
  46. Oshan, T.M.; Smith, J.P.; Fotheringham, A.S. Targeting the spatial context of obesity determinants via multiscale geographically weighted regression. Int. J. Health Geogr. 2020, 19, 11. [Google Scholar] [CrossRef]
  47. Iyanda, A.E.; Adeleke, R.; Lu, Y.; Osayomi, T.; Adaralegbe, A.; Lasode, M.; Chima-Adaralegbe, N.J.; Osundina, A.M. A retrospective cross-national examination of COVID-19 outbreak in 175 countries: A multiscale geographically weighted regression analysis (January 11-June 28, 2020). J. Infect. Public Health 2020, 13, 1438–1445. [Google Scholar] [CrossRef] [PubMed]
  48. Tonidandel, S.; LeBreton, J.M. Relative Importance Analysis: A Useful Supplement to Regression Analysis. J. Bus. Psychol. 2011, 26, 1–9. [Google Scholar] [CrossRef]
  49. Oshan, T.M.; Li, Z.; Kang, W.; Wolf, L.J.; Fotheringham, A.S. mgwr: A Python Implementation of Multiscale Geographically Weighted Regression for Investigating Process Spatial Heterogeneity and Scale. ISPRS Int. J. Geo-Inf. 2019, 8, 269. [Google Scholar] [CrossRef] [Green Version]
  50. Ministry of Health, Singapore. End of Circuit Breaker, Phased Approach to Resuming Activities Safely. Available online: https://www.moh.gov.sg/news-highlights/details/end-of-circuit-breaker-phased-approach-to-resuming-activities-safely (accessed on 20 May 2020).
  51. Thomas, H.; Angrist, N.; Cameron-Blake, E.; Hallas, L.; Kira, B.; Majumdar, S.; Petherick, A.; Phillips, T.; Tatlow, H.; Webster, S. Oxford COVID-19 Government Response Tracker. Available online: https://www.bsg.ox.ac.uk/research/research-projects/coronavirus-government-response-tracker (accessed on 25 December 2020).
  52. Aral, N.; Bakir, H. Spatiotemporal Analysis of COVID-19 in Turkey. Sustain. Cities Soc. 2022, 76, 103421. [Google Scholar] [CrossRef]
  53. Li, S.; Ma, S.; Zhang, J. Association of built environment attributes with the spread of COVID-19 at its initial stage in China. Sustain. Cities Soc. 2021, 67, 102752. [Google Scholar] [CrossRef] [PubMed]
  54. Ministry of Health, Singapore. Additional precautionary measures to protect our seniors. Available online: https://www.moh.gov.sg/news-highlights/details/additional-precautionary-measures-to-protect-our-seniors (accessed on 20 May 2020).
  55. Li, Y.; Qian, H.; Hang, J.; Chen, X.; Hong, L.; Liang, P.; Li, J.; Xiao, S.; Wei, J.; Liu, L.; et al. Evidence for probable aerosol transmission of SARS-CoV-2 in a poorly ventilated restaurant. medRxiv 2020. [Google Scholar] [CrossRef] [Green Version]
  56. Mamode Khan, N.; Bakouch, H.S.; Soobhug, A.D.; Scotto, M.G. Insights on the trend of the Novel Coronavirus 2019 series in some Small Island Developing States: A Thinning-based Modelling Approach. Alex. Eng. J. 2021, 60, 2535–2550. [Google Scholar] [CrossRef]
  57. Roques, L.; Bonnefon, O.; Baudrot, V.; Soubeyrand, S.; Berestycki, H. A parsimonious approach for spatial transmission and heterogeneity in the COVID-19 propagation. R. Soc. Open Sci. 2020, 7, 201382. [Google Scholar] [CrossRef]
  58. Yeoh, E.K.; Chong, K.C.; Chiew, C.J.; Lee, V.J.; Ng, C.W.; Hashimoto, H.; Kwon, S.; Wang, W.; Chau, N.N.S.; Yam, C.H.K.; et al. Assessing the impact of non-pharmaceutical interventions on the transmissibility and severity of COVID-19 during the first five months in the Western Pacific Region. One Health 2021, 12, 100213. [Google Scholar] [CrossRef]
  59. Fu, X.; Zhai, W. Examining the spatial and temporal relationship between social vulnerability and stay-at-home behaviors in New York City during the COVID-19 pandemic. Sustain. Cities Soc. 2021, 67, 102757. [Google Scholar] [CrossRef] [PubMed]
Figure 1. The six phases of the COVID-19 outbreak in Singapore from 23 January to 30 September 2020.
Ijgi 11 00152 g001
Figure 2. Hot spot analysis of COVID-19 cases in Singapore over the six phases. The (AF) refer to the six phases in this study.
Ijgi 11 00152 g002
Figure 3. Spatial distribution of the local coefficients of the elderly population density, business land proportion, hospital density, pharmacy density, supermarket density, hotel density, eatery density, and park density in different phases. The capital letters in each map title refer to one of the six phases in this study; for example, A refers to phase A.
Ijgi 11 00152 g003
Table 1. Global Moran’s I values of the distribution of COVID-19 cases over the six phases.
IndexPhase APhase BPhase CPhase DPhase EPhase F
Moran’s I−0.0080.077−0.0120.2020.075−0.007
p value0.4540.0180.4300.0010.0260.359
Z score−0.1092.924−0.3356.4702.586−0.157
PatternsRandomClusteredRandomClusteredClusteredRandom
Table 2. Global Moran’s I values of the local and imported cases in phases A, B, and C.
IndexPhase APhase BPhase C
ImportedLocalImportedLocalImported
Moran’s I−0.0080.089−0.001−0.015−0.037
p value0.4130.0040.3630.3470.128
Z score−0.1243.6670.067−0.533−1.075
PatternsRandomClusteredRandomRandomRandom
Table 3. Coefficients of the global OLS model over the six phases.
VariablesPhase APhase BPhase CPhase DPhase EPhase F
Elderly population (65+) density 0.002 0.290 ***−0.018−0.094 −0.061 0.041
Commercial land proportion−0.127 0.088 −0.172−0.034 −0.026 0.139
Business land proportion−0.031 0.0000.0030.257 ***0.198 *** 0.072
Hospital density −0.058−0.184 * −0.0070.0640.007−0.314 ***
School density−0.108 0.111 0.027−0.112−0.049 0.020
Pharmacy density−0.311 ***−0.031 0.014−0.031 −0.015 0.021
Supermarket density0.409 ***0.1140.0050.217 **0.134 0.058
Hotel density0.0550.1180.624 ***0.010−0.008−0.200 **
Eatery density0.270 **0.165−0.072−0.016−0.0390.317 ***
Park density0.008−0.0160.127 *0.1000.0390.269 ***
Note: * p < 0.05, ** p < 0.01, *** p < 0.001.
Table 4. Adjusted R2 and AICc values of the OLS and MGWR models over the six phases.
PhasesOLSMGWR
Adjusted R2AICc Adjusted R2AICc
A0.158899.80.366828.7
B0.149903.40.289868.6
C0.275850.30.651635.4
D0.085927.50.261871.1
E0.030946.90.076939.5
F0.190887.00.512742.9
Table 5. The contribution percentage and rank of each factor over the six phases. The contribution percentage (%) is the percentage of each factor’s total average contribution value to the model’s variance, and the rank is the order of relative importance of each factor, as expressed by the numbers in brackets.
VariablesPhase APhase BPhase CPhase DPhase EPhase F
Elderly population (65+) density 2.34 (7)37.45 (1)0.47 (7)10.55 (4)9.3 (2)1.28 (8)
Commercial land proportion2.49 (6)5.17 (6)12.07 (2)0.44 (10)1.01 (9)6.77 (5)
Business land proportion0.81 (9)2.81 (8)0.45 (8)55.98 (1)64.23 (1)1.26 (9)
Hospital density 4.75 (4)4.96 (7)1.68 (4)1.36 (7)3.21 (5)11.4 (3)
School density2.5 (5)16.29 (2)0.33 (9)12.04 (3)8.38 (4)0.63 (10)
Pharmacy density12.01 (3)2.19 (9)0.51 (6)1.73 (6)1.55 (6)8.74 (4)
Supermarket density52.46 (1)13.96 (3)0.2 (10)13.79 (2)9.14 (3)5.01 (7)
Hotel density1.37 (8)11.06 (4)77.86 (1)0.53 (9)1.03 (8)5.91 (6)
Eatery density20.47 (2)5.33 (5)1.44 (5)1.04 (8)1.24 (7)19.2 (2)
Park density0.8 (10)0.77 (10)4.97 (3)2.54 (5)0.91 (10)39.78 (1)
Publisher’s Note: MDPI stays neutral with regard to jurisdictional claims in published maps and institutional affiliations.

