Article

Nominal Land Valuation with Best-Worst Method Using Geographic Information System: A Case of Atakum, Samsun

1
Department of Geomatics Engineering, Institute of Graduate Studies, Ondokuz Mayis University, Samsun 55270, Turkey
2
Department of Geomatics Engineering, Faculty of Engineering, Ondokuz Mayis University, Samsun 55270, Turkey
*
Author to whom correspondence should be addressed.
ISPRS Int. J. Geo-Inf. 2022, 11(4), 213; https://doi.org/10.3390/ijgi11040213
Submission received: 5 February 2022 / Revised: 7 March 2022 / Accepted: 15 March 2022 / Published: 22 March 2022

Abstract

:
Land valuation can be used in various areas, such as taxation, property acquisition, rental, expropriation, urban regeneration, and land readjustment. As a result, determining the value of land accurately by considering multiple criteria to eliminate the impact of subjectivity on the value of land is important. Nominal valuation is a statistical method for determining land values based on multiple criteria. In nominal valuation, criteria can be managed, analyzed, and integrated using Geographic Information Systems (GIS). This study produced a land value map using a nominal valuation method based on multiple criteria. The main criteria and sub-criteria have been determined according to the previous studies. Criteria weights were determined using the Best-Worst Method (BWM), which is one of the Multi-Criteria Decision-Making methods. A nominal land value map of the Atakum district of Samsun was produced by integrating criteria maps using GIS and compared with a value map based on current land sales.

1. Introduction

The human population is increasing worldwide as well as the urban population [1]. Urbanization worldwide is expanding to meet the demands of an ever-increasing population, making real estate knowledge valuable. The value of real estate should be included in real estate management for successful use of real estate and to undertake planning, project design, and investment decisions [2]. Real estate and its value are important.
Real estate valuation is the process of estimating the value of a property using technical knowledge and considering its characteristics in light of prevailing economic conditions [2,3,4]. Determining the value of real estate is critical for various tasks, including taxation, expropriation, privatization, assurance, land registry and cadaster fees, land readjustment, and urban transformation. With the increasing economic development of countries and the increasing complexity of evaluation, more accurate appraisals are becoming increasingly important [2,3,4,5,6]. Real estate appraisal is frequently regarded as a disorganized, unregulated process that lacks any legal framework and is far from scientific or objective. This is most likely because this procedure is based on subjective views that are not subjected to any control or inspection to maintain consistency and equality [7,8].
Traditional methods of real estate valuation, allow legal, physical, and market parameters to be compared directly, but every real estate is different. Therefore, to consider the difference, an alternative method is required [9,10,11,12]. Traditional methods for calculating the value of a property, including a comparison, income, and cost approach, could be sufficient. However, when valuing several properties, commonly known as mass valuation, such conventional methods are mostly insufficient. Advanced methods, such as modern methods (fuzzy logic, artificial intelligence, specialized systems, evolutionary algorithms, and artificial neural networks), and statistical methods (multiple regression, hedonic and nominal) have been applied to mass value applications such as real estate taxation [3,7,12,13,14,15]. The nominal valuation method remains one of the most used methods for land evaluation, particularly on a large scale. The factors that influence real estate value must be understood to create a mathematical model. However, the criteria are numerous and vary according to location, even the place where people live and their lifestyles can impact the model developed for mass valuation [2,13,15].
Nominal valuation is a method that generates calculated parametric scores of weighted parameters that influence real estate values. This method uses scientific approaches to generate a distribution of land values as parametric quantities without requiring the market value [5,6,11,12,13,16,17,18]. Nominal land value is determined from a large amount of spatial data that may be handled and integrated using Geographical Information Systems (GIS). GIS can combine spatially related data to provide decision support and has been applied to real estate land valuation [14,16,17,19].
The Best-Worst Method (BWM) is a relatively new weighting method that uses pairwise comparisons to generate criteria weights. The BWM avoids the inconsistency problem that occurs during pairwise comparisons by only executing 2n-3 comparisons [20]. Energy, supply chain management, transportation, manufacturing, education, investment, performance evaluation, aviation industry, communication, healthcare, finance, technology, and tourism are just a few examples of real-world challenges where the BWM has been used [21,22,23,24,25,26,27,28]. This method compensates for incompatibility, which is a shortcoming of methods based on pairwise comparisons (e.g., Analytic Hierarchy Process-AHP). Furthermore, it considerably decreases the number of pairwise comparisons by only performing reference comparisons. The BWM has been utilized to establish the weights and ranks of alternatives in numerous domains due to its simplicity, the clear understanding of the range of evaluations to be undertaken by the decision-maker before conducting a comparison, and the elimination of potential bias from the decision-maker when undertaking pairwise comparisons [20]. According to the best knowledge of the authors, few studies exist [16,29] in the literature that combined BWM and GIS in nominal land valuation; these studies focused on the effects of resolution differences on the nominal values.
This study aims to estimate the nominal land value of the Atakum district of Samsun, Turkey, using BWM with GIS as a decision tool and compare it with a value map based on current land sales.

2. Methodology

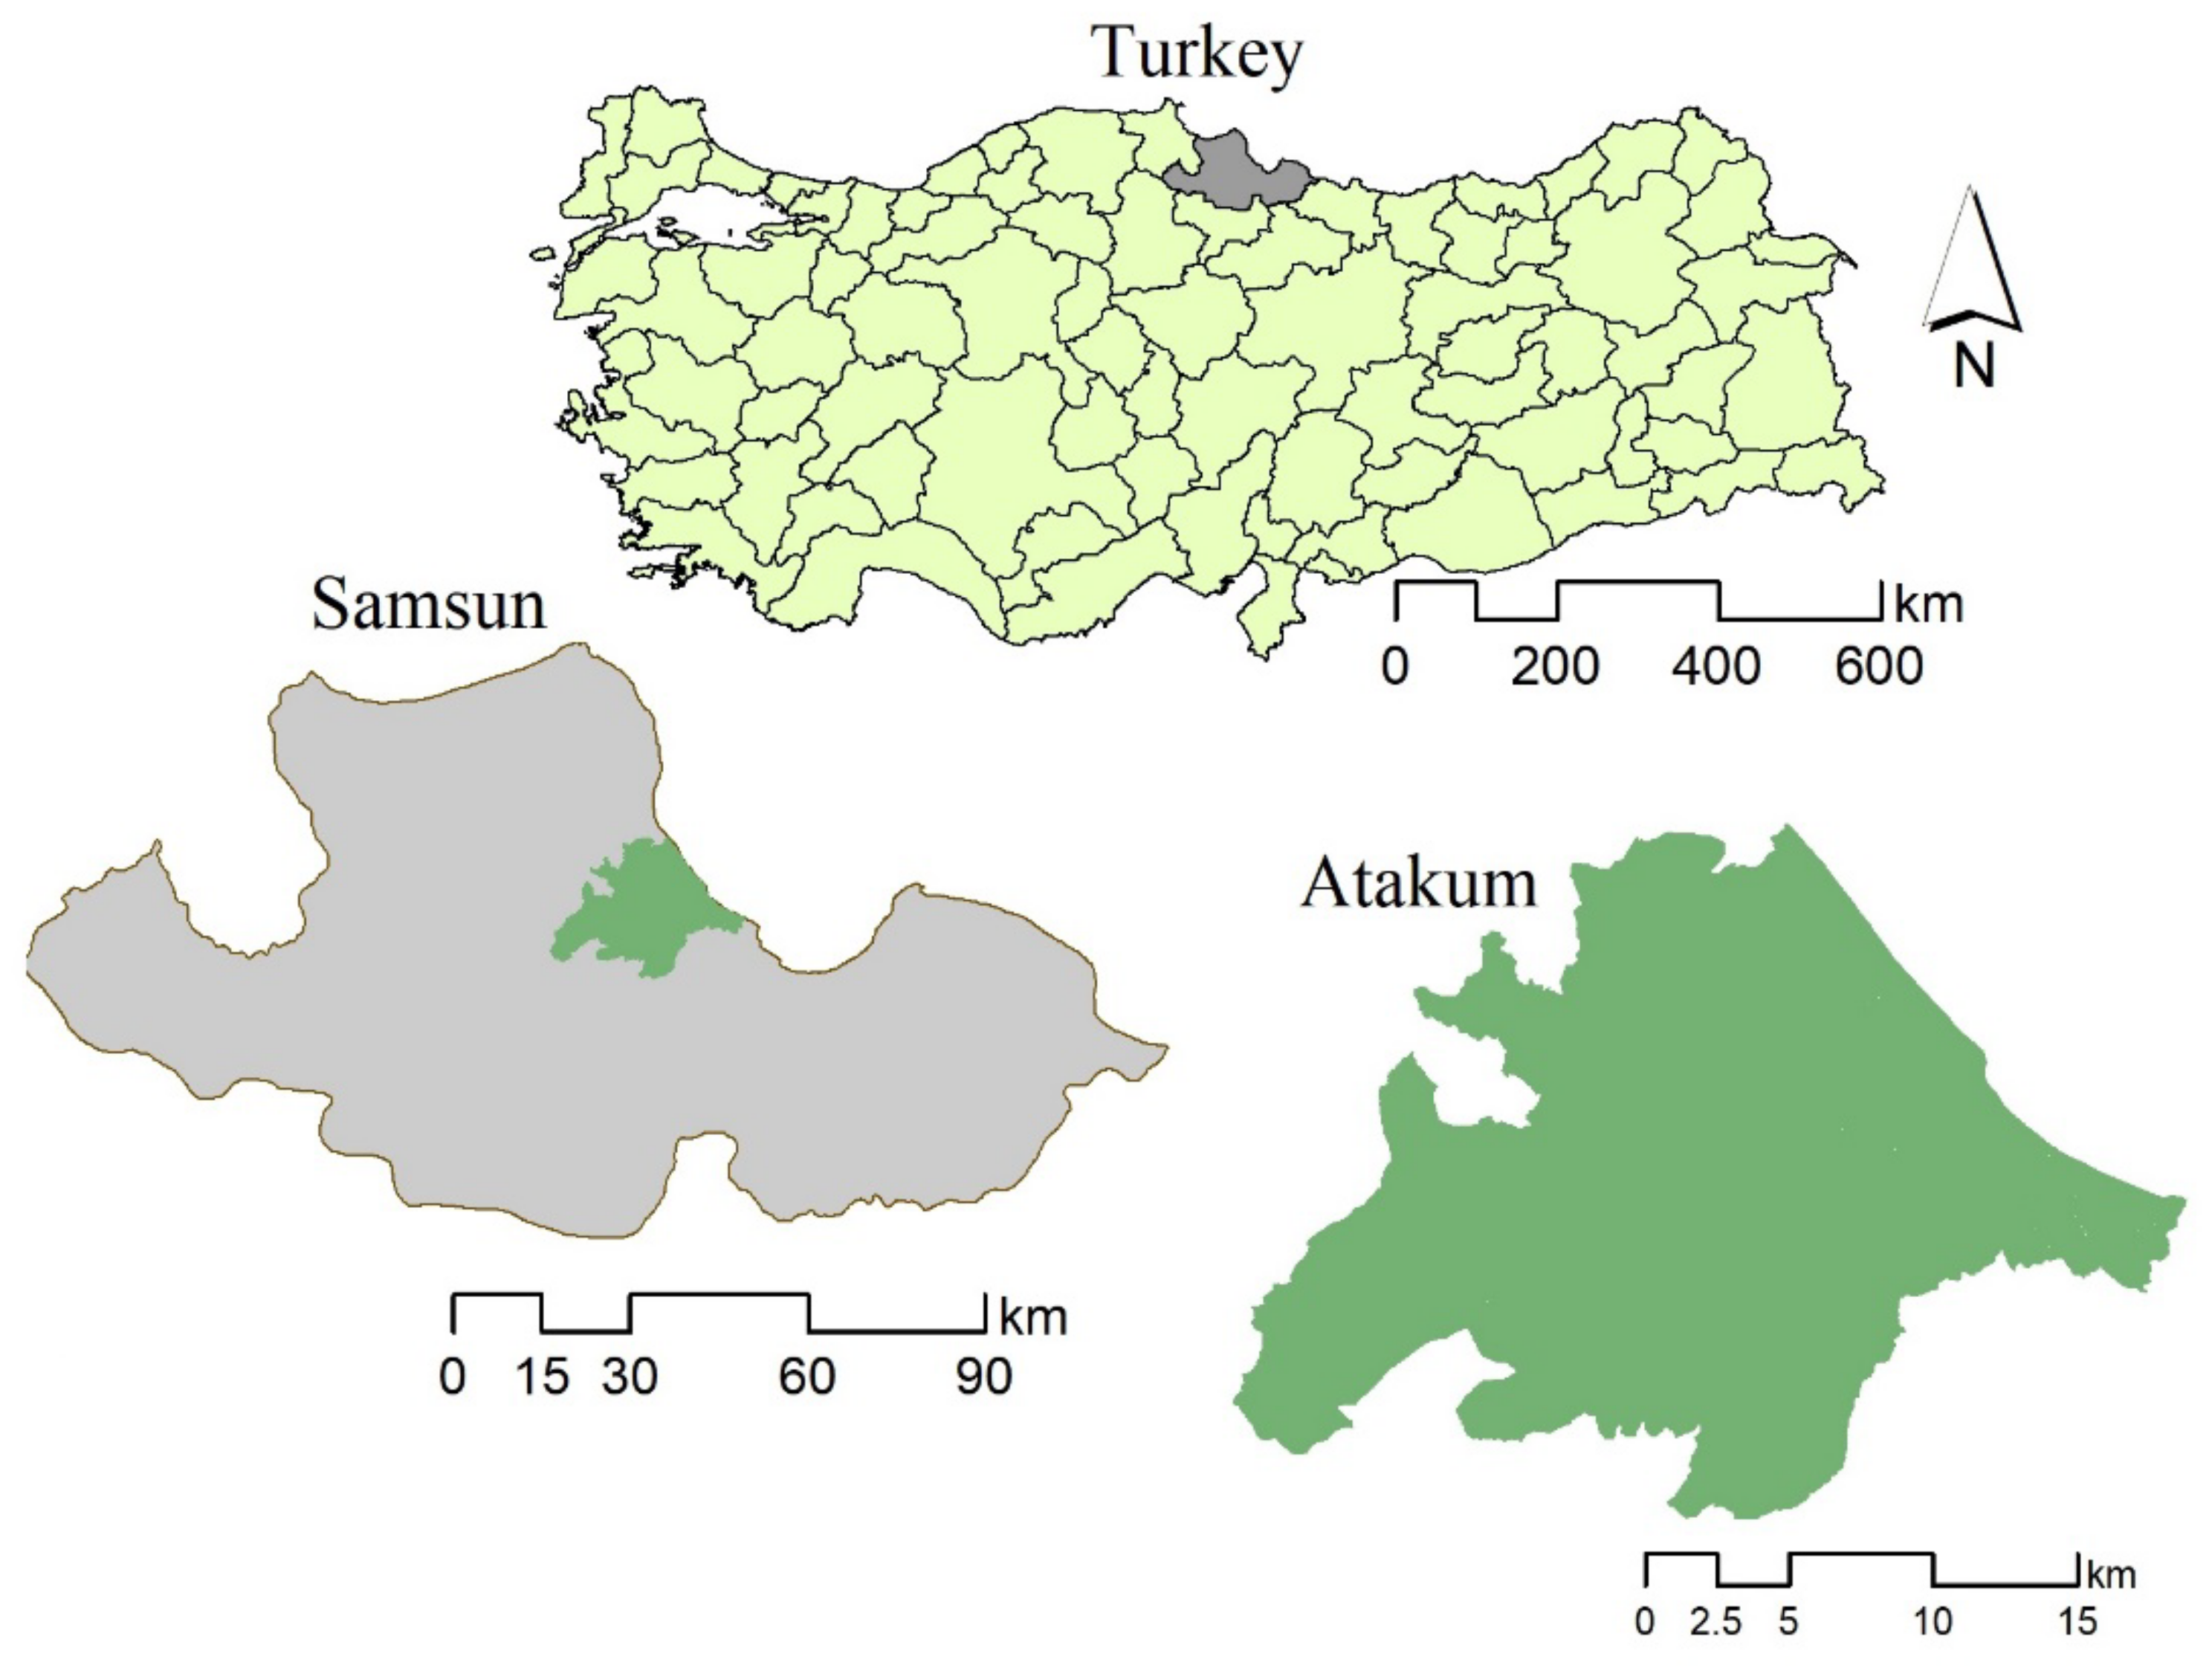
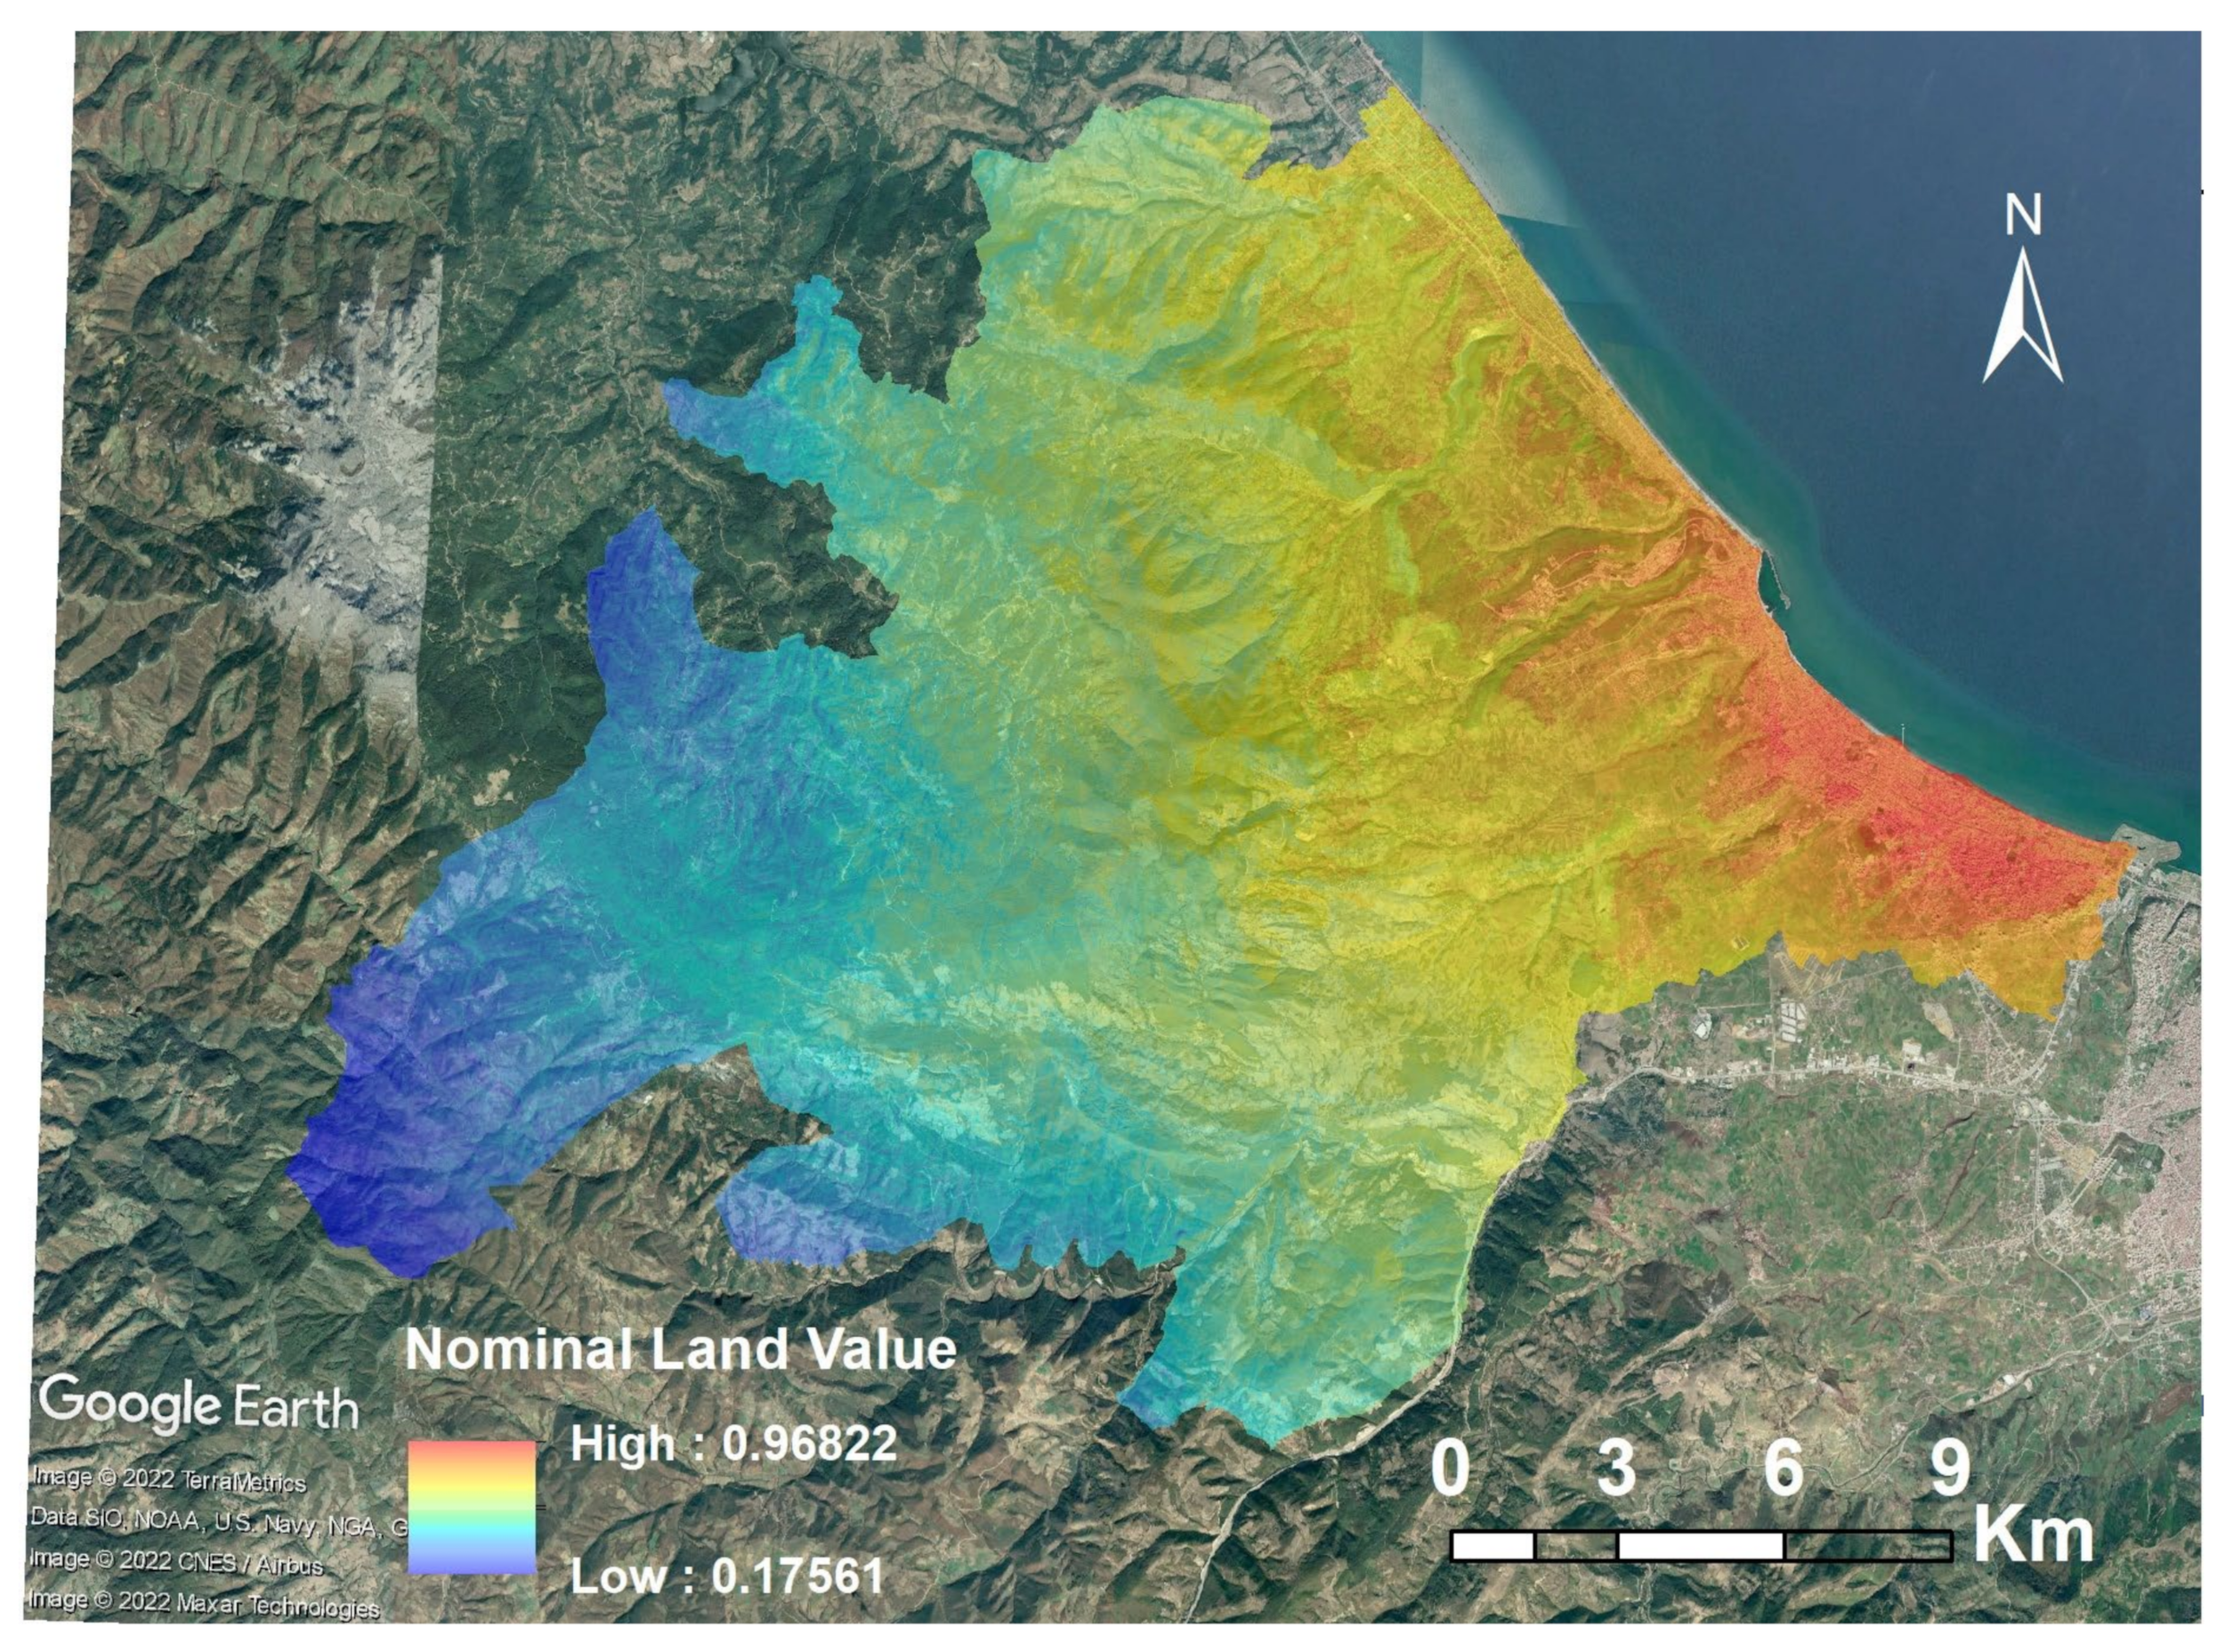
2.1. Location of the Study Area
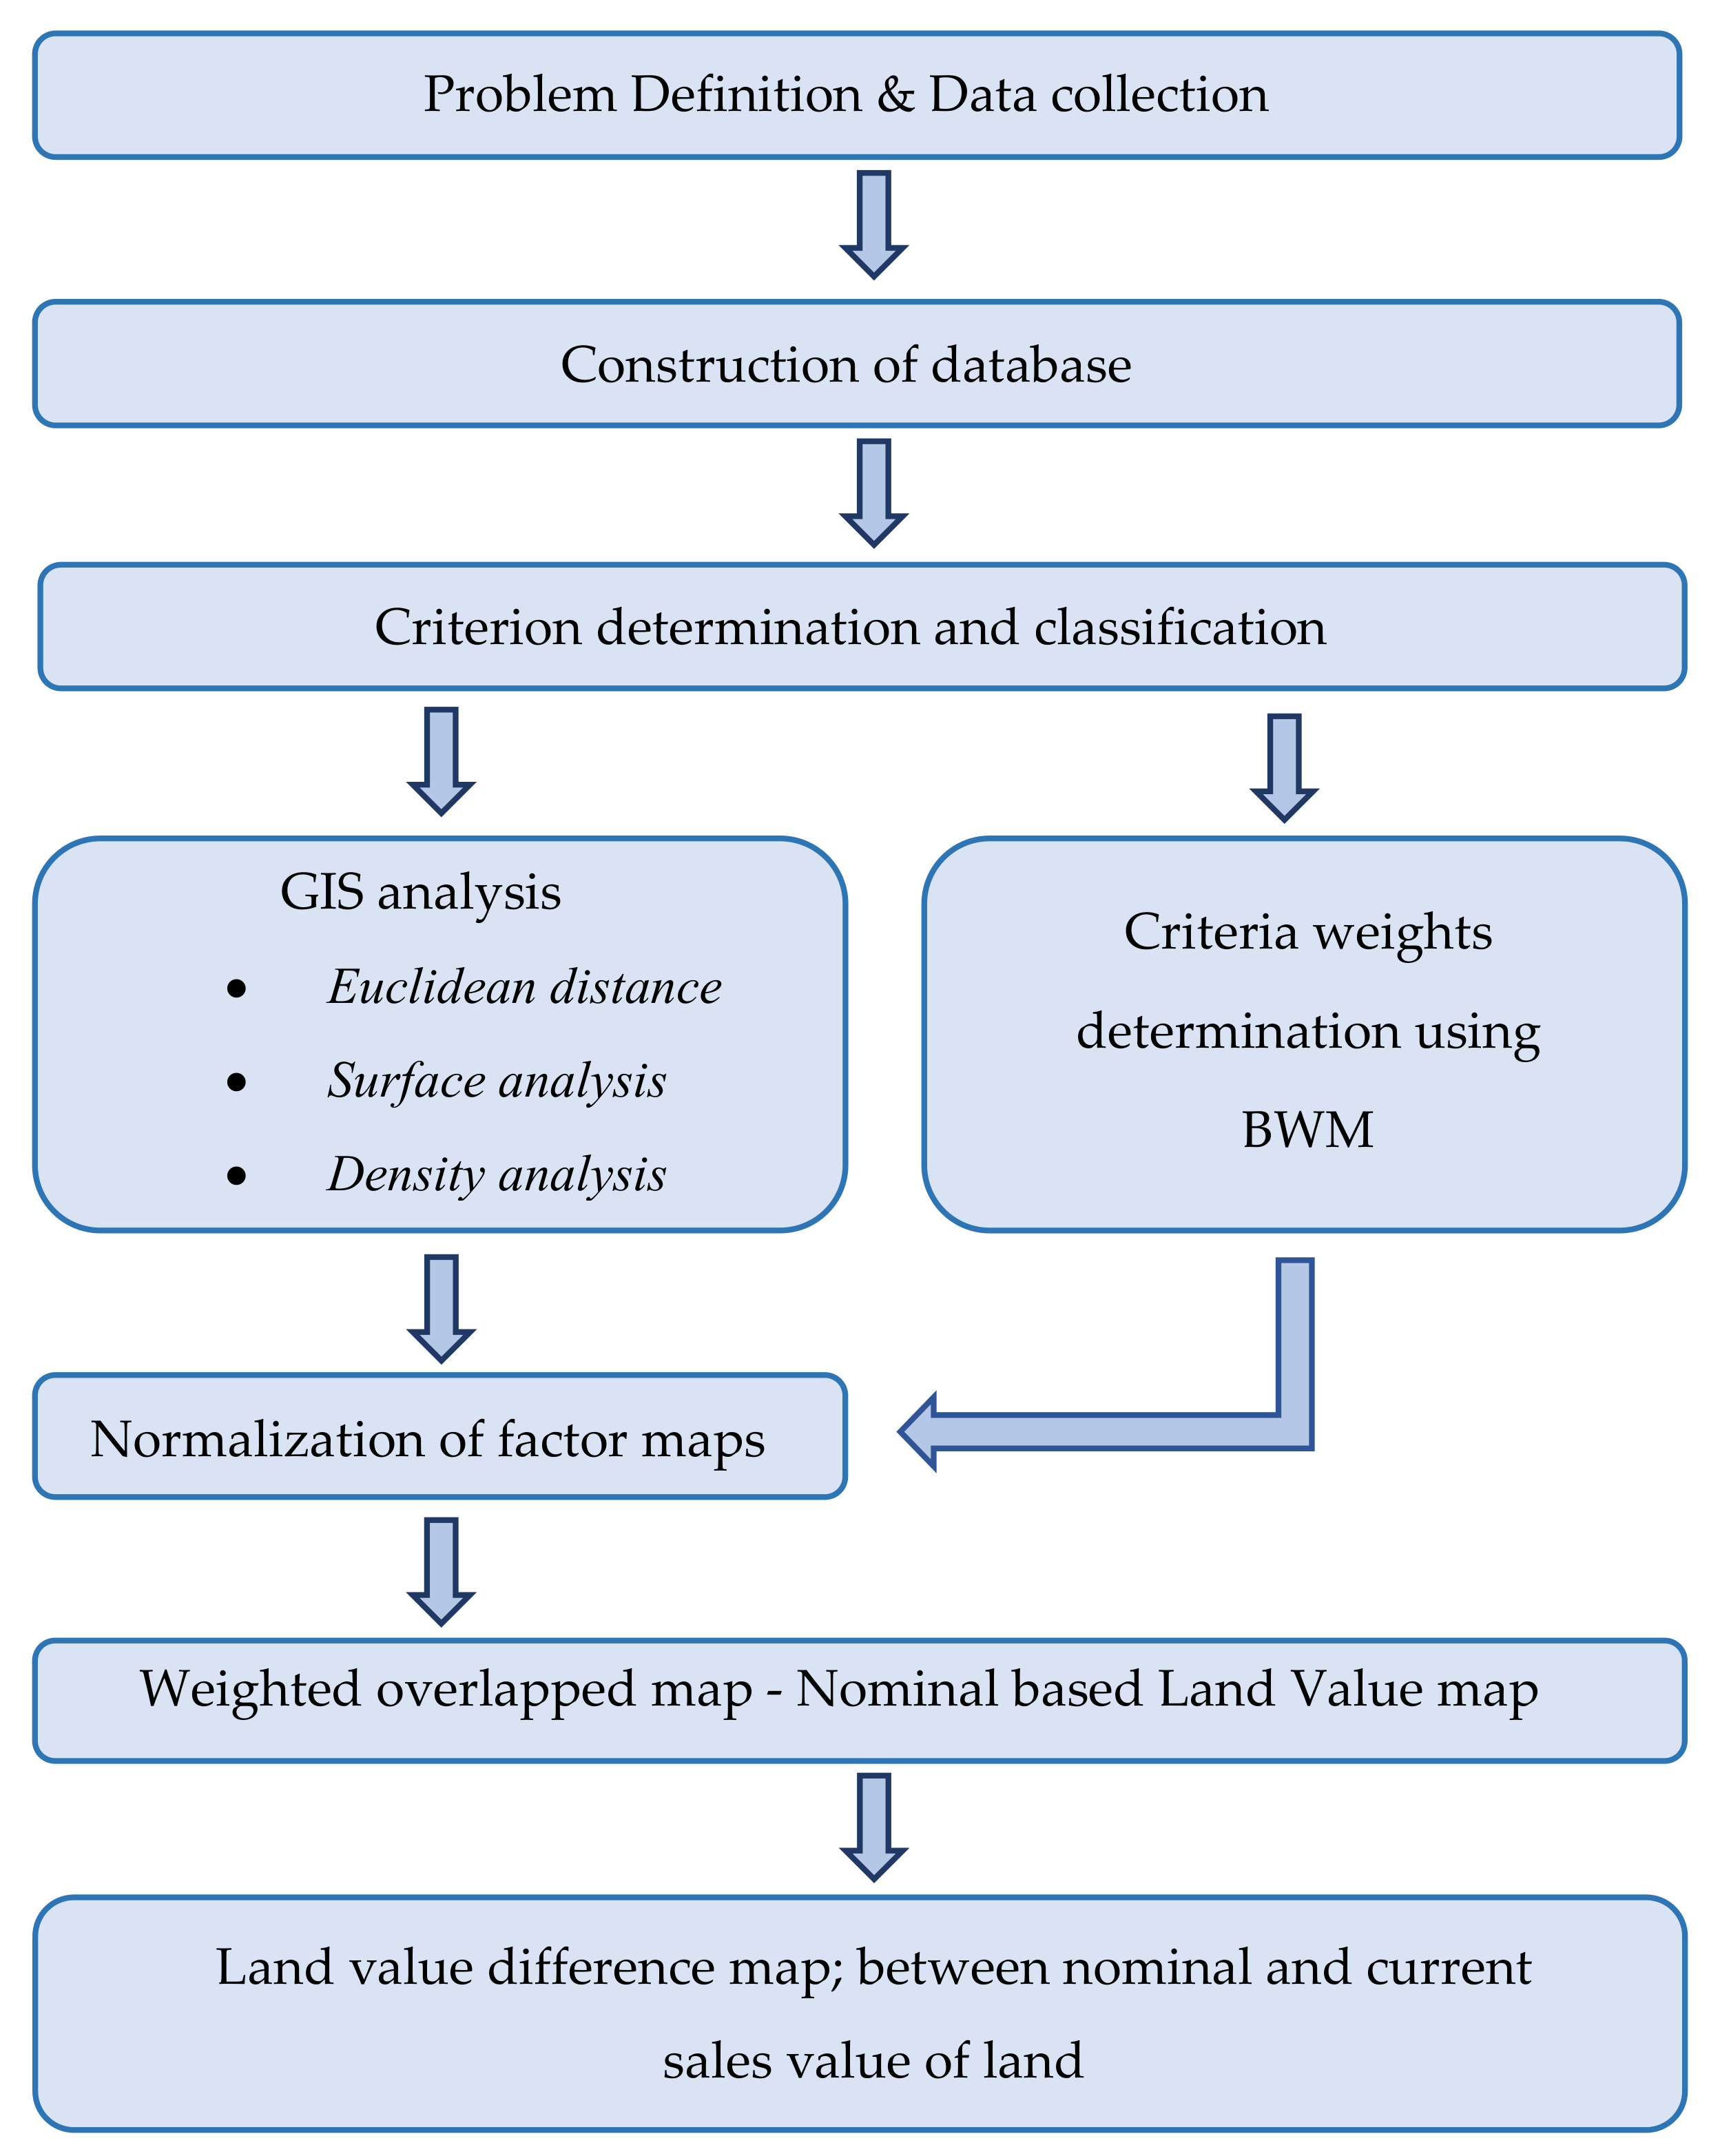
The Atakum district of Samsun city is used as the study area. Atakum is located on the Black Sea coast of Turkey (Figure 1) and had a population of 238,702 in 2021 [30]. Many reasons can be mentioned for the study area and the main ones are that it has had an annual growth of 5.7% for the last 5 years and has the highest population growth rate in Samsun city [30], with 10,607 dwellings being sold in 2019, it was listed as the 23rd highest district for residential sales of the 923 districts of Turkey in 2019 [31]. Therefore, real estate valuation is a very important issue in this region.

2.2. Method

Data were collected from multiple sources, including USGS Earth Explorer (Digital Elevation Model—DEM), Google Earth satellite images, and the Atakum district zoning plan. A handheld GNSS receiver was used to collect and correct spatial data such as railway stations, bus stops, parks, schools, etc. Current sales value data obtained from local real estate offices. Secondary data has been processed in the GIS environment and the nominal method used for land valuation. The nominal method calculates parametric scores for weighted parameters that influence real estate values. This method uses scientific approaches to generate a distribution of land values as parametric quantities without requiring the market value [12,16,17]. Equation (1) shows the nominal method being used for real estate valuation [6,12].
V i = S i j = 1 k f j i W j
where V: Total nominal Value, S: Parcel Area, f: Criterion value, W: Criterion weight, and K: Total number of factors.
Criteria were classified into three main criteria and fifteen sub-criteria. GIS analysis was carried out, including the Euclidean distance, surface, and density calculations. Each criterion was weighted based on its impact on land value using BWM. The nominal land value map was produced using the weighted sum of the normalized criteria maps. Then a difference map was produced using the nominal land value map and the normalized current land sales value map of the study area. We tried to investigate how the nominal land value map based on selected criteria, similar to the value map produced based on current land sales. The general workflow is illustrated in Figure 2.

2.3. Determination of Criteria

Many criteria affect the value of the land. One of the most important is personal preference, as different criteria have a different effect on people. In addition, proximity to institutes, amenities, transport, social facilities, and organizations have a significant impact both positively and negatively on the value of the land. The location of the land is also an important factor affecting its value. Many factors that affect the value of land have been identified and investigated, considering aspects such environmental status of the area (near to the sea or not, etc.). The most common factors previously considered in the literature are given in Table 1.
The impact of the factors differs in different studies due to the locational condition, personal feeling, and surface condition of the region. According to the previous studies and the reality of the current study area, the factors that affect the nominal value of land for this study are shown in Table 2 and explained in Table 3.

2.4. Determination of Weight of the Criteria

Many criteria affect the value of real estate; however, each has a different weight and it is important to determine the value. BWM has been used to determine the weights for the criteria and sub-criteria selected from the literature. In the current study, expert opinions were used for weight determination of the criteria. BWM is one of the most effective methods for determining the weights of alternatives and criteria in multi-criteria decision-making (MCDM) problems [27]. The decision-maker first determines the best (e.g., most desirable, most important) and worst (e.g., least desirable, least important) criteria, after which the best criterion is compared to the other criteria, and the other criteria are compared to the worst criterion. The steps of BWM can then be used to compute the weights of the criteria as follows. [27].
Step 1. Identify a set of decision criteria. In this step, the decision-maker identifies n criteria c 1 ,   c 2 ,   ,   c n that will be used to make a decision.
Step 2. Determine the best (most important) and the worst (least important) criteria.
Step 3. Assign a preference to the best criterion between 1 and 9, compared to the other criteria. The resulting best-to-others (BO) vector would be
A B = a B 1 , a B 2 ,   a B n
where a B j indicates the preference of the most important criterion B over criterion j. It is clear that a B B = 1 .
Step 4. Assign a preference to the least important criterion between 1 and 9, compared to the criteria. The resulting others-to-worst (OW) vector would be:
A W = a 1 W , a 2 W ,   , a n W T
where a j W indicates the preference of the criterion j over the least important criterion W. Note, a   W W = 1 .
Step 5. Find the optimal weights ( W 1 * , W 2 * ,   ,   W n * ) for the criteria.
The optimal weights and consistency of the factors are calculated as Equation (2) [26,27,29].
Min ξ L such that
W B a B j W j ξ L ,   f o r   a l l   j W j a j W   W W ξ L ,   f o r   a l l   j j W j = 1 W j 0 ,   f o r   a l l   j
where
  • a B j : preference for the best criterion over criterion j
  • a j W : preference for the worst criterion over criterion j
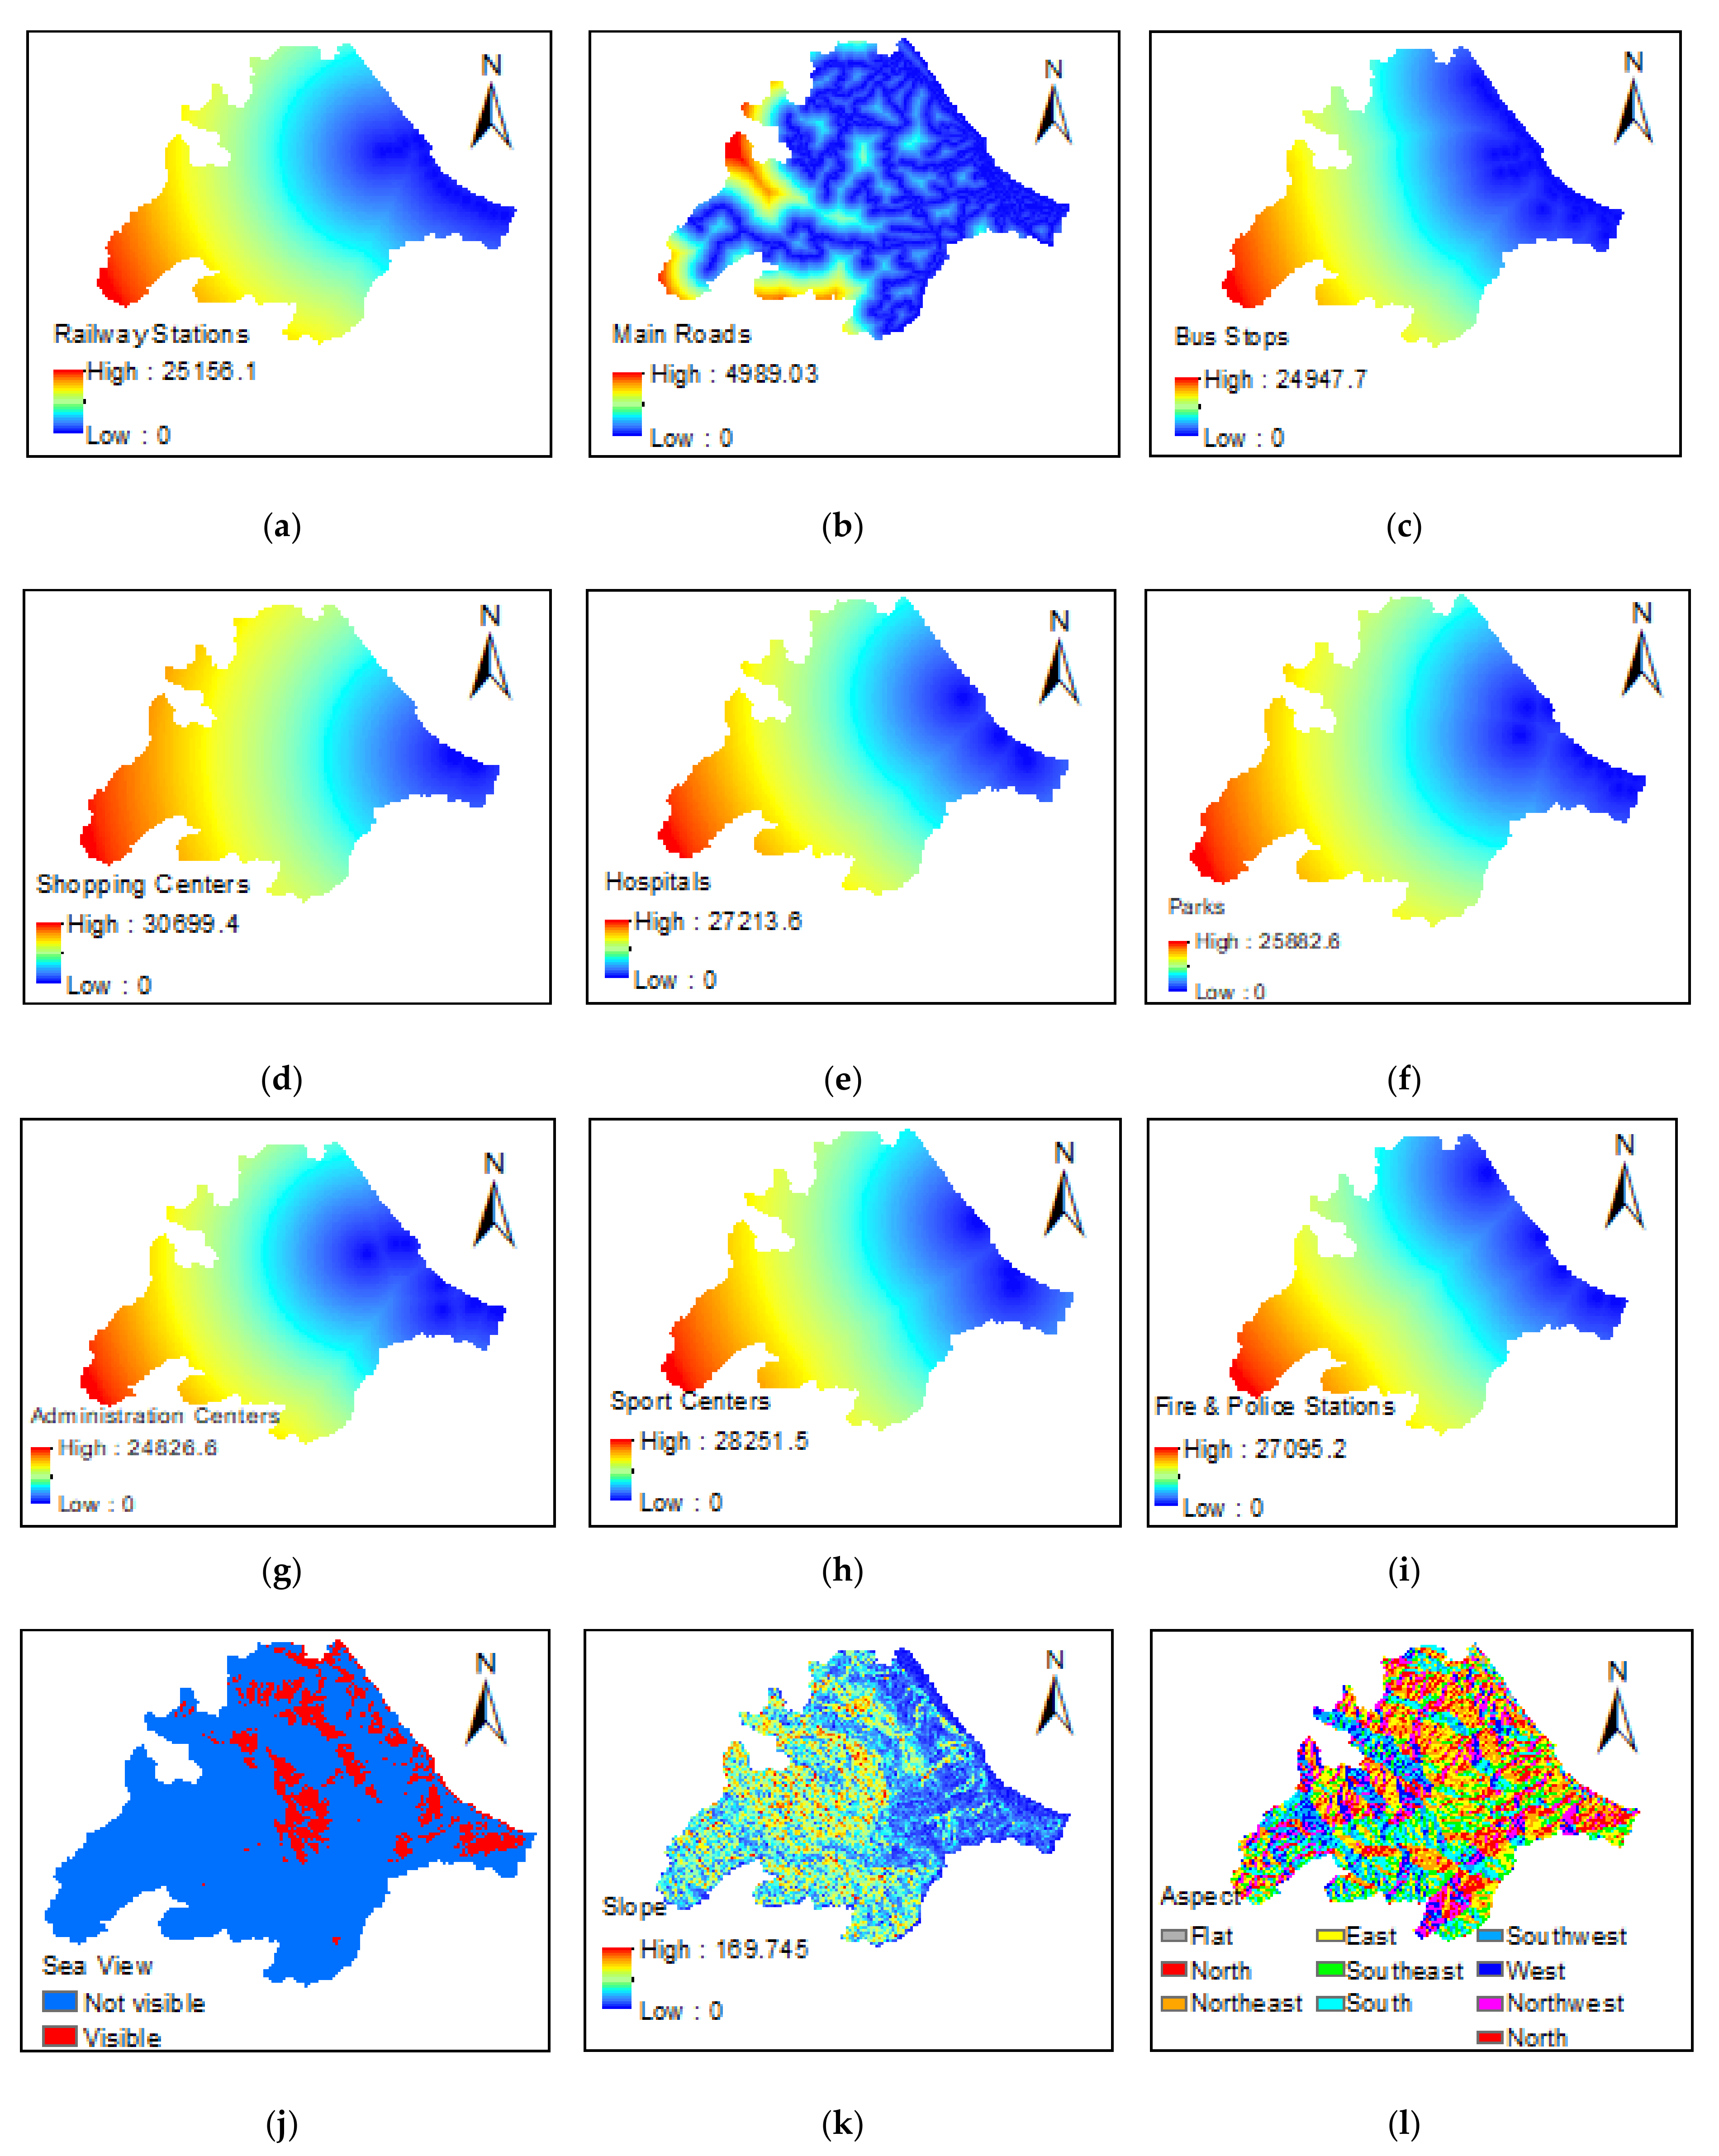
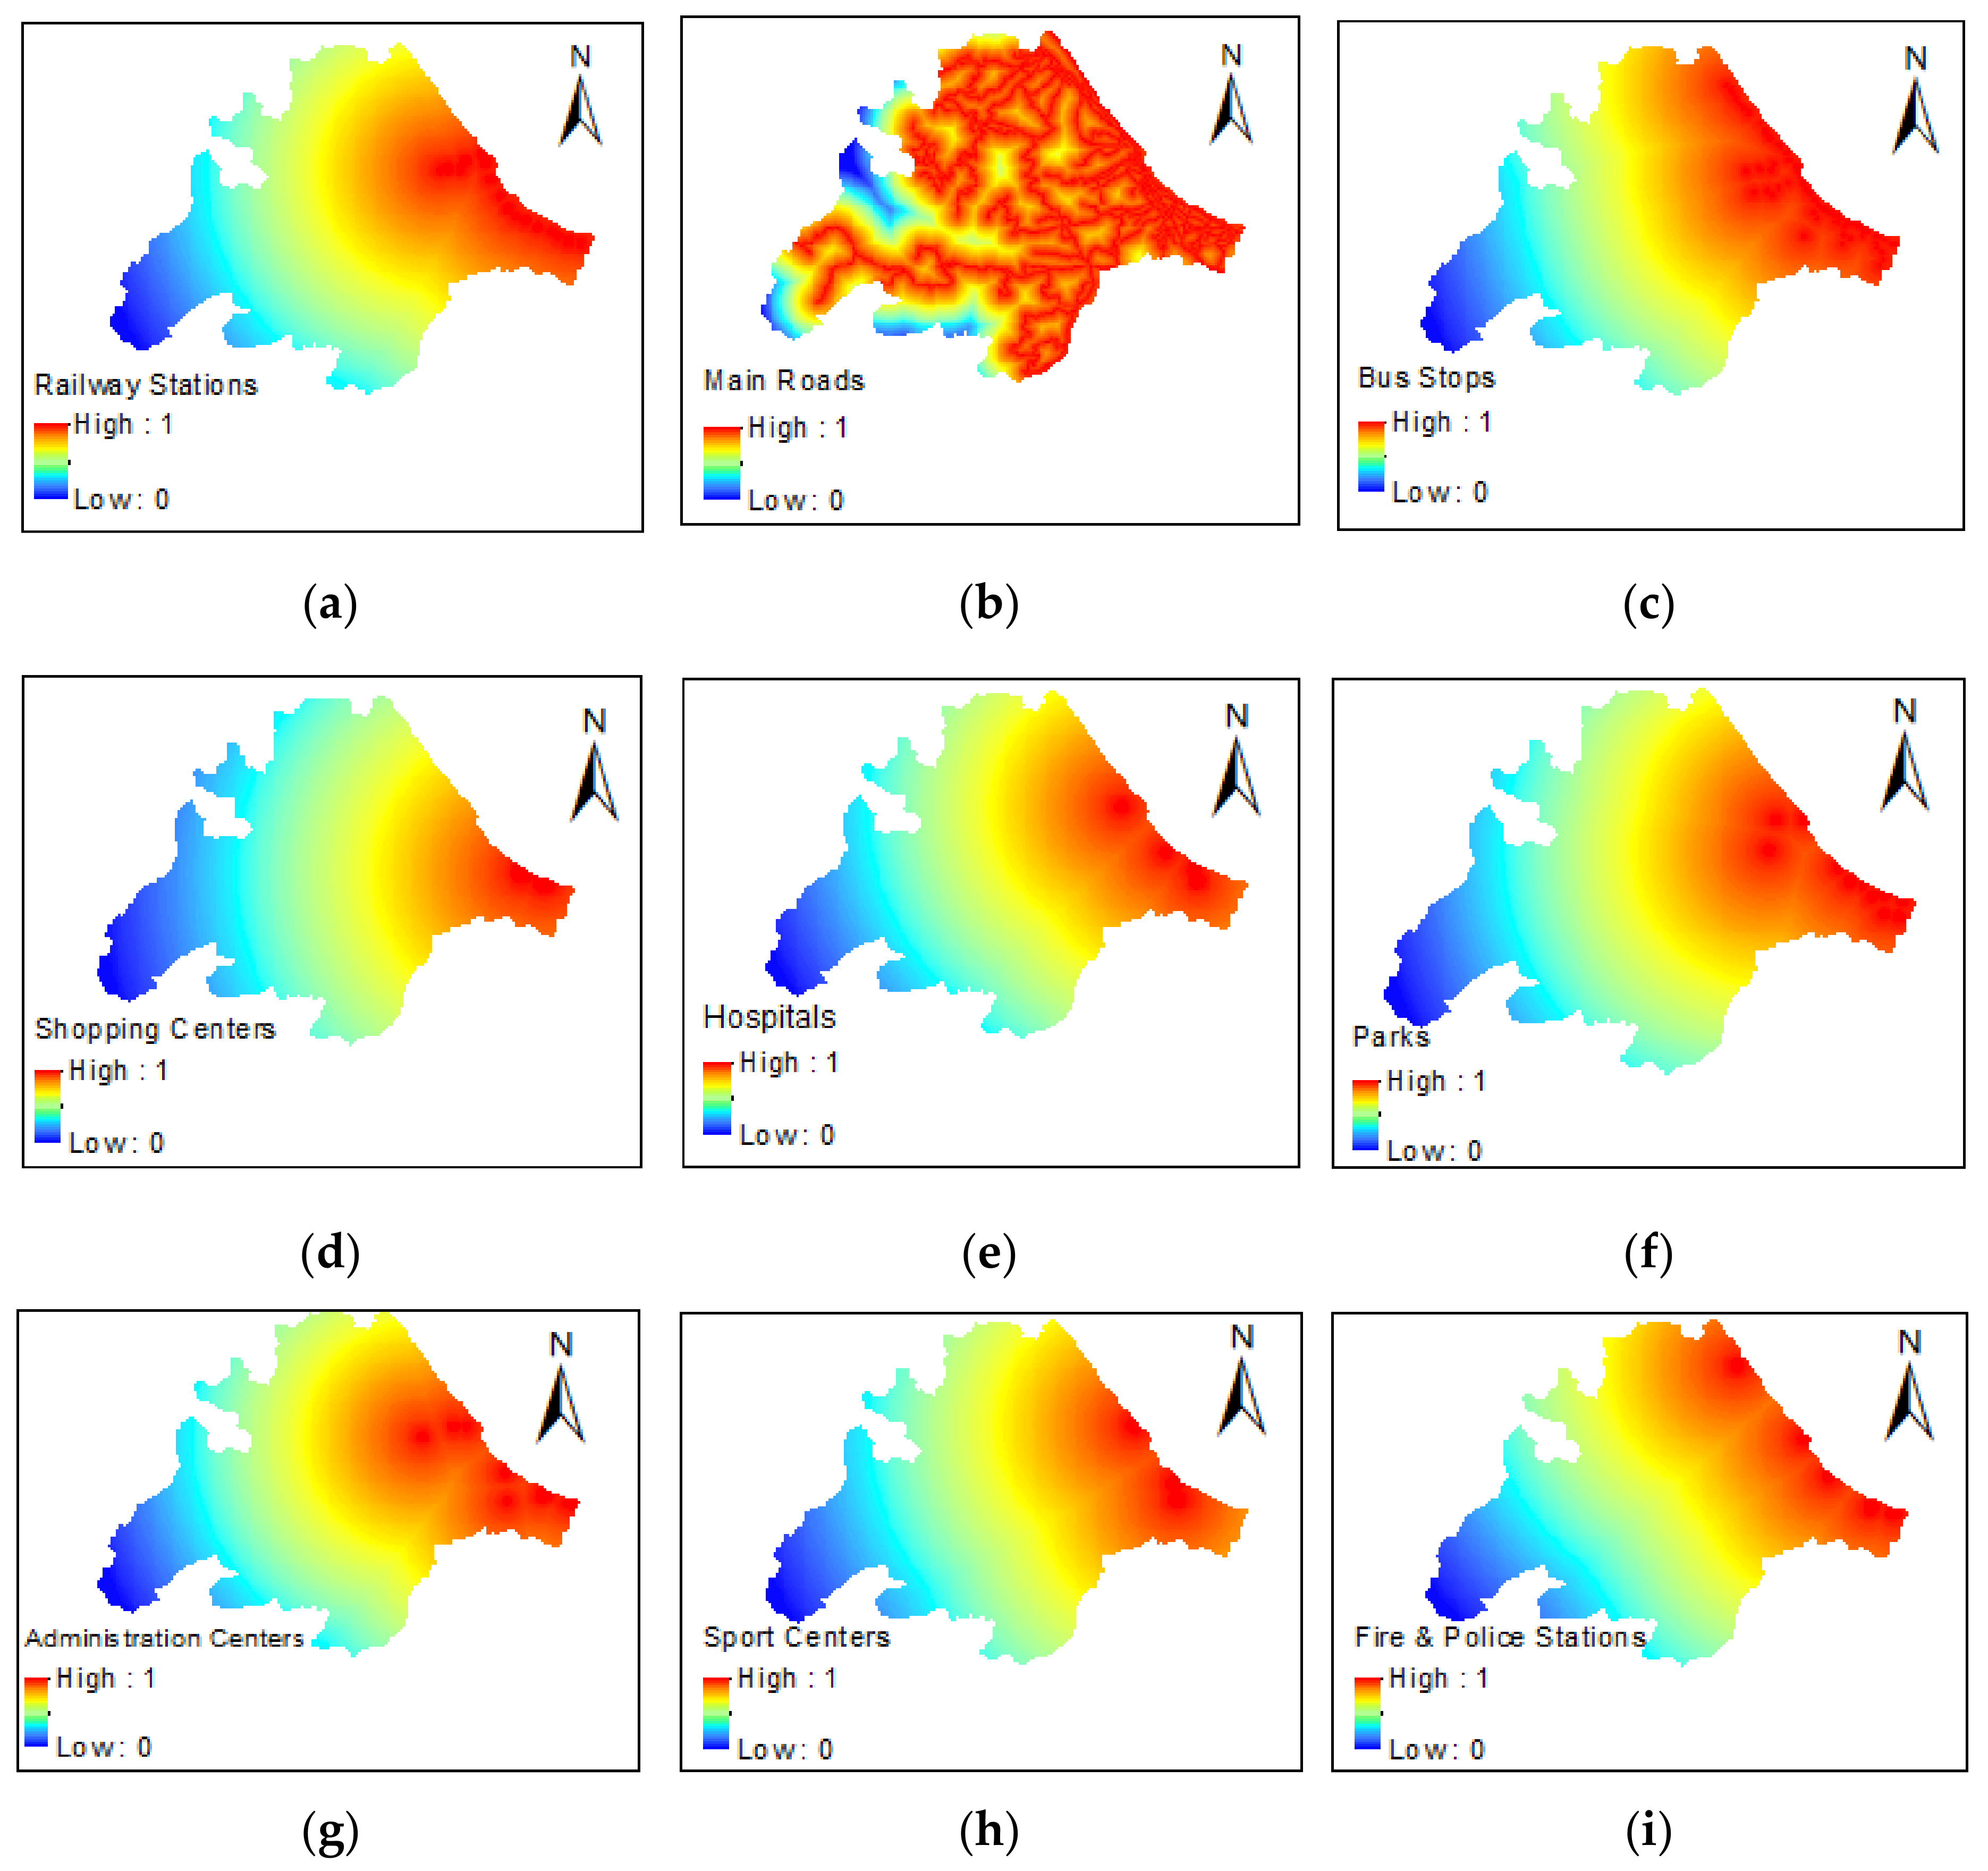
Linear BWM is used to calculate the weight and consistency of the factors using the BWM-Solver tool of Excel [27]. The consistency ratio of decision-making ranges between 0 for complete consistency and 1 for complete inconsistency [33]. The value for high consistency is expected to be less than or equal to 0.25. The consistency ratio for this study, in addition to the criteria for the nominal real estate valuation and generated weights as shown in Table 4, is within the prescribed limit [34].
Three main criteria and fifteen sub-criteria are used based on the literature. According to the expert’s opinions, the best criteria of the location is the railway station and the worst criteria are fire stations and police stations. The slope is the best criterion and the aspect is the worst criterion for the surface/topographical criteria. Population density is the best criterion and noise is the worst criterion for the personal criteria determined.

3. Analysis

Euclidean distance, density, surface analysis, raster calculator, and weighted sum tools have been used to analyze the criteria that affect the nominal value of the land. Distance analysis determines the distance from the items and produces a raster map based on items. Density analysis calculates where features are concentrated and produce a raster map [31]. Surface analysis generated contour, slope, aspect, hill shade, visibility maps, for example, based on the 3D data [35].
Euclidean distance analysis was used to determine the value of the raster for railway stations, main roads, bus stations, shopping centers, hospitals, parks, administration centers, sports centers, noise, and schools. The value of the raster for slope, aspect, and sea view was obtained by surface analysis. A population density map for the study area was produced using kernel density analysis. A raster calculator has been used to normalize the raster value and weighted sum tools have been used to provide a nominal land value. The normalization process for the raster value of each criterion is performed based on the impact of the factors on the land valuation. Factors that have a positive impact on land value are normalized by equation 3, whereas the factors that have a negative impact on land valuation are normalized by equation 4. This form of normalization is applied as some criteria have a negative effect on the land value, such as proximity to noise or situated on a steep slope. The criteria map and normalized criteria map are shown in Figure 3 and Figure 4, respectively. Figure 3 shows the real pixel value maps based on Euclidean distance analysis, surface analysis, and density analysis, and Figure 4 shows the normalized pixel value maps for Euclidean distance analysis, surface analysis, and density analysis of the criteria.
X ij = x j max x ij x j max x j min   ,   the   lowest   value   is   the   highest
X ij = x ij x j min x j max x j min ,   the   highest   value   is   still   the   highest

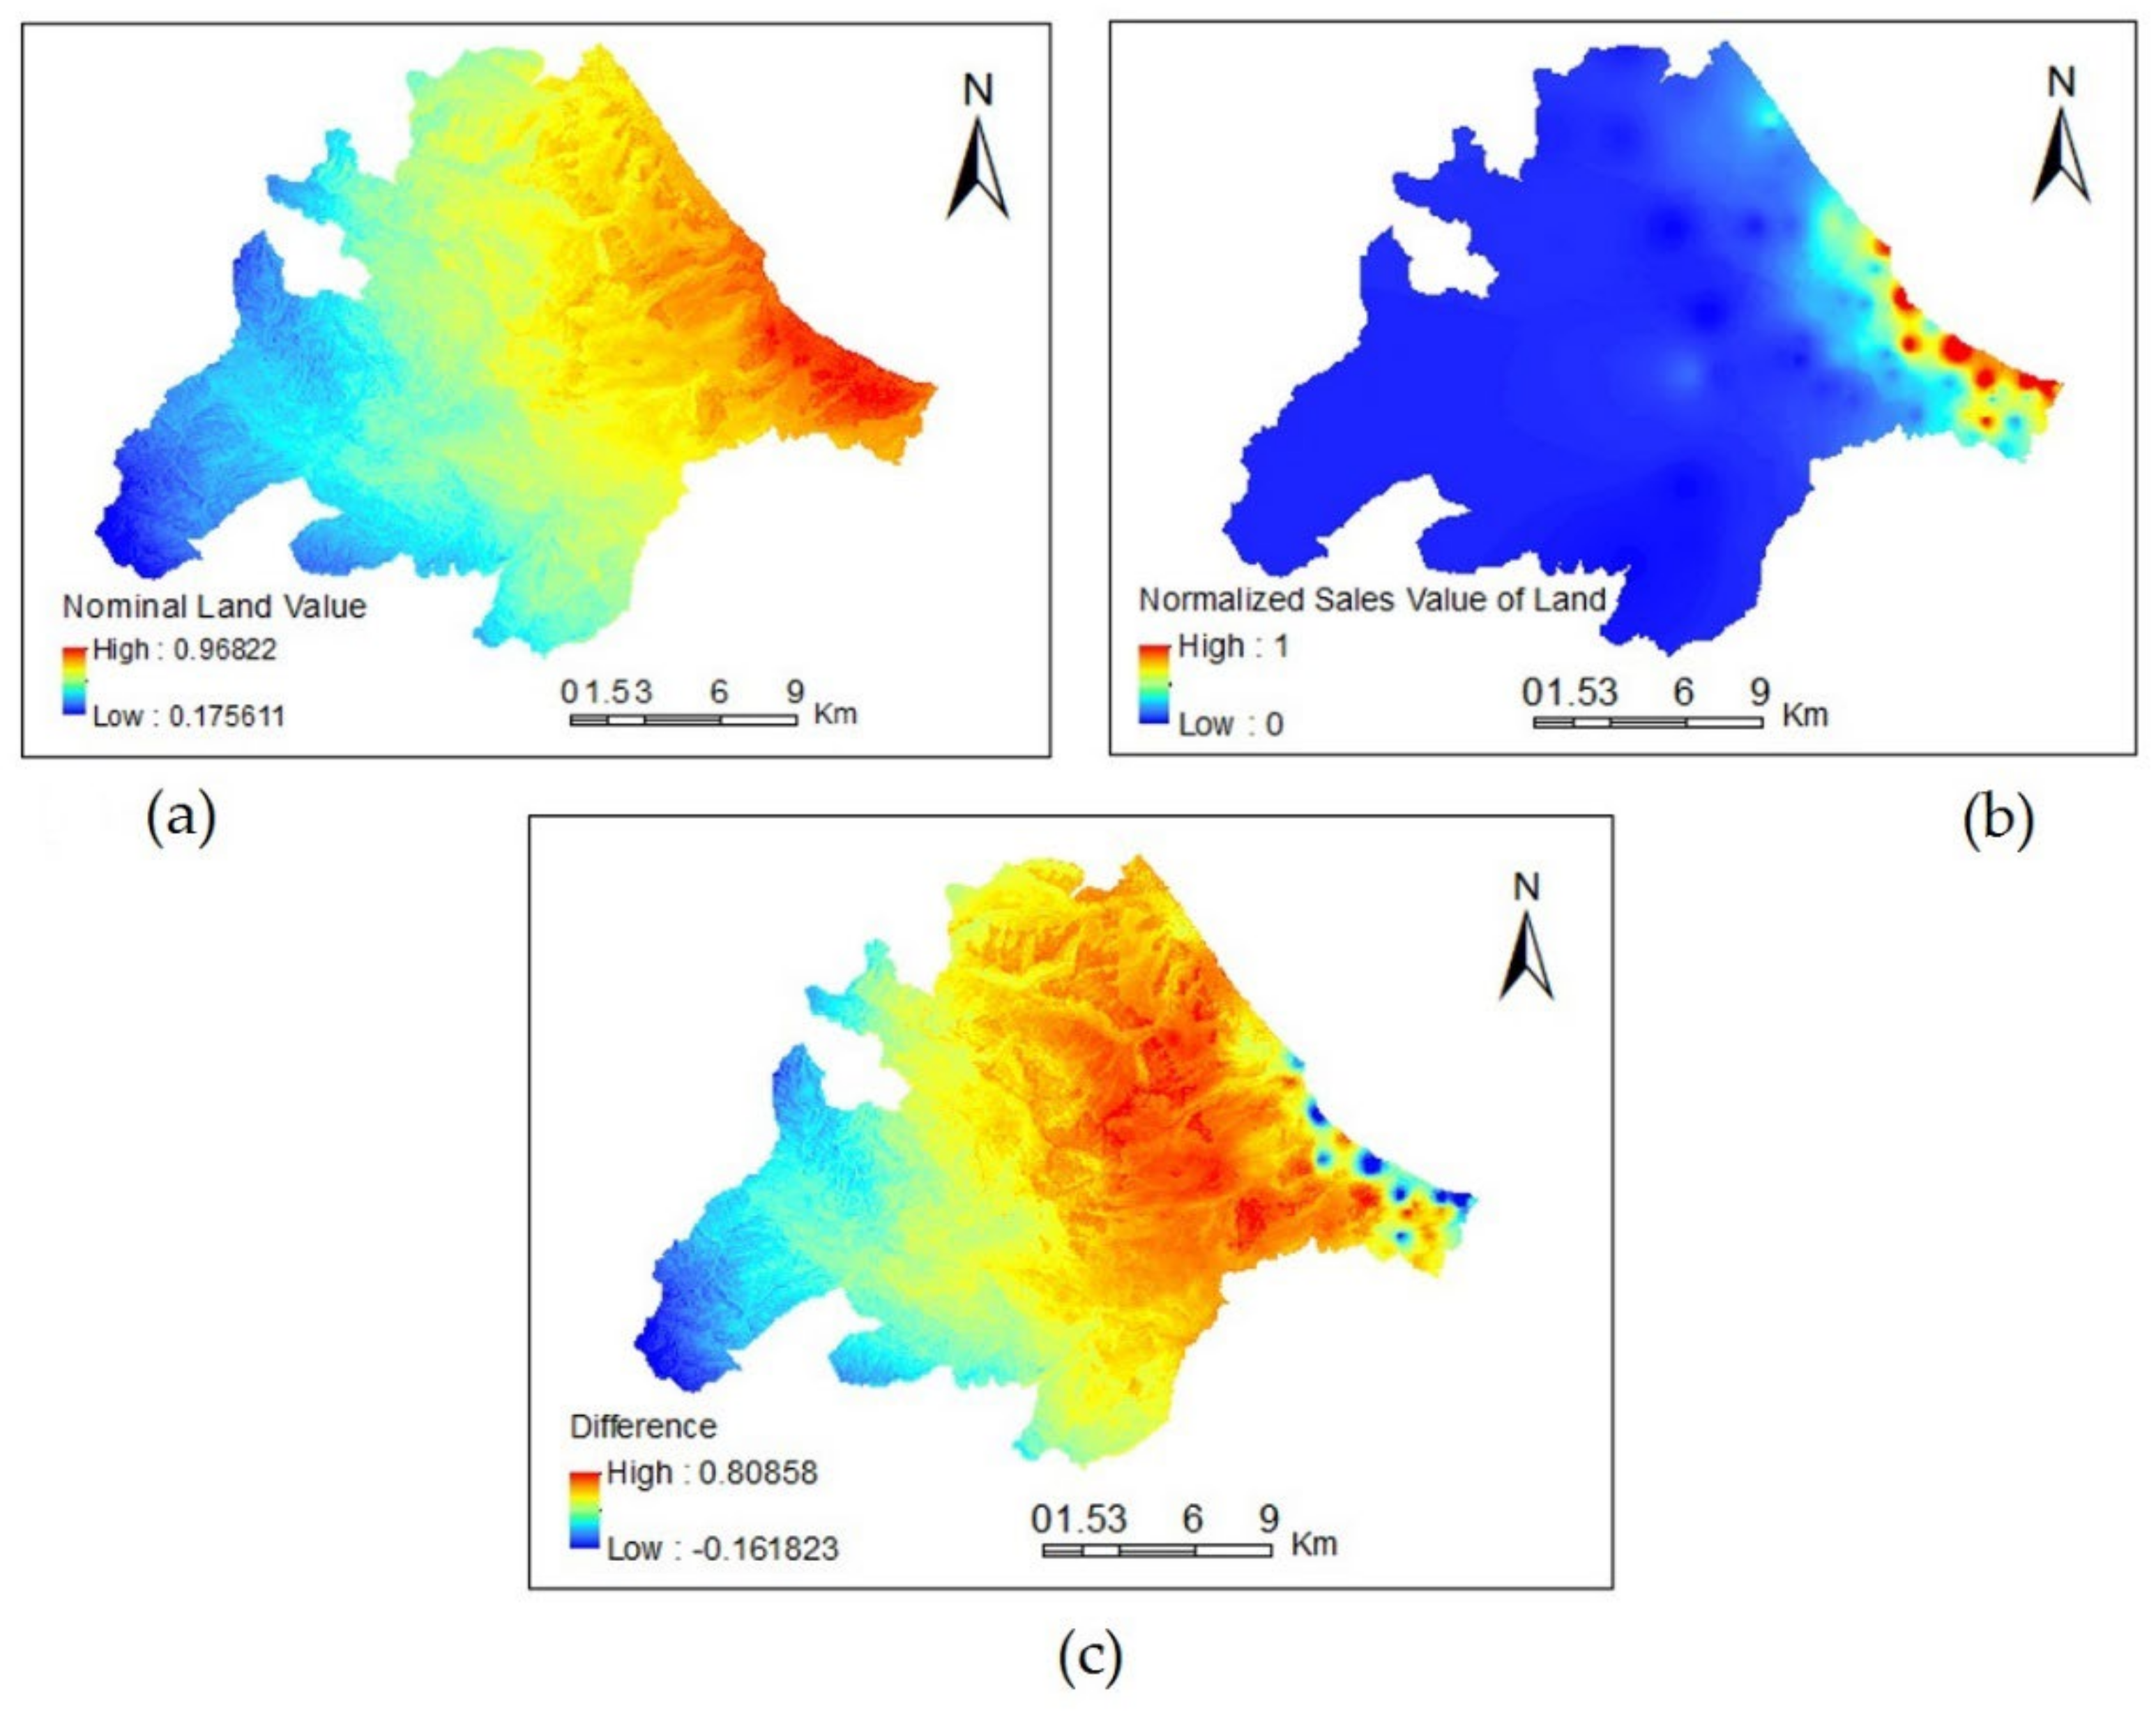
4. Results and Discussions

This study focused on producing a mass valuation application that could be used in taxation, property acquisition, rental, expropriation, urban regeneration, and land readjustment, using a nominal method based on the factors. The identified factors were managed in the GIS to make them understandable during analysis. Factors having a higher impact on the land value were given higher weights and vice versa, the weights of the factors being determined using BWM. This was accomplished by identifying the best and the worst criteria and then comparing the best and worst criteria with all other criteria on a pairwise comparison and considering the standard consistency ratio.
The land valuation of the Atakum district was produced using statistical methods: the nominal method, which uses GIS and the weighted sum method based on the identified weights of the criteria to eliminate subjectivity, as shown in Figure 5. The intensity of the color was used to depict the nominal value of the land; red indicates a high value, whereas blue indicates a low value (Figure 5). The land value map shows that densely populated areas and coastal areas are the most valuable in the study area. Moreover, the map indicates that land value is directly correlated with population density. The map also shows the inner side of the study area is relatively less valuable land.
In this study, a nominal land value map was produced based on many criteria that affect land value and the weight of the criteria determined with BWM differ from previous studies [6,11,12,18]. BWM was used [16,29] in weighting the criteria to produce nominal land value map, but many criteria were different from the current study, such as highway junctions, rapid-transit bus stations, quays, Bosphorus view, historical places, and hazardous areas, due to the location and characteristics of the study area.
The value map generated using the nominal method has been compared with a value map produced based on the current sale value of 79 properties in the study area. These properties were concentrated in the most densely populated part of the study area and Inverse Distance Weighted (IDW) analysis was used to produce the current sales value map, then it was normalized to values between 0 and 1.
Figure 6a shows the normalized nominal land value map; Figure 6b shows the normalized current sales value map; Figure 6c showing the difference between them.
Nominal land value and current sales value are identical in the coastal area and the lower populated western part of the study area. However, it was observed that in the central part of the study area values are differ. Because nominal land value considers factors that influence land value rather than traditional techniques of valuation. In addition, this difference related to the unevenly distributed insufficient current sales data, and the fact that the area is generally unsettled and partially agricultural.
Figure 7 shows the overlapped nominal land value map and satellite image to portray the nominal land value with the existing land used. As mentioned above, densely populated areas and coastal areas are the most valuable land, and the inner side is a relatively less valuable part of the study area.

5. Conclusions

Nominal land valuation is accomplished by examining objectively the many factors that have a negative and positive impact on the value with BWM using GIS. The criteria, which were gathered from numerous sources, were assessed using GIS tools, and the nominal value map of the study area was produced. The factors influencing land value vary between regions, country, and person. For mass valuation, the criteria should be identified by considering trends and realities. This study identified 15 criteria from previous studies appropriate to the type of property in the study area and classified them into three groups for weight computation with BWM.
Choice of criteria used for nominal land valuation is very important to ensure fast, accurate, and quality valuation. The nominal land valuation criteria are managed, analyzed, and presented in the GIS; GIS is also used to normalize the criteria and generate value maps. If applied at a large scale, such as region and country, nominal land valuation using BWM utilizing GIS could be quick and efficient and provide important decision support for the valuation experts, sellers and buyers. It may also provide a method for mass valuation that constitutes a fair and sustainable real estate tax system. With this method, sensitive mass valuation applications can be made, but the most important issue is the criteria that are determined according to the characteristics of the region.

Author Contributions

Conceptualization, Zelalem Ayalke; Formal analysis, Zelalem Ayalke; Project administration, Aziz Sisman; Supervision, Aziz Sisman; Writing—original draft, Zelalem Ayalke. The authors have an equal contribution to this work. All authors have read and agreed to the published version of the manuscript.

Funding

This research received no external funding.

Institutional Review Board Statement

Not applicable.

Informed Consent Statement

Not applicable.

Data Availability Statement

Not applicable.

Conflicts of Interest

The authors declare no conflict of interest.

References

  1. World Bank. “Population, Total-World|Data,” The World Bank. 2020. Available online: https://data.worldbank.org/indicator/SP.POP.TOTL?end=2020&locations=1W&start=1960) (accessed on 7 October 2021).
  2. Yalpir, S.; Bunyan Unel, F. Multivariate Statistical Analysis Application to Determine Factors Affecting The Parcel Value to Be Used Mass Real Estate Valuation Approaches. Int. J. Eng. Geosci 2022, 7, 32–42. [Google Scholar]
  3. Bencure, J.C.; Tripathi, N.K.; Miyazaki, H.; Ninsawat, S.; Kim, S.M. Factors Affecting Decision-Making in Land Valuation Process Using AHP: A Case in the Philippines. Int. J. Hous. Mark. Anal. 2022, 15, 188–202. [Google Scholar] [CrossRef]
  4. Demetriou, D. The Assessment of Land Valuation in Land Consolidation Schemes: The Need For A New Land Valuation Framework. Land Use Policy 2016, 54, 487–498. [Google Scholar] [CrossRef]
  5. Mete, O.M.; Yomralioglu, T. Implementation of Serverless Cloud GIS Platform for Land Valuation. Int. J. Digital Earth 2021, 14, 836–850. [Google Scholar] [CrossRef]
  6. Yomralioglu, T. A Nominal Asset Value-Based Approach for Land Readjustment and Its Implementation Using Geographical Information Systems. Ph.D. Thesis, University of Newcastle upon Tyne, Newcastle upon Tyne, UK, 1993. [Google Scholar]
  7. Bunyan Unel, F.; Yalpir, S. Valuations of Building Plots Using the AHP Method. Int. J. Strateg. Prop. Manag. 2019, 23, 197–212. [Google Scholar] [CrossRef] [Green Version]
  8. Podor, A. GIS Application in Real Estate Investment. Sci. J. Riga Tech. Univ. 2010, 20, 94–99. [Google Scholar]
  9. Chinh, N.T.; Son, N.P.; Manh, L.V.; Thuy, N.T.; Vu, T.N.; Hanh, N.T.; Linh, L.P. Factors That Affect Land Values and The Development of Land Value Maps for Strengthening Policy Making in Vietnam: The Case Study of Non-Agricultural Land in Quang Ninh Province, Vietnam. Int. J. Environ. Qual. 2020, 36, 23–35. [Google Scholar]
  10. Wyatt, P. Using a Geographical Information Syatem for Property Valuation. J. Prop. Valuat. Invest. 1996, 14, 67–79. [Google Scholar] [CrossRef] [Green Version]
  11. Yomralioglu, T.; Nisanci, R. Nominal Asset Land Valuation Technique by GIS. In TS-27 Valuation Techniques and Applications; FIG Working Week: Athens, Greece, 2004. [Google Scholar]
  12. Nisanci, R. The Production of Pixel Based Urban Land Value Maps with Nominal Valuation Method Using GIS. Ph.D. Thesis, Department of Geomatics, Karadeniz Technical University, Trabzon, Turkey, 2005. [Google Scholar]
  13. Bencure, J.C.; Tripathi, N.K.; Miyazaki, H.; Ninsawat, S.; Kim, S.M. Development of an Innovative Land Valuation Model (iLVM) for Mass Appraisal Application in Sub-Urban Areas Using AHP: An Integration of Theoretical and Practical Approaches. Sustainability 2019, 11, 3731. [Google Scholar] [CrossRef] [Green Version]
  14. Herzberg, R.; Pham, T.G.; Kappas, M.; Wyss, D.; Tran, C.T.M. Multi-Criteria Decision Analysis for The Land Evaluation of Potential Agricultural Land Use Types in A Hilly Area of Central Vietnam. Land 2019, 8, 90. [Google Scholar] [CrossRef] [Green Version]
  15. Yalpir, S. The Development and Application of A Real-Estate Valuation Model with Fuzzy Logic Methodology: Konya Case Study. Ph.D. Thesis, Department of Geodesy and Photogrammetry, Selçuk University, Konya, Turkey, 2007. [Google Scholar]
  16. Mete, O.M. Creation of Nominal Asset Value-Based Map Using Geographical Informatıon Systems for Istanbul City. Master’s Thesis, Department of Geomatics, Istanbul Technical University, Istanbul, Turkey, 2019. [Google Scholar]
  17. Başer, V.; Bıyık, C.; Uzun, B.; Yıldırım, V.; Nişanci, R. A Recommendation of Decision-Support Model Based on Geographical Information Systems for Generating Real Estate Evaluation Maps: Kaşüstü/Trabzon Example. Sigma J. Eng. Nat. Sci. 2016, 34, 349–363. [Google Scholar]
  18. Yomralioglu, T.; Nisanci, R.; Yildirim, V. An Implementation of Nominal Asset Based Land Readjustment. In TS 5C–Real Estate Valuation; FIG Working Week: Hong Kong, China, 2007. [Google Scholar]
  19. Yalpir, S.; Durduran, S.S.; Bunyan Unel, F.; Yolcu, M. Creating A Valuation Map in GIS Through Artificial Neural Network Methodology: A Case Study. Acta Montan. Slovaca 2014, 19, 89–99. [Google Scholar]
  20. Pamučar, D.; Ecer, F.; Cirovic, G.; Arlasheedi, M.A. Application of Improved Best Worst Method (BWM) in Real-World Problems. Mathematics 2020, 8, 1342. [Google Scholar] [CrossRef]
  21. Beemsterboer, D.J.C.; Hendrix, E.M.T.; Claassen, G.D.H. On Solving the Best-Worst Method in Multi-Criteria Decision-Making. IFAC Pap. 2018, 51, 1660–1665. [Google Scholar] [CrossRef]
  22. Ghaffari, S.; Arab, A.; Nafari, J.; Manteghi, M. Investigation and Evaluation of Key Success Factors in Technological Innovation Development Based On BWM. Decis. Sci. Lett. 2017, 6, 295–306. [Google Scholar] [CrossRef]
  23. Gupta, P.; Anand, S.; Gupta, H. Developing a Roadmap to Overcome Barriers to Energy Efficiency in Buildings Using Best Worst Method. Sustain. Cities Soc. 2017, 31, 244–259. [Google Scholar] [CrossRef]
  24. Liu, P.; Zhu, B.; Wang, P.A. Weighting Model Based on Best–Worst Method and its Application for Environmental Performance Evaluation. Appl. Soft Comput. 2021, 103, 107168. [Google Scholar] [CrossRef]
  25. Puji Setyono, R.; Sarno, R. Vendor Track Record Selection Using Best Worst Method. In Proceedings of the International Seminar on Application for Technology of Information and Communication, Semarang, Indonesia, 21–22 September 2018. [Google Scholar]
  26. Sofuoğlu, M.A. Fuzzy applications of Best–Worst method in manufacturing environment. Soft Comput. 2020, 24, 647–659. [Google Scholar] [CrossRef]
  27. Rezaei, J. Best-Worst Multi-Criteria Decision-Making Method:Some Properties and A Linear Model. Omega 2016, 64, 124–130. [Google Scholar] [CrossRef]
  28. Van de Kaa, G.; Fens, T.; Rezaei, J.; Kaynak, D.; Hatun, Z.; Tsilimeni-Archangelidi, A. Realizing Smart Meter Connectivity: Analyzing the Competing Technologies Power Line Communication, Mobile Telephony, and Radio Frequency Using The Best Worst Method. Renew. Sustain. Energy Rev. 2019, 103, 320–327. [Google Scholar] [CrossRef]
  29. Mete, M.O.; Yomralioglu, T. Creation of Nominal Asset Value-Based Maps using GIS: A Case Study of Istanbul Beyoglu and Gaziosmanpasa Districts. GI_Forum 2019, 2, 98–112. [Google Scholar] [CrossRef] [Green Version]
  30. TSI, Turkish Statistical Institute. 2022. Available online: https://biruni.tuik.gov.tr/medas/?kn=95&locale=tr (accessed on 5 February 2022).
  31. Boyaci, A.Ç.; Şişman, A.; Sarıcaoğlu, K. Site Selection For Waste Vegetable Oil and Waste Battery Collection Boxes: A GIS-Based Hybrid Hesitant Fuzzy Decision-Making Approach. Environ. Sci. Pollut R 2021, 28, 17431–17444. [Google Scholar] [CrossRef] [PubMed]
  32. Deveci, E.; Yilmaz, I. The Evaluation of Real Estates by Geographical Information Systems: The Case of Central Afyonkarahisar. Electron. J. Map Technol. 2009, 1, 33–47. [Google Scholar]
  33. Liang, F.; Brunelli, M.; Rezaei, J. Consistency Issues in The Best Worst Method: Measurements and Thresholds. Omega 2020, 96, 102175. [Google Scholar] [CrossRef]
  34. Saaty, T.L. Decision Making with The Analytic Hierarchy Process. Int. J. Serv. Sci. 2008, 1, 83–98. [Google Scholar] [CrossRef] [Green Version]
  35. Giridhar, M.V.S.S.; Viswanadh, G.K.; Acharyulu, S.K.C. Surface Analysıs Usıng GIS. In Proceedings of the National Conference on Soft Computing Applications in Water Resources & Environmental Engineering, College of Engineering, Osmania University, Hyderabad, India, 14 December 2007. [Google Scholar]
Figure 1. Location of the study area.
Ijgi 11 00213 g001
Figure 2. General flowchart of the research.
Ijgi 11 00213 g002
Figure 3. Criteria maps. (a) railway stations, (b) main roads, (c) bus stops, (d) shopping centers,(e) hospitals, (f) parks, (g) administration centers, (h) sport centers, (i) fire and police stations, (j) sea view, (k) slope, (l) aspect, (m) population density, (n) noise, and (o) schools.
Ijgi 11 00213 g003aIjgi 11 00213 g003b
Figure 4. Normalized criteria maps, (a) railway stations, (b) main roads, (c) bus stops, (d) shopping centers, (e) hospitals, (f) parks, (g) administration centers, (h) sport centers, (i) fire and police stations, (j) sea view, (k) slope (l) aspect, (m) population density, (n) noise, and (o) schools.
Ijgi 11 00213 g004aIjgi 11 00213 g004b
Figure 5. Nominal land value map.
Ijgi 11 00213 g005
Figure 6. (a) Nominal land value map; (b) current sales value map; (c) difference map.
Ijgi 11 00213 g006
Figure 7. Nominal land value map and satellite image (Google Erath).
Ijgi 11 00213 g007
Table 1. Criteria used in studies.
StudyCriteria Used
[2]Property conditions, Zoning status, Location of the plot, Geometric Structure, Technical infrastructure Services, Road conditions, Slope of the plot, Health facilities, Educational Institutions, Public institutions, Security Units, Shopping centers, Attraction centers, Entertainment centers, cultural centers, Green areas, Public transportation Points, Unsanitary Areas, Industrial Zones, Graveyards, Worship Places, Business Centers, View from the plot, Parking Areas, Surrounding Environment and Underground, soil, and aboveground features
[6]Topography, Shape, Size, View, Landscaping, Wind, Environment, Soil condition, Current sale price, Distance to shopping areas, Distance to recreational areas, Distance to play garden, Distance to parking facilities, Distance to school, Distance to religious areas, Distance to city center, Access to Street, Access to highway, Access to railroad, Access to waterway, Nearby nuisances, Nearby healthy services, Noise, Smoke, Natural vegetation, Water use, Sewerage, Drainage, Available utilities, Basic municipal services, Building, Street frontage, Corner location, Location in a site block, Permitted number of floors, Permitted usable construction area, Load-bearing utilities, Type of permitted building style
[7]Education, Shopping, Sanctuary, Healthcare, Green areas, Transportation, Center, Parcel status Road status, Base Area Coefficient, Floor Area Coefficient, and Parcel area
[11]Supplied basic services, Number of floors, Construction area, Landscape, view, Street, Environment, Parcel location within a block, Street frontage, Nuisances, Land parcel shape, currently usable area, City center, Noise, Soil condition, educational centers, Health services, Highway, Shopping center, Available utilities, Recreational areas, Topography, Religious place, Play Garden, Car parking area, Fire station, Waterway, Police station and railway
[16,29]Main road, Highway junctions, Street, Railways, Rapid-Transit Bus Stations, Bus Stations, Quays, Educational institutions, Universities, Health institutions, Hospitals, Fire station, Police station, Parking lots, Shopping centers, green spaces, City center, Bosphorus view, Historical, Hazardous areas, Sea view, Slope and Aspect
[17]Availability of public services, Licensed floor number, Landscape, Access to the street, Position in building block, Plot utilization area, Environment, Façade, Plot type, Distance from city center, Available area, Distance from the dangerous sections of the city, Distance to educational centers, Distance to highway, Soil type, Distance to shopping mall, Noise, Distance to healthcare services, Distance to green areas, Topography, Distance to prayer rooms, Current sources, Distance to playground, Distance to parking lot, Distance to seaway, Distance to railway, Distance to fire department and Distance to police station
[32]Bus stops, Train stations, Places of worship, Police stations, Fire station, Bus stations, educational areas, Slope of the region, Noise, Crime zones, City center, Average income of residents, working places, Preferred population density, Shape of the plot number of facades of the plot, the location of the parcel within the island, the number of floors allowed with the zoning plan and Percentage of usage area given with zoning plan
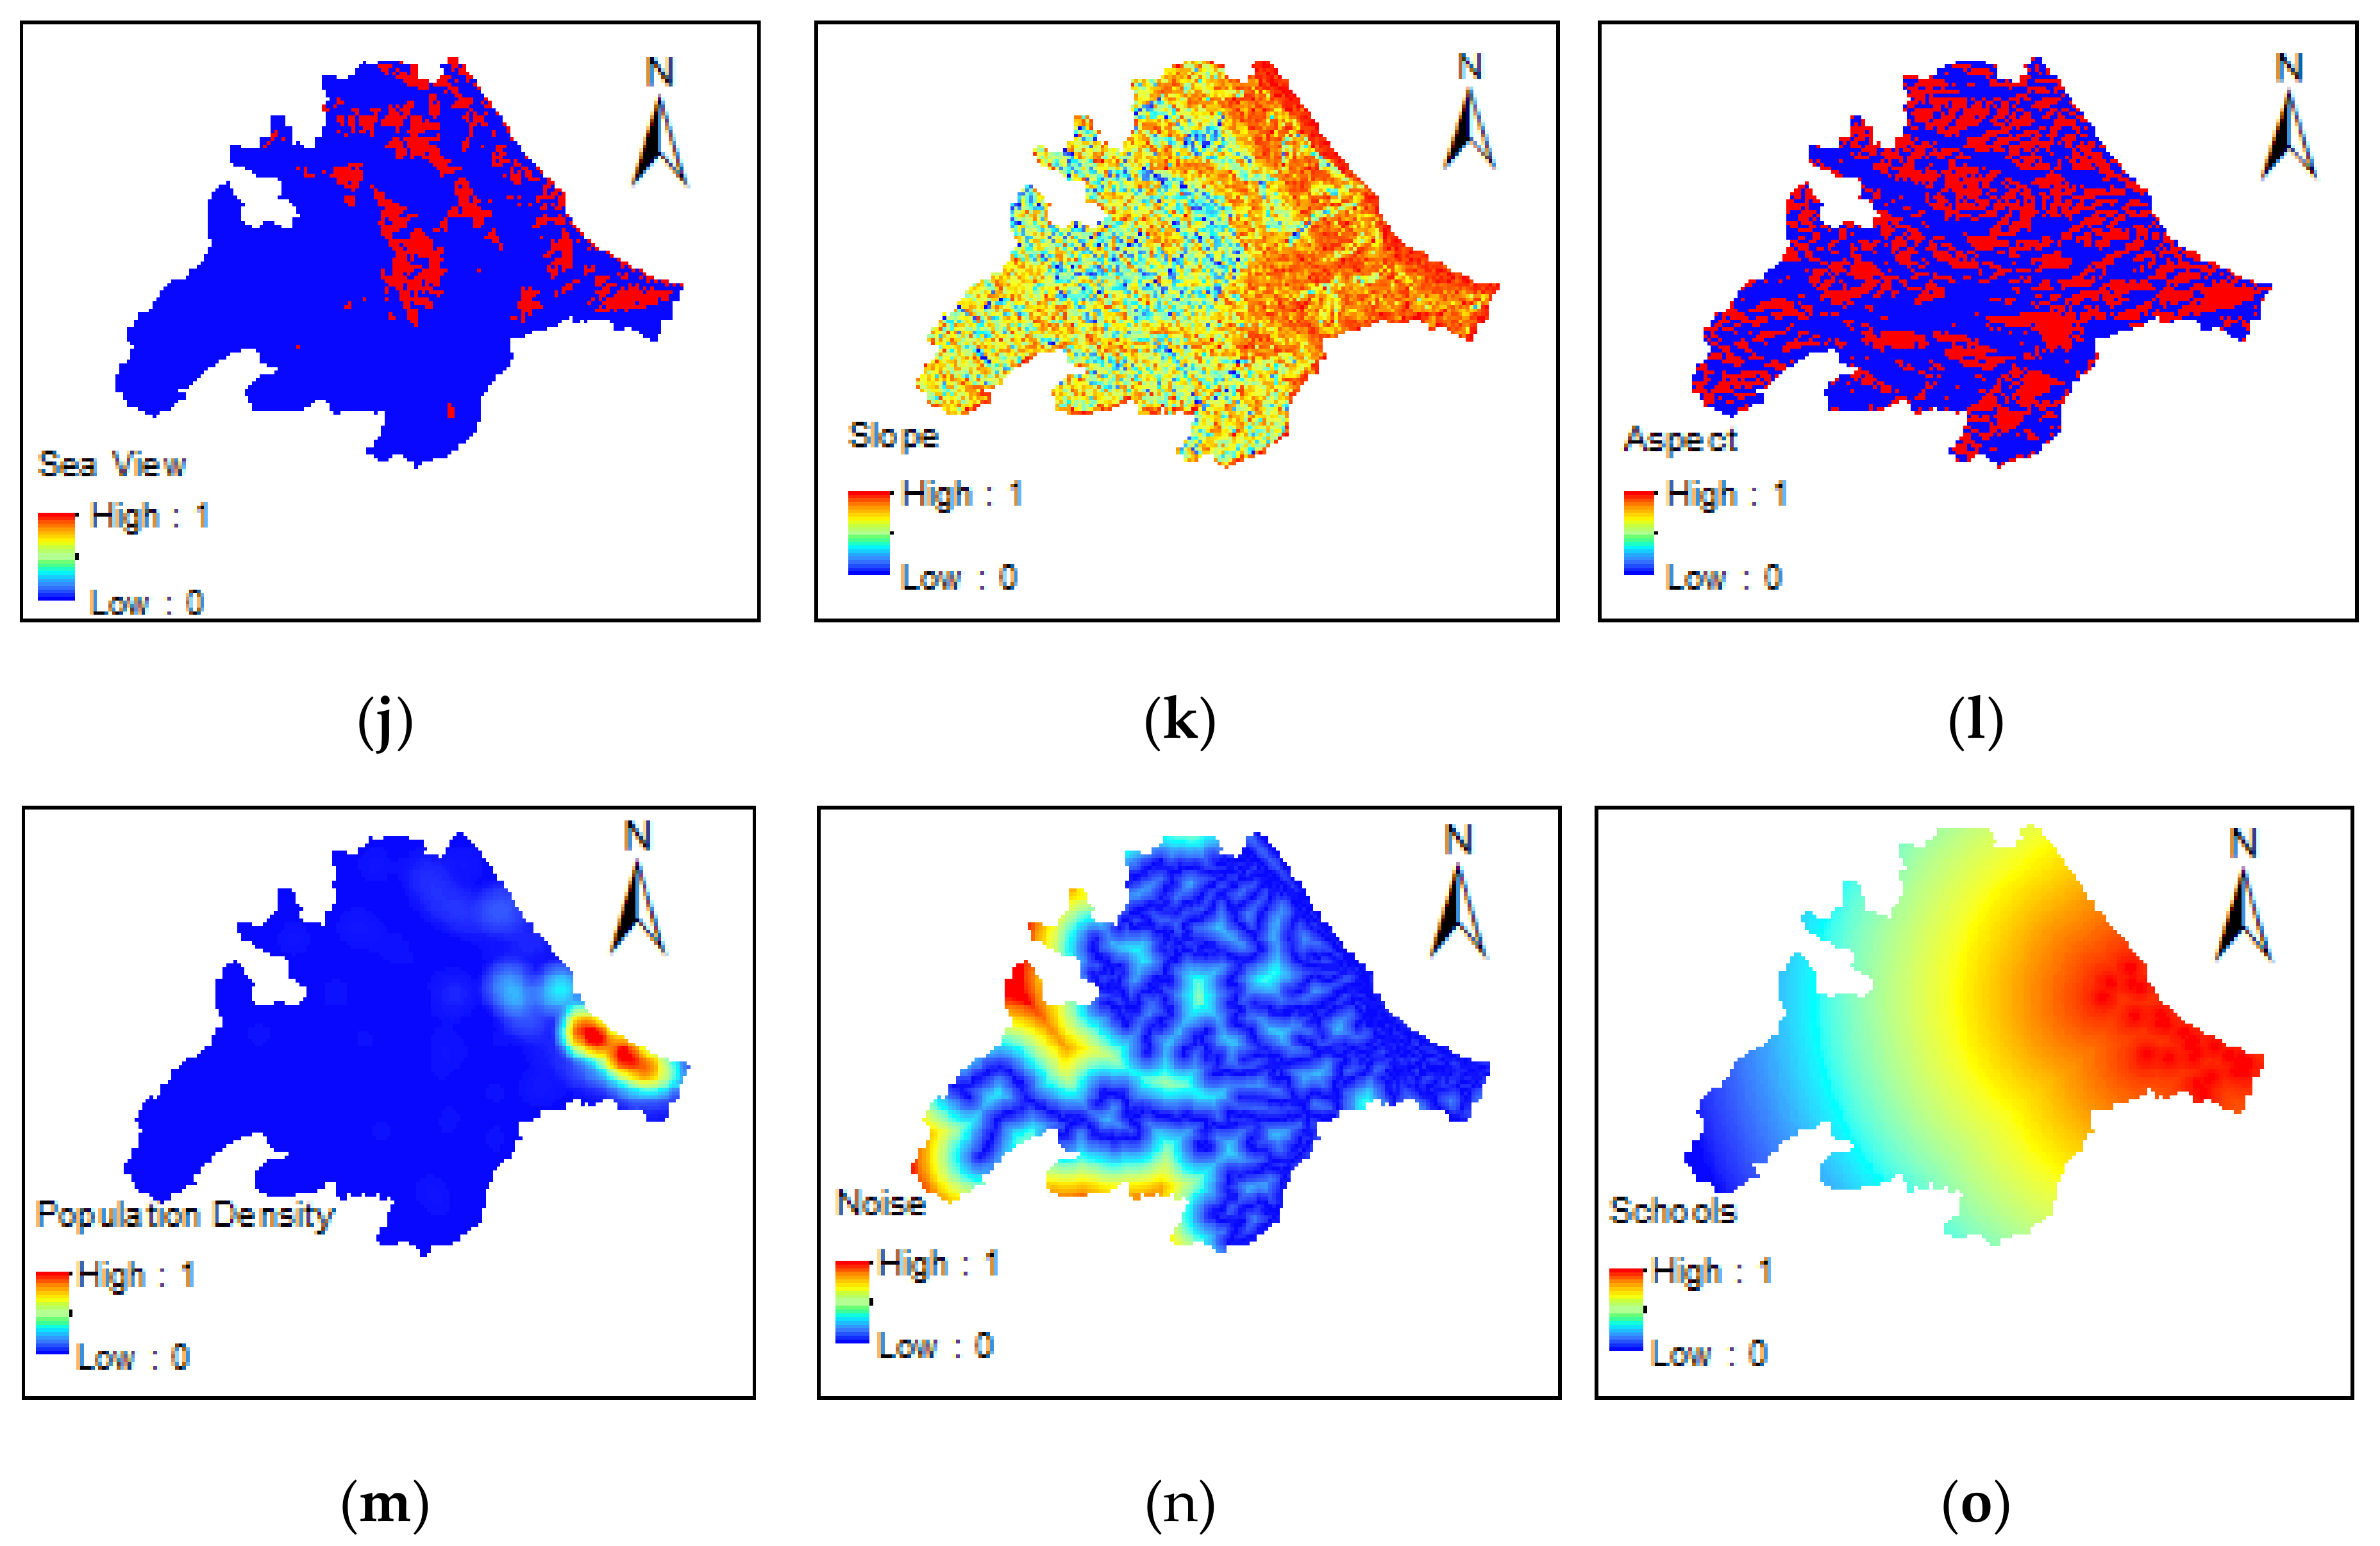
Table 2. Selected criteria for this study.
Locational (Distance)
Criteria
Surface (Topographical) Criteria Personal
Criteria
RailwaySlopePopulation Density
Main roadSeaviewNoise
Bus stationAspectSchools
Shopping center
Hospitals
Parks
Administration centers
Sport center
Fire station and police station
Table 3. Explanation of criteria used in this study.
Criteria Explanation
Railway stationsIt is more convenient for residents to travel. The land near the railway station is extremely valuable.
Main roadsThe main road network has a substantial impact on land value in facilitating access to public utilities and commercial centers. The direct connection between the land and the main road is extremely advantageous.
Bus stationThe land near the bus station has an important advantage for value. Makes traveling more convenient for the residents.
Shopping centerSupermarkets and shopping malls help the residents’ shopping needs and have a positive effect on the value.
HospitalsAccessibility to health facilities, medical examination, and treatment.
ParksThis is for people of all ages to have fun or entertainment on a daily basis.
Administration centersA place where a community’s central administration is located.
Sport centerA place where sports activities are available.
Fire station and police stationDescribe the safety and security level of the area.
Seaview The view of a sea. If the land has a sea view, desirable.
Slope Transportation, daily activities, and economic activities are all influenced by regional topography. The flat terrain is the most desirable in terms of land valuation.
Aspect Direction or azimuth the terrain surface faces. An important factor regarding accessing sunlight and also environmental view.
Population DensityThe amount of population/concentration of people. The greater the density of a population, the more desirable the land valuation.
NoiseNoise pollution has detrimental impacts on the quality of life of the residents, nearby companies, and offices, especially near the main road, commercial areas, and industries. Due to this reason, it has an inverse impact (negative) on the value of the land.
SchoolsFamilies need closer distances so that they may conveniently get their children to school. Schools include Primary, Middle, and High schools.
Table 4. Weight of the criteria.
Main CriteriaWeightConsistencySub CriteriaWeightTotalConsistencyWeight of Sub Criteria
Location0.6000.171Railway stations0.2521.0000.0470.151
Main roads0.2520.151
Bus stops 0.1490.089
Shopping centers0.1000.060
Hospitals0.0750.045
Parks0.0600.036
Administration Centers0.0500.030
Sport centers0.0330.020
Fire & Police stations0.0290.020
Surface/
Topographical
0.257Sea view 0.1871.0000.1970.048
Slope0.7360.189
Aspect0.0770.020
Personal0.143Population Density0.5421.0000.140.076
Schools0.2920.042
Noise0.1660.023
Total1.000 1.000
Publisher’s Note: MDPI stays neutral with regard to jurisdictional claims in published maps and institutional affiliations.

