Article

Analysis of the Characteristics and Spatial Pattern of the Catering Industry in the Four Central Cities of the Yangtze River Delta

1
College of Civil Engineering and Architecture, Zhejiang University, Hangzhou 310058, China
2
China Institute of Urbanization, Zhejiang University, Hangzhou 310058, China
*
Author to whom correspondence should be addressed.
ISPRS Int. J. Geo-Inf. 2022, 11(6), 321; https://doi.org/10.3390/ijgi11060321
Submission received: 18 March 2022 / Revised: 13 May 2022 / Accepted: 19 May 2022 / Published: 24 May 2022

Abstract

:
The development of the catering industry in big cities is of great significance for countries to improve the quality of development and improve people’s living standards. In recent years, the urban catering industry has effectively promoted the process of urbanization, and it is significant to study the development characteristics and spatial distribution of the catering industry for the urban pattern. Taking the four central cities (Shanghai, Hangzhou, Nanjing, and Hefei) of China’s Yangtze River Delta (YRD) urban agglomeration as examples, first, the point-of-interest (POI) data of various catering facilities in the city’s main urban area were crawled from the Amap (AutoNavi map) open platform through Python. Second, for the first time, three quantitative indicators were constructed to characterize the development and urbanization of the urban catering industry, namely cuisine localization index (CLI), cuisine diversity index (CDI), and cuisine geographical preference index (CGPI). Third, the overall spatial characteristics of the catering industry in the four central cities and administrative districts were obtained using the methods of kernel density and spatial autocorrelation analysis. The spatial distribution of the catering industry development in each city is displayed through GIS visualization, and its influencing factors are discussed preliminarily through geographically weighted regression (GWR) model. The research shows that: (1) the four central cities in the YRD have formed core catering areas with different agglomeration levels. Different cuisines in the city have the characteristics of partial spatial overlap. (2) In the four central cities of the YRD, there is a significant positive spatial correlation between the catering industry as a whole and individuals. Hangzhou and Hefei have higher CLI (0.38), but the cuisine structure is relatively simple. The CLI of Shanghai and Nanjing is at a low level, but the overall cuisine structure is relatively balanced. (3) The catering industry in the four central cities has a high degree of agglomeration, a wide range of agglomeration, and many agglomeration points. Only Shanghai cuisine, Jiangsu and Zhejiang cuisine, Anhui cuisine, Fujian cuisine, Shandong cuisine, and Hunan cuisine have significant positive correlations in space, and the correlations weaken in turn. (4) The influence intensity of the influencing factors on CLI and CDI is in the order of degree of openness, regional economic level, market vitality, population concentration level, industrial structure. The spatial pattern of catering in a city is greatly affected by the regional economy and population density. This study can provide a reference for research on the spatial distribution of the catering industry in similar urban agglomerations around the world.

1. Introduction

“Food is the paramount necessity of the people”. Since the beginning of the new century, China’s national economy and the income levels of residents have developed rapidly. At the same time, catering consumption demand and turnover have also gradually increased, making the catering industry one of the fastest-growing industries in China in recent years [1]. The catering industry is related to people’s health and living standards [2]. It can activate the mass consumption market and drive urban economic development [3]. The healthy development of catering is inseparable from the scientific spatial pattern of catering [4]. Grasping the current spatial pattern of catering is of great significance for regulating the development of the urban catering industry and improving culture, tourism, and life. For cultural inheritance, catering spaces have the dual attributes of carrying food and experiencing cultural connotations. It can continue the long-standing Chinese food culture, express the city’s culture and connotations, help shape a good city brand and image [4,5]. For tourism development, catering has become the main content and attraction of the development of tourist destinations. A reasonable layout of the catering space will help promote the development of accommodation tourism and other related industries, which is an essential attractive factor for investors and foreign tourists [6,7]. For residents’ lives, the development of the catering industry can increase the employment rate [8]. The spatial pattern of catering is directly related to the convenience of urban residents’ life and indirectly determines the residents’ urban life experience and quality of life [9].
As an important economic region in China, the Yangtze River Delta (YRD) region has the largest and most mature catering industry development, and its total sales rank first in China. The YRD has a long cultural tradition and profound cultural accumulation, forming a diverse and inclusive regional cultural pattern [10]. The catering industry has gathered eight major cuisines and sixteen major groups, integrating Chinese and foreign characteristics. It has laid the foundation for the development and innovation of catering culture and created unique tourism resource conditions in the YRD. It has attracted thousands of domestic and foreign tourists as one of China’s most popular tourist destinations. Therefore, exploring the spatial distribution and patterns of the catering industry in the YRD has practical significance and demonstrable effect for the development and prosperity of regional culture and boosting tourism development in the YRD.
This study will contribute from the following aspects. First, by analyzing the spatial pattern of the catering industry in the YRD, it provides an empirical basis for improving the development of the catering industry and policy formulation. Second, this study takes culture as the starting point, uses the latest POI data of the catering industry, and applies the combination of geography and statistics to the analysis of the spatial pattern of catering facilities, which makes up for the theoretical deficiency of related research. Third, the cuisine localization index (CLI), cuisine diversity index (CDI), and cuisine geographical preference index (CGPI) were constructed for the first time. The kernel density analysis, spatial autocorrelation analysis, and statistical methods effectively demonstrate the catering industry’s development characteristics and spatial pattern. Fourth, this study preliminarily analyzes the influencing factors of the characteristics of the catering industry in the YRD from the aspects of the economy, population, open level, market, and industry through geographically weighted regression (GWR). The conclusions will help urban planners and policymakers manage spatial strategy issues related to the catering industry more effectively.
The study is organized as follows: The first section explains the purpose and significance of the research. The second section provides an overview of related work. The third section introduces the research area, data sources, and methods. The fourth section analyzes the spatial distribution characteristics and influencing factors of the catering industry in the YRD. The fifth section briefly introduces the main conclusions. Finally, the sixth section discusses these findings’ practical implications and limitations.

2. Related Work

In countries other than China, most of the related research on the layout of catering spaces focuses on the spatial distribution of single catering formats such as hotels [11], tourist restaurants [12], fast-food chains [13], and high-end restaurants [14]. The purpose is to provide a basis for the location selection of a catering space. With the deepening of the research content, more disciplines’ research methods and contents have been used in geography [15,16]. Scholars began to use different methods and models to reveal the spatial distribution characteristics of the catering industry [17,18,19]. In addition, many studies have explored the dynamic mechanism that constitutes the spatial structure of the catering industry from the aspects of economic structure, population structure, the transportation network, and land use [20,21,22,23].
In China, the earliest research on the spatial pattern of catering is from cultural geography. The research is mainly about the spatial differentiation of catering attributes such as Chinese cuisine and regional culture. The qualitative method is the main method. For example, Chen [24] revealed the regional characteristics of Chinese traditional food culture by comparing the geographical distribution of China’s four major traditional cuisines. Lan [25] combined statistical analysis, field investigation, literature records, and other methods, pointing out that the stratification phenomenon in China’s food taste is closely related to the living environment. With social progress and technological development, the research on catering space mainly focuses on the distribution characteristics of the catering space and the factors affecting the spatial pattern. Using big data such as POI data and public comment data, combined with technical methods such as geographic information systems, we can more accurately analyze the spatial distribution characteristics of catering. The factors influencing the spatial pattern are discussed from the internal and external environment of the catering industry, such as economy, culture, population, transportation, industry, land use, urban pattern, and facility environment. The research content has a certain similarity with foreign research. It can be roughly divided into two types: the spatial pattern of each catering format in a single geographical unit and the spatial distribution of a single catering format. For the spatial pattern of each catering industry in a single geographical unit, the content is mainly about the spatial distribution characteristics and influencing factors of the catering industry in cities or regions. Finally, it proposes optimization measures for the spatial layout of the catering industry. These cities include Xi’an [26], Wuhan [9], Shanghai [27], Nanjing [28], Tibet Lhasa [29], Guangzhou [30], Beijing [31]. For the spatial distribution of a single catering format, Zhao et al. [32] took the local catering and imported catering outlets in the central area of the old city of Chengdu as the research objects, describing their spatial differentiation characteristics and analyzing their spatial competition relationship. Zhou et al. [33] used statistical analysis, GIS spatial analysis, and factor analysis to analyze the time-honored restaurants in Beijing’s urban areas from the perspectives of cuisine taste and food grade. Wang et al. [34] found that Beijing’s online takeaway restaurants showed “distributed concentration” characteristics and analyzed the correlation between traditional and takeaway restaurants and economic level, transportation accessibility, facility convenience, and population distribution.
The above shows that the existing research on catering spaces focuses on catering facilities within a specific city or a specific type. Through field research, POI and other technical means reveal the characteristics and main influencing factors of the spatial distribution of the catering industry. There is a lack of comparative studies between different cities at a macro scale and studies on the richness and diversity of catering formats in urban agglomerations. In addition, there is a lack of comparative research on the spatial distribution characteristics of different catering formats. The research that takes cultural geography as the starting point and combines the latest technologies and methods to analyze the catering industry’s spatial layout and influencing factors is still a blank page. Therefore, this study takes the main urban areas of the four central cities in the YRD as the research area, combined with the latest POI data of the catering industry, and compares and analyzes the development characteristics and spatial patterns of different cuisines by constructing index, kernel density estimation, and spatial autocorrelation analysis methods. Moreover, using GWR to discuss the influencing factors of the characteristics of the catering industry, it aims to fill the gap in the relevant research and promote the development of the catering industry.

3. Materials and Methods
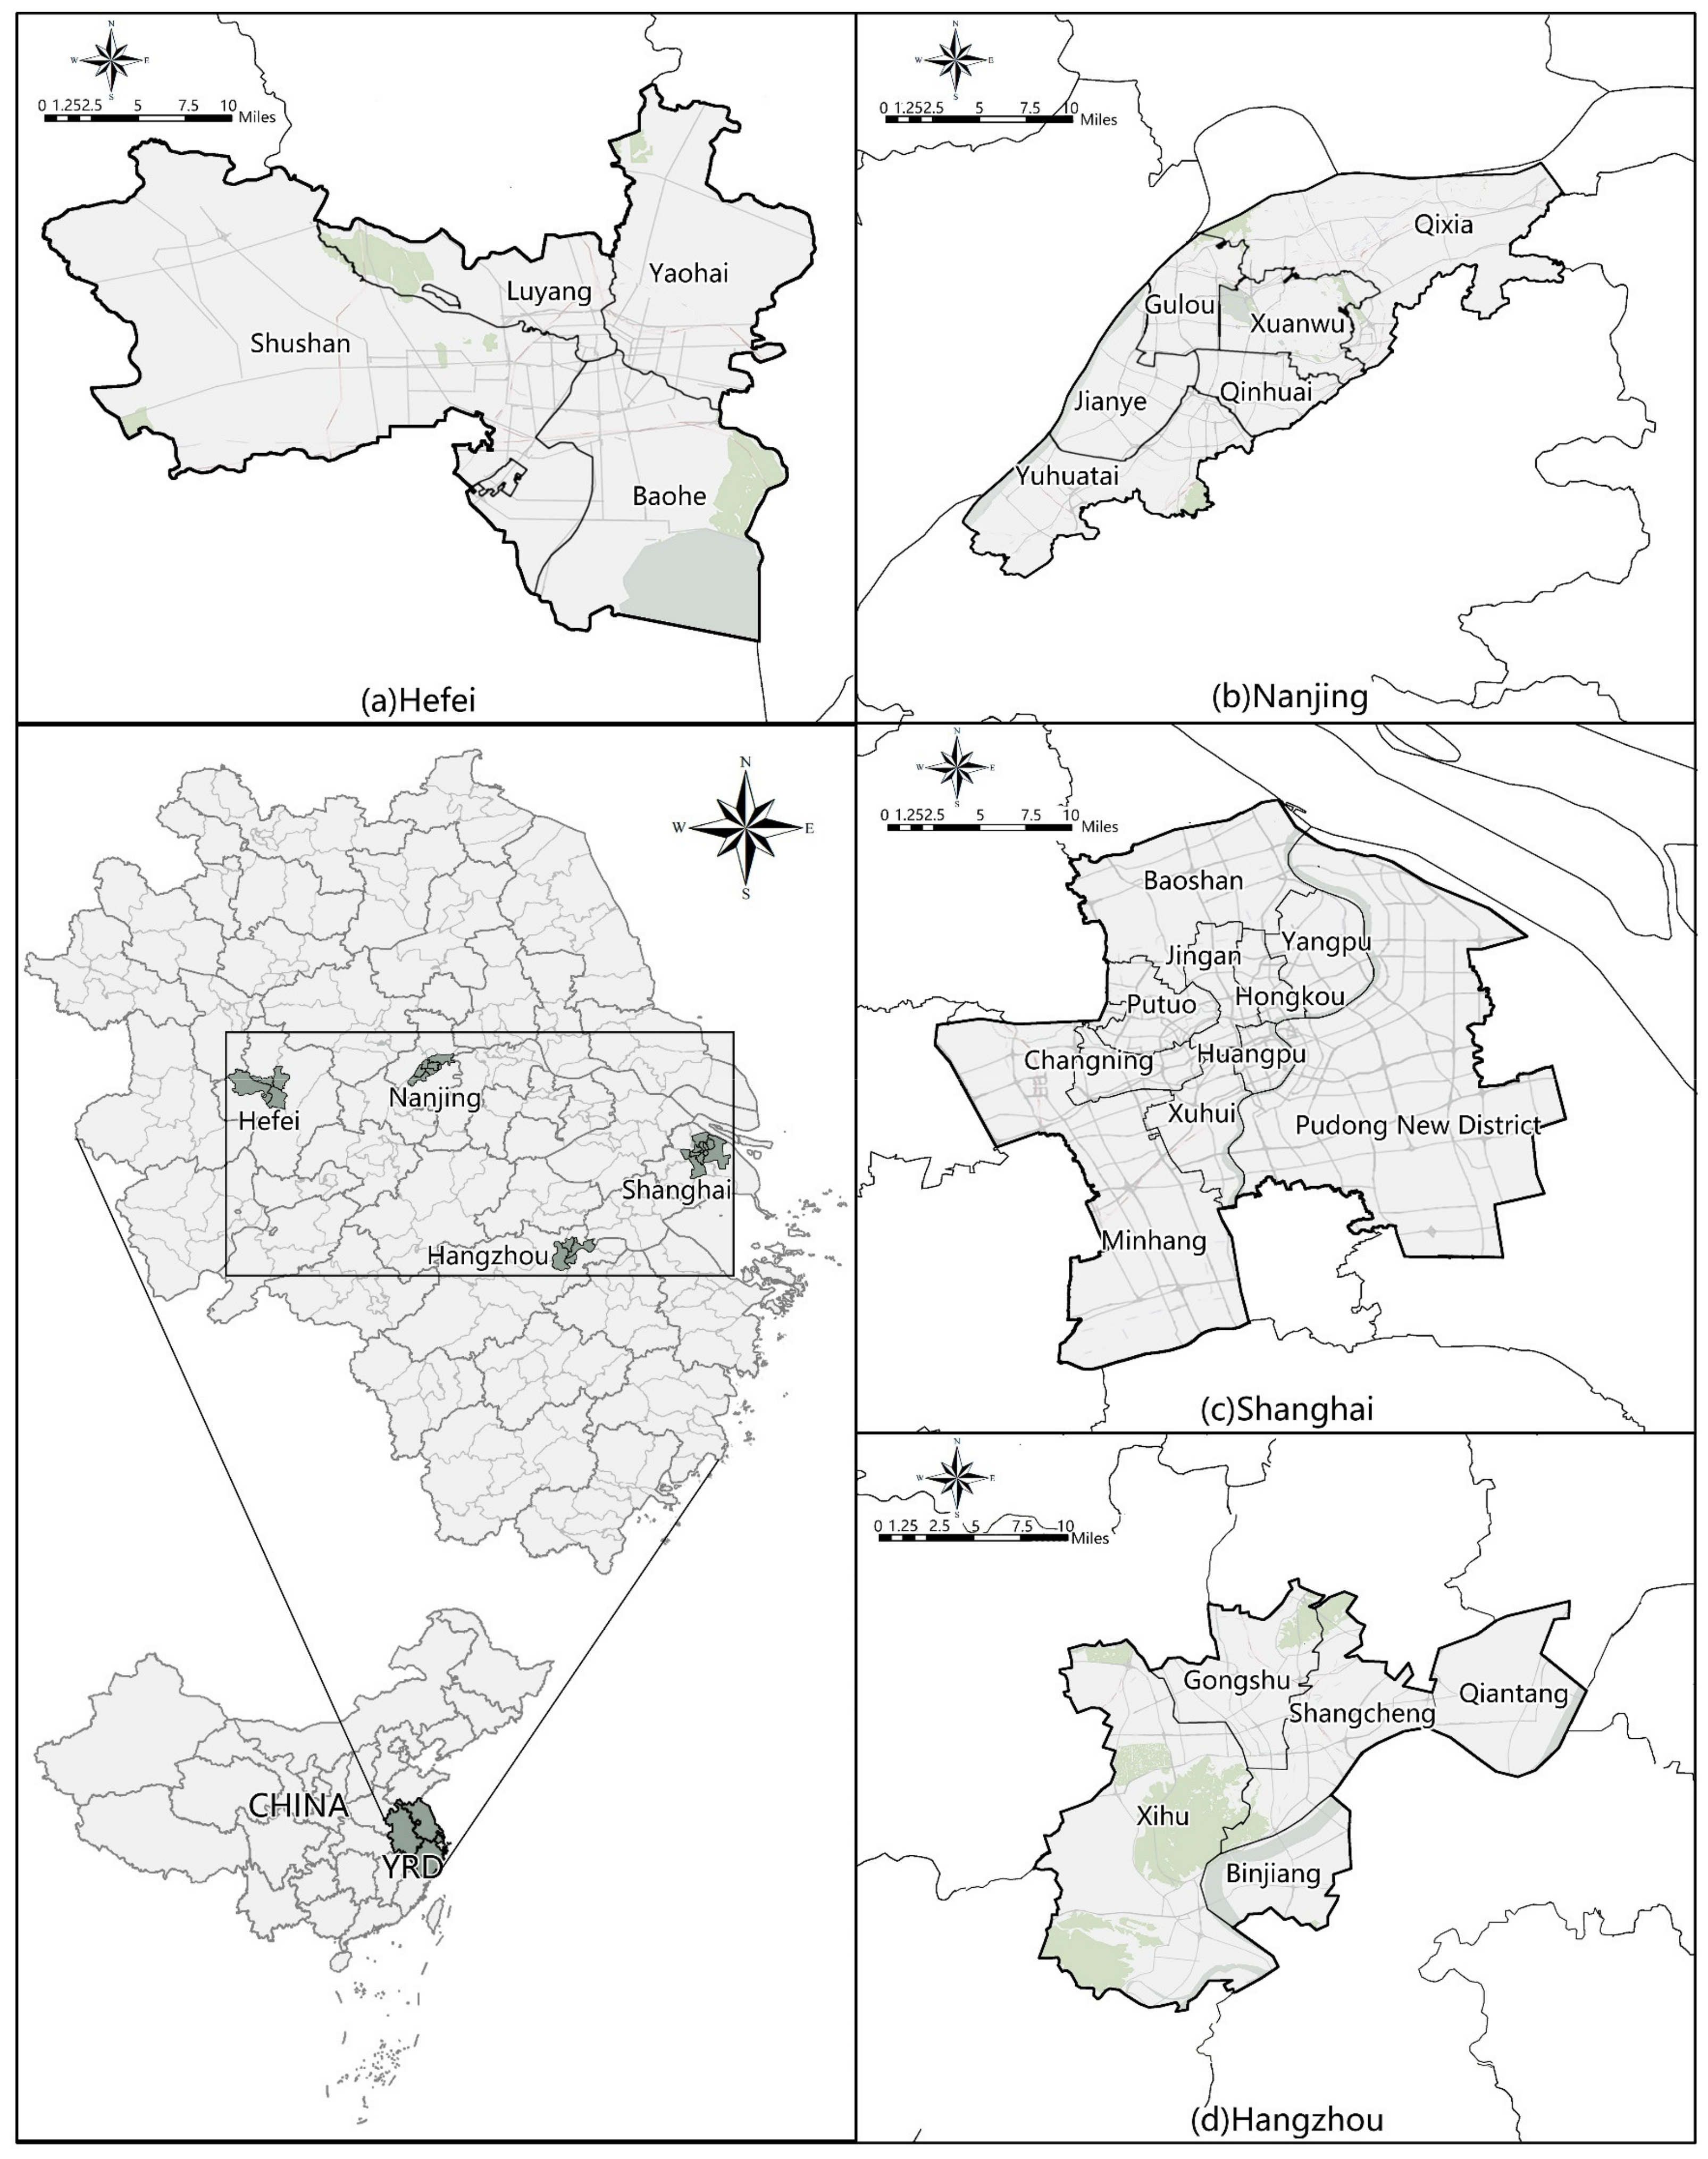
3.1. Research Area

The Yangtze River Delta (YRD) is located in the eastern coastal area of China. It is an important economic area centered on the alluvial plain of the YRD, including Shanghai, Jiangsu, Zhejiang, and Anhui. According to the 2020 National Bureau of Statistics, the population of the three provinces and one city in the YRD has reached 235 million, accounting for about one-sixth of China’s population, and the GDP has reached about 22 trillion yuan, accounting for 21.08% of the national GDP. The YRD is the largest urban agglomeration in the world.
Based on considering the basic conditions for the development of urban catering spaces, the main urban areas of the four central cities in the YRD are determined as the research area, namely Shanghai, Hangzhou in Zhejiang Province, Nanjing in Jiangsu Province, and Hefei in Anhui Province (Figure 1). The main urban area of Shanghai is the area within the outer ring line [35], covering Huangpu, Xuhui, Changning, Jing’an, Putuo, Hongkou, Yangpu, Minhang, Baoshan, and Pudong New District, with an area of about 664 km2. The main urban area of Hangzhou is selected from the old city of Hangzhou, including the current Shangcheng, Binjiang, West Lake, Gongshu, and Qiantang, with an area of about 705 km2. The main urban area of Nanjing is the old city of Nanjing and the traditional suburban areas [36], including the six municipal districts of Drum Tower, Xuanwu, Jianye, Qinhuai, Yuhuatai, and Qixia, with an area of about 410.61 km2. The main urban area of Hefei mainly covers Yaohai, Shushan, Baohe, Luyan, Hefei Economic and Technological Development Zone, and Binhu New District [37], with an area of about 1310 km2.

3.2. Data Sources

This study adopts the number and distribution of restaurants to characterize the catering industry. The research data are branded restaurants in the main urban areas of Shanghai, Hangzhou, Nanjing, and Hefei. The research uses Python software to crawl the POI and related attribute data of the catering facilities of the Amap Open Platform (https://lbs.amap.com/ accessed on 28 November 2021) in November 2021, through the API interface. The attribute information in the data includes the name, address, latitude, and longitude of the catering outlet and the category of the catering business. The vector data collection within the administrative boundaries of the main urban areas of the four cities comes from the Open Street Map (OSM, https://www.openstreetmap.org/ accessed on 15 December 2021) area downloaded by the QGIS3.1 software and the data information includes the administrative scope and road network. In addition, the research uses the ArcGIS10.2 platform to identify the crawled restaurants and related attribute information. Finally, a geographic database of the catering spaces in the main urban areas of the four central cities in the YRD is formed. Data related to national economic and social development were obtained from the government websites of the four cities and administrative regions.

3.3. Research Methods

3.3.1. Catering Industry Development Index

In this study, three new indicators that characterize the development of urban cuisine and the regional characteristics of urbanization were constructed, namely, the cuisine localization index (CLI), the cuisine diversity index (CDI), and the cuisine geographical preference index (CGPI). They are used to characterize the overall characteristics of the cuisine culture, cuisine structure, and cuisine tendency in the development of the catering industry in the YRD.
  • Cuisine localization index (CLI)
    CLI represents the proportion of local cuisine among the urban cuisines, which can reflect the localization development characteristics of the urban catering industry. The formula is:
    C L I = Q S
    where S is the total number of restaurants, Q is the total number of restaurants with local cuisines.
  • Cuisine diversity index (CDI)
    CDI is constructed according to the Shannon–Wiener index principle in ecology [38], combined with the characteristics of urban cuisine. The CDI describes the compositional richness and balance of urban cuisine. The formula is:
    C D I = i = 1 s P i ln P i
    where S is the number of categories of cuisine, Pi is the proportion of the i-th category of cuisines. If there is only one type of cuisine in the area, the CDI reaches the minimum value of 0. When there are n types of cuisine in a specific area and are evenly distributed, the CDI reaches the maximum value ln 1 n .
  • Cuisine geographical preference index (CGPI)
    CGPI [39] represents the preference index of urban residents to a specific cuisine, which can reflect the preference characteristics of the urban catering industry development. The formula is:
    C G P I = N S
    where S is the total number of restaurants, N is the total number of restaurants of a specific cuisine.

3.3.2. Spatial Pattern of Catering Industry

This study combines kernel density estimation and spatial autocorrelation analysis to analyze the spatial agglomeration characteristics and spatial distribution pattern of the catering industry in the YRD from the perspectives of geography and statistics.
  • Kernel density estimation
    Kernel density estimation is a method to study the probability of the occurrence of points at different locations in space [40]. In this study, kernel density estimation is used on the agglomeration centers and points of restaurant to obtain the spatial distribution pattern of different cuisines. The formula is:
    F n x = 1 n r i = 1 n k x x i r
    where k x x i r is the kernel density function of catering industries, x is the location of restaurant points, xi is the restaurant points set to be estimated, r is the bandwidth for the search radius distance (r > 0), n is the number of restaurant points in the range of bandwidth.
  • Spatial autocorrelation analysis
    Spatial autocorrelation analysis is used to explore the spatial agglomeration and correlation of CLI, CDI and the number of restaurants with different cuisines in different administrative districts [41]. In this study, Moran’s I index is used to analyze the global spatial correlation characteristics, and local Moran’s I index is used to analyze the spatial correlation degree between area i and surrounding areas.
    Moran’s I index is used to measure the spatial correlation model, which is obtained by the following formula [42]:
    I = i = 1 n j = 1 n w i j x i x ¯ x j x ¯ S 2 · i = 1 n j = 1 n w i j
    S 2 = 1 n · i = 1 n x i x ¯
    where xi and xj are the number of restaurants in the administrative districts in the geographic units of area i and j, and wij is the spatial weight matrix. The local Moran’s I index for an area i measures the association between a value at i and values of its nearby areas, defined as [43]:
    I i = x i x ¯ s x 2 j w i j x j x ¯
    where s x 2 = j x j x ¯ 2 n , represents the variance, and other notations are the same as in Equation (5).

3.3.3. Influencing Factors of Catering Industry

If there is spatial autocorrelation between the data in regression analysis, the traditional regression model will no longer be suitable [44]. The geographically weighted regression model (GWR) can incorporate spatial location factors into traditional regression models so that the relationship between variables can vary with spatial location. Therefore, this study uses GWR to explore the influencing factors of CLI and CDI. The model structure is as follows:
y i = β 0 u i , v i + k = 1 p β k u i , v i x i k + ε i
where u i , v i is the geographic center coordinate of the i-th spatial unit; β k u i , v i is the regression coefficient of the k-th variable of the i-th spatial unit; p is the number of variables; ε i is the error term.

4. Results and Analysis

4.1. General Characteristics of the Development of the Catering Industry

Firstly, we preprocessed the POI data of catering services. By removing erroneous POI points and repeated outliers and reclassifying the identified biased POI data [45], 223,079 restaurants in the main urban areas of Shanghai, Hangzhou, Nanjing, and Hefei were collected. Secondly, according to the category of catering service POI data provided by the Amap open platform itself, it was divided into Chinese restaurants, foreign restaurants, and restaurants that cannot be identified and were collectively referred to as other restaurants. Chinese restaurants were further divided into 12 cuisines: Jiangsu and Zhejiang cuisine, Cantonese cuisine, Fujian cuisine, Northeastern cuisine, Shandong cuisine, Shanghai cuisine, Sichuan cuisine, Halal Northwest Anhui cuisine, Hunan cuisine, Beijing cuisine, and Yunnan and Guizhou cuisine [24,46].
After sorting out, there were 118,833 restaurants in the main urban area of Shanghai, 39,004 restaurants in the main urban area of Hangzhou, 29,940 restaurants in the main urban area of Nanjing, and 35,302 restaurants in the main urban area of Hefei. The number of restaurants in the main urban area of Shanghai far exceeded that of the other three cities, and the number of restaurants in the main urban areas of Hangzhou, Nanjing, and Hefei was not much different. By analyzing the proportion of Chinese restaurants and foreign restaurants in the main urban areas of the four cities (Table 1), it was found that the proportion of Chinese restaurants in Shanghai was the lowest. The other three cities did not differ much, with Hefei having the highest proportion of Chinese restaurants. However, Hefei had the lowest proportion of foreign restaurants, followed by Hangzhou, Shanghai, and Nanjing. Overall, there are 119,291 Chinese restaurants and 7332 foreign restaurants in the YRD, with a ratio of 16.3:1. Shanghai dominates with Chinese restaurants in the YRD (38.2%), Hangzhou (22.7%), and Hefei (22.7%) are not much different, and Nanjing has the least (22.7%). The proportion of foreign restaurants in Shanghai far exceeds that of other cities (56.9%), followed by Hangzhou (19.9%), Nanjing (13.2%), and Hefei (10.0%).
The crawled restaurant POI data was established in GIS software to build a visual model. The geographic distribution map of the restaurants in the main urban areas of the four cities was obtained. The spatial pattern of Chinese restaurants (Figure 2) and foreign restaurants (Figure 3) in the central cities of the YRD was analyzed using the kernel density analysis tool, with a bandwidth of 5000 m. In terms of the spatial distribution of Chinese restaurants, the core areas of the main urban areas of the four cities formed the main agglomeration areas. The core area of Shanghai is located in Nanjing West Road, People’s Square, and the Qufu Road area. The core area of Nanjing is located near Xinjiekou Subway Station. The core area of Hangzhou is located near Fengqi Road and Wulinmen. The core area of Hefei City is located in the Huancheng Park Ring area. However, the agglomeration characteristics of the four cities were not the same. Shanghai and Nanjing had the highest degree of agglomeration. Shanghai had a wider agglomeration range, and Nanjing had a higher agglomeration intensity. Hangzhou and Hefei have formed a spatial structure of agglomeration center-agglomeration points. The agglomeration points are located near Hangzhou’s Jinsha Lake in Qiantang District, Sanba Subway Station in Xihu District, Changhe Station in Binjiang District, and Hefei’s Huizhou Avenue in Baohe District. The spatial distribution of foreign restaurants has formed a pattern with Shanghai as the main agglomeration area Nanjing and Hangzhou as the secondary agglomeration areas. Except for Hangzhou, all three cities only formed a single agglomeration center in the core area of the main urban area. However, Hangzhou formed a small agglomeration point near Jinsha Lake.

4.2. The Characteristics of Catering Development Based on the Catering Industry Development Index

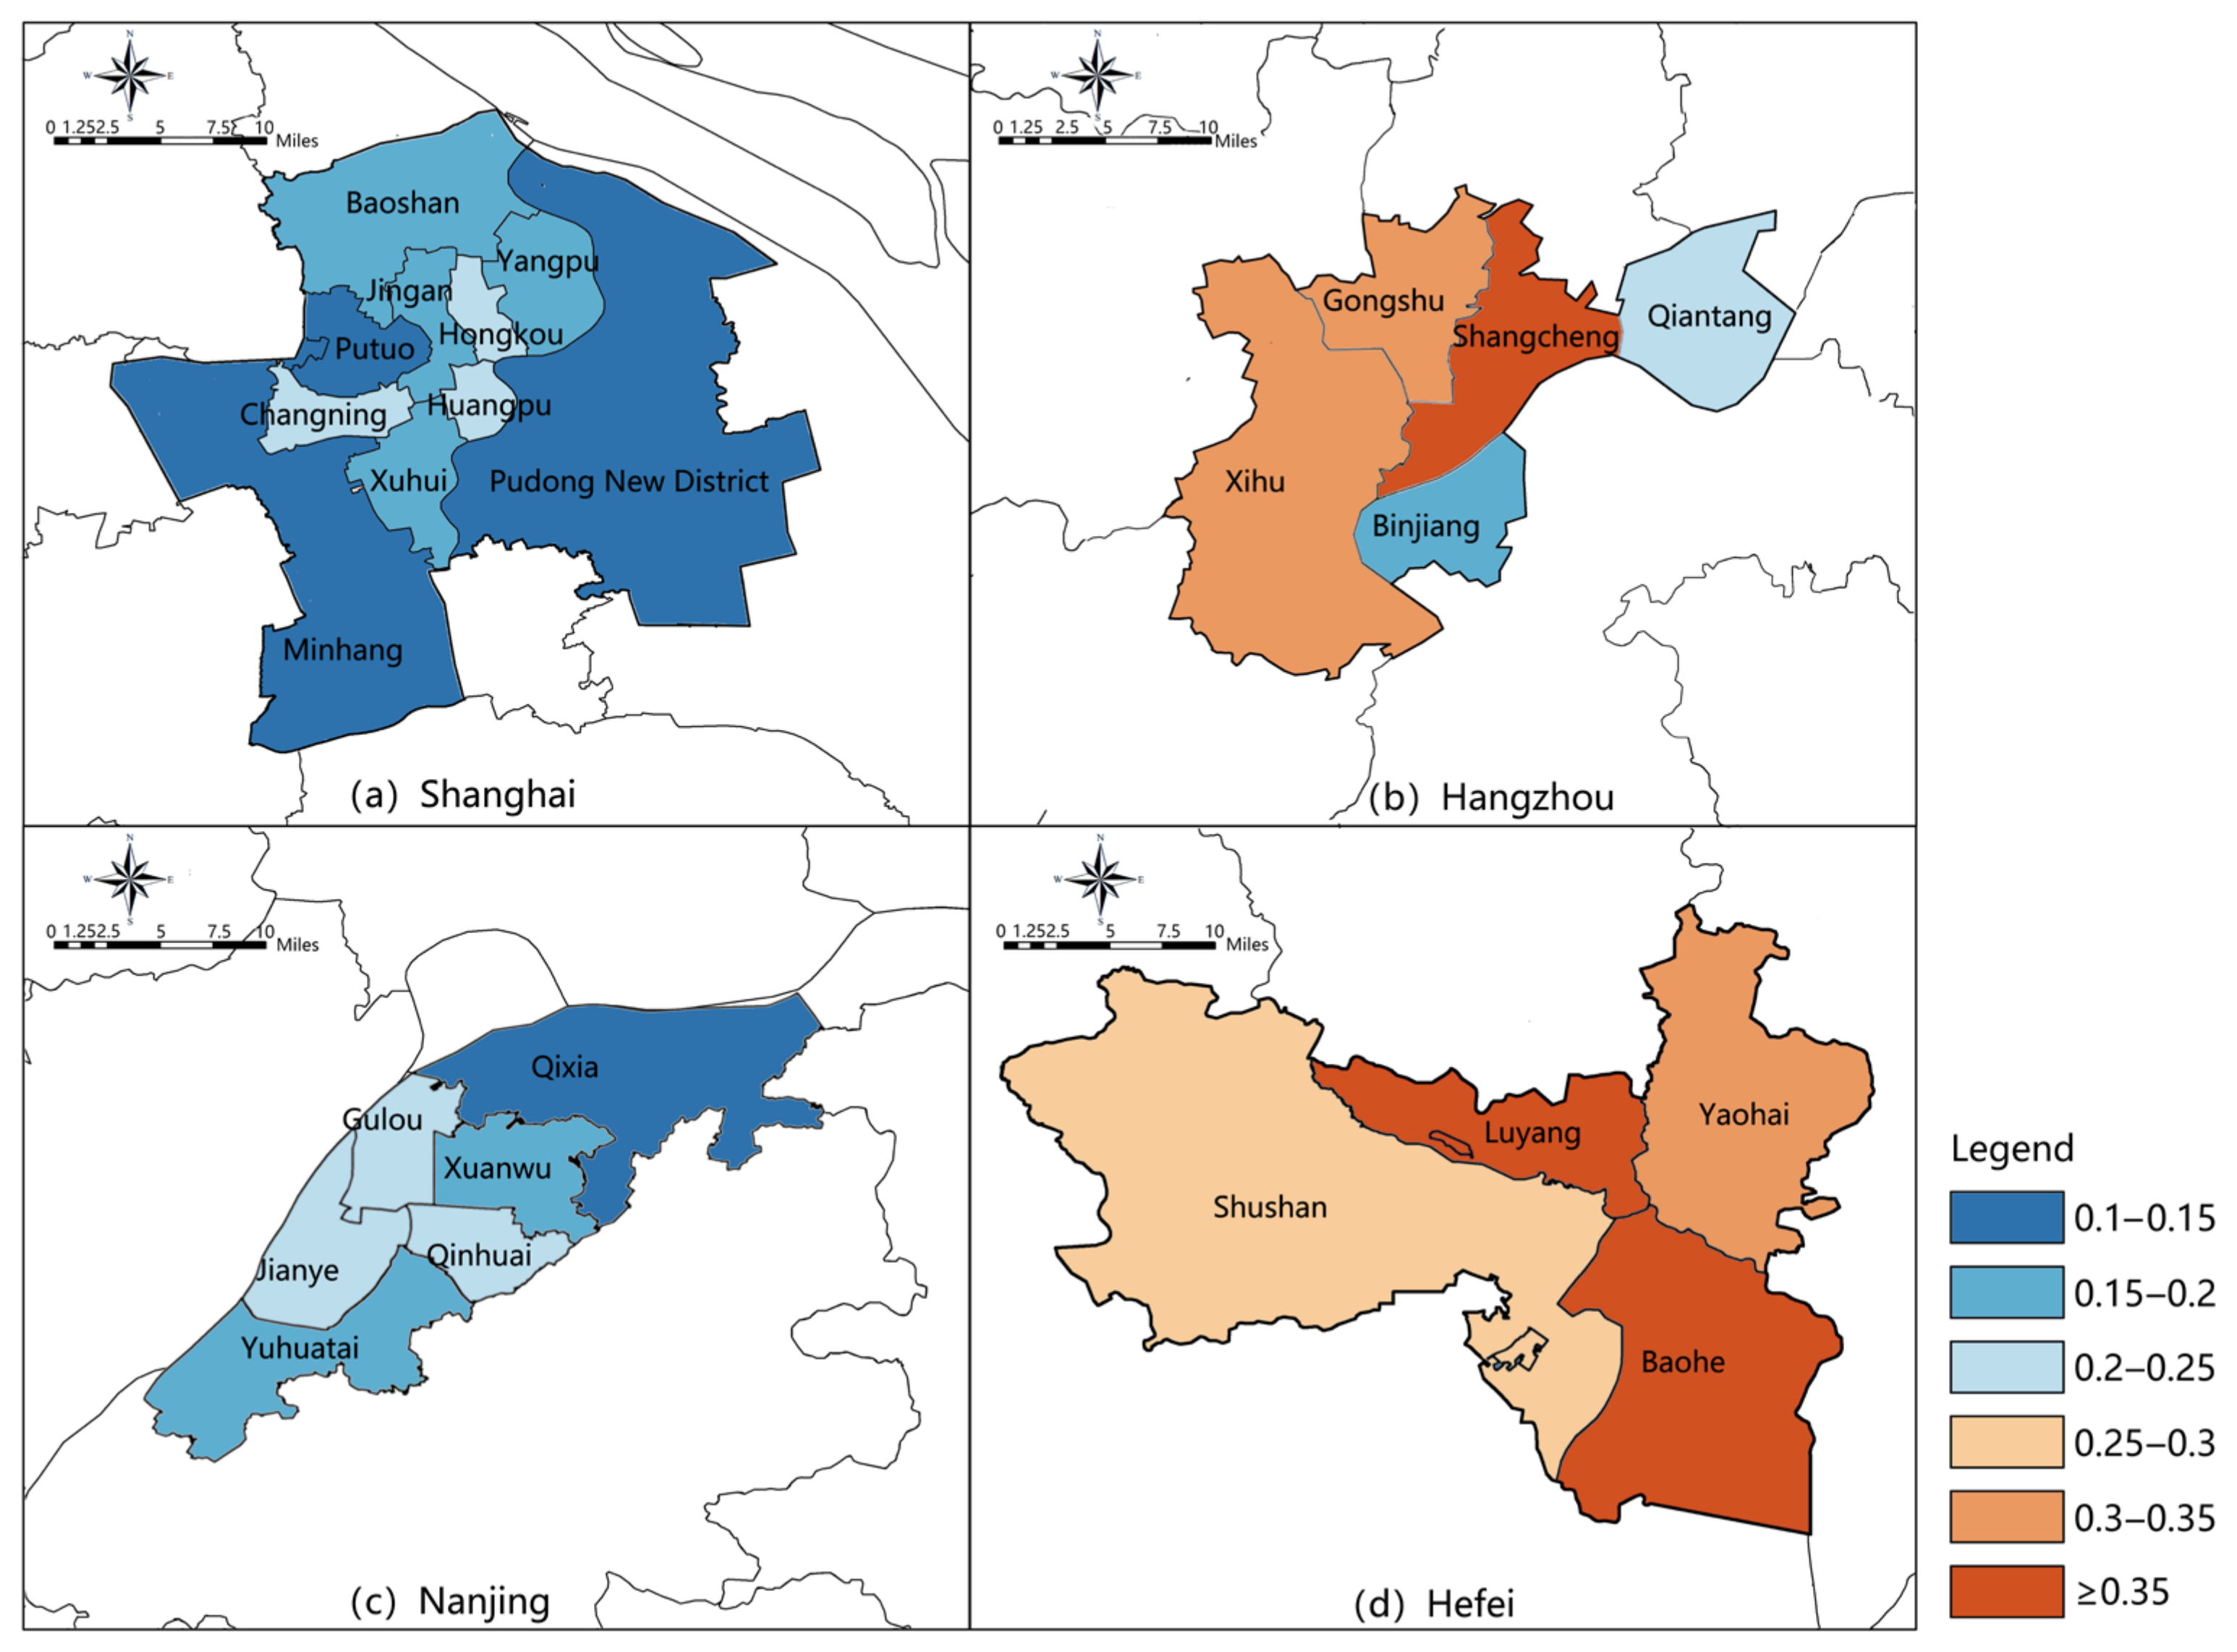
4.2.1. Regional Characteristics of Catering Based on CLI

According to Formula (1), the CLI of the four central cities and each administrative district in the YRD were calculated. It can be concluded that the local characteristics of the cuisine in the main urban area of Hefei were the most prominent, with a CLI of 0.32. Hangzhou was slightly lower than Hefei, with a CLI of 0.29. Shanghai and Nanjing were about half of the levels of Hefei and Hangzhou, at 0.16 and 0.18. Therefore, the local regional characteristics of Shanghai and Nanjing cuisines are general, and the local regional characteristics of Hangzhou and Hefei cuisines are outstanding. According to the CLI range of each administrative district of the main urban area of the four central cities, the CLI was divided into six levels. The CLI of each administrative district was further compared (Figure 4). The CLI of most administrative districts in Hangzhou and Hefei was higher than that in Shanghai and Nanjing, which was also consistent with the comparison results of the city CLI. Shangcheng District, Luyang District of Hangzhou, and Baohe District of Hefei had the highest CLI, as high as 0.38, followed by Xihu District and Gongshu District of Hangzhou, and Yaohai District of Hefei, the CLI was at a high level, between 0.3–0.35. The CLI of all the administrative districts in Shanghai and Nanjing was low in the YRD, with a CLI below 0.25. Among them, Minhang District, Pudong New District, Putuo District of Shanghai, and Qixia District of Nanjing were at the lowest level, and the CLI of Qixia District was only 0.1.
The research used the global spatial autocorrelation analysis tool in ArcGIS software to analyze the spatial agglomeration characteristics of the CLI in 25 administrative districts in the main urban areas of the four central cities in the YRD. The Moran’s I index was 0.5602 > 0, indicating that the CLI was positively correlated in space. The Z score was 4.31, the p-value was less than 0.01, reaching a 99% confidence level, the probability of generating a random pattern was less than 1%, and the CLI had significant spatial agglomeration characteristics. Further combined with the LISA map (Figure 5), it was found that there were five high-high districts, accounting for 20% of the total. They are distributed in all the main urban areas of Hefei and the Gongshu District of Hangzhou. There was one low-low district, accounting for 4% of the total, which is Pudong New District of Shanghai. Furthermore, 76% of the districts were not significant and thus showed a tendency to be randomly distributed.

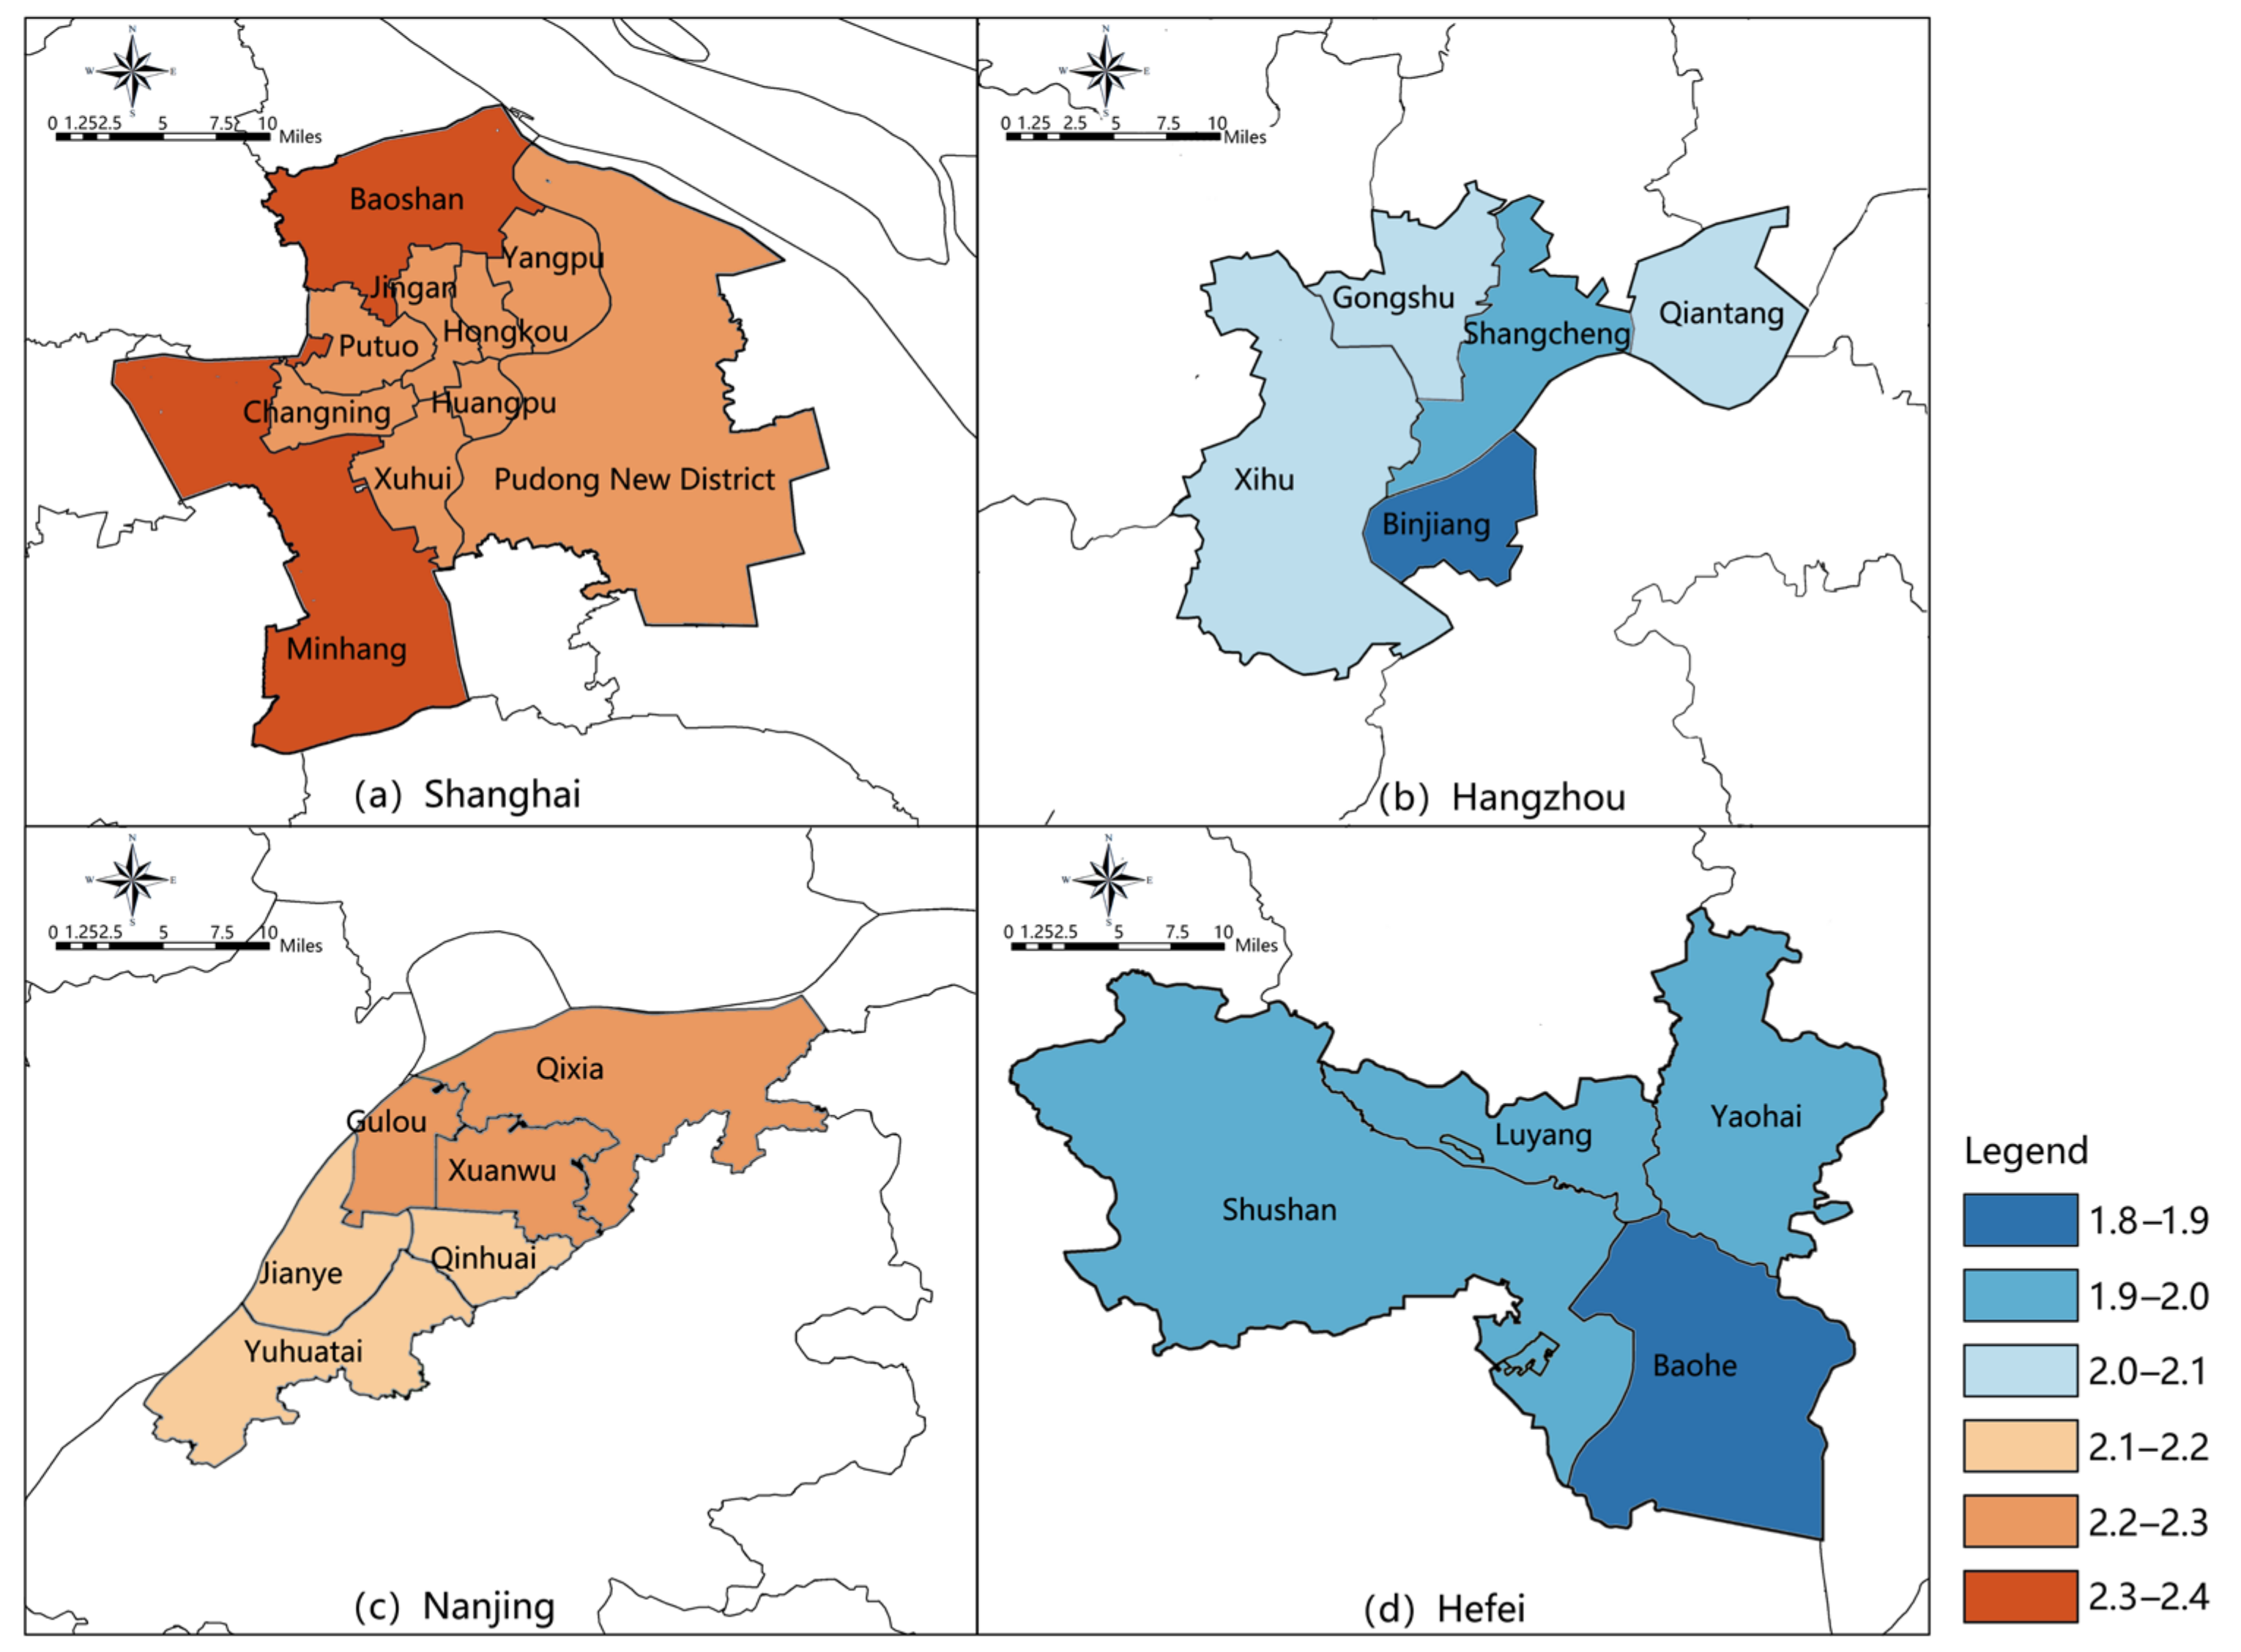
4.2.2. Composition Characteristics of Catering Based on CDI

According to Formula (2), the CDI of the four central cities and each administrative district in the YRD were calculated. It showed that Shanghai had the highest diversity of cuisines, with a CDI of 2.28. Nanjing was slightly lower than Shanghai, with a CDI of 2.21, followed by the CDI of Hangzhou at 2.02, and Hefei had the lowest diversity of cuisines, with a CDI of 1.94. Therefore, the composition of cuisines in Shanghai and Nanjing is more balanced, and the composition of cuisines in Hangzhou and Hefei is relatively simple. According to the range of the CDI of each administrative district of the main urban area of the four central cities in the YRD, the CDI was equally divided into six levels (Figure 6). It can be seen that the CDI of all the administrative districts in Shanghai and Nanjing was higher than that in Hangzhou and Hefei. The CDI of all administrative districts of the former was at a high level, and CDI was higher than 2.1. The latter was at a low level, and CDI was below 2.1. Minhang District and Baoshan District of Shanghai had the highest CDI at 2.3. The other eight administrative districts in Shanghai and Gulou District, Xuanwu District, Qixia District of Nanjing were slightly below the highest level, with CDI between 2.2 and 2.3. The Binjiang District of Hangzhou and Baohe District of Hefei had the lowest CDI, at 1.82 and 1.89.
Through global spatial autocorrelation analysis, the spatial agglomeration characteristics of CDI in the YRD were explored. The Moran’s I index was 0.8362 > 0, indicating that the CDI was positively correlated in space. The Z score was 6.24, the p-value was less than 0.01, reaching a 99% confidence level, the probability of generating a random pattern was less than 1%, and the CDI had a significant spatial agglomeration characteristic. Combined with the LISA map (Figure 7), it was found that there were three high-high districts, accounting for 12% of the total, distributed in the Baoshan District, Minhang District, and Pudong New District of Shanghai. There are seven low-low districts, accounting for 28% of the total, distributed in the main urban area of Hefei and Xihu District, Shangcheng District, and Binjiang District of Hangzhou. Furthermore, 60% of the districts were not significant and thus showed a tendency to be randomly distributed.

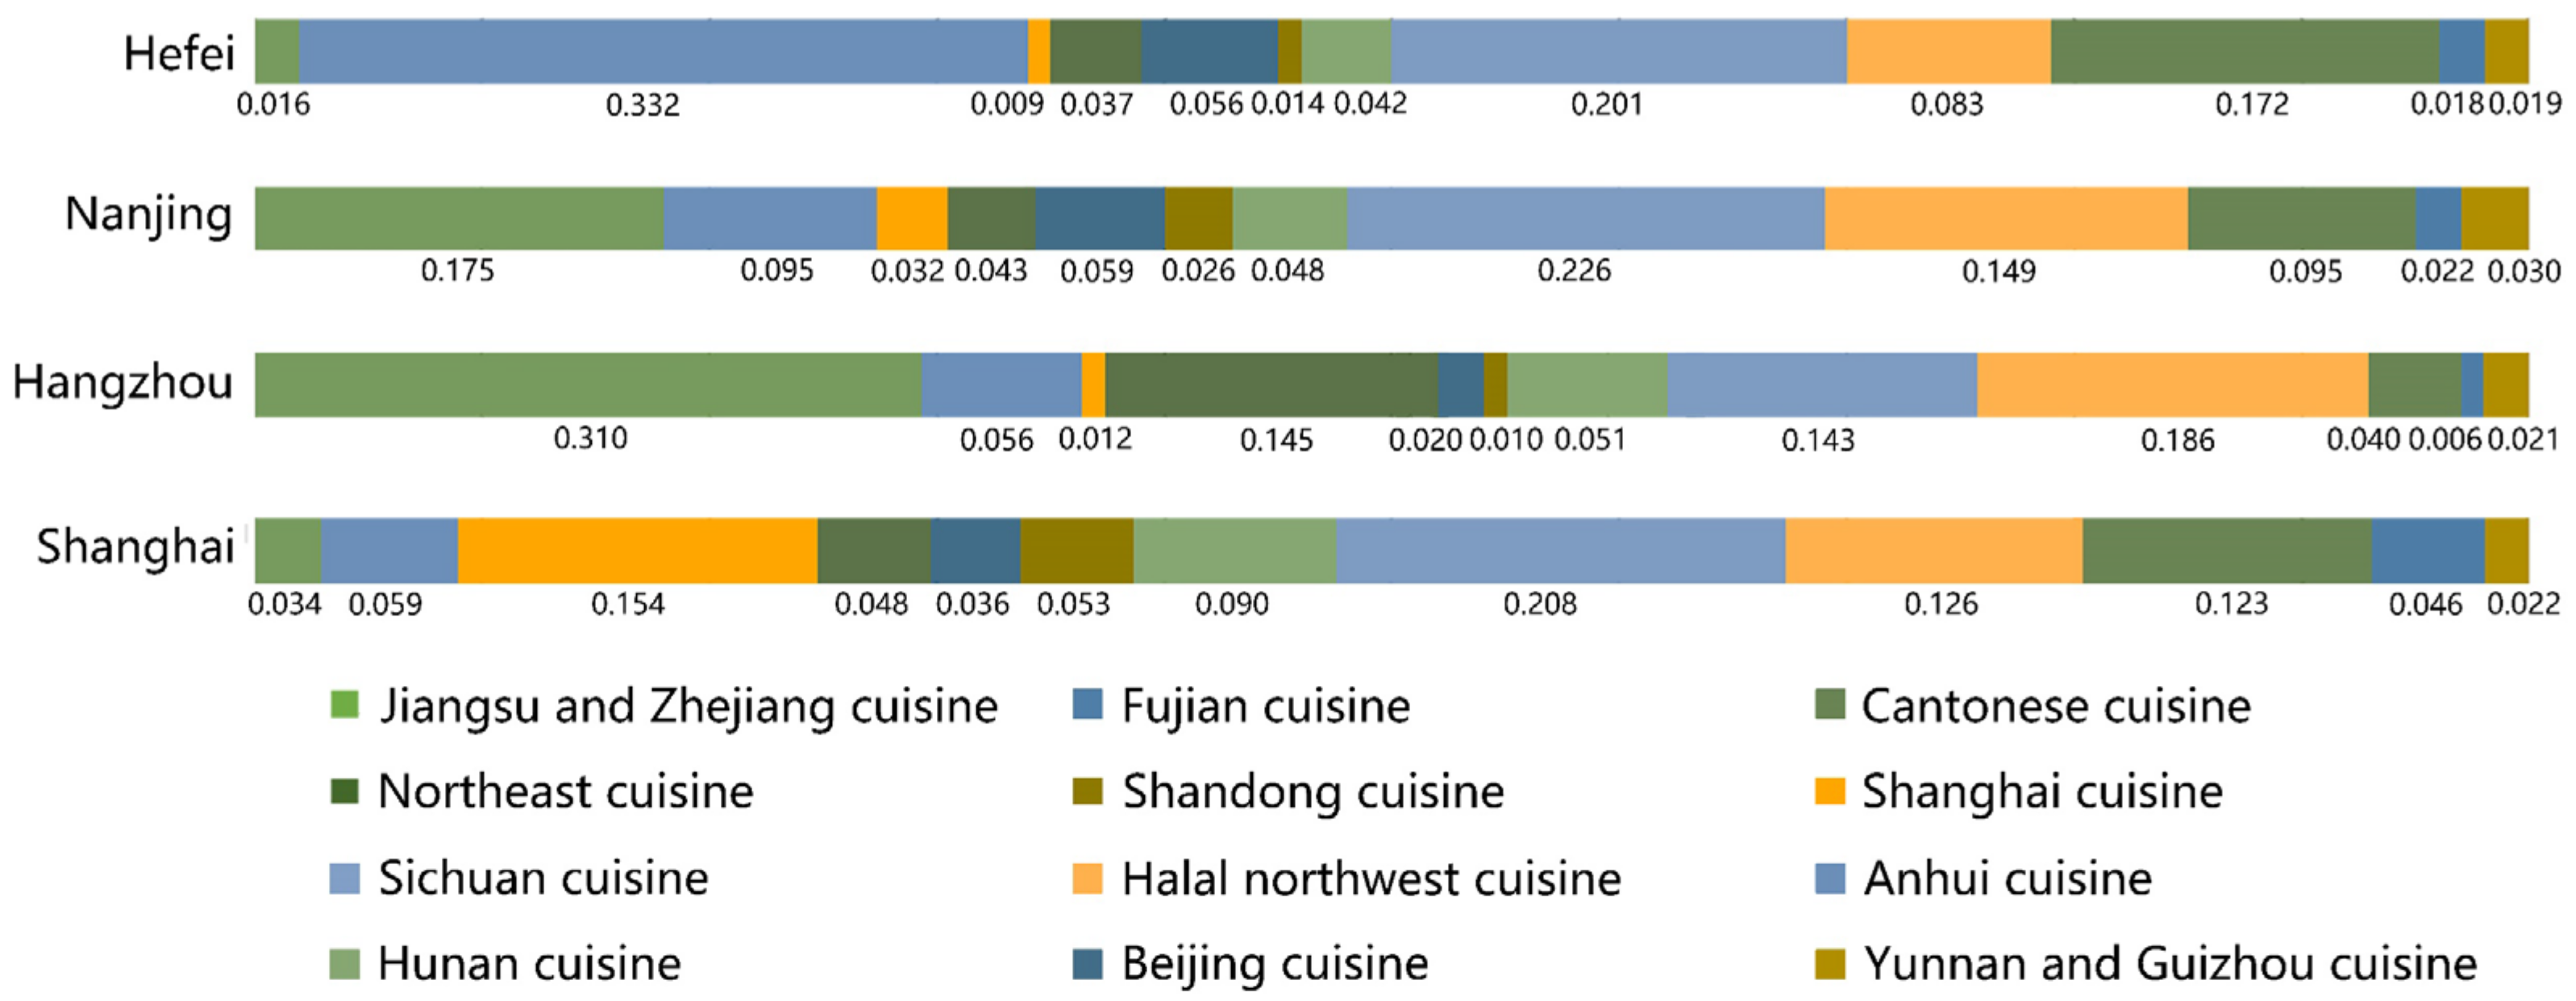
4.2.3. Food Preference Characteristics Based on CGPI

According to Equation (3), the CGPI of the four cities was calculated (Figure 8). Shanghai had the highest CGPI for Sichuan cuisine, as high as 0.208, followed by Shanghai cuisine, Halal Northwestern cuisine, and Cantonese cuisine, all of which had a CGPI of over 0.1. Hangzhou’s CGPI for Jiangsu and Zhejiang cuisine was far higher than all other cuisines, as high as 0.31, followed by Halal Northwestern cuisine, Northeast cuisine, and Sichuan cuisine, with a CGPI of 0.186, 0.145 and 0.143. Fujian cuisine was the lowest at 0.006. Nanjing also had the highest CGPI for Sichuan cuisine, as high as 0.226, followed by Jiangsu and Zhejiang cuisine and Halal Northwest cuisine. There were as many as five cuisines with a CGPI of 0.1 or more. The CGPI for Anhui cuisine in Hefei was the highest in the YRD, as high as 0.332. Next, were Sichuan cuisine and Cantonese cuisine. The CGPI for other cuisines was below 0.1, and Shanghai cuisine was the lowest at 0.009. The preferred cuisines in the main urban areas of the four central cities of the YRD were Sichuan cuisine and Halal northwestern cuisines, combined with local regional cuisines, and Fujian cuisine, Shandong cuisine, and Yunnan and Guizhou cuisine were relatively scarce.

4.3. Catering Spatial Pattern Based on Spatial Analysis of Catering Industry

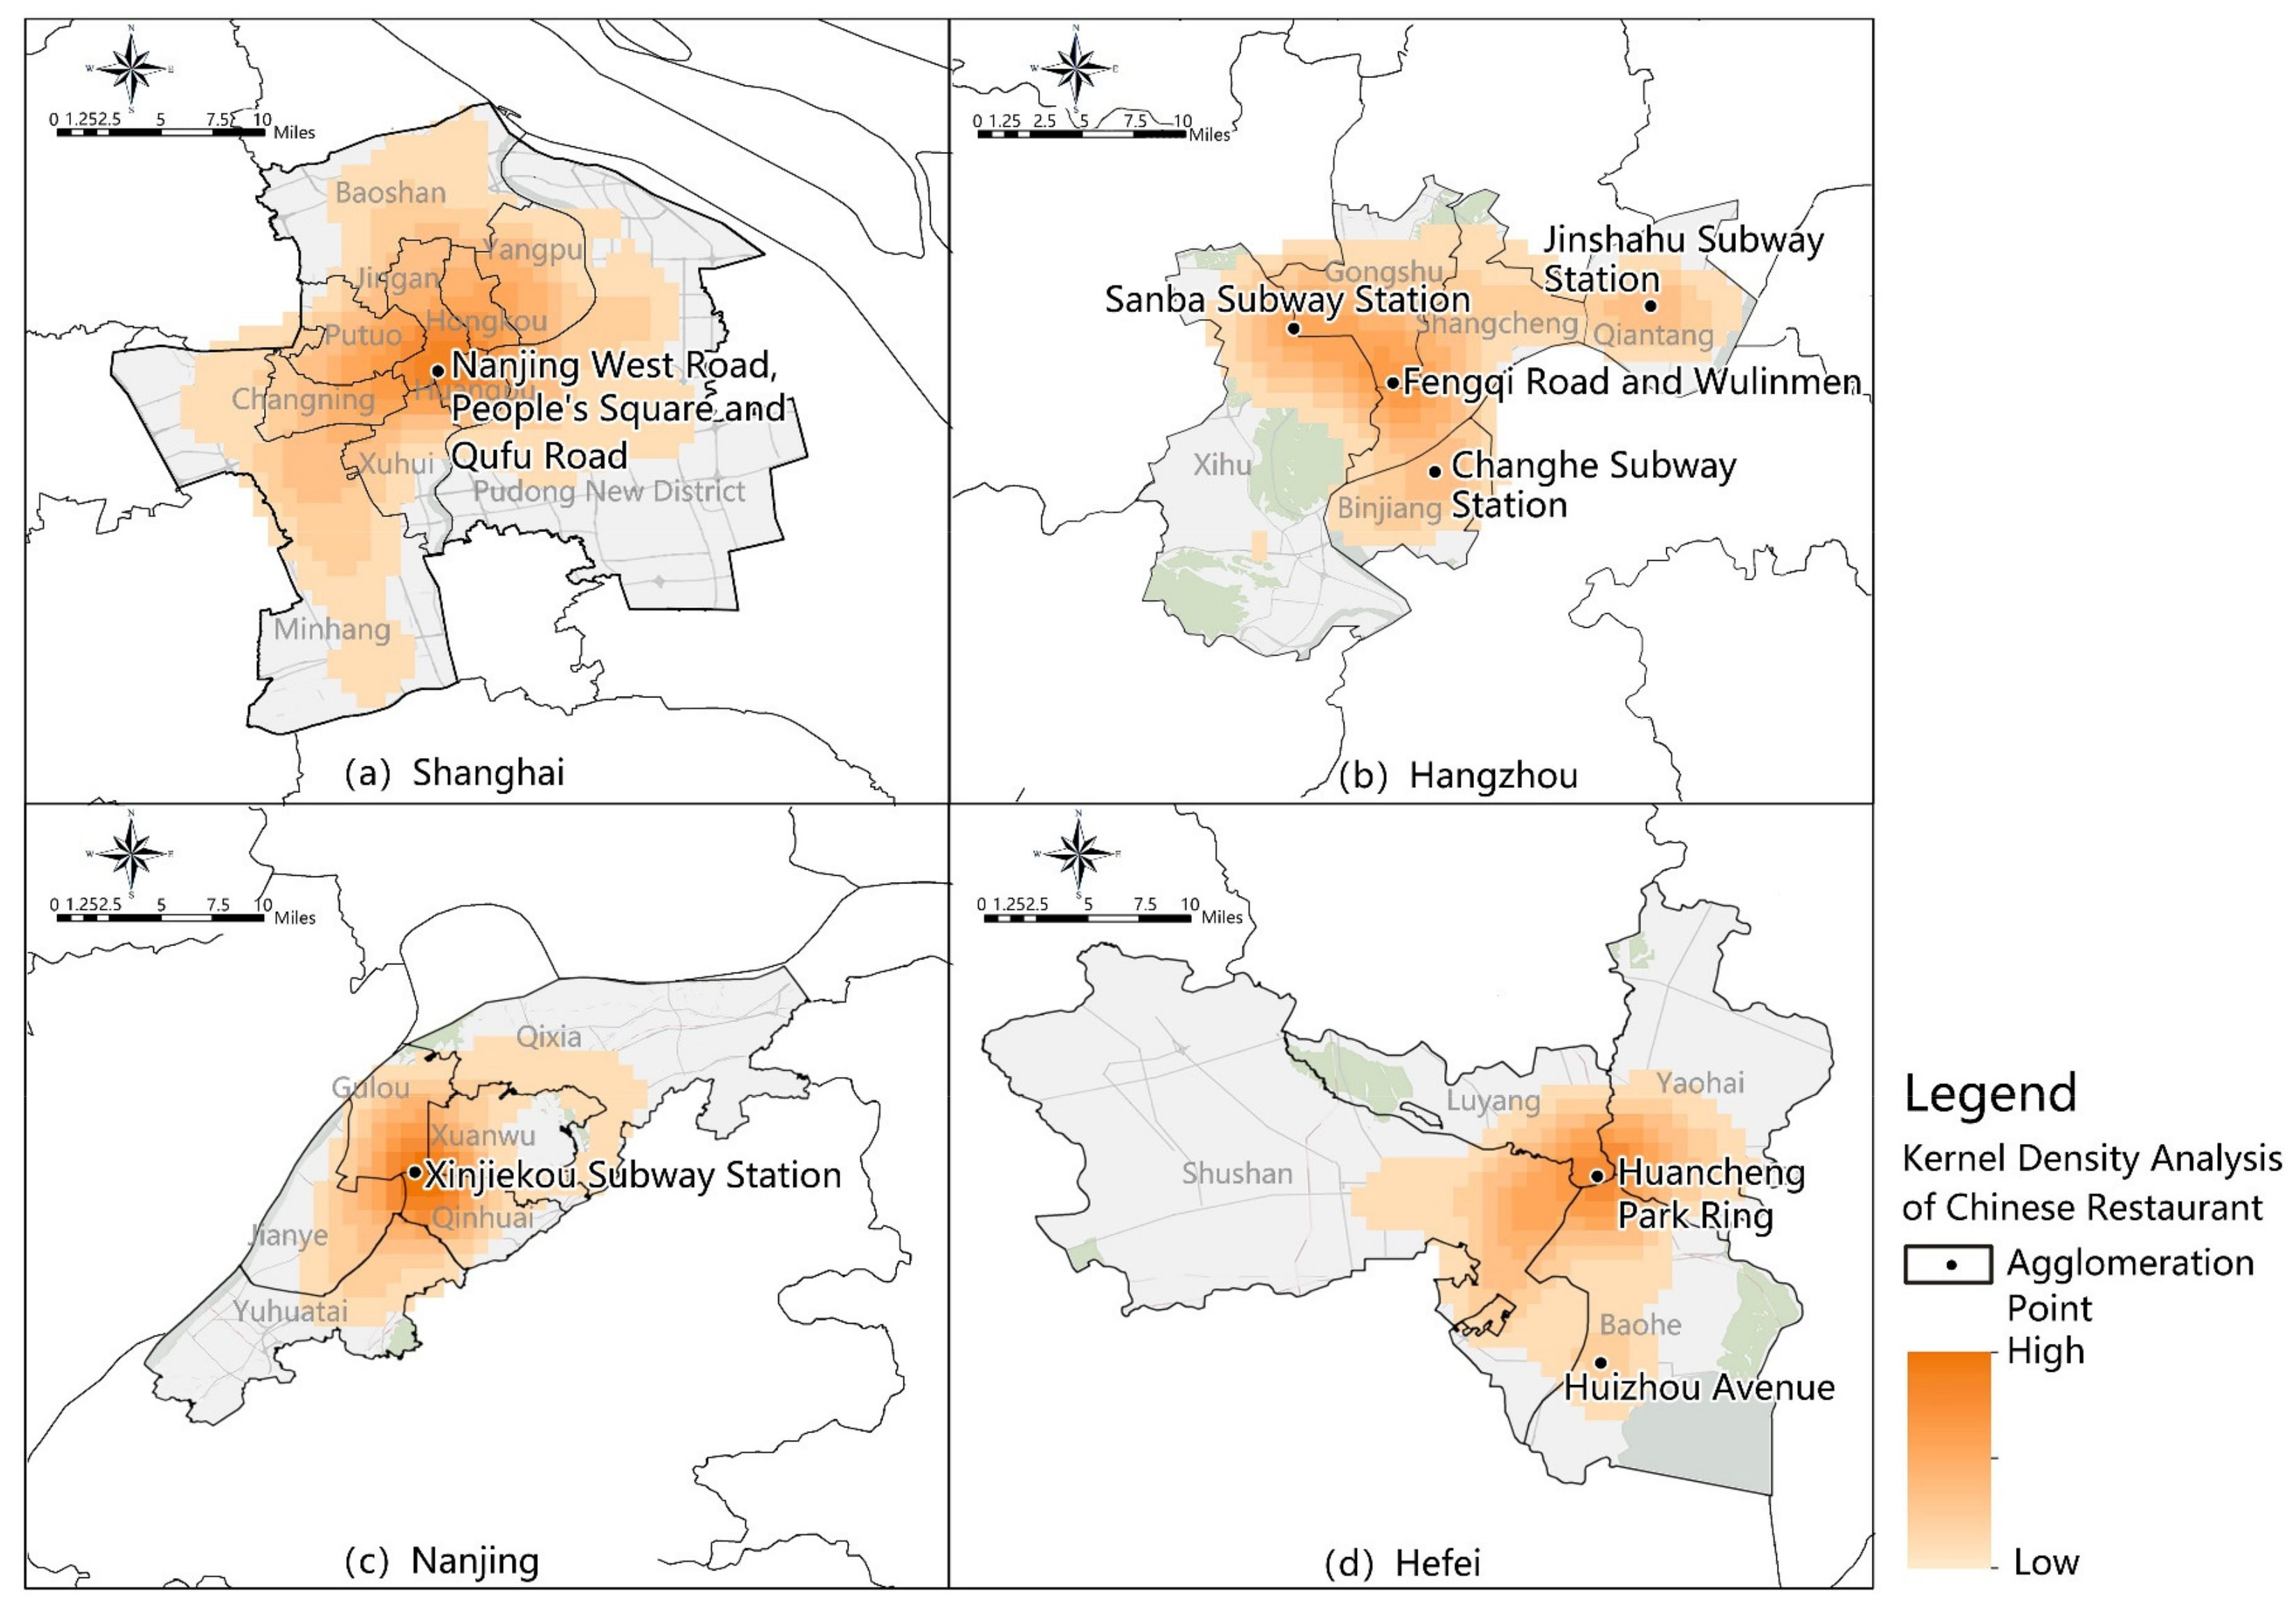
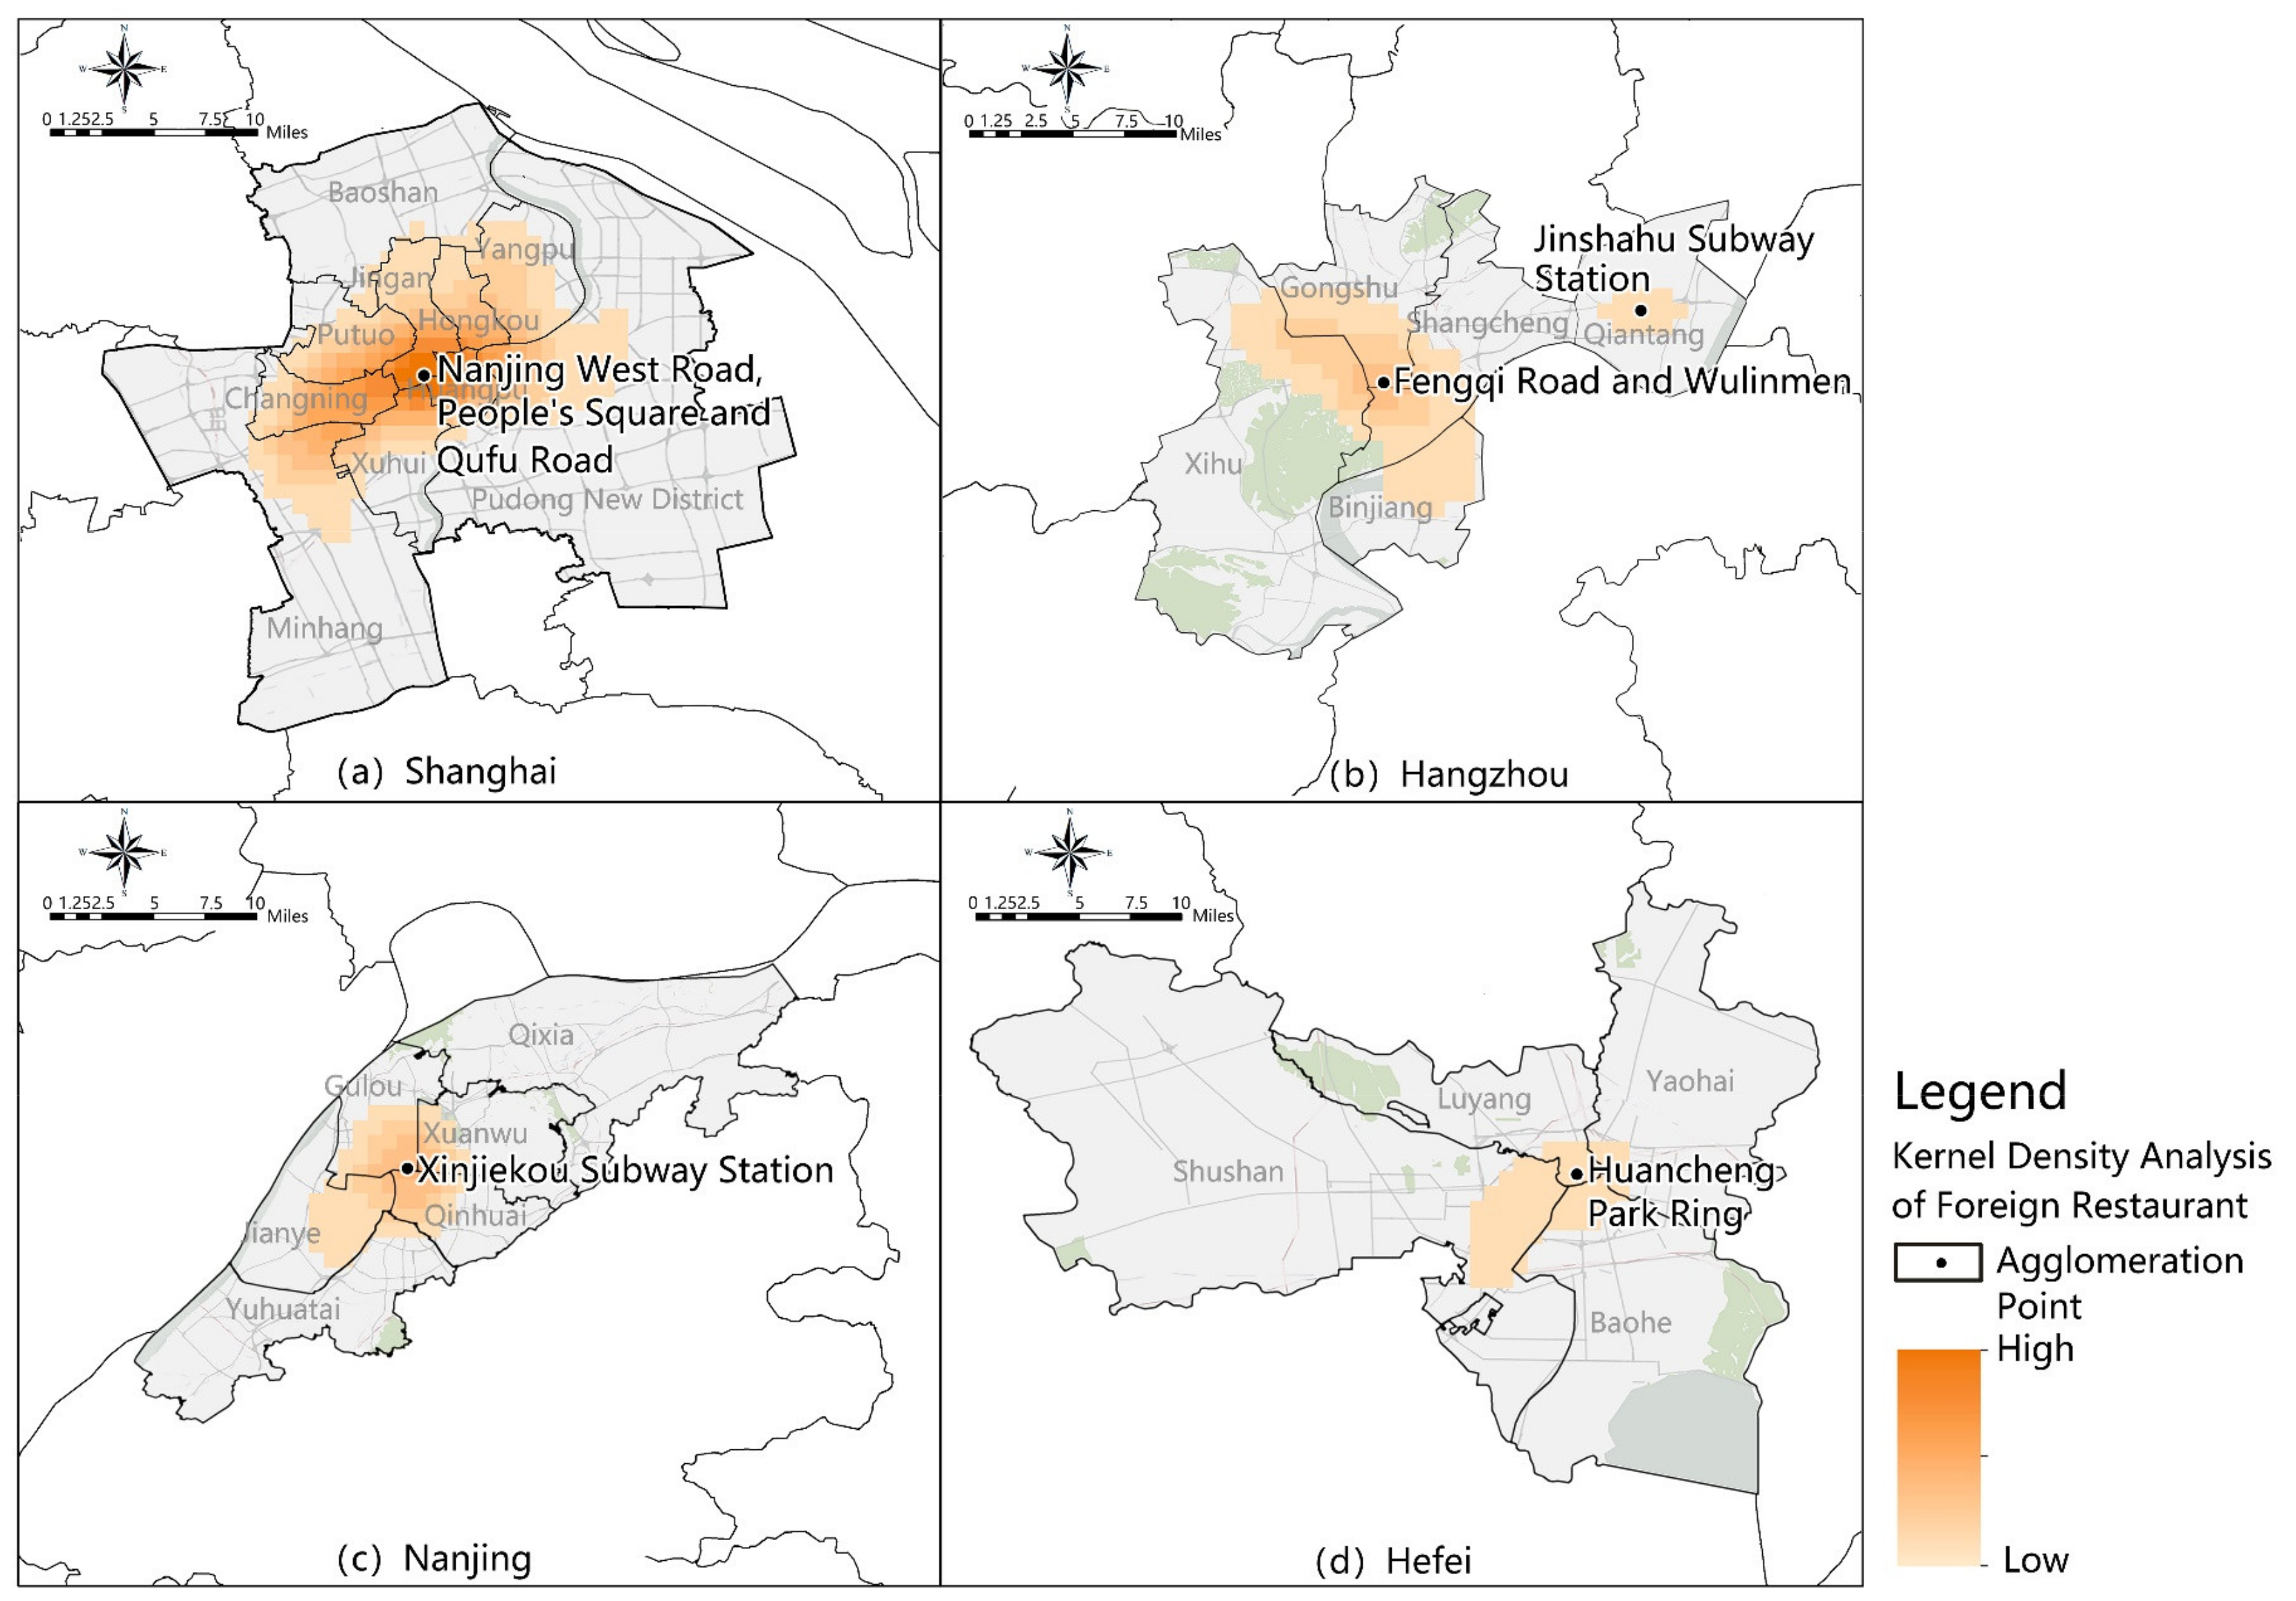
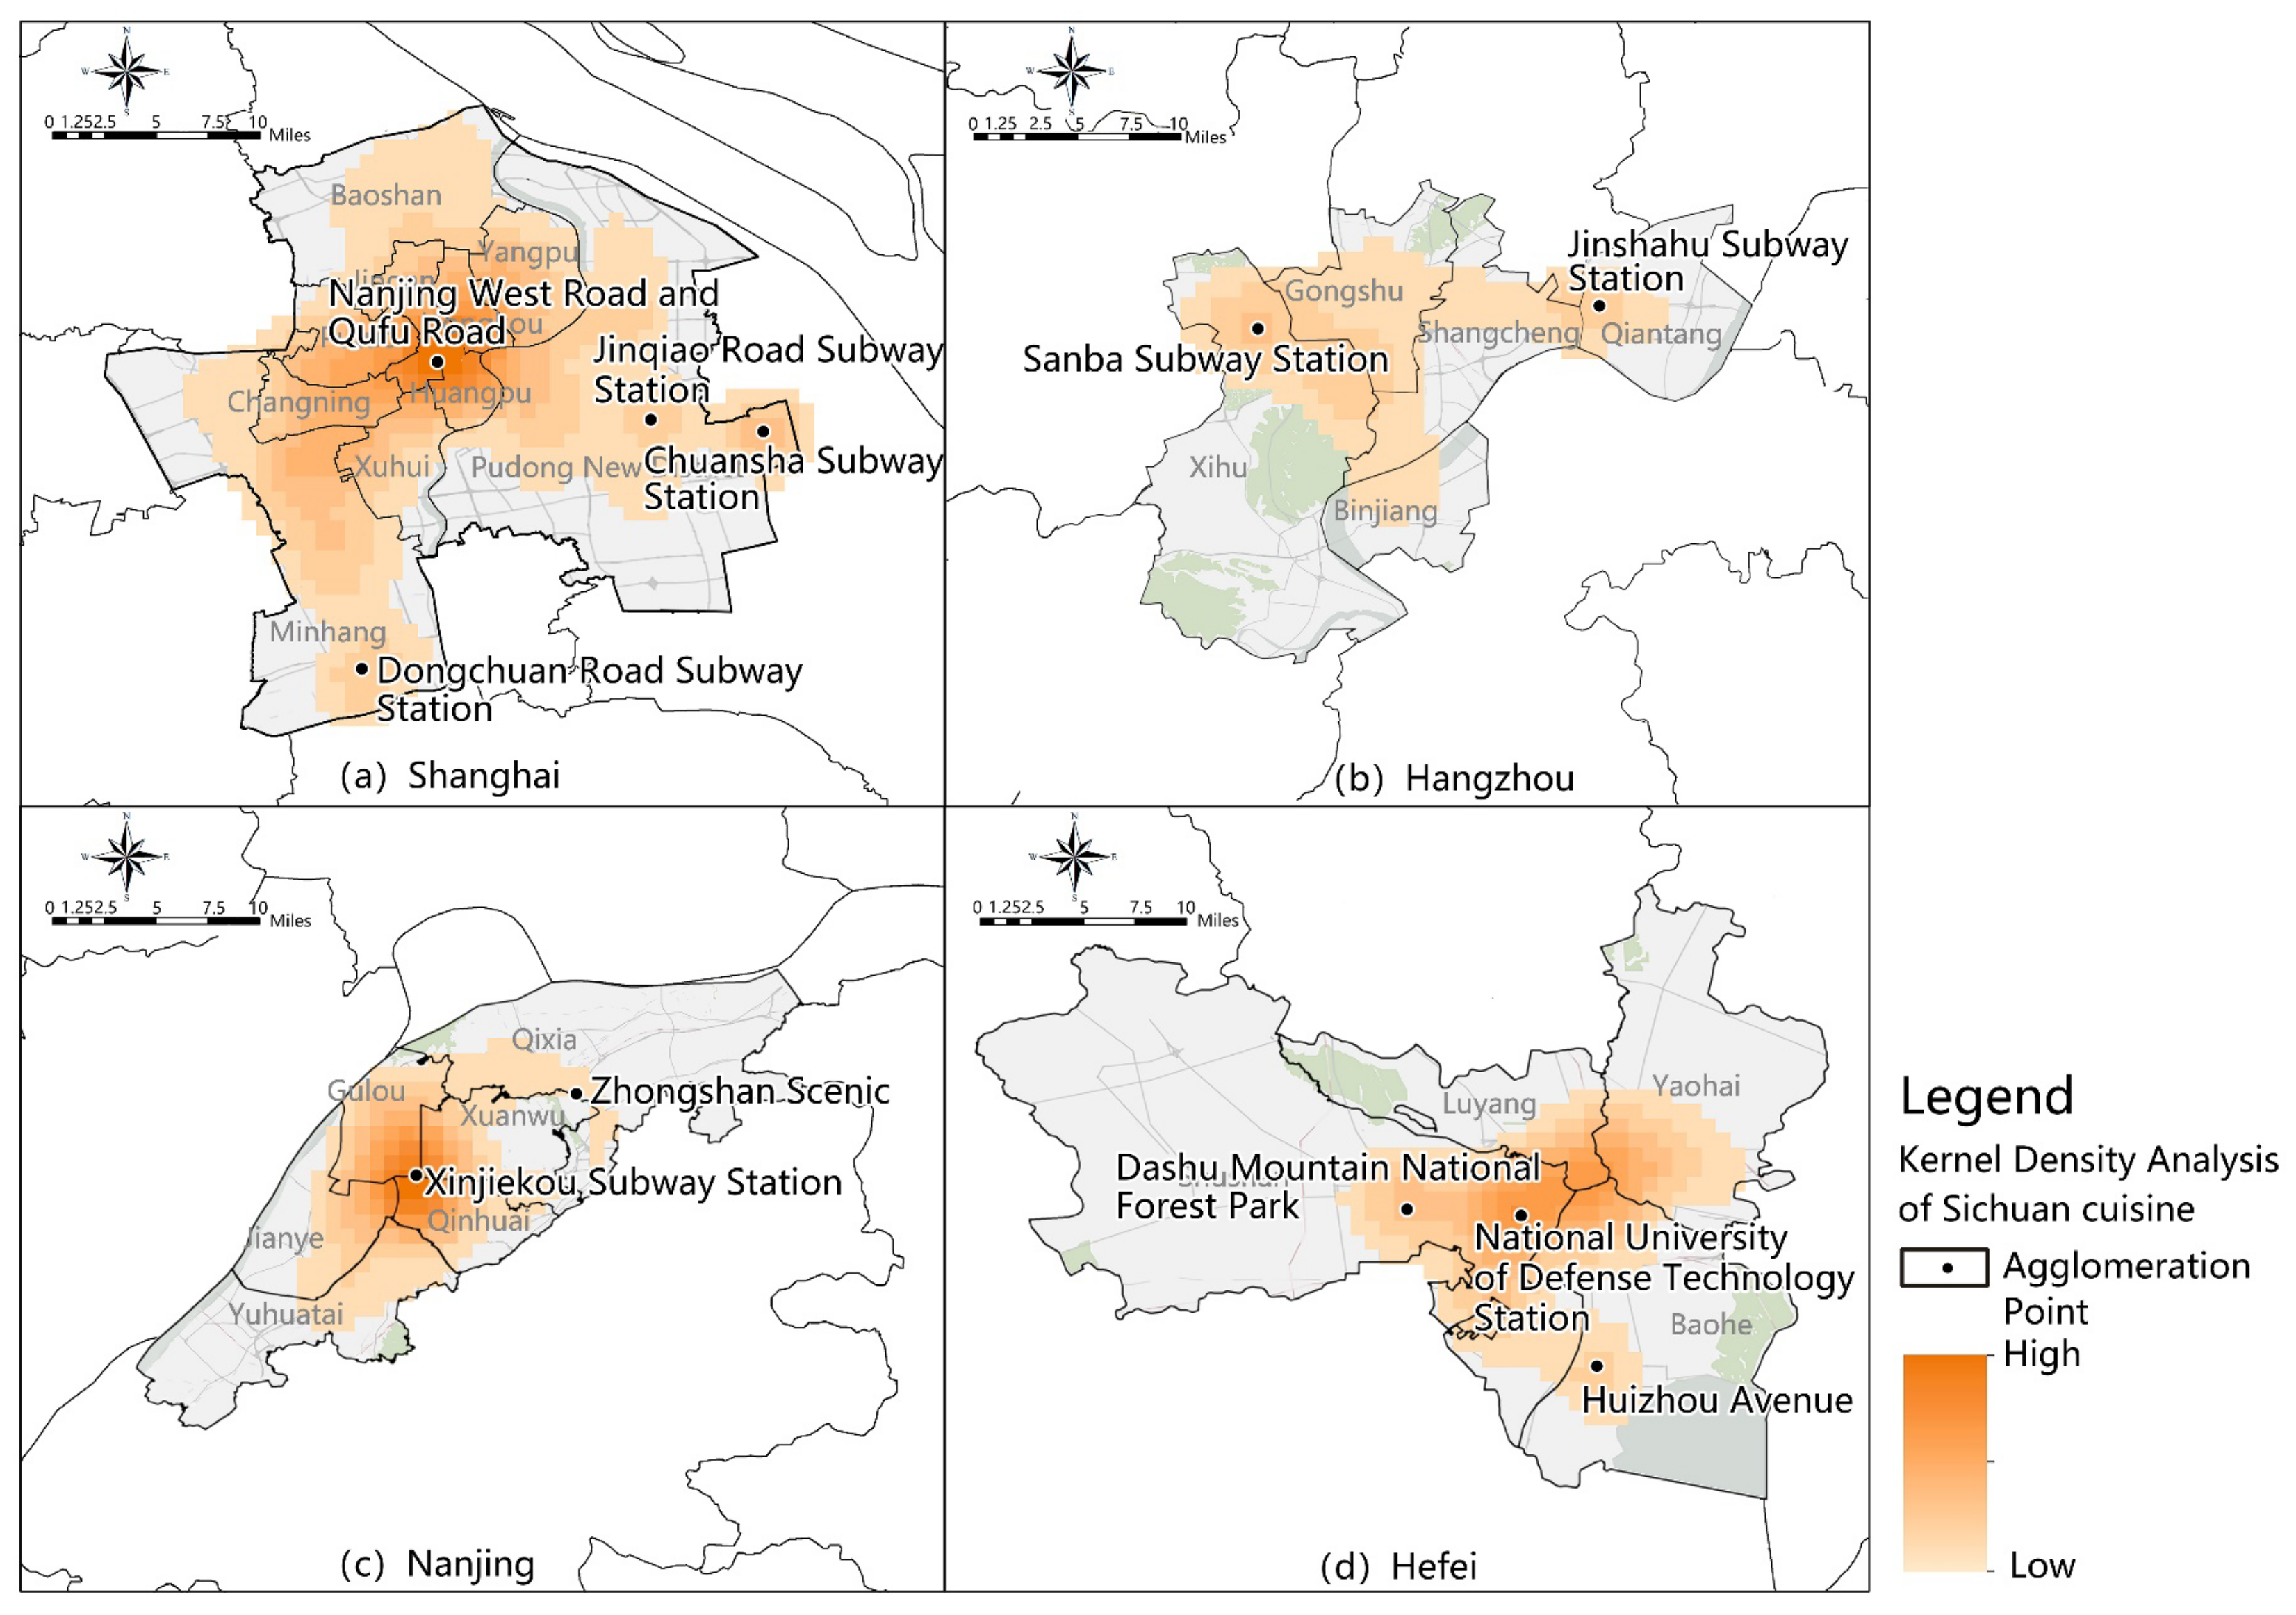
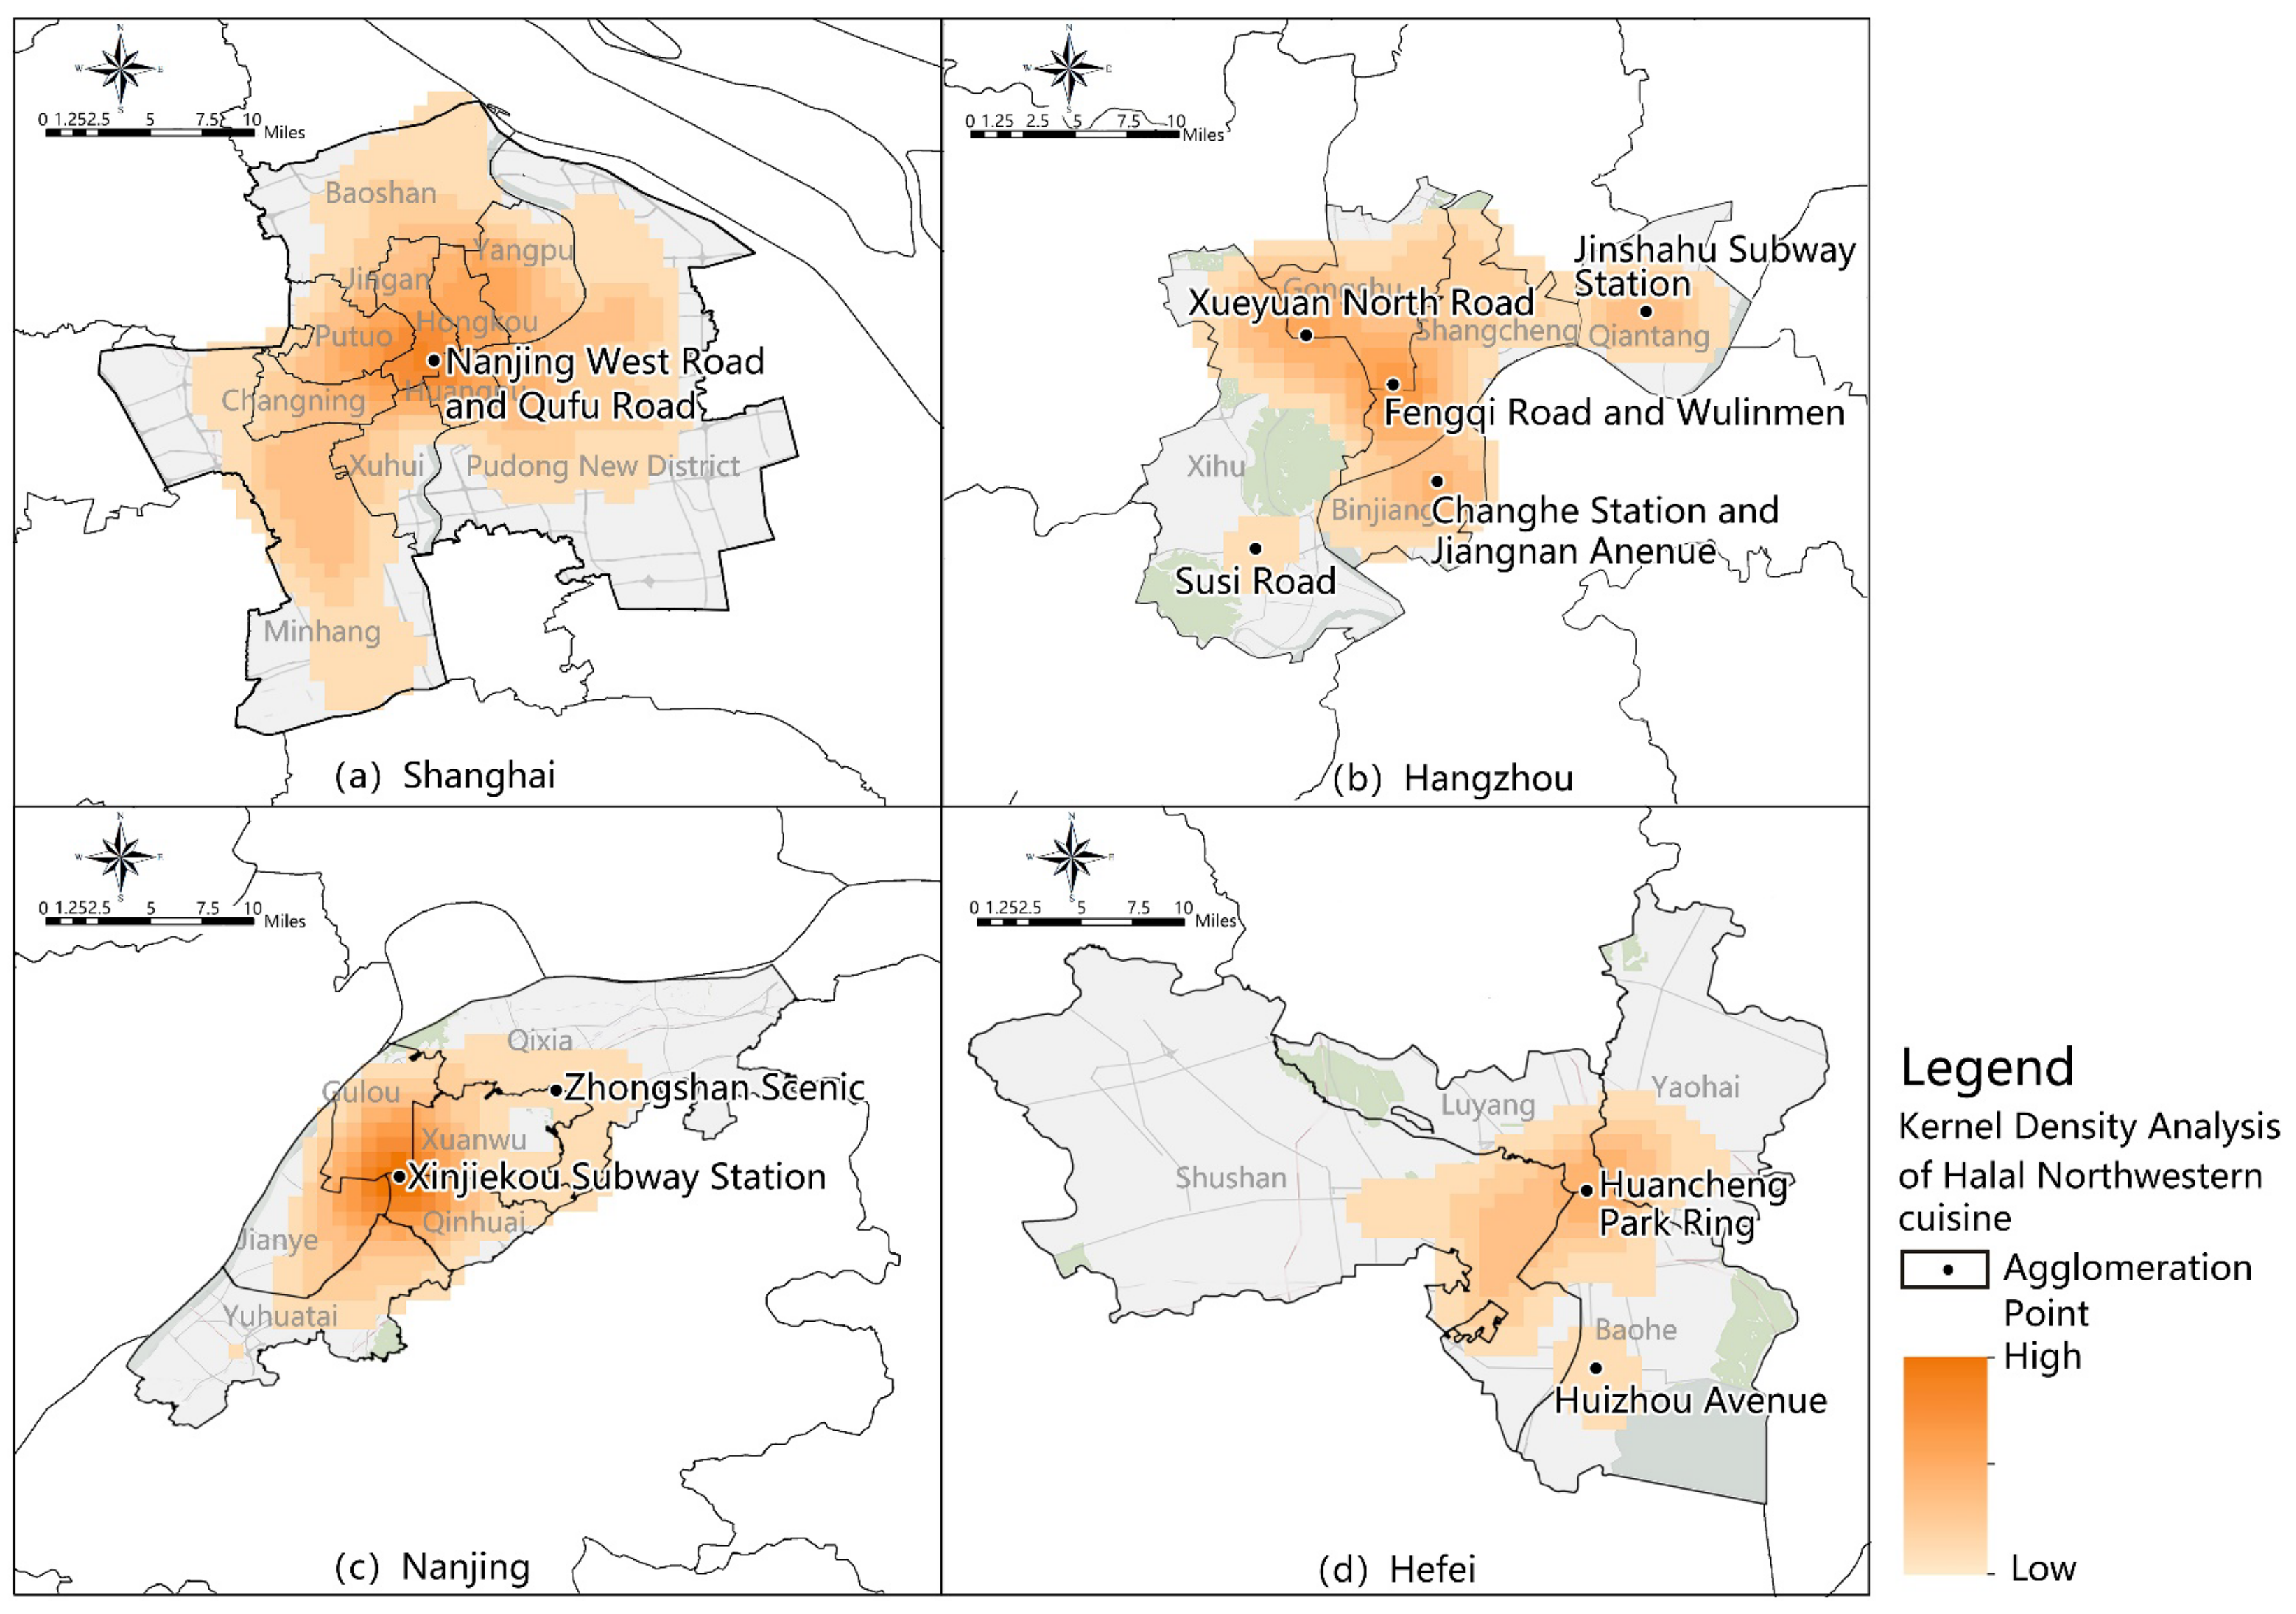
4.3.1. Spatial Distribution Pattern of Different Cuisines Based on Kernel Density Estimation

According to the kernel density estimation results of 12 kinds of cuisines, we summarized the cuisines with similar spatial distribution patterns into five types of spatial distribution patterns. For each type, a typical cuisine was selected to represent the spatial distribution pattern of this type. (1) The main agglomeration areas were in the city where the cuisine originated, and the agglomeration centers were in the core area of the main urban area. Other cities only formed weak agglomeration points. The typical cuisines were Anhui cuisine (Figure 9), Shanghai cuisine, Jiangsu and Zhejiang cuisine. The main agglomeration area of Anhui cuisine was in the Hefei’s Huancheng Park ring area, and a small agglomeration point was near Huizhou Avenue. The degree of agglomeration in Nanjing, Hangzhou, and Shanghai was far from Hefei. The main agglomeration area of Shanghai cuisine was in the core area of the main urban area of Shanghai, and a weak agglomeration point was in Nanjing. The main agglomeration areas of Jiangsu and Zhejiang cuisine were in the core areas of the main urban area of Nanjing and Hangzhou, and small agglomeration points were near the Jinsha Lake in Hangzhou and Shanghai. (2) The main agglomeration areas with Shanghai as the main center, Nanjing and Hefei as supplements, the agglomeration range was relatively wide. A secondary agglomeration area was in Hangzhou. The typical cuisines were Sichuan cuisine (Figure 10), Hunan cuisine, and Yunnan and Guizhou cuisine. The main agglomeration areas of Sichuan cuisine were in the core areas of the main urban areas of Shanghai and Nanjing. Shanghai had a wider agglomeration range, extending from Qufu Road, Hanzhong Road to Hechuan Road, and most of the main urban area. Nanjing had a higher level of agglomeration, and the agglomeration extended to the Zhongshan Scenic Area. A secondary agglomeration area was near the National University of Defense Technology Station in Hefei. Small agglomeration points were located at Chuansha Station and Jinqiao Road in Shanghai, Huizhou Avenue, and Dashu Mountain National Forest Park in Hefei, Sanba Station, and Jinsha Lake in Hangzhou. The degree of agglomeration was no less than the core area of the main urban area. Hunan Cuisine and Yunnan and Guizhou cuisine are similar to Sichuan Cuisine, but the degree of agglomeration of Hunan Cuisine was Shanghai, Nanjing, Hefei, and Hangzhou, in order. Yunnan and Guizhou cuisine formed a small agglomeration point near Zhusi Road in Hangzhou. (3) The main agglomeration area was in Shanghai, the secondary agglomeration areas were in Nanjing and Hefei, and Hangzhou had no obvious agglomeration points. The typical cuisines are Fujian cuisine (Figure 11) and Shandong cuisine. The agglomeration center of Fujian cuisine in Nanjing was located in the Jiangsu Road Square area. The agglomeration range of Shandong cuisine in Shanghai was wider than that of Fujian cuisine. The agglomeration degree of Fujian cuisine in Hefei was higher than that of Shandong cuisine. (4) The degree of agglomeration in Shanghai, Nanjing and Hefei was not much different, but Hangzhou was relatively weak. The typical cuisines are Cantonese cuisine (Figure 12) and Beijing cuisine. The main agglomeration areas of Cantonese cuisine were in Shanghai and Hefei. The agglomeration center of Shanghai was near the core area of the main urban area. The agglomeration center of Hefei was near the National University of Defense Technology Station and Swan Lake Park, and a small agglomeration point was on Huizhou Avenue. A secondary agglomeration area of Cantonese cuisine was in Nanjing’s Xinjiekou and Hanzhong Road. Some weak agglomeration points were near the Dashu Mountain National Forest Park in Hefei, the Zhongshan Scenic Area in Nanjing, Xueyuan North Road, and Changhe subway Station in Hangzhou. The main agglomeration areas of Beijing cuisine were in the core areas of the main urban areas of Hefei and Nanjing, and the secondary agglomeration area was in Shanghai, which extended from Nanjing West Road and Shanghai Railway Station to Wujiaochang. (5) The agglomeration degree of the four cities was relatively high, with a wide agglomeration range and many agglomeration points. The typical cuisines are Halal Northwestern cuisine (Figure 13) and Northeastern cuisine. The main agglomeration areas of Halal Northwest cuisine were in Nanjing and Shanghai, and the main agglomeration areas of Northeast cuisine were in Shanghai and Hangzhou. Hangzhou’s agglomeration center–agglomeration points spatial structure was the most prominent. The agglomeration center was from Xueyuan North Road in Gongshu District to the core area. The agglomeration points were on Zhusi Road, Jinsha Lake, Changhe Station, and Jiangnan Avenue.

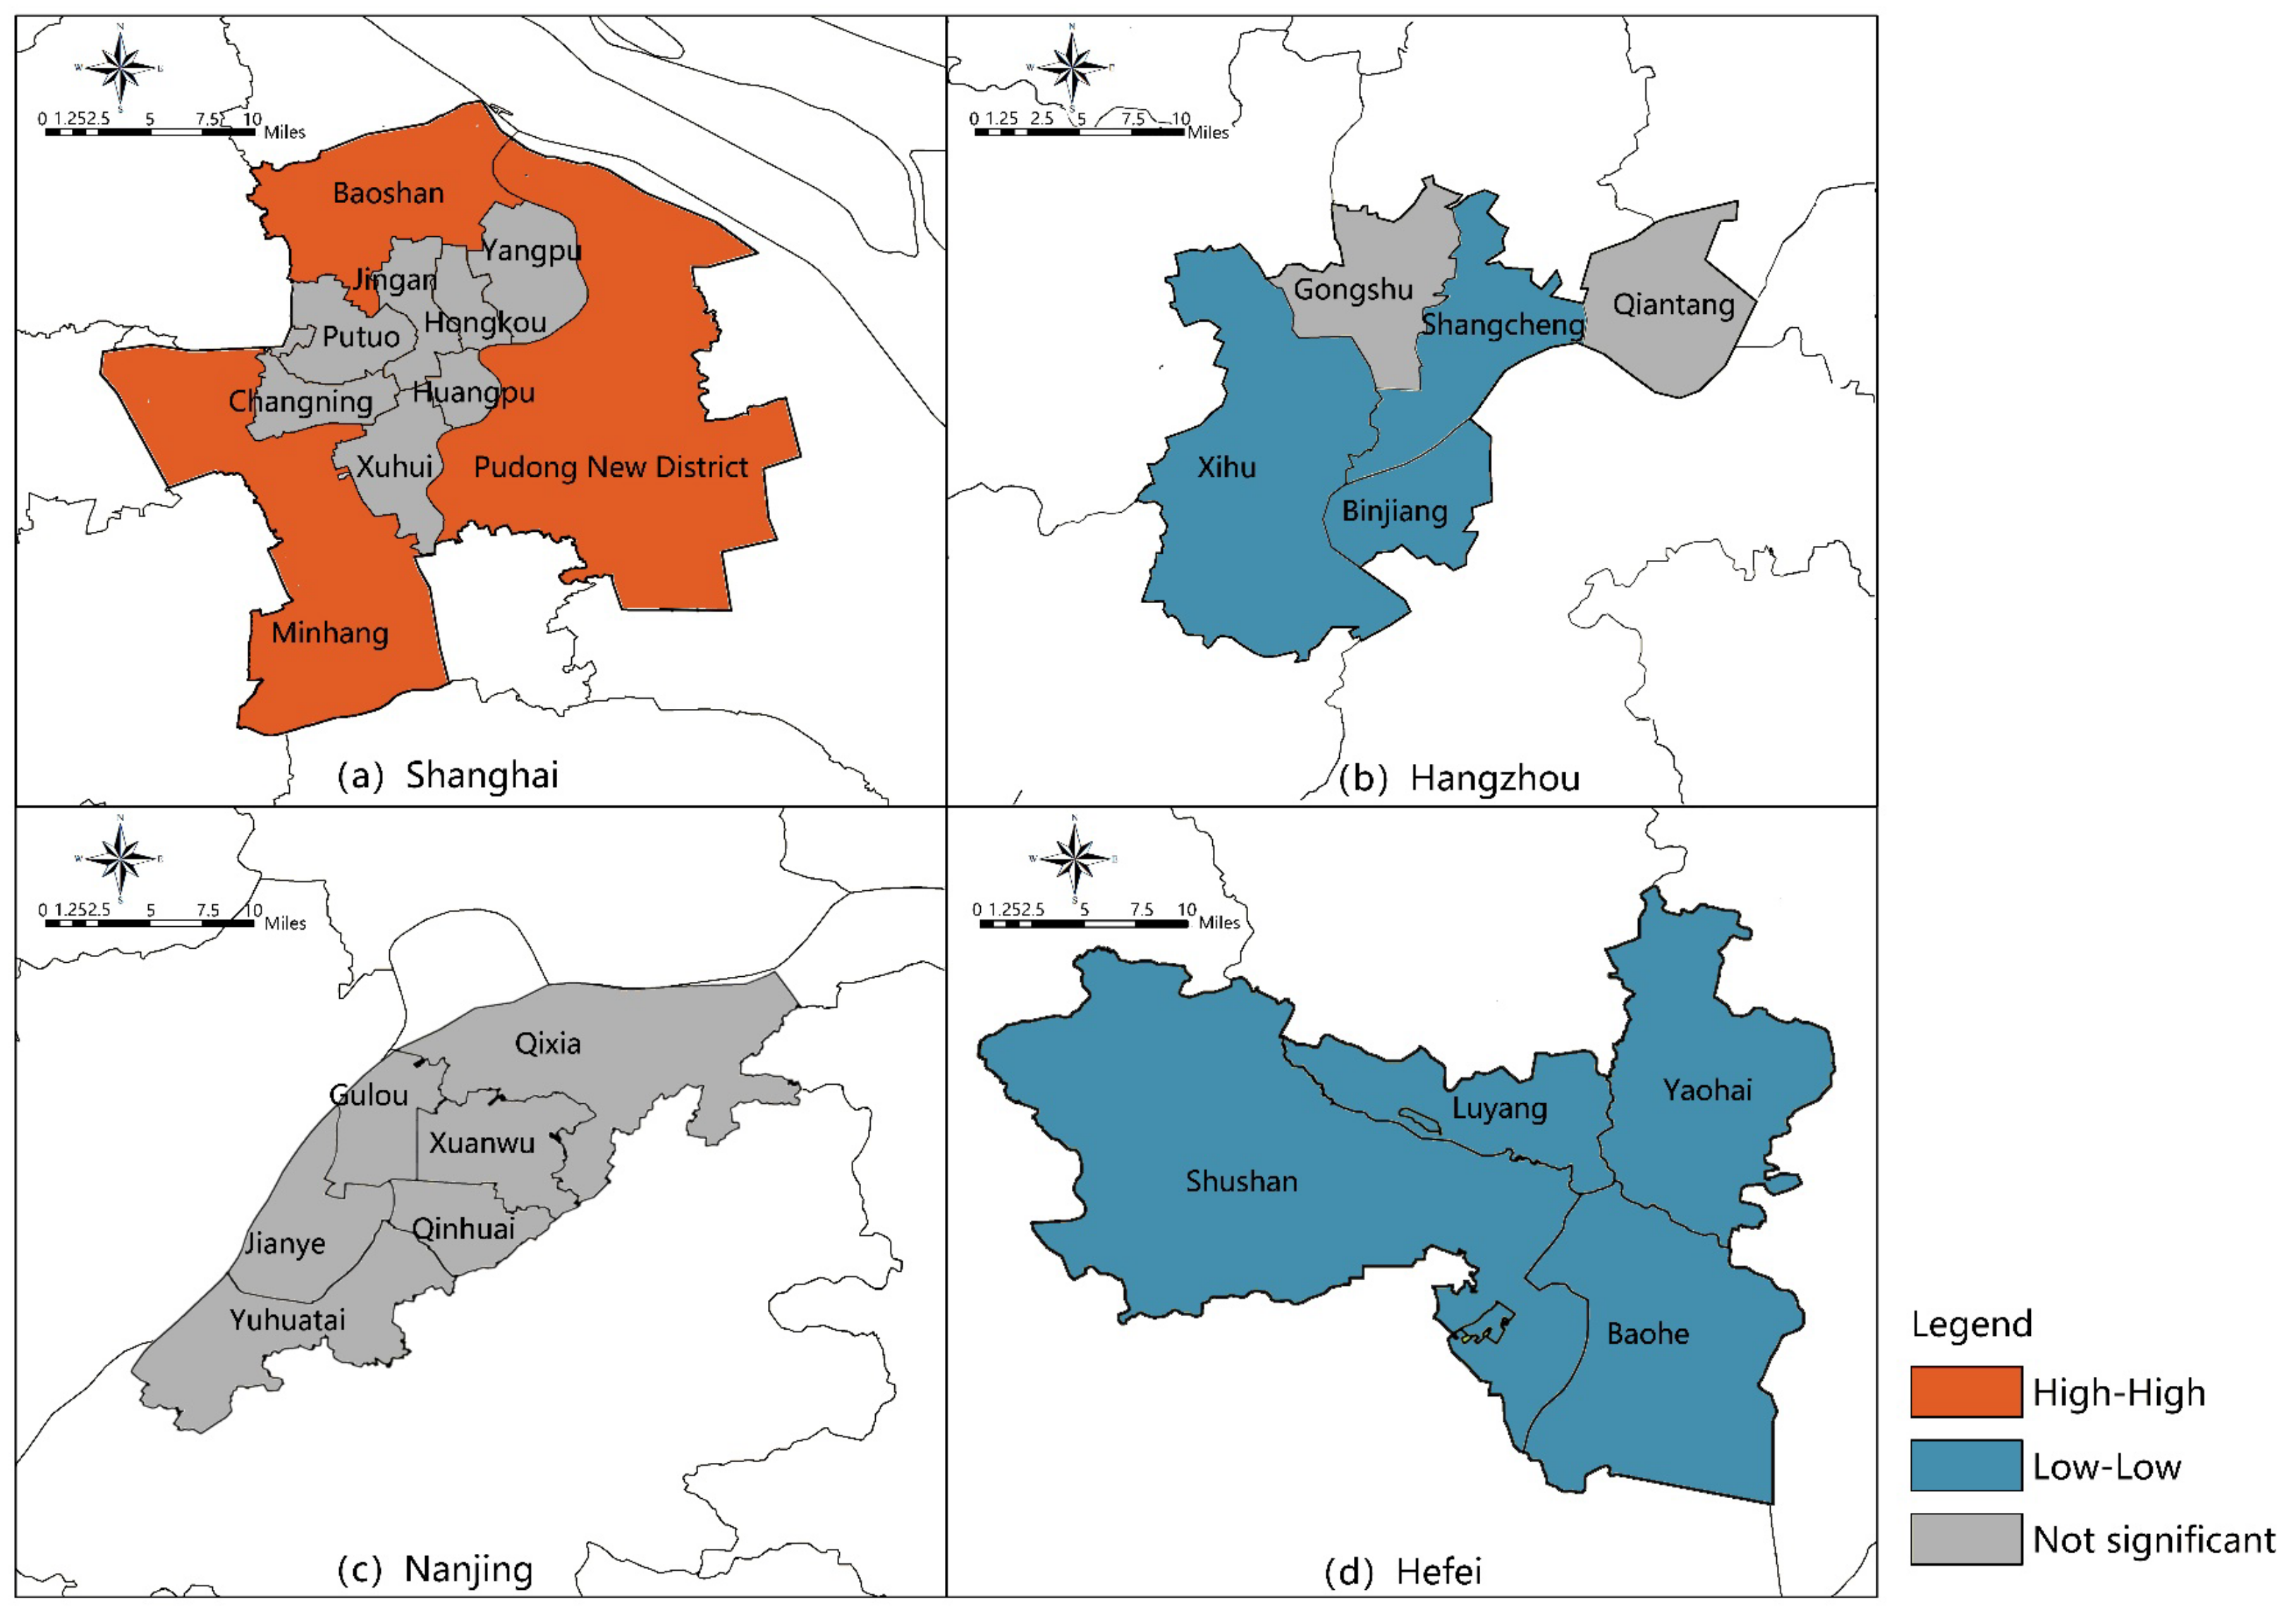
4.3.2. Spatial Agglomeration Characteristics of Different Cuisines Based on Spatial Autocorrelation Analysis

The spatial agglomeration characteristics of 12 cuisines in the YRD were analyzed using the global and local spatial autocorrelation analysis tools in ArcGIS software. Combined with the LISA map, the specific characteristics of the spatial agglomeration of 12 cuisines were obtained (Table 2). Only Shanghai cuisine, Jiangsu and Zhejiang cuisine, Anhui cuisine, Fujian cuisine, Shandong cuisine, and Hunan cuisine passed the significant test at about the 5% level. The Moran’s I index had all positive index values in the range of 0.1842–0.7846, indicating that the spatial correlation was positive, showing a convergence trend. For Hunan cuisine with the weakest spatial correlation, the minimum value of Moran’s I index was 0.1842, and for Shanghai cuisine with the strongest spatial correlation, the maximum value of Moran’s I index was 0.7846. The spatial agglomeration characteristics of the six cuisines were all high-high districts. The largest proportion of the high-high district was Shanghai cuisine (24%), and the smallest was Hunan cuisine (8.3%). Regarding spatial agglomeration distribution, Shanghai cuisine, Fujian cuisine, Shandong cuisine, and Hunan cuisine were mainly distributed in Shanghai, especially in the suburbs such as Minhang District, Pudong New District, and Baoshan District of Shanghai. Jiangsu and Zhejiang cuisines were distributed in the Shangcheng District, Xihu District, and Gongshu District of Hangzhou. Anhui cuisine was distributed in the main urban area of Hefei.

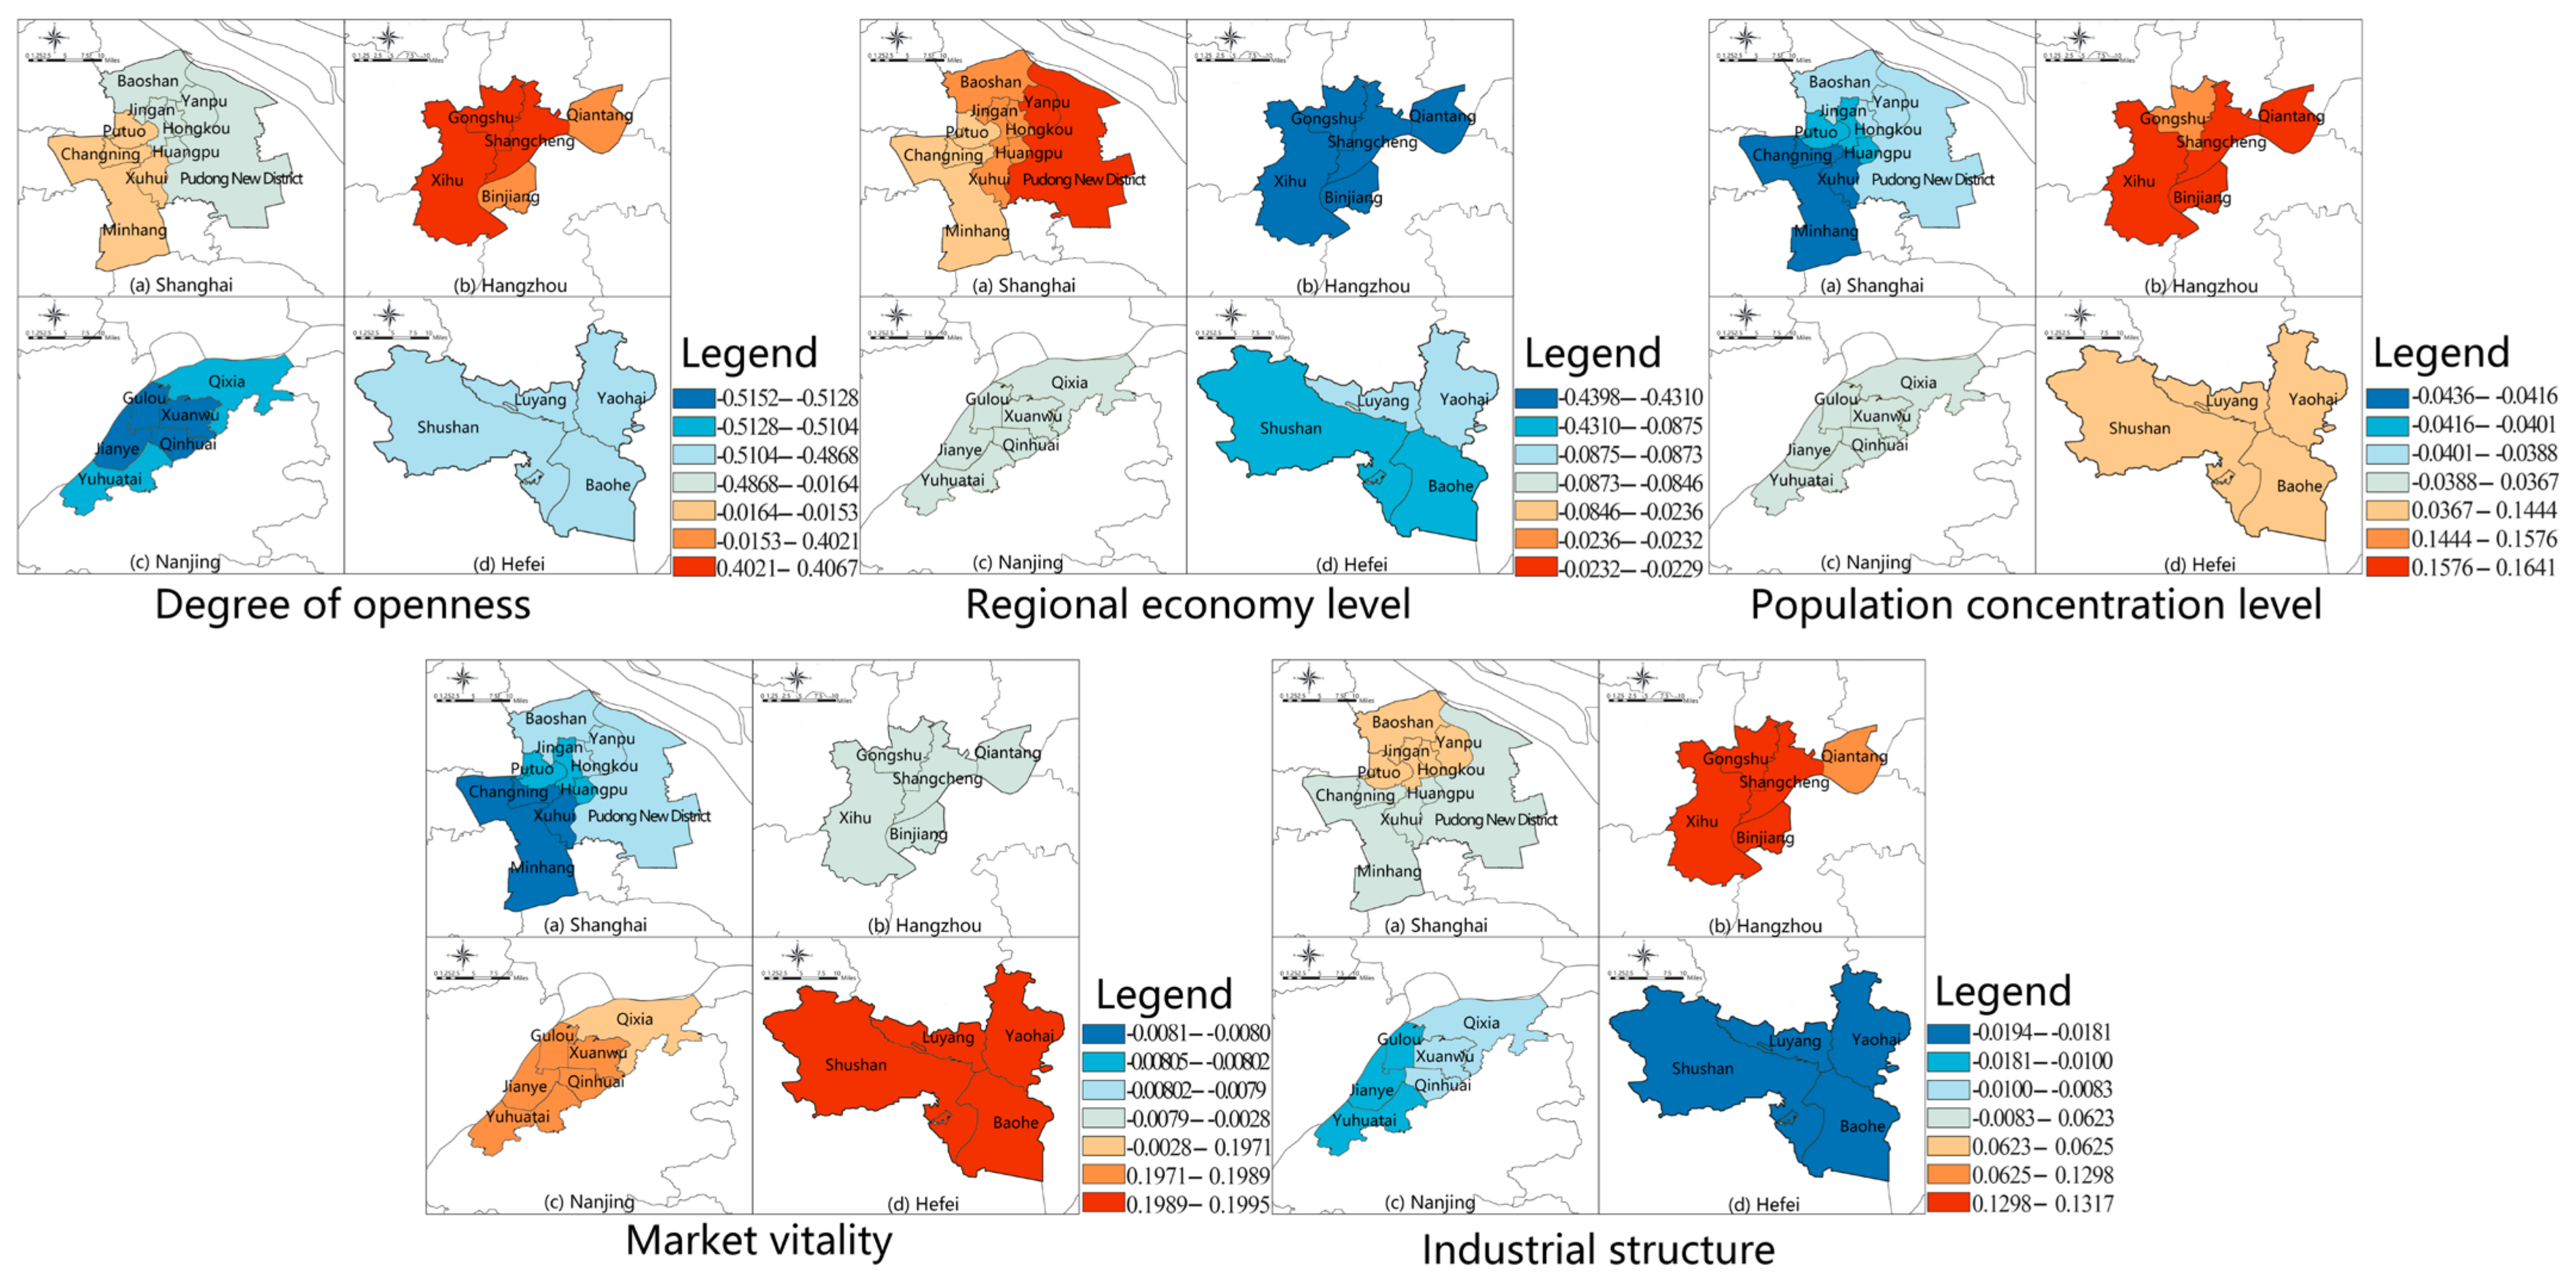
4.4. Analysis of Influencing Factors of Catering Industry Based on Geographically Weighted Regression Model

Various factors cause the imbalance of urban catering spaces. This study considered the relevant factors discussed in the previous studies and the relationship between other socioeconomic indicators and the indicators in the study. We decided to explore the influencing factors of the characteristics of the catering industry from five aspects: regional economic level, population concentration level, industrial structure, degree of openness, and market vitality. The specific indicators are shown in Table 3. To eliminate the influence of dimension, z-score normalization was performed on all indicators. The indicators were weighted and summed with equal weights for a factor with two indicators. There was no collinearity among the factors. The GWR model was constructed using ArcGIS 10.2, and CV was used to determine the optimal bandwidth of the model. The adjusted R2 of the CLI and CDI models were 0.79 and 0.60, respectively. The adjusted R2 estimated by the traditional OLS model were 0.33 and 0.37, respectively. It can be seen that the fitting degree of the GWR model was significantly higher than that of the traditional OLS model.
From the local regression coefficients of each influencing factor of CLI (Figure 14) and CDI (Figure 15), the influence intensity of the five factors on CLI and CDI was in descending order of degree of openness, regional economic level, market vitality, population concentration level, industrial structure. The degree of openness and economic level had a negative impact on CLI, while market vitality, population concentration level, and industrial structure had a positive impact, and the intensity decreases. The degree of openness, market vitality, and industrial structure had a negative impact on CDI. The economic and population concentration levels positively impacted CDI, and the intensity decreased. There were apparent spatial differences in the impact of each explanatory variable on localization and diversity.

4.4.1. Regional Economic Level

The regional economic level affects the purchasing power of residents, is directly related to the sales profits of merchants, and determines the radiation range of the catering industry and its survival threshold [26]. The regional economic level coefficients of CLI were all negative, indicating that the development of the economic level is not conducive to the improvement of CLI. However, the regional economic level promotion effect on CDI is more prominent and broader. From the regression coefficient, the regional economic level had the most apparent effect on the CLI of Hangzhou, Shushan District, and Baohe District of Hefei. It shows that economic development will inhibit the development of local cuisine in these regions, and the relationship between economic growth and local culture should be appropriately regulated. The economic level has the most apparent promoting effect on the CDI of Hefei and Nanjing, except for the Qixia District. Raising economic development in these regions could significantly improve their cuisine structure. The city’s agglomeration areas of catering spaces are also economically developed. Most of the catering spaces were initially concentrated in the core area of the main urban area. Later, with the formation of significant business districts, they began to spread and polarize in various business districts [47]. The catering space also formed high agglomeration points in these business districts, such as Longhu Jinsha Tianjie near Jinsha Lake in Qiantang District and Longhu Binjiang Tianjie near Jiangnan Avenue in Binjiang District of Hangzhou, Longhu Minhang Tianjie near Dongchuan Road in Minhang District, Wujiaochang and Chuansha business district in Yangpu District of Shanghai.

4.4.2. Degree of Openness

The coefficient of the degree of openness of CLI had positive and negative values. However, the coefficient of the degree of openness of CDI was all negative, indicating a negative relationship between the level of opening to the outside world and the diversification of cuisine. From the perspective of the regression coefficient, the improvement of openness positively affected the development of local cuisine in Hangzhou. However, it had an inhibitory effect on most other areas, especially Qinhuai, Gulou, Jianye, and Xuanwu districts in Nanjing. At first, the composition of a city’s cuisine was dominated by local cuisines. However, with the continuous development of the regional economy, it has become more closely connected with all parts of the country. International exchanges have increased, bringing about the impact and collision of foreign cultures and cuisines, slowly changing people’s traditional dietary structure and catering needs [48]. The CLI gradually weakened. Improving Hefei’s openness will limit CDI development. It will also have an inhibitory effect on Yuhuatai District, Jianye District, and Qinhuai District in Nanjing.

4.4.3. Population Concentration Level

Population size is an essential factor affecting the agglomeration of the catering industry. In a service industry, the service object is people, and people’s demand for catering is also an important link that affects the survival threshold of the catering industry [44]. The population concentration level had little effect on CLI and CDI. From the regression coefficient, the improvement of population concentration level had a relatively significant effect on the CLI of Hangzhou and Hefei and the CDI of Hangzhou. Other areas had little effect and even had an inhibitory effect. The catering space agglomeration point was also related to the population concentration level, and the density of catering merchants strongly depends on the population density [49]. Business circles, parks, scenic spots, and university spaces have brought a large population flow, and tourism activities have become more intensive, providing sufficient consumer groups for the catering industry. The number and types of merchants are also more abundant [27].

4.4.4. Market Vitality

The catering industry can activate the mass consumer market, and its development must be related to the market [3]. Market vitality promotes CLI but inhibits CDI. From the regression coefficient, active market transactions had the most significant effect on the CLI of Hefei and Nanjing but had little impact on other regions. However, in Hefei and the Qixia District, Gulou District, Xuanwu District, and Jianye District of Nanjing, the improvement of market vitality will inhibit the development of the diversity of cuisines.

4.4.5. Industrial Structure

The catering industry is a part of tertiary industry. The optimization and upgrading of the industrial structure impact the catering industry and related service industries [44]. However, industrial structure had little effect on CLI and CDI from the regression coefficient. The industrial structure coefficients of the CDI were all negative. However, it is worth mentioning that the improvement of tertiary industry will promote the development of local cuisines in Hangzhou and Shanghai.
In addition, the CGPI is inseparably related to the geographical environment. As a Chinese saying goes, “land and water are the same as people”, the geographical environment mainly affects regional products and dietary styles [24]. With the development of the economy and society, regional products are no longer limited. The dietary style determined by cooking methods and taste preferences has become an essential factor affecting the CGPI due to long-standing habits. Sichuan cuisine, Halal Northwestern cuisine, Cantonese cuisine, and Northeastern cuisine are widely distributed throughout China. In addition to Hefei, most of the central cities in the YRD region have preferred a sweet taste since ancient times. Therefore, Cantonese and Fujian cuisines align with Shanghai, Hangzhou, and Nanjing’s cuisine and taste preferences. Shandong cuisine, Hunan cuisine, and Beijing cuisine align with Hefei’s cooking and taste preferences [50]. Moreover, due to the geographical limitations of Fujian cuisine and the self-enclosed nature of Shandong cuisine [24], the YRD prefers Sichuan cuisine and Halal Northwestern cuisine, combined with local cuisines, Fujian cuisine, Shandong cuisine, and Yunnan and Guizhou cuisine are relatively scarce.

5. Discussion

Some limitations exist in our study. First, the application of big data eliminates the dependence on traditional statistical data and provides new opportunities for the spatial analysis of socioeconomic phenomena in human economic geography. However, the POI data itself are flawed, ignoring the influence of the scale of each outlet in the urban catering space and the customer flow. In addition, due to subjective and objective reasons such as urban reconstruction and poor management, catering shops have been relocated and closed, opened branches, and gone bankrupt. The data of catering outlets are updated more frequently, and it is not easy to obtain long-term accurate statistical data. Second, this study selected influencing factors directly related to the catering industry, such as the regional economy, industrial structure, and population density, but there are other possible factors. The urban catering industry is also closely related to the spatial planning and policies formulated by the state and local governments. Land change in urbanization directly affects industrial upgrading and replacement. In the future, the superposition and comparison of the catering industry with national policies and long-term influencing factors can be regarded as the following research focus. Third, in the future, through on-the-spot research and questionnaire interviews, quantitative model analysis and other technologies can be used to conduct an in-depth exploration and dynamic simulation of the geographical changes in the spatial distribution of urban catering. In order to analyze and predict its development trends and explore its internal mechanisms, it can provide a reference for the optimization of urban catering space patterns and the inheritance of urban culture.
As one of the regions with the most dynamic economy, the highest degree of openness, and the most vital innovation capability in China, the YRD plays a crucial role in global competition and the overall situation of national modernization. Despite the limitations, this study proposes an in-depth research method that combines the development indicators of the catering industry, the analysis of main influencing factors, and ArcGIS as an analytical tool. This combination opens up a new perspective in the YRD or other urban agglomerations in China, or even in the world, to establish a coordinated development, co-governance, and sharing of public policies and planning. It can be applied to other economically developed urban agglomerations in China, such as the Pearl River Delta urban agglomeration, or areas with a prominent catering culture, such as Sichuan Province. It can also be applied to the world’s urban agglomerations to explore the internal characteristics of the catering culture in the development of the catering industry. There is a dynamic coordination between urban-industrial development and various influencing factors. We hope that the research results can enlighten urban planners, relevant governments, and architects.

6. Conclusions

This study selected the YRD urban agglomeration as the research area. The CLI, CDI, and CGPI were used to characterize the development characteristics of the catering space in the central city. The spatial distribution pattern of the catering industry in central cities was obtained by the kernel density analysis and spatial autocorrelation analysis of catering big data. Influencing factors were discussed using the GWR model. The main conclusions are as follows:
(1)
From the perspective of the overall characteristics of the catering industry, the number of Chinese restaurants is much larger than that of foreign restaurants. Shanghai and Nanjing have the highest concentration of Chinese restaurants, while Hangzhou and Hefei have formed multiple clusters. The central cities of the YRD have formed core centers of different density levels. The high-density areas of the various cities also show the characteristics of partial spatial overlap.
(2)
From the perspective of the catering industry development index, the local characteristics of cuisines in Hangzhou and Hefei are more prominent, and the composition of cuisines in Shanghai and Nanjing is more balanced. Shangcheng District of Hangzhou, Luyang District, and Baohe District of Hefei have the highest CLI. The CLI of all administrative districts in Shanghai and Nanjing is low. Shanghai’s Minhang District and Baoshan District have the highest CDI. The Binjiang District of Hangzhou and Baohe District of Hefei have the lowest CDI. The overall and individual catering industry in the central cities of the YRD have a significant positive correlation in space, showing a trend of convergence. The YRD prefers Sichuan cuisine and Halal Northwestern cuisine. However, Fujian cuisine, Shandong cuisine, and Yunnan and Guizhou cuisine are relatively scarce.
(3)
From the perspective of the catering space pattern of different cuisines, it can be divided into five types. In the first type, the main agglomeration areas are formed in the local origin area of the cuisine and other cities form weak agglomeration points. In the second type, the main agglomeration area is mainly Shanghai, supplemented by Nanjing and Hefei, and Hangzhou is the secondary agglomeration area. In the third type, Shanghai forms the main agglomeration area, Nanjing and Hefei form the secondary agglomeration areas, and Hangzhou has no obvious agglomeration point. In the fourth type, the agglomeration degree in Shanghai, Nanjing, and Hefei is not much different, but in Hangzhou is relatively weak. In the fifth type, the agglomeration degree is relatively high in the four cities, and the agglomeration range is wide and there are many agglomeration points. However, only Shanghai cuisine, Jiangsu and Zhejiang cuisine, Anhui cuisine, Fujian cuisine, Shandong cuisine, and Hunan cuisine have a significant positive correlation in space, and they weaken in turn.
(4)
From the perspective of the influencing factors of the catering industry, the impact strengths of the five influencing factors on CLI and CDI are roughly the same, and the order is the degree of openness, regional economic level, market vitality, population concentration level, industrial structure. The degree of openness and regional economic level are the main factors that restrict the development of CLI, and they are the main factors that inhibit and promote CDI, respectively. The geographical environment is the main factor affecting CGPI. The regional economy and population density significantly affect the cities’ high agglomeration points of catering.

Author Contributions

Conceptualization, Weiwu Wang and Shan Wang; methodology, Weiwu Wang and Shan Wang; data collection, Shan Wang and Tianle Fu; data analysis, Weiwu Wang, Shan Wang, Huan Chen and Yuxin Yang; model, Shan Wang, Weiwu Wang, Lingjun Liu and Huan Chen; writing—original draft preparation, Shan Wang, Huan Chen, Lingjun Liu and Weiwu Wang; visualization, Shan Wang, Tianle Fu, Weiwu Wang and Yuxin Yang; writing revision and paper finalization, Weiwu Wang, Shan Wang, Huan Chen and Lingjun Liu. Weiwu Wang is responsible for future questions from readers as the corresponding author. All authors have read and agreed to the published version of the manuscript.

Funding

This research received no external funding.

Informed Consent Statement

Not applicable.

Data Availability Statement

Exclude this statement.

Conflicts of Interest

The authors declare no conflict of interest.

References

  1. Yu, G.Q. Blue Book of Catering Industry: Annual Report on Catering Industry Development of China (2019); Social Sciences Academic Press of China: Beijing, China, 2019. [Google Scholar]
  2. Hankey, C. Food and Catering Modifications for Public Health: Chronic Disease and Obesity Prevention. Medicine 2015, 43, 135–138. [Google Scholar] [CrossRef]
  3. Cai, X.C.; Zhang, F.; Cheng, S.K.; Liu, X.J. Sustainable Development of the Catering Industry in China: Policy and Food Waste. J. Resour. Ecol. 2021, 12, 628–635. [Google Scholar] [CrossRef]
  4. Zhu, J.W.; Xu, Y.; Fang, Z.X.; Shaw, S.L.; Liu, X.J. Geographic Prevalence and Mix of Regional Cuisines in Chinese Cities. ISPRS Int. J. Geo-Inf. 2018, 7, 183. [Google Scholar] [CrossRef] [Green Version]
  5. Du, L. Discussion on the Characteristics of Urban Catering Culture and the Construction of “City of Food”—Taking the Two Cities of Chengdu and Chongqing as Examples. J. Chin. Cult. 2011, 3, 86–91. [Google Scholar]
  6. Robinson, R.N.S.; Getz, D. Profiling Potential Food Tourists: An Australian Study. Br. Food J. 2014, 116, 690–706. [Google Scholar] [CrossRef]
  7. Okumus, B.; Okumus, F.; McKercher, B. Incorporating Local and International Cuisines in the Marketing of Tourism Destination: The Cases of Hong Kong and Turkey. Tour. Manag. 2007, 28, 253–261. [Google Scholar] [CrossRef]
  8. Ribault, T. Employment in the Hotel and Catering Industry in Japan. A Comparsion with France. JIL Rep. 2002, halshs-00195594. Available online: https://halshs.archives-ouvertes.fr/halshs-00195594 (accessed on 17 March 2022).
  9. Zhang, Y.; Li, Q. The spatial characteristics of catering industry and its coupling analysis with dynamic population in the main city of Wuhan. J. Cent. China Norm. Univ. (Nat. Sci. Ed.) 2019, 53, 121–129. [Google Scholar] [CrossRef]
  10. Hou, B.; Tao, R.; Zhu, W.Z. Research on the occurrence and correlation of traditional food cultural resources in the Yangtze River Delta region. J. Res. Diet. Sci. Cult. 2014, 31, 32–38. [Google Scholar]
  11. Doren, C.S.V.; Gustke, L.D. Spatial analysis of the US lodging industry, 1963–1977. Ann. Tour. Res. 1982, 9, 543–563. [Google Scholar] [CrossRef]
  12. Wall, G.; Dudycha, D.; Hutchinson, J. Point pattern analyses of accommodation in Toronto. Ann. Tour. Res. 1985, 12, 603–618. [Google Scholar] [CrossRef]
  13. Thornton, L.E.; Lamb, K.E.; Ball, K. Fast food restaurant locations according to socioeconomic disadvantage, urban–regional locality, and schools within Victoria, Australia. SSM Popul. Health 2016, 2, 1–9. [Google Scholar] [CrossRef] [PubMed] [Green Version]
  14. Cró, S.; Martins, M.A. Hotel and hostel location in Lisbon: Looking for their determinants. Tour. Geogr. 2017, 5, 1–20. [Google Scholar] [CrossRef]
  15. Kim, E.J.; Geistfeld, L.V. Consumers restaurant choice behavior and the impact of socioeconomic and demographic factors. J. Food Serv. Bus. Res. 2003, 6, 3–24. [Google Scholar] [CrossRef]
  16. Austin, S.B.; Melly, S.J.; Sanchez, B.N.; Patel, A.; Buka, S.; Gortmaker, S.L. Clustering of Fast-Food Restaurants Around Schools: A Novel Application of Spatial Statistics to the Study of Food Environments. Am. J. Public Health 2005, 95, 1575–1581. [Google Scholar] [CrossRef]
  17. Ashworth, G.J.; Tunbridge, J.E. The Tourist-Historic City; Belhaven Press: London, UK, 1990. [Google Scholar] [CrossRef]
  18. Powell, L.M.; Chaloupka, F.J.; Bao, Y. The availability of fast-food and full-service restaurants in the United States: Associations with neighborhood characteristics. Am. J. Prev. Med. 2007, 33, 240–245. [Google Scholar] [CrossRef]
  19. Chou, T.Y.; Hsu, C.L.; Chen, M.C. A fuzzy multi-criteria decision model for international tourist hotels location selection. Int. J. Hosp. Manag. 2008, 27, 293–301. [Google Scholar] [CrossRef]
  20. Ritter, W. Hotel Location in Big Cites Tourism; Reimer: Berlin, Germany, 1986. [Google Scholar]
  21. Bégin, S. The geography of a tourist business hotel distribution and urban development in Xiamen, China. Tour. Geogr. 2000, 2, 448–471. [Google Scholar] [CrossRef]
  22. Yang, Y.; Wong, K.K.F.; Wang, T.K. How do hotels choose their location? Evidence from hotels in Beijing. Int. J. Hosp. Manag. 2012, 31, 675–685. [Google Scholar] [CrossRef]
  23. Prayag, G.; Landré, M.; Ryan, C. Restaurant location in Hamilton, New Zealand: Clustering patterns from 1996 to 2008. Int. J. Contemp. Hosp. Manag. 2012, 24, 430–450. [Google Scholar] [CrossRef]
  24. Chen, C.K. Regional differentiation and development trend of Chinese food culture. Acta Geogr. Sin. 1994, 49, 226–235. [Google Scholar]
  25. Lan, Y. On the Reasons and Distribution of Pungent Flavor in Chinese Food and Drink. Hum. Geogr. 2001, 16, 84–88. [Google Scholar]
  26. Liang, L. The distribution in space of urban catering and its factors: Xi’an as an example. J. Northwest Univ. (Nat. Sci. Ed.) 2007, 37, 925–930. [Google Scholar]
  27. Tang, J.Y.; He, Y.J.; Ta, N. Spatial Distribution Patterns and Factors Influencing the Shanghai Catering Industry Based on POI Data. Trop. Geogr. 2020, 40, 1015–1025. [Google Scholar] [CrossRef]
  28. Qin, X.; Zhen, F.; Zhu, S.J.; Xi, G.L. Spatial Pattern of Catering Industry in Nanjing Urban Area Based on the Degree of Public Praise from Internet: A Case Study of Dianping.com. Sci. Geogr. Sin. 2014, 34, 810–817. [Google Scholar] [CrossRef]
  29. Li, Y.Y.; Liu, H.Y.; Wang, L. Spatial Distribution Pattern of the Catering Industry in A Tourist City: Taking Lhasa City as A Case. J. Resour. Ecol. 2020, 11, 191–205. [Google Scholar] [CrossRef]
  30. Zeng, X.; Cui, H.S.; Liu, Z.G. Spatial and Temporal Evolution Characteristics and Influencing Factors of Restaurants in Guangzhou. Econ. Geogr. 2019, 39, 143–151. [Google Scholar] [CrossRef]
  31. Xu, X.Y.; Li, M. Analysis on Spatial Distribution Pattern of Beijing Restaurants based on Open Source Big Data. J. Geo-Inf. Sci. 2019, 21, 215–225. [Google Scholar]
  32. Zhao, W.; Cheng, Y.Y.; Zhou, L.; Yang, Y.S. Spatial Structure Characters of Special Catering Industry in the Central Area of Chengdu. Planner 2018, 34, 93–98. [Google Scholar]
  33. Zhou, A.H.; Zhang, Y.S.; Fu, X.; Zhu, H.Y.; Dong, H.N. Study on the spatial distribution of Beijing’s Time-honored Brand Caterings and its influencing factors. World Reg. Stud. 2015, 24, 150–158. [Google Scholar]
  34. Wang, Y.F.; Lin, W.S.; Feng, C.C. The Impacts of Information and Communication Technologies (ICT) on the Spatial Distribution of Urban Customer Services: A Case Study of Online Takeaway Industry in Beijing. Urban Stud. 2019, 26, 100–107. [Google Scholar]
  35. Shanghai Municipal Government. Shanghai Urban Master Plan (2017–2035). Available online: https://ghzyj.sh.gov.cn/ghjh/20200110/0032-811864.html (accessed on 15 December 2017).
  36. Kan, B.Y.; Pu, L.J.; Xu, C.Y.; Zhu, M.; Huang, S.H.; Xie, Z.D. Driving Factors on the Spatial Heterogeneity of Residential Land Pricein Downtown Nanjing Based on GWR Model. Econ. Geogr. 2019, 39, 100–107. [Google Scholar] [CrossRef]
  37. Liu, W. Construction of Ecological Network in the Main Urban Area of Hefei City Based on Ecological Risk Assessment. Master’s Thesis, Nanchang University, Nanchang, China, 2018. [Google Scholar]
  38. An, S.Q.; Wang, Z.F.; Zhu, X.L.; Hong, B.G.; Zhao, R.L. Effects of soil factors on species diversity of secondary forest communities. J. Wuhan Bot. Res. 1997, 15, 143–150. [Google Scholar]
  39. Gu, Q.S.; Zhang, H.P.; Zhou, X.X.; Zhao, P.F. Geographical distribution and diffusion effect of eight traditional Chinese cuisines—An empirical analysis based on the perspective of big data. Zhejiang Acad. J. 2019, 5, 47–53, 241–244. [Google Scholar] [CrossRef]
  40. Zuo, Y.; Chen, H.; Pan, J.; Si, Y.; Law, R.; Zhang, M. Spatial distribution pattern and influencing factors of sports tourism resources in China. ISPRS Int. J. Geo-Inf. 2021, 10, 428. [Google Scholar] [CrossRef]
  41. Getis, A. Spatial autocorrelation. In Handbook of Applied Spatial Analysis; Fischer, M.M., Getis, A., Eds.; Springer: Berlin, Germany, 2010. [Google Scholar] [CrossRef]
  42. Chen, G.; Luo, J.; Zhang, C.; Jiang, L.; Tian, L.; Chen, G. Characteristics and influencing factors of spatial differentiation of urban black and odorous waters in China. Sustainability 2018, 10, 4747. [Google Scholar] [CrossRef] [Green Version]
  43. Wang, F. Quantitative Methods and Socio-Economic Applications in GIS; CRC Press: Boca Raton, FL, USA, 2014. [Google Scholar] [CrossRef] [Green Version]
  44. Xia, L.J.; Liu, Y.F.; Liu, G.W. Distribution pattern and influencing factors of catering industry in prefecture-level cities in China: An empirical study based on the data of “Dianping.com”. Econ. Geogr. 2018, 38, 133–141. [Google Scholar] [CrossRef]
  45. Gao, Y.H.; Yang, Q.Q.; Liang, L.; Zhao, Y.H. Spatial pattern and influencing factors of retailing industries in Xi’an based on POI data. Sci. Geogr. Sin. 2020, 40, 710–719. [Google Scholar] [CrossRef]
  46. Jiang, Y.Z. The Eight Major Chinese Cuisines and the Ninth Cuisine. Essence Lit. Hist. 2013, 5, 64–68. [Google Scholar]
  47. Wu, L.Z.; Quan, D.J.; Zhu, H.X. Study on the Spatial Distribution of Time-honored Catering Brand and its Influencing Factors in Xi’an City. World Reg. Stud. 2017, 26, 105–114, 127. [Google Scholar]
  48. Zhang, X.; Xu, Y.L. Spatial distribution and influencing factors of catering facilities in Nanjing. Trop. Geogr. 2009, 29, 362–367. [Google Scholar]
  49. Wang, P.P.; Yan, Y. Research on the spatial pattern of catering industry in the main urban area of Xi’an based on network data. J. Ningxia Univ. (Nat. Sci. Ed.) 2019, 40, 291–296. [Google Scholar]
  50. Guo, J.Y. Geographical and Environmental Factors for the Formation of Eight Chinese Cuisines. Yinshan Acad. J. 2016, 30, 104–107. [Google Scholar] [CrossRef]
Figure 1. The main urban areas and administrative districts of the four central cities in the YRD.
Ijgi 11 00321 g001
Figure 2. Kernel density analysis of Chinese restaurants in the main urban areas of the four central cities in the YRD.
Ijgi 11 00321 g002
Figure 3. Kernel density analysis of foreign restaurants in the main urban areas of the four central cities in the YRD.
Ijgi 11 00321 g003
Figure 4. The CLI distribution of the administrative districts in the main urban areas of the four central cities in the YRD.
Ijgi 11 00321 g004
Figure 5. The LISA map of the CLI of the administrative districts in the main urban areas of the four central cities in the YRD.
Ijgi 11 00321 g005
Figure 6. The CDI distribution of the administrative districts in the main urban areas of the four central cities in the YRD.
Ijgi 11 00321 g006
Figure 7. The LISA map of the CDI of the administrative districts in the main urban areas of the four central cities in the YRD.
Ijgi 11 00321 g007
Figure 8. The CGPI of the four central cities in the YRD.
Ijgi 11 00321 g008
Figure 9. Kernel density analysis of Anhui cuisine in the main urban areas of the four central cities in the YRD.
Ijgi 11 00321 g009
Figure 10. Kernel density analysis of Sichuan cuisine in the main urban areas of the four central cities in the YRD.
Ijgi 11 00321 g010
Figure 11. Kernel density analysis of Fujian cuisine in the main urban areas of the four central cities in the YRD.
Ijgi 11 00321 g011
Figure 12. Kernel density analysis of Cantonese cuisine in the main urban areas of the four central cities in the YRD.
Ijgi 11 00321 g012
Figure 13. Kernel density analysis of Halal Northwestern cuisine in the main urban areas of the four central cities in the YRD.
Ijgi 11 00321 g013
Figure 14. Spatial distribution of regression coefficients of GWR model of CLI in YRD.
Ijgi 11 00321 g014
Figure 15. Spatial distribution of regression coefficients of GWR model of CDI in YRD.
Ijgi 11 00321 g015
Table 1. Proportion of Chinese restaurants and foreign restaurants in the main urban areas of the four central cities in the YRD.
Types and Proportions of RestaurantsShanghaiHangzhouNanjingHefei
Chinese restaurants (%)38.369.570.972.1
foreign restaurants (%)3.53.73.22.1
other restaurants (%)58.226.825.925.8
Table 2. Global and local spatial autocorrelation analysis results table of different cuisines in the YRD.
Type of
Cuisine
Moran’s I
Index
Expectation
Index
VarianceZ
Score
p
Value
High-High District
Shanghai cuisine0.7846−0.04170.01816.14180Minhang District, Pudong New District, Baoshan District, Huangpu District, Yangpu District, Jing’an District of Shanghai
Jiangsu and Zhejiang cuisine0.6274−0.04170.01735.08750Shangcheng District, Gongshu District and Xihu District of Hangzhou
Anhui cuisine0.5405−0.04170.01484.780Luyang District, Baohe District, Yaohai District, Shushan District of Hefei
Fujian cuisine0.5172−0.04170.01724.25510Minhang District, Pudong New District, Baoshan District of Shanghai
Shandong cuisine0.3969−0.04170.01533.5380.0004Minhang District, Pudong New District, Baoshan District, Yangpu District of Shanghai
Hunan cuisine0.1842−0.04170.01431.88620.0592Minhang District, Pudong New District of Shanghai
Table 3. Influencing factors indicators of the characteristics of the catering industry in the YRD.
FactorIndicatorUnit
Regional economic levelGDPbillion
Per capita disposable incomeyuan
Population concentration levelPermanent residents10,000 people
Population densitypeople/km2
Industrial structureThe added value of the tertiary industrybillion
The proportion of the tertiary industry%
Degree of opennessTotal import and exportbillion
Market vitalityThe total retail sales of social consumer goodsbillion
Publisher’s Note: MDPI stays neutral with regard to jurisdictional claims in published maps and institutional affiliations.

