
Multipurpose GIS Portal for Forest Management, Research, and Education


Abstract
:1. Introduction
2. Materials and Methods
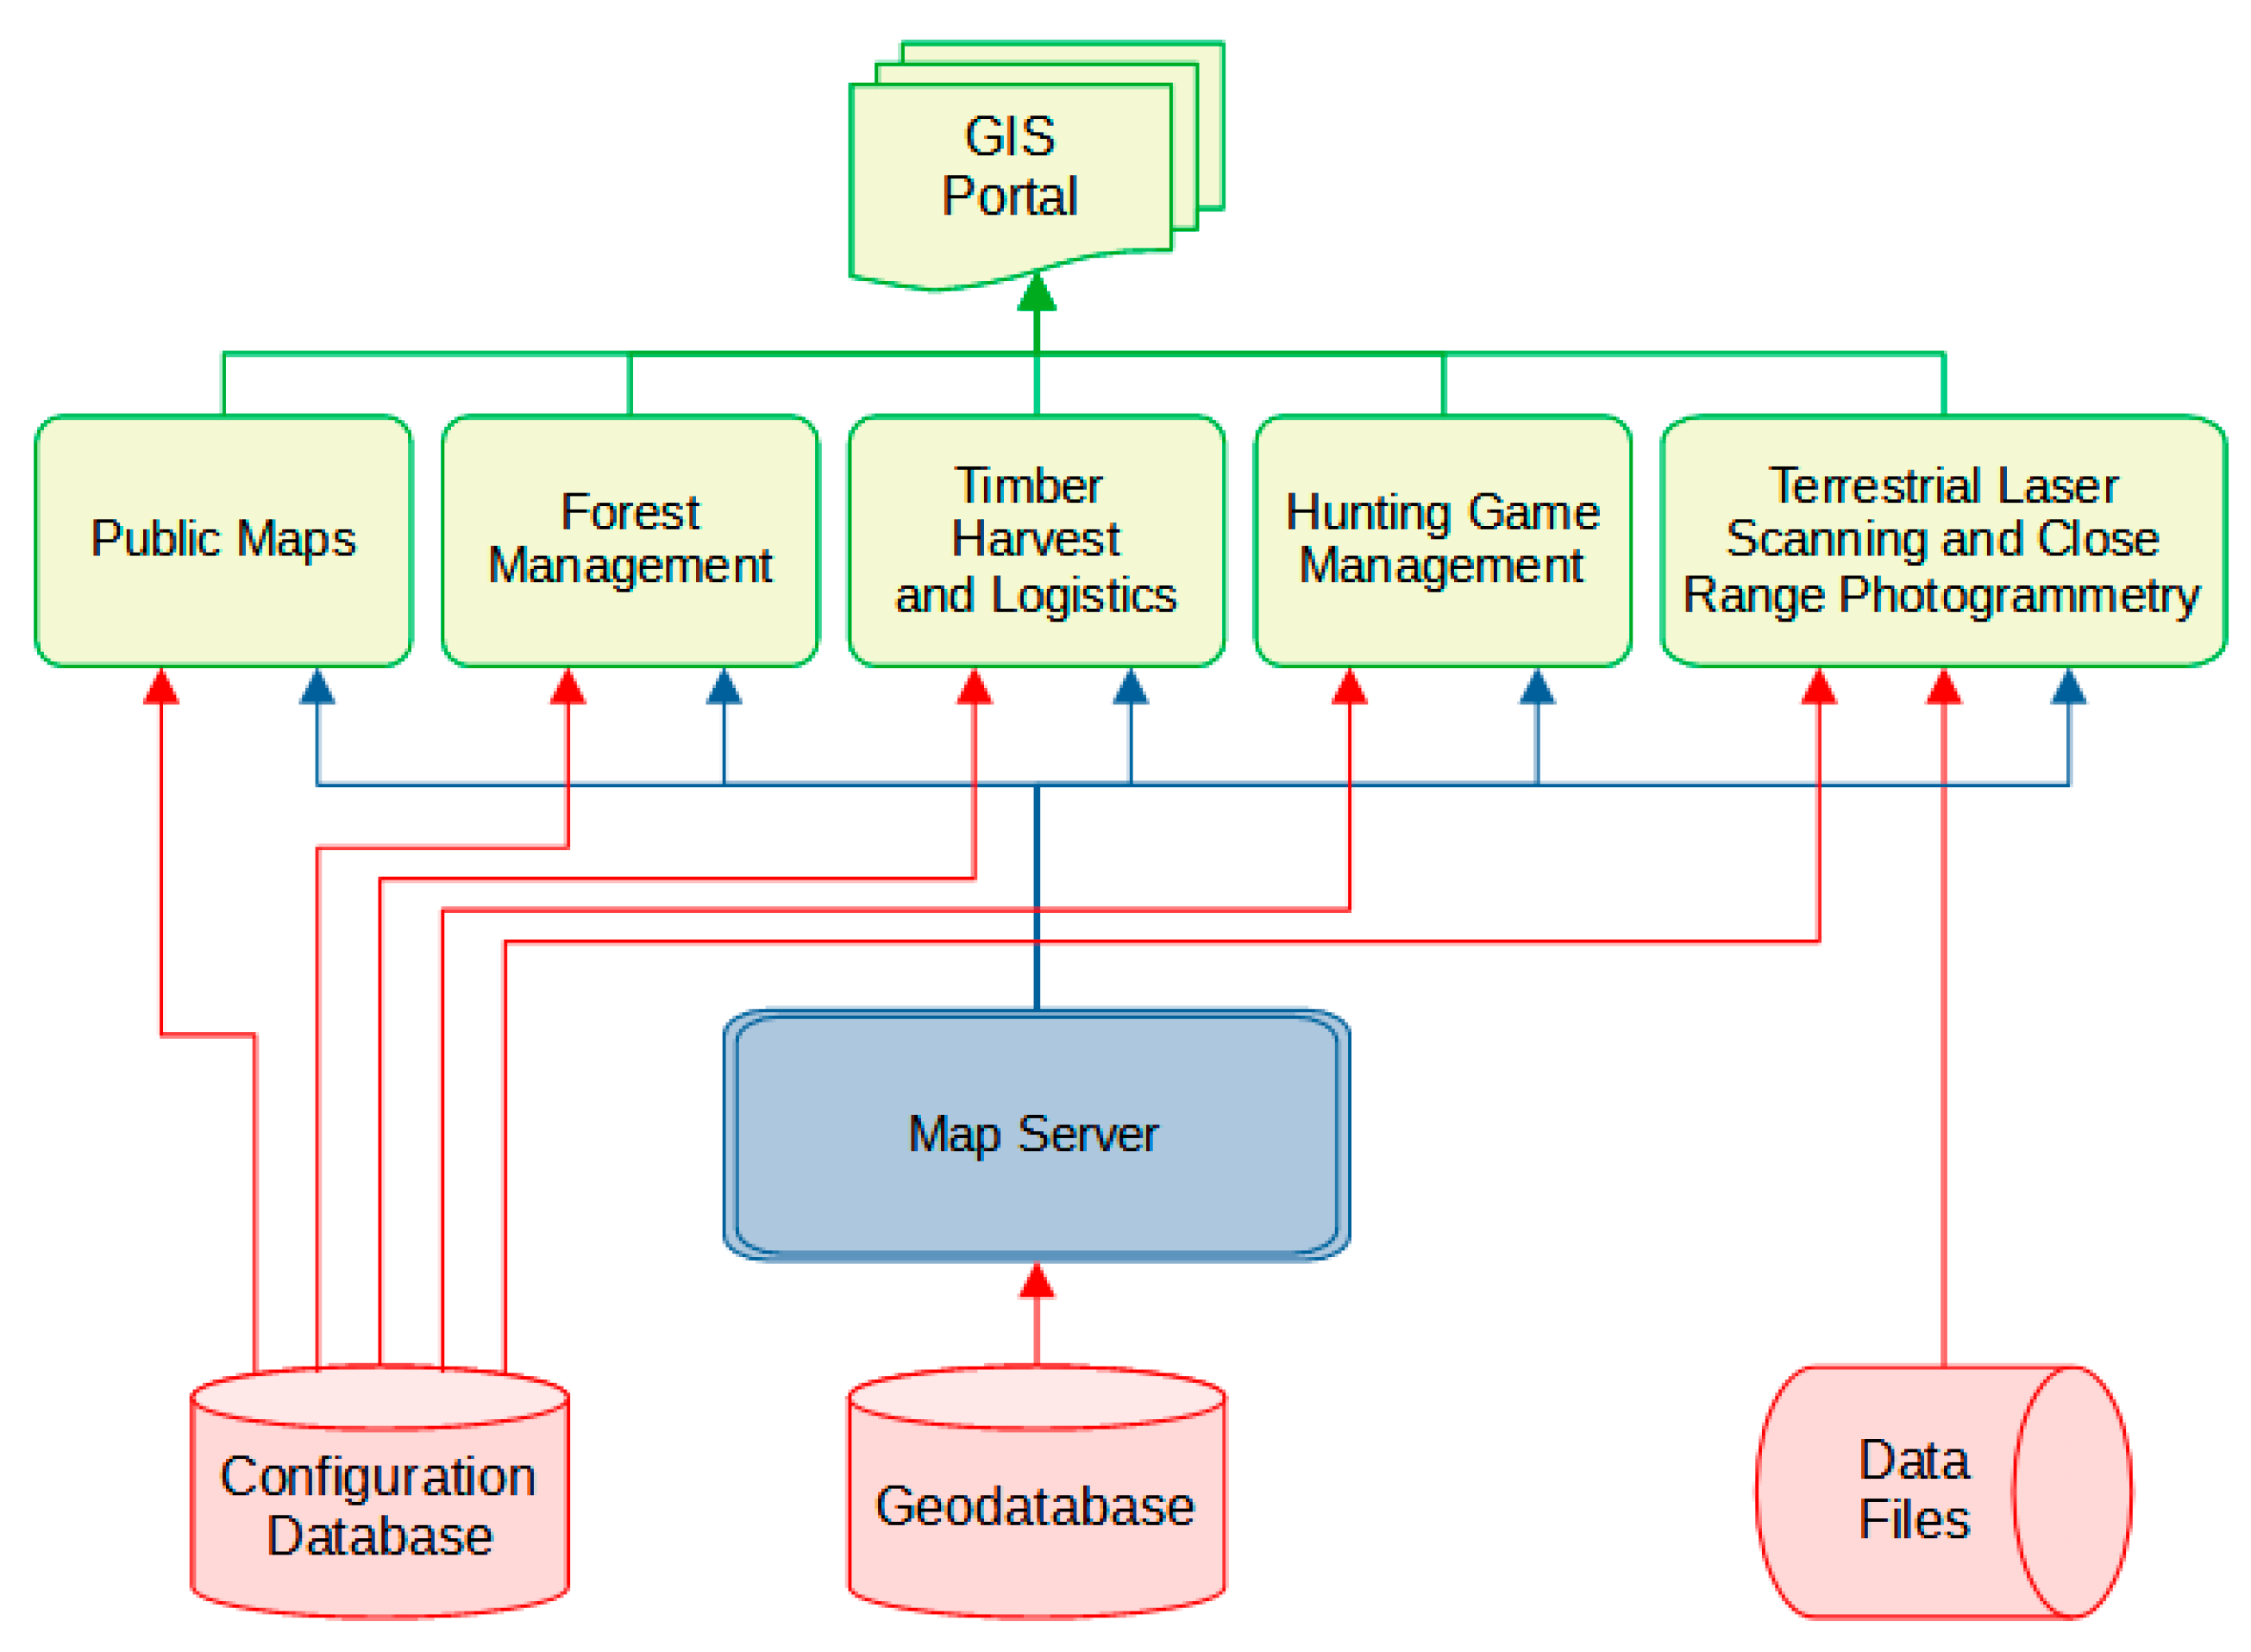
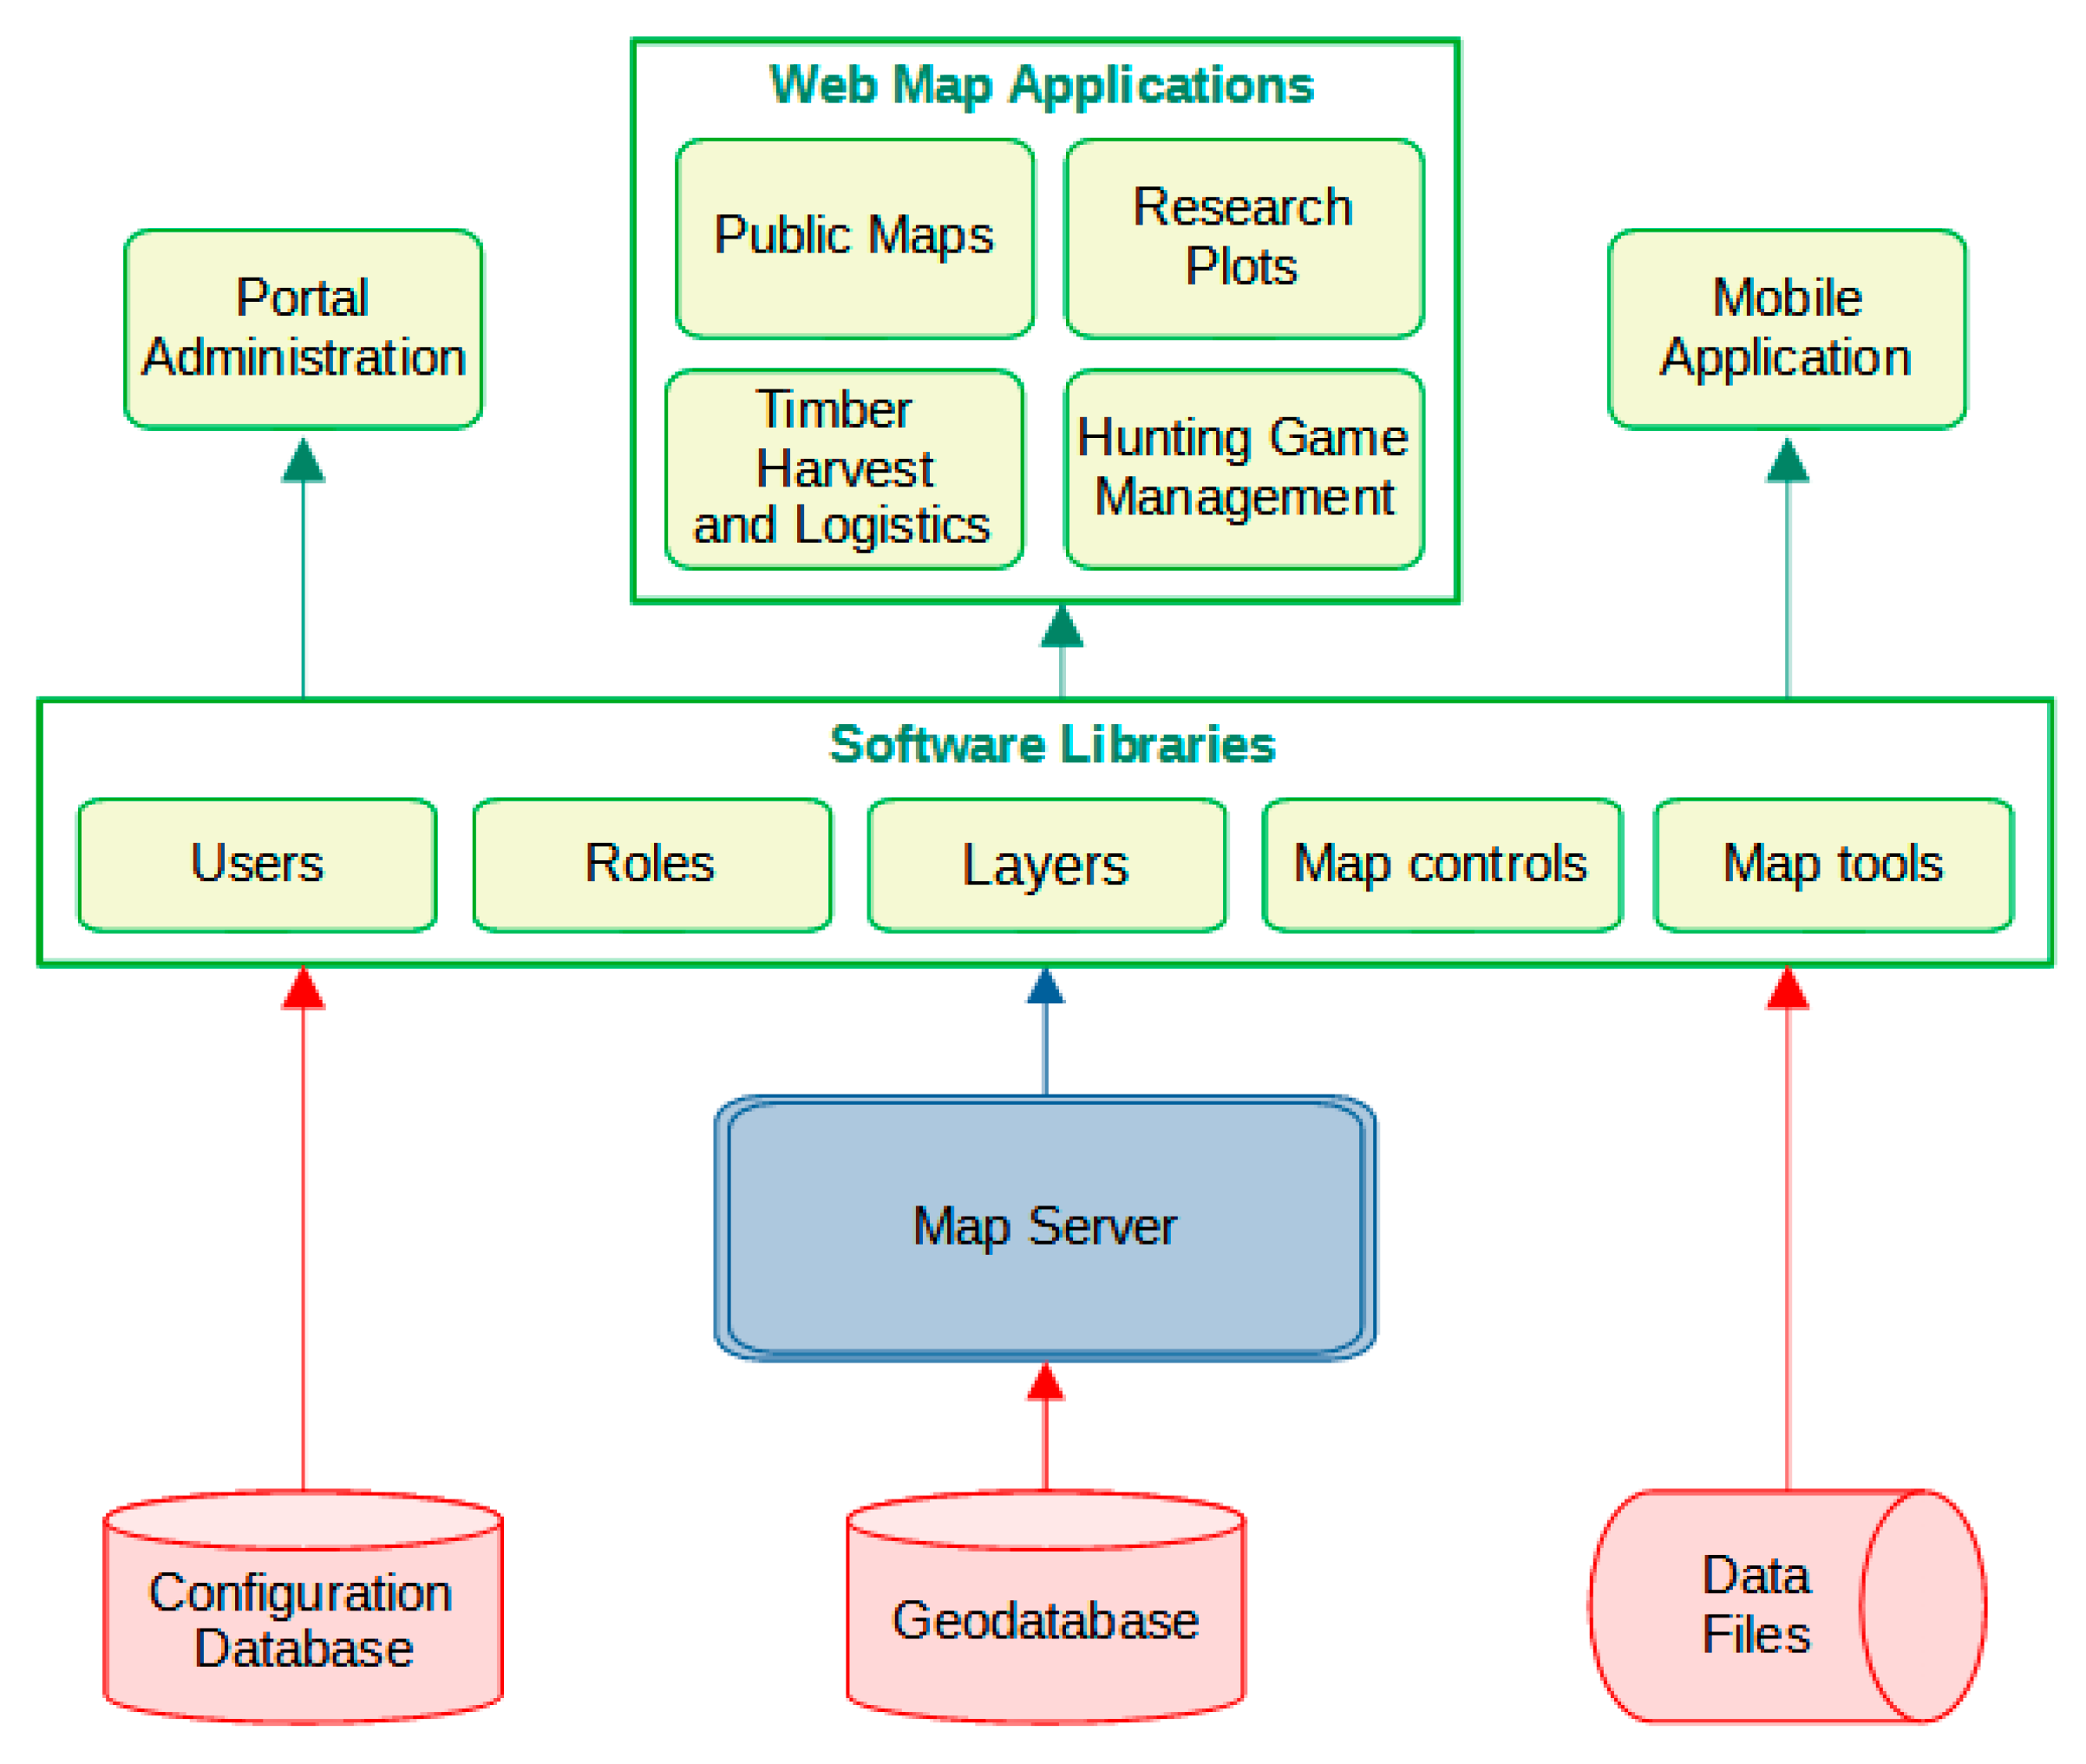
2.1. Prototype of the GIS Portal
- Public Maps provides detailed interactive online digital maps of the UFE area, including roads, color orthophoto maps, and thematic maps of forest stands for public use.
- Forest Management presents forest stand maps using a combination of orthophoto time series, high-resolution digital elevation models (DEMs), and digital surface models (DSMs).
- Timber Harvest and Logistics is highly specialized and provides detailed information on the forest road network, landings, skidding distances, and forest stand terrain.
- Hunting Game Management gives detailed maps of roads and trails, hunting lodges, stands, game feeders, wild boar parks and other hunting facilities. It also calculates viewing areas from user-defined points, including 3D visualization.
- Terrestrial Laser Scanning (TLS) and Close Range Photogrammetry (CRP) focuses on new data sources for forest inventory, growth forecasting, and 3D modeling. The location of research plots and research activities is included. Point clouds are published and visualized in interactive 3D views.
2.2. User Preferences
2.3. Data Processing
3. Results
3.1. User Preferences
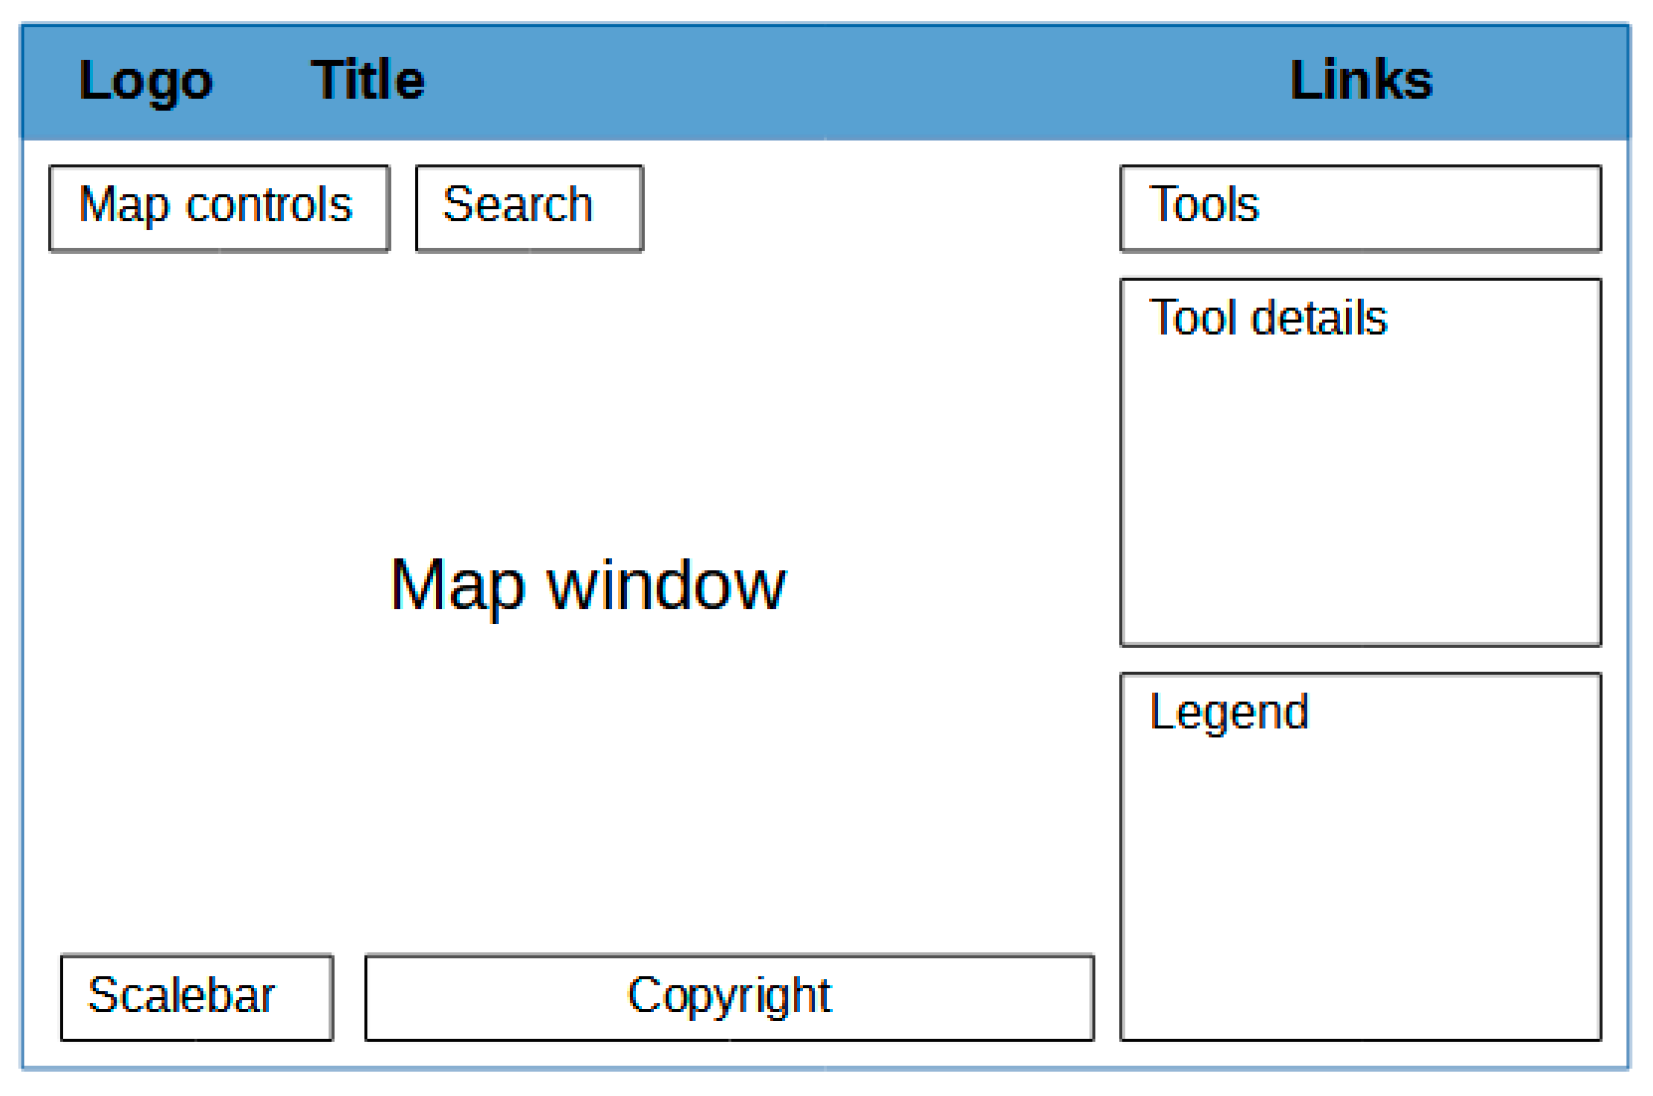
3.2. Design of the GIS Portal
4. Discussion
5. Conclusions
Author Contributions
Funding
Data Availability Statement
Conflicts of Interest
Appendix A

| Platform | S 1 | R | F | T | A |
|---|---|---|---|---|---|
| Desktop | 2.7 ± 0.6 | 2.5 ± 1.1 | 2.6 ± 1.1 | 2.4 ± 0.9 | 2.3 ± 0.9 |
| Mobile | 2.2 ± 0.9 | 2.9 ± 1.0 | 2.6 ± 1.0 | 2.5 ± 0.7 | 2.6 ± 0.9 |
| User Groups | Difference | p-Value of t-Test |
|---|---|---|
| Researchers/students | 0.8 | 8.3 × 10⁻³ |
| Foresters/students | 0.9 | 3.4 × 10⁻³ |
| Teachers/students | 0.7 | 4.4 × 10⁻² |
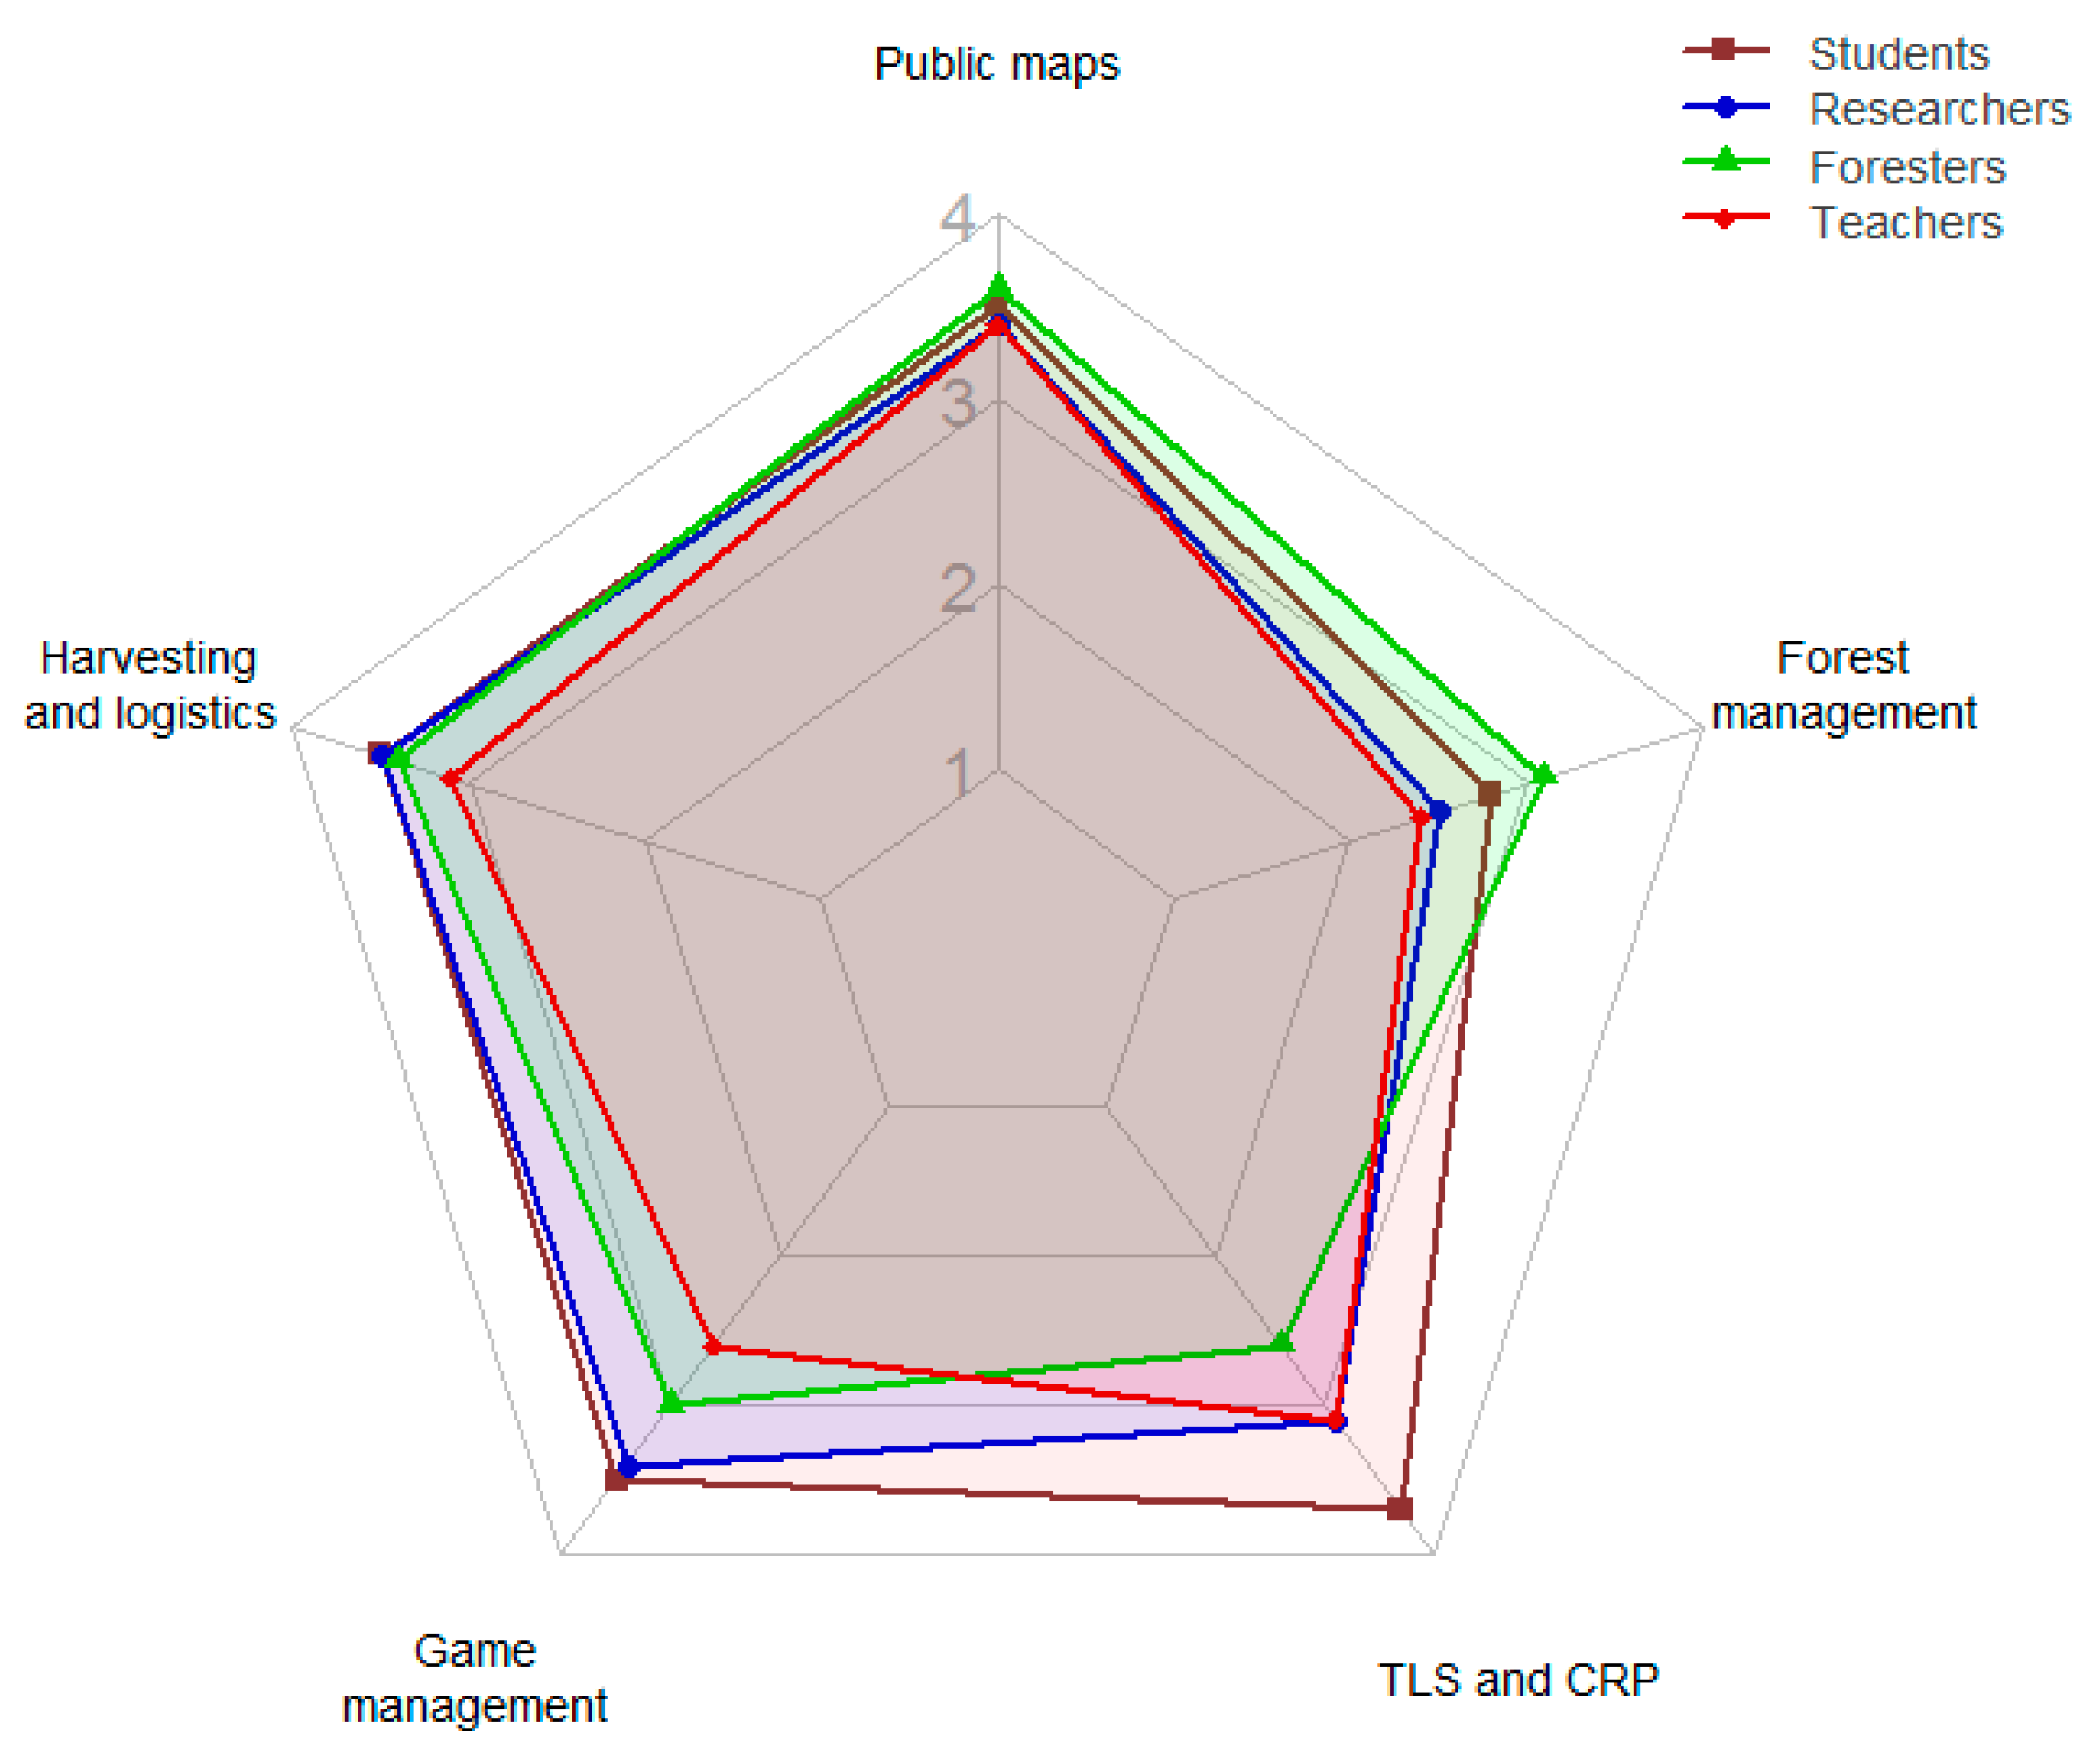
| Application | S 1 | R | F | T | A |
|---|---|---|---|---|---|
| Public Maps | 3.5 ± 0.6 | 3.4 ± 0.7 | 3.6 ± 0.7 | 3.4 ± 0.5 | 3.5 ± 0.6 |
| Timber Harvest and Logistics | 3.5 ± 0.6 | 3.5 ± 0.9 | 3.4 ± 0.6 | 3.1 ± 0.5 | 3.4 ± 0.7 |
| Hunting Game Management | 3.5 ± 0.5 | 3.4 ± 0.9 | 3.0 ± 1.0 | 2.6 ± 0.6 | 3.1 ± 0.7 |
| TLS and CRP | 3.7 ± 0.5 | 3.1 ± 0.9 | 2.6 ± 1.1 | 3.1 ± 0.7 | 3.1 ± 0.8 |
| Forestry | 2.8 ± 0.9 | 2.5 ± 1.1 | 3.1 ± 1.0 | 2.4 ± 0.6 | 2.7 ± 0.9 |
| Application | User Groups | Difference | p-Value of t-Test |
|---|---|---|---|
| Timber Harvest and Logistics | Students/teachers | 0.4 | 4.0 × 10⁻³ |
| Hunting Game Management | Students/teachers | 0.9 | 8.7 × 10⁻⁵ |
| Researchers/teachers | 0.8 | 6.1 × 10⁻⁴ | |
| TLS and CRP | Students/researchers | 0.6 | 2.8 × 10⁻³ |
| Students/foresters | 1.1 | 7.0 × 10⁻⁶ | |
| Forestry | Foresters/researchers | 0.6 | 4.4 × 10⁻³ |
| Foresters/teachers | 0.7 | 5.1 × 10⁻³ |
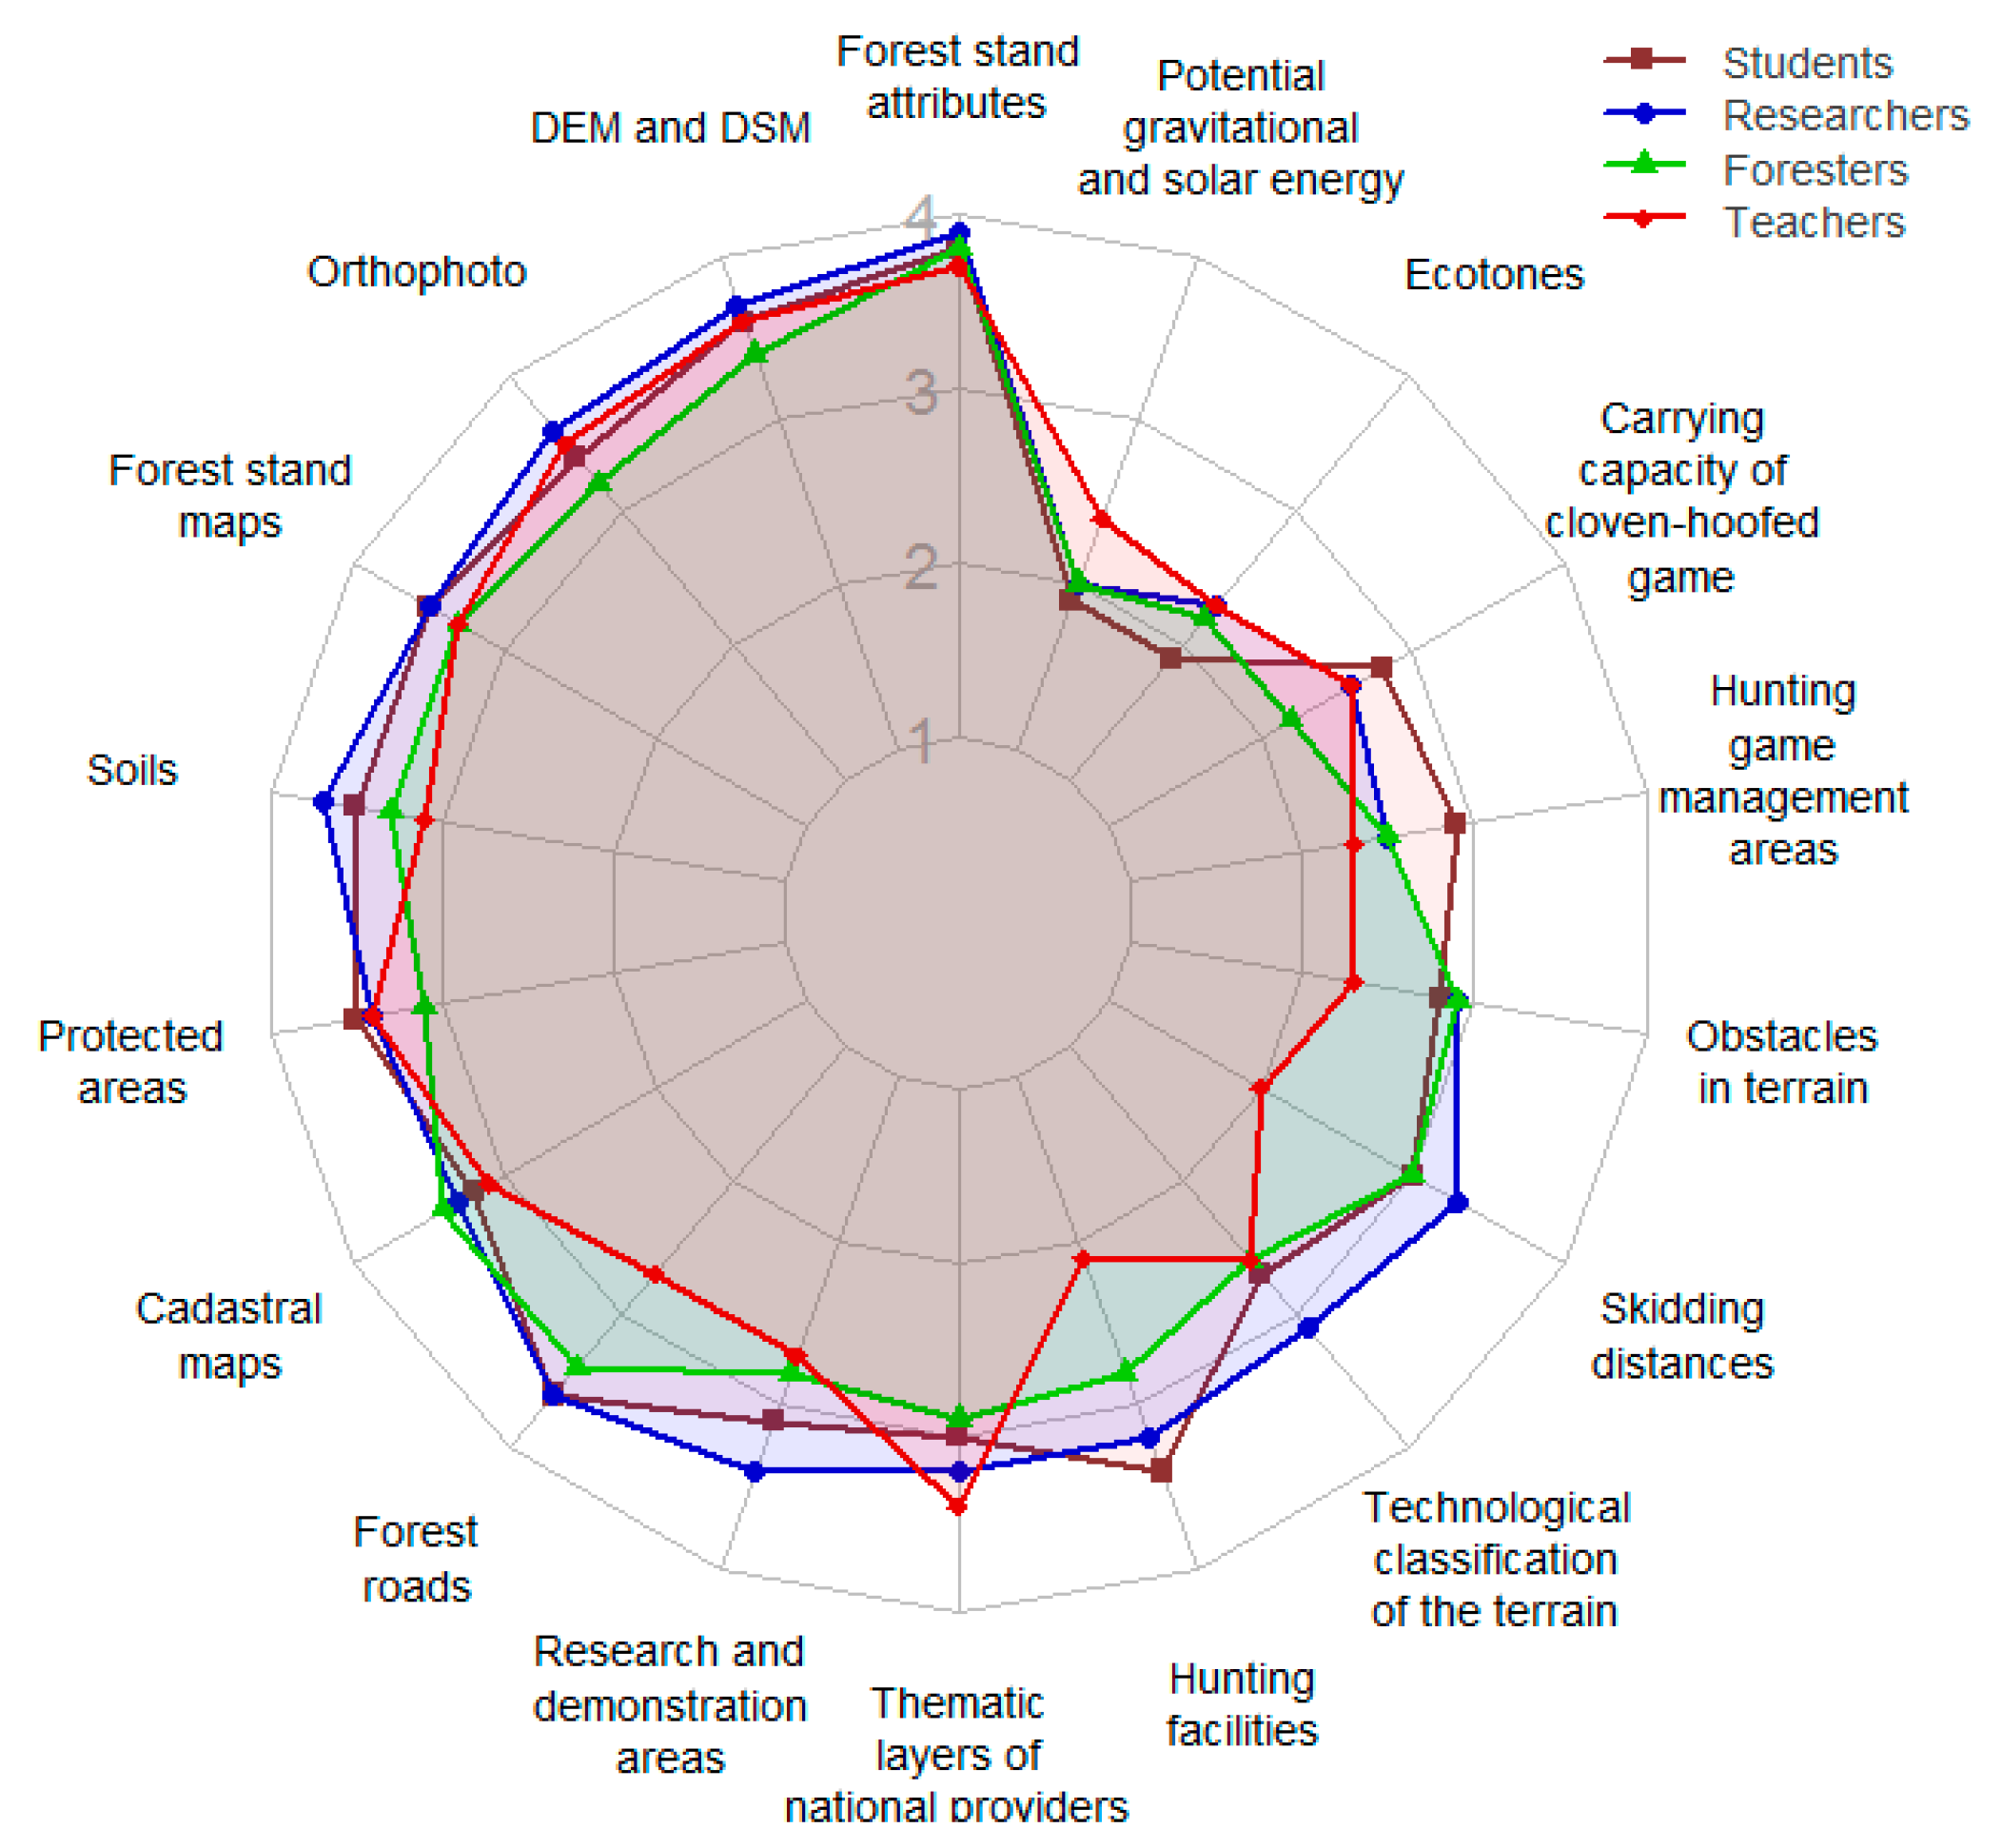
| Thematic Layer | S 1 | R | F | T | A |
|---|---|---|---|---|---|
| Forest stand attributes | 3.8 ± 0.4 | 3.9 ± 0.4 | 3.8 ± 0.4 | 3.7 ± 0.5 | 3.8 ± 0.4 |
| DEM and DSM | 3.6 ± 0.7 | 3.7 ± 0.6 | 3.4 ± 0.6 | 3.6 ± 0.5 | 3.6 ± 0.6 |
| Orthophoto | 3.4 ± 0.7 | 3.6 ± 0.7 | 3.2 ± 0.8 | 3.5 ± 0.5 | 3.4 ± 0.7 |
| Forest stand maps | 3.5 ± 0.6 | 3.5 ± 0.6 | 3.3 ± 0.7 | 3.3 ± 0.7 | 3.4 ± 0.7 |
| Soils | 3.5 ± 0.6 | 3.7 ± 0.5 | 3.3 ± 0.8 | 3.1 ± 0.6 | 3.4 ± 0.6 |
| Protected areas | 3.5 ± 0.6 | 3.4 ± 0.8 | 3.1 ± 0.7 | 3.4 ± 0.6 | 3.4 ± 0.7 |
| Cadastral maps | 3.2 ± 0.7 | 3.3 ± 0.7 | 3.4 ± 0.7 | 3.1 ± 0.7 | 3.3 ± 0.7 |
| Forest roads | 3.6 ± 0.7 | 3.6 ± 0.5 | 3.4 ± 0.7 | 2.7 ± 0.6 | 3.3 ± 0.6 |
| Research and demonstration areas | 3.1 ± 0.7 | 3.4 ± 0.8 | 2.8 ± 1.0 | 2.7 ± 0.9 | 3.0 ± 0.8 |
| Thematic layers of national providers | 3.0 ± 0.7 | 3.2 ± 0.7 | 2.9 ± 0.9 | 3.4 ± 0.6 | 3.0 ± 0.7 |
| Hunting facilities | 3.4 ± 0.7 | 3.2 ± 0.8 | 2.8 ± 1.0 | 2.1 ± 0.8 | 2.9 ± 0.8 |
| Technological classi- fication of the terrain | 2.7 ± 0.8 | 3.1 ± 0.8 | 2.6 ± 0.8 | 2.6 ± 0.7 | 2.8 ± 0.8 |
| Skidding distances | 3.0 ± 0.9 | 3.3 ± 0.9 | 3.0 ± 0.8 | 2.0 ± 0.6 | 2.8 ± 0.8 |
| Obstacles in terrain | 2.8 ± 0.6 | 2.9 ± 0.9 | 2.9 ± 0.8 | 2.3 ± 0.6 | 2.7 ± 0.7 |
| Hunting game management areas | 2.9 ± 0.9 | 2.5 ± 0.9 | 2.5 ± 0.9 | 2.3 ± 0.7 | 2.6 ± 0.8 |
| Carrying capacity of cloven-hoofed game | 2.8 ± 0.7 | 2.6 ± 0.8 | 2.2 ± 0.8 | 2.6 ± 0.5 | 2.6 ± 0.7 |
| Ecotones | 1.9 ± 0.8 | 2.3 ± 1.0 | 2.2 ± 0.7 | 2.3 ± 0.7 | 2.2 ± 0.8 |
| Potential gravitational and solar energy | 1.9 ± 0.7 | 2.0 ± 0.9 | 2.0 ± 1.0 | 2.4 ± 0.7 | 2.1 ± 0.8 |
| Thematic Layer | User Groups | Difference | p-Value of t-Test |
|---|---|---|---|
| Soils | Researchers/foresters | 0.4 | 2.7 × 10⁻³ |
| Researchers/teachers | 0.6 | 3.9 × 10⁻⁵ | |
| Forest roads | Students/teachers | 0.9 | 7.1 × 10⁻⁷ |
| Researchers/teachers | 0.9 | 1.0 × 10⁻⁷ | |
| Foresters/teachers | 0.7 | 6.5 × 10⁻⁵ | |
| Research and demonstration areas | Researchers/teachers | 0.7 | 5.5 × 10⁻⁴ |
| Hunting facilities | Students/foresters | 0.6 | 4.8 × 10⁻³ |
| Students/teachers | 1.3 | 2.4 × 10⁻⁷ | |
| Researchers/teachers | 1.1 | 4.3 × 10⁻⁶ | |
| Foresters/teachers | 0.7 | 1.1 × 10⁻³ | |
| Skidding distances | Students/teachers | 1.0 | 1.1 × 10⁻⁵ |
| Researchers/teachers | 1.3 | 6.8 × 10⁻⁸ | |
| Foresters/teachers | 1.0 | 4.4 × 10⁻⁵ | |
| Obstacles in terrain | Researchers/teachers | 2.6 | 1.5 × 10⁻³ |
| Foresters/teachers | 2.6 | 1.5 × 10⁻³ | |
| Carrying capacity of cloven-hoofed game | Students/foresters | 0.6 | 1.5 × 10⁻³ |
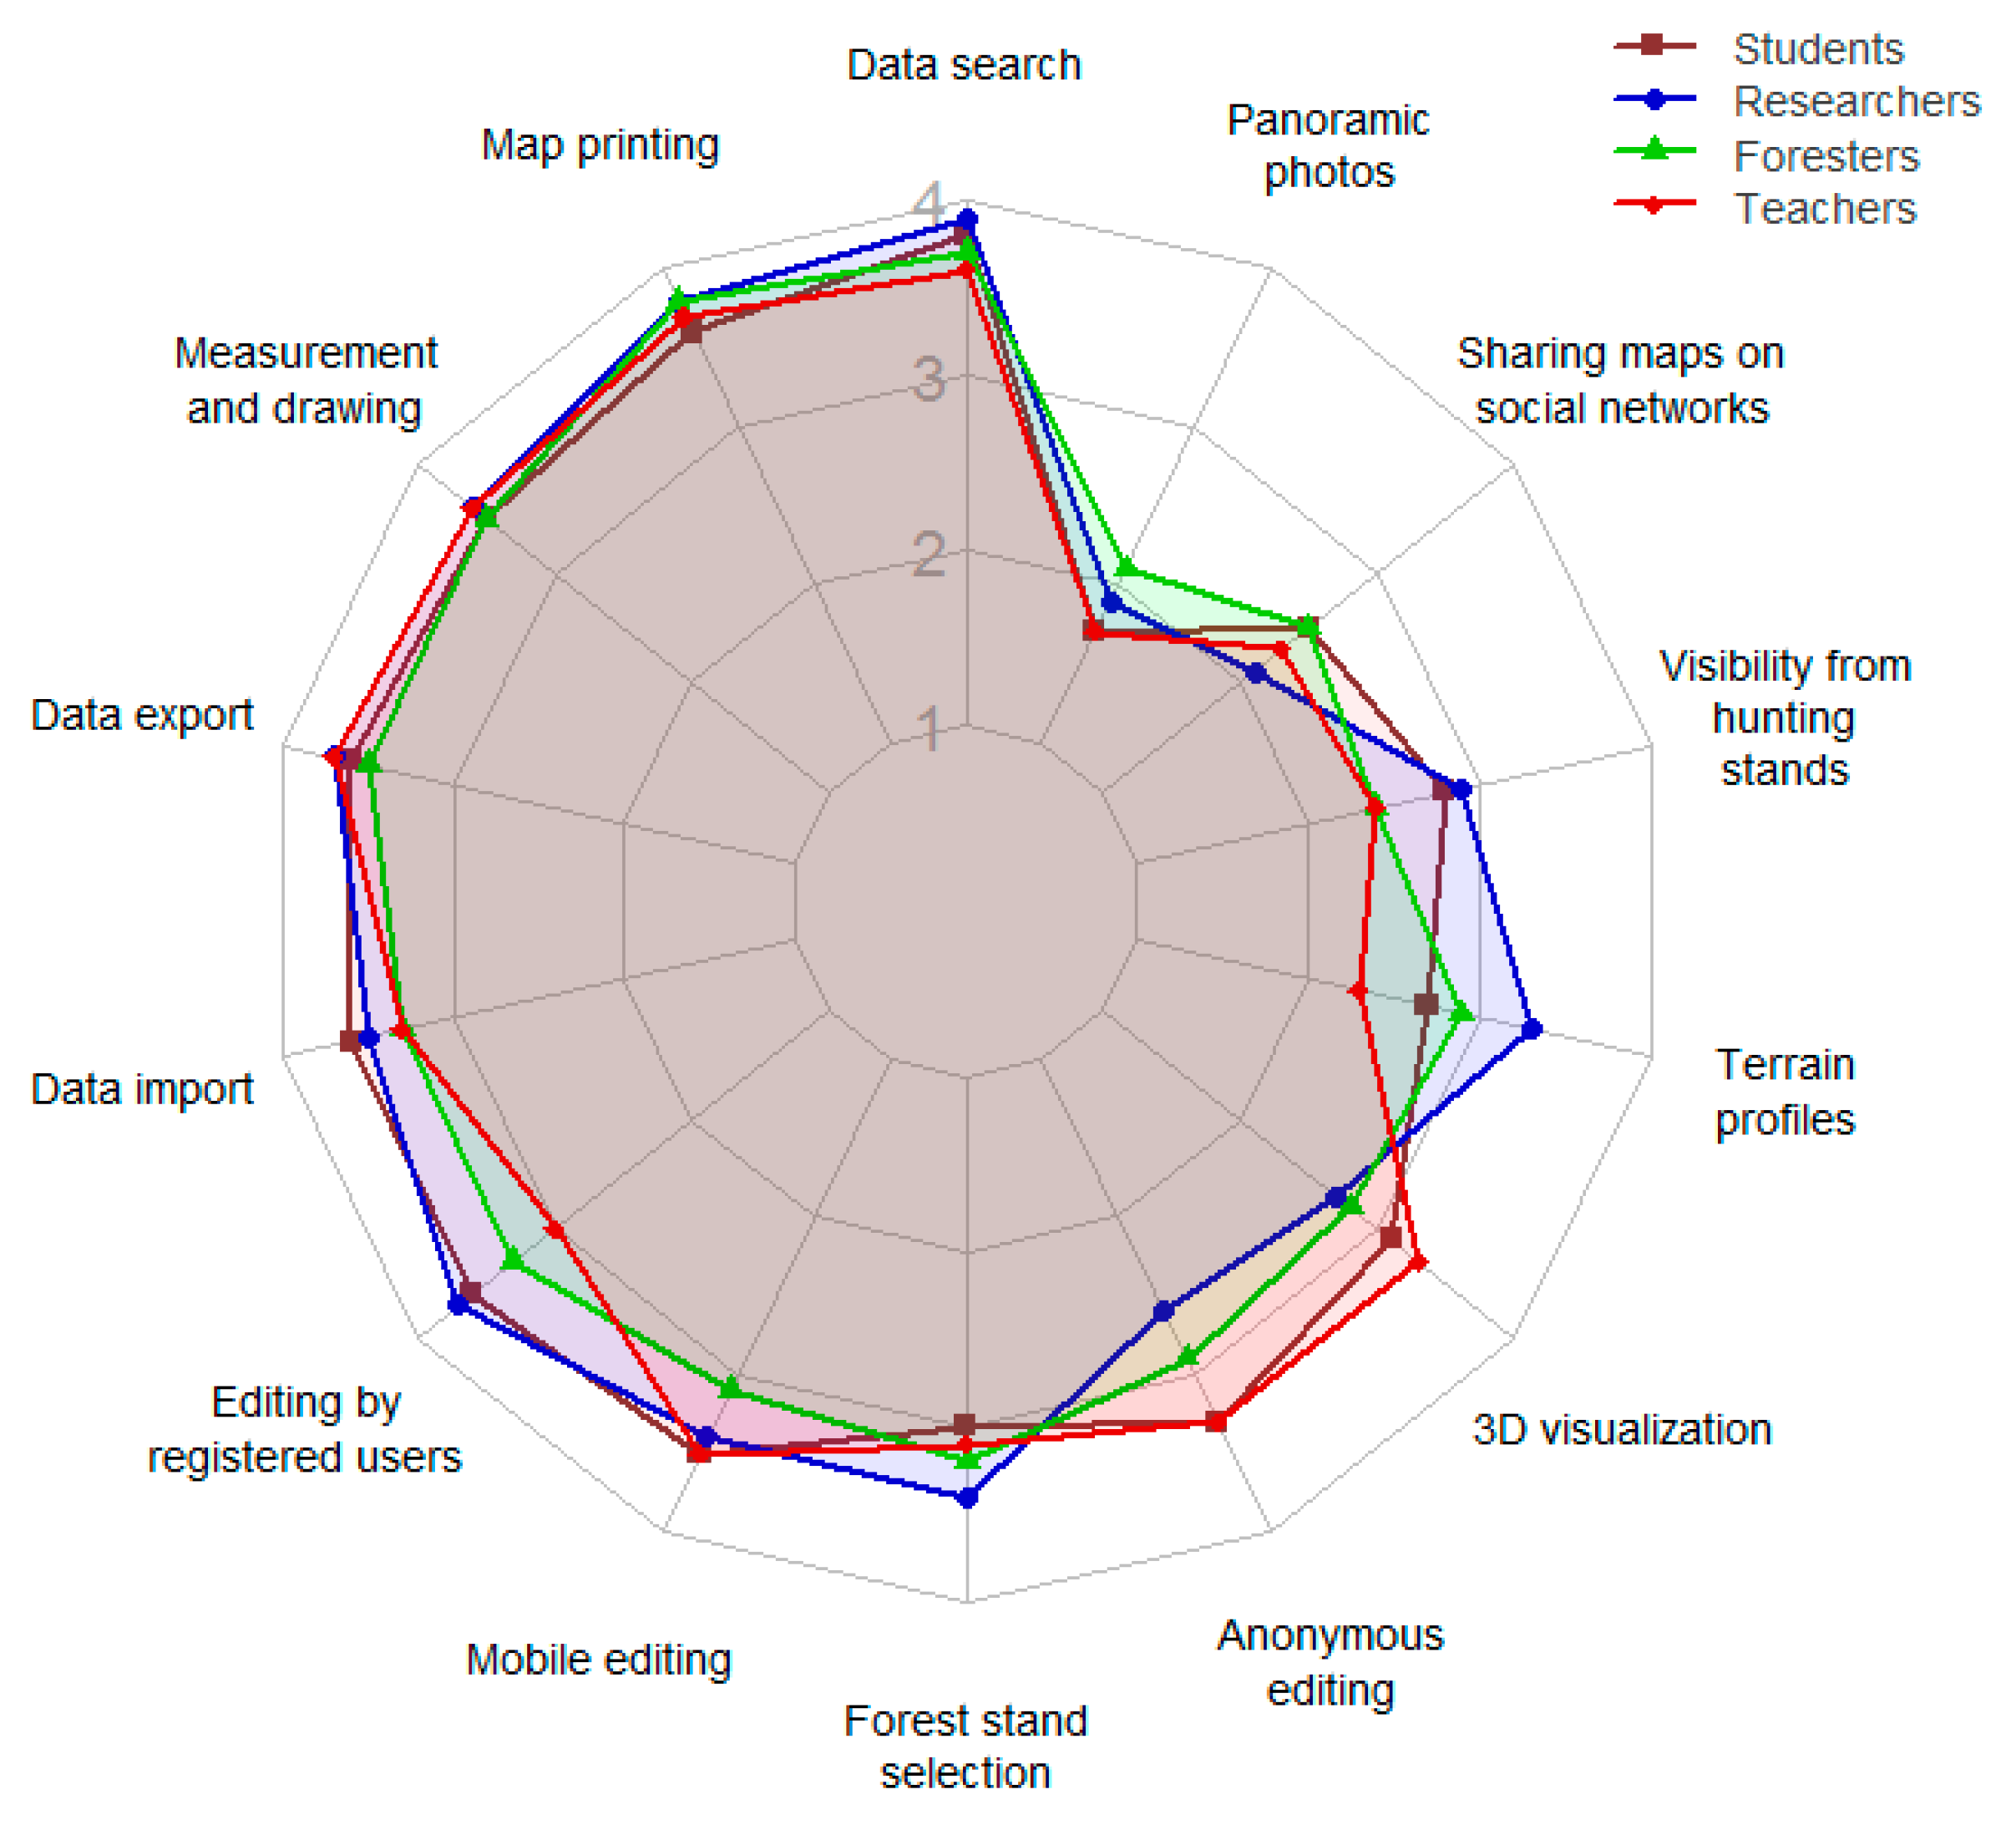
| GIS Tool | S 1 | R | F | T | A |
|---|---|---|---|---|---|
| Data search | 3.8 ± 0.4 | 3.9 ± 0.3 | 3.7 ± 0.7 | 3.6 ± 0.5 | 3.8 ± 0.5 |
| Map printing | 3.6 ± 0.6 | 3.8 ± 0.6 | 3.8 ± 0.4 | 3.7 ± 0.5 | 3.7 ± 0.5 |
| Measurement and drawing | 3.5 ± 0.5 | 3.6 ± 0.6 | 3.5 ± 0.7 | 3.6 ± 0.5 | 3.6 ± 0.6 |
| Data export | 3.6 ± 0.6 | 3.7 ± 0.6 | 3.5 ± 0.6 | 3.7 ± 0.5 | 3.6 ± 0.6 |
| Data import | 3.6 ± 0.6 | 3.5 ± 0.7 | 3.3 ± 0.8 | 3.3 ± 0.6 | 3.5 ± 0.7 |
| Editing by registered users | 3.6 ± 0.6 | 3.7 ± 0.6 | 3.3 ± 0.8 | 3.0 ± 0.8 | 3.4 ± 0.7 |
| Mobile editing | 3.5 ± 0.6 | 3.4 ± 0.6 | 3.1 ± 0.9 | 3.5 ± 0.6 | 3.4 ± 0.7 |
| Forest stand selection | 3.0 ± 0.7 | 3.4 ± 0.7 | 3.2 ± 0.6 | 3.1 ± 0.4 | 3.2 ± 0.6 |
| Anonymous editing | 3.3 ± 0.7 | 2.6 ± 1.1 | 2.9 ± 0.8 | 3.3 ± 0.7 | 3.0 ± 0.8 |
| 3D visualization | 3.1 ± 0.7 | 2.7 ± 0.9 | 2.8 ± 0.9 | 3.3 ± 0.5 | 3.0 ± 0.8 |
| Terrain profiles | 2.7 ± 0.9 | 3.3 ± 0.8 | 2.9 ± 0.9 | 2.3 ± 0.7 | 2.8 ± 0.8 |
| Visibility from hunting stands | 2.8 ± 0.9 | 2.9 ± 1.0 | 2.4 ± 0.9 | 2.4 ± 0.7 | 2.6 ± 0.9 |
| Sharing maps on social networks | 2.5 ± 1.0 | 2.1 ± 1.0 | 2.5 ± 1.1 | 2.3 ± 0.8 | 2.4 ± 1.0 |
| Panoramic photos | 1.7 ± 0.8 | 1.9 ± 1.0 | 2.1 ± 0.9 | 1.7 ± 0.5 | 1.8 ± 0.8 |
| GIS Tool | User Groups | Difference | p-Value of t-Test |
|---|---|---|---|
| Editing by registered users | Students/teachers | 0.6 | 1.3 × 10⁻³ |
| Researchers/teachers | 0.7 | 6.4 × 10⁻⁵ | |
| Anonymous editing | Students/researchers | 0.7 | 2.1 × 10⁻³ |
| Teachers/researchers | 0.7 | 1.3 × 10⁻³ | |
| 3D visualization | Teachers/researchers | 0.6 | 1.2 × 10⁻³ |
| Terrain profiles | Researchers/students | 0.6 | 2.2 × 10⁻³ |
| Researchers/teachers | 1.0 | 4.7 × 10⁻⁵ | |
| Foresters/teachers | 0.6 | 3.5 × 10⁻³ |
References
- Recknagel, F. Ecological Informatics: A Discipline in the Making. Ecol. Inform. 2011, 6, 1–3. [Google Scholar] [CrossRef]
- Sonti, S.H. Application of Geographic Information System (GIS) in Forest Management. J. Geogr. Nat. Disasters 2015, 5, 1000145. [Google Scholar] [CrossRef] [Green Version]
- Grigolato, S.; Mologni, O.; Cavalli, R. GIS Applications in Forest Operations and Road Network Planning: An Overview over the Last Two Decades. Croat. J. Eng. 2017, 38, 175–186. [Google Scholar]
- Picchio, R.; Pignatti, G.; Marchi, E.; Latterini, F.; Benanchi, M.; Foderi, C.; Venanzi, R.; Verani, S. The Application of Two Approaches Using GIS Technology Implementation in Forest Road Network Planning in an Italian Mountain Setting. Forests 2018, 9, 277. [Google Scholar] [CrossRef] [Green Version]
- Vallejo-Villalta, I.; Rodríguez-Navas, E.; Márquez-Pérez, J. Mapping Forest Fire Risk at a Local Scale—A Case Study in Andalusia (Spain). Environments 2019, 6, 30. [Google Scholar] [CrossRef] [Green Version]
- Sachdeva, S.; Bhatia, T.; Verma, A.K. GIS-Based Evolutionary Optimized Gradient Boosted Decision Trees for Forest Fire Susceptibility Mapping. Nat. Hazards 2018, 92, 1399–1418. [Google Scholar] [CrossRef]
- Marušák, R.; Kašpar, J.; Vopěnka, P. Decision Support Systems (DSS) Optimal—A Case Study from the Czech Republic. Forests 2015, 6, 163–182. [Google Scholar] [CrossRef] [Green Version]
- Sagebiel, J.; Glenk, K.; Meyerhoff, J. Spatially Explicit Demand for Afforestation. For. Policy Econ. 2017, 78, 190–199. [Google Scholar] [CrossRef]
- Štofik, J.; Merganič, J.; Merganičová, K.; Saniga, M. Seasonal Changes in Food Composition of the Brown Bear (Ursus Arctos) from the Edge of Its Occurrence—Eastern Carpathians (Slovakia). Folia Zool. 2013, 62, 222–231. [Google Scholar] [CrossRef]
- Potterf, M.; Nikolov, C.; Kočická, E.; Ferenčík, J.; Mezei, P.; Jakuš, R. Landscape-Level Spread of Beetle Infestations from Windthrown- and Beetle-Killed Trees in the Non-Intervention Zone of the Tatra National Park, Slovakia (Central Europe). For. Ecol. Manag. 2019, 432, 489–500. [Google Scholar] [CrossRef]
- Diodato, N.; Bellocchi, G. Spatial Probability Modelling of Forest Productivity Indicator in Italy. Ecol. Indic. 2020, 108, 105721. [Google Scholar] [CrossRef]
- Díaz-Yáñez, O.; Mola-Yudego, B.; González-Olabarria, J.R. Modelling Damage Occurrence by Snow and Wind in Forest Ecosystems. Ecol. Model. 2019, 408, 108741. [Google Scholar] [CrossRef]
- Fan, Y.; Feng, Z.; Mannan, A.; Khan, T.; Shen, C.; Saeed, S. Estimating Tree Position, Diameter at Breast Height, and Tree Height in Real-Time Using a Mobile Phone with RGB-D SLAM. Remote Sens. 2018, 10, 1845. [Google Scholar] [CrossRef] [Green Version]
- Hyyppä, J.; Virtanen, J.-P.; Jaakkola, A.; Yu, X.; Hyyppä, H.; Liang, X. Feasibility of Google Tango and Kinect for Crowdsourcing Forestry Information. Forests 2017, 9, 6. [Google Scholar] [CrossRef] [Green Version]
- Pierzchała, M.; Giguère, P.; Astrup, R. Mapping Forests Using an Unmanned Ground Vehicle with 3D LiDAR and Graph-SLAM. Comput. Electron. Agric. 2018, 145, 217–225. [Google Scholar] [CrossRef]
- Kuželka, K.; Surový, P. Mapping Forest Structure Using UAS inside Flight Capabilities. Sensors 2018, 18, 2245. [Google Scholar] [CrossRef] [PubMed] [Green Version]
- Saukkola, A.; Melkas, T.; Riekki, K.; Sirparanta, S.; Peuhkurinen, J.; Holopainen, M.; Hyyppä, J.; Vastaranta, M. Predicting Forest Inventory Attributes Using Airborne Laser Scanning, Aerial Imagery, and Harvester Data. Remote Sens. 2019, 11, 797. [Google Scholar] [CrossRef] [Green Version]
- Piermattei, L.; Marty, M.; Karel, W.; Ressl, C.; Hollaus, M.; Ginzler, C.; Pfeifer, N. Impact of the Acquisition Geometry of Very High-Resolution Pléiades Imagery on the Accuracy of Canopy Height Models over Forested Alpine Regions. Remote Sens. 2018, 10, 1542. [Google Scholar] [CrossRef] [Green Version]
- Quegan, S.; Le Toan, T.; Chave, J.; Dall, J.; Exbrayat, J.-F.; Minh, D.H.T.; Lomas, M.; D’Alessandro, M.M.; Paillou, P.; Papathanassiou, K.; et al. The European Space Agency BIOMASS Mission: Measuring Forest above-Ground Biomass from Space. Remote Sens. Environ. 2019, 227, 44–60. [Google Scholar] [CrossRef] [Green Version]
- Mokroš, M.; Liang, X.; Surový, P.; Valent, P.; Čerňava, J.; Chudý, F.; Tunák, D.; Saloň, Š.; Merganič, J. Evaluation of Close-Range Photogrammetry Image Collection Methods for Estimating Tree Diameters. ISPRS Int. J. Geo-Inf. 2018, 7, 93. [Google Scholar] [CrossRef] [Green Version]
- Mulverhill, C.; Coops, N.C.; Tompalski, P.; Bater, C.W.; Dick, A.R. The Utility of Terrestrial Photogrammetry for Assessment of Tree Volume and Taper in Boreal Mixedwood Forests. Ann. For. Sci. 2019, 76, 83. [Google Scholar] [CrossRef] [Green Version]
- Cabo, C.; Del Pozo, S.; Rodríguez-Gonzálvez, P.; Ordóñez, C.; González-Aguilera, D. Comparing Terrestrial Laser Scanning (TLS) and Wearable Laser Scanning (WLS) for Individual Tree Modeling at Plot Level. Remote Sens. 2018, 10, 540. [Google Scholar] [CrossRef] [Green Version]
- Pyörälä, J.; Kankare, V.; Liang, X.; Saarinen, N.; Rikala, J.; Kivinen, V.-P.; Sipi, M.; Holopainen, M.; Hyyppä, J.; Vastaranta, M. Assessing Log Geometry and Wood Quality in Standing Timber Using Terrestrial Laser-Scanning Point Clouds. For. Int. J. For. Res. 2019, 92, 177–187. [Google Scholar] [CrossRef]
- Merry, K.; Bettinger, P.; Grebner, D.; Boston, K.; Siry, J. Assessment of Geographic Information System (GIS) Skills Employed by Graduates from Three Forestry Programs in the United States. Forests 2016, 7, 304. [Google Scholar] [CrossRef] [Green Version]
- Bettinger, P.; Merry, K. Follow-up Study of the Importance of Mapping Technology Knowledge and Skills for Entry-Level Forestry Job Positions, as Deduced from Recent Job Advertisements. Math. Comput. For. Nat.-Resour. Sci. 2017, 10, 15–23. [Google Scholar]
- Bettinger, P.; Merry, K.; Bayat, M.; Tomaštík, J. GNSS Use in Forestry—A Multi-National Survey from Iran, Slovakia and Southern USA. Comput. Electron. Agric. 2019, 158, 369–383. [Google Scholar] [CrossRef]
- Favier, T.T.; van der Schee, J.A. The Effects of Geography Lessons with Geospatial Technologies on the Development of High School Students’ Relational Thinking. Comput. Educ. 2014, 76, 225–236. [Google Scholar] [CrossRef]
- Norton, E.; Li, Y.; Mason, L.R.; Washington-Allen, R.A. Assessing the Impact of a Geospatial Data Collection App on Student Engagement in Environmental Education. Educ. Sci. 2019, 9, 118. [Google Scholar] [CrossRef] [Green Version]
- Groshans, G.; Mikhailova, E.; Post, C.; Schlautman, M.; Carbajales-Dale, P.; Payne, K. Digital Story Map Learning for STEM Disciplines. Educ. Sci. 2019, 9, 75. [Google Scholar] [CrossRef] [Green Version]
- Sack, C.M. The Status of Web Mapping in North American Higher Education. Cartogr. Perspect. 2018, 89, 25–43. [Google Scholar] [CrossRef]
- Orazio, C.; Cordero Montoya, R.; Régolini, M.; Borges, J.; Garcia-Gonzalo, J.; Barreiro, S.; Botequim, B.; Marques, S.; Sedmák, R.; Smreček, R.; et al. Decision Support Tools and Strategies to Simulate Forest Landscape Evolutions Integrating Forest Owner Behaviour: A Review from the Case Studies of the European Project, INTEGRAL. Sustainability 2017, 9, 599. [Google Scholar] [CrossRef] [Green Version]
- Marto, M.; Reynolds, K.M.; Borges, J.G.; Bushenkov, V.A.; Marques, S.; Marques, M.; Barreiro, S.; Botequim, B.; Tomé, M. Web-Based Forest Resources Management Decision Support System. Forests 2019, 10, 1079. [Google Scholar] [CrossRef] [Green Version]
- Pastorella, F.; Borges, J.; De Meo, I. Usefulness and Perceived Usefulness of Decision Support Systems (DSSs) in Participatory Forest Planning: The Final Users’ Point of View. IForest—Biogeosci. For. 2016, 9, 422–429. [Google Scholar] [CrossRef] [Green Version]
- Environmental Systems Research Institute (Esri). Available online: https://www.esri.com (accessed on 27 April 2022).
- Jquery. 2022. Available online: https://github.com/jquery/jquery (accessed on 27 April 2022).
- Bootstrap. 2022. Available online: https://github.com/twbs/bootstrap (accessed on 27 April 2022).
- R Core Team. R: A Language and Environment for Statistical Computing; R Foundation for Statistical Computing: Vienna, Austria, 2021. [Google Scholar]
- Athanasis, N.; Karagiannis, F.; Palaiologou, P.; Vasilakos, C.; Kalabokidis, K. AEGIS App: Wildfire Information Management for Windows Phone Devices. Procedia Comput. Sci. 2015, 56, 544–549. [Google Scholar] [CrossRef] [Green Version]
- Fan, G.; Chen, F.; Li, Y.; Liu, B.; Fan, X. Development and Testing of a New Ground Measurement Tool to Assist in Forest GIS Surveys. Forests 2019, 10, 643. [Google Scholar] [CrossRef] [Green Version]
- Kennedy, R.; McLeman, R.; Sawada, M.; Smigielski, J. Use of Smartphone Technology for Small-Scale Silviculture: A Test of Low-Cost Technology in Eastern Ontario. Small-Scale For. 2014, 13, 101–115. [Google Scholar] [CrossRef]
- Li, C.; Jiang, Y. Development of Mobile GIS System for Forest Resources Second-Class Inventory. J. For. Res. 2011, 22, 263–268. [Google Scholar] [CrossRef]
- National Forest Center (NFC), Slovakia. Available online: https://www.nlcsk.org (accessed on 27 April 2022).
- Vahidi, H.; Klinkenberg, B.; Johnson, B.; Moskal, L.; Yan, W. Mapping the Individual Trees in Urban Orchards by Incorporating Volunteered Geographic Information and Very High Resolution Optical Remotely Sensed Data: A Template Matching-Based Approach. Remote Sens. 2018, 10, 1134. [Google Scholar] [CrossRef] [Green Version]
- Wohner, C.; Peterseil, J.; Poursanidis, D.; Kliment, T.; Wilson, M.; Mirtl, M.; Chrysoulakis, N. DEIMS-SDR—A Web Portal to Document Research Sites and Their Associated Data. Ecol. Inform. 2019, 51, 15–24. [Google Scholar] [CrossRef]
- Moreno, R.; Pérez-Gil, F.J.; Pardo, J.J.; Navarro, A.; Tapiador, F.J. Science for Everyone (ScifE): A Proposed Framework for Science as a Service Using Interactive Web Technologies. Comput. Geosci. 2019, 131, 70–79. [Google Scholar] [CrossRef]
- Athanasiadis, A.; Andreopoulou, Z. E-Praxis: A Web-Based Forest Law Decision Support System for Land Characterization in Greece. For. Policy Econ. 2019, 103, 157–166. [Google Scholar] [CrossRef]
- Zhang, M.; Jiang, L.; Yue, P.; Gong, J. Interoperable Web Sharing of Environmental Models Using OGC Web Processing Service and Open Modeling Interface (OpenMI). Environ. Model. Softw. 2020, 133, 104838. [Google Scholar] [CrossRef]
- Aye, Z.C.; Jaboyedoff, M.; Derron, M.-H.; van Westen, C.J. Prototype of a Web-Based Participative Decision Support Platform in Natural Hazards and Risk Management. ISPRS Int. J. Geo-Inf. 2015, 4, 1201–1224. [Google Scholar] [CrossRef] [Green Version]
- Brown, G.G.; Donovan, S. Escaping the National Forest Planning Quagmire: Using Public Participation GIS to Assess Acceptable National Forest Use. J. For. 2013, 111, 115–125. [Google Scholar] [CrossRef] [Green Version]
- Jaligot, R.; Hasler, S.; Chenal, J. National Assessment of Cultural Ecosystem Services: Participatory Mapping in Switzerland. Ambio 2019, 48, 1219–1233. [Google Scholar] [CrossRef]
- Janse, G. Communication between Forest Scientists and Forest Policy-Makers in Europe—A Survey on Both Sides of the Science/Policy Interface. For. Policy Econ. 2008, 10, 183–194. [Google Scholar] [CrossRef]
- Horbiński, T.; Cybulski, P.; Medyńska-Gulij, B. Web Map Effectiveness in the Responsive Context of the Graphical User Interface. ISPRS Int. J. Geo-Inf. 2021, 10, 134. [Google Scholar] [CrossRef]

Publisher’s Note: MDPI stays neutral with regard to jurisdictional claims in published maps and institutional affiliations. |
© 2022 by the authors. Licensee MDPI, Basel, Switzerland. This article is an open access article distributed under the terms and conditions of the Creative Commons Attribution (CC BY) license (https://creativecommons.org/licenses/by/4.0/).
Share and Cite
Zápotocký, M.; Koreň, M. Multipurpose GIS Portal for Forest Management, Research, and Education. ISPRS Int. J. Geo-Inf. 2022, 11, 405. https://doi.org/10.3390/ijgi11070405
Zápotocký M, Koreň M. Multipurpose GIS Portal for Forest Management, Research, and Education. ISPRS International Journal of Geo-Information. 2022; 11(7):405. https://doi.org/10.3390/ijgi11070405
Chicago/Turabian StyleZápotocký, Martin, and Milan Koreň. 2022. "Multipurpose GIS Portal for Forest Management, Research, and Education" ISPRS International Journal of Geo-Information 11, no. 7: 405. https://doi.org/10.3390/ijgi11070405
APA StyleZápotocký, M., & Koreň, M. (2022). Multipurpose GIS Portal for Forest Management, Research, and Education. ISPRS International Journal of Geo-Information, 11(7), 405. https://doi.org/10.3390/ijgi11070405