Article

Exploring Spatial Features of Population Activities and Functional Facilities in Rail Transit Station Realm Based on Real-Time Positioning Data: A Case of Xi’an Metro Line 2

1
Graduate School of Environmental Engineering, University of Kitakyushu, Wakamatsu 808-0135, Japan
2
Department of Architecture, University of Kitakyushu, Wakamatsu 808-0135, Japan
3
School of Architecture, Chang’an University, Xi’an 710061, China
*
Author to whom correspondence should be addressed.
ISPRS Int. J. Geo-Inf. 2022, 11(9), 485; https://doi.org/10.3390/ijgi11090485
Submission received: 30 July 2022 / Revised: 27 August 2022 / Accepted: 9 September 2022 / Published: 14 September 2022
(This article belongs to the Special Issue Urban Geospatial Analytics Based on Crowdsourced Data)

Abstract

:
The rail transit station realm is an important urban spatial node that carries various behavioral activities and multiple functions. In order to accurately identify the spatial and temporal distribution of population activities and functional facilities in the rail transit station realm and understand the dynamic influence relationship between them, this paper takes four different types of stations of Xi’an Metro Line 2 as the research object, using real-time positioning data to represent population activities and points of interest (POIs) to represent functional facilities. An analytical framework combining the spatial point pattern identification technique and ordinary least squares (OLS) regression model is proposed. The results show that (1) there is spatial and temporal heterogeneity in the population activities in the rail transit station realm; the density distribution of population activities in different time periods shows the characteristic of clustering within 500 m of the station, regardless of working days or off days; (2) the distribution of shopping service POI, catering service POI, and living service POI in different station realms shows the feature of clustering around the stations; (3) the catering POI, living POI, shopping POI and transportation POI have positive attraction to population activities in different time periods; the constructed OLS model can basically explain the influence relationship between various functional facilities and population activities in all time periods. The conclusions can help city managers understand the spatial and temporal distribution and intrinsic mechanisms of population activities and functional facilities from a microscopic perspective and provide an effective decision-making basis for optimizing the allocation of functional resources in the station realm.

1. Introduction

The rapidly developing urban subway system has greatly improved the accessibility of the area around the station and attracted a large number of people and various services to gather in this area, thus forming an urban space with the station as the center and people’s daily activities influenced by the station to a certain extent [1,2]. This is the rail transit station influence realm (referred to as station realm in this paper). In Hong Kong, rail transit shares 43.9% of the daily public transportation trips of permanent residents, and nearly 50% of citizens live within a radius of 500 m from the station [3]. In Tokyo, where rail transit is developed, the rail transit travel share rate in Tokyo’s 23 districts exceeded 77% in 2018 [4]. In Northwest China, where the development of rail transit is relatively late, the share of rail transit in urban public transport in Xi’an will be over 50% in 2021 [5]. In addition, rail transit–oriented development models such as TOD [6], station-city integration [7], and station integrated development [8] are favored by urban planners and managers around the world, especially for developing countries facing traffic congestion problems caused by rapid urbanization. Thus, the urban rail station area has become an important region to play the function of gathering the city, to create public transportation to support and guide urban development, and to improve the quality of the urban environment [9,10]. Therefore, in order to develop a policy for sustainable spatial development of the station realm that meets public demands, urban managers and designers must improve their knowledge of the spatial pattern of the area. This is especially true when understanding the intrinsic influence relationships between functional facilities and population activities.
In general, the construction of major transportation infrastructure affects the distribution of urban elements and thus reshapes the spatial pattern of cities [11,12]. In previous studies, many scholars have revealed the spatial features of the rail transit station domain in terms of land use structure [13,14], industrial distribution [15,16], etc., but there is little literature addressing the detailed revelation of the spatial features of human activities in the station domain, especially considering the dynamic distribution changes of population activities in space under different time periods. Meanwhile, most studies have focused on the mechanisms of rail transit’s influence on land use [17,18], accessibility [19,20], and land price [21,22] around stations, while few studies have explored the relationship between urban functions and population activities, especially considering the dynamic influence mechanisms under different time periods of working days and off days. The public space around the rail station is a special space dominated by the activity trajectory of residents, and people are the main actors of activities in the public space [23]. Therefore, population activities are an important part of the space of the rail transit station realm. Consequently, to complement the above research status gap, we attempt to identify the spatial point pattern of population activities and urban functions in the station realm using more refined and real-time positioning big data on the ArcGIS platform and further develop regression models to explore the dynamic influence mechanism between population activities and urban functions.
In today’s rapidly developing information technology, big data has greatly enriched the methods and ways for researchers to obtain data. Compared with the traditional survey methods based on observation and experience, big data has the advantages of rich sources, large sample size, and real-time, which can reflect the characteristics of survey subjects more objectively [24]. Although many researchers have used multi-source data such as mobile phone signaling [25,26], the Metro Automatic Fare Collection System (Metro AFC) [27,28], social media [29,30,31], and Wi-Fi signaling technology [32] to explore user travel activities and distribution features, the above big data sources have some limitations in the use of the microscopic station space region. Mobile phone signaling technology is usually used to extract the Original and Destination (OD) data of residents’ traffic travel [33], but the distribution density of communication base stations is small (the coverage radius of urban areas is generally 100~500 m) [34]. Using the base station to send and receive data may cause spatial positioning errors, which in turn affects the accuracy of crowd identification. Metro AFC is a system that uses automatic ticket gates to record the exit and entry station and time of each passenger and uploads this data to a database with a specific frequency [35], the data can provide a large amount of passenger travel information, including passenger codes, entrance times, exit times, departure and destination stations, etc. However, the AFC data are only applicable to the statistics of the total passenger flow of the rail transit network, and the real-time passenger distribution in space is not available [36]. In addition, the use of social media platforms such as Facebook, Twitter, and Weibo to collect analytical data related to population activity trajectories is not sufficient to represent the activity characteristics of people of all ages, since most of the contributors are young people [37]. The Wi-Fi signaling technology needs to plan and deploy significant signal equipment to ensure full coverage of signals in the station area region in order to ensure the accuracy of data collection; however, this greatly increases the research cost [38]. In this study, we choose the mobile terminal program developed by WeChat, Easygo applet (which displays the thermal distribution of people flow in the currently selected area based on the map). These data have the following advantages [39,40]: (1) strong real-time performance. The data of WeChat comes from the GPS positioning information of the mobile intelligent terminals of the crowd. It has the characteristics of dynamic update and real-time feedback; (2) high accuracy: the extraction range of the data of Easygo is only a 25 m × 25 m grid, which is more suitable for research at the micro-scale; (3) high coverage: the positioning data of Easygo mainly comes from WeChat, a social software owned by Tencent, which covers a wider population in China and has strong utilization value; (4) easy availability: Easygo directly provides an API interface to make data easier to obtain directly. Therefore, the real-time positioning data of Easygo is suitable for this paper to identify the population distribution and changes in the station realm at the microscopic scale.
The study has two main objectives. The first one is to demonstrate the use of positioning big data to explore the distribution features of population activities and functional facilities within the study area at the microscopic scale. The second objective is to analyze the relationship between population activities and functional facilities over time using ordinary least squares (OLS) models. In summary, the main purpose of our study is to take the rail transit station realm as the research unit, use real-time positioning data from Easygo and POI data from AutoNavi Map, and visualize and analyze the spatial distribution of population activities and functional facilities within the station realm based on the spatial pattern tool of geographic information system (GIS). Then, an ordinary least squares (OLS) model is used to further explore the correlation between the spatial characteristics of population activity distribution and functional facilities and to analyze the dynamic influence relationship between them.
The main contributions of this paper are as follows:
  • Expansion of theoretical research. Focusing on the dynamic spatial distribution changes of population activities, we study in depth the inner mechanism of population activities and various functional facilities, which enriches the theoretical system of spatial pattern research in the station realm.
  • Innovation in research scale. By taking the station realm as an independent and complete spatial unit, we break the limitation of traditional urban spatial boundaries, and thus realize the spatial pattern features of population activities and functional facilities from a more microscopic perspective.
  • Innovation of technical means. We use real-time and more accurate positioning data (Easygo data), an analysis framework combining spatial point pattern identification technology, and an ordinary least squares (OLS) regression model. Based on identifying the spatial distribution features of population activities and functional facilities in the station realm, the dynamic influence relationship between the two is further reflected.
The rest of this paper is organized as follows. Section 2 presents the study area. Section 3 explains the basis for selecting research stations, the method for defining the station realm, the source of the study data, and the analysis method. Section 4 shows the results of the kernel density analysis and OLS regression analysis. Section 5 and Section 6 provide a discussion and summary of the analysis results.

2. Study Area

Xi’an is the capital city of Shaanxi Province and the political, economic, and cultural center of Northwest China, with a population of 12.95 million [
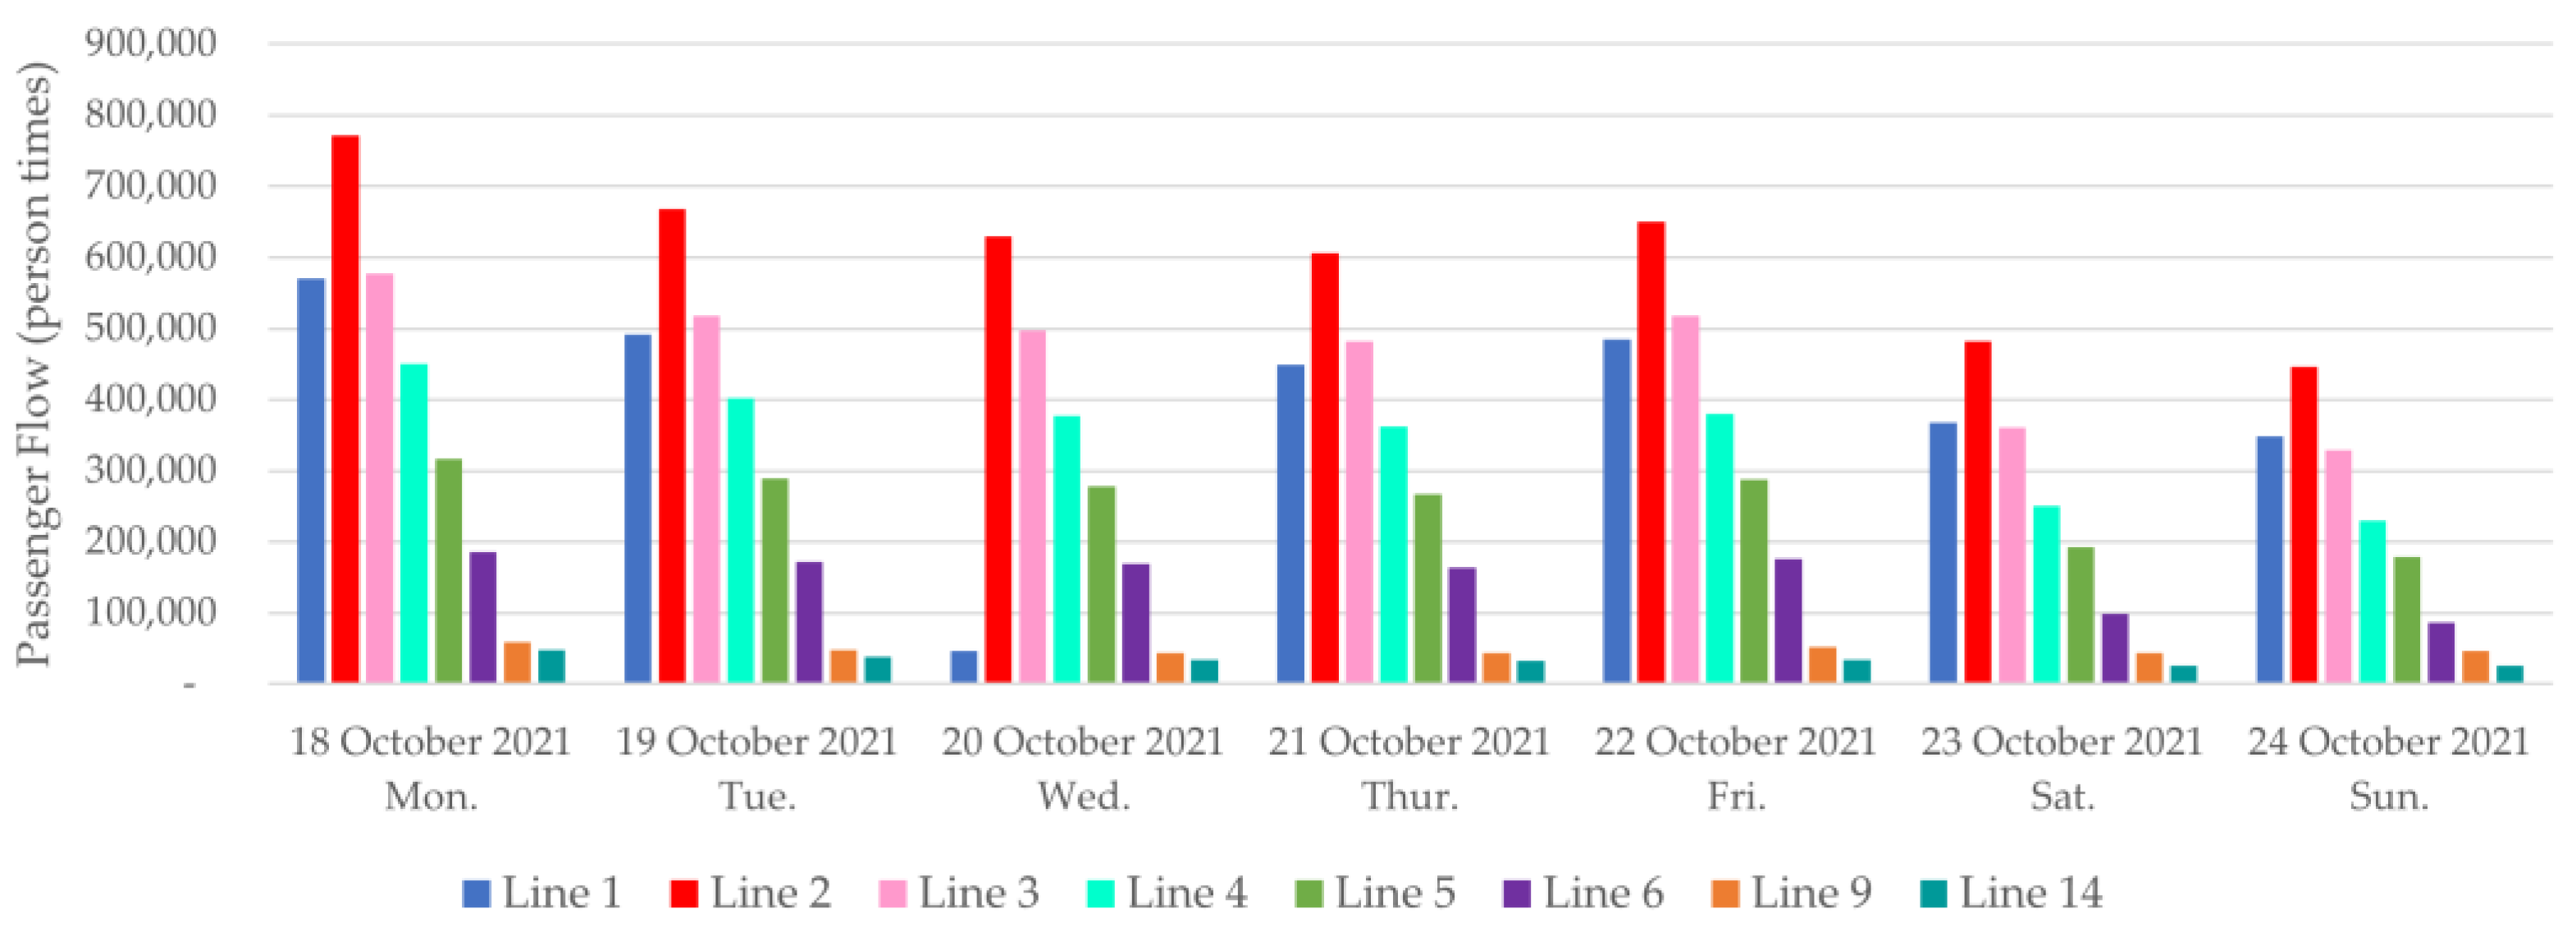
41]. At present, there are eight rail transit lines in operation in Xi’an. In 2011, the first Metro Line 2 was put into operation, with a total length of 26.7 km and a total of 21 stations [42]. It is not only the line with the highest average daily passenger flow in Xi’an (Figure 1), but also the core line that overlaps with the city’s central axis and connects multiple functional development areas in the north and south. Metro Line 2 is a very important case study, because it has a profound impact on the urban spatial structure along and around the station. Therefore, fully grasping its characteristics and laws has strong reference significance for the sustainable development of the future metro station surrounding areas in Shaanxi Province and even the entire Northwest China.
In this paper, each station of Line 2 is classified based on the method proposed by Duan Degang et al. [43] to classify station types by the land use composition around the station (Table 1). Under the premise of including all types and considering the geographical location in Xi’an where the stations are located (Figure 2), we selected a total of four typical stations, namely Xing Zheng Zhong Xin Station, Long Shou Yuan Station, Bei Da Jie Station, and Wei Yi Jie Station, as the research objects of this paper (Table 2).

3. Materials and Methods

As shown in Figure 3, a five-stage research methodology was used: (i) determination of station realm; (ii) data collection and processing; (iii) spatial point pattern identification; (iv) regression analysis; (v) feature induction. stage (i) defines the scope of the station realm, stage (ii) is the preparation of the data for analysis, and stages (iii) through (v) include the analysis of data and the summary of results. Specifically, the stage of spatial point pattern identification reveals the characteristics of population activities and urban function distribution in the station realm, and the spatial relationship analysis is the further explanation of the characteristics and phenomena.

3.1. Rail Transit Station Realm

The walking scale is usually the core element to define the scope of the rail transit station realm [44]. At present, the definition of the rail transit station area is mainly based on the area in which the station entrance can be reached within 10 to 15 min walking distance and that is closely related to the rail function [9,45]. However, in practice, since the scale standard is not a fixed value, the station area range value tends to vary from city to city. For example, the walking distance of the station realm in Canadian cities is mostly between 300 m and 900 m, while it is 400 to 800 m in the US [46,47]. Hyungun Sung delineated the Seoul rail transit station impact area with a reasonable walking range of 500 m [20]. In Shenzhen, China, some scholars proposed that the public habitual walking time is mostly concentrated in a 6~10 min interval walking range, or about 400~700 m, based on the survey [48]. In addition, some scholars believe that the rail transit station realm is not simply delineated by abstract geometric radius; it is also influenced by topographic space, road pattern, plot function, and other factors [49].
Therefore, taking the BDJ Station of the Xi’an Metro Line 2 as an example, we firstly use questionnaires and infrared velocimetry to conduct field surveys on the acceptable walking time (Figure 4a) and average walking speed (Figure 4b) of pedestrians around the BDJ Station, respectively. Secondly, the walking time of 10 min and average walking speed of 1.18 m/s are selected based on the relevant literature and actual demand, and the walking scale is calculated as 708 m. The walking scale is used as a radius to set up a buffer zone on ArcGIS and is adjusted according to the actual situation of urban roads and land integrity to finally obtain the station realm of BDJ (Figure 5). Other research station realm ranges in this paper are defined by the same method (Figure 6).

3.2. Data Source and Collection

3.2.1. Data Source

As mentioned above, this study considers the spatial distribution of pedestrians and urban functions simultaneously. The data mainly comes from WeChat’s Easygo applet and AutoNavi Map’s API. In addition, data such as pedestrian walking time and walking speed were collected through field surveys.
WeChat is an instant messaging software launched by China’s Tencent on 21 January 2011. It supports mobile operating systems such as Android and IOS. As of 30 June 2021, the software’s monthly active users (MUA) exceeded 1.2 billion, making it the most active social software in China [50]. In addition, WeChat accounts for about 69.2% of China’s communication software [51]; excluding children, elementary school students, and the elderly, who rarely use mobile phones, the data can fully cover various activities of the population of all ages. Easygo is a WeChat built-in applet. By recording the real-time location information of WeChat users, it gives the real-time pedestrian location in the form of spatial point data, which has the characteristics of low acquisition cost, high spatial resolution, and real-time dynamic change. Therefore, the above points are the reasons why the data of Easygo can reflect the spatial distribution features of pedestrians in this study.
POI (Point of interest) data mainly include spatial information and attribute information data of geographic entities closely related to people’s lives. It can quickly and intuitively obtain the distribution of various functions in urban space, which is superior to traditional research data [52]. In addition, different from the previous studies on the relationship between rail stations and surrounding urban land through the nature of land use, POI data is more microscopic and has more advantages in data accuracy, which can more intuitively reflect the spatial agglomeration characteristics of urban functions [53]. In this study, POI mainly reflects the spatial distribution of urban functions in the station realm and conducts correlation analysis with the spatial activity characteristics of pedestrians.
In summary, for the scope of this study, Easygo‘s point data represent population activities; AutoNavi Map’s points of interest represent urban functional facilities.

3.2.2. Data Collection

The data for population activities and POIs in this paper are sourced from the Tencent Location Big Data Service window (https://heat.qq.com/index.php, accessed on 15 November 2021) and the AutoNavi Map’s Public Application Programming Interface (API) (https://lbs.amap.com, accessed on 30 December 2021). These applications can collect all the data in the delimited area and export them to csv files. In order to protect the privacy of WeChat users, we only extract the geographic location and time information of users when collecting data on Easygo and do not collect data containing personally identifiable information such as name, age, and gender. Similarly, we only extract the type of service facilities and geographic location in extracting the points of interest of AutoNavi map. The details are shown in Table 3.
Existing studies have shown that the daily activities of the inner-city population usually vary cyclically on a weekly basis and that there are some differences in the distribution of the population between working days and off days [39,54]. In this study, the Easygo data were collected for 7 consecutive days from 15 November to 21 November 2021 (20 and 21 were off days and 15 to 19 were working days) using the boundary of each research station realm as the data collection scope (Figure 7); the collection time was from 7:00 a.m. to 22:00 p.m. (according to the Xi’an metro operation time), and a total of 193,592 raw data in CSV format, including activity date, activity number, longitude and latitude, were collected. In order to accurately identify the spatial distribution features, after preliminary experimental validation, we selected the 17th (Wednesday) and 20th (Saturday) to represent the population activities on working days and off days.
The POI data were also collected within the boundaries of each research station realm; the collection time was 30 December 2021, with a total of 12,283 pieces of data collected. In this paper, the classification of the collected POI data refers to the relevant literature [53,55]; 10 categories closely related to daily life are selected according to the primary classification code as shown in Appendix A. The quantity statistics of POI data are shown in Figure 8. To make the research results more convincing, we remove the POIs of public service facilities, because the amount of data is too small in each study station realm, and public facilities such as restrooms, telephone booths, and newsstands would not be overly attractive to pedestrians under normal circumstances.
All the above data were converted from raw data to point data based on latitude and longitude information using the ArcGIS platform and were summarized and integrated according to the names of the stations in order to prepare for the next stage.

3.3. Data Analytical Methods

In order to visualize the location, shape and size of the spatial clustering of the study objects, we used kernel density to identify the spatial point pattern of human activities and urban functions, and explored the basic features and patterns of spatial distribution of each research station realm. In addition, we further analyzed the changing relationship between population activities and urban functions in the station realm space by ordinary least squares (OLS).

3.3.1. Kernel Density Analysis

Kernel Density Analysis can reflect the distribution of the whole area by showing the aggregation of points by density based on the values of the input point elements and their distribution and produce a continuous raster graph (heat map) [56]. In this study, kernel density analysis is used to explore the state of spatial distribution of human activities and functional facilities in each station realm. Kernel density analysis has been widely used in the field of urban space–related research [57,58,59]. The calculation equation is as follows:
D e n s i t y = 1 ( r a d i u s ) 2 i = 1 n [ 3 π · p o p i ( 1 ( d i s t i r a d i u s ) 2 ) 2 ] For   dist i < radius
where i = 1, …, n are the input points. Only points in the sum are included if they lie within the radius distance of the (x,y) position. Disti is the distance between point I and the (x,y) position.

3.3.2. Ordinary Least Squares

Ordinary least squares (OLS) is the most commonly used regression method to assess the relationships between urban spatial elements [60,61]. In this paper we focus on the coefficient of each explanatory variable, which reflects the strength and type of relationship between the explanatory and dependent variables. When the sign associated with the coefficient is positive, the coefficient is positively related to the dependent variable, and conversely, it is negatively related. In addition, probabilities (p-values) can help us find which variables are statistically significant (p < 0.01) and thus deserve further analysis. The model of OLS can be described as Equation (2):
y = β 0 + β 1 x 1 + β 2 x 2 + β n x n + ε
where y is the dependent variable, x n is the explanatory variable, β n is the regression coefficient, and ε is the random error. In this study, the number of active people in the study station realm is the dependent variable, and the number of POIs in each functional facility is the explanatory variable. Table 4 shows the explanatory variables and their descriptive statistics.

4. Results

4.1. The Spatial Distribution of Population Activities

The size of the search radius in the kernel density analysis has a significant effect on the refinement of the analysis results. According to the related literature [62], we took the average side length of 200 m of the natural blocks composed of roads in each study station realm as the threshold value and took the radius of 50 m, 100 m, 150 m, 200 m and above, respectively, for the detection analysis. The results show that there are too many first-level hotspots within 100 m (Figure 9a) and too many integrated above 200 m (Figure 9e), while the hotspot levels between 100 and 200 m are basically stable (Figure 9b–d), which only affects the smaller levels of hotspots. Therefore, this paper takes the middle number of 150 m as the search radius.
The visualization of the kernel density results of the population activities in each research station realm is shown in Figure 10. The results show that the location, shape, and size of the population activity aggregation area during the day change spatially along with time, which indicates that the population activity in the station realm is spatially non-stationary. In terms of the overall spatial distribution, we measured the distance between the peak areas of the nuclear density of population activity (dark areas) and the stations in each research station realm using the metric tool of ArcGIS, and we found that these peak areas were mainly distributed within 500 m of the station perimeter (Figure 11), which indicates a high level of population activity within this range. In terms of spatial position, the population activities in the XZZX station realm are mainly concentrated in the large shopping mall on the south side; the population activities in the LSY station realm are mainly distributed in the neighborhoods and commercial complexes around the station; the population activities in the BDJ station realm are mainly concentrated in a number of large medical institutions on the east side of the station and the large shopping mall on the south side; there are several universities and urban villages in the WYJ station realm, so the population activities are mainly concentrated in these areas.
In terms of temporal distribution features, the peak kernel density of population activities in the four study station realms for each period on working days and off days is shown in Figure 12. During working days, population activity is basically dominated by commuting characteristics, with the morning peak period generally lasting from 7:00 a.m. to 9:00 a.m., and the evening peak mainly concentrated between 6:00 p.m. and 8:00 p.m. On off days, the peak time for population activity is generally at or after 11:00 a.m. This indicates that on off days people choose to be out later compared to working days due to the absence of demands such as work and school. In addition, the mean value of the kernel density of population activity is higher on off days than on working days after 11:00 a.m., which could indicate that the population is more active on off days than on working days during that period.
It is worth mentioning that the population activity in the LSY Station realm shows a continuous increase between 6:00 and 10:00 p.m., and the kernel density of population activity reaches its highest value at 10:00 p.m. The field survey reveals that a large number of night markets appear around the station during this period, which attracts the population to gather here.

4.2. The Spatial Distribution of Functional Facilities

The results of the kernel density analysis for each type of POI in the four research station realms are shown in Figure 13.
As shown in Figure 13a, the POIs of various functions in the Xing Zheng Zhong Xin station realm show a spatial distribution feature of high in the south and low in the north. The POIs of various functional facilities in the Long Shou Yuan station realm are generally distributed around the station (Figure 13b), especially the six types of facilities, namely shopping POIs, catering POIs, living POIs, transportation POIs, government agency POIs, and accommodation POIs, which have the characteristic of higher density the closer they are to the station. As shown in Figure 13c, the distribution features of each functional facility in the Bei Da Jie station realm differ significantly. Five types of facilities, namely shopping POI, catering POI, living POI, accommodation POI, and financial POI, are more densely distributed in the south of the station realm than in the north. In addition, the density distribution of medical and health POIs is much higher in the east-central part of the station realm than in other regions. The results of the kernel density analysis of the station realm of Wei Yi Jie (Figure 13d) show that we find that the POIs of each functional facility are distributed along both sides of Chang’an South Road (north–south direction) and Chang Ming Road (east–west direction).
In general, shopping service POIs, catering service POIs, and living service POIs show spatial distribution features around the stations in each research station realm. However, the different land composition within diverse types of station realms makes the density distribution features of functional facilities vary significantly, such as entertainment POIs, government agency POIs, and medical and health POIs. However, through comparative analysis, we found that population activities and functional facilities have geographically similar peak kernel density coverage areas in the station realm, which indicates that areas with a high-density distribution of functional facilities within the station realm are more attractive for people to move around in.

4.3. Spatiotemporally Varying Impact of Functional Facilities on Population Activities

In order to more accurately assess the dynamic influence relationship between functional facilities and population activities, based on the boundaries of each study station realm, a grid with an image element scale of 25 × 25 m was created on the ArcGIS platform as the spatial statistical unit for the regression analysis in this paper (which is consistent with the collection scale of our population activity data). Then, the dependent variable (population activity) and the explanatory variable (functional facility) were connected to this grid for OLS regression analysis. However, variance inflation factors (VIFs) also needed to be calculated to avoid multicollinearity among the explanatory variables of the model and to exclude variables with VIF values greater than 10 [63]. As shown in Table 5, the VIF values of each explanatory variable in the four research station realms are less than 10, indicating that there is no cointegration among the explanatory variables and that they are suitable to form a regression model.
As shown in Table 6, the explanatory variables in the Xing Zheng Zhong Xin station realm (hybrid type)—medical and health POIs (V4), catering POIs (V6), living POIs (V7), shopping POIs (V8), and transportation POIs (V9)—have a positive relationship with population activity during almost all hours of the working days and off days. This indicates that the higher number of these functional facilities is also more attractive for population activities. In particular, the catering POIs and living POIs have a significant positive correlation. The entertainment POI (V1) has a negative relationship with population activity most of the time, indicating that an increase in the number of such functional facilities does not attract more activity. In addition, the financial service POI (V2) and government agency POI (V3) have a positive relationship with population activities on working days, while the off days have more of a negative relationship.
The OLS regression results for the Long Shou Yuan station realm (residential type) are shown in Table 7. Among them, the financial POIs (V2), accommodation POIs (V5), and catering POIs (V6) show a significant positive relationship on both working days and off days, indicating that these three types of facilities are highly attractive to population activities most of the time. The medical and health POIs (V4) have a negative effect on population activity most of the time. In addition, the entertainment POIs (V1) have a positive relationship on working days most of the time compared to off days, indicating that the entertainment POIs (V1) are more attractive to population activity on working days than off days.
As shown in Table 8, the medical and health POIs (V4), catering POIs (V6), shopping POIs (V8), and transportation POIs (V9) in the Bei Da Jie station realm (commercial service type) have a positive relationship with population activity during most of the working days and off days. In particular, the medical and health POIs (V4) have a significant positive impact on all time periods, due to the presence of several large or comprehensive public hospitals within the Bei Da Jie station realm, and the high accessibility of the metro makes it even more convenient for residents from other areas to come here for medical care; this indicates that quality medical resources can be more attractive to population activity. The financial POIs (V2) and the government institution POIs (V3) have a positive relationship with population activity only during specific times of the working day. It is worth mentioning that the accommodation services POIs (V5) have a positive relationship with population activity during off days, while it is mostly negative during working days. Combined with the results of the kernel density analysis of population activity, it can be found that the Bei Da Jie station realm may be visited by more outsiders on off days, thus enhancing the attractiveness of the accommodation service POIs for population activity.
As shown in Table 9, most of functional facilities in the Wei Yi Jie station realm (public service type) have a positive relationship with population activity, except for the entertainment POIs (V1) and government institution POIs (V3). In addition, through the field survey, we found that there are several higher education schools and educational training institutions in the Wei Yi Jie Station realm, leading to the existence of many inexpensive rental rooms, restaurants, school supply stores, courier stations, and other facilities that are closely related to campus life within the area. Therefore, accommodation POIs (V5), catering POIs (V6) and living service POIs (V7) have a strong attraction to population activities most of the time.
In terms of overall spatial relationships, the “Accommodation POIs (V5)”, “Catering POIs (V6)”, “Living POIs (V7)”, “Shopping POIs (V8)”, and “Transportation POIs (V9)” in each research station realm have positive relationships with population activity most of the time. In particular, the catering service POIs have a strong positive attraction to population activities, the reason for which can be traced back to the long-standing Xi’an food culture, where restaurants have become one of the most important places for social activities for citizens. On the other hand, the transportation facility POIs generally have a significant positive relationship with population activity from 12:00 p.m. to 6:00 p.m., indicating that people have high utilization of public transportation during this time.
In addition, from a temporal perspective, the entertainment services POIs (V1) usually have a positive relationship with the population activity only in the evening. The financial services POIs (V2) generally have a positive impact on working days (excluding BDJ Station). Since the financial institutions are usually closed on off days, they have a negative impact for most of the day. Government agency POIs (V3) are generally only open to their staff, so there is a significant negative correlation for population activity within each research station realm for most of the time, whether it is a working day or an off day.
It is worth mentioning that medical and health facilities (V4) have a positive correlation with population activity most of the time, except for LSY Station. Several provincial or municipal public hospitals (e.g., Xi’an Central Hospital, the Second Affiliated Hospital of Xi’an Jiaotong University, etc.) are concentrated within the BDJ station realm, and the medical and health facilities (V4) have a significant positive attraction for population activities almost all day long. On the contrary, although there are several private clinics and community medical service centers in the LSY station realm, the POI of medical and health facilities has a negative correlation with population activity most of the time due to the lack of large public hospitals.

5. Discussion

This study investigated the spatial features of the four study station realms of Xi’an Metro Line 2 based on positioning data from Easygo applet and POI data from AutoNavi Map and further analyzed the dynamic influence relationships of functional facilities with population activities in the station realm under different time periods through OLS models.
The results of the spatial point pattern identification show the following:
  • There is a clustering of population activities within the metro station realm, especially in the areas within 500 m of the station. Consistent findings were revealed by several studies in different cities [64,65,66]. In addition, the peak periods of population activity in the station realm are between 7:00 and 9:00 a.m. and between 6:00 and 8:00 p.m. on working days. On the off days, the population activity is more active during the time period from 11:00 a.m. to 5:00 p.m. In Xi’an, although the proportion of public transportation trips is increasing year by year, with the metro ratio exceeding 50% in 2021 [5], urban traffic congestion is still a serious problem. Therefore, identifying changes in the active time of population activities helps city managers accurately and effectively optimize the operation time and structure of public transportation, thus alleviating problems such as traffic congestion in the city.
  • In this paper, we found that the three types of functional facilities, namely shopping services, catering services, and living services, in each study station realm exhibit the feature that their density distribution is higher when they are closer to the station. The density distribution features of other functional facilities in different types of station realms vary greatly. In fact, the development of rail transit in China started late compared to developed countries, and stations are often built in already developed urban environments [67], which also leads to the spatial development of station realms being restricted by public policies, transportation supply, station location, land use structure, etc. [68,69], making it difficult to form a high-density, mixed functional structures around stations as advocated by TOD and station-city integration models. In this paper, we summarize the spatial distribution features of various functional facilities in different types of station realms. However, the realization of diverse urban functions clustered around the station with the support of national policies and high-quality urban renewal, thus promoting comprehensive, composite, and efficient development of the station realm, remains a complex issue. The relationship between rail transit and urban functional facilities needs further research.
  • It is worth mentioning that although POI data cannot record “informal activity” facilities that are mobile and self-organized, using real-time location data and field surveys, we found the presence of night markets in some station realms, which cause population clustering at night. The existing literature shows that night markets have an impact on the economic development and quality of life of residents in a region [70]. On the one hand, night markets can provide a means of subsistence for some of the unemployed [71] and can also serve as a vehicle for a region’s unique culture and customs [72], contributing to economic development. On the other hand, the excessive lighting, noise, and waste generated by night market activities can have a negative impact on the health of suppliers as well as local residents [73,74]. Therefore, the development of a night market economy in station realms with a base of night market activities can be effective in enhancing the vitality of the area, but the resulting public safety issues should be of concern to city managers and urban researchers.
The results of the regression analysis showed the following:
  • The POI variables, such as catering, living, shopping, and transportation, showed a high positive attraction for population activities within the station realm. This indicates that these types of services and facilities will be more likely to attract activities in this area, which is also consistent with the results of the current related studies [37,75]. In particular, catering service POIs and population activity have a significant positive correlation in all four research station realms, which indicates that catering strongly attracts population activity. For city managers, focusing on developing the local food culture can effectively improve the vitality of station realms. In addition, the study found that medical and health care POIs have a more significant positive correlation with population activity in station realms with a relatively high concentration of general or public hospitals. Especially under the influence of the COVID-19 pandemic, the demand for medical resource capacity and medical service facilities has greatly increased, making the allocation of quality medical and health resources more attractive for population activity. This finding helps city managers to better optimize the allocation of public health care resources in station realms.
  • From a dynamic perspective, there are different coefficients of variation on weekdays and off days for all POI categories in different types of station realms. For example, the financial services POIs, government POIs, and accommodation services POIs in the Xing Zheng Zhong Xin station realm have a positive relationship with population activity only on working days. In the Bei Da Jie station realm, the accommodation service POI is more attractive to demographic activities on off days than on working days. In addition, transportation facilities are significantly more positively related to population activity on working days than on off days. This suggests that on working days people are more likely to take public transportation to work, school, and other daily activities, while on off days people may be more likely to rest at home or choose to travel by private car. In conclusion, the analytical framework developed in this paper basically describes the relationship between various types of POI facilities and population activities, and these research results can help city managers understand the needs of people’s daily activities in different types of station realms from a dynamic perspective, so as to improve the allocation of urban public resources more effectively.
In terms of data, unlike exploring population distribution features by using big data such as mobile phone signaling, social media, and Wi-Fi signaling technologies [25,26,27,28,29,30,31,32], this paper uses the higher precision and better timeliness of Easygo positioning data, which provides a reliable data source for researchers to identify the dynamic distribution features of population activities from a microscopic perspective. Existing studies have shown the importance of POI data for studying the spatial and temporal distribution features and mechanisms of urban population density [76]. Therefore, the real-time positioning data of Easygo and the POI data of AutoNavi Map used in this paper help to enable researchers to obtain more convincing analysis results.
However, there are still some limitations in this study, which may be a feasible direction for improvement. First, due to the lack of staff and time constraints, only four stations in Xi’an Metro Line 2 were selected for this study to conduct specific investigation and analysis. If all stations of Metro Line 2 could be investigated and studied, the spatial features of rail transit station realms would be more completely understood. In addition, the survey data in the study are not comprehensive enough to obtain data on the land use status and population flow before the completion of Metro Line 2. If the spatial features of the station realm before and after the completion of the metro can be compared and analyzed in the future, the practical application value of the research results will be further enhanced to support the development of metro station realms.

6. Conclusions

Public rail transportation is essential in people’s daily travel. With the rapid development of the city metro and the increase in the frequency of people’s use of stations, various urban functions that provide convenience to people’s lives are gradually concentrated in the stations and the surrounding areas where passengers gather. In this context, a full understanding of the spatial features of the existing metro station realm and the influence mechanism between the two is crucial for the future urban renewal of the area as well as the planning of others. This study achieves quantitative research on the spatial distribution of population activities and urban functional facilities by combining real-time positioning data and POI data to help identify the spatial features of the station realm. By building OLS models, we further found that “catering”, “living”, “shopping”, and “transportation” have positive relationships with population activities in metro station realms most of the time, while financial institutions and government agencies have positive relationships at specific times. Medical and health facilities in particular have stronger associations in station realms where general or public hospitals are concentrated. In addition, the regression results basically explain the phenomenon and causes of crowd gathering in time and space, which helps to better understand the characteristics and patterns of the spatial distribution of station realms and make the formulation of related strategies more effective.
Overall, research on location-based big data resources such as WeChat’s Easygo applet and AutoNavi Map’s POI enables researchers to clearly identify the spatiotemporal distribution status of population activities and functional facilities at the micro level and understand people’s demand for urban functions from a dynamic perspective.

Author Contributions

Di Wang and Bart Dewancker conceived and designed the experiments; Di Wang acquired and analyzed the data; Yaqiong Duan and Meng Zhao contributed analysis tools; Di Wang and Bart Dewancker wrote the paper. All authors have read and agreed to the published version of the manuscript.

Funding

This research was funded by the Natural Science in Shannxi Province of China (Program No. 2021JQ-285) and the Fundamental Research Funds for the Central Universities, CHD (Grant No. 3300102411106), China.

Institutional Review Board Statement

The study did not require ethical approval, so chose to exclude this statement.

Informed Consent Statement

Not applicable.

Data Availability Statement

Not applicable.

Acknowledgments

We are grateful to the three reviewers for their valuable comments. We also thank the academic and English editors for their valuable comments on this paper.

Conflicts of Interest

The authors declare no conflict of interest.

Appendix A

Table A1. Definition and classification of POI data.
Serial NumberPrimary ClassificationSecondary ClassificationTertiary Classification
1EntertainmentCultureMuseums, science and technology museums, libraries, etc.
Leisure and RecreationParks, playgrounds, KTV, etc.
Sports and FitnessSwimming pools, badminton courts, gymnasiums, etc.
2Financial ServiceBankBank management, banks, credit unions, etc.
InsuranceInsurance management, insurance, etc.
SecuritiesSecurities management, investment, guarantee, etc.
3Government AgencyGovernmentProvincial, city (local), district governments, etc.
Public, Prosecution, LawPublic security, public prosecutor’s office, court
TaxationState tax, local tax
Social groupsPublic groups at all levels
4Medical and Health CareMedical institutionsHospitals, medical centers, clinics
Epidemic Prevention and ControlEpidemic prevention, medical examination
Health Care RehabilitationHealth care, rehabilitation
PharmacyPharmacies, medical equipment stores
5Accommodation ServiceHotelExpress hotels, hotels, hostels, guest houses
6Catering ServiceChinese restaurantsLocal flavor restaurants, hot pot restaurants, etc.
Foreign restaurantsWestern restaurants, foreign cuisine restaurants
Fast food restaurantsKFC, McDonalds, Pizza Hut, etc.
TeahouseTeahouses
Beverage storesCoffee shops, cold drink stores, dessert stores, etc.
7Living ServiceSupply service officeVarious types of bill payment points, electricity maintenance, gas maintenance, etc.
Daily life serviceHousekeeping, dry cleaners, wedding services, hairdressing, etc.
Ticket officeTrain ticket office, bus ticket office, etc.
8ShoppingStoreSupermarkets, shopping malls
Electrical appliances, digital product stores
Tobacco, wine, tea, souvenir, and clothing stores
Flowers, petsFlower or pet stores
Furniture, building materialsFurniture stores, building materials markets
Wholesale marketWholesale markets
9Transportation ServicePublic Transportation StopsBus stops, cab stands, public bicycle storage points, etc.
Transportation parking facilitiesVarious types of parking lots
Car ServiceGas stations, car rentals, traffic vehicle management, etc.
10Public ServicePublic facilitiesNewsstands, telephone booths, public restrooms, etc.
The “secondary” and “tertiary” classifications in the table are not fully listed.

References

  1. Hu, M. The impact of rail transit on urban spatial layout. Mod. Urban Res. 2007, 11, 34–39. [Google Scholar]
  2. Chu, D.; Wei, S. From Polysemous Affect to City Integration: The Definition Thinking and Frontier Method to Radiation Realm of City Rail Transit Station. In Smart Growth and Sustainable Development; Springer: Cham, Switzerland, 2017; Volume 122, pp. 35–53. [Google Scholar] [CrossRef]
  3. Yin, Z. From “R+P” to a rail compact city—The story behind Hong Kong’s railroad statistics. Architect 2018, 195, 55–60. [Google Scholar]
  4. The 6th Tokyo Urban Area Person Trip Survey. Available online: https://www.tokyo-pt.jp/special_6th (accessed on 7 April 2021).
  5. Official Account of China News. Available online: https://baijiahao.baidu.com/s?id=1694018781800096450&wfr=spider&for=pc (accessed on 25 March 2021).
  6. Calthorpe Associates. Transit-Oriented Development Design Guidelines; Calthorpe Associates: San Diego, CA, USA, 1990; p. 5. [Google Scholar]
  7. Maeda, A. Aiming for the Creation of New Space: Development of Tokyo Station City. JR East Tech. Rev. 2007, 10, 4–7. [Google Scholar]
  8. Yu, X.; Zheng, J.; Zhong, P. Site Integrated Development (SID) Case Study—Visit to Lyon High Speed Rail Hub. Traffic Transp. 2012, 28, 40–42. [Google Scholar]
  9. Guidelines for Planning and Designing of Areas around Urban Rail Transit. Available online: http://std.samr.gov.cn/gb/search/gbDetailed?id=71F772D7E4FBD3A7E05397BE0A0AB82A (accessed on 12 April 2021).
  10. Design Guidelines for the Integration of Xi’an Rail Transit and the City. Available online: http://www.xa.gov.cn/xw/rdgz/jt/list/47.html (accessed on 12 April 2021).
  11. Bhattacharjee, S.; Goetz, A.R. The rail transit system and land use change in the Denver metro region. J. Transp. Geogr. 2016, 54, 440–450. [Google Scholar] [CrossRef]
  12. Zhang, Y.; Luo, Y.; Zhu, X.; Yang, P.; Gu, Z. The Jobs-Housing Spatial Change in the Catchment Areas of Rail Transit Stations: A Case Study of Shenzhen City. Urban Plan. Forum 2020, 3, 48–56. [Google Scholar] [CrossRef]
  13. Liu, S.; Guo, J.; Li, R.; Li, Q. Analysis of land use characteristics around typical stations of rail transit in Beijing. Urban Dev. Res. 2014, 21, 66–71. [Google Scholar]
  14. Niu, S.; Hu, A.; Shen, Z.; Siu, S.; Lau, Y.; Gan, X. Study on land use characteristics of rail transit TOD sites in new towns—Taking Singapore as an example. J. Asian Archit. Build. Eng. 2019, 18, 16–27. [Google Scholar] [CrossRef]
  15. Wu, Y. Research on the Spatial Pattern of Producer Services in Xi’an Rail Transit Stations. Master’s Thesis, Xi’an University of Architecture and Technology, Xi’an, China, 2017. [Google Scholar]
  16. Yuan, M. Analysis of commercial space distribution characteristics and influencing factors of rail transit station region in core urban areas of Shanghai. Urban Rail Transit Res. 2018, 21, 1–4. [Google Scholar] [CrossRef]
  17. Pan, H.; Zhang, M. Rail transit impacts on land use: Evidence from Shanghai, China. Transp. Res. Rec. 2008, 2048, 16–25. [Google Scholar] [CrossRef]
  18. Calvo, F.; de Oña, J.; Arán, F. Impact of the Madrid subway on population settlement and land use. Land Use Policy 2013, 31, 627–639. [Google Scholar] [CrossRef]
  19. Lewis-Workman, S.; Brod, D. Measuring the neighborhood benefits of rail transit accessibility. Transp. Res. Rec. 1997, 1576, 147–153. [Google Scholar] [CrossRef]
  20. Sung, H.; Choi, K.; Lee, S.; Cheon, S. Exploring the impacts of land use by service coverage and station-level accessibility on rail transit ridership. J. Transp. Geogr. 2014, 36, 134–140. [Google Scholar] [CrossRef]
  21. Gadziński, J.; Radzimski, A. The first rapid tram line in Poland: How has it affected travel behaviors, housing choices and satisfaction, and apartment prices? J. Transp. Geogr. 2016, 54, 451–463. [Google Scholar] [CrossRef]
  22. Chen, X.; Chen, J. Analysis of spatial layout and property development linkage of Wuhan Metro Line 4 stations. Huazhong Archit. 2019, 37, 90–93. [Google Scholar]
  23. Zhuo, X. Study on Vitality of Public Space in the Vicinity of Rail Transit Stations Based on Space Syntax—Take Xuzhou Rail Transit Line 1 as an Example. Master’s Thesis, China University of Mining and Technology, Jiangsu, China, 2018. [Google Scholar]
  24. Shaw, S.-L.; Tsou, M.-H.; Ye, X. Editorial: Human dynamics in the mobile and big data era. Int. J. Geogr. Inf. Sci. 2016, 30, 1687–1693. [Google Scholar] [CrossRef]
  25. Huang, Q.; Yang, Y.; Xu, Y.; Yang, F.; Yuan, Z.; Sun, Y. Citywide road-network traffic monitoring using large-scale mobile signaling data. Neurocomputing 2021, 444, 136–146. [Google Scholar] [CrossRef]
  26. Zhao, P.; Luo, J.; Hu, H. Spatial match between residents’ daily life circle and public service facilities using big data analytics: A case of Beijing. Prog. Geogr. 2021, 40, 541–553. [Google Scholar] [CrossRef]
  27. Wang, Z.; Hu, Y.; Zhu, P.; Qin, Y.; Jia, L. Ring aggregation pattern of metro passenger trips: A study using smart card data. Phys. A Stat. Mech. Its Appl. 2018, 491, 471–479. [Google Scholar] [CrossRef]
  28. Xu, X.; Xie, L.; Li, H.; Qin, L. Learning the route choice behavior of subway passengers from AFC data. Expert Syst. Appl. 2018, 95, 324–332. [Google Scholar] [CrossRef]
  29. Kovács, Z.; Vida, G.; Elekes, Á.; Kovalcsik, T. Combining Social Media and Mobile Positioning Data in the Analysis of Tourist Flows: A Case Study from Szeged, Hungary. Sustainability 2021, 13, 2926. [Google Scholar] [CrossRef]
  30. Condeço Melhorado, A.; Mohino, I.; Moya-Gómez, B.; García-Palomares, J.C. The Rio Olympic Games: A Look into City Dynamics through the Lens of Twitter Data. Sustainability 2020, 12, 7003. [Google Scholar] [CrossRef]
  31. Zhu, W.; Ma, D.; Zhao, Z.; Guo, R. Investigating the Complexity of Spatial Interactions between Different Administrative Units in China Using Flickr Data. Sustainability 2020, 12, 9778. [Google Scholar] [CrossRef]
  32. Zola, E.; Barcelo-Arroyo, F. A comparative analysis of the user behavior in academic Wi-Fi networks. In Proceedings of the 6th ACM Workshop on Performance Monitoring and Measurement of Heterogeneous Wireless and Wired Networks, Miami, FL, USA, 31 October 2011; Association for Computing Machinery: New York, NY, USA, 2011; pp. 59–66. [Google Scholar] [CrossRef]
  33. White, J.; Wells, I. Extracting origin destination information from mobile phone data. In Proceedings of the Eleventh International Conference on Road Transport Information and Control, London, UK, 19–21 March 2002; pp. 30–34. [Google Scholar] [CrossRef]
  34. Li, Z.F.; Yu, L.; Gao, Y.; Wu, Y.; Gong, D.; Song, G. Extraction method of temporal and spatial characteristics of residents’ trips based on cellular signaling data. Transp. Res. 2016, 2, 51–57. [Google Scholar]
  35. Jia, F.; Li, H.; Jiang, X.; Xu, X. Deep learning-based hybrid model for short-term subway passenger flow prediction using automatic fare collection data. IET Intell. Transp. Syst. 2019, 13, 1708–1716. [Google Scholar] [CrossRef]
  36. Xu, R.; Xu, Y.S. A real-time prediction method for passenger flow distribution of urban rail lines. J. Tongji Univ. Nat. Sci. Ed. 2011, 39, 857–861. [Google Scholar]
  37. Zhang, X.; Sun, Y.; Chan, T.O.; Huang, Y.; Zheng, A.; Liu, Z. Exploring Impact of Surrounding Service Facilities on Urban Vibrancy Using Tencent Location-Aware Data: A Case of Guangzhou. Sustainability 2021, 13, 444. [Google Scholar] [CrossRef]
  38. Li, L.; Liu, M.; Li, Q.; Cheng, H.; Jin, C. A new support of human activity research: Characteristics, research status, and application prospects of Wi-Fi data. Prog. Geogr. 2021, 40, 1970–1982. [Google Scholar] [CrossRef]
  39. Duan, Y.M.; Liu, Y.; Liu, X.H.; Dong, H.E. Measuring polycentric urban structure using Easygo big data: A case study of Chongqing metropolitan area. Prog. Geogr. 2019, 38, 1957–1967. [Google Scholar] [CrossRef]
  40. Shen, L.; Wang, Y.; Zhang, C.; Jiang, D.; Li, H. Study on the relationship between the built environment and rail commuting in reasonable walkable range of rail stations—Example of 44 rail stations in Beijing. J. Geogr. 2018, 73, 2423–2439. [Google Scholar] [CrossRef]
  41. Shaanxi Provincial Bureau of Statistics. 2021. Available online: http://tjj.shaanxi.gov.cn/tjsj/ndsj/tjgb/qs_444/202105/t20210528_2177393.html (accessed on 1 June 2021).
  42. Xi’an Metro. Available online: https://en.wikipedia.org/wiki/Xi%27an_Metro (accessed on 22 October 2021).
  43. Duan, D.; Zhang, F. Study on classification of urban rail transit stations from the perspective of land use optimization: A case study on Xi’an subway line 2. City Plan. Rev. 2013, 37, 39–45. [Google Scholar]
  44. Quan, L. Factors Affecting Circle Structure of TOD Concentric Models. Urban Plan. Int. 2017, 5, 72–79. [Google Scholar] [CrossRef]
  45. Calthorpe, P. The Next American Metropolis: Ecology, Community, and the American Dream; Princeton Architectural Press: New York, NY, USA, 1993. [Google Scholar]
  46. O’Sullivan, S.; Morrall, J. Walking Distances to and from Light-rail Transit Stations. Transp. Res. Rec. 1996, 1, 19–26. [Google Scholar] [CrossRef]
  47. Hennigan, M.F.B.A. Station Area Access within Transit-Oriented Development: A Typological Analysis. Master’s Thesis, The University of Texas at Austin, Austin, TX, USA, 2006. [Google Scholar]
  48. Wang, J.Y.; Zheng, X.; Mo, Y.K. Construction of density zoning and determination of volume ratio for rail transit TOD development—Shenzhen rail transit line 3 as an example. Urban Plan. 2011, 35, 30–35. [Google Scholar]
  49. Tencent’s Q2 and Interim Results for 2021. Available online: https://static.www.tencent.com/uploads/ (accessed on 25 September 2021).
  50. China Mobile Internet Industry Development Analysis Report, Q3 2020. Available online: http://www.100ec.cn/detail—6575116.html (accessed on 25 September 2021).
  51. Liu, Z.; Qian, J.L.; Du, Y.; Wang, N.; Yi, J.; Sun, Y.; Ma, T.; Pei, T.; Zhou, C. Multi-level spatial distribution estimation model of the inter-regional migrant population using multi-source spatiotemporal big data: A case study of migrants from Wuhan during the spread of COVID-19. J. Geo Inf. Sci. 2020, 22, 147–160. [Google Scholar] [CrossRef]
  52. Long, Y.; Shen, Z. Discovering functional zones using bus smart card data and points of interest in Beijing. In Geospatial Analysis to Support Urban Planning in Beijing; Springer: Cham, Switzerland, 2015; pp. 193–217. [Google Scholar] [CrossRef]
  53. Shu, B.; Yang, C.; Cui, J.; Chen, L. Preliminary Study on the City’s Functional Structure of Subway Station’s Surrounding Area Under the TOD Model: Empirical Analysis Based on POI Data Along Chengdu Metro. Huazhong Archit. 2019, 5, 79–83. [Google Scholar] [CrossRef]
  54. Wu, Z.Q.; Ye, Z.N. Research on urban spatial structure based on Baidu Heat Map: A case study on the central city of Shanghai. City Plan. Rev. 2016, 40, 33–40. [Google Scholar]
  55. Zhang, L. Research on POI Classification Standard. Bull. Surv. Mapp. 2012, 10, 82–84. [Google Scholar]
  56. Yu, W.; Ai, T. Visualization and analysis of POI points in cyberspace supported by kernel density estimation method. J. Surv. Mapp. 2015, 44, 82–90. [Google Scholar]
  57. Leslie, T.F. Identification and differentiation of urban centers in Phoenix through a multi-criteria kernel-density approach. Int. Reg. Sci. Rev. 2010, 33, 205–235. [Google Scholar] [CrossRef]
  58. Kang, Y.; Cho, N.; Son, S. Spatiotemporal characteristics of elderly population’s traffic accidents in Seoul using space-time cube and space-time kernel density estimation. PLoS ONE 2018, 13, e0196845. [Google Scholar] [CrossRef] [PubMed]
  59. Iseki, H.; Eom, H. Impacts of rail transit accessibility on firm spatial distribution: Case study in the metropolitan area of Washington, DC. Transp. Res. Rec. 2019, 2673, 220–232. [Google Scholar] [CrossRef]
  60. Dark, S.J. The biogeography of invasive alien plants in California: An application of GIS and spatial regression analysis. Divers. Distrib. 2004, 10, 1–9. [Google Scholar] [CrossRef]
  61. Mahara, G.; Wang, C.; Yang, K.; Chen, S.; Guo, J.; Gao, Q.; Wang, W.; Wang, Q.; Guo, X. The association between environmental factors and scarlet fever incidence in Beijing region: Using GIS and spatial regression models. Int. J. Environ. Res. Public Health 2016, 13, 1083. [Google Scholar] [CrossRef]
  62. Zhang, H.; Zhou, X.; Tang, G.; Zhou, L.; Ye, X. Hotspot discovery and its spatial pattern analysis for catering service in cities based on field model in GIS. Geogr. Res. 2020, 39, 354–369. [Google Scholar]
  63. James, G.; Witten, D.; Hastie, T.; Tibshirani, R. An Introduction to Statistical Learning; Springer: New York, NY, USA, 2013; Volume 112, p. 18. [Google Scholar]
  64. Wang, J.; Hu, L. Attraction scope of urban rail transit station to the conventional public transit passenger flow. Syst. Eng. 2010, 1, 14–18. [Google Scholar]
  65. Yin, Z. From Accumulation to Compactness: Study on Distribution Characteristics of Residential Buildings in Catchment Area of MTR Stations. South Archit. 2016, 6, 122–126. [Google Scholar] [CrossRef]
  66. Zhou, Y.; Fang, Z.; Zhan, Q.; Huang, Y.; Fu, X. Inferring social functions available in the metro station area from passengers’ staying activities in smart card data. ISPRS Int. J. Geo Inf. 2017, 6, 394. [Google Scholar] [CrossRef]
  67. Cervero, R. Linking urban transport and land use in developing countries. J. Transp. Land Use 2013, 6, 7–24. [Google Scholar] [CrossRef]
  68. Ye, Z.; Chen, Y.; Zhang, L. The analysis of space use around Shanghai metro stations using dynamic data from mobile applications. Transp. Res. Proedria 2017, 25, 3147–3160. [Google Scholar] [CrossRef]
  69. Liang, Y.; Song, W.; Dong, X. Evaluating the space use of large railway hub station areas in Beijing toward integrated station-city development. Land 2021, 10, 1267. [Google Scholar] [CrossRef]
  70. Hung, H.K.; Wu, C.C. Impact of night markets on residents’ quality of life. Soc. Behav. Personal. Int. J. 2020, 48, 1–12. [Google Scholar] [CrossRef]
  71. Hu, J. Itinerant Peddlers and Modern Chinese Urban Society; China Social Science Press: Beijing, China, 2019. [Google Scholar]
  72. Hsieh, A.T.; Chang, J. Shopping and tourist night markets in Taiwan. Tour. Manag. 2006, 27, 138–145. [Google Scholar] [CrossRef]
  73. Zhang, S.; Peng, S.C.; Chen, T.H.; Wang, J.Z. Evaluation of inhalation exposure to carcinogenic PM10-bound PAHs of people at night markets of an urban area in a metropolis in eastern China. Aerosol Air Qual. Res. 2015, 15, 1944–1954. [Google Scholar] [CrossRef]
  74. Nguyen, T.P.L.; Peña-García, A. Users’ awareness, attitudes, and perceptions of health risks associated with excessive lighting in night markets: Policy implications for sustainable development. Sustainability 2019, 11, 6091. [Google Scholar] [CrossRef]
  75. Wang, X.; Zhang, Y.; Yu, D.; Qi, J.; Li, S. Investigating the spatiotemporal pattern of urban vibrancy and its determinants: Spatial big data analyses in Beijing, China. Land Use Policy 2022, 119, 106162. [Google Scholar] [CrossRef]
  76. Li, J.; Li, J.; Yuan, Y.; Li, G. Spatiotemporal distribution characteristics and mechanism analysis of urban population density: A case of Xi’an, Shaanxi, China. Cities 2019, 86, 62–70. [Google Scholar] [CrossRef]
Figure 1. One week passenger flow statistics chart of Xi’an Metro. Source: Xi’an Metro Official Weibo Account, https://weibo.com/xianditie (accessed on 18 to 24 October 2021).
Ijgi 11 00485 g001
Figure 2. The location of four research stations on Xi’an Metro Line 2.
Ijgi 11 00485 g002
Figure 3. The framework of the research process.
Ijgi 11 00485 g003
Figure 4. Pedestrian walking time (a) and walking speed (b) in BDJ station realm.
Ijgi 11 00485 g004
Figure 5. The scope adjustment process of the BDJ station realm: (a) before adjustment; (b) after adjustment.
Ijgi 11 00485 g005
Figure 6. Scope of the four research station realms: (a) XZZX Station, (b) LSY Station, (c) BDJ Station, (d) WYJ Station.
Ijgi 11 00485 g006
Figure 7. Data collection area and partial data. (a) Data collection area of Metro Line 2; (b) Point data distribution of population activities.
Ijgi 11 00485 g007
Figure 8. Statistics on the number of POIs for each research station realm.
Ijgi 11 00485 g008
Figure 9. Visualization of kernel density analysis results under different scale search radius: (a) 50 m radius, (b) 100 m radius, (c) 150 m radius, (d) 200 m radius, (e) more than 200 m radius.
Ijgi 11 00485 g009
Figure 10. Temporal and spatial distribution of human activities in each study station realm: (a) XZZX Station, (b) LSY Station, (c) BDJ Station, (d) WYJ Station.
Ijgi 11 00485 g010aIjgi 11 00485 g010b
Figure 11. Peak nuclear density of population activity within 500 m of each research station realm: (a) XZZX station realm; (b) LSY station realm; (c) BDJ station realm; (d) WYJ station realm.
Ijgi 11 00485 g011
Figure 12. The peak kernel density of population activities in the study station realm during working days and off days: (a) XZZX Station, (b) LSY Station, (c) BDJ Station, (d) WYJ Station.
Ijgi 11 00485 g012
Figure 13. Kernel density analysis of each functional POI in study station realm. The analysis results of the (a) XXZX Station; (b) LSY Station; (c) BDJ Station; (d) WYJ Station.
Ijgi 11 00485 g013aIjgi 11 00485 g013b
Table 1. Classification basis of rail transit stations.
Station TypesClassification Basis
ResidentialThe planning and construction of land around the station is mainly residential land; the proportion of land is 45 % .
Public ServiceThe planned land around the station is mainly for administrative offices, cultural education, and other public administration and public services, with the proportion of land greater than 15%, and the proportion of residential land is < 45 % .
Commercial ServiceThe planned land around the station is mainly commercial, business, entertainment, and recreation land, with the proportion of land > 15 % , and the proportion of residential land is < 45 % .
TransportationThe station is intended to connect with external transportation facilities. The proportion of land for transportation facilities is > 30 % , and the proportion of residential land is < 45 % .
IndustrialThe planning land around the station is mainly industrial land and storage land, with a proportion of land > 10 % , and the proportion of residential land is < 45 % .
HybridThe planning land around the station is diverse, with no obvious advantageous land, and the ratio is more balanced.
Table 2. Classification results of four station types.
CodeNameAbbreviationLocationLand Use Nature
aXing Zheng Zhong Xin STNXZZXSecond Ring Road–Third Ring RoadHybrid
bLou Shou Yuan STNLSYFirst Ring Road–Second Ring RoadResidential
cBei Da Jie STNBDJFirst Ring RoadCommercial service
dWei Yi Jie STNWYJSecond Ring Road–Third Ring RoadPublic service
Table 3. The specific metadata of the obtained original dataset.
Data AttributesEasygoAutoNavi Map
LocationLongitudeLongitude
LatitudeLatitude
Time informationDate--
Time period
Ancillary informationNumber of active peoplePlace name
Data categorization Place address
Data IDDateCity functional nature
Table 4. Definition and descriptive statistics of explanatory variables.
CodeExplanatory VariablesTotalMeanStandard Deviation
V1Entertainment POIs18145.2516.50
V2Financial Service POIs18446.0021.35
V3Government Agency POIs38696.5039.03
V4Medical and Health Care POIs37694.0083.29
V5Accommodation Service POIs418104.5048.14
V6Catering Service POIs2466616.50235.76
V7Living POIs1702425.50233.29
V8Shopping POIs3173793.25404.96
V9Transportation Service POIs59221.505.45
V10Public Service POIs86148.0034.32
Table 5. VIF values of each explanatory variable in the research station realm.
NodeExplanatory Variables
V1V2V3V4V5V6V7V8V9
a1.0771461.0520081.0032261.1538931.1678181.2818081.3313591.1776431.003262
b1.1363141.0362391.0026211.0894291.1899861.4147971.3658901.3559471.015039
c1.1213281.1744331.1019341.0481021.0733001.1850591.5099621.3221631.036715
d1.0380701.0149581.0066871.0333881.0853601.3696301.1728201.3775591.007235
Table 6. The OLS regression results for the XZZX station realm.
DayPeriodExplanatory Variables
InterceptV1V2V3V4V5V6V7V8V9
Working Day8:000.0658−0.10720.1199 *−0.0048−0.07900.0930 *0.00910.00640.0668 *0.0114
10:000.1023−0.00120.1214 *0.00830.01650.00700.01350.00860.0495 *0.0614 *
12:000.1084−0.03490.04800.00250.0934−0.03130.0342 *0.0282 *0.0571 *0.0954 *
14:000.0911−0.0738−0.00220.0364 *0.04320.03470.027 *0.0272 *0.02600.0607 *
16:000.10930.01500.07650.0452 *0.03520.0352 *0.0453 *0.0164 *0.03340.0823 *
18:000.1037−0.04580.06120.01130.1589 *0.01540.0370 *0.0191 *0.03060.0269
20:000.0887−0.08890.0181−0.01400.1215 *0.02870.0485 *0.0202 *0.01930.0554 *
22:000.0742−0.0083−0.0271−0.0163−0.04850.07860.0328 *0.0157 *0.0618 *0.0310
Off Day8:000.0616−0.0285−0.01270.00510.1692 *0.02030.01020.00190.03094 *0.0098
10:000.0857−0.01500.0092−0.01170.1781 *−0.07130.0388 *0.0154 *0.0350 *0.0264
12:000.0903−0.0306−0.0416−0.00630.08380.06660.0488 *0.0266 *0.0428 *0.0580 *
14:000.0943−0.0162−0.0101−0.01730.0384−0.01000.0523 *0.0175 *0.0470 *0.0586 *
16:000.1036−0.0426−0.0459−0.01170.02040.08380.0447 *0.0445 *−0.01290.0438
18:000.0999−0.1286−0.0249−0.01460.2333 *−0.07140.0322 *0.0346 *0.0372 *0.0575 *
20:000.07920.01280.0255−0.0049−0.0979−0.01820.0347 *0.0291 *0.01260.0287
22:000.07570.01030.1721 *−0.0155−0.01610.04290.0380 *0.0204 *0.03133 *0.0310
8:000.0616−0.0285−0.01270.00510.1692 *0.02030.01020.00190.03094 *0.0098
10:000.0857−0.01500.0092−0.01170.1781 *−0.07130.0388 *0.0154 *0.0350 *0.0264
* Asterisks next to numbers indicate statistically significant (p < 0.01).
Table 7. The OLS regression results for the LSY station realm.
DayPeriodExplanatory Variables
InterceptV1V2V3V4V5V6V7V8V9
Working Day8:000.21220.03390.0773−0.0306−0.03520.02770.01100.02139 *0.0033−0.0165
10:000.18860.04570.2109 *−0.0055−0.07110.0615 *0.00250.01520.0168 *0.0909 *
12:000.17590.09380.1826 *0.0113−0.04540.01720.0290 *−0.00540.0202 *0.0772 *
14:000.16380.09480.1541 *0.0053−0.04680.02870.0244 *0.00690.0289 *0.0953 *
16:000.1673−0.04620.1976 *0.0113−0.06770.01960.0241 *0.01900.0271 *0.0684 *
18:000.18130.03430.1831 *−0.0059−0.01320.04570.0210 *0.01390.0255 *0.1256 *
20:000.25220.05570.1148−0.03260.01450.04450.0353 *0.01050.0141 *0.0442
22:000.28380.02820.0704−0.0312−0.07410.06510.0337 *0.00010.00450.0636 *
Off Day8:000.21630.01160.0157−0.0198−0.03150.0691 *0.0193 *0.00480.00060.0219
10:000.26710.04270.1393 *−0.0304−0.00850.02020.0362 *0.00050.0183 *0.0253
12:000.17610.04720.0697−0.0080−0.00860.01820.01250.01100.0208 *0.1236 *
14:000.2429−0.05340.1604 *−0.0420−0.08230.0976 *0.0236 *0.01860.02849 *0.1069 *
16:000.2327−0.06880.1281 *−0.0082−0.04230.0850 *0.0258 *0.01870.0262 *0.1048 *
18:000.1927−0.03250.1617 *−0.0055−0.03780.05380.0212 *0.01890.0320 *0.1238 *
20:000.24240.05030.1234 *−0.0414−0.11100.04990.0265 *0.02040.0099−0.0028
22:000.2876−0.01380.0263−0.0195−0.06190.0685 *0.0167−0.00400.0180 *0.0321
* Asterisks next to numbers indicate statistically significant (p < 0.01).
Table 8. The OLS regression results for the BDJ station realm.
DayPeriodExplanatory Variables
InterceptV1V2V3V4V5V6V7V8V9
Working Day8:000.2220−0.0136−0.0030−0.04060.0729 *0.0679 *0.0105−0.0110−0.00100.0487
10:000.2239−0.00470.03770.01120.1117 *0.0466 *0.0263 *−0.01920.00750.0917 *
12:000.2127−0.0792−0.00020.00440.0970 *−0.02760.0360 *0.00160.00270.0651 *
14:000.1958−0.10450.03570.02080.0708 *0.01540.0335 *0.00570.00020.0907 *
16:000.2194−0.0509−0.0450−0.01960.0810 *−0.00180.0198 *−0.00320.0147 *0.0975 *
18:000.2366−0.07960.0505−0.03010.0782 *−0.01020.0418 *−0.00410.0157 *0.0576
20:000.2680−0.0589−0.0552−0.00010.04090.00980.0193 *0.01570.00830.0236
22:000.25960.0207−0.0185−0.02330.03820.03030.0013−0.00520.00130.0267
Off Day8:000.21810.0200−0.0121−0.01100.0856 *0.04380.0154−0.0029−0.00350.0269
10:000.22740.09120.0306−0.03510.0696 *0.0650 *0.01630.02150.00750.1067 *
12:000.2596−0.0850−0.0053−0.01800.0808 *0.04430.0295 *−0.01350.0136 *0.0403
14:000.2501−0.08830.0316−0.03450.0621 *0.03990.0286 *−0.01790.0155 *0.1182 *
16:000.2547−0.14180.05330.00930.0900 *0.04440.0385 *0.00570.00830.0018
18:000.2448−0.00140.1015 *−0.01320.0453 *0.0589 *0.0230 *−0.01570.0148 *0.0851 *
20:000.25590.0237−0.0117−0.02420.0612 *0.02160.0239 *−0.02450.00500.0387
22:000.25320.0323−0.0056−0.05460.0751 *−0.00480.01460.01550.00030.0321
* Asterisks next to numbers indicate statistically significant (p < 0.01).
Table 9. The OLS regression results for the WYJ station realm.
DayPeriodExplanatory Variables
InterceptV1V2V3V4V5V6V7V8V9
Working Day8:000.22720.05400.08870.01910.1261 *0.0648 *0.0254 *0.02810.01140.0031
10:000.25420.01630.1352 *0.03800.08060.02100.00350.02790.02190.0187
12:000.2119−0.01440.08430.05390.1875 *0.01640.0384 *0.02360.01450.0649
14:000.2113−0.01430.1203 *−0.03440.01250.0811 *0.0282 *0.0485 *0.00340.1023 *
16:000.21000.06600.1541 *0.02910.02910.02220.00600.0599 *0.00240.0024 *
18:000.2385−0.05060.1521 *0.04880.10150.1080 *0.02140.0630 *−0.00010.0589
20:000.26860.03050.0670−0.03480.06710.02010.0501 *0.03280.0215−0.0007
22:000.26490.06520.0894−0.00110.10940.02290.01730.0567 *0.0168−0.0345
Off Day8:000.17780.00730.06500.01560.1248 *0.03490.0308 *0.01010.0289 *0.0072
10:000.21180.01440.0294−0.02590.05510.1529 *0.0423 *0.03030.01000.0342
12:000.2594−0.00790.03410.03510.03790.1212 *0.0368 *0.01400.02020.0713
14:000.2371−0.01400.05900.00470.02300.0484 *0.0567 *0.04850.01270.0166
16:000.2460−0.05350.0566−0.03070.08850.04070.0416 *0.01440.0287 *0.1208 *
18:000.24980.01040.0730−0.0519−0.04800.05810.0286 *0.03160.00840.0821 *
20:000.25310.0249−0.0147−0.02110.08590.05990.0317 *0.0386 *0.0256−0.0107
22:000.2595−0.0433−0.0293−0.04550.01380.0720 *0.0305 *0.0647 *0.0028−0.0094
* Asterisks next to numbers indicate statistically significant (p < 0.01).
Publisher’s Note: MDPI stays neutral with regard to jurisdictional claims in published maps and institutional affiliations.

