Article

What Determinants Will Enhance or Constrain the Spatiality of Agricultural Products with Geographical Indications in Northeast China? An Interpretable Learning Approach

1
State Key Laboratory of Black Soils Conservation and Utilization, Northeast Institute of Geography and Agroecology, Chinese Academy of Sciences, Changchun 130102, China
2
College of Resources and Environment, University of Chinese Academy of Sciences, Beijing 100049, China
*
Author to whom correspondence should be addressed.
ISPRS Int. J. Geo-Inf. 2023, 12(11), 442; https://doi.org/10.3390/ijgi12110442
Submission received: 25 July 2023 / Revised: 17 September 2023 / Accepted: 25 October 2023 / Published: 27 October 2023

Abstract

:
Geographical indication (GI) offers a unique protection scheme to preserve high-quality agricultural products and support rural sustainability at the territorial level. However, not all the areas with traditional agricultural products are acknowledged with a GI. Quantifying the contribution of each factor to geographical indication agricultural products (GIAPs) can facilitate the formulation of effective policies to improve rural livelihoods. In this study, the random forest (RF) model was applied to investigate the contribution of multi-perspective factors, including nature, society, agriculture and market, on the distribution of GIAPs, and examined the driving causes using interpretable approaches. The empirical findings demonstrate that the RF model is able to accurately capture most of the important factors characterizing GIAPs and to make out-of-sample predictions of the study units which obtain GIs. This study revealed that natural conditions and market demand were contributing aspects to the disparity of GIAPs in Northeast China. The order of determinants was the category of online GIAPs (CatOn) > the number of online GIAPs (NumOn) > the area of black soil (BlaSoil) > the distance to offline stores selling GIAPs (DisOff). Of these, GIAPs was lower than y b a s e in parts of districts of Jilin and Heilongjiang Provinces when the area of black soil (BlaSoil) gradually increased. When the category and number of online GIAPs (CatOn and NumOn) were less than 20 and 5, respectively, GIAPs were enhanced, especially for 40% of the districts in Liaoning Province. Deepening understanding of GIAPs helps to better target and tailor sustainable development policies.

1. Introduction

In the effort to achieve the Sustainable Development Goals (SDGs) under the international community’s 2030 Agenda, rural revitalization has been a growing concern in many parts of the world where new initiatives to improve local agriculture and the rural economy have emerged in a contextual heterogeneity by different states, corporate actors, and grassroots movements [1,2]. As a means to improve the rural economy, geographical indications (GIs) contribute to the sustainability of production systems and local development by fostering a sense of territorial distinctiveness [3]. Furthermore, traditional culture will be passed on, local resources will be protected, and the conditions to ensure that farmers benefit will also be provided [4]. GIs certify that a product originates from a distinct geographical area and derives, from its geographical origin, a specific quality, which primarily reflects a long and unique journey of interaction and co-evolution between cultural practices, know-how, and the natural environment [5], thereby enticing consumers and producers with territorial distinctiveness.
Geographical indication agricultural products (GIAPs) have assumed the status of a development tool, particularly in rural sustainability. With references to economic and social sustainability, GIAPs are related to the preservation of natural resources and the ecological environment as parts of local capital [6,7]. Namely, producers attach greater significance to local resources, landscapes, and biodiversity in order to guarantee the environmental conditions for cultivation and processing [5,8,9]. For consumers, GIs provide information about where and how an agricultural product is grown, to stimulate consumers’ willingness to pay for it on the market [10,11], thereby increasing consumer welfare [12]. The emergence of GI in rural regions creates niche markets for traditional local products and raises the rural cost–benefit ratio [8,13]. Additionally, GI is linked to local attractions, among other things. Therefore, GIAPs can be considered to be both the outcome and the maintainers of their own sustainable development [14].
The legal framework for GIs is the most well-known tool for protecting the identity of site-specific food products, such as Protected Designations of Origin (PDOs) and Protected Geographical Indications (PGIs) in the European Union (EU); Trade-Related Aspects of Intellectual Property Rights (TRIPS), within the scope of the World Trade Organization (WTO) [5,15]; and the Regulations on the Protection of Geographical Indication Products and the China–EU Geographical Indications Agreement in China [16]. The uniformity of rules and procedures at the national level grants potentially equal access to the opportunity to all farmers, regardless of their nationality and/or location. Nonetheless, there are significant regional differences in the usage of GI labels to protect and value local products. Some European countries have some world-famous examples of products that, like port wine from Portugal, olive oil, or cheese from Spain, have a long tradition of protection. Nevertheless, a number of long-established agricultural products in China, such as tea and Chinese herbs, have not received the visibility they deserve. GI is a good means to promote rural sustainability, but its development is still in its infancy and neither the ecological nor economic values have been fully exploited in China. Moreover, the use of GI varies among geographical zones. GIAPs in East China account for over 26% of the national total of GIAPs. Conversely, GIAPs in Northeast China account for 8.47% of the national total, despite its good ecological environment and diverse topography, making it suitable for GIAPs to diversify. Due to China’s vast size and diversity, it must be accepted that there are peculiarities in each region’s growth. The study of GIAPs at a geographical level must still be based on the actual situation. Numerous studies have focused on GIs in an effort to elucidate food traceability from a food science perspective, cultural protection from an intellectual property perspective, or a regulatory policy perspective. These studies have discussed their pattern, implementation, and the interaction generated between the development of GIAPs and contextual factors. To date, it is rare to consider the rationale for GI development from a geographical perspective. Furthermore, the majority of this literature consists of case studies that concentrate on one or a few GIAPs, or a certain factor in relation to GI use [9,17,18]. In this way, the actual relation between the factor and the registration of GIAPs might be biased, because the role of other factors is completely disregarded, and the results have low external validity. Then, previous relevant studies had limitations and were unable to deeply interpret the specific influencing process. In addition, some emerging economic geographical phenomena, such as livestreaming e-commerce and a fan economy with instant interaction and immersive experience, have stimulated consumers’ emotions for purchasing products [19,20], but there has been little research on the effect of these new commerce patterns on agricultural products, particularly on GIAPs. Therefore, it is crucial to explore at a geographical level what contextual determinants will enhance or limit the prospects of GIAPs, so as to shape the branding of internationally recognized agricultural products.
Given this brief contextualization, this article aims to understand what the determinants are that are linked to GIs through an interpretable approach from a machine learning (ML) perspective (Figure 1). We depicted the spatial pattern of GIAPs in Northeast China, then selected twenty potential factors from the perspectives of natural condition, socioeconomic status, agricultural foundation, and market demand to interpret the spatial pattern of GIAPs (the dependent variable). For the purpose of obtaining the best result, we compared the performance of four ML models, linear regression (LR), decision tree (DT), K-nearest neighbors (KNN), and random forest (RF) algorithms, of which RF was selected for its optimal performance and the importance of the factors was ranked as a result. To resolve the issue of poor interpretability, interpretable ML was utilized to reinforce the model’s performance and reveal the determinants that will enhance or limit local GIAPs through PDP/ICE plots and SHAP values. Aiming to further stimulate GI use, the policy maker would need to find appropriate means in accordance with the determinants.
In the next section we briefly review the literature related to the progress of GI determinants and methods. Section 3 details the data and illustrates the methodology for the influence effect on GI use, applying interpretability from an ML perspective. To our knowledge, to date, this method has never been used to interpret the relation in agricultural geography studies, so that its application in a different context constitutes an innovative feature of the present study. Results are presented in Section 4, while Section 5 draws the discussion toward exploring their policy implications. Section 6 concludes.

2. Literature Review

2.1. Do GIAPs Have Development Prospects in Northeast China?

After nearly 20 years of development, a certain number of GIAPs have been successfully applied for in Northeast China, which varies by regions due to local resource endowment and agricultural development. Of these, Heilongjiang ranks first in the number of GIAPs, accounting for 57% of the total in Northeast China, while Liaoning and Jilin provinces have fewer GIAPs with uneven spatial distribution. As the most famous GIAP in Northeast China, Wuchang rice is also one of the first agricultural products to be certified as GIAP. Additionally, the honey of the Raohe Northeast black bee, Jilin Changbai Mountain ginseng, Liaozhong roses, Panjin rice, and 21 other agricultural products are not only GIAPs, but also go to the international market through the China-EU Geographical Indications Agreement [21].
These GIAPs perfectly avoid some common problems faced by traditional agricultural products, such as uneven quality, a single sales channel, an unsound logistics system, and poor brand awareness. These GIAPs have achieved high quality and good price [22], so consumers are usually willing to pay a higher price for their quality and brand. For example, the brand premium of Wuchang rice has grown over 100%, with a brand value of 71.31 billion yuan, ranking No. 4 in the top 100 GIAPs list, and No. 1 in the rice category of GIAPs for eight consecutive years [23]. Not only that, these agricultural products also ride the wave of the digital economy to revitalize the rural area. Based on the economic laws of the interconnection and mutual promotion of “business” and “agriculture”, the concept of “digital economy revitalizes rural China” is that digital technology and data elements can empower rural business [24]. Through the construction of e-commerce bases, gathering resources such as sources of goods, brands, talents, and supporting services, GIAPs in some areas have sold well, for example, in Raohe County, Heilongjiang Province, e-commerce sales have exceeded 260 million yuan in 2022 [23].
The above information shows that the GIAPs in Northeast China have good prospects and can facilitate local rural revitalization. However, many regions have not yet been certified as a GI, despite having high-quality agricultural products, so it is essential to explore what factors will influence the development of GIAPs.

2.2. What Factor Will Enhance or Constrain the Development of GIAPs?

The idea that GIs constitute a real development opportunity for rural and agricultural areas is now endorsed by scholars and practitioners [25]. However, not all agricultural products will obtain a GI, and what factors could influence the acknowledgment of GIAPs has been the focus of a significant group of studies [26]. Therefore, we proposed four groups of factors to explain the spatial pattern of GIAPs: natural condition, socioeconomic status, agricultural foundation, and market demand.
As a distinct geographical area of one agricultural product, it is inevitable that the label of GIAPs is influenced by local natural conditions, including climate, soil, landscape and so on. For example, climate is thought to play a role in citrus fruits with a GI [18]. However, the effect of climate, as well as those of other environmental factors, may be difficult to disentangle, especially when the study objective moves from certain case to a broader scale. Therefore, the influence of environmental factors on GIAPs remains to be investigated.
Socioeconomic impacts are particularly important to ensuring the viability of the GIs and to attracting investment from capitalists, which includes economy and culture. Some studies emphasize that local finance and agricultural inputs facilitated the development of the GI [27,28], while the reverse effect was not always immediately apparent. Culture encompasses two aspects, one is the local understanding of agriculture, which seems to be different in some regions. In Northern Europe, agriculture is more associated with the industrial concepts of productivity, efficiency, and innovation, as it is seen mainly as a process for producing food commodities. Conversely, in Southern Europe, farming is not just a matter of producing food, rather it is an activity closely linked to territory and tradition. Thus, food production is lifted to a cultural level of enjoyment [29,30]. This cultural difference leads directly to the awareness of the producers of agricultural products—the farmers—about applying for GI. The other aspect is whether the agricultural product has a cultural connotation [14,31], and culturally minded consumers often pay for the cultural or historical value behind an agricultural product. In addition, traffic and transportation also cannot be ignored, as they serve as a gateway for agricultural products to move from the farm to the table, and reflect the ease of access to external activities near the origin of agricultural products.
As the source of origin of agricultural products, rural areas usually arouse experts’ interest in the agricultural foundation. In general, a variation in acreage can have an impact on crop yield, and thus influence GI use. However, the focus on GIAPs is more or less important, after all, agricultural products with GI certification are just a fraction of all agricultural products. The development model of “cooperatives/Leading enterprises + farmer + Plantation Bases” has gradually spread to the farmers. Generally, farmers who join cooperatives signed a pre-acquisition contract. When crops mature, farmers sell the primary product that meets the standard to cooperatives or enterprises at the price in the contract [32,33,34]. So GIAPs are grown and targeted by enterprises under contract with farmers, meaning that the relationship between acreage area and GIAP yield is market or enterprise driven. Then, rural size and energy consumed, in a way, may be related to the production process of agricultural products, which needs to be analyzed specifically according to the study of subject and scale. In addition to this, many agricultural products do not receive GIs because farmers know little about how to obtain them—due to the information gap and low digitization, rather than because the agricultural product itself does not meet admission requirements. The digital index is, in a way, the ability to accept innovation. When the concept of GI appears in a particular village, it may be more easily accepted by the locals in villages with a high digitalization, and move faster to consumers or investors [35].
Another important consideration is market demand. If farmers want greater economic benefits, this can start by expanding the agriculture market. From the consumer’s perspective, quality is better guaranteed if it is produced and processed by a specialized enterprise, and it will also be more popular with consumers [36,37]. Thus, the participation of enterprises is related to the development of the GI. Also, the destination of agricultural product—the consumer’s table—is theoretically related to GI use. Ideas from central place theory are routinely extended so that the distance between the origin of the agricultural product and population centers of consumers influences famers’ profitability [38]. In other words, the change in physical threshold distance influences the famers’ profitability. In addition to offline sales, online sales also facilitate GI use [39]. Based on certain e-commerce interaction platforms such as Taobao, JD and Jindo, Temu and TikTok, rural e-commerce shortens the gap between urban and rural areas and enables the interaction and transformation of elements such as population, capital, information, commodities, and knowledge.
In addition to the above factors we just described, also factors related to the government, to participation mode, or the farmers’ characteristics, may influence the implementation of GI schemes. For sample, the government may provide useful assistance during the registration process, they can stimulate cooperative behavior [40,41], or they can help in the mediation between different actors [42]. However, when the role of institutions deviates from their assistance position to force top-down GI registrations, poor results may be obtained in terms of local actors’ involvement [43,44]. Some studies have also found that the farmers’ participation mode, the famer’s age, and their education level are related to GI use [34,45]. Another aspect is that some authors found a positive relationship between tourism and the use of GI labels in rural areas [44,46].

2.3. How to Interpret the Relationship between Factors and the Development of GIAPs?

Exploring the effect of factors on a dependent variable (e.g., the development of local GIAPs) is not a new problem, and the previous literature on this subject has proposed various methods. Traditionally, linear regression is often used to evaluate relationships, however, which limits it ability to model complex nonlinear relationships. In addition, it may not be able to address spatial effects well, including spatial autocorrelation and spatial heterogeneity. To solve the above problems, standard econometric models, such as panel regression [27], panel vector auto regression [28], and the spatial Durbin model [47], have been gradually introduced to quantify the impact of various factors on the development of GIAPs. A proprietary model has also been designed specifically to measure the effect of every factor [30]. In addition, the geographically weighted regression (GWR) [48] model and GeoDector [49] also are suitable choices to reveal interaction between local factors and GI use. These empirical statistical models rely heavily on prior knowledge and thus are rarely used to evaluate the influence factors of GIAPs, although they are easy to implement and explain.
ML is still relatively new to human geography, although it has been effectively used in many areas, involving agricultural land use [50] and land price cases [51]. However, there are few reports on the use of ML for GI prediction. In particular, there is a lack of empirical studies interpreting the spatial pattern of GI use through ML and analyzing the effect process of various potential determinants. ML presents significant advantages over the traditional statistical methods described above. First, statistical models generally make strict assumptions on the data distribution, and ML has no such requirements [52]. Second, ML can effectively capture high-order nonlinear interactions between various types of data by simply building a black box model, so they have better calculation capabilities than traditional statistical models. More importantly, interpretable ML has been developed to reveal physical mechanisms from black box models that might previously be unnoticeable to researchers. With advanced features, interpretable ML converts black box models to glass box (transparent) models, exposing the underlying reasoning. These interpretable models elucidate how the ML model provides their explanations, revealing factor importance and dependency. Undoubtedly, interpretable ML is a suitable tool for exploring GIAPs. Based on this, this article compared four different ML algorithms, and selected the most appropriate one to explain the spatial pattern of GIAPs. To improve the performance of the proposed model as well as to evaluate properly the influence of input factors on GI, PDP/ICE plots and the SHAP method were used. Therefore, it can be said that it is a novel study to fill a gap in the literature and practice in the current study of GIAPs using the interpretable ML approach.

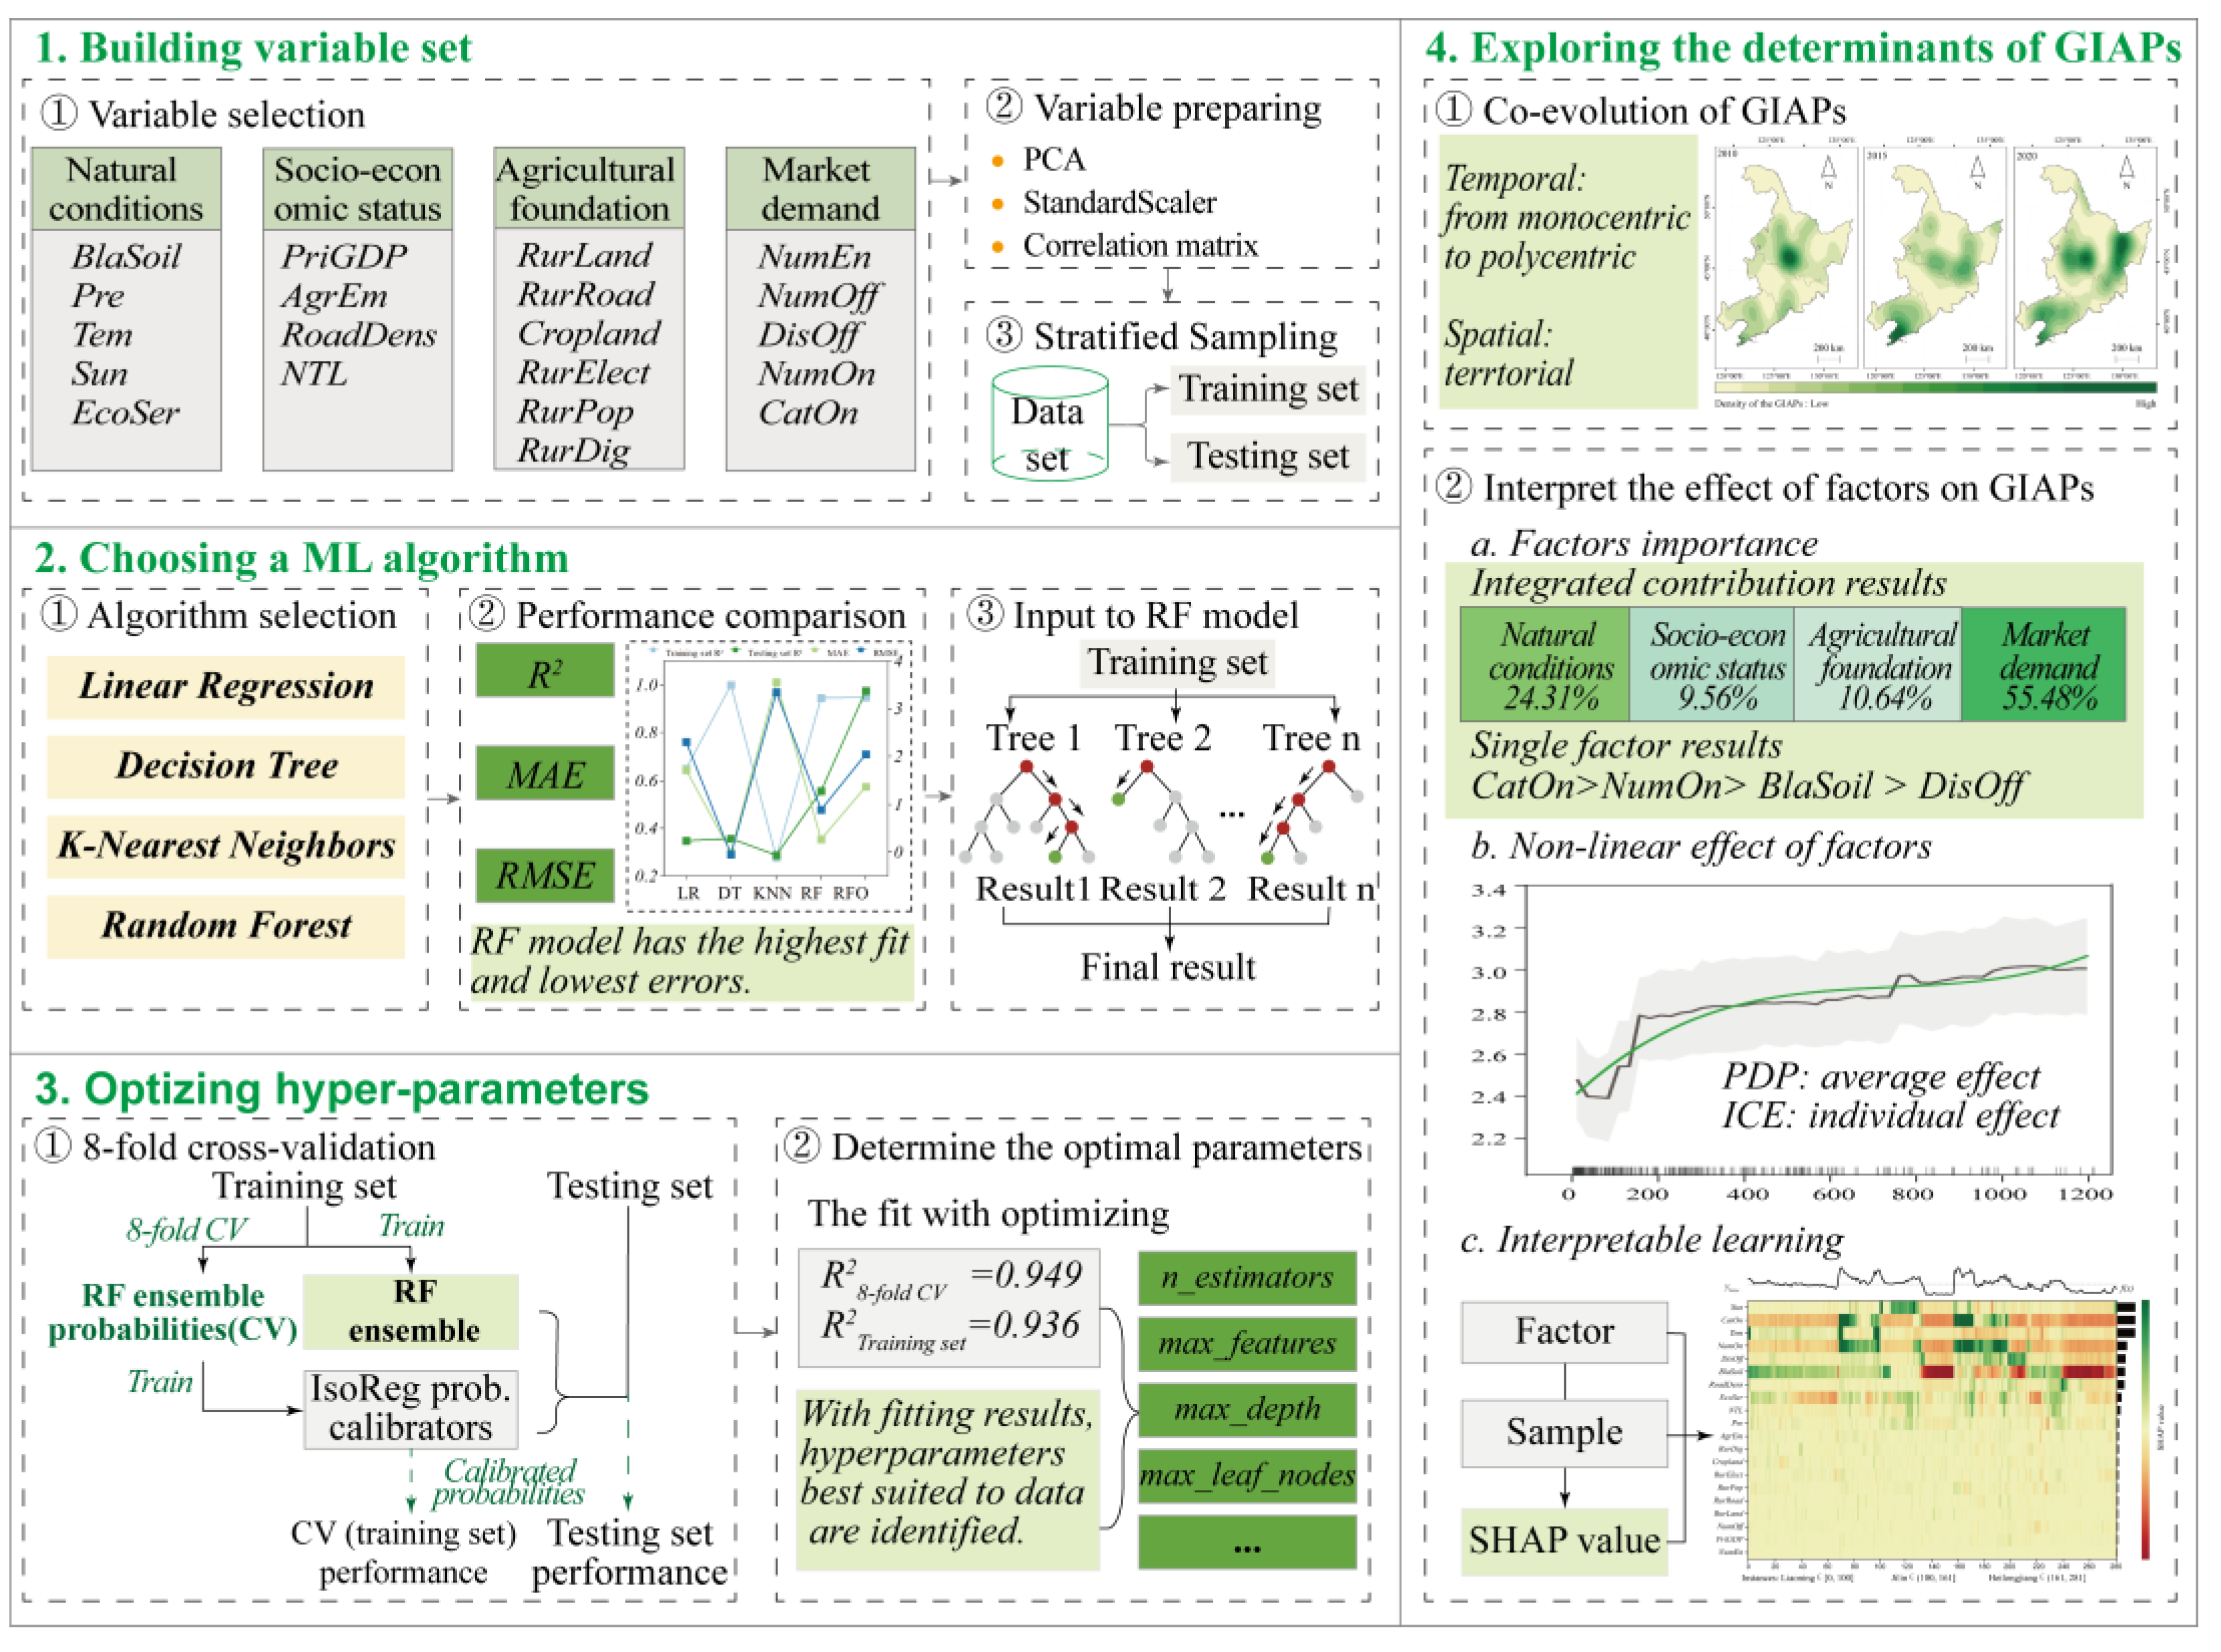
3. Materials and Methods

3.1. Study Area and Data Source

We selected Northeast China for 3 reasons. First, this region is home to China’s largest plain, covering Liaoning, Jilin, and Heilongjiang Provinces from the south to the north. As one of China’s major grain-producing regions, Northeast China not only has mostly fertile black soil suitable for crops [53], but is also rich in forests, minerals, and other resources, providing farmers with more livelihood options [54]. But in fact, to some extent, the accumulation of general food crops may not be able to satisfy the demand of other farmers in some regions and weaken resource advantages. In some regions, faced with arable land and mountain treasures, the main livelihood strategy for poor rural households is subsidies, followed by agriculture [55]. That is to say, those reliant on a single natural resource and farmers specializing in food crop production are more likely to fall into a poverty dilemma. Therefore, a traditional planting structure needs to be adjusted, which is the second reason to select Northeast China. Last but not least, a large number of food crops are grown in the Northeast, but their economic benefit of specialized production is lower than that of cash crops. Crops can be certified by the Ministry of Agriculture and Rural Affairs with their quality and cultural strengths, thus enhancing the economic value and improving local development. Therefore, Northeast China was selected as the study area, and Figure 2 shows the distribution of 293 GIAPs in Northeast China.
We aim to explore the spatial pattern of GIAPs and the influence of four groups of factors, including natural conditions, socioeconomic status, agricultural foundation, and market demand. Referring to the Ministry of Agriculture and Rural Affairs of the People’s Republic of China (http://www.moa.gov.cn/, accessed on 15 January 2023) and the National GI Agricultural Products Information Query System (http://www.anluyun.com/, accessed on 15 January 2023), we vectorized the extent of all GIAPs in the study area, so as to count GIAPs in each district or county. Then, 20 factors that may influence the spatial pattern of GIAPs were selected, these being: black soil data from the global change research data publishing and repository (https://www.geodoi.ac.cn/, accessed on 10 March 2023); precipitation, temperature, sunshine, ecological service value, nighttime light, and basic geographic information data from resource and environment science and data center (https://www.resdc.cn/Default.aspx, accessed on 10 March 2023); value-added of primary industry, number of agricultural employees, road density, rural electricity consumption and population data from local statistics bureau; rural land, road and cropland acreage data from the third national land survey (https://gtdc.mnr.gov.cn/, accessed on 12 March 2023); county digital rural index data from the institute for new rural development of Peking University (http://www.ccap.pku.edu.cn/nrdi/, accessed on 12 March 2023); enterprises using special GI data from the China national intellectual property administration (https://www.cnipa.gov.cn/, accessed on 12 March 2023); offline retail point data from Autonavi Open platform (https://lbs.amap.com/, accessed on 12 March 2023); online sale data from Chanmama data platform (https://www.chanmama.com/, accessed on 15 March 2023), and specific information is listed in Table 1.

3.2. Methodology

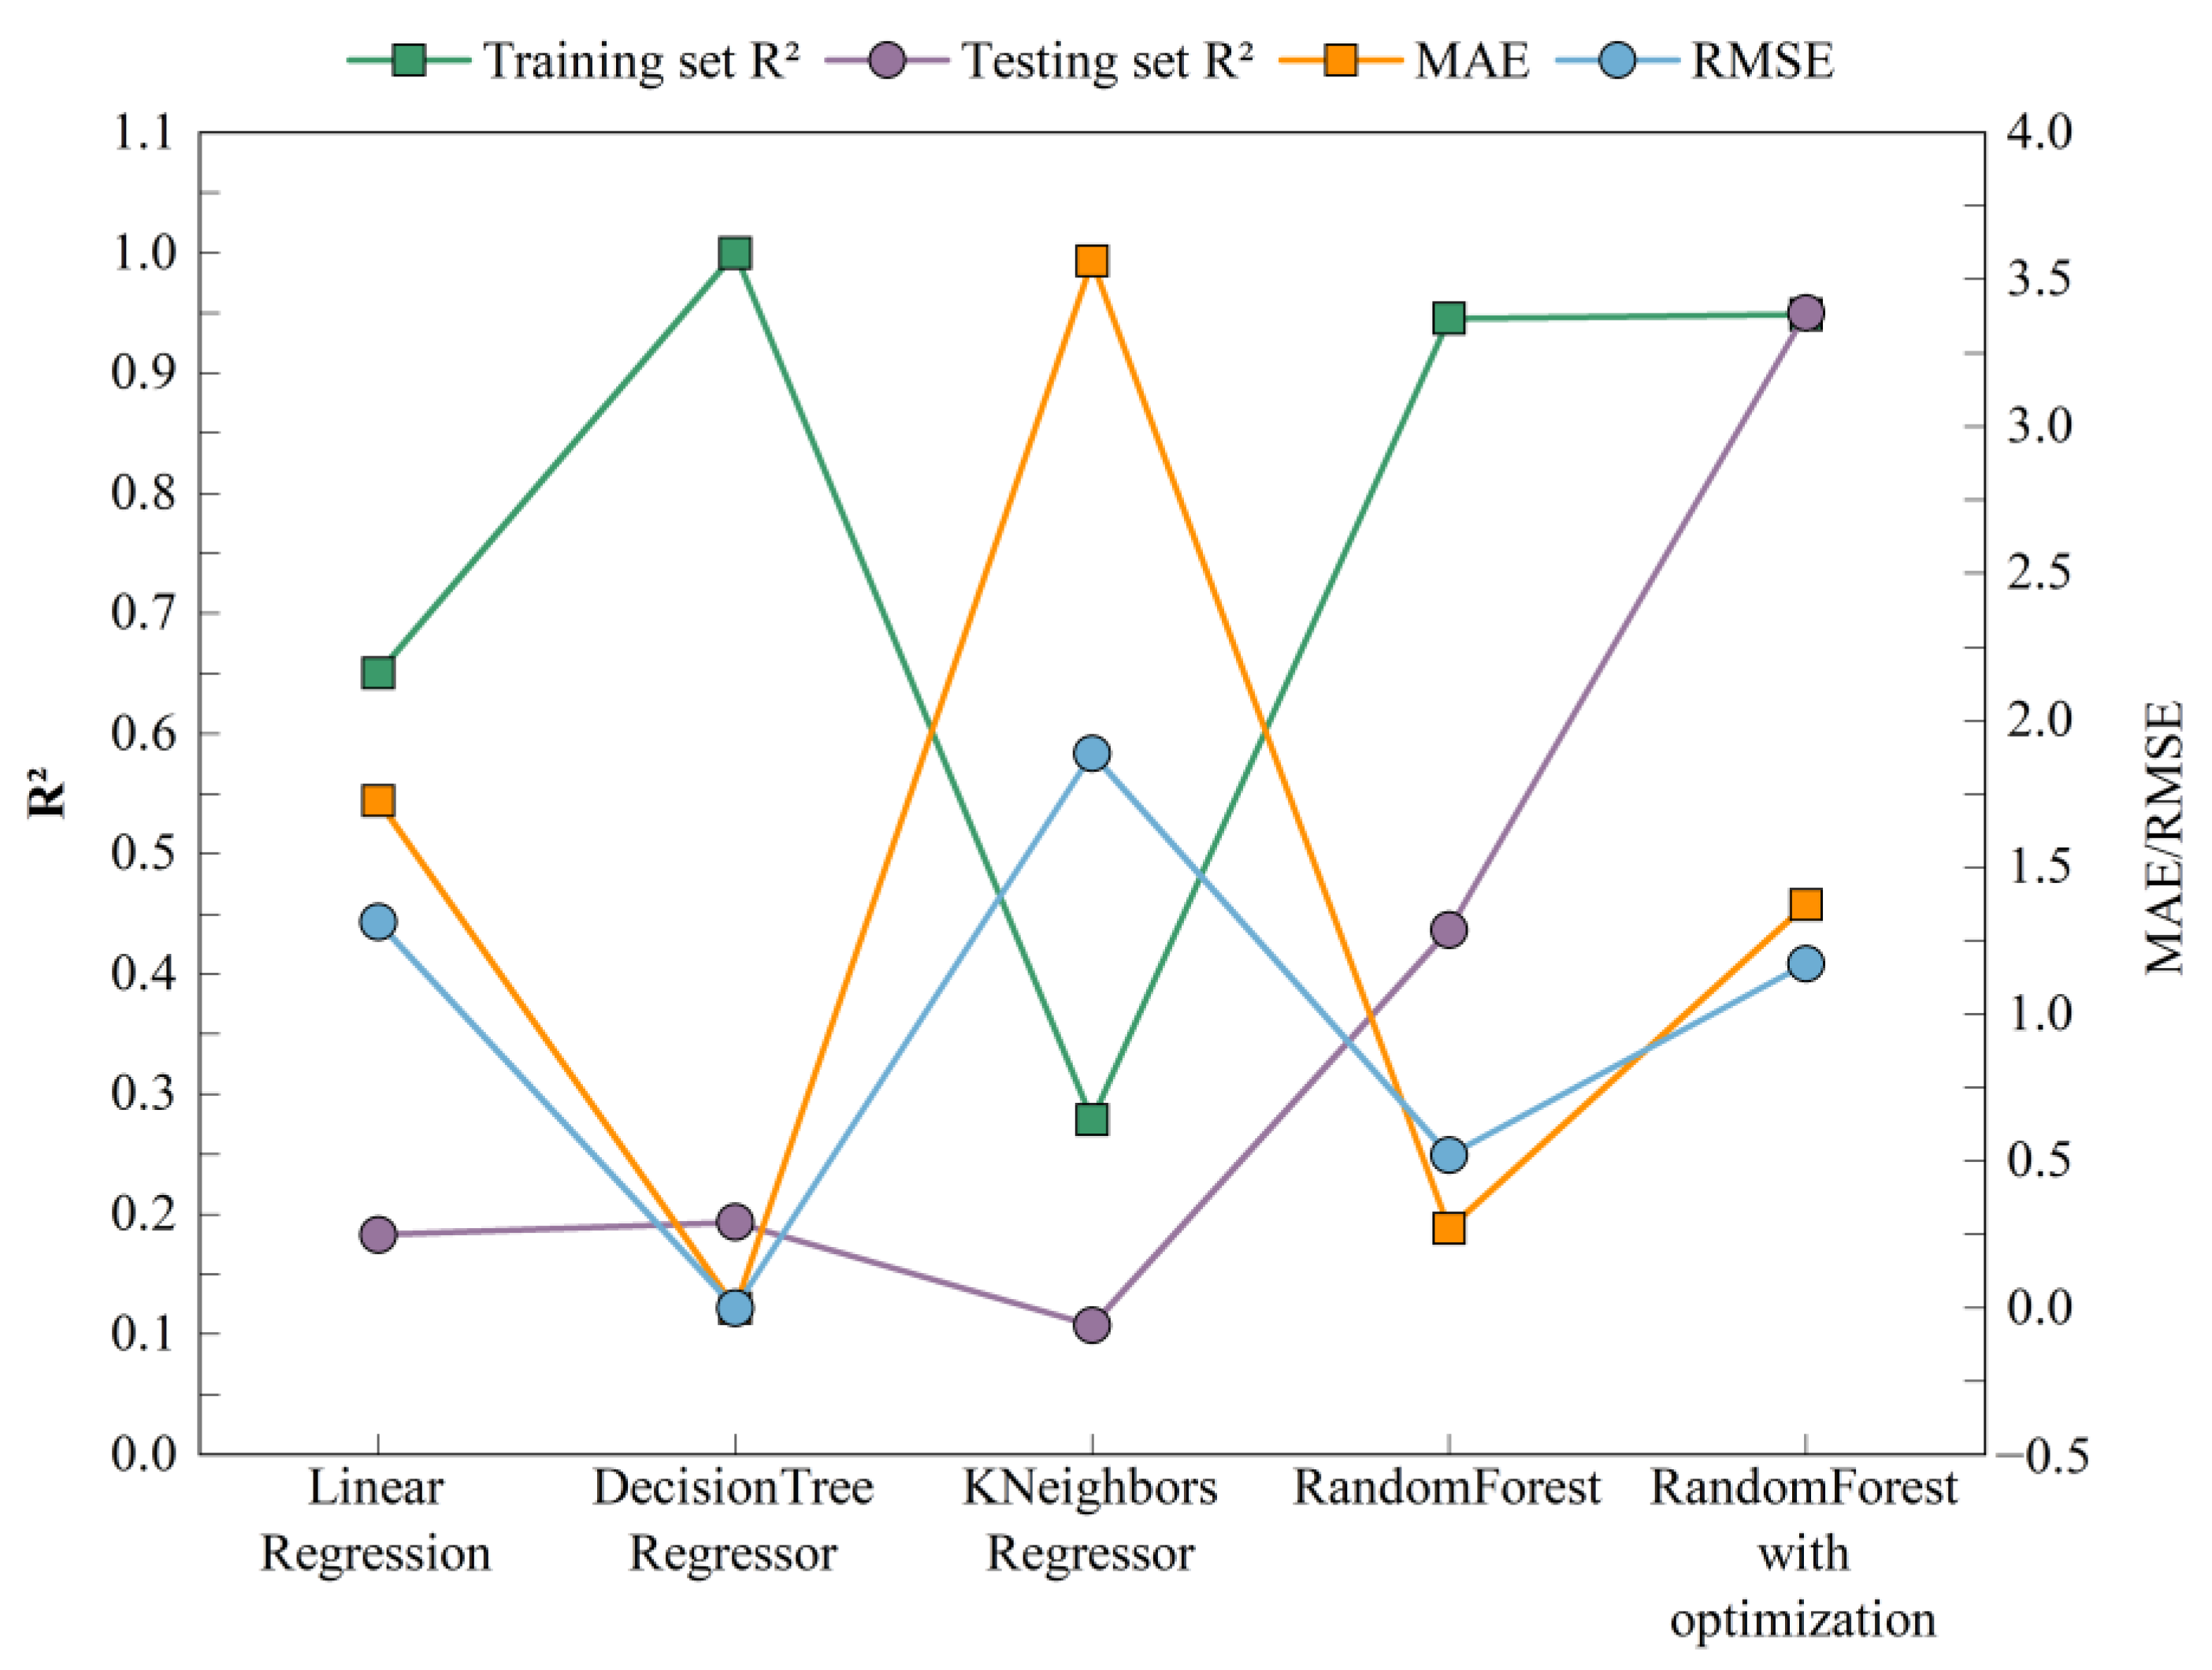
3.2.1. Machine Learning Model Selection

To analyze what factors/variables (in the ML field, the factor usually is named the variable) have influence on the development of GIAPs, LR, DT, KNN, and RF algorithms were modeled using the above selected variables. Comparatively, RF possessed comprehensively better performance over the LR, DT, KNN algorithms (Figure 3).
RF is a representative bagging integration algorithm consisting of decision trees as base evaluators, which was proposed in 2001 to solve classification and regression problems [56]. The central idea of RF is to construct multiple independent evaluators and then average or majority vote on their predictions to determine the outcome of the integrated evaluator results. Compared with other ML models, the advantages of RF are that it is (1) easy to understand its principle of decision trees for beginner researchers; (2) it is multi-functional, as it can be used for both regression and classification tasks that contain high-dimensional data and non-linear effects between variables; (3) it has a built-in mechanism that can initially rank the importance of predictors to help researchers gain insight into result. This non-parametric ML algorithm consists of an ensemble of decision trees that predict the outcome, measure, and repeat this step many times, ultimately resulting in a forest of trees. In this study, the evaluated level of GIAPs by each decision tree was obtained for every sample.
In order to choose the optimal parameter settings, we divided the dataset into a random 80% training and 20% testing set with a similar proportion of GIAPs in both sets using stratified sampling. Among the RF model parameters, the number of trees (n_estimators) and the number of randomly selected node-split feature variables (max_features) are two important custom parameters that can determine the predictive power of the model. In the study, the value of n_estimators was taken as 60, 100, 120, 200, 300, 400, and 500, which as they become larger, the fitting ability becomes stronger, but it also tends to cause overfitting. The value of max_features is taken as 3, 5, 10, 20, 25, 30, and 40. The combination of parameter settings that produced the optimal performance on the training set with a grid search and 8-fold cross-validation was selected as the optimal parameter, which can ensure the resulting search solution is the global optimal solution in the delimited grid. RF and all associated functions used in this study were carried out on the Python programming language using the scikit-learn module.

3.2.2. Model Evaluation

Three evaluation metrics were employed to evaluate the regression performance of selected and optimized models: the determination coefficient (R2), mean absolute error (MAE) and root mean square error (RMSE) [57]. The equations are as follows:
R 2 = 1 i = 1 N y i y ^ i 2 i = 1 N y i y ¯ 2
MAE = 1 N i = 1 N y i y ^ i
RMSE = 1 N i = 1 N y i y ^ i 2
where N represents the total number of samples (i.e., dependent variable). y i is the observed value of the samples in every district or county, y ^ i is the predicted value, and y ¯ is the average of the observed value.

3.2.3. Effect of Variables Evaluation

As an ML model, RF can be used to identify variables and rank importance. However, the black box model makes it hard to further reveal the qualitative relationships, which hinders the understanding of the complex mechanism behind its accurate results [58]. The PDP/ICE plots can illustrate whether the relationship between dependent and independent variables is linear, monotonic, or more complex, while the SHAP method can be interpreted globally or locally for a dataset, to clarify the logic of processing the problem and the way each variable influences the dependent variable within the RF model. In this article, the global variable importance of the RF model was listed as the overall contribution of factors, and then PDP/ICE and SHAP approaches were used to open the black box model to clarify the complex mechanism and improve the interpretability of the model.
(1)
Ranking variable importance.
One of the primary outcomes of RF is the variable importance ranking, which can be used to investigate and identify associations between variables and the outcome [56]. We obtained the variable importance ranking by taking the optimal parameter settings and fitting an RF on the entire dataset [59]. In this study, we assess the importance of potential variables acting on the spatial pattern of GIAPs in every district or county, expressed as:
i m p m = 1 n t r e e v S X m G a i n X m , v
where i m p m is the relative variable importance, which represents the contribution of the variable to the RF model (%), and the sum of i m p m is 1; X m are the independent variables, and m = 1 ,   2 , , 20 ; S X m is the set of nodes split by X m in the RF of ntree; G a i n X m , v is the Gini information gain of X m at split node v , which is used to select the predictor variable that can obtain the maximum information gain.
(2)
Partial Dependence Plot and Individual Conditional Expectation Plot (PDP/ICE).
To visualize this relationship and the mechanism of the variable on GIAPs, PDP/ICE plots were produced. PDP plots illustrate how the outcome changes on average when the variable is changed and while all other variables are kept constant at original values [60]. PDP emphasizes average effects, meaning that it looks at the whole rather than individual samples. However, it may obscure the variable interactions and heterogeneity shown only on some samples. ICE eliminates the influence of non-uniform effects and visualizes how the forecasting of the sample changes when the variable changes so that individual differences can be better observed [61]. In this study, both PDP and ICE plots were plotted together to better observe the average effect and individual sample variation, which are defined as:
f ^ x S x S = E x C f ^ x S , x C = f ^ x S , x C d P x C = 1 N i = 1 N f x S , x i , C
f ^ i , x S x S = f x S , x i , C
where f ^ * is the RF model; x S is the set containing one variable S ; and x C is the set of other variables, x i , C is the set of variables in sample i ; x S and x C constitute the total variables.
(3)
Shapley Additive Explanation (SHAP) Method.
The SHAP algorithm utilizes the idea of cooperative game theory to achieve explanations by evaluating the contributions made by each player, that is, the relationship between each independent variable and each dependent variable can be calculated by the SHAP value [62]. The SHAP value is the dependent value generated for each dependent sample model when all variables are considered as contributors, and is the value assigned to each variable in that sample. The SHAP provides two aspects of model’s interpretability [63]: The first one is global interpretability—it provides the collective SHAP values that show the contribution and direction of each independent variable to every sample. The second aspect is local interpretability—it displays the set of SHAP values corresponding to a sample, which greatly increases the transparency of the ML model. In this study, we applied global interpretability to explore the effect of each variable, and the SHAP algorithm is as follows:
f x i = 0 f , x + j = 1 M j f , x i
where f x i is the dependent variable generated for each sample x i with M variables. 0 f , x is the base value representing the expected value of RF model output over the dataset. j f , x i is the SHAP value of the impact of the variable j in the sample x i on the predicted outcome of the sample.
Further, j f , x i represents the SHAP value of each variable in each sample, which is a weighted average over all possible combinations of variable subsets.
j f , x = s X 1 , X 2 , , X m / X j S M S 1 ! M ! f x S X j f x S
where j f , x is the SHAP value of variable ( X j ). S is a subset of the variables used in the model. S is the number of non-zero entries in S . f x S is the predicted value of subset S .

4. Results

4.1. Spatiotemporal Co-Evolution of GIAPs: From Monocentric to Polycentric

Figure 4 presents the spatiotemporal co-evolution of the observed GIAPs in different periods. In general, the spatial structure of GIAPs in 2010 showed a clear monocentric pattern located on the Songnen Plain, where agricultural products were mainly fruit and vegetables. Compared with the situation in 2015, the high-value area of GIAPs expanded around the original area, and three high-value islands were formed in the Liaodong Bay and the Changbai Mountain Range, with additional agricultural products such as grain, meat, and fish enriching the regional output. By 2020, GIAPs formed an interlinked polycentric structure. Geographically, most cities in Liaoning Province were rich in agricultural products, with inland cities having well-developed livestock and planting industries, and coastal cities being rich in aquatic products. Jilin Province had the lowest value of GIAPs, mainly in planting, but in some areas there were no GIAPs at all. Heilongjiang Province’s GIAPs were mainly concentrated near the plains and mountains and contain many crops with medicinal value in addition to grains, fruit, and vegetables. Excitingly, our results show that, the locals in Northeast China have become more aware of labelling or diversifying their agricultural products.

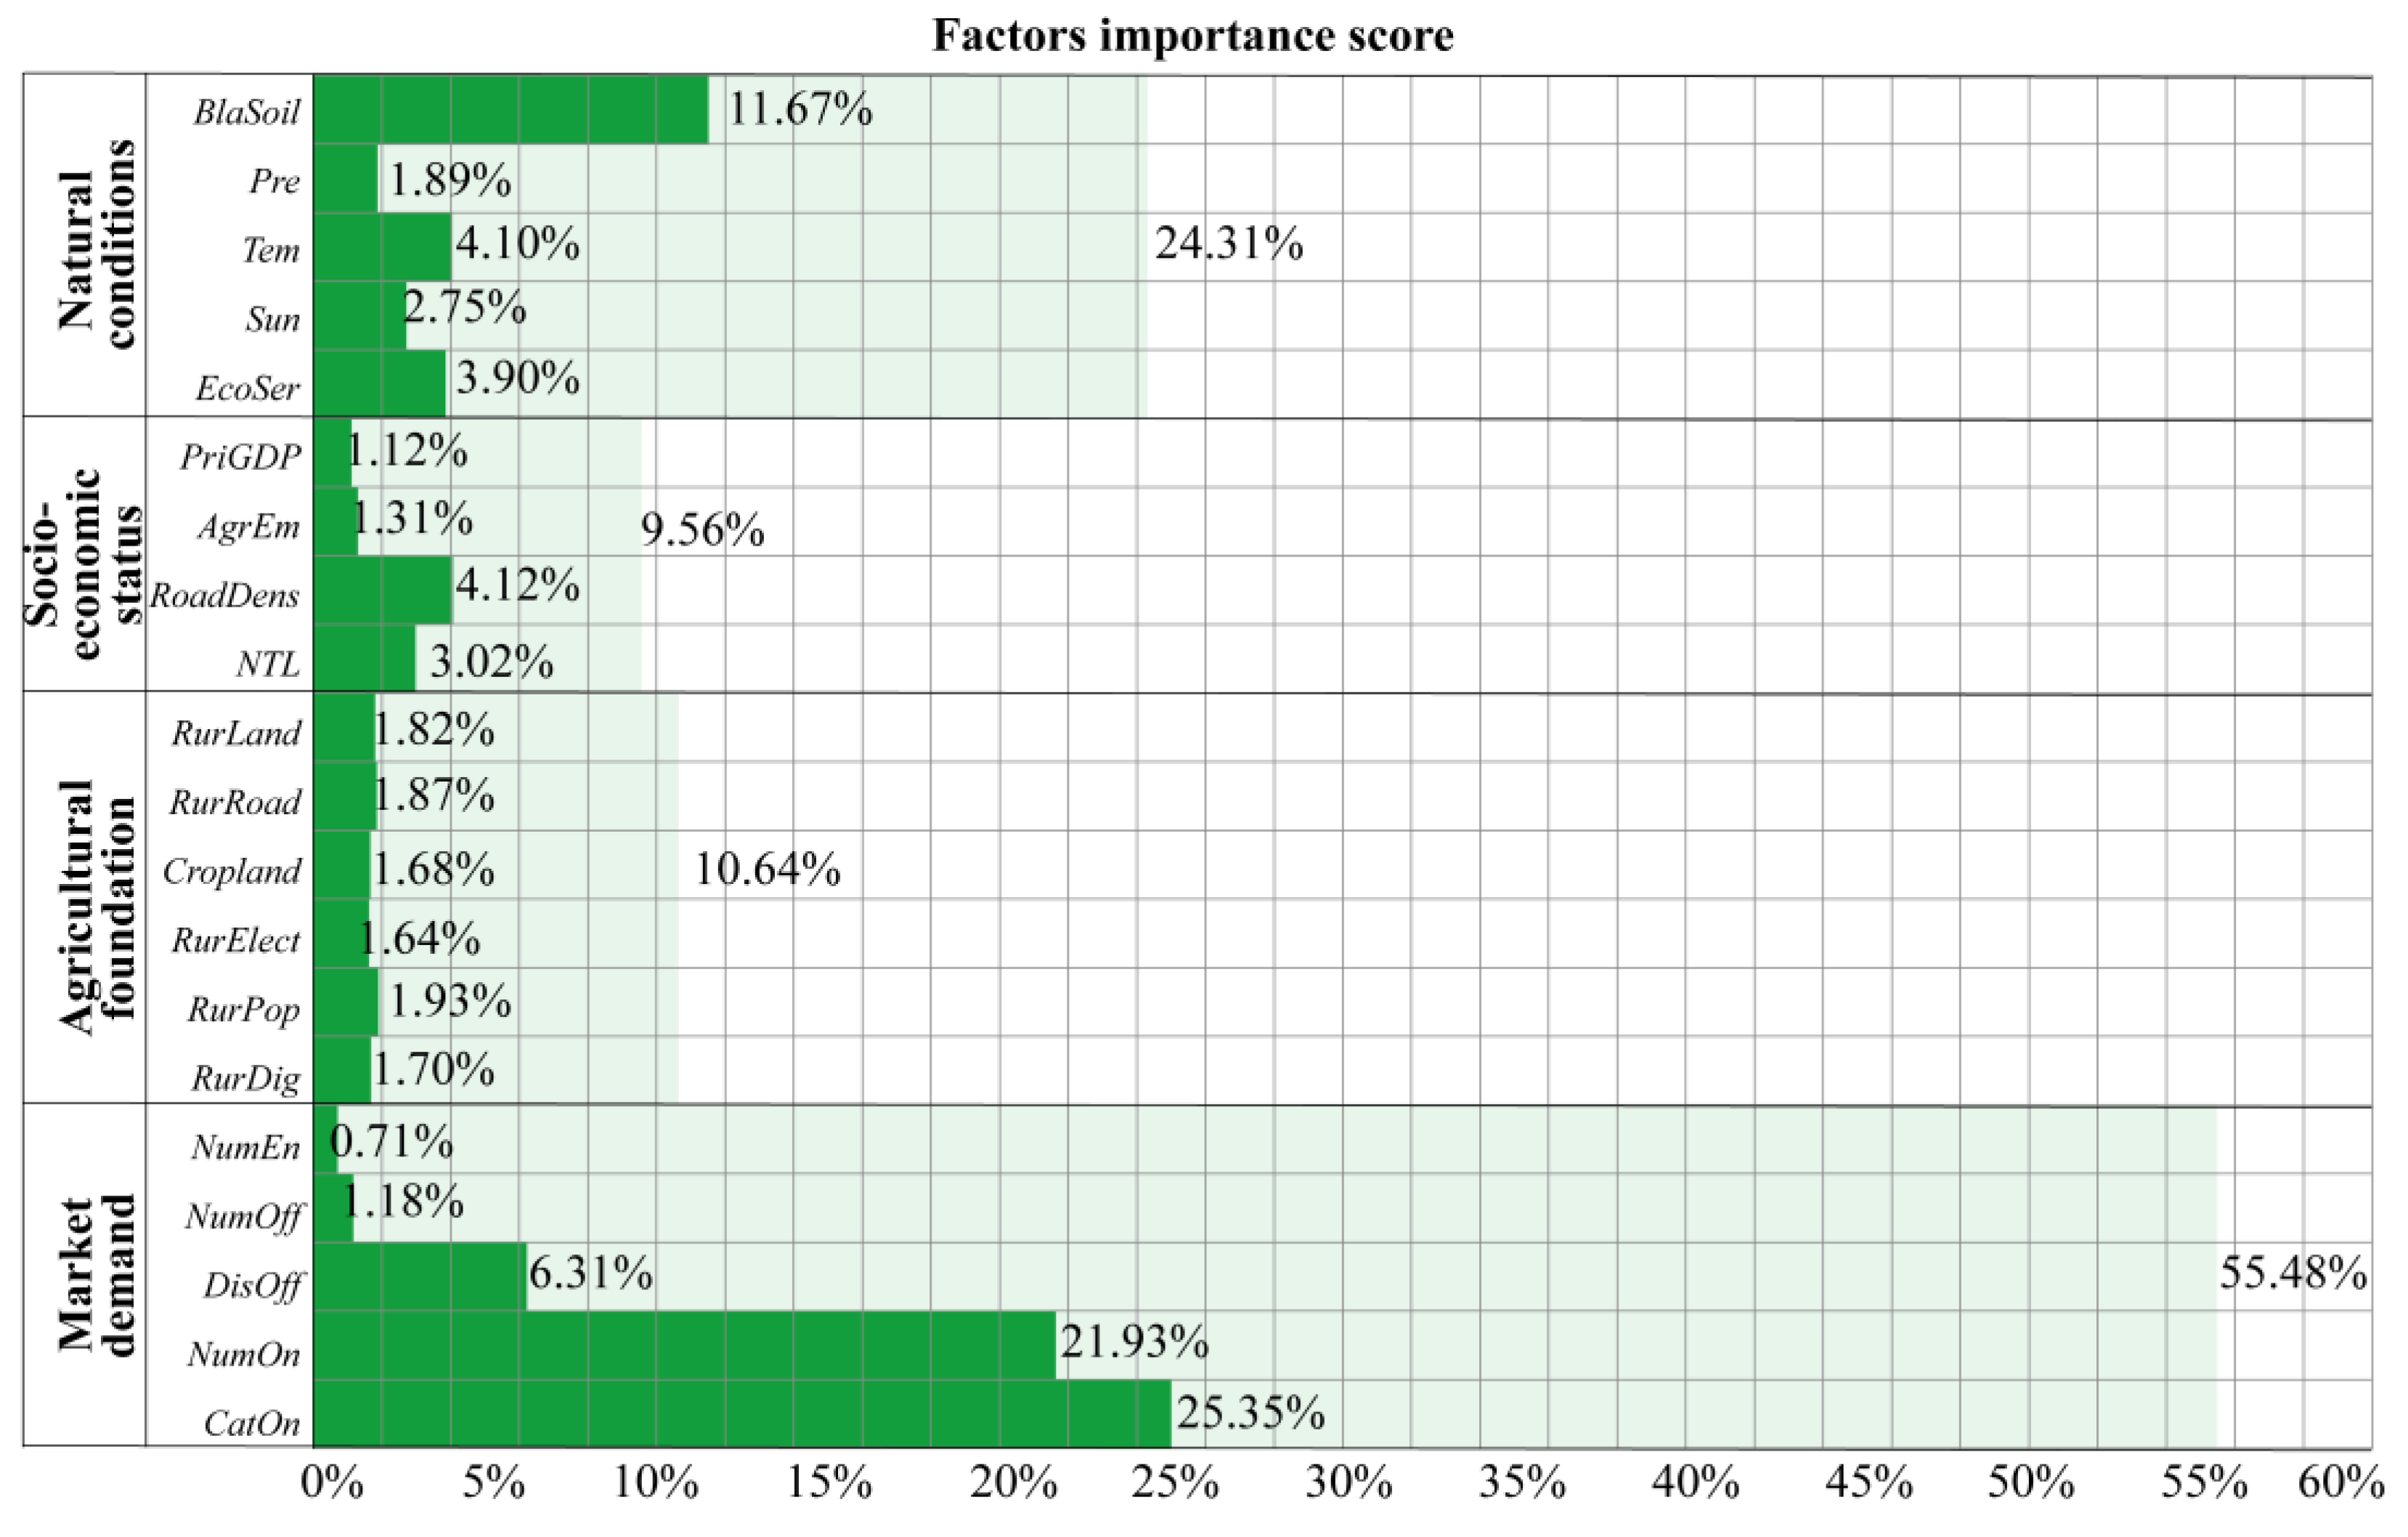
4.2. Interpreting the Effect of Determinants on GIAPs

4.2.1. Quantifying the Importance of Factors

The following Figure 5 presents how high each factor is in terms of its influence on the development of GIAPs. The total relative importance of all factors was 100%, and the ranking was based on relative importance. Analyzing the plot, it can be noticed that BlaSoil was highly correlated with GIAPs, explaining the relative importance of 11.67%. The importance score of Tem and EcoSer varied around 4%, while Pre and Sun explained only about 2% of GIAPs. Many studies say that natural conditions can be a predisposition for the development of GIAPs [30,64], but not necessarily. From this result, it can be confirmed that the natural conditions do not act as a decisive factor for promoting GIAPs. With respect to socioeconomic status, factors that directly reflect the regional economy (e.g., RoadDens and NTL) had similar predictive power, followed by statistical factors (e.g., PriGDP and AgrEm). Overall, the importance of socioeconomic status to the development of GIAPs did not exceed 10%. For agricultural foundation, all six factors played an equally, if not more, important role in the formation of GIAPs. The most noteworthy issue is that CatOn led by far the most in contributing 25.35% of this model’s output, followed by 21.93% of the NumOn and 6.31% of the DisOff, the collective contribution of which to the development of GIAPs was more than half. This finding shows the determinant of influencing GIAPs via market demand, especially online sales factors. Note that the NumEn and NumOff influenced the outcome least, meaning that offline sales may have a limited role in GIAPs.

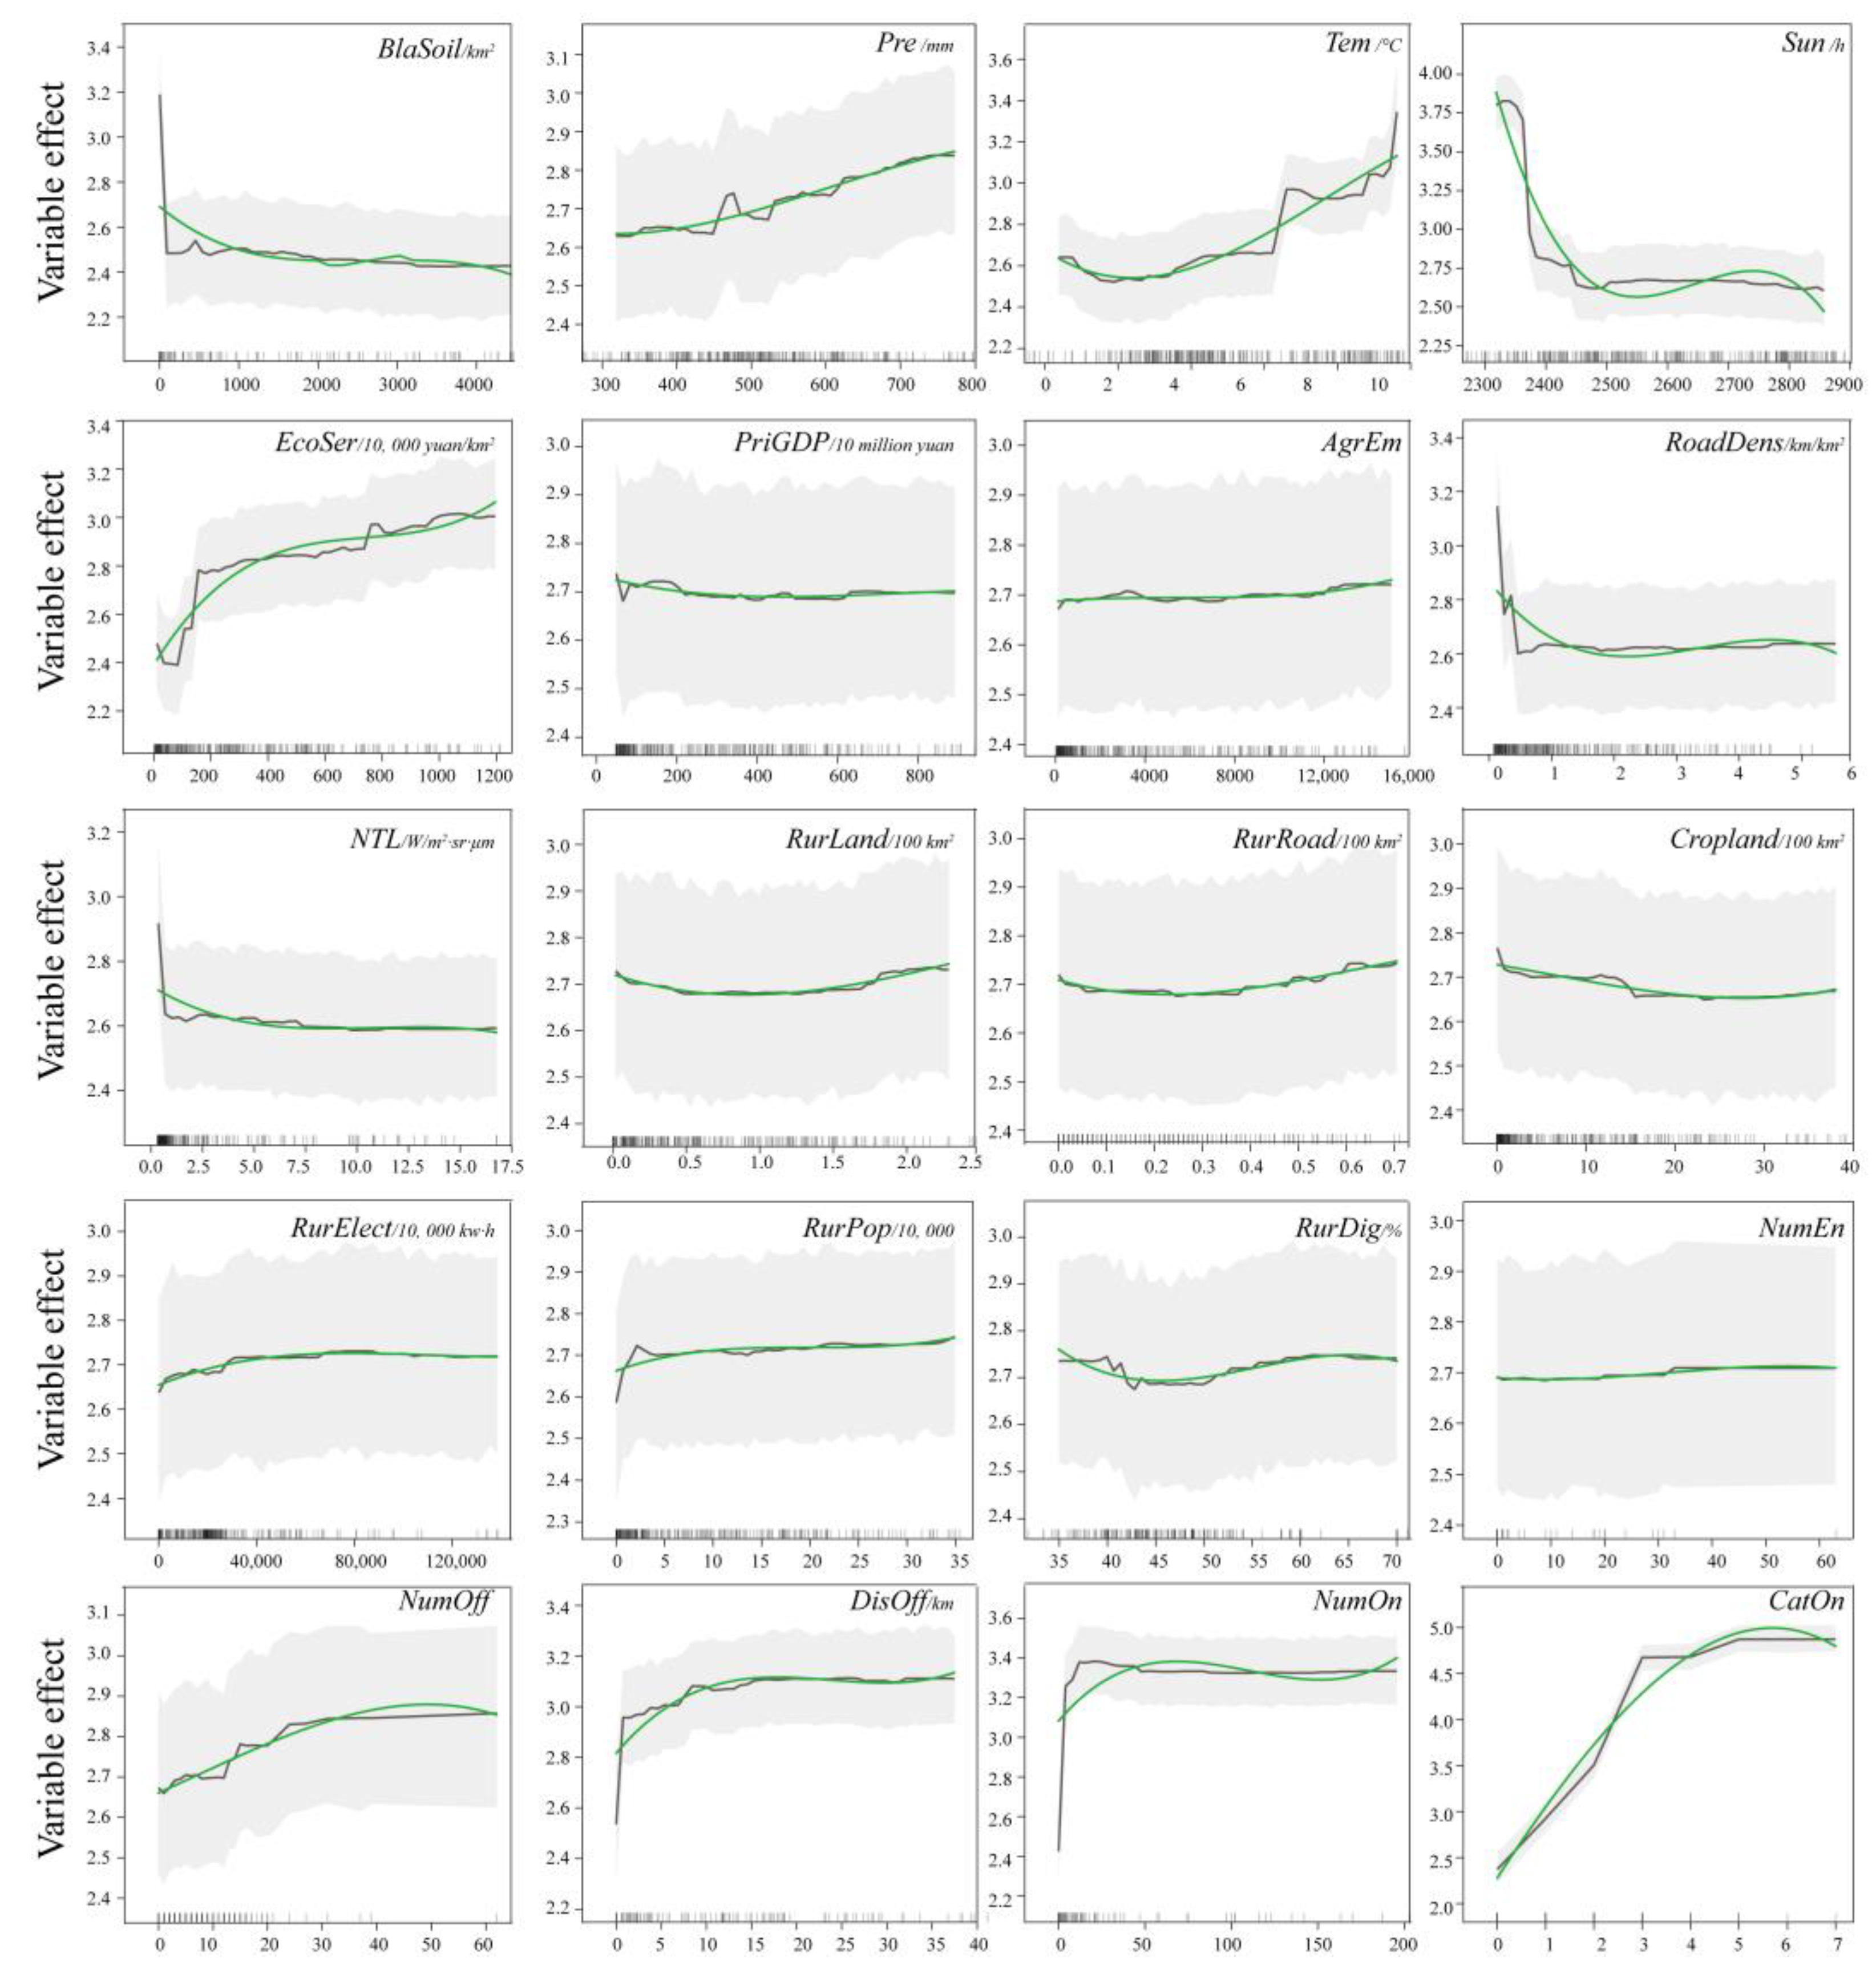
4.2.2. Evaluating the Average and Individual Effect of Factors

In order to better observe the average effect and individual sample variation, we put the PDP and ICE plots together, as shown in Figure 6. ICE visualizes the forecasted dependencies of samples for each variable, producing one line for the whole of the PDP (the grey line) and one fitted curve (the green line). The grey range is the 95% confidence interval for all samples of ICE, revealing sample heterogeneity.
From the natural conditions category, BlaSoil and SSD had negative effects on GIAPs as a whole, but Pre, Tem, and EcoSer were diametrically opposite. The partial dependence of GIAPs is strongly influenced when BlaSoil varied from 0 to approximately 100 km2, then there was almost no variation in GIAPs when BlaSoil was greater than 1000 km2. There was a positive correlation with GIAPs when Pre reached from 450 mm to 470 mm, although having a corresponding decline from 470 mm to 540 mm. Tem manifested two clear leaps at 6.1 °C and 8.8 °C. When Sun was less than 2450 h, the longer the sunshine duration, the fewer GIAPs. The EcoSer showed a positive effect on GIAPs, while when it reached around 2 billion yuan/km2, this effect slowed down. With respect to socioeconomic status, the effects of four factors were gentle, especially PriGDP and AgrEm. The effects of RoadDens and NTL both had a rapid decreasing effect on GIAPs at the initial increase, and then the effect diminished. As for factors in the agricultural foundation, the effects were weak and varied less, even though they themselves varied a lot. From market demand, GIAPs were deeply influenced by offline and online sales, while the number of enterprises using special GI was only weakly influenced. Along the DisOff, GIAPs exhibited significant variability with the most active increase occurring at around 1.5~15 km distance from offline markets, and much lower effects beyond 15 km. NumOn manifested a linear pattern and reached peaks around 20 online agricultural products, but the effect of the NumOn declined rapidly when it exceeded 20. Similar to the NumOn, the effect of the CatOn fluctuated strongly and attained higher values around five kinds of online agricultural products.

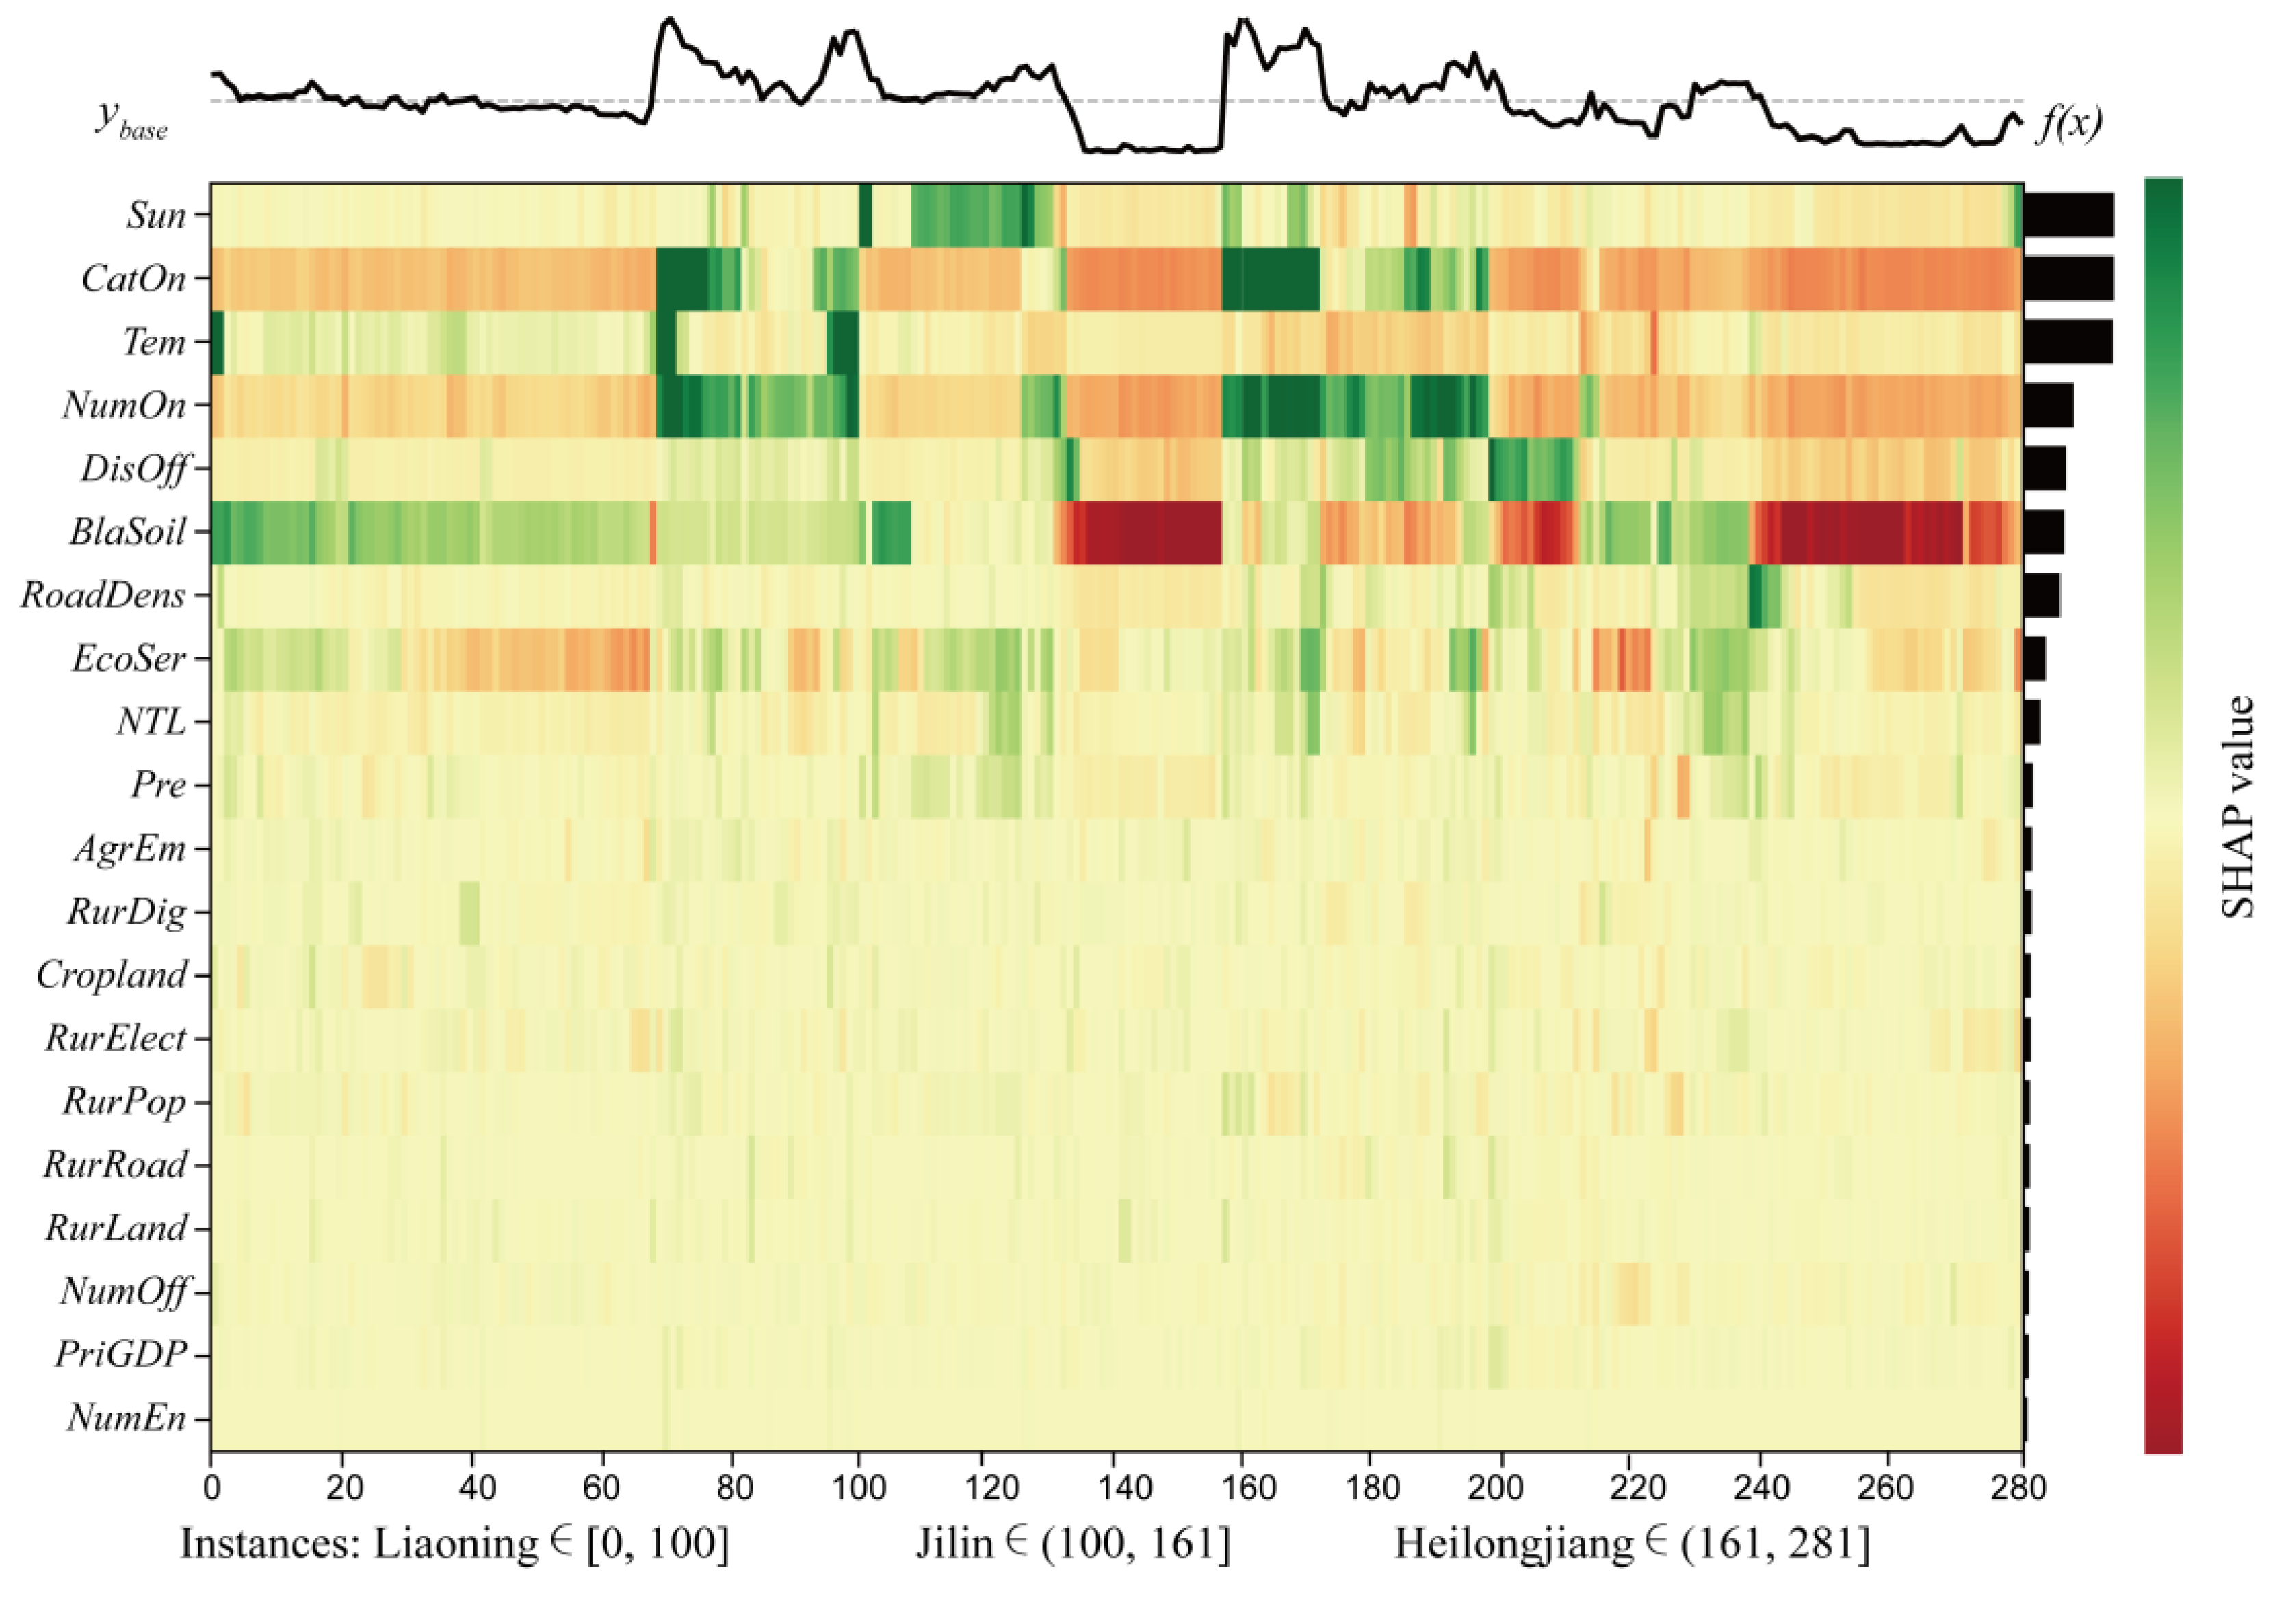
4.2.3. Interpreting the Heterogeneous Effect of Factors on Each Sample

We constructed beeswarm plots, which summarize the overall distribution of SHAP values for all samples (districts) and the directions of the effects. As showed in Figure 7, each point represents a SHAP value, which indicates the effect of a factor on a sample; as the SHAP value of a factor increases, its contribution toward the prediction of GIAPs increases. The red and green colors indicate low and high values of factors, respectively. From these plots, we observed that higher CatOn pushed districts to have higher odds of developing GIAPs (higher SHAP values). However, many districts produced few agricultural products (low values of CatOn), which reduced CatOn’s positive effect on GIAPs. Similar positive patterns were also seen for EcoSer, Tem, Pre, NumOff, RurPop, AgrEm, RurRoad, RurLand, and NumEn. The long top tails of several factors, such as CatOn and Tem, indicated rare risk factors with large effect scales. We also observed that BlaSoil, Sun, RoadDens, NTL, Cropland, and PriGDP showed negative relationships with GIAPs. Also, some factors, such as NumOn, DisOff, RurDig, and RurElect, showed a more complex correlation. The distribution of NOA indicated that many districts with fewer online agricultural products tended to be labeled with shortage area with GIAPs. But low NumOn values and a few high NumOn values were interspersed on the positive axis, denoting a non-linear and complicated impact on GIAPs.
The heatmap uses hierarchical clustering based on the explanation similarity, which helps to identify the SHAP value behind the same prediction for different samples. In our study, all samples were divided by province, and were applied in the heatmap (refer to Figure 8). Lower factors (from EcoSer to NumEn) have an inferior SHAP value on the model output. In contrast, the f(x) plot shows the samples where different SHAP values are observed for the same f(x) value.
Overall, the top three important factors were Sun, CatOn, and Tem, with heterogeneous effects. NumOn, DisOff, BlaSoil, and RoadDens were in the second tier of importance. Specifically, the SHAP value for Sun was in the upper middle for the samples from the 100th to the 130th, and both sides of the 160th, so it is clear that Sun had a weak contribution to a part of Jilin province. But in the rest of the samples the value tended to be moderate. Combined with the y b a s e results, the overall effect of Sun was weak. BlaSoil was often considered as a positive factor, however, GI use in Jilin Province, because of the negative effect of BlaSoil for the samples from the 125th to the 160th, lagged behind the other two provinces. For the samples after the 240th in Heilongjiang province, BlaSoil had a similar negative effect, keeping GIAPs well below the y b a s e . In addition, CatOn had a positive effect for the samples from the 157th to the 197th in Heilongjiang Province, which kept the development of GIAPs above the y b a s e . Such strongly highlighted variation led by determinants was also observed for NOA as well. The use of GIAPs in 40% of Liaoning Province (for the samples from the 68th to the 100th) were above the y b a s e , which was caused by the positive effect of CatOn and NumOn. And Tem showed a locally positive SHAP value for the samples in Liaoning, but a slightly negative SHAP value in other areas. The SHAP value of DisOff was high around the 130th and 200th samples, however, there was no clear variation in GIAPs of those districts, suggesting a general effect of this factor. RoadDens and EcoSer did not have a wide range of variation in SHAP values, so their effect on GI were relatively weak.

5. Discussion

This study aimed at investigating what determinants may enhance or limit the spatiality of local GIAPs. Our results unveil that it is possible to make a multi-factor and fine-scale evaluation of regions that obtained GI certification, with an interpretable learning approach. Factor importance suggests that natural conditions and market demand play a significant role in the development of local GIAPs, socioeconomic status and agricultural foundation to a lesser extent. In particular, black soil and the opportunity to sell online or offline are the main drivers for endorsing agricultural products through GI.
In theory, the emergence of GIAPs is foremost tied to the soil, climate, and hydrology in the environment where they are grown. Especially black soil, which is a typical soil of the Northeast region, has a high humus content that provides rich nutrients for crops. By doing so, the black soil produces high-quality agricultural products and local farmers have made great efforts to develop agriculture. Therefore, a series of natural conditions including black soil should be the determinants for ensuring the local agricultural product upgrade to GIAPs. Current utility means of the black soil region are, in fact, not sufficient to convert themselves into endogenous drivers of developing GIAPs. What is at the bottom of the result is, on the one hand, that the local villagers are reluctant to change their primitive cropping patterns concerning the marketing of GIAPs, so black soil is mainly occupied by food crops, making the cultivation of cash crops limited; but on the other, that the smallholder farming model of cash crops makes it impossible to create scale, thus making it difficult to attract investors and buyers. Therefore, black soil has an inverse effect on GI use, and indirectly spurs economic downturn and population loss. These findings reveal that a single high-quality, or high-yield bulk plantation does not bring real benefits to farmers, and the role of contextual conditions is not fully exploited in this case.
Looking at the market factor, we found a positive relationship between GIAPs and their markets, with more opportunities for online and offline sales, hence more local GIAPs, but disparities existed among the regions. This is evidenced by examples of increasing consumer demand for certified products as national educational attainment and economic opportunities are enhanced, in tandem with public advocacy on safe food. Because of the tag attribute, GIAPs reduce information inequality in a market economy, are regarded as a credit product, and make consumers access a product’s information more easily than searching for product and experiencing a product, thus making it more popular with consumers from an information economics perspective. Scholars [65,66] have proved that the certified products with information value and sustainability attributes have great market potential, and consumers are more enthusiastic after introducing them to the market (supermarkets and related formal markets). Furthermore, as a new form of e-commerce, live streaming has many advantages: producers can push agricultural products from geographical space to cyberspace, and cultivate fans of products by live streaming. Meanwhile, feedback from fans can also help improve product quality and brand value, and promote the upgrading of traditional products to cultural and creative products. This form has broadened the market for agricultural products and garnered word-of-mouth.

6. Conclusions

In this study we have attempted to provide a comprehensive understanding of the factors associated with the spatial pattern of GIAPs in district/county units. Exploiting an interpretability approach that reveals physical mechanisms from black box models such as the RF algorithm, we simultaneously explored the complex and non-linear role of different factors.
Beyond suggesting similar conclusions with former research that natural resources, socioeconomic status, and the agricultural foundation are basic contributors to the GI use, this study revealed that the determinants of regional propensity of GIAPs are market demand, including online and offline sales. On the one hand, the advantages of black soil are not fully exploited under conventional cropping systems. On the other hand, online and offline sales positively influence the protection of GIAPs. Public demand for high-end agricultural products is gradually increasing, and public recognition of supermarkets and live streaming shortens the distance between agricultural products and consumers.
More generally, the lesson learned from the drivers explaining the establishment of GI allows policymakers to reflect on which determinants may enhance or constrain rural sustainable development to envisage policy interventions. An integrated diagnosis of the territorial factor is the starting point to understanding under which conditions agricultural product-oriented policies, such as GI, are likely to be successful, and, consequently, which are the structural bottlenecks that should be targeted by policy strategies. We suggest notably focusing on three key objectives: (1) Developing GI on a local foundation, e.g., fertile black soil and high-quality agricultural products. In general, existing or suitable agricultural products should be the preferred choice for conversion to GI products, rather than ignoring their own conditions to follow trends. Operating the same crop devalues and is detrimental to local development. (2) Leveraging regional advantages to stimulate GI to industry scale. Positive factors, such as market demand and e-commerce factors should be paid more attention to trigger positive effects on the GI tool. Favorable factors cannot simply be transferred from one location to another, but need to be carefully adjusted to different realities. For example, choosing the right promotion approaches according to the characteristics of the agricultural product and the market base; supporting the e-commerce of agricultural products by setting up an e-commerce department; or strengthening the link between the market and the producers to avoid price differences. All in all, local governments can make use of the positive effects that already exist and allow farmers to promote GIAPs based on local conditions. (3) Turning unfavorable conditions into favorable ones. For those areas that are heavily constrained by unfavorable factors, farmers can choose crops that are better suited to the production conditions of the area to replace the original ones or use technological means to compensate for certain local conditions.
The analysis in our study can be considered a preliminary step towards a better understanding of the mechanisms lying behind the spatiality of GIAPs and their actual functioning. At the same time, applying the interpretable ML approach, this analysis can be seen as a useful complement to the evidence collected by other GI studies. In this way, the policy maker can have a more comprehensive view of the policy, being informed about both general and specific dynamics. Regarding the analysis at a macro scale, multiple paths are open for future research. There is still the need to refine the study scale from the broader region into the specific area where GIAPs are grown, considering also potential GIAPs. Furthermore, the existence of possible differences in the dynamics that GI use has in different regional contexts could be investigated.

Author Contributions

Siqi Luo: conceptualization, methodology, software, visualization, writing—original draft preparation, writing—reviewing and editing. Yanji Ma: investigation, supervision, validation. Tianli Wang: data curation. All authors have read and agreed to the published version of the manuscript.

Funding

The research was sponsored by the Strategic Priority Research Program of the Chinese Academy of Sciences under Grant number XDA28070501.

Data Availability Statement

Not applicable.

Acknowledgments

We would like to thank the investigators for their efforts with the statistical data.

Conflicts of Interest

The authors declare no conflict of interest.

References

  1. Liu, Y.; Li, Y. Revitalize the World’s Countryside. Nature 2017, 548, 275–277. [Google Scholar] [CrossRef] [PubMed]
  2. FAO (Ed.) Leveraging Food Systems for Inclusive Rural Transformation; The State of Food and Agriculture; Food and Agriculture Organization of the United Nations: Rome, Italy, 2017; ISBN 978-92-5-109873-8. [Google Scholar]
  3. Nizam, D.; Tatari, M.F. Rural Revitalization through Territorial Distinctiveness: The Use of Geographical Indications in Turkey. J. Rural. Stud. 2022, 93, 144–154. [Google Scholar] [CrossRef]
  4. Vandecandelaere, E.; Arfini, F.; Belletti, G.; Marescotti, A. Linking People, Places and Products: A Guide for Promoting Quality Linked to Geographical Origin and Sustainable Geo-Graphical Indications; FAO: Rome, Italy, 2009; ISBN 978-92-5-106656-0. [Google Scholar]
  5. Milano, M.Z.; Cazella, A.A. Environmental Effects of Geographical Indications and Their Influential Factors: A Review of the Empirical Evidence. Curr. Res. Environ. Sustain. 2021, 3, 100096. [Google Scholar] [CrossRef]
  6. Bérard, L.; Marchenay, P. Local Products and Geographical Indications: Taking Account of Local Knowledge and Biodiversity. Int. Soc. Sci. J. 2006, 58, 109–116. [Google Scholar] [CrossRef]
  7. Vakoufaris, H.; Gocci, A. Geographical Indications and Sustainable Development: An Assessment of Four Categories of Products from the Fruit and Vegetable Sector of the Eu. Food Rev. Int. 2022, 39, 1–14. [Google Scholar] [CrossRef]
  8. Mesić, Ž.; Božić, M.; Cerjak, M. The Impact of Geographical Indications on the Competitiveness of Traditional Agri-Food Products. J. Cent. Eur. Agric. 2017, 18, 1–14. [Google Scholar] [CrossRef]
  9. Suh, J.; MacPherson, A. The Impact of Geographical Indication on the Revitalisation of a Regional Economy: A Case Study of ‘Boseong’ Green Tea. Area 2007, 39, 518–527. [Google Scholar] [CrossRef]
  10. Resano, H.; Sanjuán, A.I.; Albisu, L.M. Consumers’ Response to the EU Quality Policy Allowing for Heterogeneous Preferences. Food Policy 2012, 37, 355–365. [Google Scholar] [CrossRef]
  11. Deselnicu, O.C.; Costanigro, M.; Souza-Monteiro, D.M.; McFadden, D.T. A Meta-Analysis of Geographical Indication Food Valuation Studies: What Drives the Premium for Origin-Based Labels? J. Agric. Resour. Econ. 2013, 38, 204–219. [Google Scholar]
  12. Menapace, L.; Moschini, G.C. Strength of Protection for Geographical Indications: Promotion Incentives and Welfare Effects. Am. J. Agric. Econ. 2014, 96, 1030–1048. [Google Scholar] [CrossRef]
  13. Lamarque, P.; Lambin, E.F. The Effectiveness of Marked-Based Instruments to Foster the Conservation of Extensive Land Use: The Case of Geographical Indications in the French Alps. Land Use Policy 2015, 42, 706–717. [Google Scholar] [CrossRef]
  14. Belletti, G.; Marescotti, A.; Sanz-Cañada, J.; Vakoufaris, H. Linking Protection of Geographical Indications to the Environment: Evidence from the European Union Olive-Oil Sector. Land Use Policy 2015, 48, 94–106. [Google Scholar] [CrossRef]
  15. World Trade Organization. Available online: https://www.wto.org/english/tratop_e/trips_e/trips_e.htm (accessed on 17 September 2023).
  16. Li, L. Research on the Brand Preference Formation Mechanism of the Agricultural Product Geographical Indication: From the Perspective of Geographical Relationship. Ph.D. Dissertation, Huazhong Agricultural University, Wuhan, China, 2022. [Google Scholar]
  17. García-Hernández, C.; Ruiz-Fernández, J.; Rodríguez-Gutiérrez, F. Geographical Indications in Cheese Mountain Areas: Opportunity or Threat to Landscape and Environmental Conservation? The Case of Cabrales (Spain). Appl. Geogr. 2022, 146, 102753. [Google Scholar] [CrossRef]
  18. Xian, Y.; Liu, G.; Zhong, L. Will Citrus Geographical Indications Face Different Climate Change Challenges in China? J. Clean. Prod. 2022, 356, 131885. [Google Scholar] [CrossRef]
  19. Shiu, J.Y.; Liao, S.T.; Tzeng, S.-Y. How Does Online Streaming Reform E-Commerce? An Empirical Assessment of Immersive Experience and Social Interaction in China. Humanit. Soc. Sci. Commun. 2023, 10, 224. [Google Scholar] [CrossRef]
  20. Tian, H.; Lee, Y. Factors Affecting Continuous Purchase Intention of Fashion Products on Social E-Commerce: SOR Model and the Mediating Effect. Entertain. Comput. 2022, 41, 100474. [Google Scholar] [CrossRef]
  21. Ministry of Commerce of the People’s Republic of China. Available online: http://ipr.mofcom.gov.cn/hwwq_2/chn_eu_gi/file/EN.pdf (accessed on 17 September 2023).
  22. European Commission. Available online: https://agriculture.ec.europa.eu/common-agricultural-policy/cap-overview/cmef/products-and-markets/value-production-agricultural-products-and-foodstuffs-wines-aromatised-wines-and-spirits-protected_en (accessed on 17 September 2023).
  23. Heilongjiang News. Available online: http://epaper.hljnews.cn/hljrb/pc/layout/202305/16/node_01.html (accessed on 17 September 2023).
  24. AliResearch. Available online: http://www.aliresearch.com/ch/information/informationdetails?articleCode=306957980434305024&type=%E6%96%B0%E9%97%BB (accessed on 17 September 2023).
  25. Gangjee, D.S. Proving Provenance? Geographical Indications Certification and Its Ambiguities. World Dev. 2017, 98, 12–24. [Google Scholar] [CrossRef]
  26. Haeck, C.; Meloni, G.; Swinnen, J. The Value of Terroir: A Historical Analysis of the Bordeaux and Champagne Geographical Indications. Appl. Econ. Perspect. Policy 2019, 41, 598–619. [Google Scholar] [CrossRef]
  27. Liu, J.; Huang, Y.; Wang, Y.; Wu, M. Spatial-temporal Distribution Characteristics and Humanistic Causes of Geographical Indication Agricultural Products in Hunan Province. Econ. Geogr. 2022, 42, 169–176+215. [Google Scholar] [CrossRef]
  28. Xie, Y.; Wang, C.; Wu, A. Spatiotemporal Evolution and Interactive Effects of Geographical Indication Agricultural Products and Agricultural Economy. Sci. Geogr. Sin. 2022, 42, 1577–1587. [Google Scholar] [CrossRef]
  29. Parrott, N.; Wilson, N.; Murdoch, J. Spatializing Quality: Regional Protection and the Alternative Geography of Food. Eur. Urban Reg. Stud. 2002, 9, 241–261. [Google Scholar] [CrossRef]
  30. Cei, L.; Stefani, G.; Defrancesco, E. How Do Local Factors Shape the Regional Adoption of Geographical Indications in Europe? Evidences from France, Italy and Spain. Food Policy 2021, 105, 102170. [Google Scholar] [CrossRef]
  31. Maró, Z.M.; Balogh, P.; Czine, P.; Török, Á. The Roles of Geographic Indication and Ethnocentrism in the Preferences of Central European Spirit Consumers: The Case of Pálinka. Food Qual. Prefer. 2023, 108, 104878. [Google Scholar] [CrossRef]
  32. Xiong, Z.; Wu, Q. Research on Financial Support for Industrialization of Geographical Indication Products of Yellow plum Lotus Leaf Tea under the Background of Rural Revitalization. Mod. Bus. 2023, 6, 19–22. [Google Scholar] [CrossRef]
  33. Wang, H.; Qin, W. Research on the Spatial Distribution and Agglomeration Characteristics of Geographical Indication Products in China. World Reg. Stud. 2023, 32, 157–166. [Google Scholar]
  34. Wang, J.; Xue, Y.; Wang, P.; Chen, J.; Yao, L. Participation Mode and Production Efficiency Enhancement Mechanism of Geographical Indication Products in Rural Areas: A Meta-Frontier Analysis. Phys. Chem. Earth Parts A/B/C 2021, 121, 102982. [Google Scholar] [CrossRef]
  35. Yan, Q. Study on Spatio-temporal Soupling between Agricultural Economy Growing and Geographic Indication Products of Agricultural Developing Guangxi. Master’s Dissertation, Nanning Normal University, Nanning, China, 2020. [Google Scholar]
  36. Crozet, M.; Head, K.; Mayer, T. Quality Sorting and Trade: Firm-Level Evidence for French Wine. Rev. Econ. Stud. 2012, 79, 609–644. [Google Scholar] [CrossRef]
  37. Qian, W.; Dong, Y. The Promoting Effect of Mutual Recognition of Geographical Indications between China and Europe on China’s Agricultural Exports—A Mechanism Research from a “Dual Circulation” Perspective. J. Int. Trade 2023, 6, 121–138. [Google Scholar] [CrossRef]
  38. Zhang, W. Business and Service Location Theory. In Economic Geography; Li, X., Ed.; Higher Education Press: Beijing, China, 2006; pp. 94–100. [Google Scholar]
  39. Guo, J.; Jin, S.; Zhao, J.; Wang, H.; Zhao, F. Has COVID-19 Accelerated the E-Commerce of Agricultural Products? Evidence from Sales Data of E-Stores in China. Food Policy 2022, 112, 102377. [Google Scholar] [CrossRef]
  40. Ma, W.; Abdulai, A. The Economic Impacts of Agricultural Cooperatives on Smallholder Farmers in Rural China. Agribusiness 2017, 33, 537–551. [Google Scholar] [CrossRef]
  41. Marcello, D.R.; Felice, A.; Yari, V. Building up Collective Actions to Qualify GIs. Land Use Policy 2017, 66, 340–345. [Google Scholar] [CrossRef]
  42. Pantera, A.; Burgess, P.J.; Mosquera Losada, R.; Moreno, G.; López-Díaz, M.L. Agroforestry for High Value Tree Systems in Europe. Agroforest Syst. 2018, 92, 945–959. [Google Scholar] [CrossRef]
  43. Dentoni, D.; Menozzi, D.; Capelli, M.G. Group Heterogeneity and Cooperation on the Geographical Indication Regulation: The Case of the ”Prosciutto Di Parma” Consortium. Food Policy 2012, 37, 207–216. [Google Scholar] [CrossRef]
  44. Quinones-Ruiz, X.F.; Penker, M.; Belletti, G.; Marescotti, A.; Scaramuzzi, S. Why Early Collective Action Pays off: Evidence from Setting Protected Geographical Indications. Renew. Agric. Food Syst. 2017, 2, 179. [Google Scholar] [CrossRef]
  45. Nyagaka, D.; Obare, G.; Omiti, J.; Nguyo, W. Technical Efficiency in Resource Use: Evidence from Smallholder Irish Potato Farmers in Nyandarua North District, Kenya. Afr. J. Agric. Res. 2010, 5, 1179–1186. [Google Scholar]
  46. Hoang, G.; Le, H.T.T.; Nguyen, A.H.; Dao, Q.M.T. The Impact of Geographical Indications on Sustainable Rural Development: A Case Study of the Vietnamese Cao Phong Orange. Sustainability 2020, 12, 4711. [Google Scholar] [CrossRef]
  47. Liao, Y. The Influence of the Development of Agricultural Products of Geographical Indication on the Farmers’ Income Growth: Spatial Spillover Effect and Regional Heterogeneity. J. Hunan Agric. Univ. 2021, 22, 26–33. [Google Scholar] [CrossRef]
  48. Wang, H.; Du, G. The Spatial Distribution of Geographical Indications and Agricultural Economic Growth in China. East China Econ. Manag. 2021, 35, 82–90. [Google Scholar] [CrossRef]
  49. Zhang, H.; Du, Z.; Zhang, S.; Yan, X. Reasearch on Spatial Differentiation of Agricultural Products in Liaoning Province Based on ArcGIS and GD. Chin. J. Agric. Resour. Reg. Plan. 2022, 1, 253–264. [Google Scholar]
  50. Jato-Espino, D.; Mayor-Vitoria, F. A Statistical and Machine Learning Methodology to Model Rural Depopulation Risk and Explore Its Attenuation through Agricultural Land Use Management. Appl. Geogr. 2023, 152, 102870. [Google Scholar] [CrossRef]
  51. Zhang, P.; Hu, S.; Li, W.; Zhang, C.; Yang, S.; Qu, S. Modeling Fine-Scale Residential Land Price Distribution: An Experimental Study Using Open Data and Machine Learning. Appl. Geogr. 2021, 129, 102442. [Google Scholar] [CrossRef]
  52. Alpaydin, E. Adaptive Computation and Machine Learning. In Introduction to Machine Learning; The MIT Press: Cambridge, MA, USA, 2020. [Google Scholar]
  53. Xu, X.Z.; Xu, Y.; Chen, S.C.; Xu, S.G.; Zhang, H.W. Soil Loss and Conservation in the Black Soil Region of Northeast China: A Retrospective Study. Environ. Sci. 2010, 13, 793–800. [Google Scholar] [CrossRef]
  54. Li, D.; Yang, Y.; Du, G.; Huang, S. Understanding the Contradiction between Rural Poverty and Rich Cultivated Land Resources: A Case Study of Heilongjiang Province in Northeast China. Land Use Policy 2021, 108, 105673. [Google Scholar] [CrossRef]
  55. Ma, L.; Zhang, Q.; Wästfelt, A.; Wang, S. Understanding the Spatiality of the Rural Poor’s Livelihoods in Northeast China: Geographical Context, Location and Urban Hierarchy. Appl. Geogr. 2023, 152, 102865. [Google Scholar] [CrossRef]
  56. Breiman, L. Random Forests. Mach. Learn. 2001, 45, 5–32. [Google Scholar] [CrossRef]
  57. Li, T.; Zhang, Q.; Peng, Y.; Guan, X.; Li, L.; Mu, J.; Wang, X.; Yin, X.; Wang, Q. Contributions of Various Driving Factors to Air Pollution Events: Interpretability Analysis from Machine Learning Perspective. Environ. Int. 2023, 173, 107861. [Google Scholar] [CrossRef] [PubMed]
  58. Zhang, Y.-F.; Ren, W.; Wang, W.-L.; Li, N.; Zhang, Y.-X.; Li, X.-M.; Li, W.-H. Interpretable Hardness Prediction of High-Entropy Alloys through Ensemble Learning. J. Alloys Compd. 2023, 945, 169329. [Google Scholar] [CrossRef]
  59. Mei, L.; Jiang, H. The Spatial Differentiation Process, Factors and Trends of B&B in Beijing Based on Airbnb Data. Econ. Geogr. 2021, 41, 213–222. [Google Scholar] [CrossRef]
  60. Zhao, Q.; Hastie, T. Causal Interpretations of Black-Box Models. J. Bus. Econ. Stat. 2021, 39, 272–281. [Google Scholar] [CrossRef]
  61. Li, M.; Yang, Y.; He, Z.; Guo, X.; Zhang, R.; Huang, B. A Wind Speed Forecasting Model Based on Multi-Objective Algorithm and Interpretability Learning. Energy 2023, 269, 126778. [Google Scholar] [CrossRef]
  62. Lundberg, S.M.; Lee, S.-I. A Unified Approach to Interpreting Model Predictions. In Proceedings of the 31st International Conference on Neural Information Processing Systems, Montreal, QC, Canada, 2–7 November 2018; Curran Associates Inc.: Red Hook, NY, USA, 2017; pp. 4768–4777. [Google Scholar]
  63. Bogdanovic, B.; Eftimov, T.; Simjanoska, M. In-Depth Insights into Alzheimer’s Disease by Using Explainable Machine Learning Approach. Sci. Rep. 2022, 12, 6508. [Google Scholar] [CrossRef]
  64. Vandecandelaere, E.; Samper, L.F.; Rey, A.; Daza, A.; Mejía, P.; Tartanac, F.; Vittori, M. The Geographical Indication Pathway to Sustainability: A Framework to Assess and Monitor the Contributions of Geographical Indications to Sustainability through a Participatory Process. Sustainability 2021, 13, 7535. [Google Scholar] [CrossRef]
  65. Bergleiter, S.; Meisch, S. Certification Standards for Aquaculture Products: Bringing Together the Values of Producers and Consumers in Globalised Organic Food Markets. J. Agric. Environ. Ethics 2015, 28, 553–569. [Google Scholar] [CrossRef]
  66. Arthur, H.; Thornton, A.; Tranter, P. Private Actors and Food Safety Governance in the Accra City Region: Implications for Local Food Policy. Cities 2022, 131, 104069. [Google Scholar] [CrossRef]
Figure 1. Flowchart of the overall methodology. In 2. Choosing a ML algorithm, the red dots in the first row are features, which are continuously divided into two categories (red dots and gray dots) according to the feature value until they can no longer be divided (green dots).
Ijgi 12 00442 g001
Figure 2. Geographical situation of the study area.
Ijgi 12 00442 g002
Figure 3. The results of different ML algorithms for prediction of GIAPs, where RF obtains the best prediction results.
Ijgi 12 00442 g003
Figure 4. Spatiotemporal distribution of GIAPs in Northeast China.
Ijgi 12 00442 g004
Figure 5. Random forest importance of each factor.
Ijgi 12 00442 g005
Figure 6. Random forest PDP/ICE.
Ijgi 12 00442 g006
Figure 7. The SHAP values computed for local explanations.
Ijgi 12 00442 g007
Figure 8. The heatmap based on SHAP value in Northeast China.
Ijgi 12 00442 g008
Table 1. The predictive factors used to drive ML models and their specifications.
GroupFactorIllustrate
Natural conditionsBlaSoilArea of typical black soil region in each district (km2)
PreMean precipitation in each district (mm)
TemMean temperature in each district (°C)
SunMean sunshine duration in each district (h)
EcoSerEcological service value in each district (10,000 yuan/km2)
Socioeconomic statusPriGDPValue-added of primary industry in each district (10 million yuan)
AgrEmNumber of agricultural employees in each district
RoadDensRatio of road length to area in each district (km/km2)
NTLMean nighttime light in each district (W/m2·sr·μm)
Agricultural foundationRurLandRural land area in each district (100 km2)
RurRoadRural road area in each district (100 km2)
CroplandCropland acreage in each district (100 km2)
RurElectRural electricity consumption in each district (10,000 kW·h)
RurPopRural population in each district
RurDigCounty digital rural Index (%)
Market demandNumEnNumber of enterprises using special GI in each district
NumOffNumber of offline markets in each district
DisOffDistance of offline markets in each district (km)
NumOnNumber of online agricultural product in each district
CatOnCategory of online agricultural product in each district
Disclaimer/Publisher’s Note: The statements, opinions and data contained in all publications are solely those of the individual author(s) and contributor(s) and not of MDPI and/or the editor(s). MDPI and/or the editor(s) disclaim responsibility for any injury to people or property resulting from any ideas, methods, instructions or products referred to in the content.

