Abstract
With the sustainable and coordinated development of cities, the formulation of urban street policies requires multiangle analysis. In regard to the existing street research, a large number of studies have focused on specific landscapes or accessibility of streets, and there is a lack of research on the multiple functions of streets. Recent advances in sensor technology and digitization have produced a wealth of data and methods. Thus, we may comprehensively understand streets in a less labor-intensive way, not just single street functions. This paper defines an index system of the multiple functions of urban streets and proposes a framework for multifunctional street measurement. Via the application of deep learning to Baidu Street View (BSV) imagery, we generate three functions, namely, landscape, traffic, and economic functions. The results indicate that street facilities and features are suitably identified. According to the multifunctional perspective, this paper further classifies urban streets into multifunctional categories and provides targeted policy recommendations for urban street planning. There exist correlations among the various street functions, and the correlation between the street landscape and economic functions is highly significant. This framework can be widely applied in other countries and cities to better understand street differences in various cities.
1. Introduction
As a microscale component of human settlements and basic unit of the pedestrian environment, streets yield an important impact on establishing a pedestrian city [1]. Therefore, streets have been widely studied by scholars in China and abroad. A good street environment may alleviate urban traffic pressure, maintain the ecological environment, stimulate street vitality, and effectively improve the frequency of resident sports activities [2,3]. However, as a kind of urban land, streets also exhibit a variety of functions. Only examining the walkability of streets [4] or the urban street environment is insufficient.
The concept of multifunctional land originates from the Sustainability Impact Assessment: Tools for Environmental, Social, and Economic Effects of Multifunctional Land Use in European Regions (SENSOR) (part of the sixth research framework program), which mainly refers to the environmental, social, and economic effects of land use. The original concept of multiple functions stems from early agricultural and ecosystem research [5,6,7]. With the development of the sustainable theory in the 1990s, this concept gradually expanded from the agricultural field to include multiple sustainable land use functions [8,9], which has enriched the scope of multifunctional research [10,11].
With the development of urbanization, 70% of the global population is expected to live in urban areas by 2050. Faced with a continuously increasing urban land demand, the sustainable use of limited urban land is becoming increasingly important [12], and spatial optimization has increasingly been included in government agendas. The functional diversity of the urban internal space should also be considered by the government and researchers [13,14]. Based on the multiple functions of land use, this paper proposes various functions of the urban internal public space, namely, landscape, traffic, and economic functions. At present, research on multiple functions is mostly macroscopic [7,10]. The research scale is large, data acquisition is challenging, and the accuracy is low. Therefore, there is a lack of urban-scale research.
The landscape function of streets notably improves the urban environment and benefits the sustainable development of cities [14,15], so this function has been widely considered. The function of the street landscape is mainly determined by the factors that make people feel safe and comfortable, such as green vegetation and the vastness of the sky. However, there is still a lack of objective and accurate street landscape functional measurement methods. In traditional street research, the methods of on-the-spot observations and questionnaire surveys have usually been adopted, which consume considerable manpower and material resources but also exhibit the problems of an approximate research scale and low research precision [16]. The main reason is that people’s perception is subjective, and the traditional way lacks the objective measurement of human perception such as vision. Research based on traditional data is limited by bottlenecks, and the application of big data to street research has become the general trend [17,18,19].
With the exponential growth of the global data volume, the era of big data has arrived [20]. The advancement of electronic sensors has enabled small-scale urban street research. In recent years, emerging panoramic image collections (such as Google Street View (GSV) and Baidu Street View (BSV)) have provided new data sources for traditional street research [21]. The research scope of street view pictures is wide and may cover whole cities. The contained information also objectively reflects the visual perception of humans, which is not influenced by the subjective consciousness [22,23]. However, it is difficult to extract information from street view images, which is the main technical challenge in current street research [24]. Automated recognition and processing of street view images will become the development trend of future urban street research [25,26].
At present, the analysis models of street views mainly include instance and semantic segmentation models based on deep learning. Instance segmentation effectively identifies pedestrians, buildings, and other elements in street view images and calculates their number to determine the overall conditions of the research area [27,28]; in semantic segmentation, the number and ratio of pixels of each image element are quantified to measure the visual perception of people [25,29]. Instance segmentation is accurate in the analysis of specific objects such as buildings and pedestrians, while semantic segmentation summarizes the integrity of streets.
In existing studies, streets have been analyzed via the measurement of street environmental factors [30]. For example, many scholars have applied green vegetation pixels to measure street greening [23,31,32,33], and greening results have been compared to remote sensing image results [34,35]. Researchers have calculated the sky scale to measure the street openness [15,22]. With the continuous improvement in technology, street view images may be adopted to analyze the characteristics of buildings [30,36]. Social sensing is also a new research field of heightened interest [37,38,39], and it has been demonstrated that the street environment affects the walking behavior and even the health of people [38,40]. These results verify that street view images are suitable for street research and may be adopted to examine new urban problems [41,42,43,44].
The development of machine learning has resulted in the intelligent acquisition and interpretation of street view images, which has attained a suitable accuracy in complex urban environments. Many semantic pixel-width image segmentation methods based on convolutional networks have recently emerged, such as You Only Look Once (YOLO), ImageNet, SegNet, and DeepLab. For example, SegNet is a deep convolutional network, which has been applied in objective image segmentation research. However, DeepLab won the first prize in the 2017 Cityscapes competition. DeepLab processes low-resolution features, similar to SegNet, which has been applied in other studies. DeepLab relies on fully connected pairwise conditional random fields (CRFs) to capture edge details while fitting considering long-range dependencies. DeepLab [45] combines deep convolutional neural networks (DCNNs) and probability map models (DenseCRFs) via the atrous algorithm [45] to obtain more contextual information. The three main advantages of this method are its speed, accuracy, and simplicity. Above all, DeepLab is a tool that is highly suitable for the image analysis of urban streets. With the continuous development of technology, the accuracy and speed of automated identification has been further improved, and the accuracy (mean intersection over union or MIoU) of DeepLabv3+ has reached 82.66%. This new approach allows for future research on urban agglomerations and large-scale analysis.
Street view image processing based on deep learning is a new method applicable to urban research [17]. In this method, not only are specific street elements studied but also various walking and driving behaviors [46,47,48,49] and related street safety aspects [29,30,31,32,33,34,35,36,37,38,39,40,41,42,43,44,45,46,47,48,49,50]. However, the current research has focused on specific street elements or single street functions and their correlation [51], and a comprehensive understanding of streets remains lacking. Streets not only involve static observation factors such as street infrastructure and environmental conditions but also their appeal to the outside world and the traffic flows among street networks [52,53], i.e., the economic influence and urban traffic capacity of streets. Therefore, we need to fully utilize the advantages of the big data era [54,55], adopt highly accessible open-source data to supplement existing research, and improve street multifunctional research.
Urban streets comprise construction land that does not rely on the mainstream production system or the ecological and economic functions of mature agricultural land. Three key questions should be addressed to better understand the multiple functions of streets. (1) At present, there is no universally accepted definition of a multifunctional street system. How can a multifunctional system suitable for urban land be derived from existing multifunctional research? (2) How can large-scale and multifactor urban street landscapes be measured? (3) What are the tradeoffs among different streets?
In addition to landscape function and economic function, streets are a connecting channel of various urban functional areas, and their traffic function cannot be ignored. One of the major characteristics of traffic is the connection between streets to form a complete street network. Considering only the street physical environment in street evaluation research ignores the interaction between the street and street network. The traffic function should not only consider the street itself but also consider the spatial structure of the street and the role of the street in the street network [56]. Against the background of the big data era, application of the above new techniques may provide new answers to traditional problems. Relevant research has also revealed that street networks and road connectivity exert a certain impact on the walking and riding behaviors of residents [46,47,48,49]. The advantage of the spatial syntactic model [57] is that the network space is abstracted as a spatial connection graph with interconnected axes, and the interaction relationship between topological connection characteristics and accessibility is revealed through spatial statistical analysis. Application of the spatial syntactic model has gradually become one of the main methods to analyze urban models [58]. This method partially supplements the existing research. It examines the spatial structure and potential of the street network while investigating the street space. Cardiff University developed spatial design network analysis (SDNA) software [59], which achieves these functions well and partially improves measures such as the two-phase betweenness (TPBt). A major feature of SDNA software is its compatibility with ArcGIS, which provides the basis for further analysis of urban planning. The specific methods and principles are described in the next section.
In this paper, we define a multifunctional index system of urban streets considering their landscape, traffic, and economic functions. We adopt a deep learning method and street view data to analyze the multiple functions of streets in Beijing. The combination of open-source data, such as street view imagery, and big data analytics, such as deep learning methods, yields a new research potential. This framework fills the gap in the current multifunctional street research. The research results provide a new policy basis for the sustainable and coordinated development of multifunctional streets.
2. Materials and Methods
2.1. Study Area
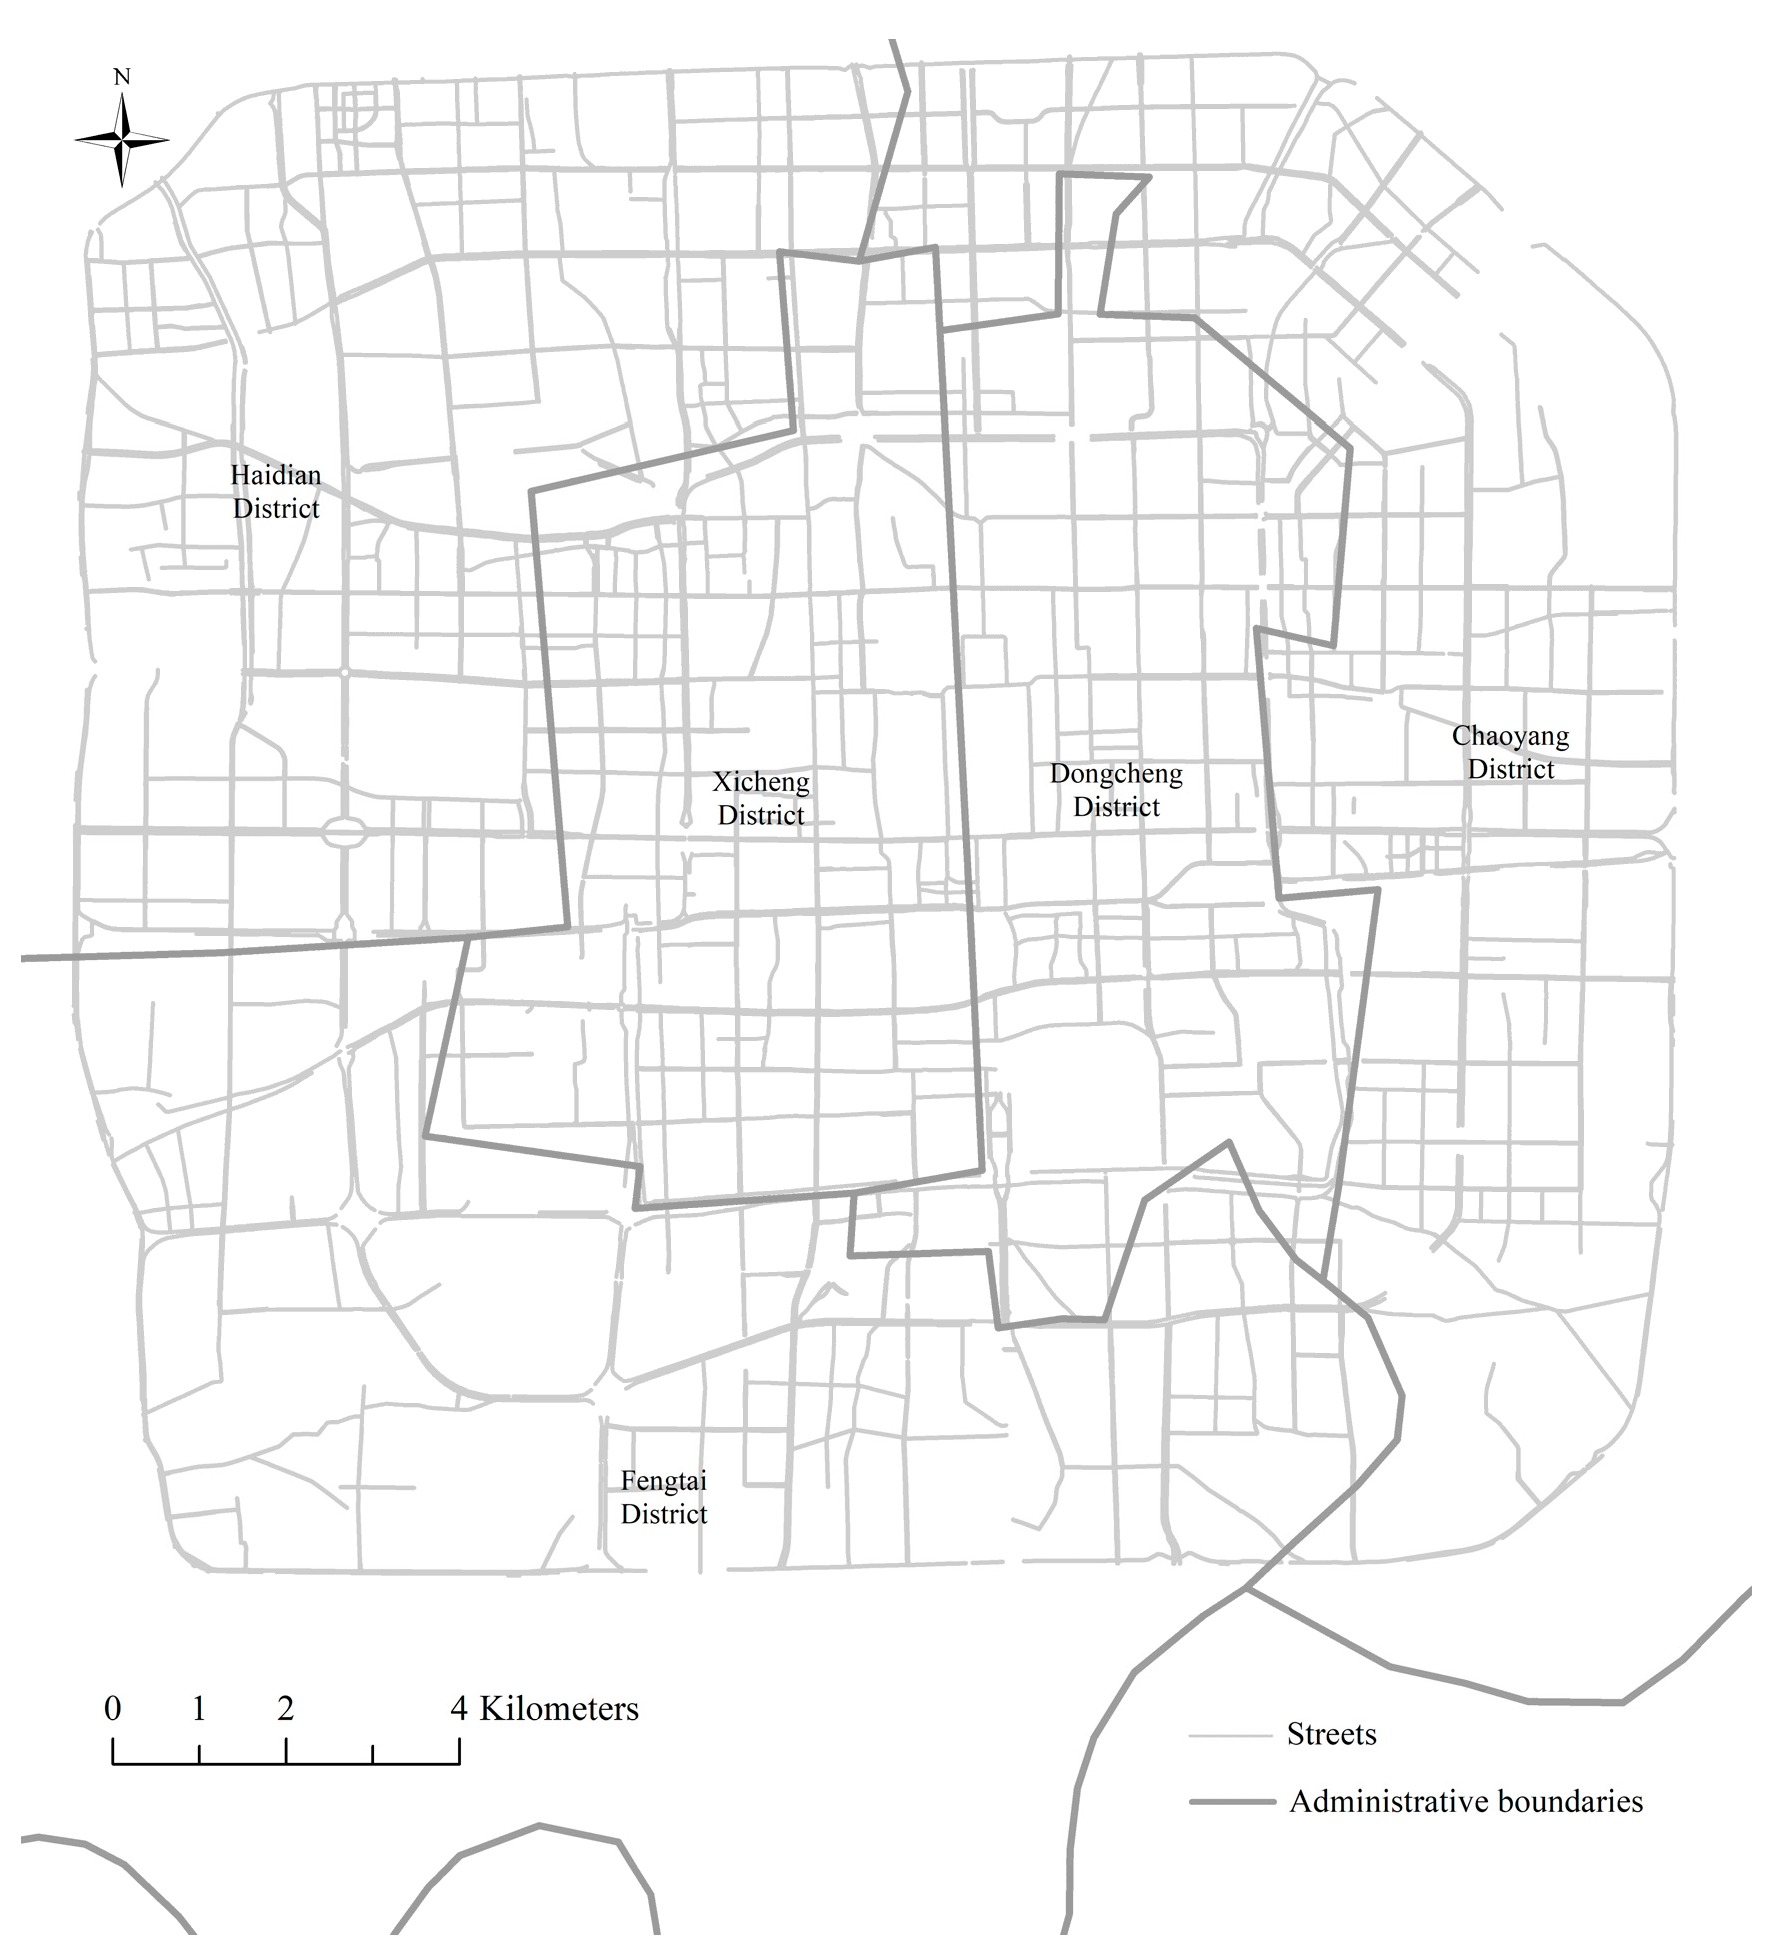
Our research is carried out in the Fourth Ring Road District of Beijing (covering an area of 302 km2). Figure 1 shows a road map of this area, and the street network is retrieved from Open Street Map (OSM). Streets are scattered across the city, with 1214 main streets and more than 5000 panoramic image sampling points. The research area is the central area of Beijing, the political center of Beijing, the economic center of Beijing, and the most important traffic artery of Beijing. In the process of urbanization, streets continue to develop with the characteristics of surrounding areas and gradually divide into different types of streets. The Fourth Ring Road District at the center of Beijing is a typical metropolitan area, which is analogous to the core urban areas of other cities. The study of Beijing’s street development is of reference significance to other cities.
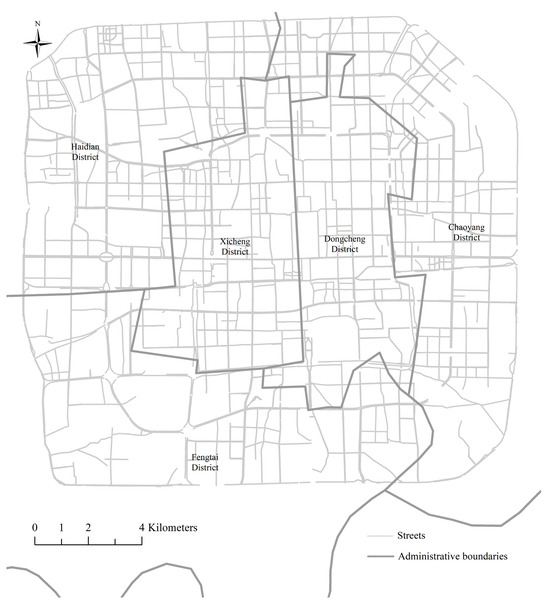
Figure 1.
Study area and sampled streets.
The data in this paper mainly include the following: (1) BSV image data, point-of-interest (POI) data, and road speed data pertaining to the center of Beijing, all obtained from the Baidu developer interface (http://www.lbsyun.baidu.com, accessed on 1 September to 30 September 2020); (2) street network data of the central area of Beijing, originating from OSM (http://www.openstreetmap.org, accessed on 1 September 2020); and (3) other data of the central area of Beijing.
2.2. Measurement of Multiple Street Functions
Traffic is an inherent attribute of urban streets, and the landscape is an objective feature of urban street facilities. This paper chooses landscape, traffic, and economic functions to measure the multiple functions of streets. Figure 2 shows a workflow of the analysis of multiple street functions. We used the semantic segmentation model Deeplab to analyze the factors of street vegetation, sky landscape, and sidewalk in street view image data to measure the street landscape function. Traffic function is mainly measured by street traffic safety function based on road speed and the street spatial priority function based on space syntax. We measure the impact of different types of POIs on street economic function by setting different attraction coefficients and distance attenuation models based on the actual road distance of the OSM network.
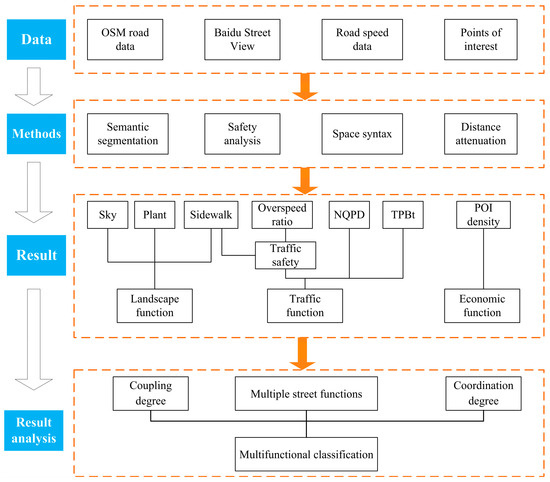
Figure 2.
The workflow of the analysis of multiple street functions.
BSV has been applied in related research in a manner similar to GSV. BSV collects street information from the human perspective through a parameter setting model. Via the collection of images along the four main directions at a given sampling point, we can obtain a panoramic view containing 360-degree distortion-free image information. We collected information on 1359 main streets and more than 5000 panoramic image sampling points. To reflect the human perception of the street landscape, we applied an accurate model to analyze the street landscape. As a semantic segmentation model, DeepLab contains a training set consisting of 5000 street photos originating from 50 different cities. Its rich training set and accuracy of up to 0.817 indicates that this model generally achieves a good recognition effect. Each street image was semantically segmented with the adopted model, and we determined the location and number of each type of pixel.
2.2.1. Landscape Function
We choose the street vegetation, sky view, and sidewalk factors to express the street landscape function. The street green vegetation factor is mainly based on the proportion of green plants in an image. In contrast to the visible green vegetation ratio, the street vegetation ratio identifies trees, flowers, grasses, and other street vegetation categories, such as nongreen plants important to people, as vegetation, which is not limited to visible green vegetation. In related research, the geographical accessibility and spatial impact of green spaces such as parks have been widely studied [60,61], and this method is further expanded to include street green vegetation.
The sky view factor is an indicator measuring the degree of openness of a street. It reflects the visual perception and psychological impact on street residents. The traditional measurement approach of the sky view factor is subjective, whereas a machine learning algorithm measures every street according to objective criteria. Compared to the traditional GPS signal method, the machine learning method attains a high processing speed and accuracy and better simulates the real feelings of residents from a visual angle.
A suitable sidewalk configuration not only affects the psychological crowding effect on residents but also ensures their safety. To date, research on street sidewalks is lacking. The main reason is that sidewalks exhibit many characteristics. Compared to green vegetation and sky view conditions, sidewalks are more difficult to identify and simulate with computers. However, the Deeplab model effectively identifies sidewalks and achieves good recognition results.
We calculate the total number of pixels and the pixel ratio of each landscape category and determine the factor score of each category. After standardization, we determine the weight of the above three factors via the entropy weight method [62] and obtain the functional value of the street landscape. The corresponding equation is as follows:
where CF1 is the landscape function result, CPi is the pixel ratio of class i, Wi is the weight of class i, Pi is the number of pixels of category i, and n is the total number of categories for semantic segmentation.
2.2.2. Traffic Function
The traffic function in this study primarily includes street traffic safety based on the road speed and street spatial priority according to the spatial syntax.
The application programming interface (API) of Baidu Map contains real-time speed data of each street. World Health Organization (WHO) research shows that for pedestrians, when the vehicle collision speed is not higher than 30 km/h, the survival rate is about 90%; when the vehicle collision speed is higher than 45 km/h, the survival rate is less than 50%. Therefore, this paper chooses 45 km/h as the speed threshold for road safety. The Baidu Map API was called through Python to obtain the real-time observed speed data of each street at five-minute intervals. We downloaded street driving speed data over half a month. Based on the minimum threshold method, the basic street safety level was determined. This was corrected with the BSV image recognition traffic safety correction tool, and the equation is as follows:
where S is the walking safety result, V is the overspeed time of a given road (higher than 45 km/h), Si is the average speed on a given road during period i, i is a different time period, and n is the time period. The total number f(Si) indicates whether a given road segment occurs under overspeed conditions during time period i, and G(x) is the road correction coefficient indicating the presence of guardrails. When a given street contains guardrails, G(x) is set to 0.8, which reduces the overspeed time. Conversely, G(x) is set to 1. T(y) is the traffic indicator correction factor for a given road. When a given street contains a traffic indicator such as traffic lights, T(y) is set to 0.8. Otherwise, T(y) is set to 1. CF2 is the traffic function result, C is the closeness, B is the betweenness, and S is the walking safety result.
Closeness and betweenness are the two main indicators of the spatial syntax model [57]. The network quantity penalized by the distance (NQPD) represents the closeness, usually referred to as a gravity model considering the quantity and accessibility of the network weight. In street research, NQPD reflects the connection difficulty of a street to the other streets within the same network, and streets with a high proximity usually exhibit a high topological accessibility and centrality. The SDNA software, which was invented by Cardiff University, is a popular spatial syntactic model. The SDNA model is an improvement and an optimization of the traditional spatial syntax model and is highly compatible with ArcGIS.
where Rx denotes all the streets affected by street x, P(y) is the ratio of the length of street y affected by street x to the total length of street y, and d(x, y) is the distance between streets x and y.
The two-phase betweenness (TPBt) is a form of the betweenness indicator, but the weight is distributed according to destination weights. This indicator more reasonably measures the probability that a given street in the entire road network is passed by people and traffic. Streets with a high traffic degree exhibit a high affinity for traffic flows.
where N denotes all the polylines in the study area, W(z) is the weight of polyline z, P(z) is the proportion of any polyline z within the radius, and total weight (y) denotes the total weight within a certain radius from polyline y.
2.2.3. Economic Function
The economic function of streets mainly depends on the attraction of street facilities to people. The different types of facilities along a street determine the street type and economic development level. Therefore, we choose POI data to measure the street economic function. We measure the impact of different types of POIs and distances on the street economic function by setting varying attraction coefficients. This method adopts the distance attenuation model based on the actual road network distance of the OSM road network, which better reflects the real street conditions than the Euclidean distance. The equation is as follows:
where CF3 is the economic function result, n is the number of POIs affecting the street economic function, and d(i) is the attraction coefficient of POI i.
This method applies the piecewise distance attenuation model. As shown in Table 1 and Figure 3, the longer the walking distance is, the lower the attraction coefficient. The influence degree of facilities within 400 m is the highest, namely, the attenuation coefficient from 400 to 800 m is 0.9, the attenuation coefficient from 800 to 1200 m is 0.55, the attenuation coefficient from 1200 to 1600 m is 0.25, and the attenuation coefficient from 1600 to 2400 m is 0.08. The influence of facilities beyond 2400 m is not considered.

Table 1.
Attraction coefficient of the different POIs.
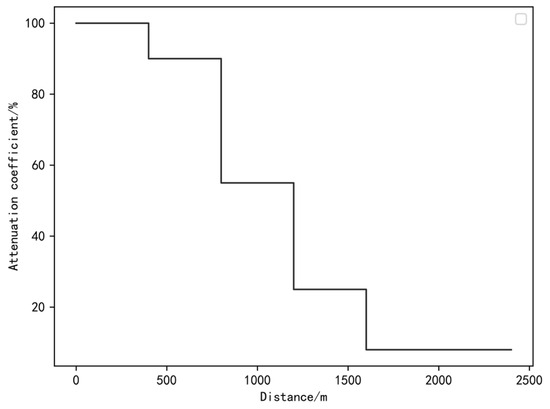
Figure 3.
Attenuation coefficient with the POI distance.
2.2.4. Tradeoff Measurement
The multiple functions of a street affect each other, and the traditional multifactor comprehensive evaluation approach does not directly determine the coupling and coordination degrees of each function. However, the coupling and coordination degrees of ecological aspects reflect the coordination degree between land functions. Therefore, this paper relies on the coupling and coordination degrees of ecological aspects to derive the multifunctional coupling and coordinating degrees of streets. The equation is as follows:
where T is the multifunctional comprehensive index; CF1, CF2, and CF3 are the landscape, traffic, and economic function indexes, respectively; C is the multifunctional coupling degree; and D is the multifunctional coordination degree.
The three functions of the landscape, traffic, and economy and the calculated coordination degree are then divided into three levels, namely, high, medium, and low, to determine the multifunctional street types. The specific classification method is summarized in Table 2.
Table 2.
Classification rules of multifunctional streets.
3. Results
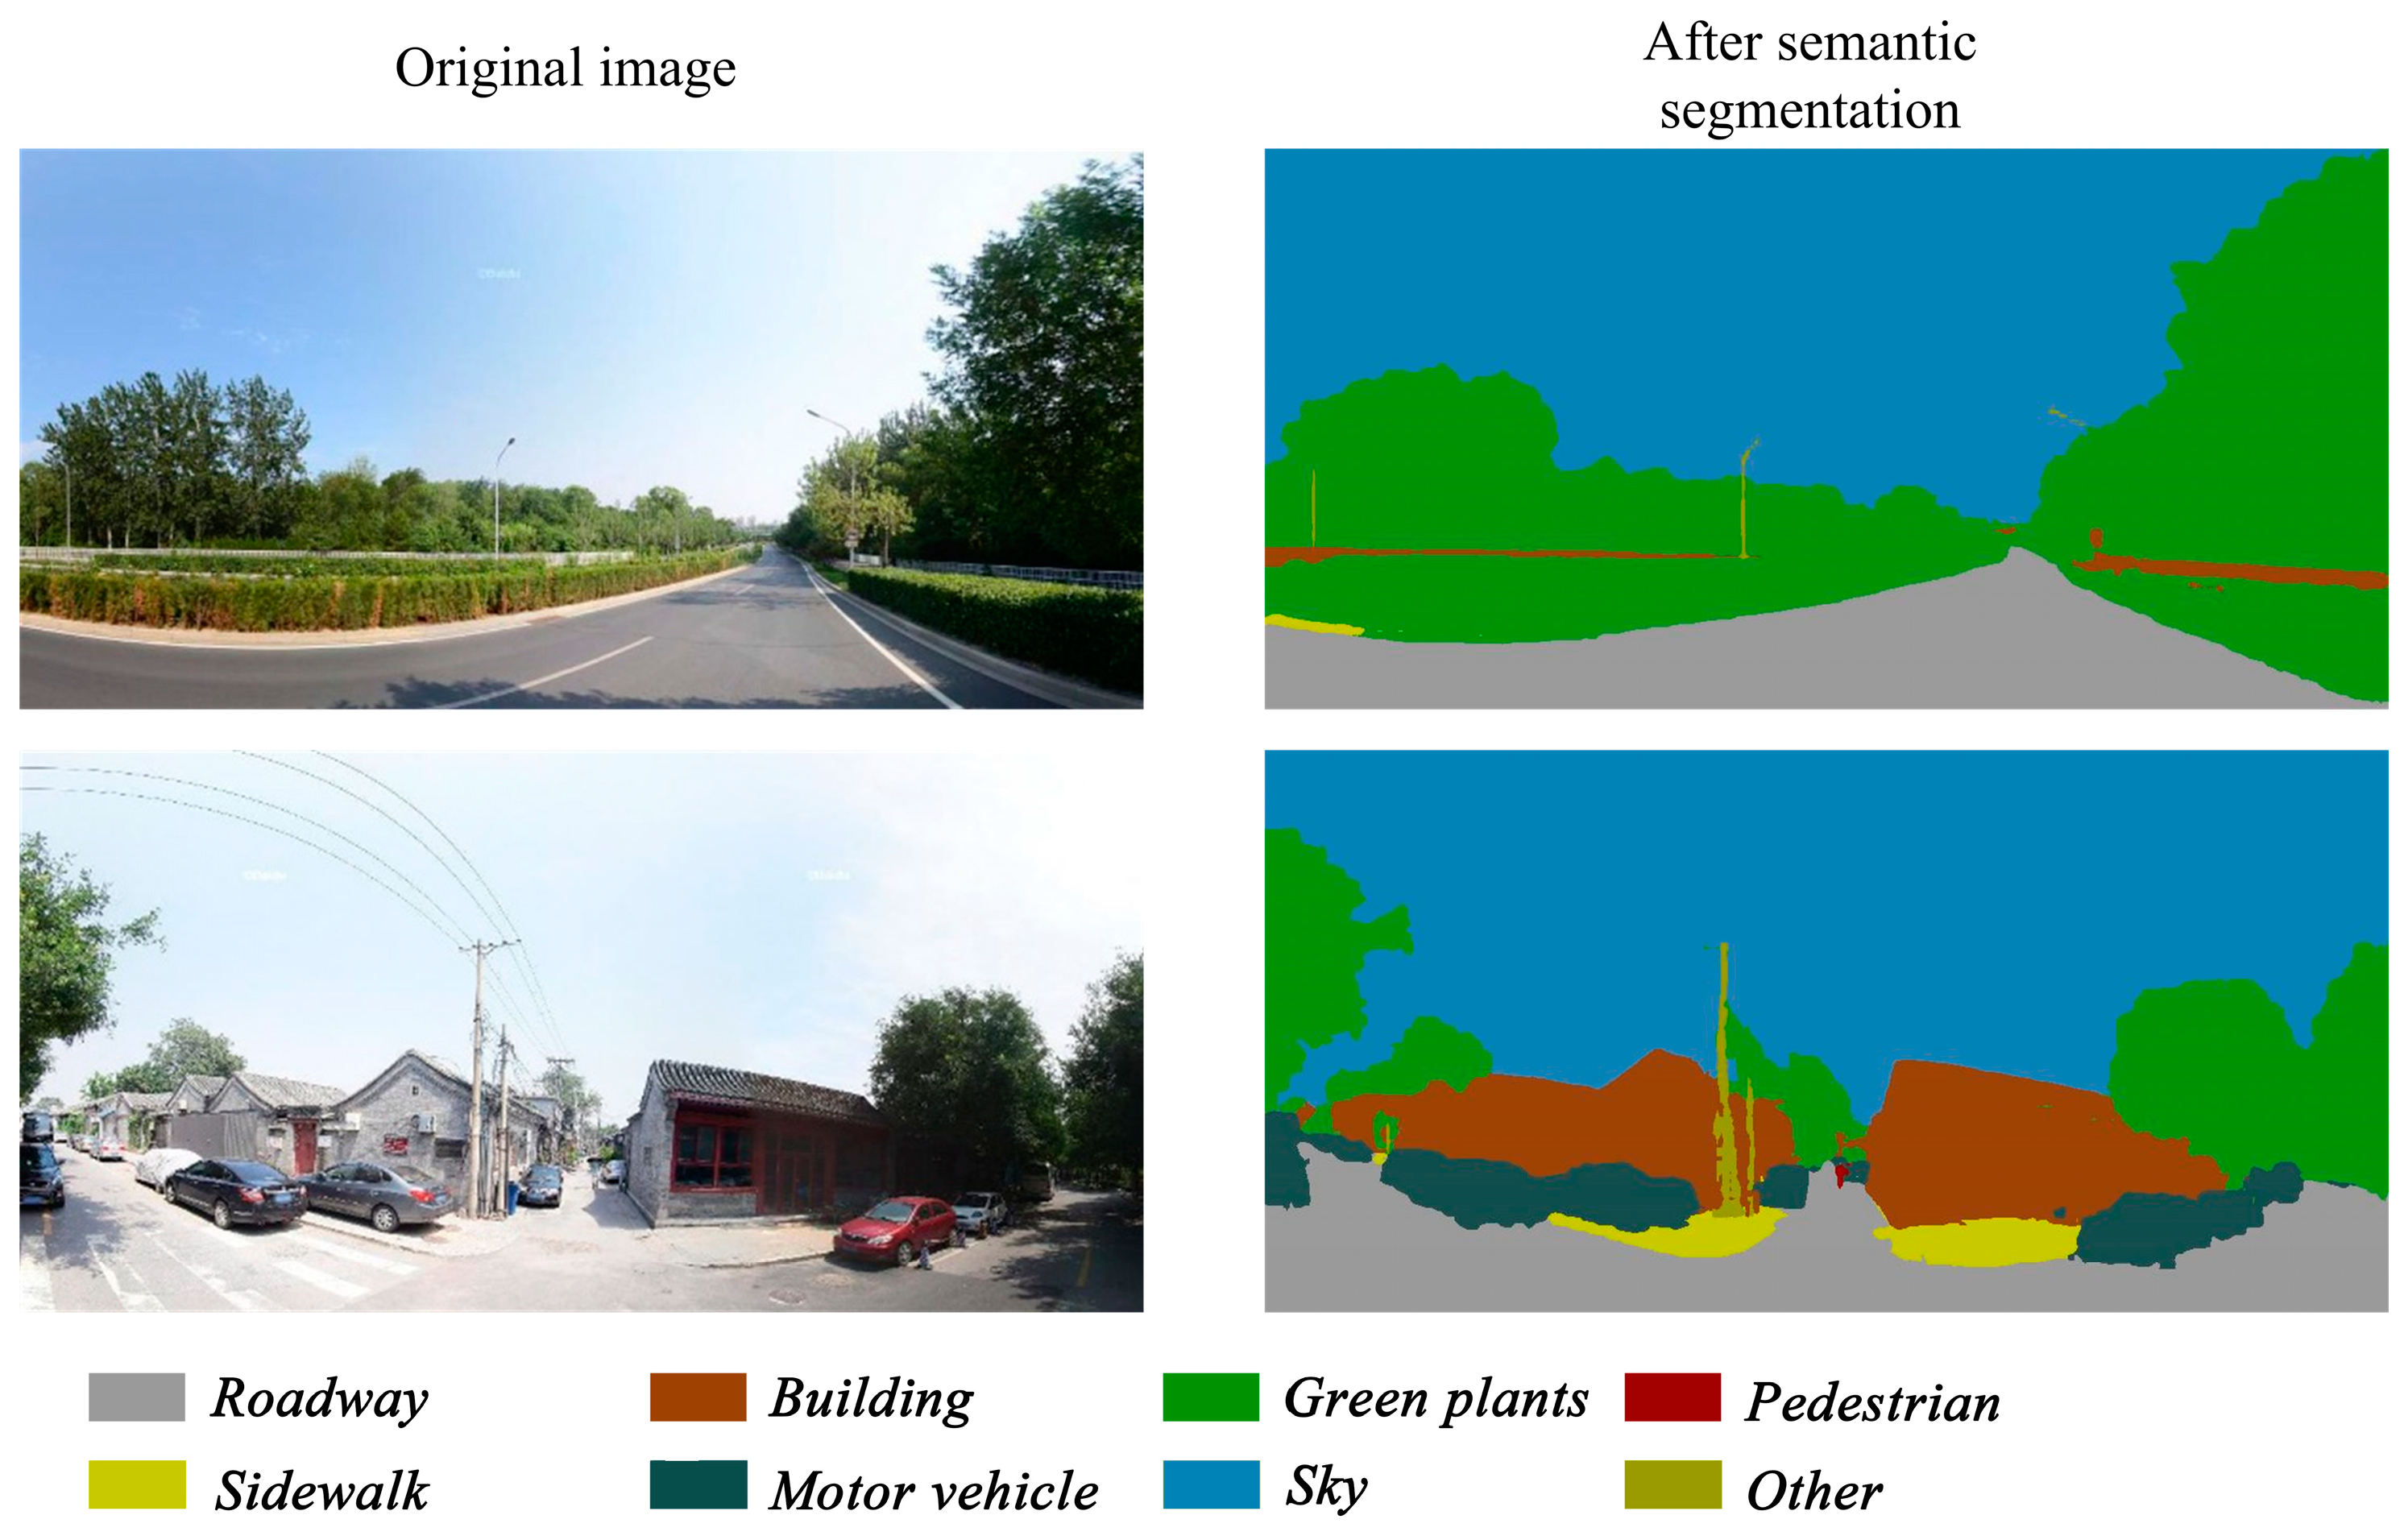
Figure 4 shows the original images and the results of semantic segmentation of BSV images via machine learning. The semantic segmentation results are good, and elements such as sidewalks, roadways, buildings, motor vehicles, green plants, sky, and pedestrians are accurately identified. Compared to traditional machine learning single-objective recognition, our method identifies multiple elements simultaneously, performs multidimensional analysis, and distinguishes ground objects overlapping each other via semantic segmentation. This method achieves a good recognition effect.

Figure 4.
Semantic segmentation results of street view images.
3.1. Multifunctional Spatial Differentiation of Streets
3.1.1. Street Landscape Function
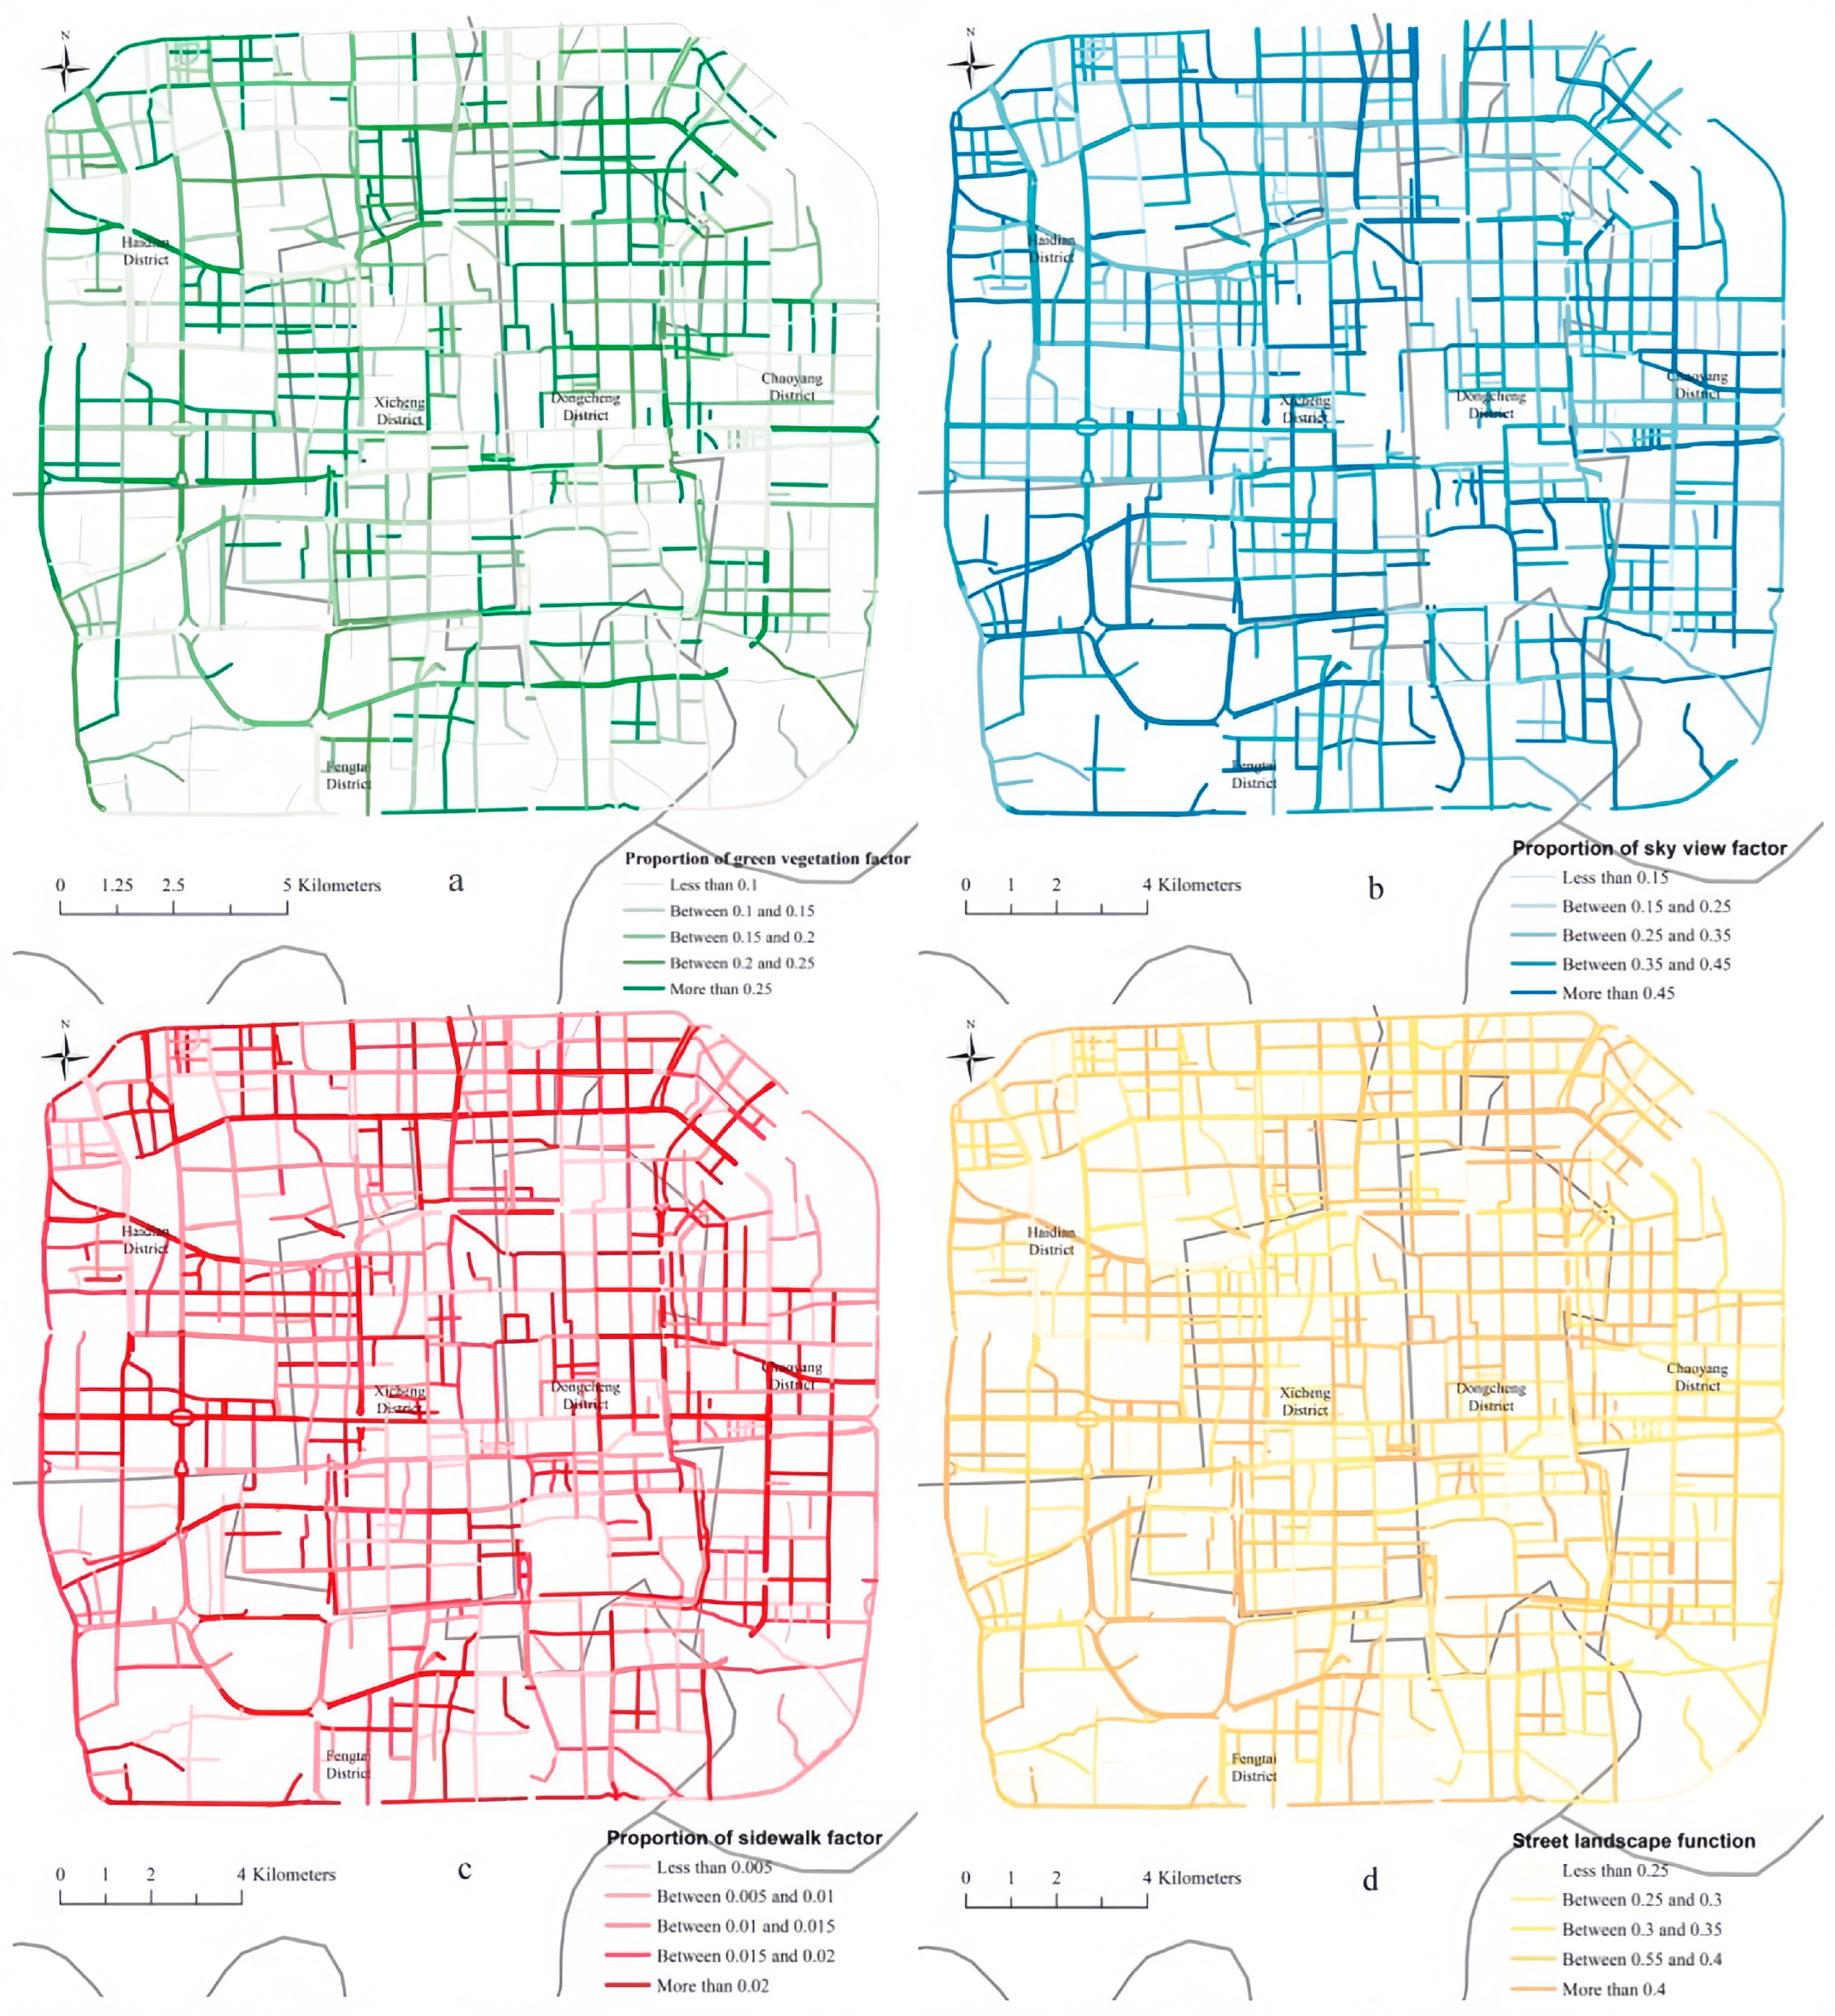
Figure 5 shows the street landscape function quality of the study area and the spatial distribution results of each factor. In regard to green vegetation, the overall research area attains a high level, and streets with poor vegetation coverage are mainly distributed outside the Third Ring Road. The proportion of vegetation along northern streets is higher than those along southern streets.
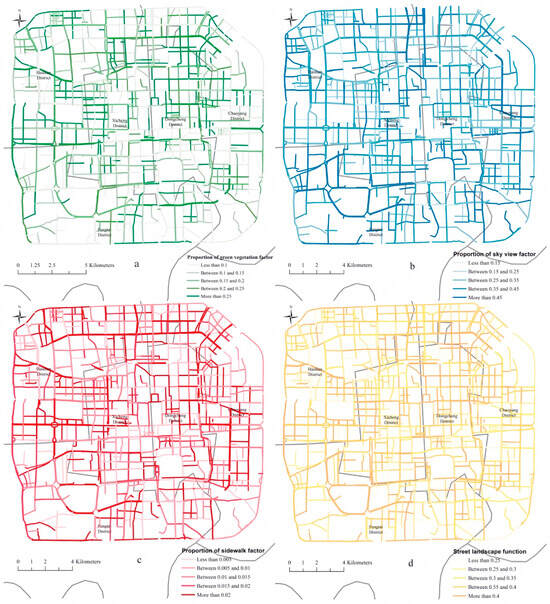
Figure 5.
Distribution of the green vegetation factor (a), sky view factor (b), sidewalk factor (c), and landscape function (d) of streets.
From the perspective of the sky view factor, the overall view of the streets in central Beijing is relatively broad. The sky view conditions in Dongcheng District, Xicheng District, and Fengtai District are better than those in the other areas. In general, the sky view conditions of eastern streets are slightly higher than those of western streets. From the ring road toward the center, the sky view factor exhibits a high-low-high spatial distribution.
Regarding sidewalks, the proportion of sidewalks in each region is relatively even, and there are no obvious high-value areas. Relatively small sidewalk areas are mostly located near the ring roads. Most of the ring roads exhibit a high transportation capacity. The angle of street view images may affect the sidewalk measurement, which may also be one of the reasons for the balanced sidewalk proportion. However, more than 90% of the streets contain obvious sidewalks, which ensure street comfort and safety.
Green vegetation and open skies visually enhance street comfort, while sidewalks are psychologically reassuring. As shown in Figure 5d, the quality of the street environment is comprehensively reflected by these three aspects. The street landscape function in the downtown area of Beijing reveals obvious attenuation characteristics. The street landscape function decreases with the distance from the central city. In space, there exists a certain geographical differentiation, and the street comfort in the northeast and southwest regions is high. In contrast, the street comfort in the southeast and northwest regions is low. The central urban streets within the second ring road are better than those outside it.
3.1.2. Street Traffic Function
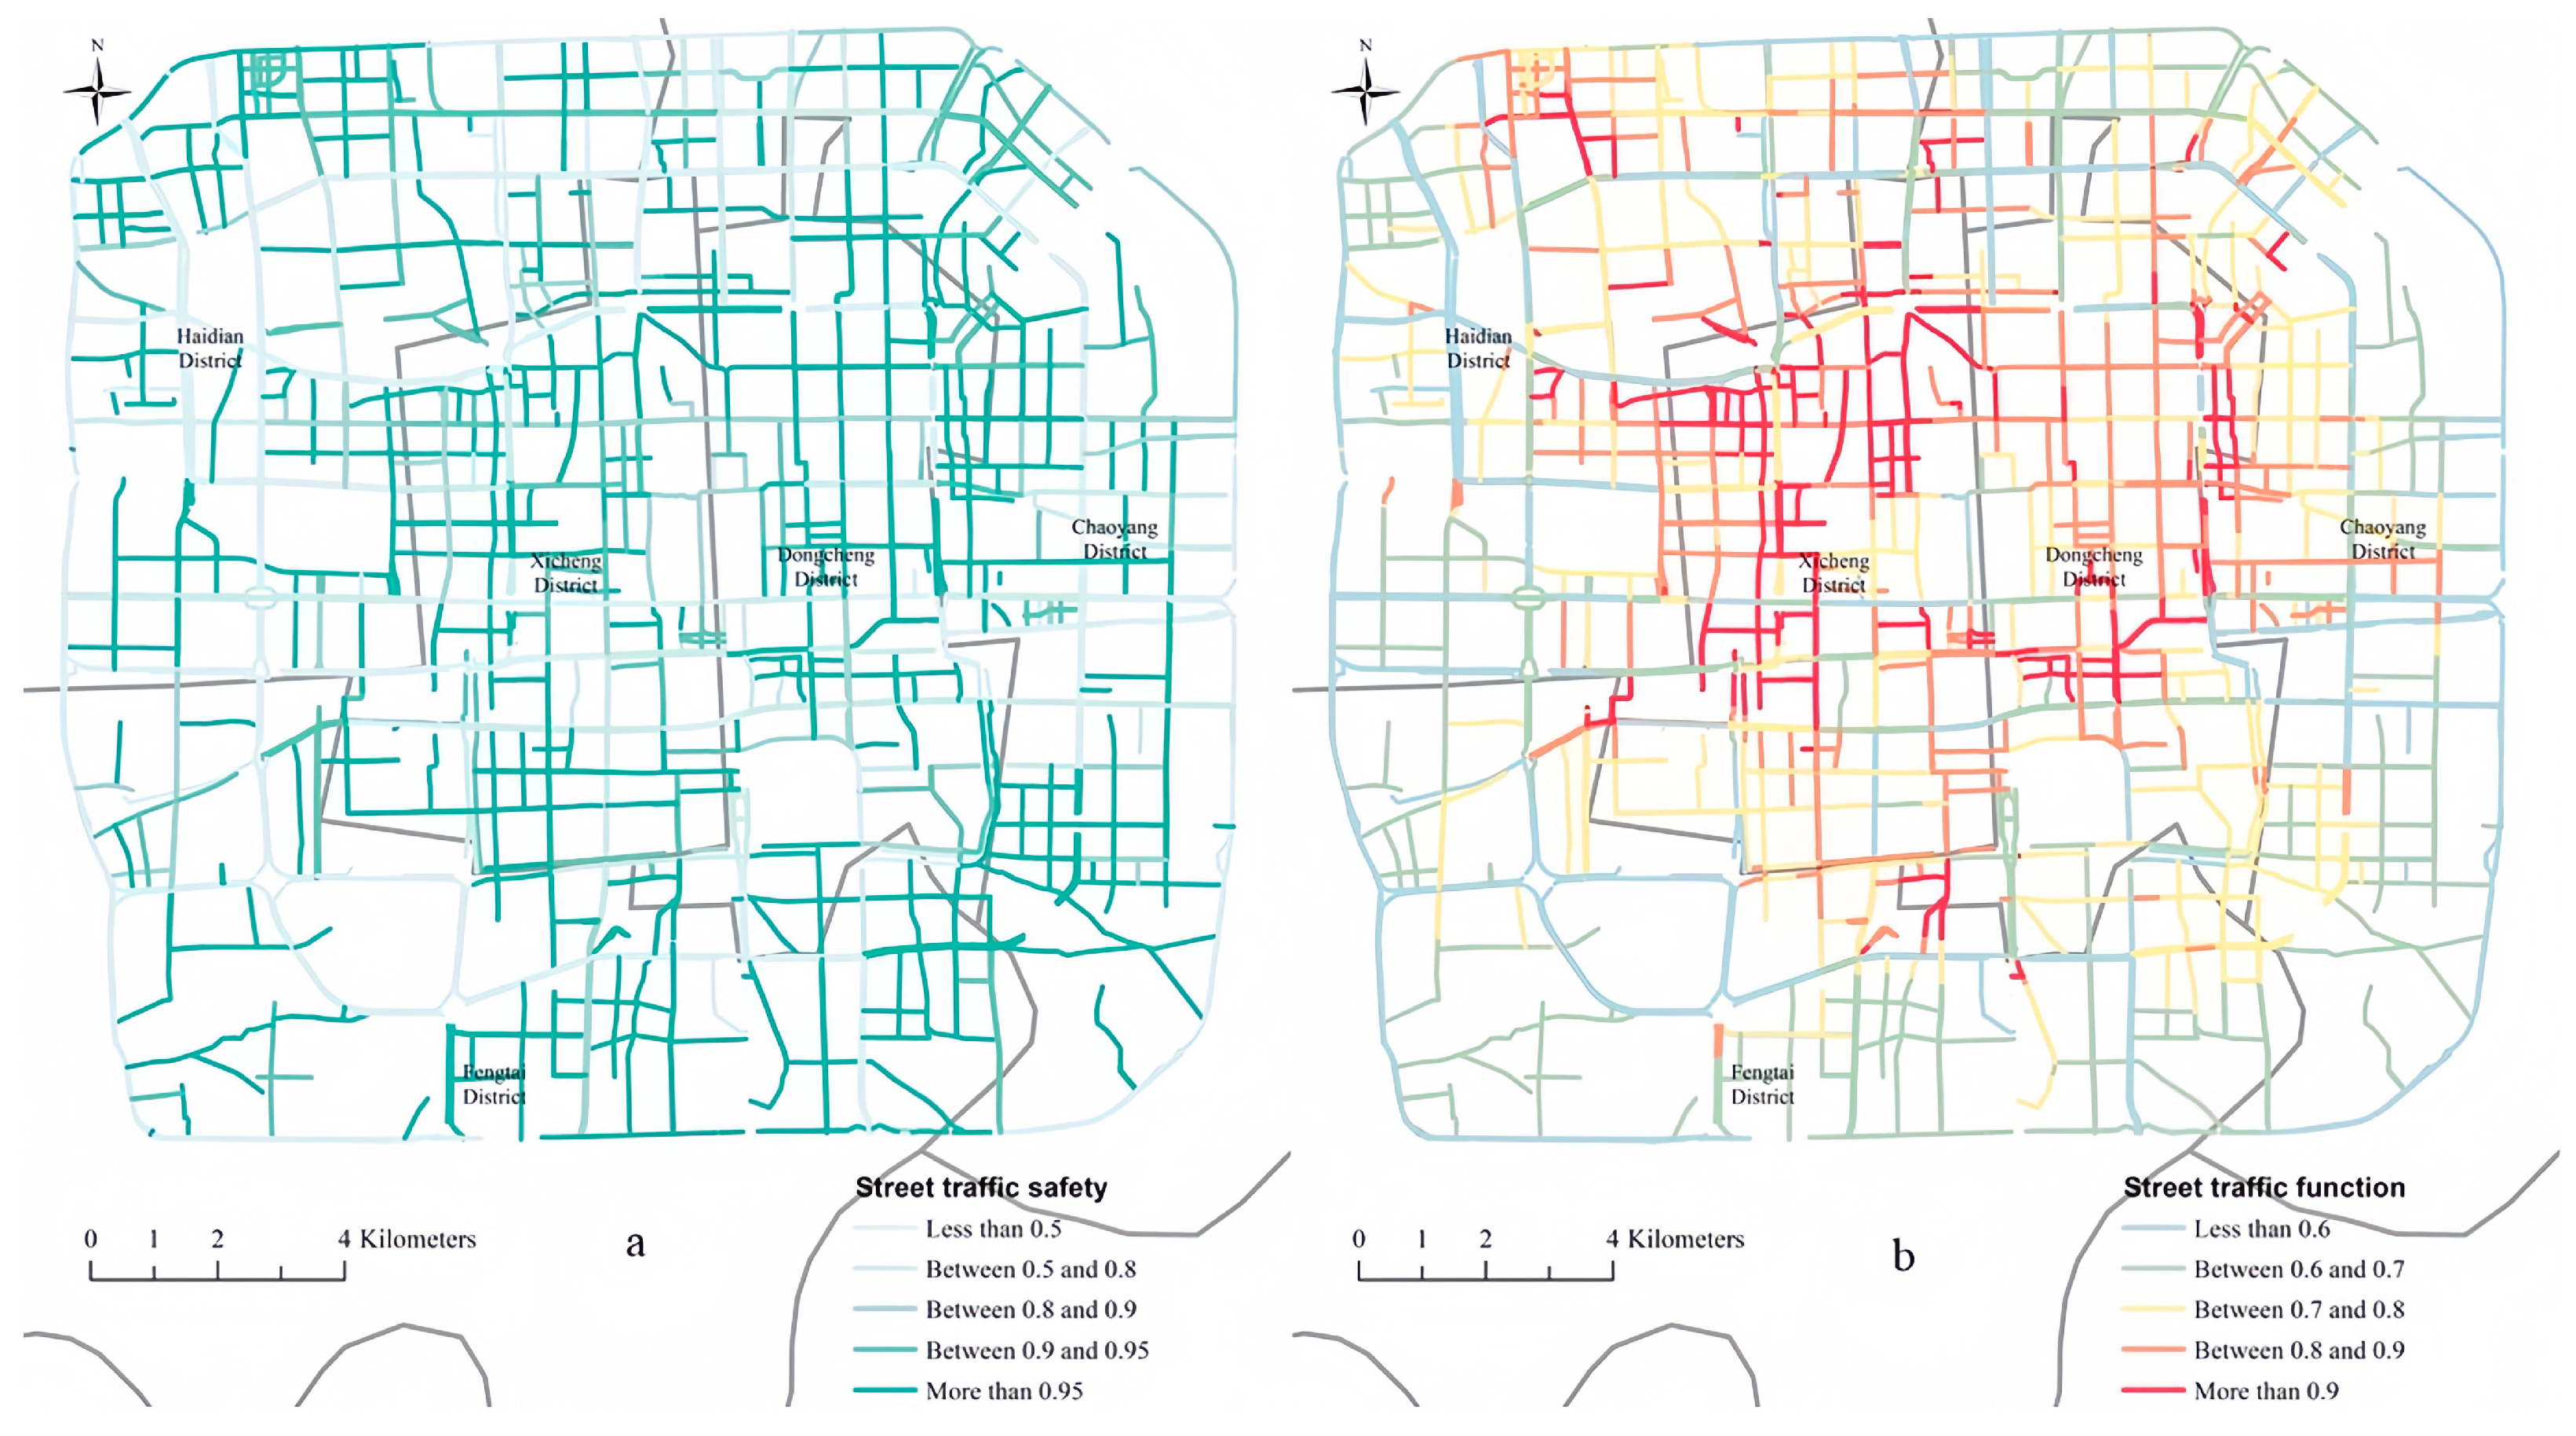
Figure 6a shows the street traffic safety of the study area. The walking safety level in the study area is excellent due to the improvement in transportation-related facilities. High-risk regions mainly occur in the peripheral area between the Third and Fourth Ring Roads and along the main streets across the ring road area. On the one hand, these results reflect the safety level of Beijing government traffic. On the other hand, they also reflect the large-scale traffic congestion conditions in Beijing. All streets contain traffic lights, and more than 95% of the roads contain guardrails to protect sidewalks, thus demonstrating the safety of Beijing as an international metropolis.
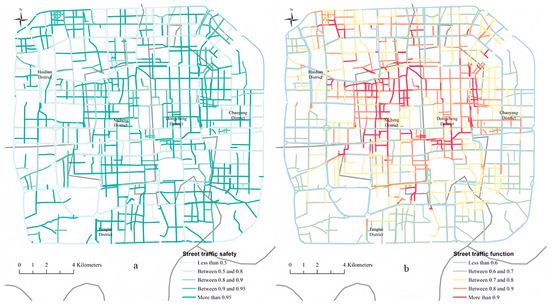
Figure 6.
Distribution of street traffic safety (a) and traffic function (b).
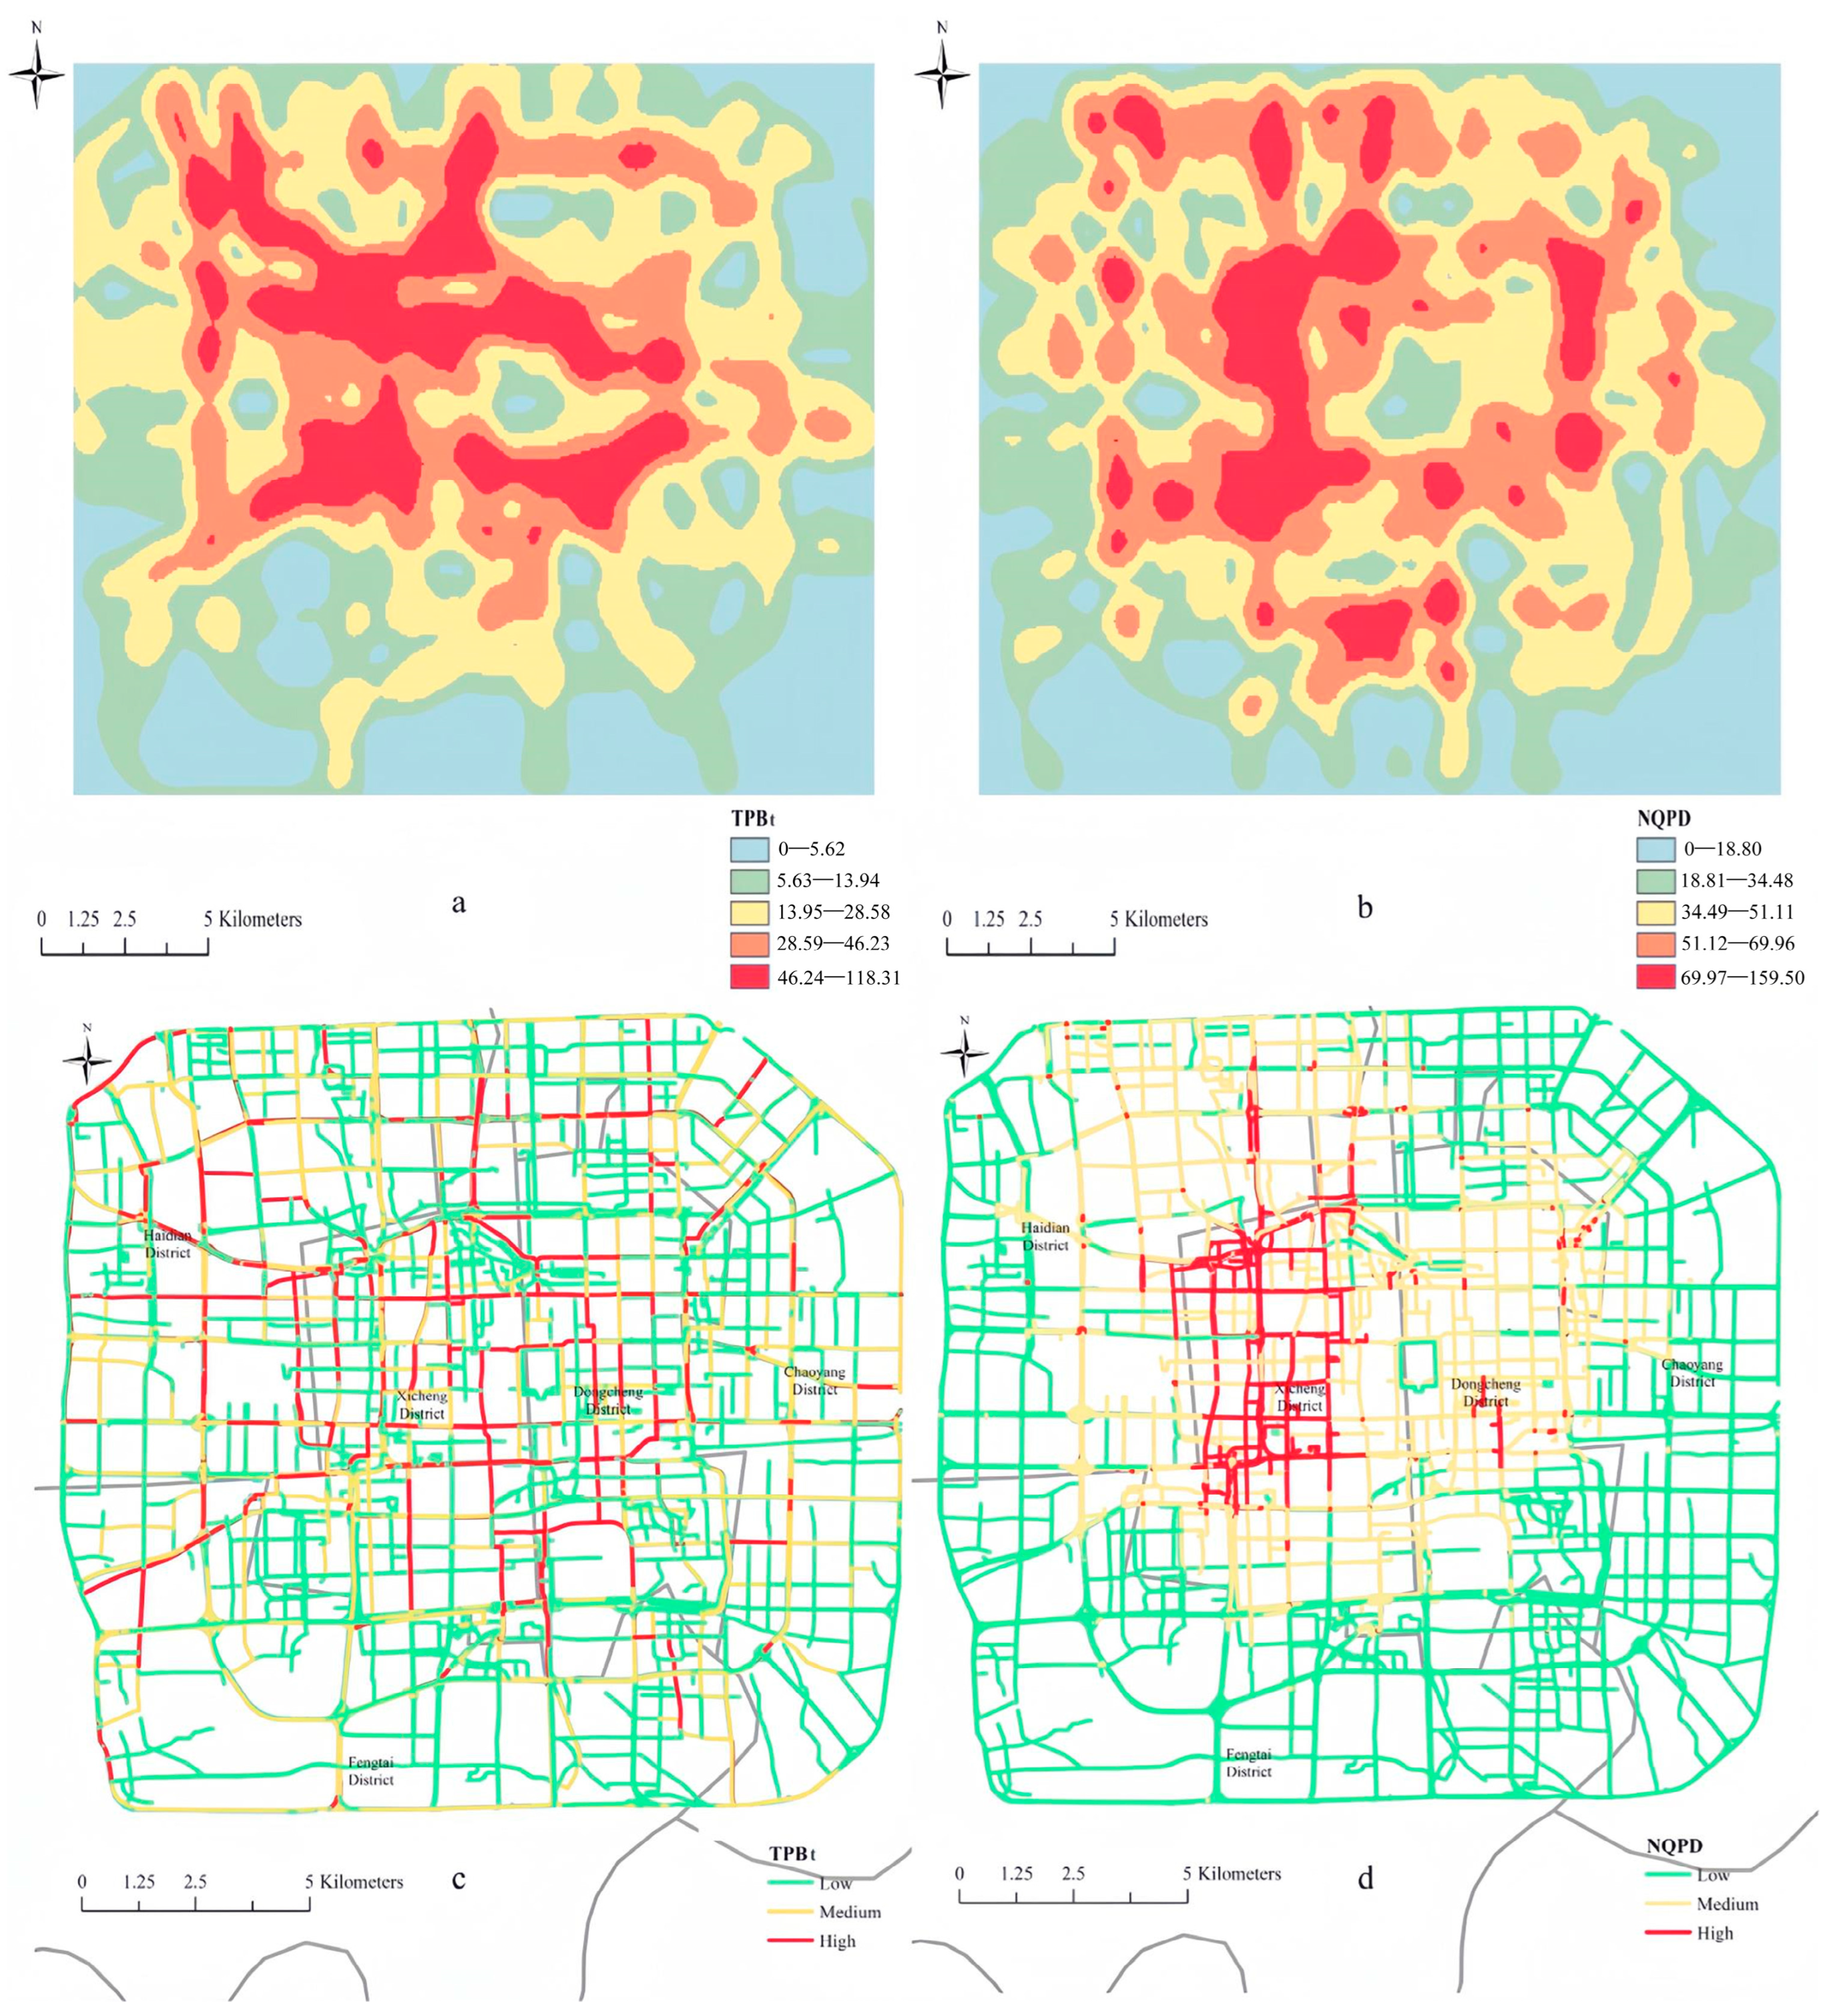
Figure 7 shows the closeness and betweenness of the study area. Based on the extended spatial syntactic SDNA model, the results reveal the spatial accessibility and spatial attraction of streets. The figure also shows the spatial difference between streets to a certain extent. In general, the traffic conditions in the central area of Beijing are highly convenient, and the traffic conditions in Xicheng District are the best, followed by Dongcheng District. Along the different directions, the traffic conditions and accessibility in Xicheng District in the northwest region are good, while in the southwest region, even the central area does not exhibit suitable accessibility.
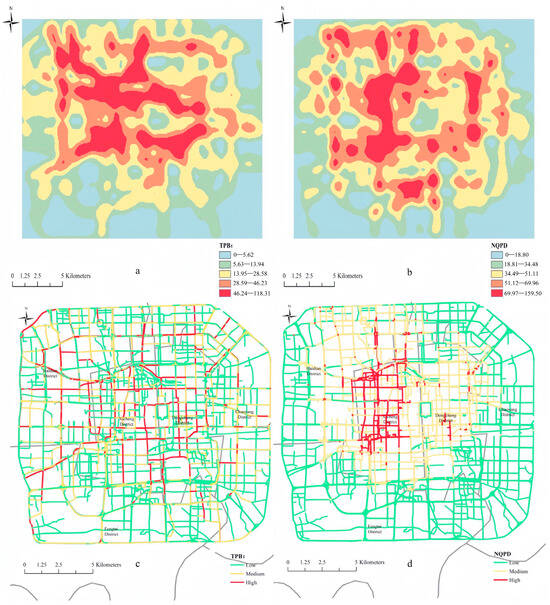
Figure 7.
Spatial characteristics (a,b) and distribution (c,d) of TPBt and NQPD in the study area.
The betweenness indicates the probability that people and traffic will pass along a given street within the network. To a certain extent, the betweenness measures the attractiveness of a space. High-penetration areas are largely located in the central and northern regions. A street connecting inner and outer streets is also attractive. The spatial attractiveness along the three directions of north, east, and west is high. In contrast, the attractiveness of the southern region is less obvious.
Figure 6b shows the integrated street traffic function of the study area. The traffic function of Beijing exhibits an obvious centrality, namely, the traffic function of the central city area is much higher than that of city areas farther away. The traffic demand of Xicheng District is the highest, followed by Dongcheng District, and the traffic capacity of the Third Ring Road area is much higher than that of the other areas.
3.1.3. Street Economic Function
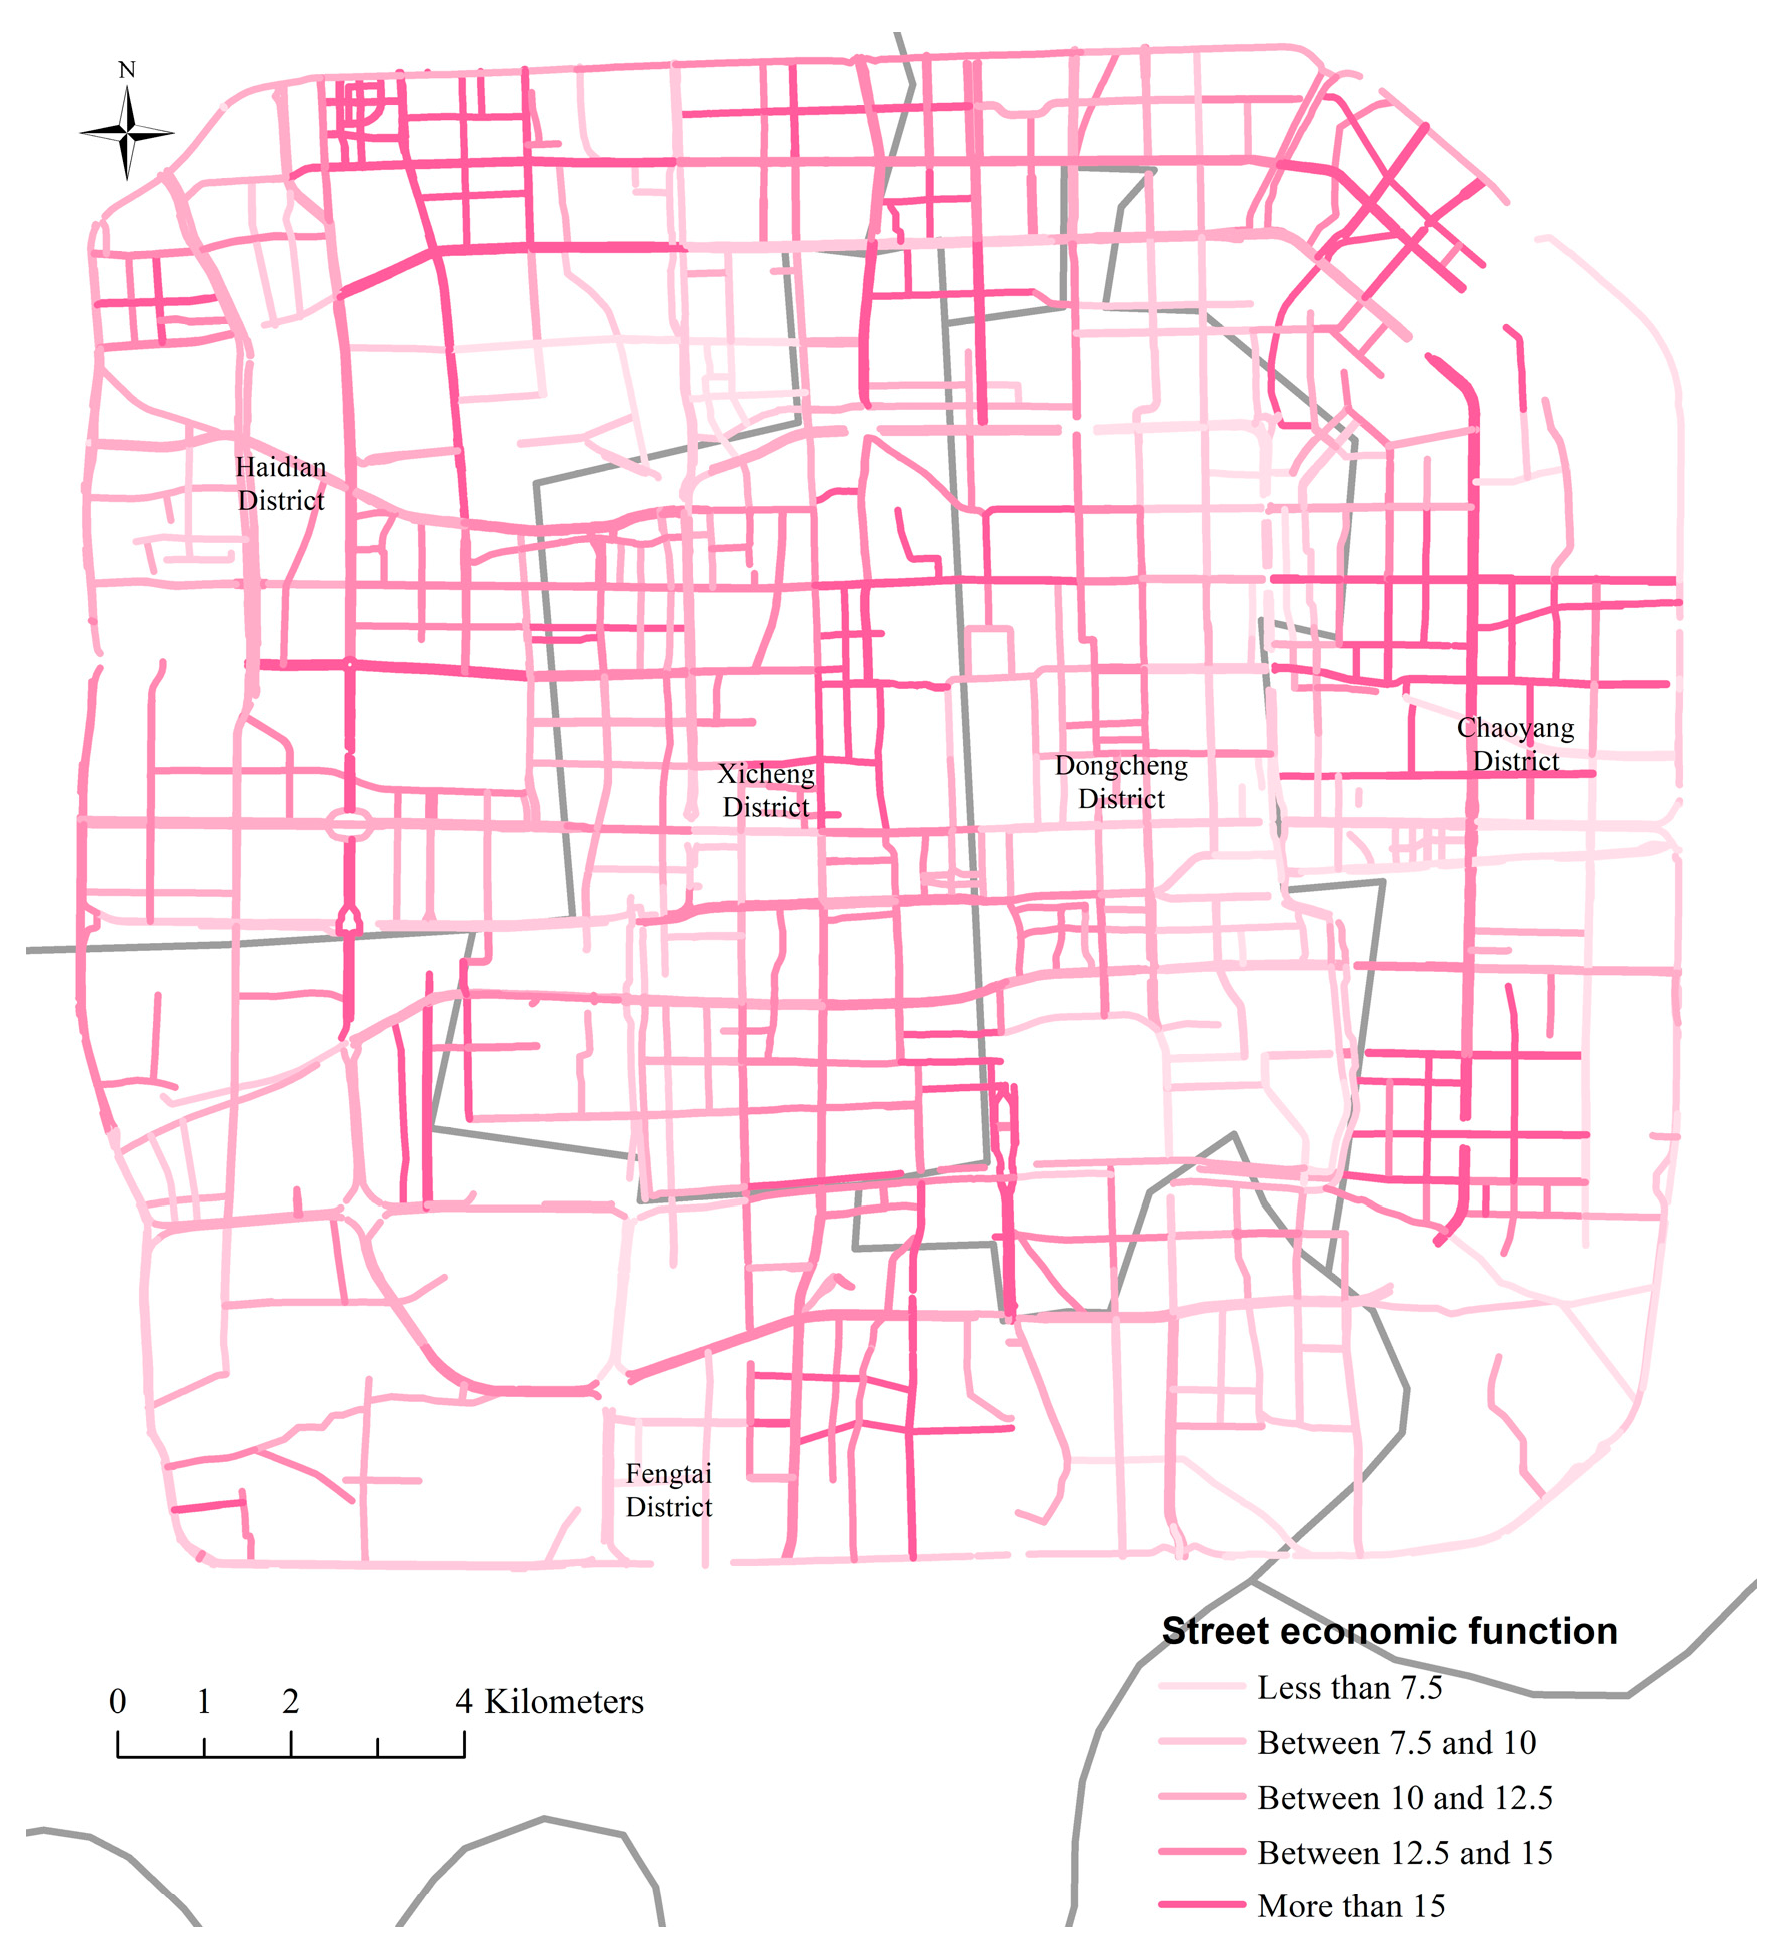
Figure 8 shows the ecological functions of the study area. The street economic quality of the Fourth Ring Road District of Beijing is relatively high, and the street economic quality of the area within the Third Ring Road is higher than that of the area outside it. The streets in the northwest area of Beijing are more attractive than those in the other areas, which is consistent with the numerous commercial buildings in the Xicheng District of Beijing. In contrast to the general rule, the economic function of Dongcheng District in the central urban area exhibits the opposite, i.e., a low value, while the landscape function of this part of the district attains a high value, which will be further examined in Section 4.1. Xicheng District, Chaoyang District, and Haidian District possess higher economic functions than the other administrative regions. As the geographical differentiation in the street economic function closely adheres to the boundaries of the administrative regions, we infer that the strength of urban economic functions is closely related to the different administrative regions. In particular, different government development decisions affect the economic development of streets.
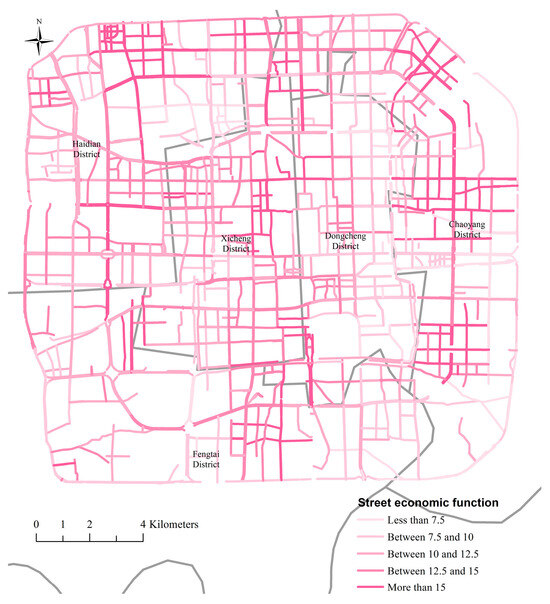
Figure 8.
Distribution of the street economic function.
3.2. Tradeoffs between the Multiple Street Functions
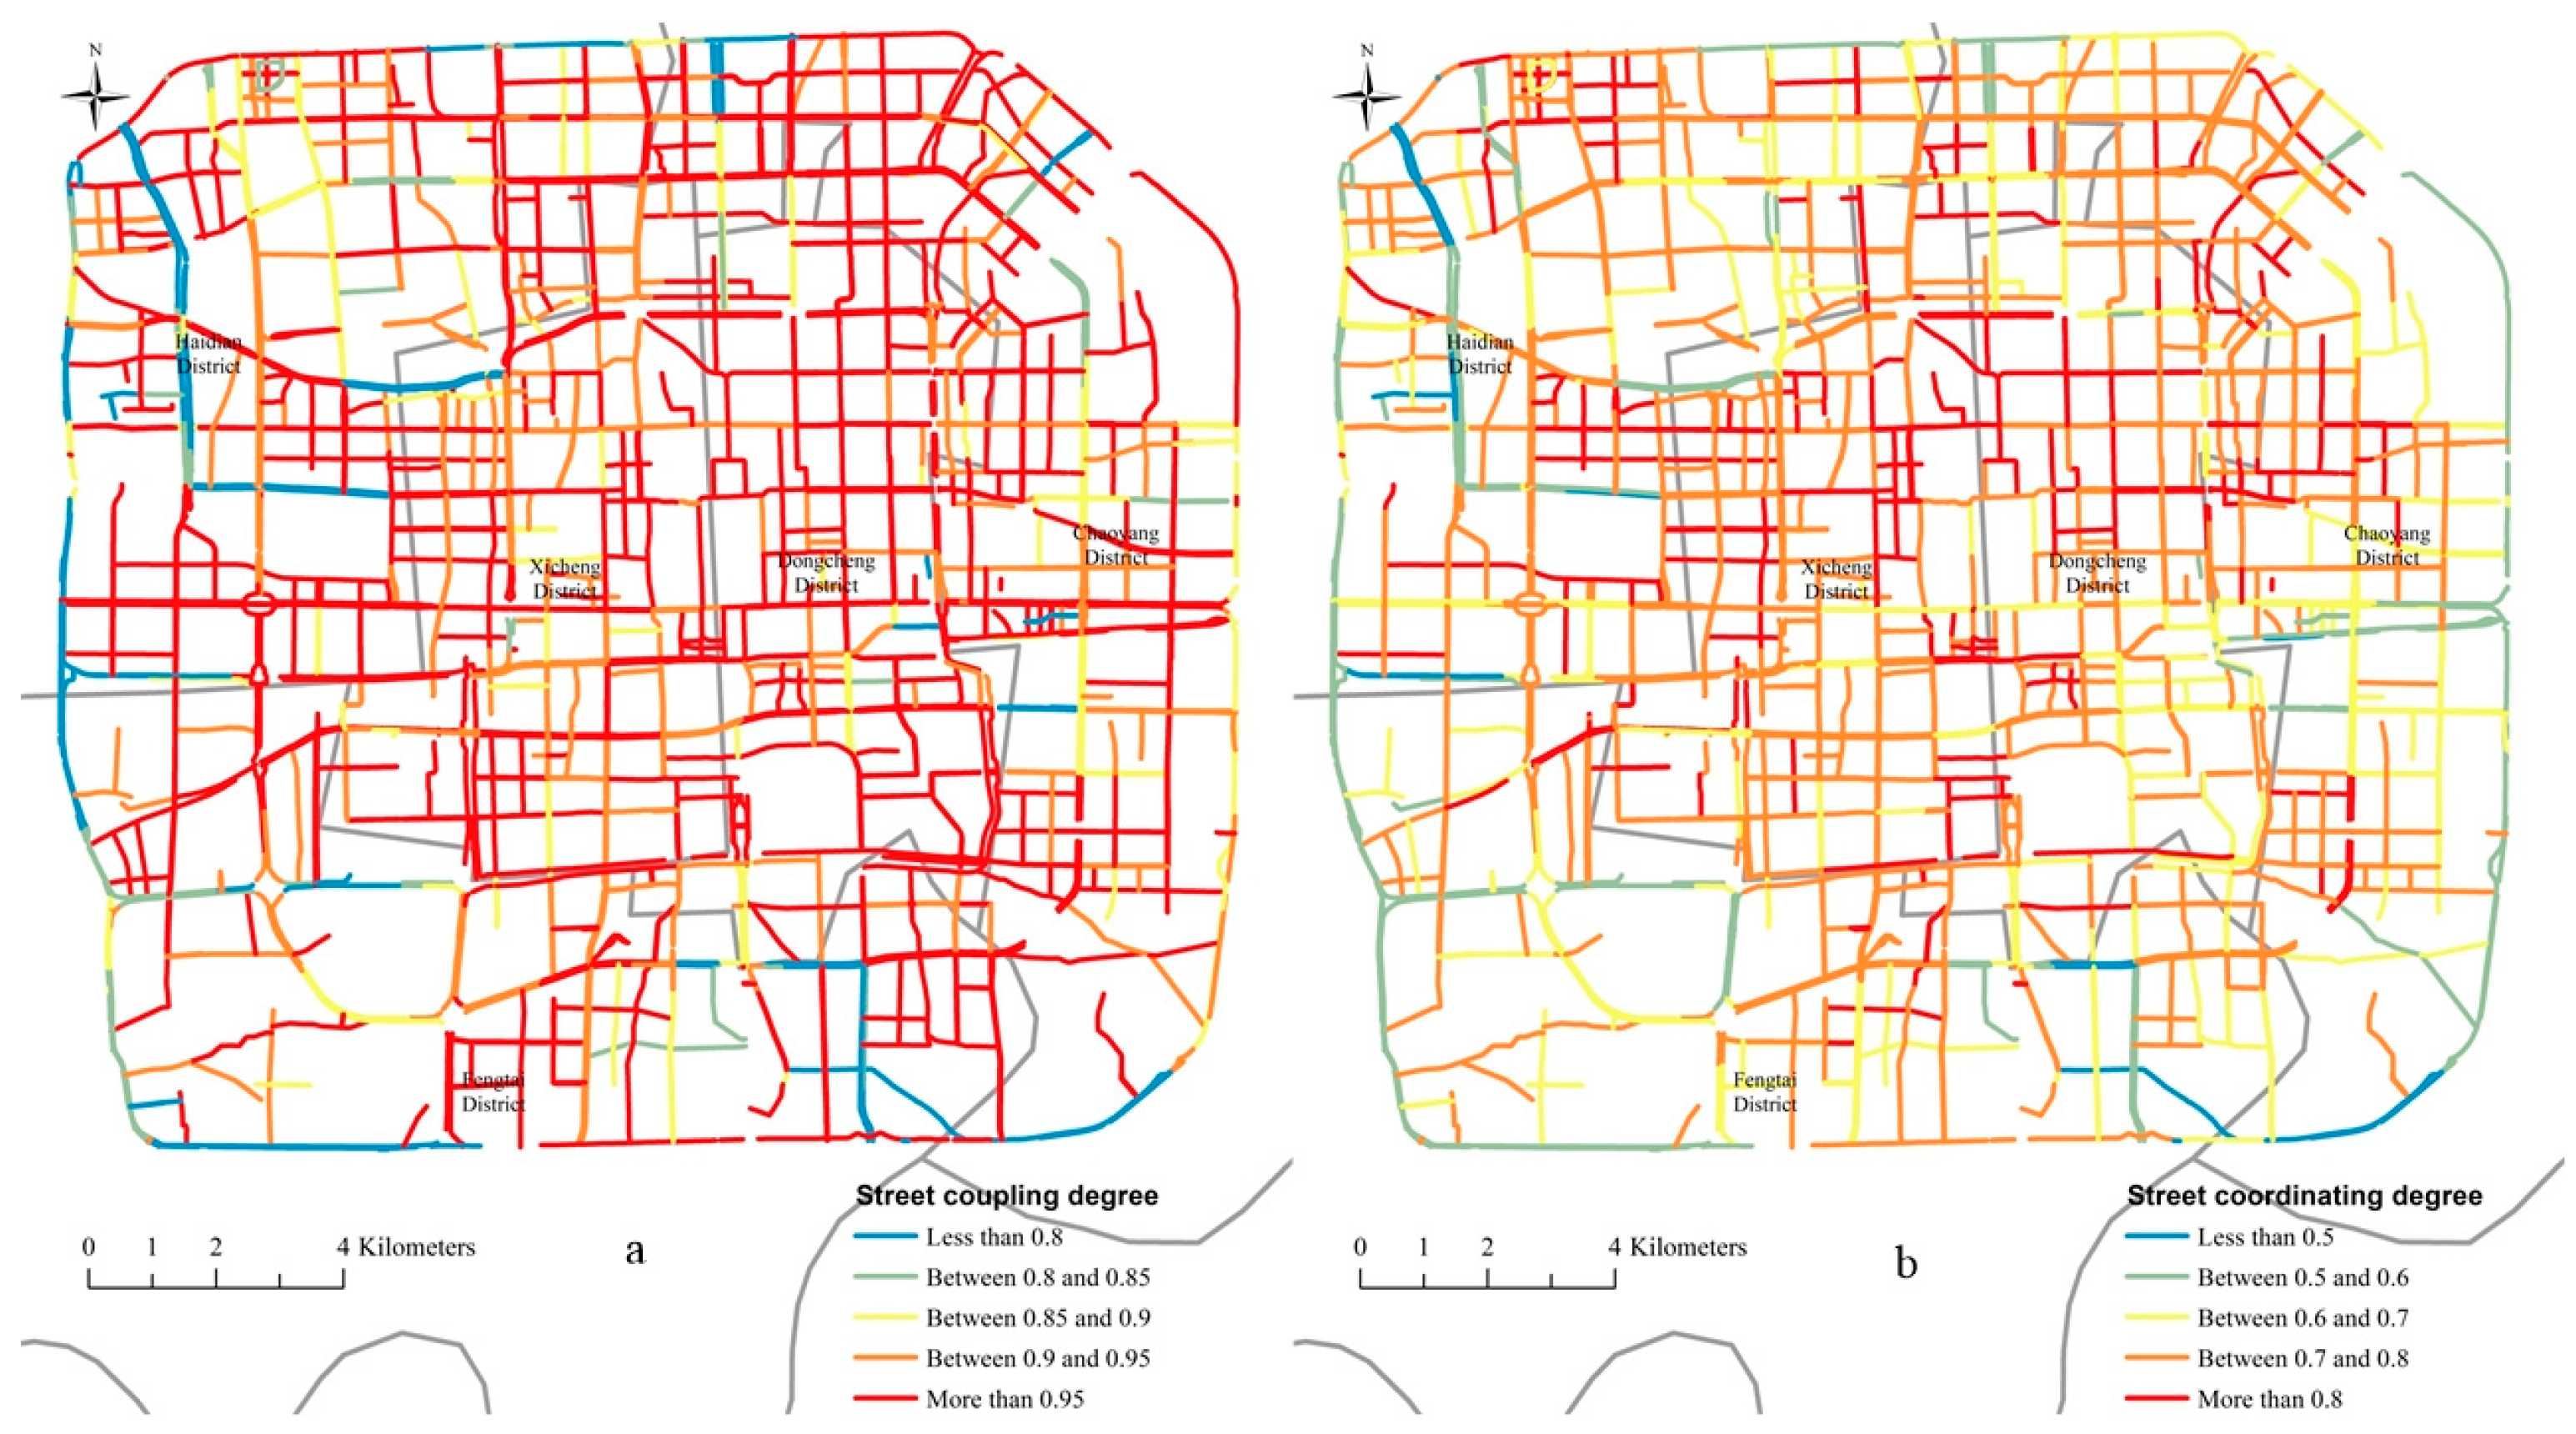
Figure 9 shows the coupling degree and coordination degree of the study area. The multifunctional coupling degree of the streets in the study area is high in the west and low in the east, and the coupling degree in the area outside the Third Ring Road is lower than that in the central city. However, the absolute value of the overall coupling degree is high, namely, most of the coupling degrees are higher than 0.8. The coupling degree in the central urban area is generally higher than 0.9, which reflects the high correlation of the street functions in Beijing.
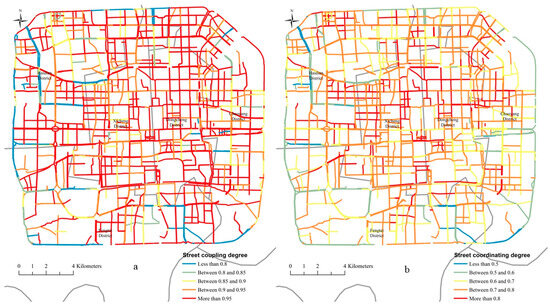
Figure 9.
Coupling degree (a) and coordination degree (b) of the multiple functions of streets.
In space, the coordination degree decreases from the central area to the periphery, and the difference among the loops is notable. These results exhibit a high degree of consistency with the spatial characteristics of the street traffic function. It is found that both the level and tradeoff relationship of the multiple street functions exhibit an obvious spatial heterogeneity. Based on the types listed in Table 3, nine multifunctional street categories of three types are defined, and the spatial distribution is shown in Figure 10.
Table 3.
Zoning indicators of the multiple functions of streets.
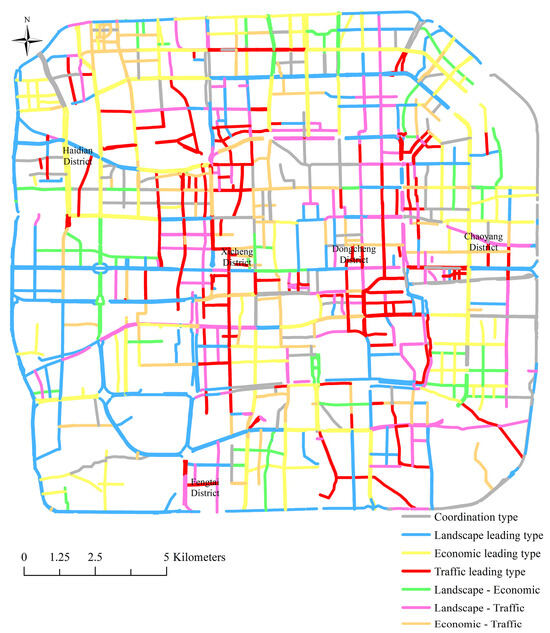
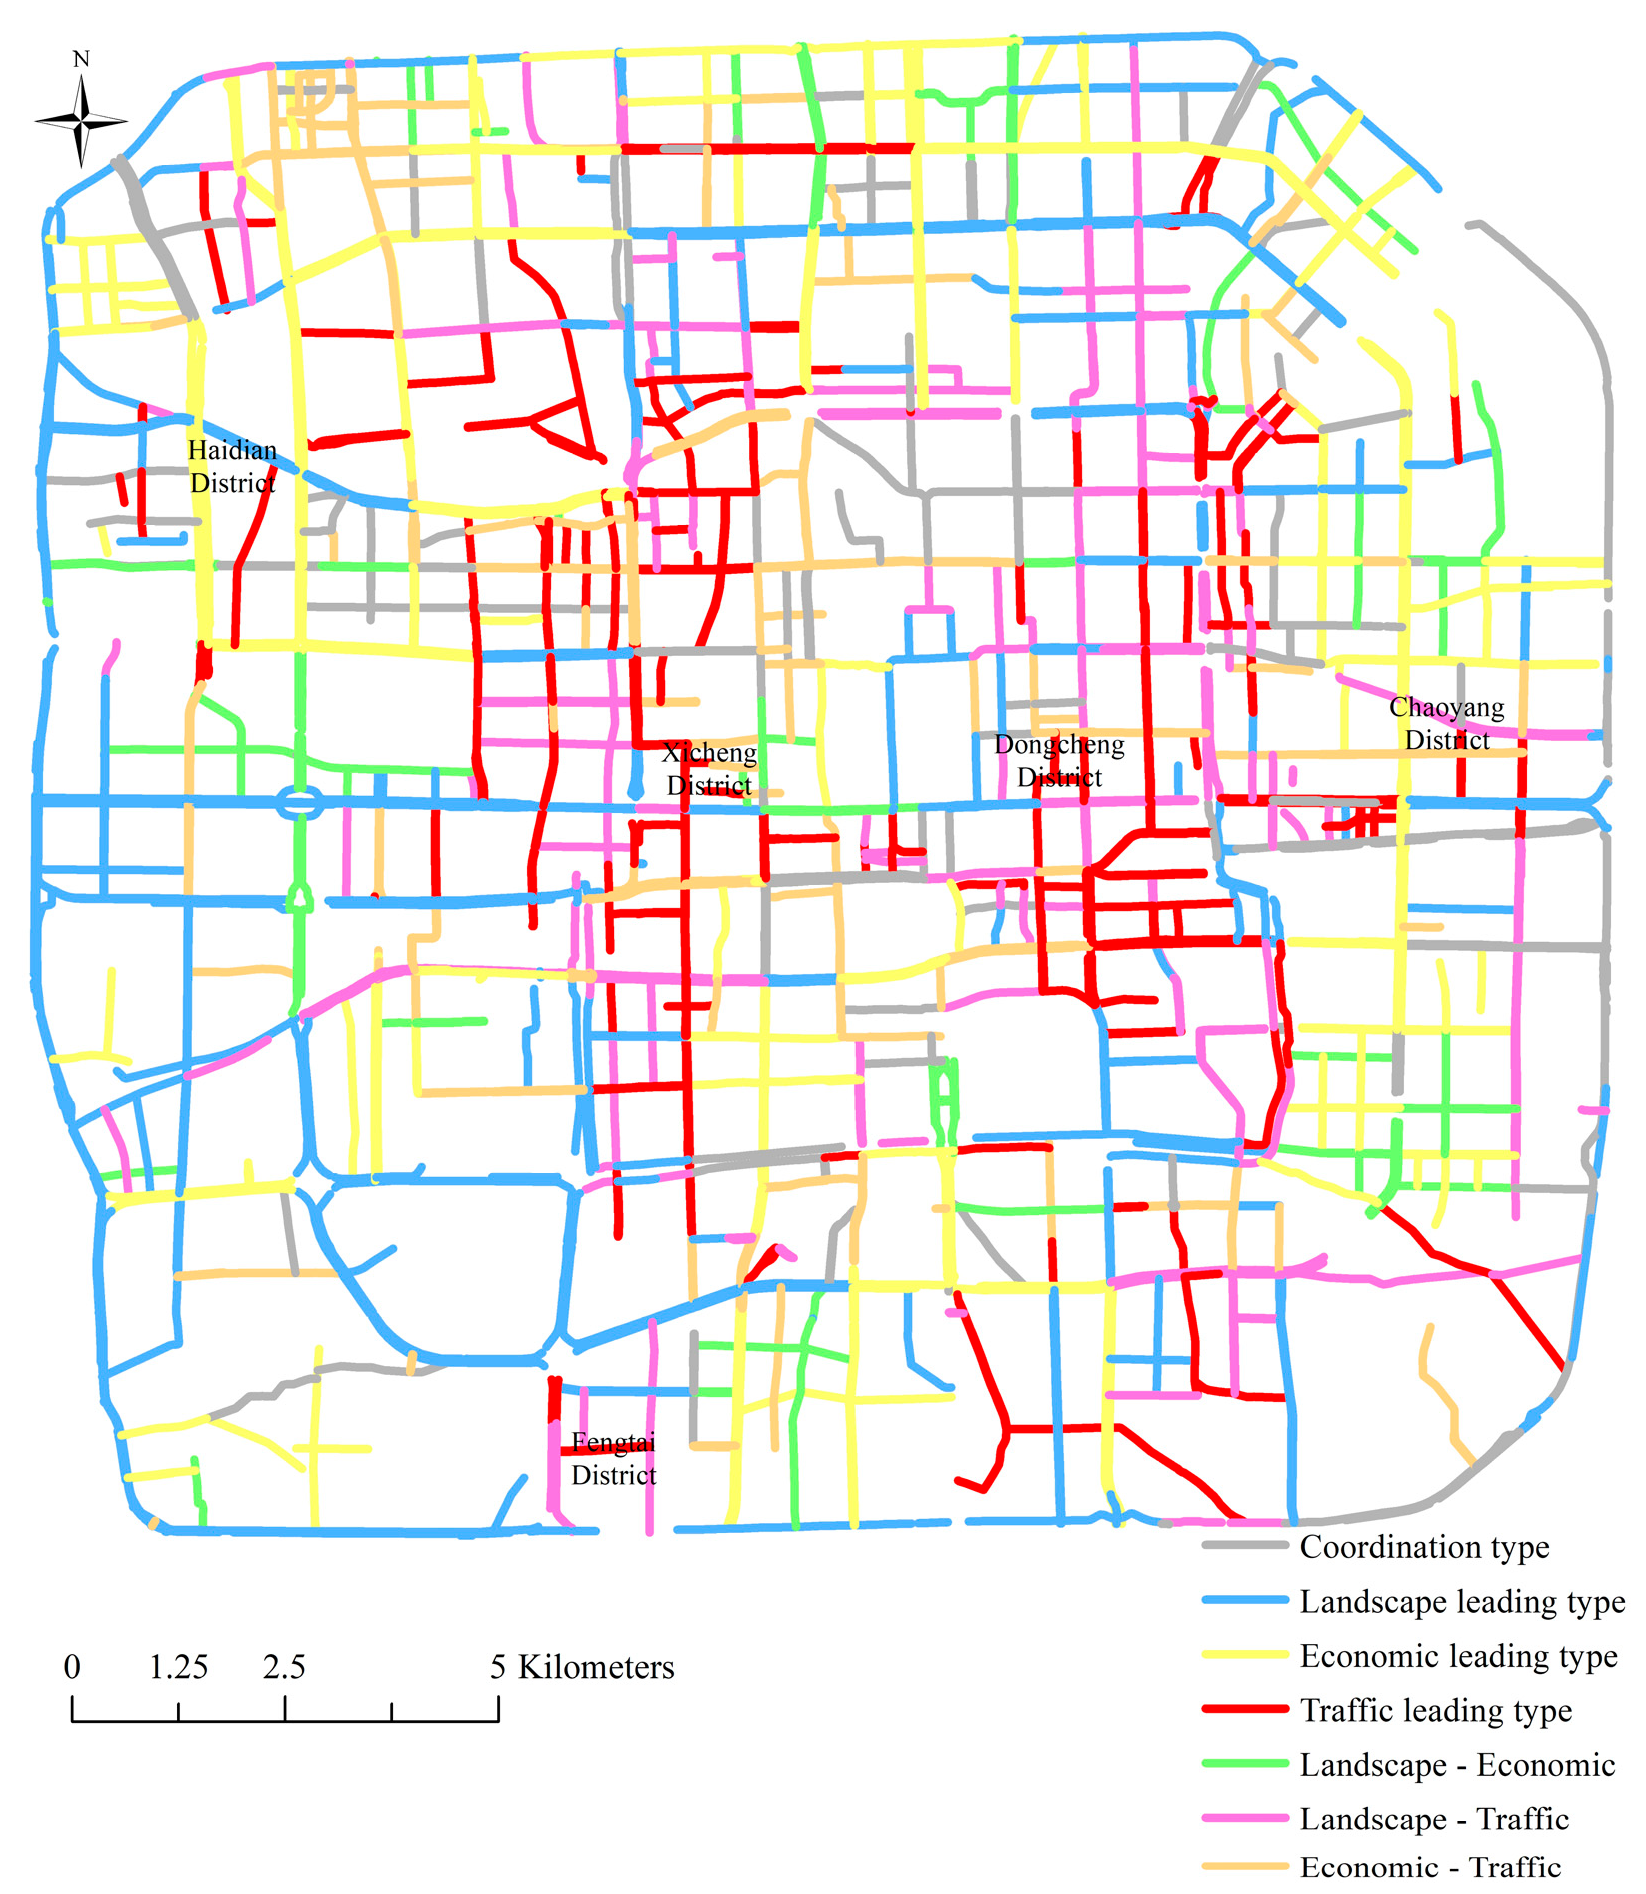
Figure 10.
Multifunctional street classification.
4. Discussion
Based on the traditional research method of the multiple functions of agricultural land, this study defined a multifunction system of urban streets, and Beijing was selected as an example to measure the spatial distribution of the landscape, traffic, and economic functions, while the tradeoffs among the multiple functions were determined. First, this study proposed a multifunctional measurement framework based on street view data and deep learning. Compared to traditional single-objective street research, the method proposed in this paper adopted a multifunctional perspective, considered multiple objectives, and attained a high efficiency, so it provides an important basis to better understand the spatial characteristics of city streets. Second, it divided the multiple function types of each street, which is helpful for government departments to clarify their development goals and formulate targeted policy recommendations. Third, in this study, the relationship among the landscape, traffic, and economic functions was further examined. The results showed that there existed a significant negative correlation between the landscape and economic function.
4.1. Multifunctional Perspective
Previous studies have focused more on a single street function, such as traffic accessibility and street greening, and systematic research on multiple street functions is lacking. As one of the basic units of the lives of urban residents, streets possess diversified functions. The requirements of sustainable and coordinated development indicate that street policies should adopt a multifunctional perspective. Based on the three functions of the landscape, traffic, and economy, this paper constructs a multifunction measurement system of streets and provides a new perspective for the study of multiple street functions.
The framework relies on the deep learning method to analyze street view images for the identification of sky conditions, vegetation, sidewalks, and other features. The proposed method is a less labor-intensive but accurate method, and it effectively assesses the differences between streets. We find that the landscape function in the northeastern and southwestern regions is higher than that in the other regions. The geographical agglomeration effect of the landscape function corresponds to cultural tourism facilities such as parks and museums in Beijing. These areas with strong landscape functions often exhibit poor economic functions, such as the Palace Museum and Temple of Heaven Park in Dongcheng District. The multifunctional perspective allows us to consider the spatial characteristics of various functions when explaining the results of a certain street function. In general, the landscape and economic functions in Beijing exhibit a gradual decline from the central urban area toward the urban areas farther away, and the decline in the traffic function is notable, as shown in Figure 4a–c. This indicates that Beijing is still very much a single-center city, and a traffic demand that is too high could lead to traffic congestion. Notably, this is a common problem in every large city. The geographical characteristics of the three functions are different, indicating that a spatial differentiation among the street landscape, traffic, and economic functions occurs. Many commercial and government office areas occur in the central area of Beijing, and the high building density and height constrain the street landscape. The numerous cultural and leisure facilities, such as parks and museums, in Dongcheng District also limit the commercial economy of its streets.
4.2. Policy Suggestions
Due to the different directions of public infrastructure and policy planning, the multiple function types of the streets in the study area reveal an obvious spatial heterogeneity. In the Fourth Ring Road District of Beijing, the proportion of single-function leading areas is the highest, accounting for more than 60% of the total area, of which the landscape function dominates, followed by the traffic and economic functions. The proportion of the dual-function coordination area is lower than that of the single-function leading area, of which the traffic–economic zone is the most frequently occurring, followed by the landscape–economic and landscape–traffic zones. Based on the functions to be developed in the dual-function coordination area, the following is determined: landscape function > traffic function > economic function. This is the reverse of the order of functions to be developed in the single-function leading area. The proportions of high-, medium-, and low-coordination areas are the lowest, all less than 5%.
In a large city such as Beijing with so many single-function leading areas, we cannot simply consider enhancing the coordination between streets. Because more of the same types of facilities could improve the agglomeration effect, the economic demand of the business district could increase, while the landscape demand could decrease. Policy guidance may also alter the direction of regional development, and cultural protection areas do not require a commercial atmosphere that is highly notable.
Hence, we adopt the administrative district as a unit to analyze the street types and future development needs, as listed in Table 4. We find that the central city (Dongcheng District and Xicheng District) attains the highest multifunctional coordination, followed by Chaoyang District. The characteristics of the central city are also different. In Xicheng District, the economic foundation is good, but the landscape function should be strengthened. In contrast, in Dongcheng District, the landscape environment is good, but the economic function should be strengthened. Fengtai District contains the best landscape environment, and Chaoyang District exhibits a high economic function, while Haidian District is balanced. In terms of transportation, the central urban area is much better than the other areas. Based on the above results, this study proposes the following policy recommendations for each administrative region.
Table 4.
Street types and future development needs of the administrative districts.
Dongcheng District is rich in historical and cultural buildings and parks, but there is a slight shortage in its economic development. Dongcheng District should continue to maintain its historical and cultural buildings and parks, and it should also pay attention to the maintenance of its ecological facilities. On this basis, we should clarify our own regional advantages and appropriately promote regional economic development.
The traffic advantages of Xicheng District are the most obvious, but its landscape construction is slightly lacking. Xicheng District should consolidate its economic advantages, improve the greening degree of surrounding streets and enhance the landscape quality of its streets.
Chaoyang District has a deep foundation of multifunctional construction and should continue to maintain the coordinated development of its multiple functions in the future. We should strengthen internal ecological construction and external transportation development.
Fengtai District contains the most advantages in regard to landscape function development, with the highest degree of street openness. It should focus on economic construction, increase economic investment, and improve traffic accessibility and regional multifunctional coordination while developing its own economic strength.
The development of Haidian District is relatively balanced. Haidian District is economically close to Xicheng District, and its street greening conditions are good. In the future, we should maintain the coordinated development of multifunctional streets, pay attention to the openness of streets, and improve the urban skyline.
4.3. Correlation of the Multiple Functions
By comparing the landscape and economic functions of streets, we find that the local economic function is often weak, while the landscape function is strong, and vice versa. This also leads to the problem of harmonious coexistence between human economic development and nature.
The three functions of streets were analyzed by Pearson correlation analysis. The Pearson correlation coefficient varies between 1 and −1. The correlation coefficient being closer to 1 or −1 means that there is a stronger positive or negative association between the two functions. As the correlation coefficient approaches 0, the association between the two variables becomes weaker. Another important index of Pearson correlation analysis is significance. It expresses whether the Pearson correlation coefficient between variables is significant. Significance and Pearson’s correlation coefficient are different. The correlation coefficient r indicates the strength of the relationship between the two, while the significance indicates whether the relationship between the two is credible, that is to say, they do have correlation. When the significance p value is below 0.01, it means the correlation coefficient between the two variables is extremely significant.
Table 5 indicates that all coefficients are significant at the 0.01 level (two-tailed). Correlations occur among the landscape, traffic, and economic functions. In particular, there exists a strong negative correlation between the landscape and economic functions. This also indicates that the urban landscape is affected to a certain extent. There are similarities between the past and future development directions of many cities in China. As a result, cities are becoming increasingly similar, thus losing the characteristics of distinct architectural styles.
Table 5.
Correlation between the multiple functions of streets.
The functions of the street landscapes in our study mainly include the degrees of sky openness, green coverage, and walking safety. These three aspects also greatly affect the happiness index of residents in urban life. In world-class cities with highly developed economies, people under pressure due to urban life often need streets with rich functions to meet their leisure expectations.
In addition, there occurs a significant positive correlation between the traffic function and the other functions, although it is not as strong as that between the landscape and economic functions. This also verifies that convenient transportation conditions facilitate the maintenance of streets, which ensures their economic vitality.
The three functions of streets are related to each other. They are all indispensable, but their coordination remains a difficult problem to resolve. For the government, the development of a city should also consider other street functions. Therefore, it is very important to study streets from the perspective of their multiple functions.
5. Conclusions
This paper is the first to define an index system of the multiple functions of urban streets, and a framework for multifunctional street measurement based on the deep learning method is proposed. From the perspective of the multiple functions, this paper measures the landscape, traffic, and economic functions of streets and examines the spatial differences between these three functions. The results indicate that there exists a spatial mismatch between the three functions. The street function of the central area of Beijing is higher than that of the surrounding suburban areas. Correlation analysis reveals that a significant negative correlation occurs between the landscape and economic functions, that is, when the landscape function of the street in the study area is strong, the economic function of the street is often weak, and vice versa. The openness and comfort of streets often cannot coexist with the prosperity of streets, which also indicates that the formulation of street development policies should consider multiple objectives. This paper further analyzes the multiple types of street functions and provides a basis for government departments to formulate policies. According to the street multifunction analysis results, multi-objective policy recommendations are proposed.
The application of multisource big geo-data to observe the urban space has become the main trend in urban planning research. The advantage of open-source data is that the data are easy to obtain and can be applied to other cities. Future research will further improve the multifunctional street evaluation system and will fully utilize the advantages of open-source data to expand the research area and examine the multifunctional differences and influencing factors of streets in different cities.
Author Contributions
Conceptualization, Shihang Fu and Yaolin Liu; methodology, Shihang Fu; software, Shihang Fu and Zhaoming Tong; validation, Ying Fang; formal analysis, Shihang Fu; investigation, Yaolin Liu; re-sources, Nannan Wang.; data curation, Nannan Wang and Zhaoming Tong; writing—original draft preparation, Shihang Fu; writing—review and editing, Shihang Fu; visualization, Shihang Fu; supervision, Ying Fang; project administration, Yaolin Liu; funding acquisition, Yaolin Liu. All authors have read and agreed to the published version of the manuscript.
Funding
This research was financially supported by the National Key Research and Development. Program of China (No. 2017YFB0503601).
Data Availability Statement
BSV image data, point-of-interest (POI) data, and road speed data pertaining to this study can be obtained from the Baidu developer interface (http://www.lbsyun.baidu.com, accessed on 1 September to 30 September, 2020). Street network data can be downloaded from OSM (http://www.openstreetmap.org, accessed on 1 September 2020). The other data that support the findings of this study are available from the corresponding author, upon reasonable request.
Conflicts of Interest
The authors declare no conflict of interest.
References
- Chin, M.H.; King, P.T.; Jones, R.G. Lessons for achieving health equity comparing Aotearoa/New Zealand and the United States. Health Policy 2018, 122, 837–853. [Google Scholar] [CrossRef] [PubMed]
- Lu, Y. Using Google Street View to investigate the association between street greenery and physical activity. Landsc. Urban Plan. 2019, 191, 103435. [Google Scholar] [CrossRef]
- Vries, S.D.; Dillen, S.V.; Groenewegen, P.P.; Spreeuwenberg, P. Streetscape greenery and health: Stress, social cohesion and physical activity as mediators. Soc. Sci. Med. 2013, 94, 26–33. [Google Scholar] [CrossRef] [PubMed]
- Rundle, A.G.; Bader, M.D.; Richards, C.A.; Neckerman, K.M.; Teitler, J.O. Using Google Street View to audit neighborhood environments. Am. J. Prev. Med. 2011, 40, 94–100. [Google Scholar] [CrossRef] [PubMed]
- Borin, M.; Passoni, M.; Thiene, M.; Tempesta, T. Multiple functions of buffer strips in farming areas. Eur. J. Agron. 2010, 32, 103–111. [Google Scholar] [CrossRef]
- Gurr, G.M.; Wratten, S.D.; Luna, J.M. Multi-function agricultural biodiversity: Pest management and other benefits. Basic Appl. Ecol. 2003, 4, 107–116. [Google Scholar] [CrossRef]
- Lester, S.E.; Costello, C.; Halpern, B.S.; Gaines, S.D.; White, C.; Barth, J.A. Evaluating tradeoffs among ecosystem services to inform marine spatial. Mar. Policy 2013, 38, 80–89. [Google Scholar] [CrossRef]
- Maria, L.P.; Cesare, P.M.; Laurence, M.J.; Marta, P.S. An aggregation framework to link indicators associated with multifunctional land use to the stakeholder evaluation of policy options. Ecol. Indic. 2011, 11, 71–80. [Google Scholar]
- Wang, J.; Lin, Y.; Anthony, G.; Xu, Y. Land-use changes and land policies evolution in China’s urbanization processes. Land Use Policy 2018, 75, 375–387. [Google Scholar] [CrossRef]
- Song, X.; Huang, Y.; Wu, Z.; Ouyang, Z. Does cultivated land function transition occur in China? J. Geogr. Sci. 2015, 25, 817–835. [Google Scholar] [CrossRef]
- Verburg, P.H.; Steeg, J.; Veldkamp, A.; Willemen, L. From land cover change to land function dynamics: A major challenge to improve land characterization. J. Environ. Manag. 2009, 90, 1327–1335. [Google Scholar] [CrossRef] [PubMed]
- Puchol-Salort, P.; O’Keeffe, J.; Van Reeuwijk, M.; Mijic, A. An urban planning sustainability framework: Systems approach to blue image green urban design. Sustain. Cities Soc. 2021, 66, 102677. [Google Scholar] [CrossRef]
- Hansen, R.; Pauleit, S. From Multifunctionality to Multiple Ecosystem Services? A Conceptual Framework for Multifunctionality in Green Infrastructure Planning for Urban Areas. Ambio 2014, 43, 516–529. [Google Scholar] [CrossRef] [PubMed]
- Kienast, F.; Bolliger, J.; Potschin, M.; Groot, R.; Verburg, P.H.; Heller, I.; Wascher, D.; Haines-Young, R. Assessing Landscape Functions with Broad-Scale Environmental Data: Insights Gained from a Prototype Development for Europe. Environ. Manag. 2009, 44, 1099–1120. [Google Scholar] [CrossRef] [PubMed]
- Liang, J.; Gong, J.; Sun, J.; Zhou, J.; Li, W.; Yi, L.; Shen, S. Automatic sky view factor estimation from street view photographs—A big data approach. Remote Sens. 2017, 9, 411. [Google Scholar] [CrossRef]
- Zhu, W.; Sun, Y.; Kurka, J.; Geremia, C.; Engelberg, J.K.; Cain, K.; Conway, T.; Sallis, J.F.; Hooker, S.P.; Adams, M.A. Reliability between online raters with varying familiarities of a region: Microscale Audit of Pedestrian Streetscapes (MAPS). Landsc. Urban Plan. 2017, 167, 240–248. [Google Scholar] [CrossRef]
- Fan, Z.; Zhou, B.; Liu, L.; Yu, L.; Fung, H.H.; Hui, L.; Carlo, R. Measuring human perceptions of a large-scale urban region using machine learning. Landsc. Urban Plan. 2018, 180, 148–160. [Google Scholar]
- Milojevic-Dupont, N.; Creutzig, F. Machine learning for geographically differentiated climate change mitigation in urban areas. Sustain. Cities Soc. 2021, 64, 102526. [Google Scholar] [CrossRef]
- Ezimand, K.; Chahardoli, M.; Azadbakht, M.; Matkan, A.A. Spatiotemporal analysis of land surface temperature using multi-temporal and multi-sensor image fusion techniques. Sustain. Cities Soc. 2021, 64, 102508. [Google Scholar] [CrossRef]
- Kong, L.; Liu, Z.; Wu, J. A systematic review of big data-based urban sustainability research: State-of-the-science and future directions. J. Clean. Prod. 2020, 273, 123–142. [Google Scholar] [CrossRef]
- He, L.; Páez, A.; Liu, D. Built environment and violent crime: An environmental audit approach using Google Street View. Comput. Environ. Urban Syst. 2017, 66, 83–95. [Google Scholar] [CrossRef]
- Yin, L.; Wang, Z. Measuring visual enclosure for street walkability: Using machine learning algorithms and Google Street View imagery. Appl. Geogr. 2016, 73, 147–153. [Google Scholar] [CrossRef]
- Richards, D.R.; Edwards, P.J. Quantifying street tree regulating ecosystem services using Google Street View. Ecol. Indic. 2017, 77, 31–40. [Google Scholar] [CrossRef]
- He, K.; Zhang, X.; Ren, S.; Sun, J. Deep residual learning for image recognition. In Proceedings of the 2016 IEEE Conference on Computer Vision and Pattern Recognition, Las Vegas, NV, USA, 26 June–1 July 2016; IEEE: New York, NY, USA, 2016; pp. 770–778. [Google Scholar]
- Tang, J.; Long, Y. Measuring visual quality of street space and its temporal variation: Methodology and its application in the Hutong area in Beijing. Landsc. Urban Plan. 2019, 191, 103436. [Google Scholar] [CrossRef]
- Kang, J.; Koerner, M.; Wang, Y.; Taubenboeck, H.; Zhu, X.X. Building instance classification using street view images. ISPRS J. Photogramm. Remote Sens. 2018, 145, 44–59. [Google Scholar] [CrossRef]
- Yin, L.; Cheng, Q.; Wang, Z.; Shao, Z. ‘Big data’ for pedestrian volume: Exploring the use of Google Street View images for pedestrian counts. Appl. Geogr. 2015, 63, 337–345. [Google Scholar] [CrossRef]
- Liu, L.; Silva, E.A.; Wu, C.; Wang, H. A machine learning-based method for the large-scale evaluation of the qualities of the urban environment. Comput. Environ. Urban Syst. 2017, 65, 113–125. [Google Scholar] [CrossRef]
- Harvey, C.; Aultman-Hall, L.; Hurley, S.E.; Troy, A. Effects of skeletal streetscape design on perceived safety. Landsc. Urban Plan. 2015, 142, 18–28. [Google Scholar] [CrossRef]
- Keralis, J.M.; Javanmardi, M.; Khanna, S.; Dwivedi, P.; Huang, D.; Tasdizen, T.; Nguyen, Q.C. Health and the built environment in United States cities: Measuring associations using Google Street View-derived indicators of the built environment. Public Health 2020, 20, 215. [Google Scholar] [CrossRef]
- Li, X.; Ratti, C.; Seiferling, I. Quantifying the shade provision of street trees in urban landscape: A case study in Boston, USA, using Google Street View. Landsc. Urban Plan. 2018, 169, 81–91. [Google Scholar] [CrossRef]
- Li, X.; Zhang, C.; Li, W.; Ricard, R.; Meng, Q.; Zhang, W. Assessing street-level urban greenery using Google Street View and a modified green view index. Urban For. Urban Green. 2015, 14, 675–685. [Google Scholar] [CrossRef]
- Chen, J.; Zhou, C.; Li, F. Quantifying the green view indicator for assessing urban greening quality: An analysis based on Internet-crawling street view data. Ecol. Indic. 2020, 113, 106192. [Google Scholar] [CrossRef]
- Ye, Y.; Richards, D.; Lu, Y.; Song, X.; Zhuang, Y.; Zeng, W.; Zhong, T. Measuring daily accessed street greenery: A human-scale approach for informing better urban planning practices. Landsc. Urban Plan. 2019, 191, 103434. [Google Scholar] [CrossRef]
- Barbierato, E.; Bernetti, I.; Capecchi, I.; Saragosa, C. Integrating Remote Sensing and Street View Images to Quantify Urban Forest Ecosystem Services. Remote Sens. 2020, 12, 329. [Google Scholar] [CrossRef]
- Ganji, A.; Minet, L.; Weichenthal, S.; Hatzopoulou, M. Predicting Traffic-Related Air Pollution Using Feature Extraction from Built Environment Images. Environ. Sci. Technol. 2020, 51, 10688–10699. [Google Scholar] [CrossRef] [PubMed]
- Zhang, F.; Wu, L.; Zhu, D.; Liu, Y. Social sensing from street-level imagery: A case study in learning spatiotemporal urban mobility patterns. ISPRS J. Photogramm. Remote Sens. 2019, 153, 48–58. [Google Scholar] [CrossRef]
- Wang, R.; Liu, Y.; Lu, Y.; Zhang, J.; Grekousis, G. Perceptions of built environment and health outcomes for older Chinese in Beijing: A big data approach with street view images and deep learning technique. Comput. Environ. Urban Syst. 2019, 78, 101386. [Google Scholar] [CrossRef]
- Mao, W.; Wang, W.; Jiao, L.; Zhao, S.; Liu, A. Modeling air quality prediction using a deep learning approach: Method optimization and evaluation. Sustain. Cities Soc. 2021, 65, 102527. [Google Scholar] [CrossRef]
- Nagataa, S.; Nakayaa, T.; Hanibuchia, T.; Amagasab, S.; Kikuchib, H.; Inoue, S. Objective scoring of streetscape walkability related to leisure walking: Statistical modeling approach with semantic segmentation of Google Street View images. Health Place 2020, 66, 102428. [Google Scholar] [CrossRef]
- Fry, D.; Mooney, S.J.; Rodríguez, D.A.; Caiaffa, W.T.; Lovasi, G.S. Assessing Google Street View Image Availability in Latin American Cities. J. Urban Health 2020, 97, 552–560. [Google Scholar] [CrossRef]
- Zhang, F.; Zu, J.; Hu, M.; Zhu, D.; Huang, Z. Uncovering inconspicuous places using social media check-ins and street view images. Comput. Environ. Urban Syst. 2020, 81, 101478. [Google Scholar] [CrossRef]
- Campbell, A.; Both, A.; Sun, Q. Detecting and mapping traffic signs from Google Street View images using deep learning and GIS. Comput. Environ. Urban Syst. 2019, 77, 101350. [Google Scholar] [CrossRef]
- Wang, R.; Feng, Z.; Pearce, J.; Yao, Y.; Li, X.; Liu, Y. The distribution of greenspace quantity and quality and their association image with neighbourhood socioeconomic conditions in Guangzhou, China: A new approach using deep learning method and street view images. Sustain. Cities Soc. 2021, 66, 102664. [Google Scholar] [CrossRef]
- Chen, L.; Lu, Y.; Sheng, Q.; Ye, Y.; Liu, Y. Estimating pedestrian volume using Street View images: A large-scale validation test. Comput. Environ. Urban Syst. 2020, 81, 101481. [Google Scholar] [CrossRef]
- Duncan, D.T.; Aldstadt, J.; Whalen, J.; Melly, S.J.; Gortmaker, S.L. Validation of Walk Score for estimating neighborhood walkability: An analysis of four US metropolitan areas. Int. J. Environ. Res. Public Health 2011, 8, 4160–4179. [Google Scholar] [CrossRef] [PubMed]
- Ewing, R.; Handy, S.L. Measuring the unmeasurable: Urban design qualities related to walkability. J. Urban Des. 2009, 14, 65–84. [Google Scholar] [CrossRef]
- Hajrasouliha, A.; Yin, L. The impact of street network connectivity on pedestrian movement. Urban Stud. 2015, 52, 2483–2497. [Google Scholar] [CrossRef]
- Marshall, W.; Garrick, N. Effect of street network design on walking and biking. Transp. Res. Rec. J. Transp. Res. Board 2010, 2198, 103–115. [Google Scholar] [CrossRef]
- Naik, N.; Philipoom, J.; Raskar, R.; Hidalgo, C. Streetscore–predicting the perceived safety of one million streetscapes. In Proceedings of the 2014 IEEE Conference on Computer Vision and Pattern Recognition Workshops, Columbus, OH, USA, 23–28 June 2014; IEEE: New York, NY, USA, 2014; pp. 793–799. [Google Scholar]
- Wu, L.; Kim, S.K. Health outcomes of urban green space in China: Evidence from Beijing. Sustain. Cities Soc. 2021, 65, 102604. [Google Scholar] [CrossRef]
- Koohsari, M.J.; Karakiewicz, J.A.; Kaczynski, A.T. Public open space and walking: The role of proximity, perceptual qualities of the surrounding built environment, and street configuration. Environ. Behav. 2013, 45, 706–736. [Google Scholar] [CrossRef]
- Millward, H.; Spinney, J.; Scott, D. Active-transport walking behavior: Destinations, durations, distances. J. Transp. Geogr. 2013, 28, 101–110. [Google Scholar] [CrossRef]
- Bin, J.; Bryan, G.; Eric, L.; Liu, Z. Multi-source urban data fusion for property value assessment: A case study in Philadelphia. Neurocomputing 2020, 404, 70–83. [Google Scholar] [CrossRef]
- Tong, Z.; Zhu, Y.; Zhang, Z.; An, R.; Liu, Y.; Zheng, M. Unravel the spatio-temporal patterns and their nonlinear relationship with correlates of dockless shared bikes near metro stations. Geo Spat. Inf. Sci. 2022, 26, 577–598. [Google Scholar] [CrossRef]
- Daniel, C.B.; Mathew, S.; Subbarayan, S. GIS-Based Study on the Association Between Road Centrality and Socio-demographic Parameters: A Case Study. J. Geovisualization Spat. Anal. 2022, 6, 1. [Google Scholar] [CrossRef]
- Al Sayed, K.; Turner, A.; Hillier, B.; Iida, S.; Penn, A. Space Syntax Methodology; UCL: London, UK, 2014. [Google Scholar]
- Ye, Y.; Van Nes, A. Quantitative tools in urban morphology: Combining space syntax, spacematrix, and mixed-use index in a GIS framework. Urban Morphol. 2014, 18, 97–118. [Google Scholar] [CrossRef]
- Chiaradia, A.; Cooper, C.; Webster, C. sDNA: A Software for Spatial Design Network Analysis. 2013. Available online: http://www.cardiff.ac.uk/sdna/ (accessed on 19 June 2016).
- Comber, A.; Brunsdon, C.; Green, E. Using a GIS-based network analysis to determine urban greenspace accessibility for different ethnic and religious groups. Landsc. Urban Plan. 2008, 86, 103–114. [Google Scholar] [CrossRef]
- Tsoka, S.; Leduc, T.; Rodler, A. Assessing the effects of urban street trees on building cooling energy needs: The role of foliage density and planting pattern. Sustain. Cities Soc. 2021, 65, 102633. [Google Scholar] [CrossRef]
- Fang, Y.; Wang, J.; Kong, X.; Rongtao, W.U.; Baolian, L.I.; Liu, J. Trade-off relation Measurement and Zoning Optimization of Multi-functionality of Cultivated Land Use: A Case Study of Henan Province. China Land Sci. 2018, 32, 57–64. [Google Scholar]


Disclaimer/Publisher’s Note: The statements, opinions and data contained in all publications are solely those of the individual author(s) and contributor(s) and not of MDPI and/or the editor(s). MDPI and/or the editor(s) disclaim responsibility for any injury to people or property resulting from any ideas, methods, instructions or products referred to in the content. |
© 2023 by the authors. Licensee MDPI, Basel, Switzerland. This article is an open access article distributed under the terms and conditions of the Creative Commons Attribution (CC BY) license (https://creativecommons.org/licenses/by/4.0/).