1. Introduction
Individual elements and features of a space influence life quality [
1]. They can affect the sense of security, the possibility of regeneration, social relations in the neighborhood, or sensory feelings. Therefore, if omitted during the spatial planning processes, they imperceptibly affect people’s lives [
2]. However, those aspects often do not have a measurable or material nature. As a result, they are hard to identify through external observation, typical of expert practice (i.e., during a field study). This argument is essential for expanding the group of stakeholders participating in the decision-making process. Ignoring residents’ knowledge resulting from everyday experiences of functioning in a space, i.e., experiential knowledge, may affect the deconstruction of essential features of the space [
3].
Spatial planning is a continuous process of decision-making in which knowledge, access to it, its integration and creation, are key elements [
4,
5]. Improving the quality of decisions by including the unique knowledge of residents is one of the primary goals of public participation in spatial planning [
6,
7]. Spatial planning practices are mainly expert-centric processes and there is a lack of space for local knowledge resulting from residents’ experiences, everyday observations, and perception of the space. As a result, public participation in spatial planning is limited to investment proposals or reactions to decisions already made [
6,
8]. On the other hand, scholars emphasize that the involvement of residents’ knowledge at the early stages of decision-making processes (a diagnostic phase and an early design phase) contributes to a greater public acceptance of decisions, reduction in conflicts, and a better understanding of the design conditions and outcomes [
9,
10]. It can also protect the whole process from time delays, as accessing new knowledge at the advanced stages of the design (or even investment stage) may significantly change the design conditions [
11].
The role and place of society and their knowledge in local governance result from the maturity of management systems grounded in the democratic state system and its evolution into a deliberative form. Decisions in deliberative democracy manifest a public good, not a political decision [
12]. They are made with the participation of the people of the place [
13] who will be affected by the decisions. In this approach, the decisions are not the aggregation of public preferences, but the result of the opinions and arguments presented by the stakeholders participating in the process [
12]. The key to the success of such a form of democracy is knowledge, its production resulting from the communication and cooperation between different stakeholders and the ability to use it by local communities; otherwise, they will not be empowered [
14,
15].
Nowadays, many European democracies face problems such as a decline in trust in public institutions, a growing level of alienation and powerlessness, a declining turnout in elections, a rise in the popularity of radical political parties, as well as more and more common forms of opposition by citizens in the form of organized protests [
16,
17]. Indicated challenges are not only the result of the financial and migration crisis but also the result of processes observed for many years, including transnationalisation and the growing complexity of management processes [
16].
According to Innes and Booher [
6], involving residents in decision-making is often counterproductive and leads to distrust of the authorities. Legally imposed ways of involving residents do not work because they attract an unrepresentative sample and are only used to follow up on decisions already made and to avoid public criticism. As a result, they leave residents with little or no influence on the decisions [
7]. Public participation geographic information systems (PPGIS) were designed to address such challenges. One of the primary goals of PPGIS is to support actual public participation in decision-making, to increase residents’ access to the process, to provide more accurate data for design processes, and to create opportunities for involving residents at different stages of decision-making, including diagnosis of the area [
18,
19,
20,
21,
22,
23,
24,
25,
26,
27]. It is assumed that PPGIS has the potential to engage less active social groups, increase public trust, and foster the awareness of the determinants of the planning processes [
22,
28,
29]. It supports residents’ inclusion in the spatial development process, limits conflicts instead of intensifying them, and legitimizes socially acceptable decisions [
22,
30,
31]. One of the PPGIS goals is to create a bridge between planners and residents [
3], which refers to the assumption that residents, being everyday users of a given space, have a unique knowledge of the spatial development of their surroundings, both of the quality and existing problems. Under this approach, a SoftGIS methodology was developed. It is focused on including the residents’ local knowledge in the spatial planning by obtaining “soft” data about everyday life paths, perception of places or activities undertaken in a given space, and as a consequence including them in the GIS (“hard”) database concerning a space [
3,
32,
33].
Nevertheless, the latest studies show that the use of PPGIS does not significantly support the increase of the level of public participation [
8,
34]. The study conducted in Poland by Bąkowska-Waldmann and Kaczmarek [
8] indicates among the main causes of the above are an absence of or low involvement of residents’ knowledge at the diagnostic stage of the decision-making process, inappropriate motivations for PPGIS use and goals of public consultations. Based on interviews and long-term case study analyses conducted in Poznań agglomeration, local authorities deciding to implement the PPGIS method were focused mainly on the number of respondents, communication with them (identified as a form of local government’s openness to residents), and legitimacy of previously assumed solutions (op. cit.). As a result, the main outcome of PPGIS use in spatial planning was the increase in the number of people involved in public consultations, but not the increase in the level of public participation on the ladder of participation.
According to Kahila-Tani [
35], PPGIS has the most significant potential for application at the stage of initiation (including early initiation) of the spatial decision-making process, when it is possible to acquire the residents’ knowledge as a valuable planning material in the design process. It also refers to a SoftGIS methodology, which aims to support public participation, allowing the residents to share their knowledge about their environment with urban planners and researchers [
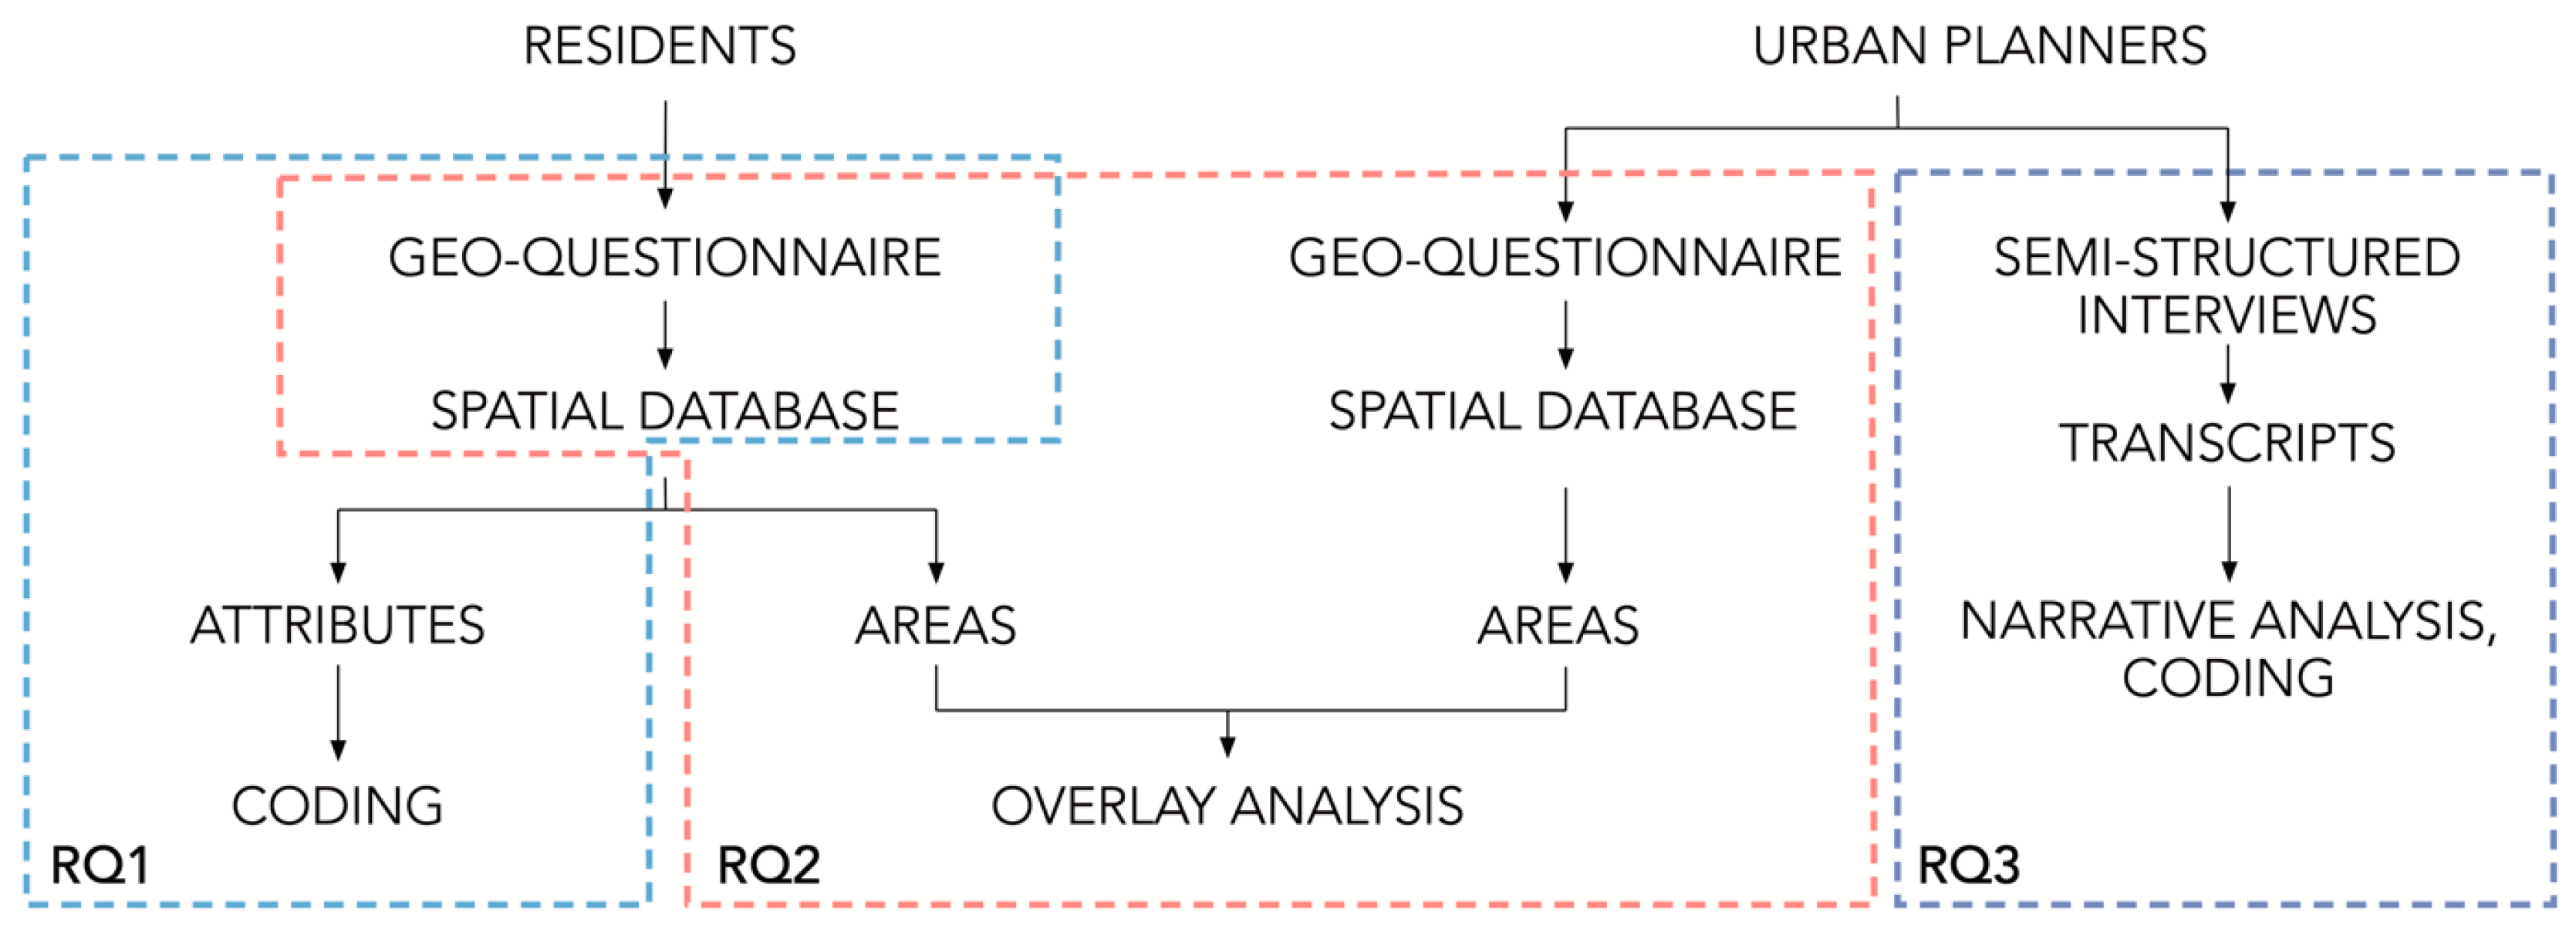
3]. However, there is a lack of studies that would confront the experiential knowledge of residents with the expertise of urban planners about a given space, which could characterize the differences and spheres with the potential to increase the role of residents’ knowledge in spatial planning. In the study, which is the subject of the paper, conducted in a chosen area of Poznań (Poland) using a PPGIS tool, i.e., a geo-questionnaire, the possibilities and potential benefits of the integration of residents’ experiential knowledge into a professional (expert) diagnosis of the space as an element of the decision-making was investigated. The study was conducted in 2022 with the participation of 300 residents from the selected area and eleven representatives of the local administration (urban planners). The main purpose of the study was to investigate how residents’ experiential knowledge differs from urban planners’ (expert) knowledge to understand the importance of knowledge integration for the early stages of decision-making in spatial planning. The research questions were as follows:
RQ1: What are the characteristics of residents’ experiential knowledge about the area communicated during the spatial diagnosis using PPGIS?
RQ2: What are the characteristics of the potential areas of differences in the space diagnosis among residents and local authorities?
RQ3. What is the role of residents’ experiential knowledge in professional spatial planning?
The paper presents the characteristics of local knowledge and its potential for integration with experts’ knowledge that were investigated on the basis of a pilot study. A concluding discussion follows on how PPGIS can be used to support the collection of residents’ experiential knowledge for the purposes of the decision-making processes at diagnostic stages.
2. Materials and Methods
The study was conducted in two neighborhoods of downtown Poznań: Old Town and St. Lazarus. Poznań is a capital city of Wielkopolska voivodship. It is located in western Poland, and along with the surrounding communes it forms the Poznań agglomeration with over 1,000,000 inhabitants. The history of Poznań dates to the 10th century, when a settlement of the Piasts, the founders of Poland, was established in Ostrów Tumski, now part of downtown Poznań. The last decade has been a time of intensive renovation and modernization of infrastructure and public spaces in the downtown area. Currently, the City Hall is implementing the Center Program, under which the transportation system is modernized, and changes in the use of public spaces are taking place towards greater accessibility and friendliness for users. The essential elements of these changes are infrastructure modernization, limiting car traffic in favor of bicycle transport and pedestrian traffic, and increasing the share of green areas.
The study participants were representatives of two groups: (1) residents of the studied area and (2) urban planners with a good knowledge of the studied area (
Table 1). The former group (referred to as “residents” in the paper) consisted of 300 adult residents of the selected area. The sample was selected purposively and limited to people aged 20–54 due to the online research method, in which it was impossible to use random sampling (resulting, among others, from digital exclusion). The focus of the study was on the PPGIS tool, and according to the study by Bąkowska-Waldmann [
36] conducted in Poland in 2015–2020, these age group representatives are most active in public consultations using PPGIS. The first group of participants was recruited using methods typical for communicating public consultation processes in spatial planning with the use of PPGIS. These included geographically-oriented social media advertising, information in local media, posters in public spaces from the study area, and newsletters of local councils.
The latter group of respondents (the second sample; referred to as “urban planners” in the paper) consisted of eleven urban planners having a master’s degree in spatial management or architecture and professional experience working in the studied area. The representatives of this group were selected purposively. They had various specialties in spatial planning that can be related to different stages of the spatial planning procedures: planning, implementation, and investment and maintenance. The specificity of their areas of expertise was dependent on their engagement in the spatial planning processes, i.e., on whether it was the planning phase (planning procedures), implementation phase (coordination of spatial development projects), or investment and maintenance phase (administration of roads, urban greenery, and public transport). All the participants worked in the field of spatial planning in local administration for more than three years.
The study consisted of three research stages dedicated to answering each of the research questions (
Figure 1).
Respondents (both residents and urban planners) were asked to fill in the online PPGIS questionnaire (geo-questionnaire), which allowed them to mark places of interest on a map (a maximum of three indications per respondent from the group of residents in each category and an unlimited number of indications per respondent from the group of urban planners). The software used was Lopi Ask. The respondents supplemented the spatial data with detailed information (descriptive data) with characteristics provided by themselves (e.g., reasons for selecting a particular place, expected changes, or problems experienced in the area). The data were collected about the presence of specific features of the area and changes within it, both those taking place in recent years and those expected by respondents. This led to the creation of a geographical database (see
Table 2). The database consisted of spatial data on the location of ten selected features of the areas, vital from the perspective of life quality [
1,
37,
38]. For the purposes of this paper, only three features with the highest number of spatial references were analyzed: thermal comfort, noise, and traffic safety.
First, an analysis was conducted of the information accompanying the places from groups A and B indicated by the respondents from the group of residents, i.e., places where changes took place (assessed by respondents as negative or positive), and places where they expect changes (with a distinction between different forms of the current land use). The comments in the attribute tables were a response to the query for explaining the reasons for indicating a given place. Each respondent could mark on a map a maximum of three points in each category. The analysis was carried out using coding, i.e., generating an index of terms supporting the interpretation of data. The codes were not predefined and were selected at the stage of qualitative content analysis [
39]. The data were analyzed to identify the manifestations of knowledge about the area (RQ1). The analysis also aimed to characterize the types of information that respondents provided to justify their choices, i.e., making a typology of phenomena articulated by the respondents.
Second, an overlay analysis of places indicated by the participants via geo-questionnaire was conducted. The data from two groups of participants were separated according to each type of information indicated in
Table 1. As a result, it was possible to conduct a polygon-to-polygon overlay analysis, demonstrating the differences in the space diagnosis according to knowledge, assessment, and expectations for the development of the area expressed by the residents and urban planners in the geo-questionnaire (RQ2). Then, to identify the possible context of differences, selected areas were analyzed according to current land use (overlay analysis using land use maps) and information from the respondents (attributes content analysis). The purpose of this stage was to answer the second research question.
Third, semi-structured interviews were conducted among participants from the group of urban planners. Before the interview, the interviewees received the report with the results of a geo-questionnaire survey conducted among the residents. The interviews were focused on (1) the overall assessment of the report from the perspective of the novelty of data (knowledge) collected among the respondents, (2) the presence and the importance of residents’ knowledge in the professional work in local administration, and (3) the potential of PPGIS in diagnosing space with the use of residents’ knowledge. The qualitative narrative analysis of interviews was dedicated to finding answers to the last research question (RQ3).
3. Results
3.1. Characteristics of Residents’ Knowledge
The characteristics of residents’ knowledge were identified based on the responses of respondents from the group of residents. The responses were analyzed according to (A) the expected changes in the area according to the land use and the type of the response and (B) changes that occurred in the area in the last 10 years.
As a result of coding the comments collected according to expectations towards the changes in the studied areas, six types of responses were identified. Four were individual and contained information about: the problem identified, opinion about a place, expected changes (actions to be taken), and expected results. The last two types of responses were mixed and contained problem identification together with expected changes or expected results. In all land use categories, the expected changes were most often the content of comments (
Figure 2). Respondents from the group of residents were proposing direct solutions, such as in the example connected with the improvement for cyclists: “Connecting Zachodnia Street with Kanałowa Street would allow you to bypass Głogowska Street.” The highest share of responses in this type related to urban greenery and transportation areas. It can be assumed that the reason for that is the direct impact on users: difficulty in moving around the city, and greenery which, if neglected or absent, is easily noticeable. The expected results were visibly less often the content of the respondents’ comments than expected changes. Still, while analyzing the comments towards an undeveloped area, the share in this type of comment was visibly higher than in the others. It is assumed that the final effect of developing such an area is clearly easier for non-experts to imagine as a series of actions to be taken. The problems identified in a given area accounted for 1/3 of all responses—as a single content of a comment or together with expected changes or results. Respondents referred, i.e., to traffic safety and comfort of public spaces, especially related to weather conditions, such as in the following comment: “The new roofing of the marketplace makes it very hot in summer, and when it rains, everything falls inside”. The last type of responses were opinions about places. The number of this type of comment was the highest for undeveloped areas and for public squares (most of them in the downtown area were recently renovated or are under construction). The vast majority of this type of response was connected with dissatisfaction with the current state of the areas and their arrangement.
While indicating places that participating residents would like to be changed, the respondents were asked for the justification of their choices. The analysis of the answers aimed at identifying manifestations of experiential knowledge. Only the responses coded as identifying a problem (also supplemented with expected changes or results) provided content that can be assumed as that type of knowledge. Further detailed analysis of the answers revealed that 63.1% of the comments referred to the information that could be obtained also during the inventory of the area or through analysis of professional documentation. 36.9% of the collected information referred to phenomena that could be identified only through personal experience or longer observation of the site. Those phenomena were as follows (examples of statements made by respondents are given in brackets):
Difficulties in the movement around a neighborhood (“No possibility of cycling from Orzeszkowa or Parkowa Streets to the Dworcowy Bridge.”),
Architectural barriers (“Going from Ratajczaka Street to Matyi Street, it is difficult to walk with a trolley because of the underground crossings with stairs you have to take a longer route through the park.”),
Traffic safety (“Drivers notoriously force priority ignoring the safety of children.”),
Disorder and the presence of people who compromise the sense of security (“Social gatherings are often held here, people consume alcohol, throw litter and make noise.”),
Places for recreation (“Children like to spend time in the market square, one slide without a shadow does not work, children are bored and run around the fountain.”),
Thermal comfort (“The whole market square is like a frying pan and if you want to hide under the roof, you cannot stand the stuffiness; it is hard to bear there.”),
Noise (“There are motorbikes here that make much noise at night.”),
Smells (“The area has been neglected; people walk their dogs here, so it stinks here.”)
The content analysis of the respondents’ comments regarding the changes that occurred in the last 10 years in the analyzed area (
Table 3) revealed three types of statements:
Respondents’ opinions about the place (e.g., “This park forms a beautiful part of the city’s landscape and is an important site for the surrounding area. “)
Respondents’ observations (e.g., “The area of former allotment gardens is decaying and going wild. It was supposed to be a shopping center and a recreation area for residents, but currently it is an unofficial car park, a dump and a feeding ground for wild boars.”)
Respondents’ experiences in the given place (e.g., “The area was renewed, which increased my sense of security here.”)
Respondents from the group of residents indicated 943 places in total—420 were marked as changed negatively and 523 were marked as changed positively.
The observation was the most common element of comments accompanying places where changes have occurred in the last ten years. They relate to elements that can be observed also, e.g., during a land inventory. In comments concerning places with negative assessments, they were most often accompanied by opinions (over 63.1% of the statements contained an element of opinion, and 38.6% contained only opinions). For the places where respondents assessed positive changes, the most frequent element of statements was observation (86.0%), with more than half (51.8%) of statements containing only information about observations. Experience, considering all statements, was the rarest element (27.5%), while the share of comments for positive and negative changes was comparable (28.5% and 26.2%, respectively).
From the point of view of knowledge integration in the decision-making process, the only useful content will relate to the experience of users, i.e., experiential knowledge. The experience of phenomena in a given space requires not only short-term observation that takes place during the inventory of the area but also direct contact with it, related to the functioning of the elements in the area. Thus, this type of knowledge is not directly accessible to an urban planner, who only partially performs his work in the field.
3.2. Differences in Spatial Diagnoses between Residents and Urban Planners
Conducting overlay analyses of three selected features in the studied area: lack of traffic safety, lack of thermal comfort, and noise, it was possible to identify the areas of differences among the two groups of respondents (
Table 4). The three chosen features of the studied area were related to user-experience and perception of the space, i.e., aspects of knowledge about the area requiring personal experience of the space.
The overlay analysis conducted according to the first analyzed aspect of traffic safety revealed that respondents from the group of urban planners identified primary roads only as unsafe. Apart from the main communication routes, participants from the second group of respondents (residents) identified numerous pedestrian crossings and road intersections in the downtown area (
Figure 3) with a speed limit of 30 km/h (“zone 30”). Urban planners marked most of the “zone 30” area as safe due to the legal speed limits in the area, thereby ignoring the fact that some drivers do not apply the speed limit or priority of pedestrians. The respondents from the group of residents also pointed to the dangers related to, for example, inattentive driving of scooters.
In the second aspect, a lack of thermal comfort, differences were minor. Both groups selected areas with strong sun exposure: main transportation routes without greenery and public city squares and markets. The first group of differences was identified in connection with recreational areas. Only respondents from the group of residents identified a lack of thermal comfort in playgrounds and around sports facilities (
Figure 4).
On the other hand, urban planners selected residential sites of the studied area (mainly 4-storey townhouses) as exposed to high temperatures and sun (
Figure 5). Former studies show that the building height supports the cooling effect because of shading and air flows [
40]. However, the effect increases with height (to some extent) and depends on the urban design of the streets [
41]. Densely built areas are urban heat islands. Nevertheless, different factors can increase or decrease this effect. Also, the grounds of the Poznań International Fair, which mainly consists of exhibition halls and roads, were indicated mainly by respondents from the group of urban planners (
Figure 6). It has to be noted that the area is inaccessible to residents on a daily basis, which may justify why it was not frequently indicated by this group of respondents. In turn, urban planners could indicate it due to a small share of green areas here.
Noise, as the last feature under study, was identified by both groups of respondents along main roads. Although tests of noise intensity are becoming more and more common, they are usually carried out in single locations during the day, while the noise experienced by residents, as the study showed, was usually associated with nighttime activities. It refers to the shopping and entertainment street in the Old Town (
Figure 7) and the area for night events with gastronomy on the outskirts of St. Lazarus which is near a residential area.
On the other hand, respondents from the group of urban planners indicated the whole area of the historic Old Town. In contrast, respondents limited their indication to selected streets with pubs and restaurants. Urban planners were alone in pointing a railway running through the study area’s northern part, and Niepodległości Avenue which bypasses the Old Town (
Figure 8). High noise levels in these places were confirmed using the acoustic maps for the city of Poznań, made for the main communication routes [
42].
The last identified difference concerned the cultural and recreational zone by the Warta River indicated by urban planners (
Figure 9). It is one of the most popular places in Poznań during summer. However, it is located far from the residential areas, which was probably the main reason why this place was not among the places indicated by the residents.
3.3. Urban Planners’ Approach to Residents’ Knowledge
The interviews with urban planners revealed numerous challenges in collecting and integrating residents’ experiential knowledge in the three types of processes connected with spatial planning and development—planning, implementation of the planning decisions, and investment and maintenance. In all the three groups of interviewees, the importance of residents’ experiential knowledge was emphasized as meaningful and fulfilling in their work. However, because of time restrictions (connected with the planning procedures and investment processes) and lack of interest among residents, taking advantage of residents’ knowledge is very limited. Even though the importance of residents’ participation in the spatial diagnoses was emphasized, it was only hypothetical.
According to interviewees, public participation processes are legally regulated, which strongly determines how these processes are to take place. However, even if the national law omits the role of public participation in the local diagnosis, in Poznań the city planning office introduced an additional, obligatory procedure for every local spatial development plan. It involves meetings with interested stakeholders at the very start of the procedure. During those meetings, residents can get familiar with the legal conditions and administrative procedures for the development of the area. During the meetings, they can also take the floor, asking questions, airing their expectations or making comments about the area. One of the urban planners said: “(…) residents of a given area know more than we do; they live there every day, so they are able to tell us more. We have knowledge about a site from formally available sources or field visits, and residents simply from everyday living in this space.” However, the interviewees pointed out that there is little interest in participating in these meetings among the residents, and for many of them it is too abstract. Personal involvement is greater when the area for which the plan is created is significant in the scale of the whole city or has caused controversy for a long time (e.g., with a significant change in use and residents’ and owners’ fear of negative consequences, such as the loss of allotments). On the other hand, in the case of such plans, there are more expectations of residents and proposals than a substantive contribution. It should be noted that this type of public consultations is carried out using usual methods (meetings, correspondence), which is a significant barrier to accessing them due to limitations, e.g., time constraints of the general population. Urban planners pointed to the very high importance of residents’ involvement at the earlier stages, which may protect them from extending the procedure due to clear objections from residents following formal arrangements with external units, required by the legal regulations. On the other hand, they are deprived of tools (which is also a result of local authorities’ decisions) that would make it possible to increase the residents’ presence at this stage. Occasionally, the residents are a source of historical knowledge about a given place for designers (e.g., in the form of photos), but the archival materials available to the city in most cases are extensive and sufficient.
A second group of interviewees was represented by urban planners specialized in the implementation phases of decision-making in spatial planning, i.e., responsible for the creation and coordination of more detailed urban design projects, resulting from local spatial development plans. In this group of interviewees, the smallest gap between residents and designers was noticed as communication with residents and their representatives in local councils is an integral element of project implementation. They conduct various types of meetings with residents, from formal ones held at the office, to less formal ones such as cultural events or workshops. It is the best opportunity for urban planners to talk to residents and learn from them about the area and the current problems resulting from their experiences and the history of the place. Older people often express sentiments during those meetings connected with the earlier atmosphere of a given place and do not necessarily indicate its technical development. Also, in this group, the interlocutors indicated a lack of sufficient time to gain residents’ knowledge: “They [residents] really know what is happening in this space. How this space functions in different seasons of the year, who uses it most often, so their knowledge is absolutely necessary, and it seems to me that in this whole administrative machine maybe it is neglected for want of time. Sometimes we get funds, and we have very little time to organize our activities because we devote a lot of energy to arrangements with municipal units, which we simply need and there is lack of this element of talking to the locals, which I think would be useful.” This level of spatial planning, apart from residents, involves local investors who are willing to share problems they experience in running their business (e.g., in the form of access to infrastructure). At the same time, due to the unique nature of the projects implemented (long-term, area-limited), city units staff already have detailed knowledge of the areas and are aware of the problems occurring in them (it also results from numerous studies accompanying the projects); therefore, new knowledge has become very rare recently.
The last group of interviewees consisted of urban planners responsible for the investment and maintenance processes. Responsible for the last stages of spatial development, these interviewees emphasized that the investments they implement are primarily intended to serve the residents, but at the same time they emphasized that it is experts’ role to decide how a given space will be designed, because at this level of detail of the projects, they have professional knowledge about technological solutions and regulations: “I believe that residents’ access to investments should be extensive, but not complete, because I am convinced that this is what specialists in a given field are for, so that they can make decisions.” However, their work is, among other things, based on design standards for specific types of places (e.g., tram stops), resulting from many years of practice and user experience. As the interviewees noted, residents often show completely different experiences and needs. For some, benches in public space are necessary to rest, and for others they are venues of less acceptable behavior in public spaces (vandalism, homelessness, alcoholism). At this stage of spatial planning, there are usually voices relating to individual preferences and expectations, without the broader context related to experiential knowledge.
4. Discussion and Conclusions
Initially, geographic information systems were used in spatial analysis and decision making in relation to land use and planning only by specialists. However, at the turn of the 1990s, criticism of the technocratic, almost elitist, application of GIS began to appear, drawing at the same time attention to the wider potential of the methods and tools used [
22,
43,
44,
45,
46]. Critical geographic information scientists drew attention to the social role of GIS, the issue of marginalization of certain groups in its application, and the specificity of the research methods [
47,
48,
49]. Representatives of critical GIS approach also discussed the question of whose knowledge collected through GIS is used, by whom and for whose needs [
50]. The study conducted among representatives of local governments in Poland in 2015–2020 [
36], showed that the residents’ perception of a given space as expressed using PPGIS was a kind of social image of a given area for decision-makers, highlighting residents’ expectations regarding its transformations, which indicates the directions of spatial development, but not their final shape. It supports Domański’s statement [
51] that in territorial governance, the key element of decision-making is perception of the environment by decision-makers, i.e., the calculation of the perspective of the attitudes of residents in the context of striving for re-election. Therefore, a question arises whether the enhancement of public participation at the beginning of the decision-making process is a form of empowerment for a local community or a way to get to know the public opinion around a decision and anticipate possible community objections that could delay the decision-making process or halt the decisions completely.
The results of a study shed new light on the actual importance and obstacles of the engagement of residents’ knowledge at the initial phases of decision-making using PPGIS, regarding the organizational constraints of participatory planning processes, characteristic and thematic scope of experiential knowledge, and the nature of differences in the diagnosis of space by experts and residents. First, the study showed that respondents from the group of residents, in their statements justifying the expected changes in the area, made little reference to their experiences. They expressed mainly the preferences or opinions commonly present, for example, in the media. From the perspective of an urban planner, in most cases they were mainly a survey rather than a valuable input to the decision-making process. However, it was possible to identify the following features regarding their experience in the area of interest during a diagnosis of the area with public participation: difficulties in moving around a neighborhood, architectural barriers, traffic safety, disorder and the presence of people who compromise the sense of security, places for recreation, thermal comfort, noise, and smell.
Second, a comparative analysis of two GIS databases (residents and urban planners) concerning three selected features of space (traffic safety, noise level, and thermal comfort) helped to identify differences and potential areas where the knowledge of residents may be important for the planning process. In the case of urban planners, the indicated areas were larger than in the case of respondents from the group of residents. This demonstrated differences in the level of knowledge about the area, which is more detailed among the residents. In their responses, urban planners referred to the urban structure of the city, which was particularly noticeable in the case of noise. They identified only areas of main roads as noisy, while the residents also pointed out nightlife areas and shopping streets. Finally, urban planners more often associated their responses with the conditions (e.g., legal) of given areas. For example, they considered the area of zone 30 as safe, and densely built-up areas as uncomfortable during summer. Meanwhile, the dependencies were not so obvious among the residents. Numerous places connected with low traffic safety were indicated by the residents within the area with speed limits. Densely built-up areas were assessed by the residents as comfortable during high temperatures, and on the other hand, they indicated recreational spaces as uncomfortable, while those locations were absent in the statements of urban planners. The results are supported by Goodchild’s concept of “citizens as sensors”, in which, via PPGIS, residents can be co-creators of data used in decision-making processes [
23,
24,
26,
52,
53]. They can create spatial information in the so-called process of crowdmapping [
54,
55,
56,
57], using the internet which supports the dispersion of knowledge, its collective creation (e.g., Wikipedia, OpenStreetMap), and free exploration. Such processes can be linked to terms such as “collective mind”, “hive mind”, “open intelligence”, “intelligent crowds”, “collective intelligence”, “a bazaar” (as opposed to a cathedral where there is only one imposed way of thinking), or the “wisdom of crowds”.
Finally, the study showed that representatives of the local administration support the statement of the valuable role of experiential knowledge in decision-making. However, due to different factors, this role is limited. This applies to time constraints on the administrative procedures of decision-making processes, and residents’ engagement limited almost only to protection of their interests. On the other hand, decision-making is the result of cost–benefit calculations and the efficiency of the actions (including lobbying) of actors interested in a given process [
58]. Referring to one of the primary assumptions of the PPGIS concept, including the SoftGIS methodology, which supports decision-making processes with the unique knowledge of residents of the area, the results indicate the principal role of administrative and power relations constraints in increasing the role of residents’ knowledge in decision-making processes. Participatory decision-making processes based on the inclusion of knowledge of the local people are considered helpful in understanding society’s preferences, increasing the accountability of authorities, increasing justice, and building public understanding and trust in policymakers [
59,
60]. The developments in GIS technologies, including geoweb methods, support the collection of different types of spatial data, among different groups, and on different scales. On the other hand, the use of GIS technologies does not always support the increase in the level of public participation and only supplements earlier methods, having similar limitations [
8,
61].
The limitations of the research prevented the study of the relationship between the knowledge of residents and urban planners on a larger scale, using methods other than PPGIS. The area covered by the study was the center of one of the biggest cities in Poland, which has witnessed intensive urban renewal processes in recent years. This was the reason for the relatively good knowledge of the area by the urban planners who participated in the study. Further research should be carried out in areas with different features, that are peripheral or less densely developed. A growing number of in-depth case studies analyzing the impact of technology on public participation in decision-making (including GIS) helps to develop methods supporting the citizens’ role in spatial planning, preventing failure of their applications and raising the awareness of their limitations.


