

Cartographic Design and Processing of Originally Printed Historical Maps for Their Presentation on the Web

Abstract
:1. Introduction
1.1. Visualisation of Historical Data
1.2. Printed Historical Atlases
1.3. Electronic Historical Atlases
1.4. Aims
- −
- To create a historical web atlas that would differ from standard approaches in similar projects that present only digitized analogue maps;
- −
- To design the type of web map functionality (map dynamics and interactivity) according to the map characteristics to increase the information potential of original maps;
- −
- To propose a methodology for the conversion of originally printed historical maps to the web environment;
- −
- To keep the cartographic quality of the original printed maps with respect to the specific characteristics of the web as a presentation medium.
2. Methods
- Map analysis (Section 2.1);
- Cartographic design and map processing (Section 2.2);
- Map publishing (Section 2.3).
2.1. Map Analysis
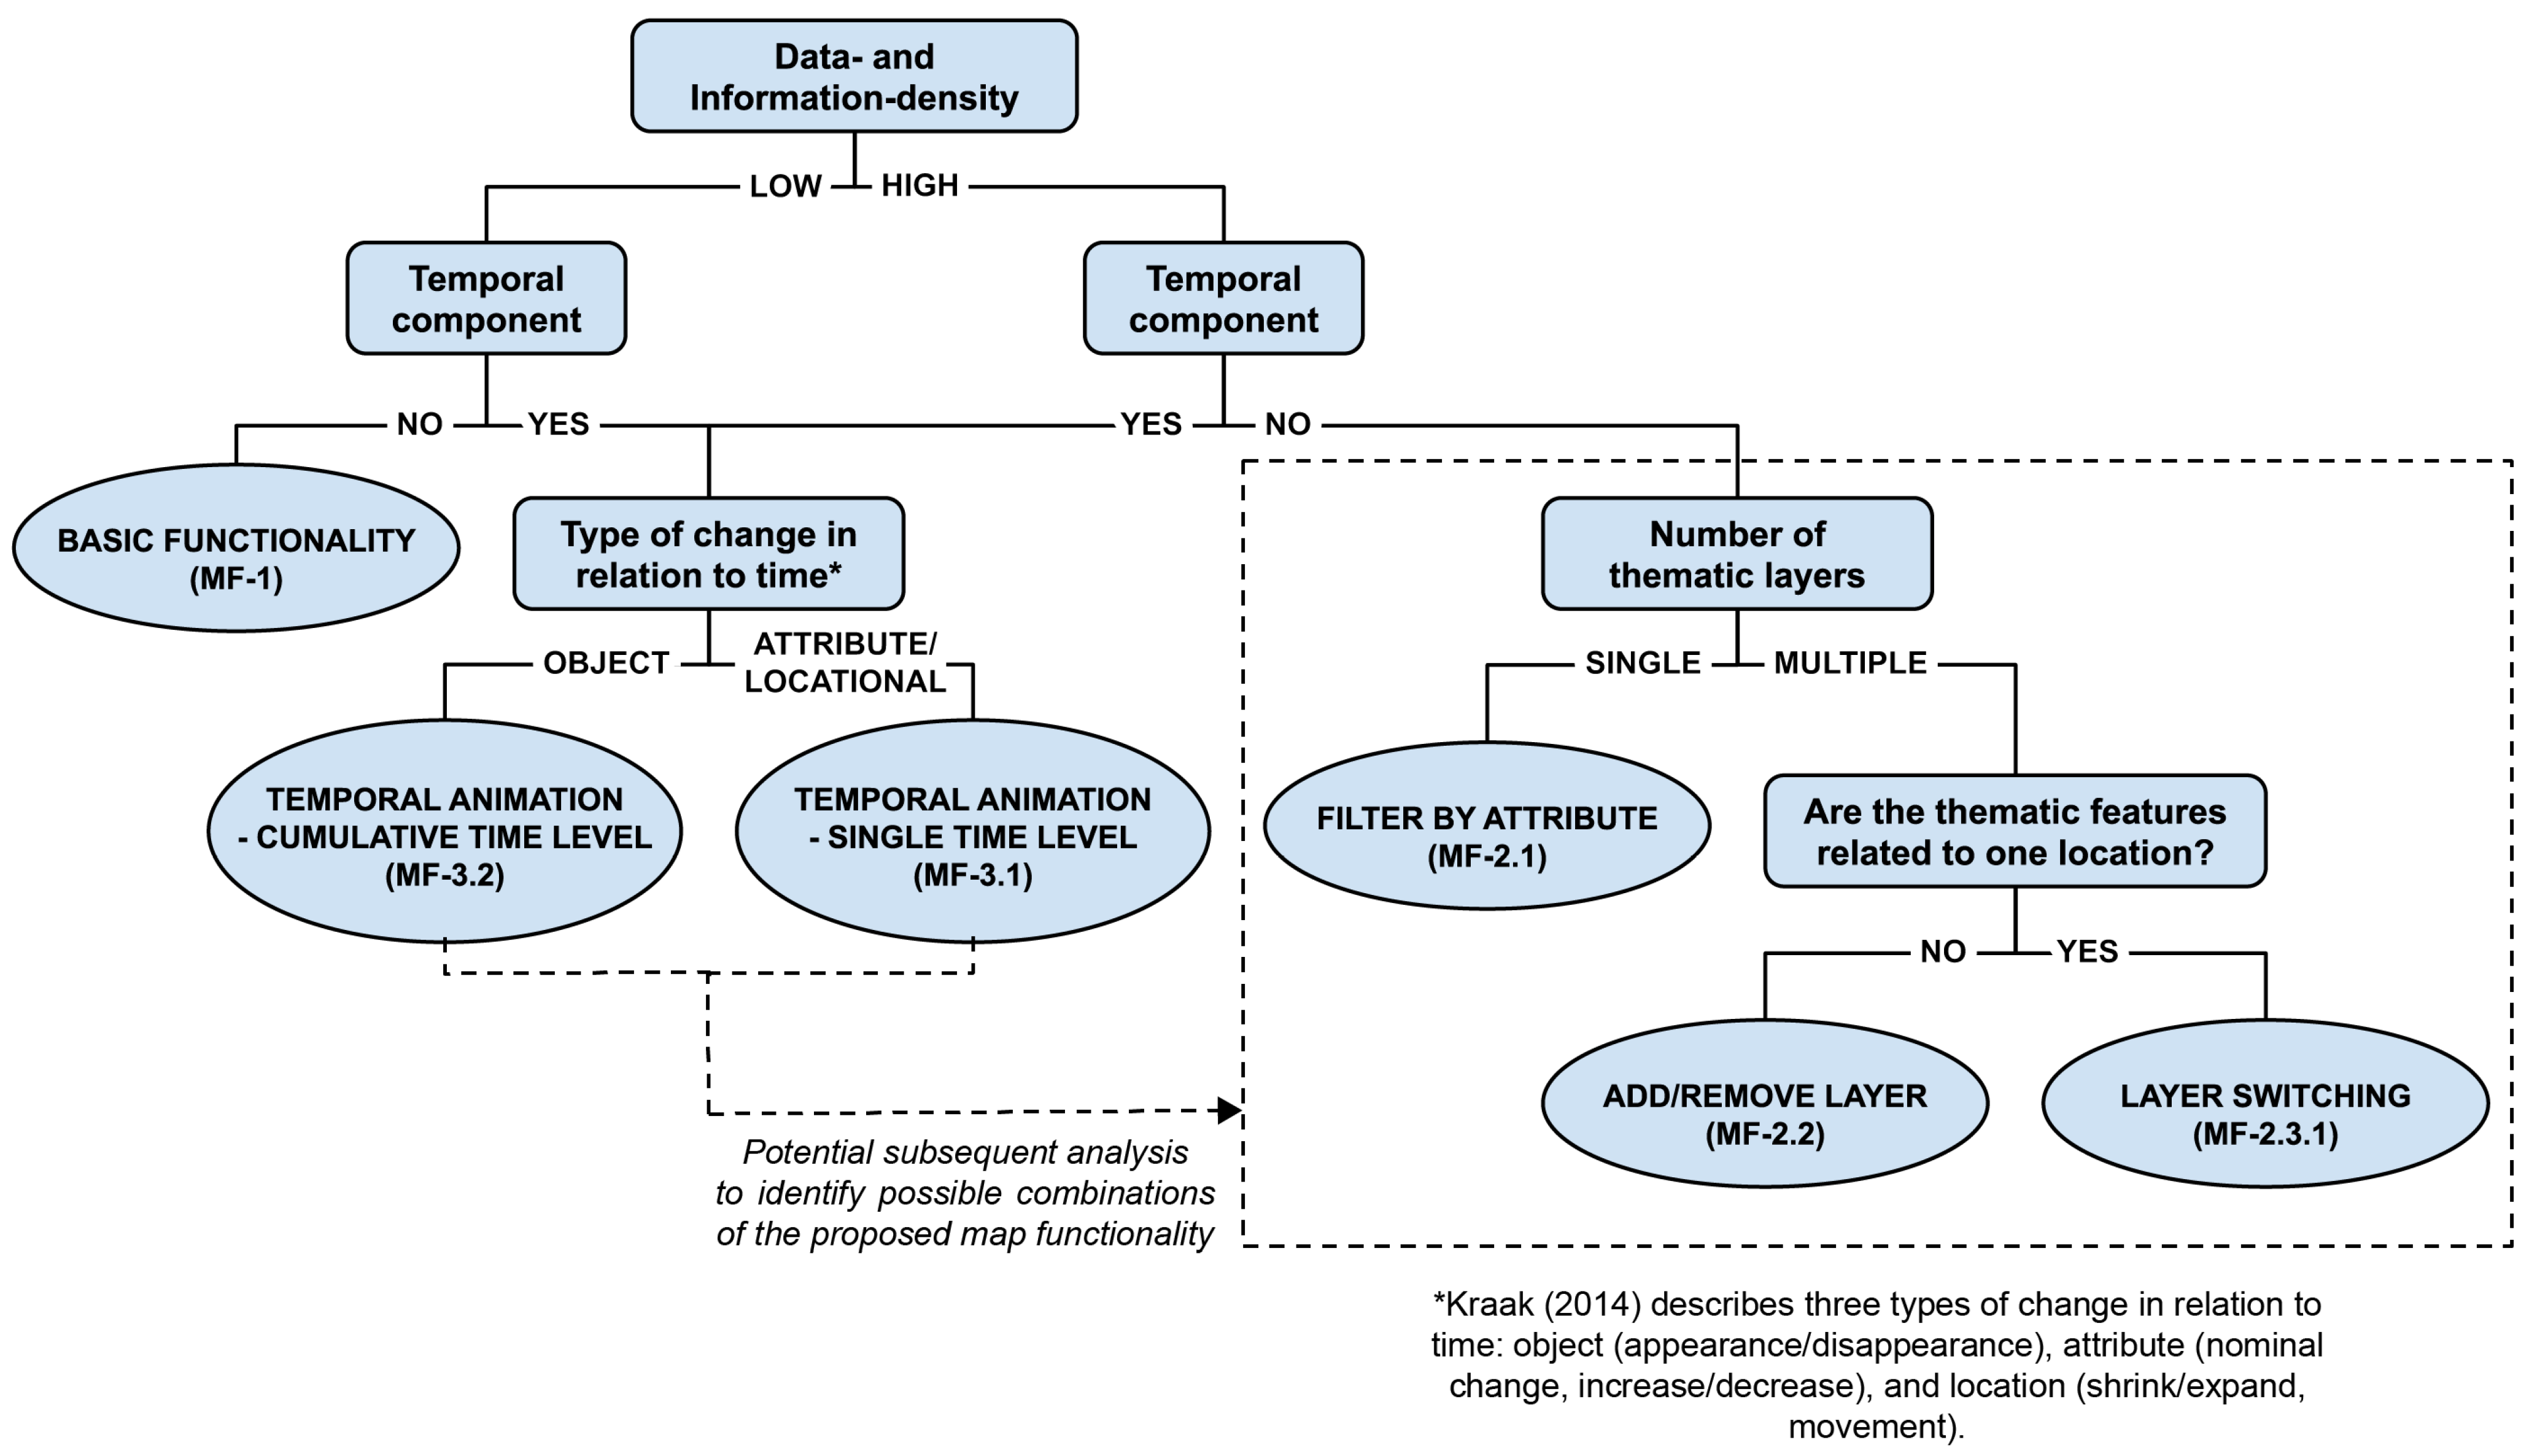
- Filter by attribute (MF-2.1): The user has the option to filter the features according to the predefined attribute to analyse the spatial pattern/distribution of phenomena and their relations. This functionality is suitable for high data-density maps displaying a single thematic layer of qualitative data with no temporal component.
- Add/Remove layer (MF-2.2): The user is allowed to customise the map content by adding or removing thematic layers while preserving the initial default thematic layer in the map view. This functionality can be applied to maps displaying multiple thematic features with no temporal component that are not related to one location or are of different spatial dimensions.
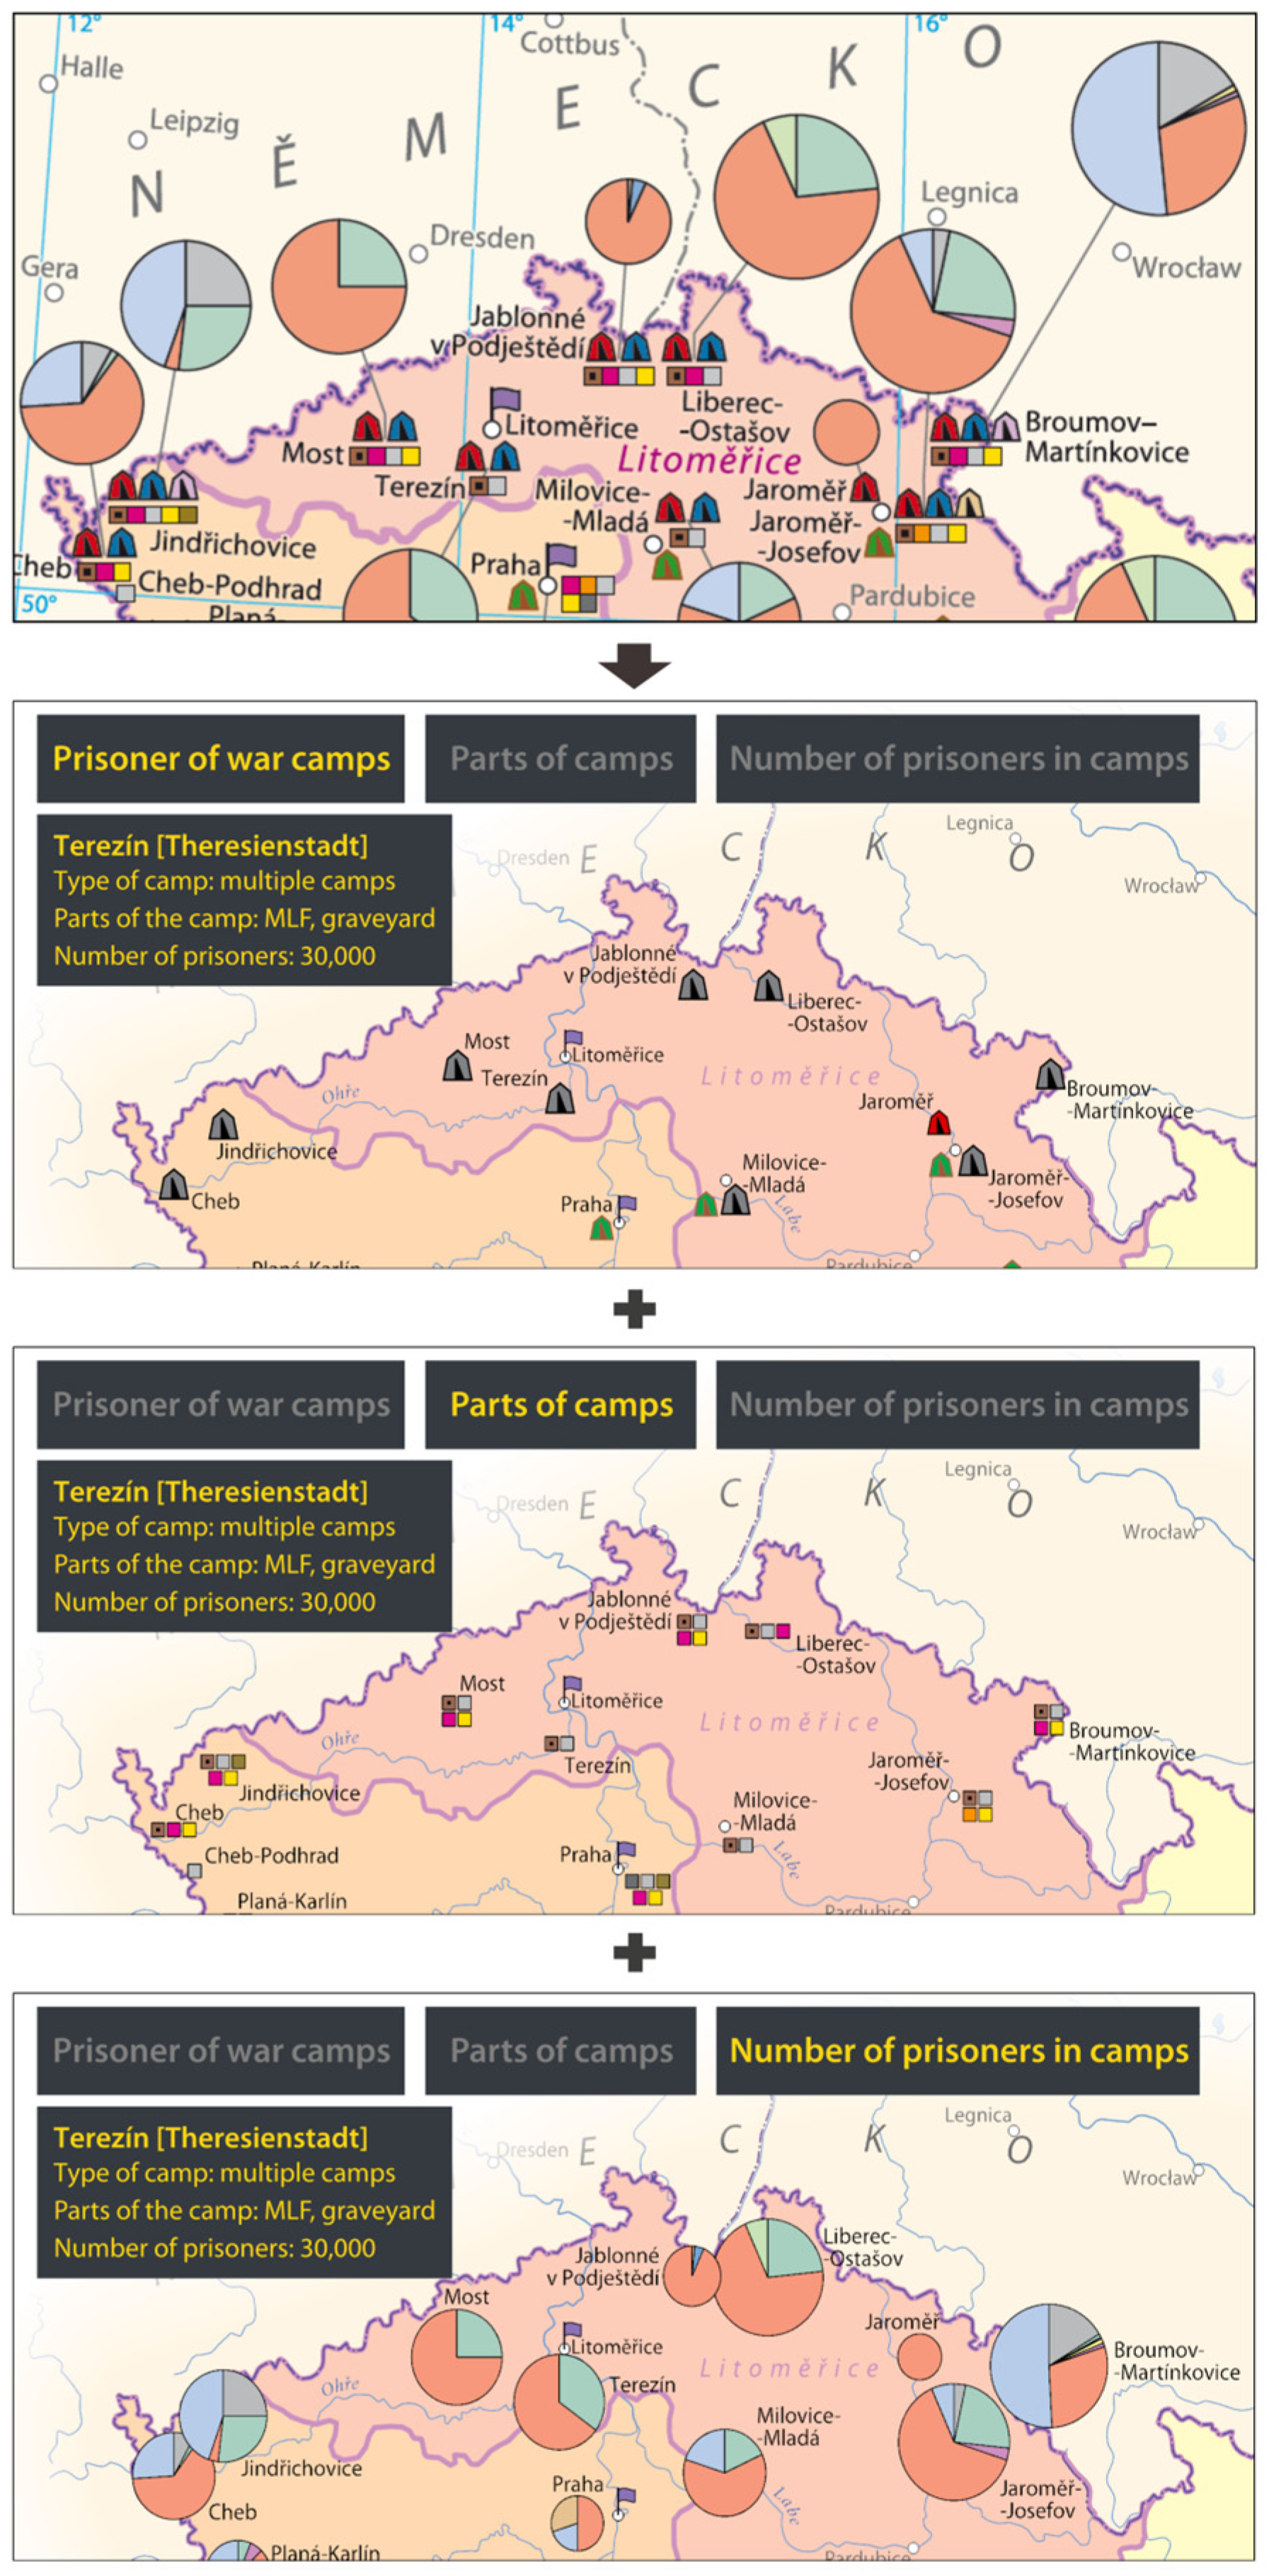
- Layer/Map switching (MF-2.3): The user can switch the displayed thematic layer (MF-2.3.1) or change the geographical extent of the map (MF-2.3.2). The first mentioned option is suitable for maps displaying multiple thematic layers/features with no temporal component related to one location that are represented by multiple symbols of the same spatial dimension, or for multivariate maps combining different thematic methods. This layer switch option enables the user to reveal the thematic information in a separate visually simplified map while keeping the thematic information of the remaining (not visually represented) layers in a pop-up window. Map switching functionality (MF-2.3.2) is best useable to show more detail of a portion of the main map (originally displayed in an inset map) in a single map view.
- Interactive temporal animation (MF-3): The user can control the position of the slider on the timeline with predefined time sections. Temporal animation enables the user to better perceive the development of depicted phenomena over time as it is presented either as a sequence of maps representing a single time level (MF-3.1) or as a sequence of maps presenting individual time levels cumulatively (MF-3.2). The former option can be applied on maps displaying several states of phenomena in multiple time levels, as the state of the depicted phenomena is valid only for the displayed time interval (e.g., administrative border or military campaign). On the contrary, the cumulative sequence is suitable for maps displaying features with temporal information on their appearance and disappearance, as many features existed over several time intervals (e.g., development of a railway network).
2.2. Map Processing
- RGB colour mode and symbol simplification (Section 2.2.1);
- Zooming (Section 2.2.2);
- Panning (Section 2.2.3);
- Pop-up window (Section 2.2.4);
- Additional map functionality (Section 2.2.5).
2.2.1. RGB Colour Mode and Symbol Simplification
2.2.2. Zooming
2.2.3. Panning
2.2.4. Pop-Up Window
2.2.5. Additional Map Functionality
- Filter by attribute (MF-2.1): A copy of the filtered thematic layer with faded symbology was made to visually distinguish inactive features while filtering. This duplicate layer also preserved the original thematic content in the background in all phases of interaction with the map.
- Add/Remove layer (MF-2.2): No additional visualisation process was applied. For the purpose of this functionality, we only differentiated the thematic layers by assigning a unique ID that specified the initial setting of the layer visibility.
- Layer/Map switching (MF-2.3): Originally polythematic or multivariate maps had to be decomposed into several simplified monothematic maps that could be displayed separately in a single map frame (MF-2.3.1). This process often required a complete redesign of the original map composition either by symbol and label replacement (Figure 3), or by modifying the original thematic cartographic method. Inset maps that were going to be displayed in a single map frame (MF-2.3.2) required a more radical intervention in the original map composition as the final scale significantly differs from the original one.
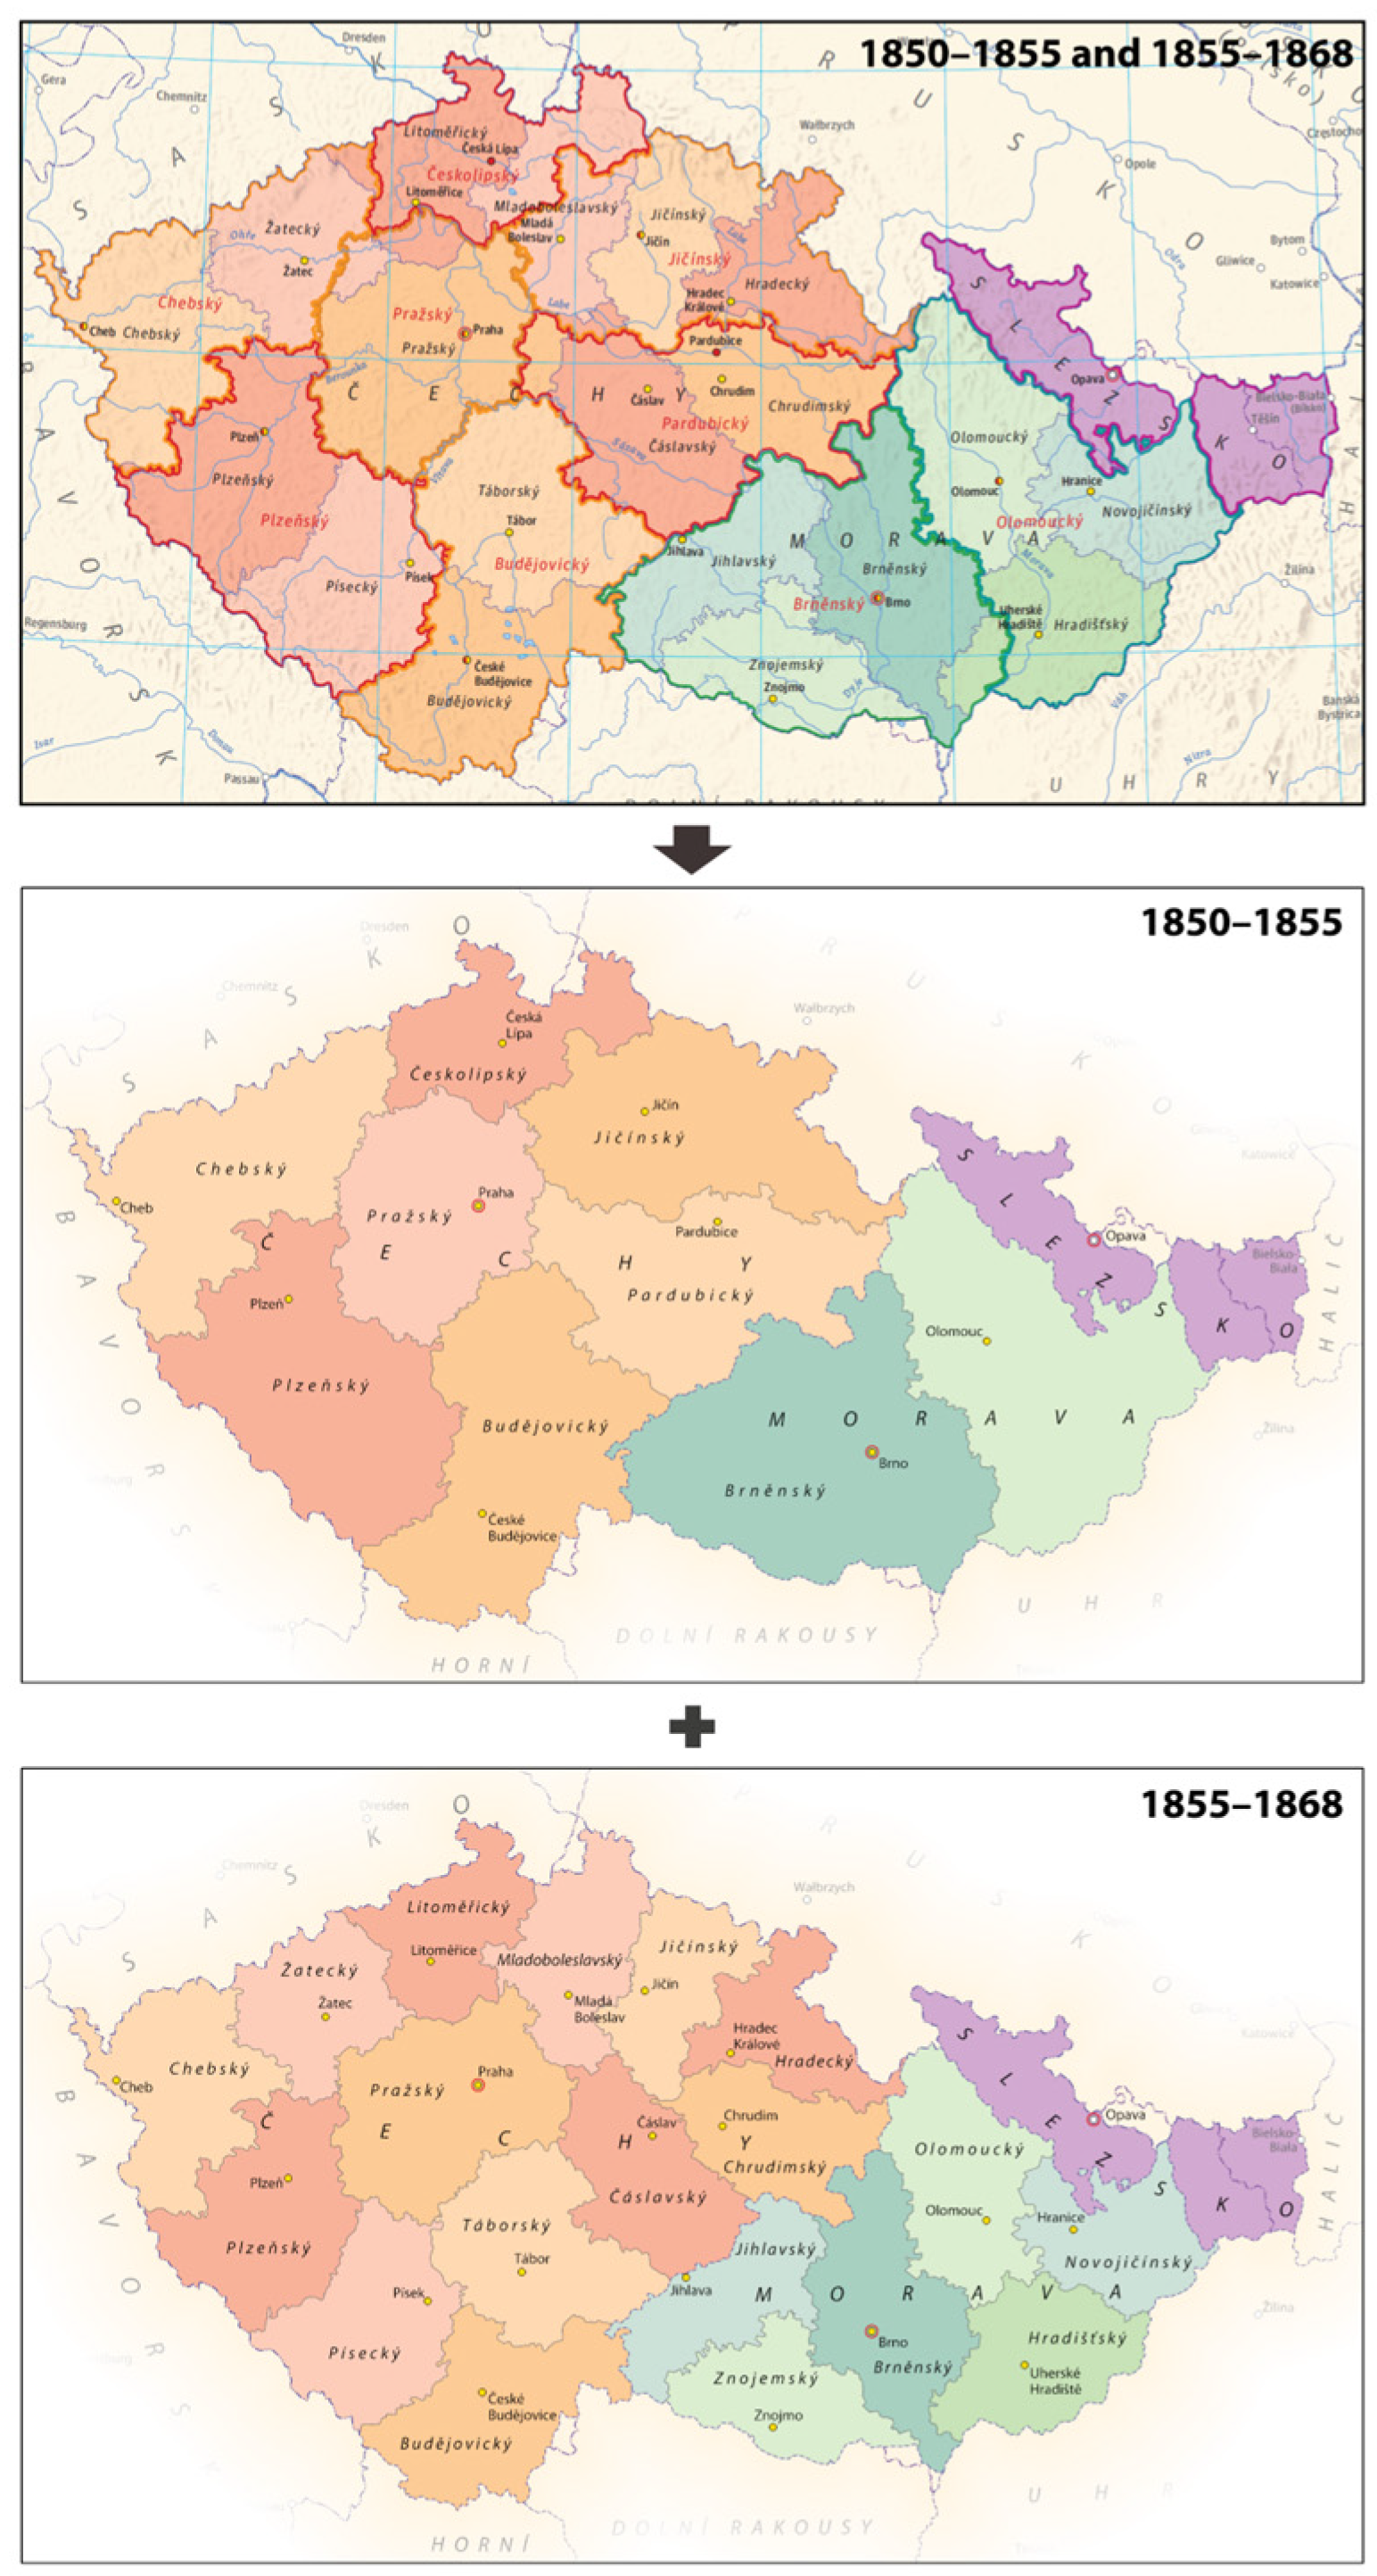
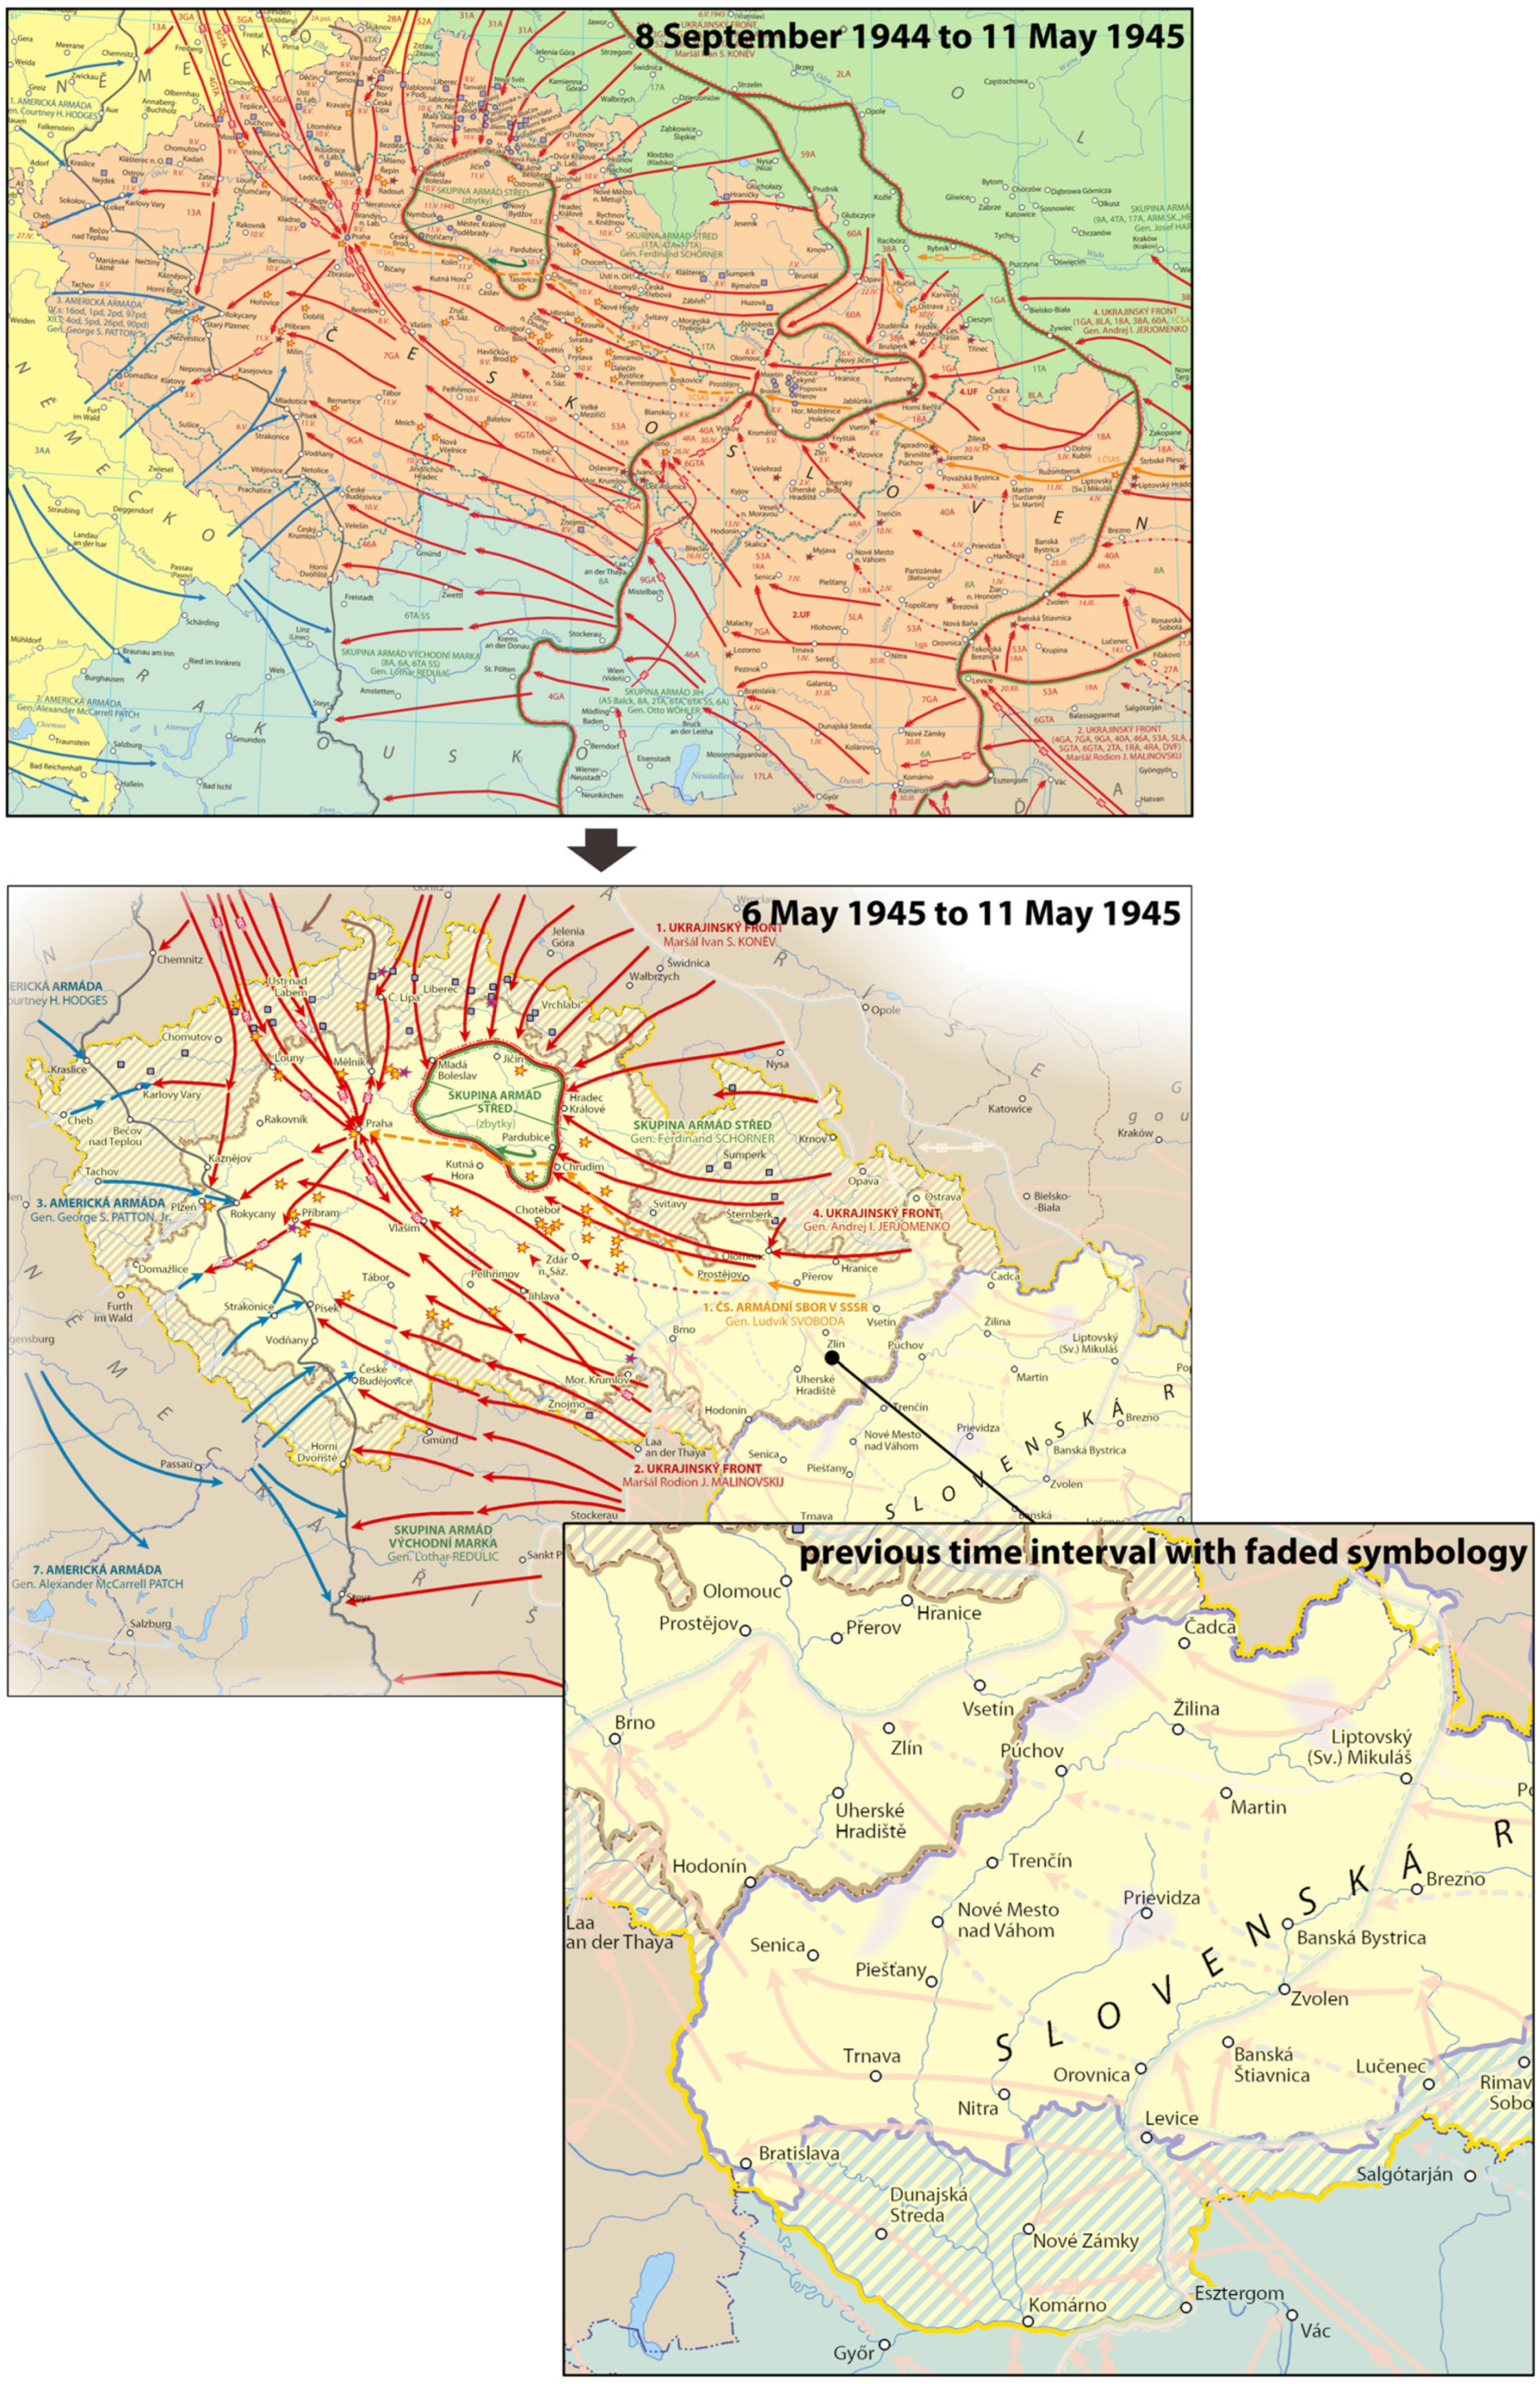
- Interactive temporal animation—single time level (MF-3.1): Single maps that displayed several states of phenomena in multiple time levels were decomposed into a series of maps, each displaying the state of the phenomena only in a given time interval. If the temporal component of the data was expressed by means of visual variables (e.g., change of administrative borders), it was necessary to redesign the original cartographic visualisation and create new visualisations for each time interval (Figure 4). If the temporal component of the feature was expressed only through the exact time annotation (movement of the army or a battle on military maps), the visualisation for each map view was created by filtering the features according to the time or another predefined attribute. The predefined attribute represented the order of the time interval on the timeline and was derived from the time attribute in the geodatabase. Very often it was necessary to complete the original database of the map, as temporal information for some features was missing. The time intervals (sections of the timeline), their number, and range were set according to important milestones in the development of the depicted phenomena. This process required a discussion with the subject specialist, historian, or historical geographer. In some cases, this information could be easily retrieved from the original map (exact time determination of the change of the borders or the movement of the war front). In the temporal animation of military maps, we decided to visually preserve the previous state of phenomena in the map view to facilitate the comprehension of the spatial context of the movement. For this purpose, the duplicate of the thematic layer with faded symbology was created, to visually distinguish the current and the past time interval (Figure 5).
- Interactive temporal animation—cumulative time levels (MF-3.2): The complex cartographic symbology of maps that originally displayed features with temporal information on their appearance and disappearance (often along with many other attributes) had already been simplified within the general modifications of the cartographic design (see above). Therefore, the original map composition could be decomposed into multiple temporal views only by filtering features according to the time or another predefined attribute (see above). In contrast to the afore-mentioned functionality (MF-3.1), each temporal view included the content of the previous one, as many displayed features existed over several time intervals (Figure 6). The faded symbology was applied only for disappeared features.
2.3. Map Publication
- Thematic layers—an active content of the map over which a certain functionality is applied;
- Background layers—an inactive content of the map.
3. Results
- Basic functionality (MF-1);
- Filter by attribute (MF-2.1);
- Add/Remove layer (MF-2.2);
- Layer switching (MF-2.3.1);
- Map switching (MF-2.3.2);
- Interactive temporal animation—single time level (MF-3.1);
- Interactive temporal animation—cumulative time levels (MF-3.2).
- −
- Conversion of the original CMYK colour model to its RGB equivalent;
- −
- Simplification of complex cartographic symbology (replacement by map functionality);
- −
- Redesign of the originally static map to a dynamic multiscale map: (1) setting the maximum zoom level according to the level of detail of the original data; (2) reducing the visual complexity and information density of some maps at smaller scales;
- −
- Solving the problem with missing data at the edge of the original map frame: (1) applying a method to limit the extent of the web map; (2) applying a covering polygon layer;
- −
- Editing or enrichment of attribute data of the original maps for displaying additional information in pop-up.
- −
- Using faded symbology to visually distinguish active and inactive features while filtering (MF-2.1) for existing and disappeared features at a given time interval (MF-3.2);
- −
- Redesign of the original map composition either by symbol and label replacement (MF-2.3.1) or by the modification of the original thematic cartographic method (MF-2.3.1, MF-3.1a);
- −
- Creating a visualisation for temporal views by filtering features according to the time or another predefined attribute (MF-3.1b, MF-3.2).
4. Discussion and Conclusions
Author Contributions
Funding
Data Availability Statement
Conflicts of Interest
References
- Monmonier, M. Strategies for the Visualisation of Geographic Time-Series Data. Cartographica 1990, 27, 30–45. [Google Scholar] [CrossRef]
- Vasiliev, I. Mapping Time. Cartographica 1997, 34, 1–51. [Google Scholar] [CrossRef]
- Wright, J.K. Appendix 1—Cartographic Considerations. A Proposed Atlas of Diseases. Geogr. Rev. 1944, 34, 649–651. [Google Scholar]
- Hsu, M.-L. The Cartographer’s Conceptual Process and Thematic Symbolization. Am. Cartogr. 1979, 6, 117–127. [Google Scholar] [CrossRef]
- Kraak, M.-J. Mapping Time. Illustrated by Minard’s Map of Napoleon’s Russian Campaign of 1812; ESRI Press: Redlands, CA, USA, 2014. [Google Scholar]
- Wigen, K.; Winterer, C. (Eds.) Time in Maps. From the Age of Discovery to Our Digital Era; University of Chicago Press: Chicago, IL, USA, 2020. [Google Scholar]
- Buckley, A. Guidelines for the effective design of spatio-temporal maps. In Proceedings of the 26th International Cartographic Conference ICC2013, Dresden, Germany, 25–30 August 2013. [Google Scholar]
- Andrienko, N.; Andrienko, G.; Gatalsky, P. Exploratory spatio-temporal visualization: An analytical review. J. Vis. Lang. Comput. 2003, 14, 503–541. [Google Scholar]
- Knowles, A.K.; Hillier, A. Placing History. How Maps, Spatial Data, and GIS Are Changing Historical Scholarship; ESRI Press: Redlands, CA, USA, 2008. [Google Scholar]
- MacEachren, A.M. Visualizing Uncertain Information. Cartogr. Perspect. 1992, 10–19. [Google Scholar]
- Kubíček, P.; Šašinka, Č. Thematic uncertainty visualization usability—Comparison of basic methods. Ann. GIS 2011, 17, 253–263. [Google Scholar] [CrossRef]
- Bláha, J.D.; Močičková, J. The research-analytic part of preparation of a cartographic work: A case study of an analysis of historical atlases as the basis for creating the Czech Historical Atlas. AUC Geogr. 2018, 53, 58–69. [Google Scholar] [CrossRef] [Green Version]
- Močičková, J. Historický atlas revolučního hnutí–historickokartografické dílo jako nástroj politické propagandy v Československu 50. let 20. století. Hist. Geogr. 2016, 42, 329–368. [Google Scholar]
- Keates, J.S. Cartographic Design and Production, 2nd ed.; Longman: Harlow, UK, 1989. [Google Scholar]
- Leszczycki, S. The Concept of a New Geographical Atlas. Geogr. Vestn. 1977, 49, 55–58. [Google Scholar]
- Vozenilek, V. Aspects of the Thematic Atlas Compilation. In Modern Trends in Cartography; Brus, J., Vondráková, A., Voženílek, V., Eds.; Springer: Cham, Switzerland, 2015; pp. 3–12. [Google Scholar]
- Dörflinger, J. Geschichtsatlanten vom 16. bis zum Beginn des 20. Jahrhunderts. In Vierhundert Jahre Mercator, Vierhundert Jahte Atlas: “Die Ganze Welt Zwischen Zwei Buchdeckeln”: Eine Geschichte der Atlanten; Wolff, H., Ed.; Ausstellungskataloge/Bayerische Staatsbibliothek 65; Anton H. Konrad: Weißenhorn, Germany, 1995; pp. 179–198. [Google Scholar]
- Goffart, W. Historical Atlases. The First Three Hundred Years, 1570–1870; University of Chicago Press: Chicago, IL, USA, 2003. [Google Scholar]
- Black, J. Historical atlases. Hist. J. 1994, 37, 643–667. [Google Scholar] [CrossRef]
- Black, J. Maps and History. Constructing Images of the Past; Yale University Press: New Haven, CT, USA, 2000. [Google Scholar]
- Siekierska, E.M.; Taylor, D. Electronic mapping and electronic atlases: New cartographic products for the information era: The electronic atlas of Canada. CISM J. 1991, 45, 11–21. [Google Scholar] [CrossRef]
- Cron, J.; Wiesmann, S.; Hurni, L. Facilitating the Handling of Interactive Atlases by Dynamic Grouping of Functions—The Example of ‘Smart Legend’. In Geospatial Vision; Moore, A., Drecki, I., Eds.; Lecture Notes in Geoinformation and Cartography; Springer: Berlin/Heidelberg, Germany, 2008; pp. 1–18. [Google Scholar]
- Bär, H.R.; Sieber, R. Towards high standard interactive atlases: The GIS and multimedia cartography approach. In Proceedings of the 19th International Cartographic Conference, Ottawa, ON, Canada, 14–21 August 1999. [Google Scholar]
- Sieber, R.; Huber, S. Atlas of Switzerland 2—A highly interactive thematic national atlas. In Multimedia Cartography; Cartwright, W., Peterson, M.P., Gartner, G., Eds.; Springer: Berlin/Heidelberg, Germany, 2007; pp. 161–182. [Google Scholar]
- Sieber, R.; Geisthövel, R.; Hurni, L. Atlas of Switzerland 3—A Decade of Exploring Interactive Atlas Cartography. In Proceedings of the 24th International Cartographic Conference ICC, Santiago de Chile, Chile, 15–21 November 2009. [Google Scholar]
- Lechthaler, M. Interactive and Multimedia Atlas Information Systems as a Cartographic Geo-Communication Platform. In Cartography in Central and Eastern Europe; Gartner, G., Ortag, F., Eds.; Lecture Notes in Geoinformation and Cartography; Springer: Berlin/Heidelberg, Germany, 2009; pp. 383–402. [Google Scholar]
- Kelnhofer, F. Geographische und/oder kartographische Informationssysteme. In Kartographie im Umbruch-Neue Herausforderungen, neue Technologien. Beiträge zum Kartographiekongreß, Interlaken ‘96; Nicoline Thieme: Leipzig, Germany, 1996; pp. 9–26. [Google Scholar]
- Kelnhofer, F.; Pammer, A.; Schimon, G. “GeoInfo Austria”—Interaktives Multimediales Kartographisches Informationssystem von Österreich. In Beiträge zum 5. Symposium zur Rolle der Informationstechnologie in der und für Die Raumplanung, CORP 2000; Schrenk, M., Ed.; TU Wien: Vienna, Austria, 2000. [Google Scholar]
- Atlas Obyvatelstva. Available online: http://www.atlasobyvatelstva.cz/ (accessed on 20 December 2022).
- Atlas of the Historical Geography of the United States. Available online: https://dsl.richmond.edu/historicalatlas/ (accessed on 10 December 2022).
- Historical Atlas of Canada. Available online: http://www.historicalatlas.ca/website/hacolp/index.htm (accessed on 15 December 2022).
- Šedivý, J. Map portals and databases of towns in Central Europe: An appendix or substitute for printed historical town atlases? Città Stor. 2015, 10, 261–280. [Google Scholar]
- Historic Towns Atlas of the Czech Republic Web Map Portal. Available online: http://towns.hiu.cas.cz/en/ (accessed on 22 December 2022).
- Österreichischer Städteatlas. Available online: https://www.arcanum.com/hu/online-kiadvanyok/OsterreichischerStadtatlas-osterreichischer-stadteatlas-1/ (accessed on 3 December 2022).
- Atlas of World History. Available online: https://atlasofworldhistory.com/ (accessed on 5 December 2022).
- Mapping History. Available online: https://mappinghistory.uoregon.edu/english/index.html (accessed on 5 December 2022).
- The Timemap of World History. Available online: https://timemaps.com/ (accessed on 6 December 2022).
- Omniatlas—Interactive Atlas of World History. Available online: https://omniatlas.com/ (accessed on 3 December 2022).
- The Map as History: A Multimedia Atlas. Available online: https://www.the-map-as-history.com/ (accessed on 5 December 2022).
- Muehlenhaus, I. Web Cartography; CRC Press: Boca Raton, FL, USA, 2013. [Google Scholar]
- Ostellus—The Future of History. Available online: https://ostellus.com/ (accessed on 3 December 2022).
- Hruška, L.; Jarošová, L.; Lipovski, R. The Great Historical Atlas of Silesia. Available online: https://mapa.atlas-slezska.cz/en.html (accessed on 10 December 2022).
- The GeaCron. Available online: http://geacron.com/ (accessed on 15 March 2023).
- Historical Atlas of the 20th Century. Available online: http://users.erols.com/mwhite28/20centry.htm (accessed on 3 December 2022).
- World History: HyperHistory. Available online: https://www.hyperhistory.com/online_n2/History_n2/a.html (accessed on 6 December 2022).
- Czech Historical Atlas Portal. Available online: http://www.czechhistoricalatlas.cz/ (accessed on 8 January 2023).
- Semotanová, E.; Cajthaml, J. Akademický Atlas Českých Dějin, 2., Doplnĕné Vydání; Academia: Praha, Czech Republic, 2016. [Google Scholar]
- Semotanová, E.; Zudová-Lešková, Z. Český Historický Atlas. Kapitoly z Dějin 20. Století = Czech Historical Atlas: Chapters on the History of the 20th Century; Práce Historického Ústavu AV ČR, v.v.i. Řada A, Monographia = Opera Instituti Historici Pragae. Series A, Monographia Svazek 94; Historický Ústav: Praha, Czech Republic, 2019. [Google Scholar]
- Sieber, R.; Schmid, C.; Wiesmann, S. Smart legend–smart atlas. In Proceedings of the 22th International Conference of the ICA, A Coruña, Spain, 9–16 July 2005. [Google Scholar]
- Vít, L.; Bláha, J.D. A Study of the User Friendliness of Temporal Legends in Animated Maps. AUC Geogr. 2017, 47, 53–61. [Google Scholar] [CrossRef] [Green Version]
- Caquard, S.; Cartwright, W. Narrative Cartography: From Mapping Stories to the Narrative of Maps and Mapping. Cartogr. J. 2014, 51, 101–106. [Google Scholar] [CrossRef]
- Landaverde Cortés, N.A. A Conceptual Framework for Interactive Cartographic Storytelling. Master’s Thesis, University of Twente, Enschede, The Netherlands, 2018. [Google Scholar]
- Fairbairn, D. Measuring Map Complexity. Cartogr. J. 2006, 43, 224–238. [Google Scholar] [CrossRef]
- Gartner, G.; Kriz, K.; Spanring, C.; Pucher, A. The concept of “restrictive flexibility” in the “ÖROK Atlas Online”. In Internet-Based Cartographic Teaching and Learning: Atlases, Map Use and Visual Analytics; TU Wien: Vienna, Austria, 2005; pp. 105–110. [Google Scholar]
- Neudeck, S. Zur Gestaltung topografischer Karten für die Bildschirmvisualisierung. Ph.D. Thesis, Universität der Bundeswehr München, Neubiberg, Germany, 2001. [Google Scholar]
- Kern, J.P.; Brewer, C.A. Automation and the Map Label Placement Problem: A Comparison of Two GIS Implementations of Label Placement. Cartogr. Perspect. 2008, 60, 22–45. [Google Scholar] [CrossRef]
- Been, K.; Daiches, E.; Yap, C. Dynamic map labeling. IEEE Trans. Vis. Comput. Graph. 2006, 12, 773–780. [Google Scholar] [CrossRef] [PubMed]
- Jílková, P.; Janata, T. Selected Possibilities of Data Excerption from the Database of Historical Atlases. Civ. Eng. J. 2019, 28, 589–598. [Google Scholar] [CrossRef]
- Çöltekin, A.; Heil, B.; Garlandini, S.; Fabrikant, S.I. Evaluating the Effectiveness of Interactive Map Interface Designs: A Case Study Integrating Usability Metrics with Eye-Movement Analysis. Cartogr. Geogr. Inf. Sci. 2009, 36, 5–17. [Google Scholar] [CrossRef]
- Ooms, K.; de Maeyer, P.; Fack, V. Analyzing eye movement patterns to improve map design. In AutoCarto 2010, Proceedings of the 18th International Research Symposium on Computer-Based Cartography and GIScience (AutoCarto 2010): Geospatial Data and Geovisualization for the Environments, Security, and Society, Orlando, FL, USA, 15–18 November 2010; Cartography and Geographic Information Society (CaGIS): Cincinnati, OH, USA, 2010. [Google Scholar]
- Kramers, E.R. Interaction with Maps on the Internet—A User Centred Design Approach for The Atlas of Canada. Cartogr. J. 2008, 45, 98–107. [Google Scholar] [CrossRef]
- Van Elzakker, C.P.J.M.; Ooms, K. Understanding map uses and users. In The Routledge Handbook of Mapping and Cartography; Routledge: Oxford, UK, 2017; pp. 55–67. [Google Scholar]


Disclaimer/Publisher’s Note: The statements, opinions and data contained in all publications are solely those of the individual author(s) and contributor(s) and not of MDPI and/or the editor(s). MDPI and/or the editor(s) disclaim responsibility for any injury to people or property resulting from any ideas, methods, instructions or products referred to in the content. |
© 2023 by the authors. Licensee MDPI, Basel, Switzerland. This article is an open access article distributed under the terms and conditions of the Creative Commons Attribution (CC BY) license (https://creativecommons.org/licenses/by/4.0/).
Share and Cite
Justová, P.; Cajthaml, J. Cartographic Design and Processing of Originally Printed Historical Maps for Their Presentation on the Web. ISPRS Int. J. Geo-Inf. 2023, 12, 230. https://doi.org/10.3390/ijgi12060230
Justová P, Cajthaml J. Cartographic Design and Processing of Originally Printed Historical Maps for Their Presentation on the Web. ISPRS International Journal of Geo-Information. 2023; 12(6):230. https://doi.org/10.3390/ijgi12060230
Chicago/Turabian StyleJustová, Petra, and Jiří Cajthaml. 2023. "Cartographic Design and Processing of Originally Printed Historical Maps for Their Presentation on the Web" ISPRS International Journal of Geo-Information 12, no. 6: 230. https://doi.org/10.3390/ijgi12060230
APA StyleJustová, P., & Cajthaml, J. (2023). Cartographic Design and Processing of Originally Printed Historical Maps for Their Presentation on the Web. ISPRS International Journal of Geo-Information, 12(6), 230. https://doi.org/10.3390/ijgi12060230