1. Introduction
The preservation of the environment and mitigation of the primary sources of environmental pollution are crucial endeavors, as the advancement of a society can be gauged by the level of its constituents’ commitment to environmental preservation [
1,
2]. Therefore, caring for the environment has become an important matter in the Kingdom of Saudi Arabia (KSA), and the extent of society’s development is measured by it through the extent to which it preserves the environment and achieves sustainability environment that would contribute to raising the level of satisfaction among all members of society [
3]. The need for recreation and picnics has emerged because of population migration towards urban areas, increased work pressures, multiple living and psychological problems, and increased free time available to workers due to the use of modern technologies [
1]. Despite the diversity of recreational services in cities, green spaces still constitute the most important recreational land uses in them as it constitutes more than a quarter of the total land use areas in many cities of the world, it is also one of the most important aesthetic elements, being part of the requirements of city planning, and the most important places for picnics and entertainment for the population, in addition to the gathering of urban activities in it, and it is a major indicator for achieving sustainability. Environmental, so that the human touches his surrounding environment deeply, and reduces environmental pollution. Green cities prioritize the protection and preservation of the environment. They aim to reduce carbon emissions, promote renewable energy sources, conserve water resources, and preserve natural habitats. By adopting sustainable practices, green cities help combat climate change, reduce pollution levels, and protect biodiversity. Green cities focus on efficient use of resources such as energy, water, and materials. They promote energy-efficient buildings, encourage public transportation systems, implement waste management strategies like recycling and composting, and adopt sustainable agriculture practices. These measures help conserve resources for future generations while reducing the strain on ecosystems. Green cities prioritize the health and well-being of their residents. They provide ample green spaces such as parks and gardens for recreation and relaxation. Access to nature has been linked to improved mental health, reduced stress levels, increased physical activity, and enhanced overall well-being [
4,
5].
Preservation of biodiversity refers to the protection and conservation of the variety of life on Earth, including all species of plants, animals, and microorganisms, as well as the ecosystems they inhabit. Biodiversity is essential for maintaining the health and balance of ecosystems and provides numerous benefits to humans. To preserve biodiversity effectively, it is important to implement measures such as protected areas (national parks, wildlife reserves), sustainable land and resource management practices, habitat restoration, species conservation programs, and public awareness campaigns. Collaboration between governments, organizations, communities, and individuals is crucial for the long-term preservation of biodiversity [
6,
7].
There are many classifications of green areas in cities, to include wooded areas such as forests and belts surrounding the city, and all kinds of gardens, including the neighborhood garden or residential complexes, the city garden, the public garden, and finally the parks, which are characterized by their large areas compared to gardens, and the interest in establishing parks has increased with the urban development in Many Saudi cities, including Abha and Bisha [
8,
9].
The impact of high temperatures on green cities can have both positive and negative effects. High temperatures can promote photosynthesis and stimulate plant growth, resulting in lush greenery in the city and also lengthens the growing season, warmer temperatures and high temperatures can lengthen the growing season, allowing for more varied and bountiful crop yields, as well as greater biodiversity, some species thrive in warmer conditions, resulting in greater biodiversity in urban ecosystems and better outdoor activities, Warmer temperatures may encourage people to spend more time outdoors and engage in leisure activities, and promote healthier lifestyles. Overall, while high temperatures may initially contribute to a greener city with increased plant growth and biodiversity, they also bring challenges such as heat stress on plants, increased energy consumption, health risks, and the urban heat island effect that need to be addressed for sustainable urban development [
7,
10].
The ongoing trend of worldwide urban migration leads to a rise in population density, which subsequently influences the spatial dimensions of green areas [
11,
12]. Scholars who have examined the notion of urban areas emphasized the importance of adopting a multifaceted perspective when addressing the matter of green spaces [
13,
14]. This encompasses considering both the rapid urban population and the significant problems facing the environment concurrently with urbanization [
15,
16]. Thus, it is required to discover and determine the evidence about the physical and non-physical health advantages of urban green areas in order to fulfill this requirement [
17,
18].
Geographical Information System (GIS) is a powerful tool that can be used for spatial and statistical analysis of various aspects of a city, including green areas. In the case of the cities of Abha and Bisha, this analysis can be conducted to assess the current state of green areas and their contribution to environmental sustainability.
The main goal of this research is to undertake comparative work on environmental sustainability between the cities of Abha and Bisha in the Asir region of Saudi Arabia. The importance of environmental sustainability and the extent of its contribution to the achievement of Saudi Vision 2030 on increased investment and economic stimulation.
3. Materials and Methods
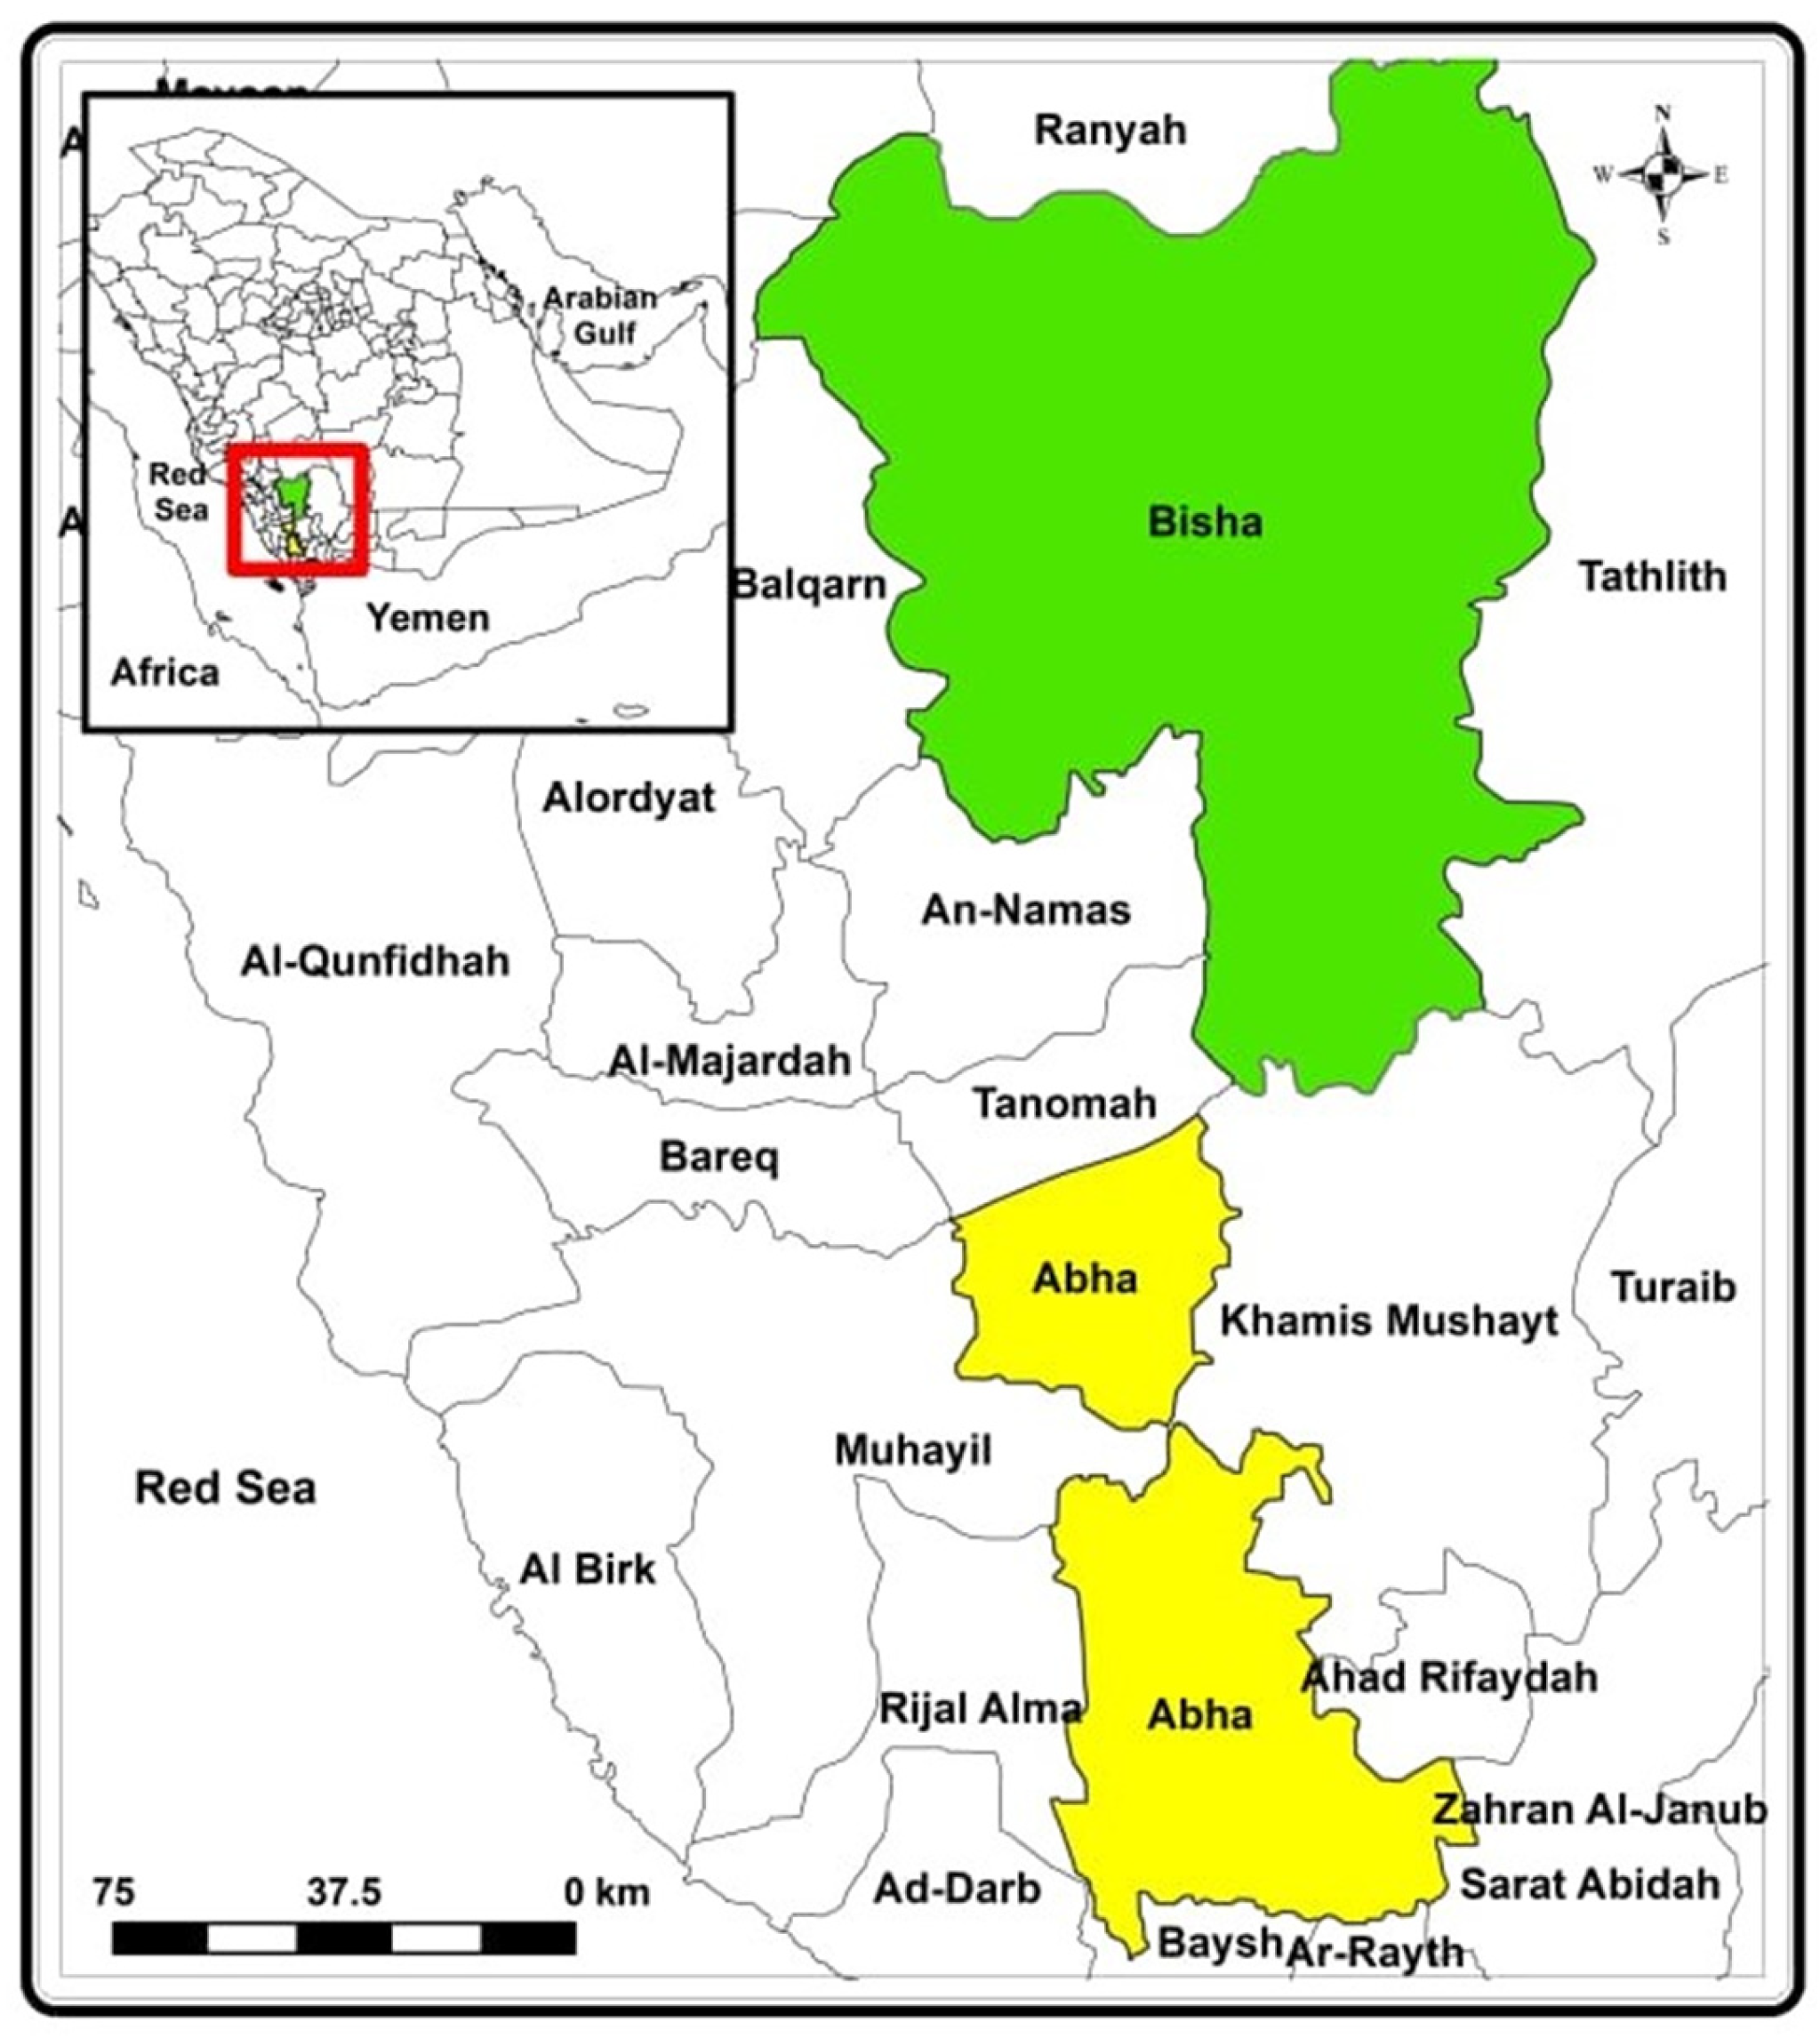
The study takes the cities of Abha and Bisha as an applied field. As seen in
Figure 1, the two cities are located in the Asir area, which is situated in the southwestern part of the Kingdom of Saudi Arabia. The Asir region is one of the thirteen regions that make up the Kingdom. Both the administrative and political centers of the Asir Emirate are located in the same city: Abha. It got its name from the nearby valley of the same name. The city of Abha is located at the confluence of latitude 18°12′, longitude 42°30′ E. A center in Al-Hamr (Abha Governorate), to the south the centers of Al-Sha’f and Marba (Abha Governorate), to the east the city of Khamis Mushait (Khamis Mushait Governorate), and to the west the centers of Tayyib and Al-Souda (Abha Governorate).
The study relies on conducting spatial analyzes of the distribution of green spaces in the cities of Abha and Bisha using spatial analysis tools in the geographic information systems environment. Within the framework of the application framework service spatial statistical analysis is a branch of statistics that focuses on analyzing and understanding spatial patterns and relationships in data. It involves the application of statistical techniques to data that have a spatial component, such as geographic coordinates or spatial units. The main goal of spatial statistical analysis is to explore and quantify the spatial structure and variability in data, as well as to identify any spatial dependencies or relationships that may exist. This can be done through various methods, including exploratory spatial data analysis (ESDA), geostatistics, and spatial regression. Spatial reference was used to create geo-database is national Spatial Reference SANSRS [
17].
The city of Abha spans around 290.7 km, distributed over 44 residential neighborhoods, that includes prominent places such as Shamsan, Al-Manhal, Al-Andalus, Al-Azizia, Al-Salam, Al-Khalidiyah, and others, with a population of 446,697 people in 2022 AD. As for Bisha, it is located in the northwest of the Asir region, between latitudes 19°0′, 20°51′ N, and longitudes 41°50′, 43°5′ E. It is bordered on the north by the Makkah Al-Mukarramah region, and on the south is the center of Khaybar in Khamis Mushait Governorate. It is bordered to the east by the centers of Tathleeth, Jash, and Al-Sabikha in the Tathleeth Governorate, and to the west by the Al-Baha region, and the governorates of Balqarn, and Al-Namas.
The city of Bisha extends from north to south with a length of 185 km, and its width varies from east to west, as its lowest width was recorded in the south by about 48 km, and the maximum width in the north by about 120 km. 659 km2, while its population is 248,452 people in 2022 AD, and its importance is gained from its location on Wadi Bisha, the largest and most important valley in the Kingdom, and the valley has the largest dam in the Kingdom, with a storage capacity of 325 million m3, and Bisha is famous for agriculture, especially date palms, and the city of Bisha in the neighboring cities with a good network of roads, the most important of which is the Khamis Mushait-Bisha-Raniyeh-Khurmah road, which is one of the pivotal roads linking the Asir region with the Makkah region.
In this investigation, an analytical descriptive methodology was utilized in addition to three other approaches, namely, substantive, regional, and historical approaches. Statistical analysis was performed using several methods to investigate the spatial organization of environmental sustainability. The research relied on Geographic Information System (GIS) to produce maps and spatially analyze them using a program called “Arc GIS 10.8”. The mathematical equation used in the research was linked to the Arc map 10.8 programs by linking the results of the spatial analysis in this program with the results of the mathematical equation, as the results of the two were identical. A geo-database was created using a program called “Arc Catalog” Such as the location, roads, flats, population distribution, and neighborhoods of each city, and others to comprise a set of feature classes that included information on different features of the city. This enabled the researcher to conduct spatial statistical analyses. A type of geodatabase have been apply is a personal geodatabase while type of feature class created and coordinate system used is based on the global coordinate system WGS 1984. To mitigate the lack of data, a questionnaire was design for the residents of the cities of Abha and Bisha.
The purpose of this questionnaire is to gather information and opinions on research topic. The details of the field study, the date it was conducted, and the number of items were mentioned, and its details are as follows “The field study was conducted in January 2023, and a total of 479 responses were collected in the city of Abha and 496 responses in the city of Bisha”. A questionnaire is a research tool consisting of a series of questions or other types of prompts designed to gather information from the respondent. The research questionnaire is usually a mixture of closed and open questions. Long, open-ended questions give the respondent the opportunity to develop their thinking. The Statistical Society of London developed research questionnaires in 1838. The data collected through the data collection questionnaire can be both qualitative and quantitative in nature. The questionnaire may or may not be provided as a poll, but a poll is always a poll.
The field study was conducted in January 2023, and a total of 479 responses were collected in the city of Abha and 496 responses in the city of Bisha. The software used in the study was “Arc GIS 10.8” and “Arc Catalog”. Any computer code used is available and can be provided upon request. The pre-registration codes used in the study are also available upon request. The study explicated the methods and protocols employed, facilitating the possibility of replication and further development of the published findings. The study provided a concise overview of established techniques and properly referenced them to guarantee the clarity and replicability of the research.
3.1. Data Collection
The research was carried out in three phases. The first phase involved collecting data on various fundamental networks and services in Abha and Bisha cities, including maps, layouts, quantitative data, and annual reports from different organizations such as the geological Survey, the Ministry of Environment, Water and Agriculture, and the data and reports issued by the Asir Region Municipality as well as green spaces services, and their distribution in the two cities. The second phase focused on the collection of data related to environmental sustainability through field inspection and historical study to assess the resilience level of the two cities, the researcher did field inspection of the field study. Finally, in the third phase, a comparative study was conducted to evaluate the environmental sustainability of the two cities based on the data collected and analyzed in the first two phases. This included the distribution of green areas in the two cities, as well as the distribution of residents, and measuring their satisfaction.
3.2. Hypotheses and Research Questions
There are three hypotheses in this study:
Hypothesis 1. The study findings indicate that there is no exist statistically significant variations among the study sample participants in terms of quality of life in Abha and Bisha cities, based on the variables of gender, age group, and category.
Hypothesis 2. On the principle of increasing green areas, which have a medium impact on the quality of life in the cities of Abha and Bisha.
Hypothesis 3. The axes measuring the quality of life in the cities of Abha and Bisha do not have any correlation.
These hypotheses formed a strong motive for the researcher to prepare this study, to answer many concerns, including:
What is the degree of impact of increasing green spaces on the axes of quality of life in the cities of Abha and Bisha?
Is there a difference in quality of life between males and females, older and younger people, and those from different socioeconomic backgrounds in Abha and Bisha?
Is there a correlation between the quality-of-life axes in the cities of Abha and Bisha?
Do the cities of Abha and Bisha differ significantly from one another in terms of quality-of-life indicators?
3.3. The Study Sample and Its Distribution
When administering the questionnaire to a cross-section of the Abha and Bisha populations, we included people of all ages and both sexes, which numbered (479) responses in the city of Abha, and (496) responses in the city of Bisha, all of which are correct, complete and valid for analysis as shown in
Table 1.
Description of the study sample:
The study sample individuals’ characteristics were identified based on the variables presented in
Table 2.
Gender: (Male, Female).
Age: (<20 years, 20–40 years, >40 years).
Category: (Citizen, Resident).
3.4. Normality of the Normal Distribution of the Study Sample
To ensure the normality of the distribution among the categories of the research sample, the (One-Sample Kolmogorov Smirnov Test) was utilized to see if the data obtained from the sample followed a normal distribution or not, to determine the appropriate tests for each case (Teachers’ tests—or non-parametric tests). To ensure the moderate distribution among the categories of the research sample, the Kolmogorov-Smirnov One-Sample Test was used to see if the data obtained from the sample. Let assume that
,
be the independent and identical distributed observations and
,
cumulative distribution function on continuous variable. We can test the hypotheses as follows:
Here
represent is known cumulative distribution function whereas the
is an empirical cumulative distribution. The null hypothesis posits that there is no discernible distinction between the observed and theoretical distributions. The test statistic
is then computed to determine the degree of deviation, if any.
It is clear from the results of the Kolmogorov-Smirnov One-Sample test, which examines the moderation of the distribution of members sample, that there is no moderation between the distribution of the sample members in the cities of Abha and Bisha in all research variables, and accordingly, the Mann-Whitney U test was applied on the two samples. The Mann-Whitney U test that is a non-parametric test for null hypothesis which is randomly selected for two variables
X and
Y from the population and defined as follows:
Two independent samples with variables (gender, category) were used, and the Kruskal-Wallis test was used for several independent samples with a variable (age), as shown later.
where the expected value of the rankings and variance with sample size
n is defined as follows:
The parametric tests are used when the distribution is normal, and the significance level of the test is greater than (0.05), while non-parametric tests are used when the distribution is abnormal and the significance level of the test is less than (0.05), and the test results are presented in
Table 2:
The findings of the one-sample Kolmogorov Smirnov test indicate that there is no significant moderation in the distribution of sample members between the cities of Abha and Bisha across all research variables. Consequently, the Mann-Whitney U test was employed to analyze two independent samples with variables of Gender and Category, while the Krus-kal-Wallis test was utilized to examine several independent samples with the variable of Age, as presented in the subsequent sections.
3.5. Methods Used in Spaital Analysis
There are several methods of spatial analysis that can be used to study properties of concrete. Some of the commonly used methods include such as Geographic Information Systems (GIS) which known as the powerful tool for spatial analysis that allows researchers to integrate, analyze, and visualize various data layers related to concrete properties. It can help in identifying patterns, hotspots, and spatial relationships between different variables.
The mean center of spatial analysis, known as the centroid or center of gravity, is a statistical measure used to determine the average location or central point of a set of geographic features or data points within a given area. It is commonly used in various fields such as geography, urban planning, and transportation.
The central feature of spatial analysis is the examination of patterns and relationships within geographic data. It involves the use of various techniques and tools to analyze, interpret, and visualize spatial data in order to gain insights and make informed decisions.
The standard distance of spatial analysis refers to the average distance between objects or features in a spatial dataset. It is a measure of the dispersion or clustering of the data points in space. There are several methods to calculate the standard distance, depending on the type of data and the specific analysis being conducted. One commonly used measure is the standard deviation, which quantifies how much the data points deviate from their mean location.
Nearest neighbor analysis is a spatial analysis technique used to determine the degree of clustering or dispersion of point features within a given study area. It helps identify patterns and relationships between points based on their proximity to one another. The process involves calculating the average distance between each point and its nearest neighboring point. This average distance is then compared to an expected average distance, which is derived from a random distribution of points with the same density as the study area.
4. Results and Discussion
The Arc Map 10.8 Spatial Statistics tool has well-known methods for measuring the spatial relationship between phenomena based on measurements of location, shape, size, and area according to the following methods (
Figure 2):
4.1. Mean Center
The spatial average of the green spaces in the cities of Abha and Bisha is in the south of Bisha and the north of Abha, specifically in the separating area between them, and therefore it is the main attraction for the distributions, and this explains its location in the middle of the distance between the two cities, and the availability of a large number of gardens in the surrounding neighborhoods.
4.2. Central Feature
The green area that is located as close as possible to the spatial average is determined, and it is located in the city of Abha, specifically to the west of the city center. This green area is the most central of them and represents the heart of its spatial distribution. This is due to the association of the distribution of gardens with heavily populated neighborhoods, which are concentrated to the west.
4.3. Standard Distance
The spatial concentration or dispersion of green areas in the cities of Abha and Bisha can be determined using the concept of Circle Standard. The standard distance, which is the radius of the standard circle, is 5603.2 m. Within this circle, there are 27 green areas. Based on this information, it can be inferred that the green areas are not appropriately distributed and tend to be dispersed. The circle with a radius equal to the standard distance should ideally include around 68% of the phenomenon if the distribution is appropriate. However, in this case, there are more green areas within the circle than expected. To analyze the directional distribution of green areas, an oval shape is used. The center point represents the average location, and the largest axis indicates the direction that most green spaces take. By measuring the angle of deviation from north, it can be determined if there is a specific direction to the distribution. In this case, it was found that the pattern of spreading gardens in Abha and Bisha takes an oval shape extending from north to south. The angle of deviation from north is 49.4 degrees. This can be attributed to the flat land between surrounding heights in both cities. Overall, these findings suggest that green areas in Abha and Bisha are dispersed rather than concentrated, and they tend to follow a north-south direction due to geographical factors.
4.4. Nearest Neighbor Analysis
Nearest neighbor analysis showed a value of (0.86), indicating that the distribution of parks across Abha and Bisha was entirely coincidental, and the reason for this is the location of the Z Score, whose value is (1.58) within the range of the critical value, where the range of the critical value ranges between (−2.58, +2.58), and if the Z Score value, which is associated with the standard deviation from the mean, falls outside the range of the critical value, then we accept the alternative hypothesis represented in the distribution taking a non-random pattern, and vice versa, with a very high statistical significance level, reaching the level of Her confidence is 100%.
4.5. General Statistical Trends for the Population Sample in the Two Cities
The frequencies, percentages, arithmetic averages, and standard deviation were calculated for the themes and expressions of environmental sustainability in the cities of Abha and Bisha, and the arithmetic averages were arranged in descending order to determine the highest themes and phrases. The results were as presented in the following
Table 3:
The statistics for Abha seem to be comparable to those for Bisha, and analysis of the data in
Table 3 yields the following results:
With a mean score of 3.61 and an agreement degree across all axes and phrases, Abha was rated as having a relatively sustainable environment overall. Additionally, the city’s environmental sustainability score had a relatively small standard deviation of 0.815. Indicative of the harmony of the distribution of green areas in the city’s communities, since all neighborhoods enjoy vast sections of green space, the research sample agreed regarding the overall scale.
Phrase No. (2) reads (Increasing green spaces has enhanced the status of the city and improved the environmental sustainability for citizens and residents alike) got the highest average of (3.65), followed by phrase No. (1) reads (Increasing green spaces plays an important role in achieving environmental sustainability), where I got an average of (3.63), and this indicates that the city of Abha has occupied a distinguished position on the map of domestic tourism in the Kingdom, and the availability of green spaces in it has strengthened that position.
Phrase No. (3) got the lowest average, at (3.52), and it deals with promoting biodiversity and restoring the natural environment in a way that achieves sustainability, and this indicates the need for the city’s residents to raise awareness about the term environmental sustainability.
The study recorded very diverse statistical outcomes for Bisha, the city under investigation: The total measure of environmental sustainability in the city of Bisha obtained a score of (Neutral), with an arithmetic mean of (3.73), and a small standard deviation of (0.939), which indicates the agreement of the opinions of the research sample on the total measure as a whole.
Phrase No. (2) reads (Increasing green spaces has enhanced the status of the city and improved the environmental sustainability for citizens and residents alike.) got the highest average of (3.45), and despite that it is lower than its counterpart in the city of Abha, which It indicates the importance of landscaping as one of the important variables in creating environmental sustainability on the one hand, in addition to the lack of green areas in Bisha compared to Abha.
The decrease in the average of phrase No. (1) reads (Increasing green spaces plays an important role in achieving environmental sustainability), as it reached (3.28), and this is explained by the low environmental awareness among the residents of the city of Bisha of the importance of green spaces in achieving environmental sustainability.
4.6. Populations Trends toward Green Landscapes According to Type
The Mann-Whitney U test was employed to assess the dissimilarities between two autonomous samples, namely Male and Female, with respect to environmental sustainability in the cities of Abha and Bisha, based on the gender variable.
Environmental sustainability was significantly more important in the city of Abha, with a value of (0.905) in
Table 4, than in the city of Bisha, with a value of (0.239), both of which are larger than (0.05). This shows that there are no variations between the averages of the responses of the research sample individuals in Abha and Bisha on the overall scale at the level of significance (=0.05). This can be attributable to the variable (gender), suggesting that both men and women in the two cities share a same level of understanding of the need of preserving the environment for future generations.
4.7. Populations Trends toward Green Landscapes According to Age Group
The non-parametric Kruskal-Wallis test was used for several independent samples (Less than 20 years, from 20 to 40 years, more than 40 years), to measure the differences between the study sample in environmental sustainability in the two cities of Abha. And Bisha according to the age variable (Age).
Table 5 shows that Environmental Sustainability in Abha was 0.092, while it reached (0.368) in the city of Bisha, all of which have values greater than (0.05). This suggests that there are no significant differences from a statistical standpoint. At a significance level of 0.05, a comparison was made between the mean responses of the research sample in the cities of Abha and Bisha with respect to the variable of age (Age). The results indicate that there is no significant difference in the level of cognitive awareness of environmental sustainability among residents of Abha and Bisha across all age groups.
4.8. Populations Trends toward Green Landscapes According to Nationality
The study employed the Mann-Whitney U test to compare two independent samples, namely Citizen and Resident, to evaluate the disparities among the participants in a specific aspect of environmental sustainability in the cities of Abha and Bisha based on the categorical variable.
By analyzing the numbers of
Table 6, it was found that the value of (Environmental Sustainability) amounted to (0.589), in the city of Abha, which is greater than (0.05). This means that there are no discernible variations in average responses from one group of people to another at the 0.05 level of statistical significance. Abha, while in Bisha it reached (0.000), which is less than (0.05), indicating the existence of statistically significant differences between the averages of the responses of the research sample at the significance level (=0.05). It can be explained by looking at the category variable, which shows that citizens are more concerned with protecting green spaces than non-Saudi residents and so more likely to work toward environmental sustainability.
4.9. Correlation Analsis between the Components of Environmental
The present study computed the Pearson Correlation coefficient to examine the association between the overall score of the quality-of-life measure and the total score of each axis of the scale, based on the responses obtained from the study sample residing in the cities of Abha and Bisha.
The results presented in
Table 7 demonstrate that the correlation coefficients between the degree of the total quality of life measure and all axes of the scale were statistically significant at a level of significance of 0.01, with a
p-value of 0.000. These findings indicate a positive correlation and function between the variables. The study sample from the cities of Abha and Bisha suggests that there is a correlation between the overall scale of environmental sustainability and the individual axes of the scale. This indicates that the components of environmental sustainability have a mutual influence on each other. Furthermore, the study suggests that the population’s environmental culture appears to be consistent across all variables. The findings pertaining to the disparities in the mean response of the sample population residing in the two urban centers:
By analysing the data of
Table 8, the total level of significance for the dimensions of the quality of life measure (Total: Quality of life in the cities) was at the level of significance (0.000), and the level of significance of the first axis (Environmental Sustainability) was at a value of (0.000), while The significance level of the second axis (carbon emissions) was (0.005), the significance level of the third axis (Increasing the green area) was (0.000), the significance level of the fourth axis (Improving Public Utilities and Services) was (0.001), and the significance level of the fifth axis (Improving Cultural and Entertainment Services) had a value of (0.000). All of which are values smaller than (0.05), indicating that there are statistically significant differences at the level of significance (
p = 0.05) between the average responses of the research sample individuals in the city of Abha and those in Bisha in the total quality of life scale, which is attributed to the variable (City), in favor of Abha. This explains the authorities’ clear interest in the city.


