Article

An Evaluation of Smartphone Tracking for Travel Behavior Studies

by
Dominique Gillis
1,2,*,
Angel J. Lopez
1,2,3 and
Sidharta Gautama
1,2
1
Department of Industrial Systems Engineering and Product Design, Ghent University, B-9000 Ghent, Belgium
2
FlandersMake@UGent—Corelab ISyE, B-3001 Leuven, Belgium
3
Department of Electrical and Computer Engineering, ESPOL Polytechnic University, Guayaquil 090150, Ecuador
*
Author to whom correspondence should be addressed.
ISPRS Int. J. Geo-Inf. 2023, 12(8), 335; https://doi.org/10.3390/ijgi12080335
Submission received: 17 May 2023 / Revised: 24 July 2023 / Accepted: 2 August 2023 / Published: 11 August 2023
(This article belongs to the Special Issue Urban Geospatial Analytics Based on Crowdsourced Data)

Abstract

:
The use of smartphone tracking is seen as the way forward in data collection for travel behavior studies. It overcomes some of the weaknesses of the classical approach (which uses paper trip diaries) in terms of accuracy and user annoyance. This article evaluates if these benefits hold in the practical application of smartphone tracking and compares the findings of a travel behavior survey using smartphone tracking to the findings of a previous paper survey. We compare three phases of the travel behavior study. In the recruitment phase, we expect smartphone tracking to make people more willing to participate in surveys, given the innovative nature and reduced burden to participants. However, we found the recruitment of participants equally challenging as for classical methods. In the data collection phase, however, we observe that participants entering the smartphone tracking survey are much more likely to complete the data collection period than when using paper trip diaries. Because of the limited burden, the risk of drop-out from the survey is significantly lower, making the actual data collection more efficient, even for longer survey periods. Finally, in the data analysis phase, the travel behavior indicators derived from smartphone tracking data result in higher average trip rates, shorter average trip lengths and a higher share of active modes (bike, walking) than the results from the paper survey. Although this is explained by more complete and more consistent trip registration, this finding is problematic for comparability between surveys based on different methods, both for longitudinal monitoring (comparability over consequent surveys) and for benchmarking (comparability over geographical areas). Therefore, it is crucial to clearly report the applied data collection methods when describing or comparing travel indicators. In surveys, a combined approach of both written trip diaries and smartphone tracking is advised, where each method can complement the shortcomings of the other.

1. Introduction

Insight into an individual’s mobility behavior is a key element for urban mobility planning. Understanding the drivers behind people’s mobility choices (destination choice, mode choice, route choice, etc.) is essential in creating adequate conditions to fulfil their travel needs and to stimulate them towards more sustainable travel behavior. These insights are applied in transport planning in order to assess the impact of spatial and infrastructural projects on future traffic and mobility, for example, by using traffic models. This way, investments in mobility systems can be evaluated and optimized according to the expected behavioral impact.
Traditional methods for the collection of data on individual trip behavior are “self-reporting”, which means that people are asked to report their daily trips during a survey period of several days. This can be achieved by means of paper reports (“trip diaries”) or telephone surveys. For each trip, the most important variables are registered, typically including the travel purpose, mode, origin/destination, time of departure/arrival, trip length, etc.
These methods have important drawbacks. So far, many studies [1,2] have shown that data collected in this manner systematically deviated from actual travel behavior. An important issue is that part of the information is likely to be lost due to the delay between the actual trip and the time of completing the trip survey. Typically, trip surveys are recorded at the end of the day. This can heavily influence the accuracy of the reported departure/arrival times and trip distances. Time durations are typically rounded to 5 or 15 min values and distances are rounded to 5 or 10 km values [3]. Car drivers tend to underestimate their travel times, and public transport users tend to overestimate their travel times [4]. Another issue is the difficulty in accurately reporting locations (origin, destination) and routes followed during trips, due to the limitations of survey instruments. This issue can be overcome by integrating computer-assisted web interviewing (CAWI); however, this increases the burden on the user. Indeed, these survey methods require a great deal of effort from the respondent, which has been mitigated to some extent by replacing the original paper-and-pencil interview (PAPI) with computer-assisted personal interviews (CAPI, face-to-face interviews), computer-assisted telephone interviews (CATI) and, later, computer-assisted web interviews (CAWI) [5]. These techniques help respondents to understand the questions asked and recall the trips they had during the day [6]. Still, however, the resulting burden is reported to cause a loss of motivation and undesired side-effects such as a typical decrease in the reported number of daily trips during the survey period [7,8], due to underreporting of short trips [1,9,10,11] and participants dropping out from the survey [12,13]. As a consequence, traditional survey methods use relatively short survey periods of several days [14,15].
The introduction of the Global Positioning System (commonly referred to as GPS) started an important revolution in the collection of trip data. By logging GPS-tracked data, an enormous amount of detailed information on the positions of devices together with corresponding time stamps became available, offering a massive potential to fill some of the gaps that were not covered by traditional data-gathering methods. The use of GPS enabled the reporting of exact origins and destinations and of exact times of departure and arrival. In addition, routes themselves was logged, including detailed information on intermediate points, enabling the monitoring of travel speed. On top of this, data was collected without any interference by the respondent, allowing round-the-clock monitoring, even for longer periods. This type of logging became known as “passive logging”.
However, GPS logging has two major shortcomings. Firstly, since initially GPS devices were typically installed in vehicles, the gathered data only reported on the use of that specific vehicle, covering only a unimodal part of an individual’s trip behavior. Vehicles could also be used by more than one individual, distorting the one-to-one relationship between individual users and logged travel data. The use of portable handheld GPS devices offered a solution to this issue [16] but required the effort and discipline from the respondent to continuously carry the device with him/her and to regularly charge the device. Forgetting the device —by mistake or out of convenience— or running out of battery resulted in unreported gaps in trip data. Secondly, a drawback of GPS logging is the lack of information on aspects like trip purpose and travel mode. This introduces new challenges in reconstructing this information in retrospect, either by means of additional surveys [17] or by interpreting the data using logical rules, e.g., using speed information [18] or GIS information [19]. Interpretation of the data is divided into several partial problems which have been approached using different methodologies [18,20,21,22,23,24,25]. Splitting the continuous GPS logging into separate trips by detecting origins and destinations is based on dwelling times at a location. The determination of the travel mode is primarily based on speed characteristics during the trip, which can be further regularized with additional GIS data (e.g., about public transportation networks and rail networks) or accelerometer data [26]. Trip purpose is estimated using land-use maps or by analyzing individual trip chaining (a sequence of trip segments between a pair of anchor activities “home” and “work” or “school” [27]). These methodologies yield good results for determining trip ends and travel modes, but the quality of the estimation of trip purposes remains poor [28].
New horizons have opened up with the popularity of the smartphone, offering similar features as those of portable GPS devices but with additional sensors (accelerometer, Bluetooth, Wi-Fi, Near Field Communication (NFC), System User Interface (UI)) that avoid typical problems of GPS devices such as signal loss (in buildings, “urban canyons” or during the warm-up time when finding the initial position) [29]. An analysis of time gaps in data collection [30] shows that these losses mainly involve gaps with limited duration. Additional sensors offer a more solid base for, e.g., travel mode determination [31]. Some of the disadvantages mentioned apply to a lesser degree, as carrying a smartphone has become a habit and is, therefore, considered less of a burden. This reduces the risk of non-reported trips or uncharged batteries.
In addition, smartphones offer the opportunity of running dedicated mobile applications or apps, optimizing the practicality of trip registration through the application’s user interface. Various smartphone apps have been developed with various logging strategies.
One essential design choice is whether trip registrations are activated manually by the user (“active logging”) or rely on automatic trip detection by the app itself. In the case of active logging, the user manually activates and deactivates the registration of a trip [32]. This option requires discipline and dedication of the user to register every single trip during the test period, although the burden remains limited [33] when reporting is restricted to short entries at the very moment of departure and arrival. Still, the quality (completeness) of data collection depends on the user’s motivation and dedication. In the case of “passive logging”, the smartphone app uses the input from various sensors to decide when a trip has started or ended and automatically starts and ends registration accordingly. This reduces the burden on the user, but the correctness of the detection algorithm is determining for the quality of the data, with the risk of over- or underreporting trips in case of missed starts/stops. A review of emerging trends in household travel surveys [34] points to the exploration of more passive data enhancement as a way forward to supplement household surveying efforts. However, a comparison of 17 smartphones apps for travel diary collection [35] indicated that purely passive apps are not ready for rollout and that active contribution from respondents is still highly recommended. We note that, in this context, the “burden” on the user should be interpreted in a broader sense than merely as the manual handling of registrations. As the collection, processing and communication of data from various sensors drastically impact battery consumption, battery-saving strategies also represent an essential challenge related to the potential of mobile-sensed mobility behavior [36,37,38]. An unexpectedly low or completely flat smartphone battery may be another hurdle for users, urging them to stop participation in the survey.
A second important feature is the possibility for users to annotate additional trip characteristics (like trip purpose, travel mode or the number of persons undertaking the same trip), which cannot be measured by smartphone sensors (e.g., impossible to detect if the person was travelling with company, e.g., children, or was transporting any luggage during the trip) or can only be estimated implicitly from the data (e.g., the transportation mode is related to speed and acceleration data; the trip purpose may be linked to the time of day or the destination location). As many of these aspects are crucial in understanding people’s transportation decisions (departure time, transport mode choice, trip destination, etc.), many tracking apps allow the user to annotate these trip characteristics, in order to have more accurate information than that obtained by deduction from sensor data. The downside is that the annotation poses an additional burden on the participant. Therefore, it can be offered as a voluntary option instead of as an obligatory action by the user. For the same reason, instead of prompting the annotation immediately at the start or end of a trip (ensuring immediate and most correct information), it may be delayed until a quieter moment (e.g., every evening).
Another feature of smartphone tracking is whether the user has the opportunity to control and correct trip registrations afterwards. The user can improve the quality of the data by adding trips (in case of missed trip starts), by shortening trips (in case of missed trip ends), by defining trip legs (splitting a multimodal trip into separate trip legs per transport mode) or by correcting trip attributes (in case of automated assessment of attributes like transport mode, trip purpose, etc.). Especially in case of passive logging, this check avoids the dependency of the quality on technical processes for data collection (automated trip detection, travel mode assessment) and data enhancement (e.g., filtering, interpolating missing parts of trips, map matching). Also, in case of active logging, this allows the user to correct for possible mistakes in the manual handling of registrations. As described in [39], low-level data inaccuracies propagate throughout processing stages and affect derived information. Again, however, consideration is needed between data quality, on the one hand, and the required effort from the user, with the related risk of drop-out from the survey, on the other.
As a result, smartphone tracking is considered a valid method for performing travel behavior surveys [29,40,41], mainly because of the automated collection of a large amount of detailed data on spatiotemporal trajectories and related information without the use of time-consuming and expensive surveys and with great flexibility in designing the survey—overcoming some of the limitations of traditional surveys in terms of the required commitment from the participants and inaccurate or incomplete information [29]. Some limitations are the required IT expertise, the relatively short battery life and the cost of transferring data—although these limitations are becoming less important with technological development—and possible sampling problems due to uneven distribution of mobile phones in society [42,43]. Two groups of applications of smartphone tracking are distinguished in [29]. One group focuses on technical and methodological aspects, in order to verify and enhance the accuracy of the method. The second group focuses on the application of travel behavior data for analytical purposes [37,44] or for the needs of public policies (see [45] for an extensive overview of research domains; specific applications, for example, apply to bicycle safety and bicycle comfort [46,47,48,49] or the mobility impact of the COVID-19 pandemic [50,51]). On a larger scale, the French standard mobility observation mechanism has been revised towards a modular architecture with a core comprising optimized household travel surveys and options that react to changing needs and opportunities, one of which is the use of smartphone applications as a fully fledged method of data collection [52].
Direct comparisons between traditional paper surveys and smartphone methodology mostly relate to the accuracy of data collection and processing steps (trip start/stop detection, travel model assessment, etc.) [30,53,54,55,56]. Nahmias-Biran et al. [57] presented comparative analyses between travel surveys using the FMS platform (Future Mobility Sensing, smartphone-based survey) and face-to-face interviews in Singapore and Tel-Aviv. The analyses showed that FMS data were more accurate, more complete and richer than those obtained from traditional surveys. More specifically, the FMS survey data had higher resolution and better accuracies regarding times, locations and paths, better represented out-of-work and leisure activities and revealed large day-to-day activity pattern variability, which was not captured by the one-day snapshots obtained with the traditional surveys. FMS also captured travel and activity that were underreported in the traditional surveys, such as multiple stops in a tour and work-based sub-tours. A similar comparison between a traditional survey and a GPS-based survey in Phoenix, Arizona [58], reports on the known issues of underreporting of trips and travel time rounding in traditional surveys. The most significant magnitude of differences between trips rates in the traditional and FMS-based surveys—up to almost 85%—was for non-home-based trips. Large differences were observed for motorized modes due to apparent underreporting of intermediate trips in home- and work-based travel tours. This circumstance was also reflected in the trip length distribution by purpose and mode between the two surveys with underreporting of short trips in the traditional survey.
Some works of research have compared the methods specifically from the perspective of respondents. Roddis [59] reported the evaluations by respondents who simultaneously completed a survey using both methods. The participants reported a higher degree of confidence in the accuracy of the automated data collection, a higher level of survey enjoyment because of the graphical design of the survey but also a higher survey difficulty (mostly referring to the validation and correction of the recorded data). A similar evaluation of a smartphone travel survey [60] reveals that the perceived “ease of use” and “usefulness” have a significant, positive impact on the level of respondents’ “satisfaction” and “continuance intention” toward respective travel surveys. These findings highlight that while most travel survey apps currently focus on data collection, it is important to provide useful information and services to survey participants (e.g., their energy consumption, active calories burned and vehicle emissions) to motivate them to participate in surveys.
In this article, we want to broaden this comparison from an operational viewpoint: do the reported strengths also reflect in the execution of a travel behavior study based on smartphone tracking? Therefore, we evaluate the method on the level of a complete data campaign, focusing on the expected impacts of the smartphone technique in three specific stages of the campaign:
-
During the recruitment of participants, one would expect smartphone tracking to make people more willing to participate in surveys, given the innovative nature and reduced burden;
-
In the data collection phase, one would expect that participants entering the smartphone tracking survey are much more likely to complete the data collection period, given the reduced burden compared to paper trip diaries;
-
More detailed and more complete registration is expected to result in more reliable indicator values for travel behavior indicators.
We evaluate the three aspects by comparing the findings of a test survey utilizing smartphones with the results of a traditional approach using a paper trip diary. After explaining the set-up of the experiment (Section 2), we describe and discuss the findings for each of the three aspects (Section 3) before summarizing the conclusions in Section 4.

2. Materials and Methods

Like many authorities, the Walloon region, the southern part of Belgium, has a tradition of regular travel behavior surveys in order to monitor various aspects of mobility in the area and to understand the drivers behind the behavior. Recent travel behavior surveys have been performed at the national level in Belgium in 1999 (MOBEL, Daily Mobility in Belgium [61]), 2010 (BelDaM, Belgian Daily Mobility [62]) and 2017 (MONITOR, [63]), also covering the Walloon area. Additional surveys for the Walloon area took place in 2002 and 2004 (ERMM, Regional Mobility Survey of households in Wallonia).
The different surveys share a similar approach in order to ensure comparability between consecutive surveys and to allow for longitudinal insights. The surveys consist of a paper trip diary, collecting information (travel mode(s), purpose, passengers, etc.) about all trips of the participant during one reference day, which is complemented by a socio-demographic survey on the level of both the individual and the household, in order to link the individual mobility behavior to the person’s socio-demographic profile.
The major challenge of the surveys concerns the representativity of the sampled population, as a consequence of the difficulty in reaching certain subgroups and of the decreasing participation rate of contacted persons. Experiments are, therefore, undertaken to test alternative survey methods based on CAPI, CATI and CAWI.
One of the experiments has also been dedicated to travel behavior studies by means of smartphone GPS tracking. The project GPSWAL was organized by IWEPS (Walloon Institute for Evaluation, Forecasting and Statistics) in 2016–2017 in order to explore the potential and limitations of GPS tracking for this purpose and to evaluate the possible impact of the survey methods on the final results and indicators for mobility in the Walloon region.
For the data collection, the Android-based smartphone application CONNECT was used, which was developed at Ghent University [30] with specific attention paid toward user friendliness in terms of ease of use, graphical attractivity and optimized battery usage. Various settings for the location accuracy and the sampling frequency of the location points were tested during the development period.
CONNECT integrates the registration phase (the collection of some basic personal information like age, gender, household type, professional status, driving license, postal code of home and work location) so that no additional contacts or surveys are needed, thereby avoiding demotivation or drop-out of participants. After installation and registration, the app can be used in two modes:
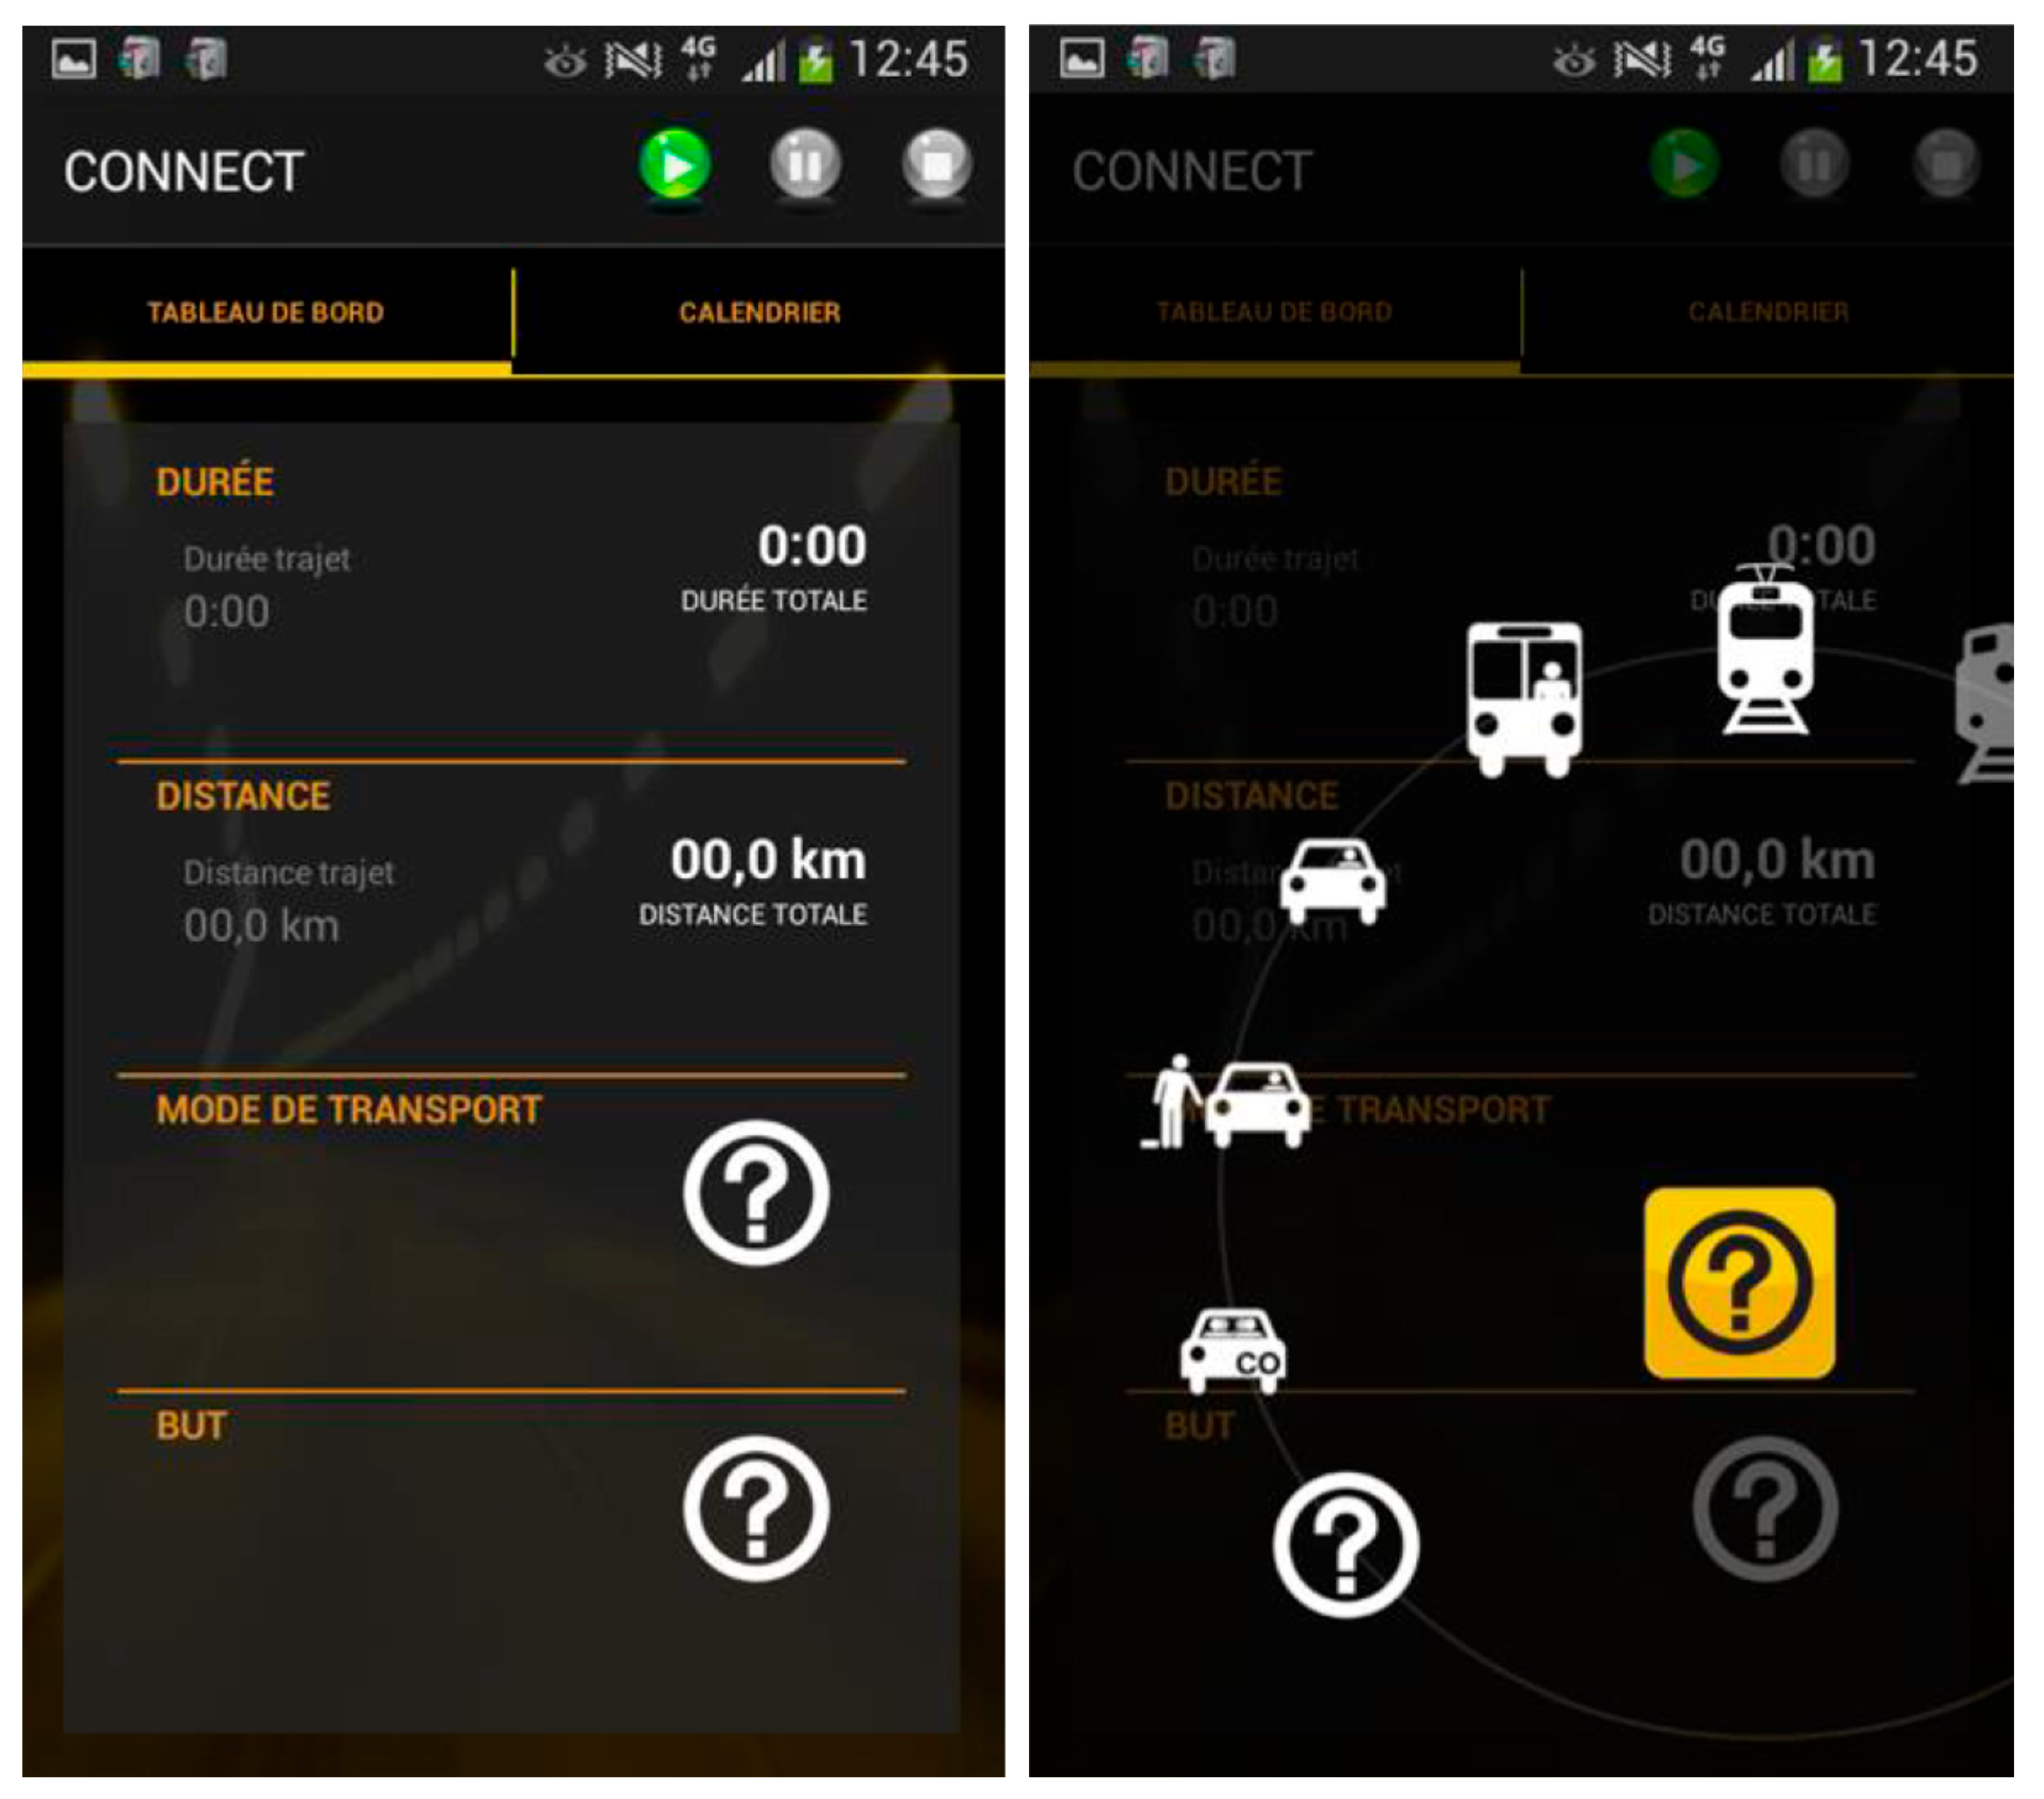
  • In the “survey” mode, the participant manually initiates and terminates the registration of a trip at the start and upon arrival. In this case, the user also immediately enters the transport mode and purpose of the specific trip, resulting in complete and reliable trip information (see Figure 1);
  • The “background” mode applies automatic trip detection in order to decide autonomously about the activation and deactivation of smartphone tracking, without need of the participant to interfere with the app. In this case, the transport mode is estimated during the processing of the data (out of four modes: pedestrian, bike, motorized and other), resulting in segmented trip activity (time and estimated distance) with one out of four detected transport modes. Trip segments belonging to one trip are recorded as such. In the background mode, no information about trip purpose is available.
By combining both modes, minimal levels of data collection and data quality are guaranteed for all participants who have at least installed the CONNECT app, since the “background” mode ensures automatic data registration. This mode limits the burden on the participant to carry his smartphone during all trips and ensure that the battery is regularly charged. More motivated participants are free to apply the “survey” mode and invest some effort in collecting data with even better quality. Even if participants do not use the “survey” mode for all trips or for all seven survey days, it still contributes to a better and more complete dataset. Moreover, even in background mode, the user does have the possibility to consult, validate and correct his/her registered trips to improve the quality of the collected data. This is specifically relevant for the transport mode (confirmation or correction by the user results in a higher reliability compared to the value estimated by the algorithm) and trip purpose (addition by the user provides additional information which cannot be assessed by the algorithm).
Because of the ease of use, participants in GPSWAL were asked to keep the app installed (and, thus, log their trips) for a survey period of seven days, compared to a typical survey period of one to three reference days in surveys employing written trip diaries.
During the official survey period, which lasted from 13 October 2016 to 30 May 2017, 237 individual users participated in the survey by installing the CONNECT application to track their trips.
In this article, we evaluate the feasibility of smartphone GPS tracking for the purpose of travel data collection, based on the GPSWAL smartphone survey.
The collected raw data (GPS locations) collected by CONNECT were aggregated into trips and trip legs, which were cleaned by means of map matching. Based on the trip characteristics, a transportation mode was automatically assigned per trip leg, distinguishing four categories: bike, foot, motorized modes and other. Further background information on data processing in the CONNECT app and the supporting data platform MOVE is found in the publications [30,39,47,64,65].
Erroneous registrations (false starts, missed stops, missing GPS data) were filtered by a set of rules:
  • Trips or trip legs with a distance = 0;
  • Trips or trip legs with Duration ≤ 0;
  • Trips or trip legs with distance < 100 m;
  • Trips or trip legs with distance > 100 km.
The resulting dataset for the official survey period consisted of 10.395 trips, totaling a distance of over 121.000 km. This dataset was used to assess travel behavior indicators for the evaluation described in the following step.
For the evaluation of the data collection campaign, we considered three phases of data collection:
  • The recruitment of the participants;
  • The completion rate of the survey;
  • The impact of smartphone tracking on the resulting travel behavior indicators.
The last aspect is described by comparing the results of the GPSWAL project (applying smartphone tracking) to the results of the BELDAM and MONITOR studies (using a paper trip diary).
This comparison is made for 5 of the indicators covered in the BELDAM report:
  • Trip rates;
  • Modal split;
  • Trip purpose;
  • Trip distance;
  • Trip durations.
The main differences between both results are described in a qualitative way, and the possible role of the survey methodology as a cause for these differences is considered.
When comparing results between surveys, BELDAM has two advantages over MONITOR. First of all, the BELDAM report analyzes a wider set of mobility indicators, such as trip length distribution and trip duration, which are not or very partially analyzed in public MONITOR reports. Secondly, MONITOR only reports results for the whole of Belgium, whereas BELDAM reports specific results for the Walloon region in the south of Belgium, which is also GPSWAL’s study area. This is essential as the southern (Wallonia) and northern (Flanders) regions of Belgium have very different travel behavior, e.g., because of the flatter and more urbanized context of Flanders. On the other hand, a limitation of BELDAM is the 7 year time gap between BELDAM and GPSWAL, possibly introducing social, demographic and infrastructural changes, to name a few.
When discussing the results for mobility indicators between the surveys, we mainly compare BELDAM and GPSWAL as both evaluate the same detailed indicators, specifically for the Walloon region of Belgium. In addition, BELDAM and MONITOR are compared to describe the evolution over the period of 2010–2017, but this comparison can only be based on the average values for all Belgians.

3. Results and Discussion

We structure the results and discussion around the following three stages in our traffic behavior survey campaign: the recruitment of the candidates, the cooperation of participants during the survey (completion rate) and the eventual transport behavior indicators.

3.1. Recruitment of Participants

A typical initial challenge in the organization of travel behavior surveys is the recruitment of participants. It is methodologically important to obtain a representative sample of the total population; underrepresentation of specific subgroups requires specific attention.
A specific challenge, however, is the response rate of contacted candidates: not all contacted persons will necessarily participate in the survey. From earlier experiences with surveys based on written trip diaries, it is known that the response rate is low. For the BELDAM survey, the response rate (for the whole of Belgium) was 13% for the people contacted by post and 17% for people contacted for a face-to-face survey. A mixed approach increased the response rate to 30%. If we compare these results to the OViN survey in the Netherlands (Onderzoek Verplaatsingen in Nederland [66]), the response rate for CAWI surveys is similar (18.9%), but personal methods have a much higher effect than those employed in BELDAM, with 47.7% for CATI and 50.2% for CAPI. In the German Mobility Panel [67], 15% of the targeted persons completed the trip diary (having the choice between a paper survey or a web-based survey via desktop, smartphone or tablet).
The initial set-up of the GPSWAL aimed to incorporate the representativity of the sample during the recruitment phase. In order to meet an objective of 1200 participants in the survey, a stratified sample of 7000 persons were selected from the national register, taking into account the response rate of the latest BELDAM survey and the availability rate of Android smartphones. This group was first contacted by a personal invitation letter (13 October 2016) containing a link to the registration website. Several measures were taken to stimulate participation, such as a proper GPSWAL website, a helpdesk reachable by telephone or e-mail, a prolonged project period to allow more candidates to find a suitable survey period, clarification on the measures used to ensure data privacy and reminder mails to explain the importance of the survey and to ask for justification in case of non-participation. Privacy protection appeared to be a major concern withholding people from the survey. In a second phase of recruitment, recruitment was extended to all volunteers willing to cooperate, allowing open large-scale contacts by various communication channels (like e-mails and leaflets within the networks of participating partners). This way, the initial goal of achieving a representative sample was attenuated in order to increase the total sample size and investigate the technical aspects of data collection by smartphone and of further processing and analysis of the data. Indeed, this raises the concern of representativity as recruitment strategy and collection methods affect respondent characteristics [59,68] in terms of socio-demographic characteristics and related mobility attitudes [51,69,70,71,72].
As a result of the recruitment campaign, the CONNECT IWEPS application has been downloaded from the Google Play store 385 times since the start of the project, of which 67 downloads happened during the development and testing phase. Since the start of the official campaign, the app has been downloaded 318 times (note that the number of actual users is lower, as some users performed multiple downloads from one single imei-code and not every download leads to an installation of the app).
Table 1 gives an overview of the GPSWAL data activity in the official survey period, as used in further analysis:
Over the whole project, 237 people used the CONNECT app (meaning that 1 download on average resulted in 0.75 installations) to register their trips (note that this is lower than the sum of the two campaigns as some users participated in both campaigns). This number is very low, compared to the target of 1200 users and to the effort invested in recruitment (initial contacting of 7000 candidates, followed by open contacting of a broad audience), especially considering the innovative aspect of the smartphone survey and its decreased burden on the participant. On the other hand, however, the required availability of a smartphone, specifically running on Android, can be a limiter, certainly among specific target groups. On the other hand, a comparable field trial in Stockholm [73], wherein 130,000 people were contacted, resulted in 1559 people showing interest in participating and 495 actually signing up for the field trial. Three likely reasons were mentioned by the authors: some of the users possibly just wanted to have more information about the research project and did not see it as signing up for a field trial; iPhone users at first wrongly received information that they could not participate, after which the app was suddenly accepted and published on the App Store; and some candidates were not Android or iPhone users and, therefore, could not participate (mainly Windows Phone users).
The experience of the GPSWAL campaign indicates that the recruitment of participants maintains a crucial element in the success of the travel behavior study. Even when applying a modernized and more user-friendly method, possible survey respondents need to be convinced into participation. A simple (reminded) invitation by e-mail did not suffice for GPSWAL, although the only action needed was to install the smartphone application and register to the app. Stronger methods, for example, by personal contact via telephone or a face-to-face or motivating communication strategy, remain necessary to increase the response rate. This experience confirms the finding in [34,41], that the challenge of increasing participation in household surveys is one of the emerging trends in household travel surveys.

3.2. Completion Rate of the Survey

After participants have started the survey, a second challenge arises in keeping them motivated to persist until the end of the survey period. Typical phenomena are drop-out (participants terminating the survey during the survey period) and fatigue (decreasing number of reported trips during the survey period, e.g., because of respondents—deliberately or not—forgetting to report short trips). It was expected that smartphone GPS tracking would exclude the risk of fatigue because of automatic trip registration, which ensured consistent data quality throughout the entire survey period. Drop-out remained possible (by uninstalling the app before the end of the survey period) but seemed less probable as the burden on the respondent is drastically reduced compared to classical methods (paper survey, CATI, CAWI, CAPI). Two important causes of hindrance for the user were battery consumption and data usage, which were both increased by the tracking app (use of GPS and other sensors, data processing and transmission). Unexpected battery drainage or loss of data connection may be sufficient reasons for frustration causing the user to uninstall the application, which is exactly why the app was optimized for these criteria during the testing phase.
In the following paragraphs, we discuss the completion rate of the survey based on two indicators: the number of days with trip registrations and the use of the “survey mode” and tool for trip correction.

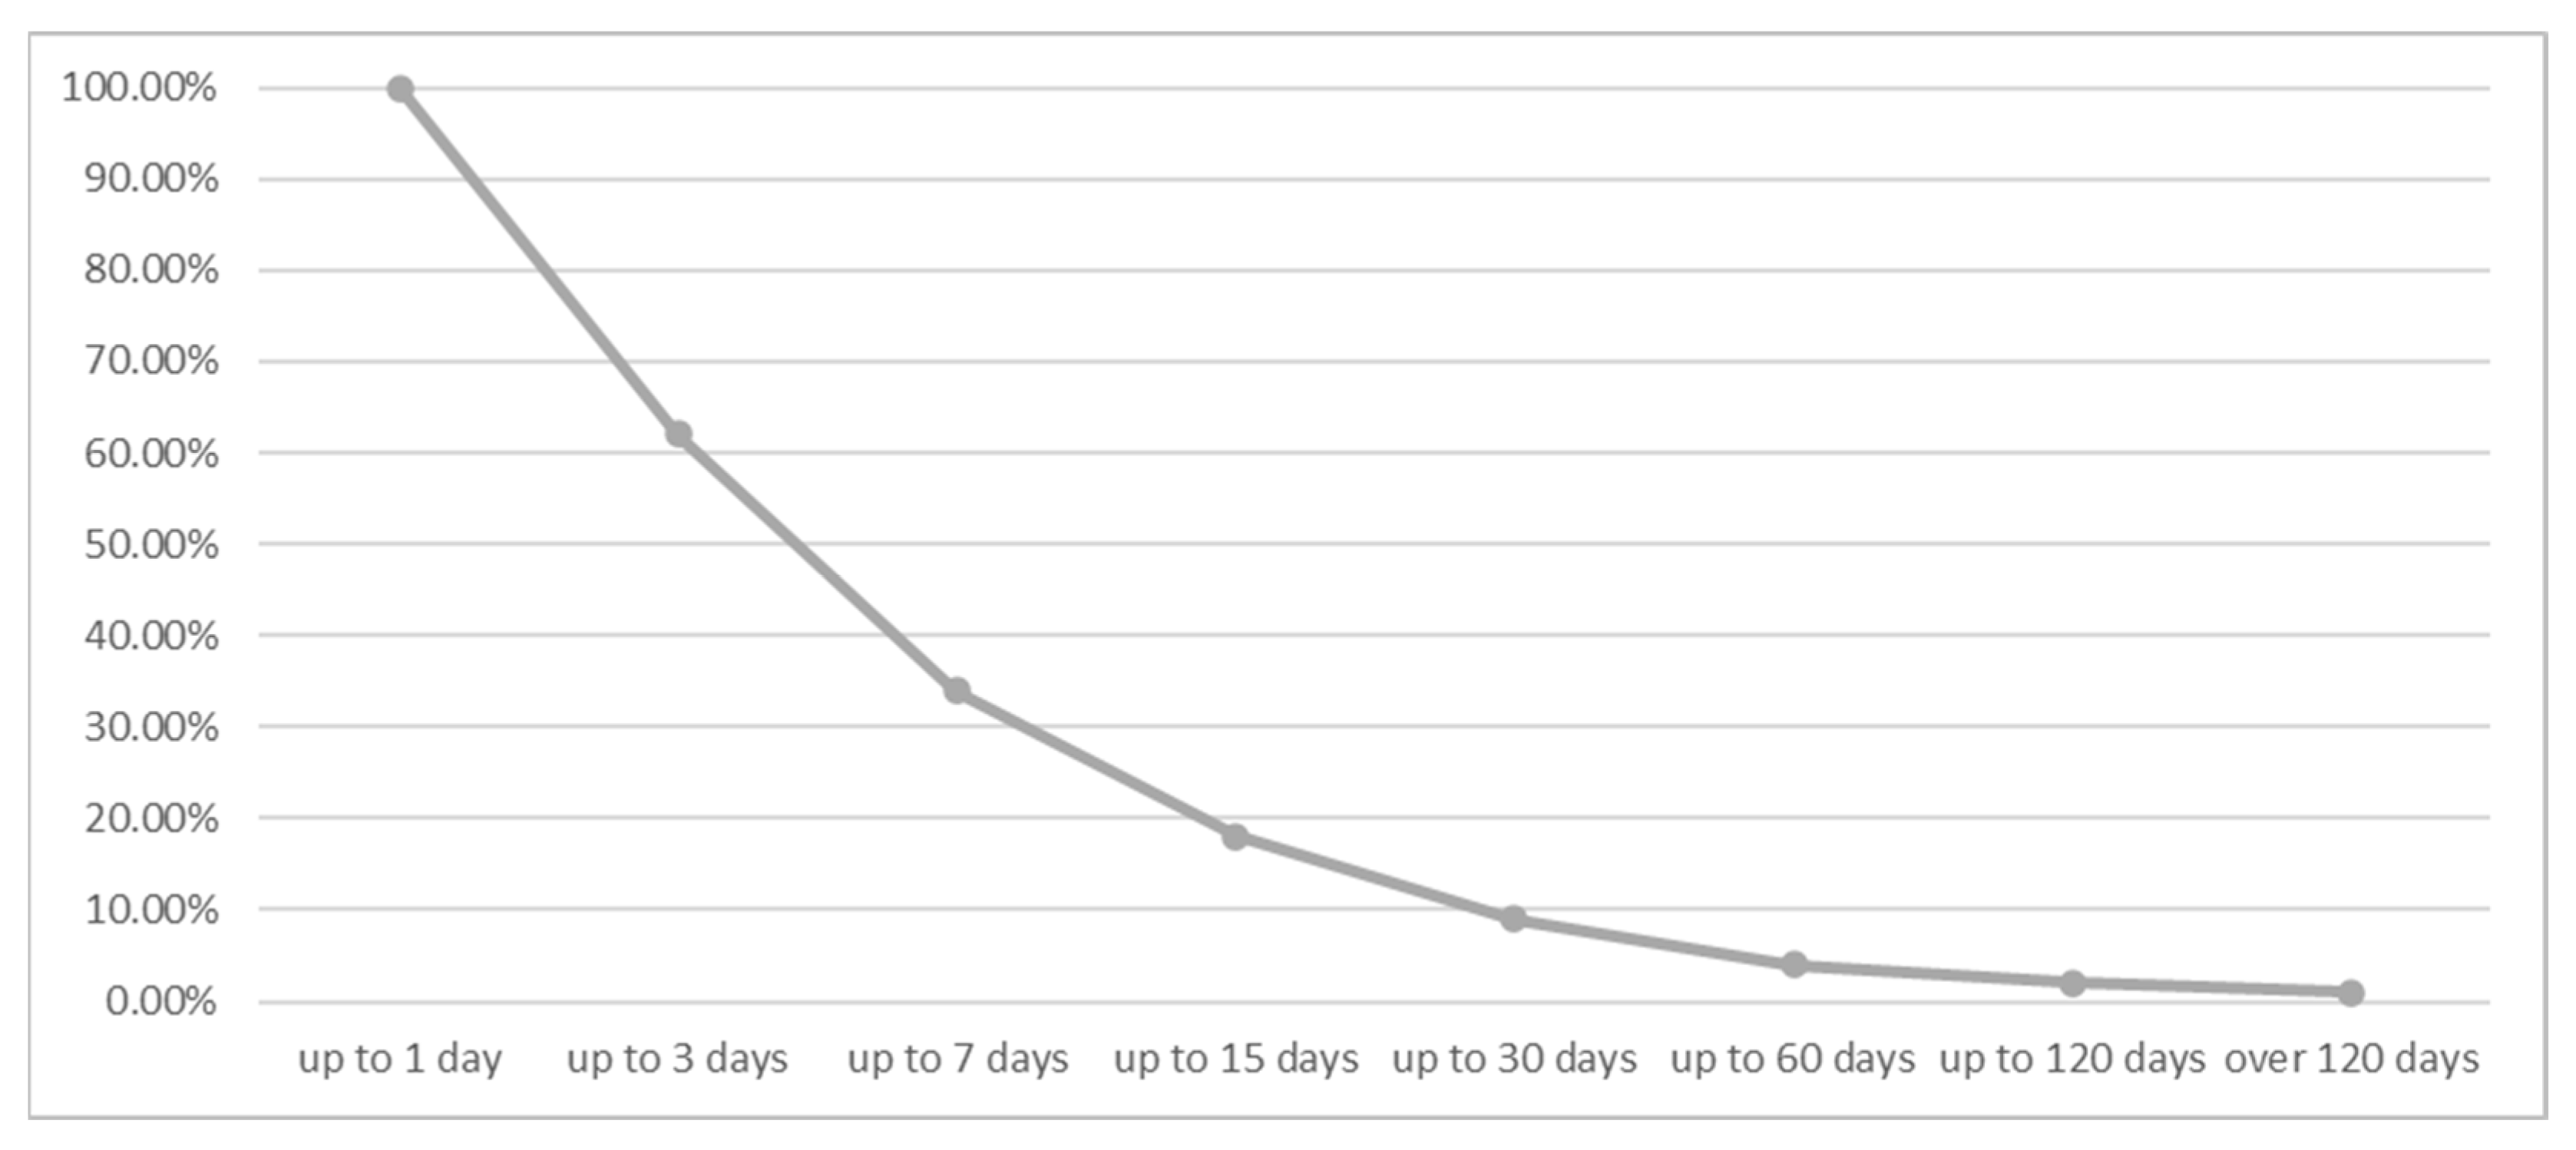
3.2.1. Number of Days with Trip Data

The most crucial indicator for the completion rate is the number of days per user during which trip data were collected. The request to respondents was to keep the tracking app installed for one week (which is much longer than the one reference day required in earlier Walloon trip behavior surveys).
The user activity in Figure 2 is measured by the period (total number of days) during which a device reported measurements (location points). A total of 94% of devices reported more than one day of activity, 83% reported more than three days, while 69% of devices reported more than seven days of mobility behavior. These findings are in line with Hong [58], reporting that many participants collected three or more days of data and some participants verified up to eight days, despite participants only being required to collect and verify two days of data. They conclude that many users are willing to continue running the app and could be incentivized to verify additional days.
Taking into the account that traditional travel behavior studies usually consider one to three days of mobility behavior to collect survey data [74], the smartphone-based data collection approach seems successful. We refer to the findings from the Walloon MOBWAL survey, a trip diary survey, organized in parallel to GPSWAL, wherein 961 respondents agreed to participate in the survey, resulting in 426 submitted trip diaries, of which only 274 were analyzed after the validation process (for reasons of incompleteness or inconsistency), resulting in a completion rate of 29%. It is also meaningful that 14 participants of GPSWAL continued registering trip data even after the closing date of the official survey campaign. Earlier research [57] has found longer survey periods to be relevant in revealing day-to-day activity pattern variability.
Ensuring reporting continuity (travel behavior covered for several consecutive days) is, of course, dependent on several factors including user motivation and discipline, which can be stimulated by the provision of different incentives during the campaign. Montini et al. [75] offered EUR 150 as incentive to participants of their campaign. This can be considered as compensation for annoyances like carrying a charger with them and the occasional flat battery or time invested in checking and correcting their data. However, they report that even in such a case, participants did not always fulfil their commitment to actively record mobility behavior. During GPSWAL, no incentive scheme was used and recruitment relied on using different communication channels to attract volunteers. A survey by Maruyama [76] illustrates that participation rate declines greatly if no reward is provided, compared to the same survey with a reward, especially for young people. However, an associated risk is that such a reward may affect the travel behavior, as participants may feel obliged to report (many) trips.
For better insight into reporting activity during the GPSWAL project, we examine the first and the last logging days for each user and eventual reporting time gaps, i.e., empty days in their active period during which no positioning data were received. A total of 51% of users had no time gaps in the reported data (continuous logging), while 49% showed gaps (non-continuous logging). Out of the devices that had gaps in their observed mobility behavior, 38% (19% of all users) had only one day of missing data, 28% (or 14% of all population) had two or three days of missing data and 33% (or 16% of all population) had more than three missing days, while 18% (8.8% of all population) had more than seven days of missing data (Figure 3). In total, 66% of the non-continuous devices (84% of all population) showed gaps smaller than three days. It should be noted that non-continuous logging means that there were no “background” logging data available for that given period, meaning that no trips were performed, that the device was turned off or out of battery, or that users switched off location services for the app during that period. This last option is standard in mobile apps (in order to protect user privacy, but also to prevent battery drain) and is inherent to any app-based data logging methodology.

3.2.2. Use of the CONNECT Survey Mode and Correction Option

Within the GPSWAL campaign, different modes of data collection were supported by the CONNECT application. In background mode, the app monitors movement activity and automatically starts logging when outdoor transportation is detected.
Two additional features are available for the user to improve the quality of the collected data. As these require manual intervention by the user, their application can be considered as an indicator of the user’s motivation:
  • The survey mode allows users to manually record their trip during travel, resulting in a higher accuracy in terms of location data as GPS logging is activated during travel;
  • Direct feedback on trip details by the user is enabled through the travel diary option in the CONNECT app, providing users with an overview of their weekly travels, where trip data can be edited by correcting errors in detected trip information (e.g., travel mode) or by adding additional information (e.g., trip purpose). In this case, edited information is stored in the database as a “trip revision” and stored next to the original data, so that modifications are traceable.
Table 2 and Table 3 give an overview of trip edits introduced by users for trip segments collected in “survey” and “background logging” app modes (data including the testing period before the official survey). “No revision” means that no revisions were made by the user and “Revised” indicates that users made edits on trip metadata. Overall, 101 out of 237 users corrected at least one trip leg (regardless of whether the initial trip data were collected in “survey” or “background” mode).
A total of 5% of the total number of trip segments were collected in “survey” mode, i.e., manually recorded by the user during travel. Of the automatically recorded trip segments collected in “background” logging mode, however, 21% were manually corrected or modified by the users. This number is high and provides proof that the combined methodology of automated tracking and user feedback on recorded trips gives added value. This value goes in line with those reported in the literature [5], where, on average, 22% of trips required additional clarifications in order to be correctly interpreted. In survey mode, the number of corrections is much lower (<2%), as the trip attributes were already manually inserted by the user.

3.3. Travel Behavior Indicators

Based on the data from the GPSWAL survey, five relevant travel behavior indicators were evaluated and compared to the results of the paper-based BELDAM survey.

3.3.1. Trip Rate

Trip rate or the number of trips made by a user during the day is a significant element of any mobility study. There is an ongoing debate in the scientific literature regarding the transferability of these values between traditional data collection findings and mobile-sensed ones. Some empirical results indicate that mobile sensing provides more detailed observation of individual mobility behavior and that traditional techniques can underestimate trip rate by up to 22% [9,37]. However, other studies have found comparable results between mobile-sensed and traditionally collected trip rates [24].
The GPSWAL data reveal an average number of 3.54 trips per day per user, consisting, on average, of a total of 4.9 trip segments (where trip segments are the parts of a trip, travelled with different modes), meaning that the average trip is constructed out of 1.38 trip segments.
Compared to the BELDAM statistics for the same area [74], where trip rate is reported to be 3.2 trips per day, the GPSWAL results reveal a value approximately 10% higher. The result corresponds with [57], wherein smartphone-based registration results in a 19.4% higher trip rate than a traditional survey, which is explained by a more complete detection of trips, not only of short walk trips but also of motorized trips. Sammer [11] even notes an underreporting of 27% in terms of the daily number of trips.
This increase cannot be attributed to the time gap between 2010 and 2017, as it is contrary to the Belgian trend found between the BELDAM and MONITOR surveys, reporting a decreasing trip rate from 2.4 trips per day for BELDAM (average for all Belgians, including non-mobiles reporting 0 trips on a survey day) to 2.2 trips per day for MONITOR. Therefore, a similar explanation with reference to the more continuous and automated trip detection of smartphone tracking seems applicable.
The average number of trips per weekday per user in the GPSWAL dataset is 3.55 while the average number of trips on weekend days is slightly lower (3.21). Similar variations can be found in other studies based on mobile sensing [37], as individuals show more mobility activity during the weekdays (work and school related), while during the weekend they tend to exhibit more stationary behavior.

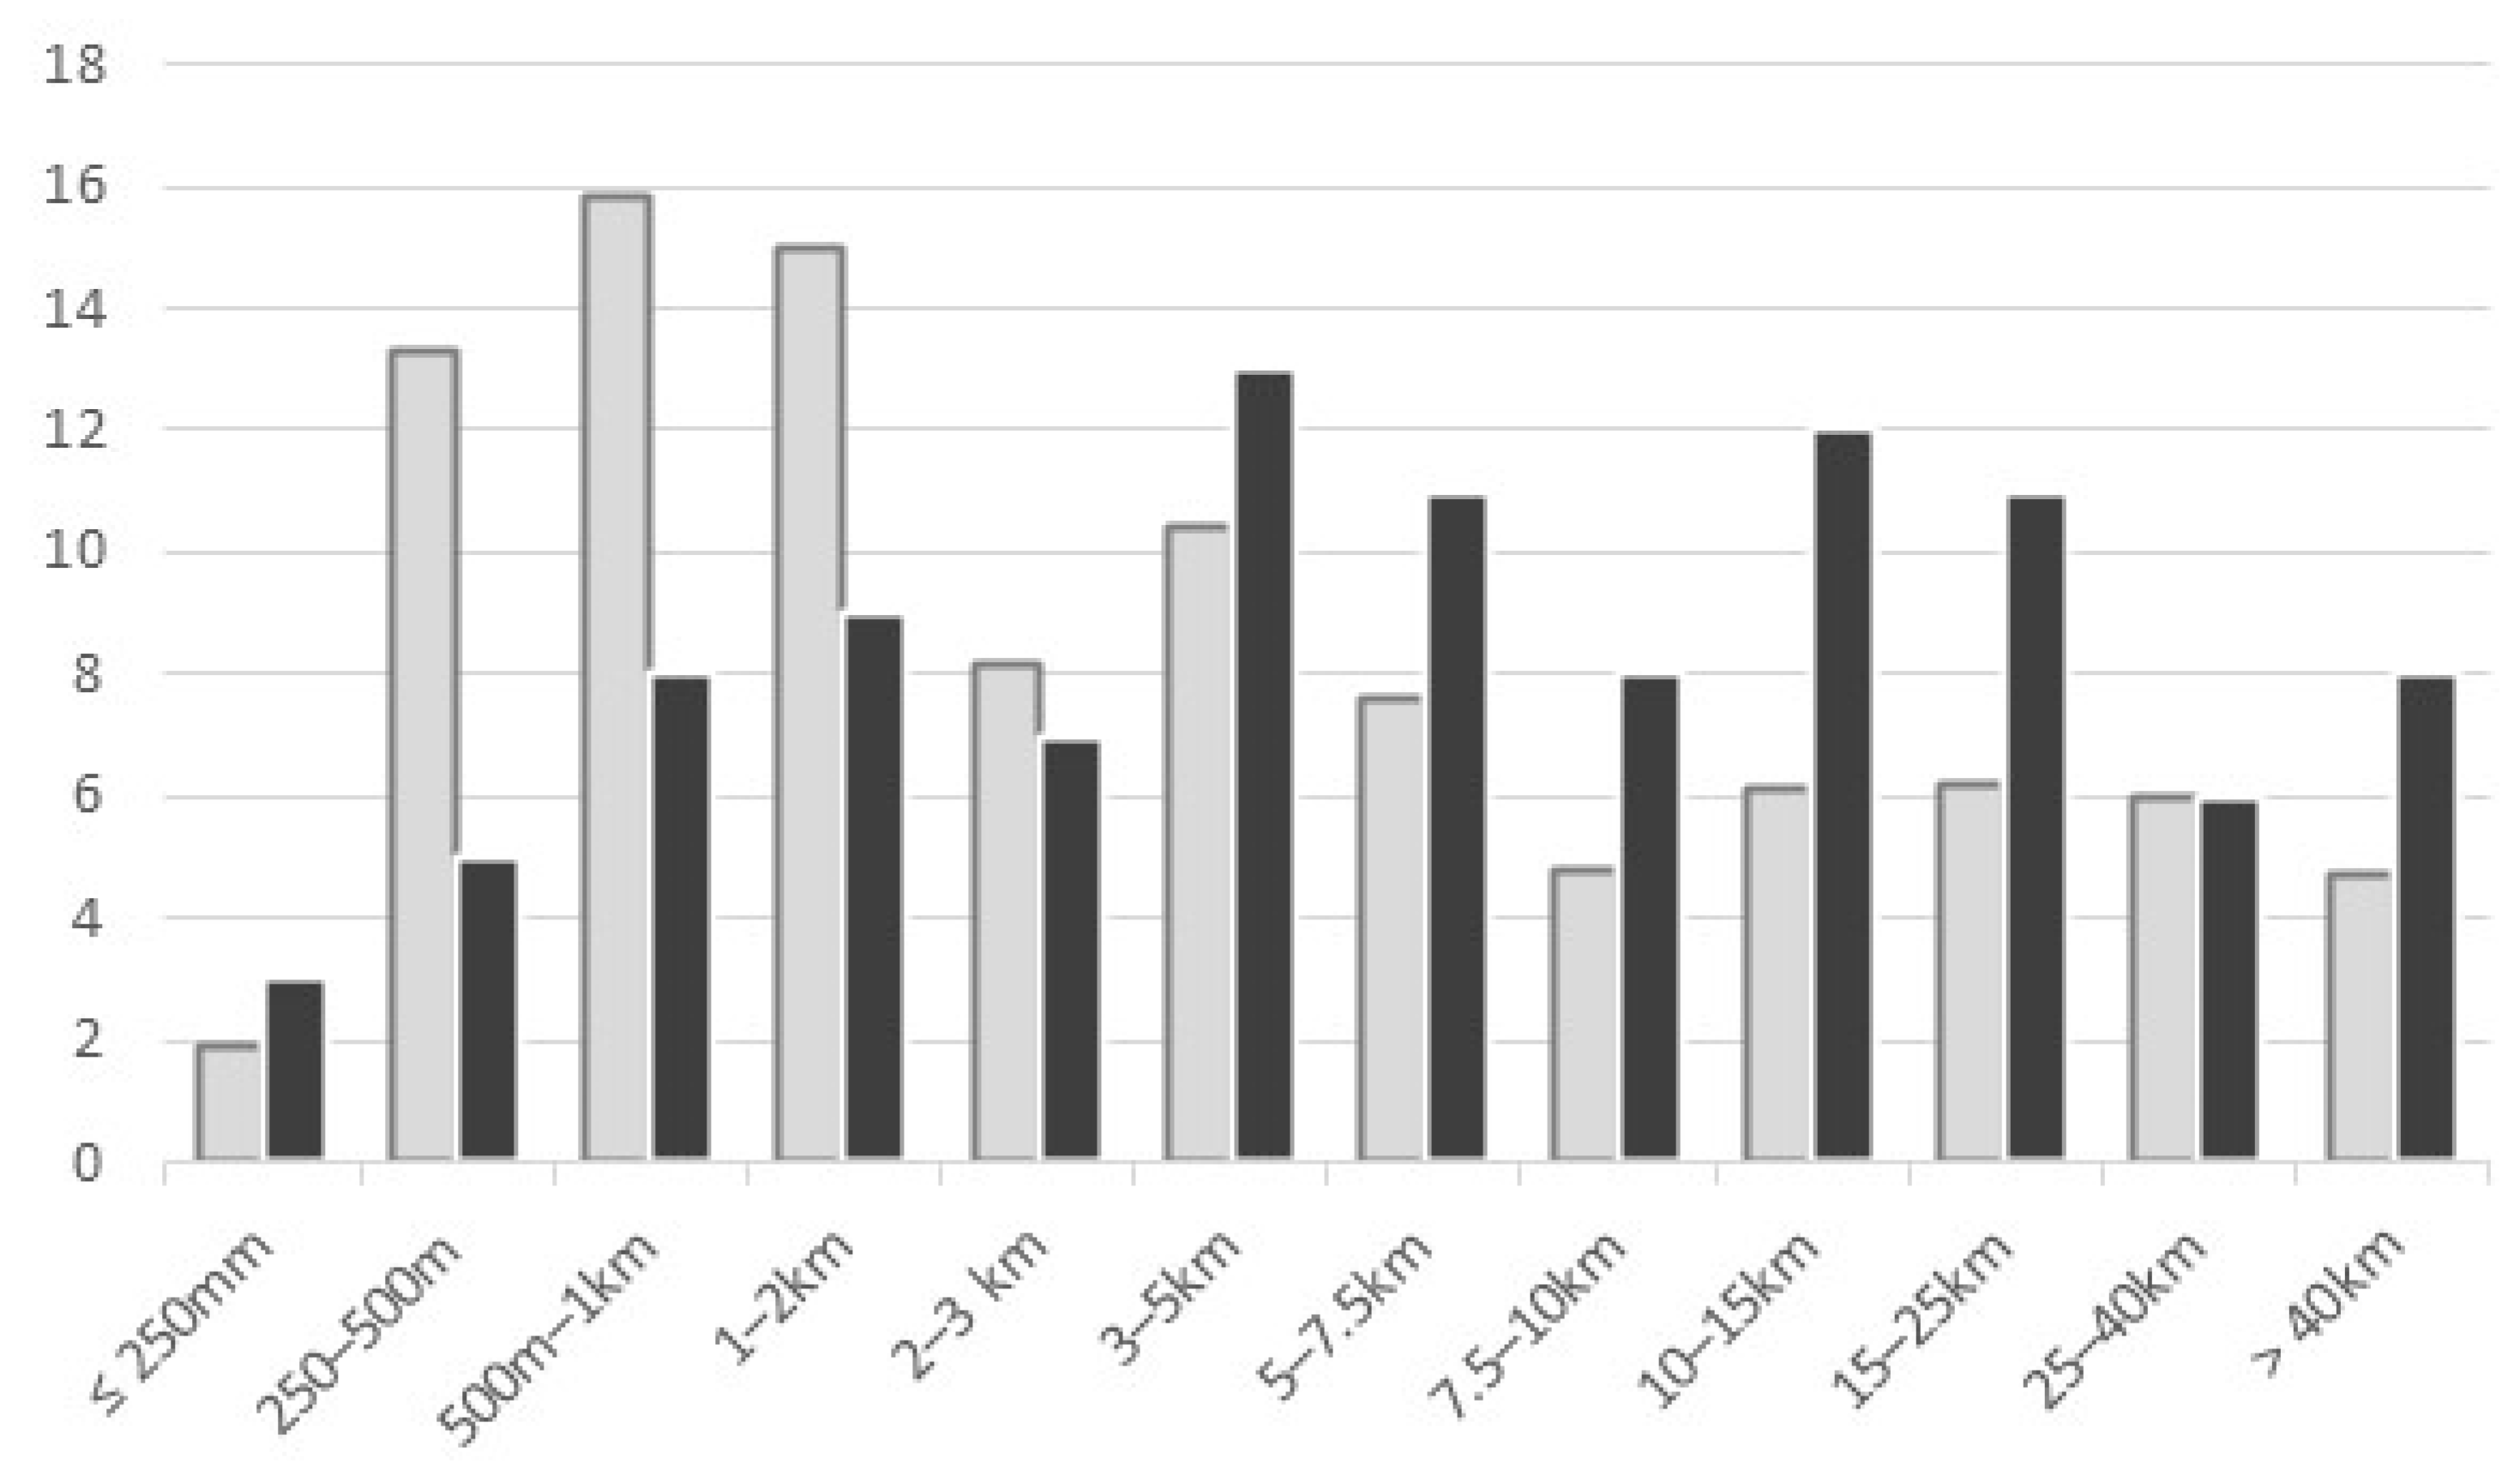
3.3.2. Trip Distances

Figure 4 shows the distribution of trip distances for trips collected during the GPSWAL project, compared to the distribution as reported in the BELDAM statistics. When comparing, a higher share of trips with very short trip distances (up to 2 km) is observed in GPSWAL compared to the BELDAM results. This higher share (around double values) of short trips in mobile-sensed studies is regularly reported [28,54,77]. This finding also goes in line with previous studies which found that respondents tended to underreport small trips in traditional travel diaries/surveys [10,11].
Again, this difference is contrary to the Belgian trend found between 2010 and 2017, reporting an increasing average trip length from 12.3 km in BELDAM to 16 km in MONITOR. Therefore, the increase in GPSWAL trip distances can be linked to the smartphone tracking technology which, on the one hand, excludes the human factor of underreporting and, on the other hand, ensures more complete trip registration, regardless of the travel mode or distance.

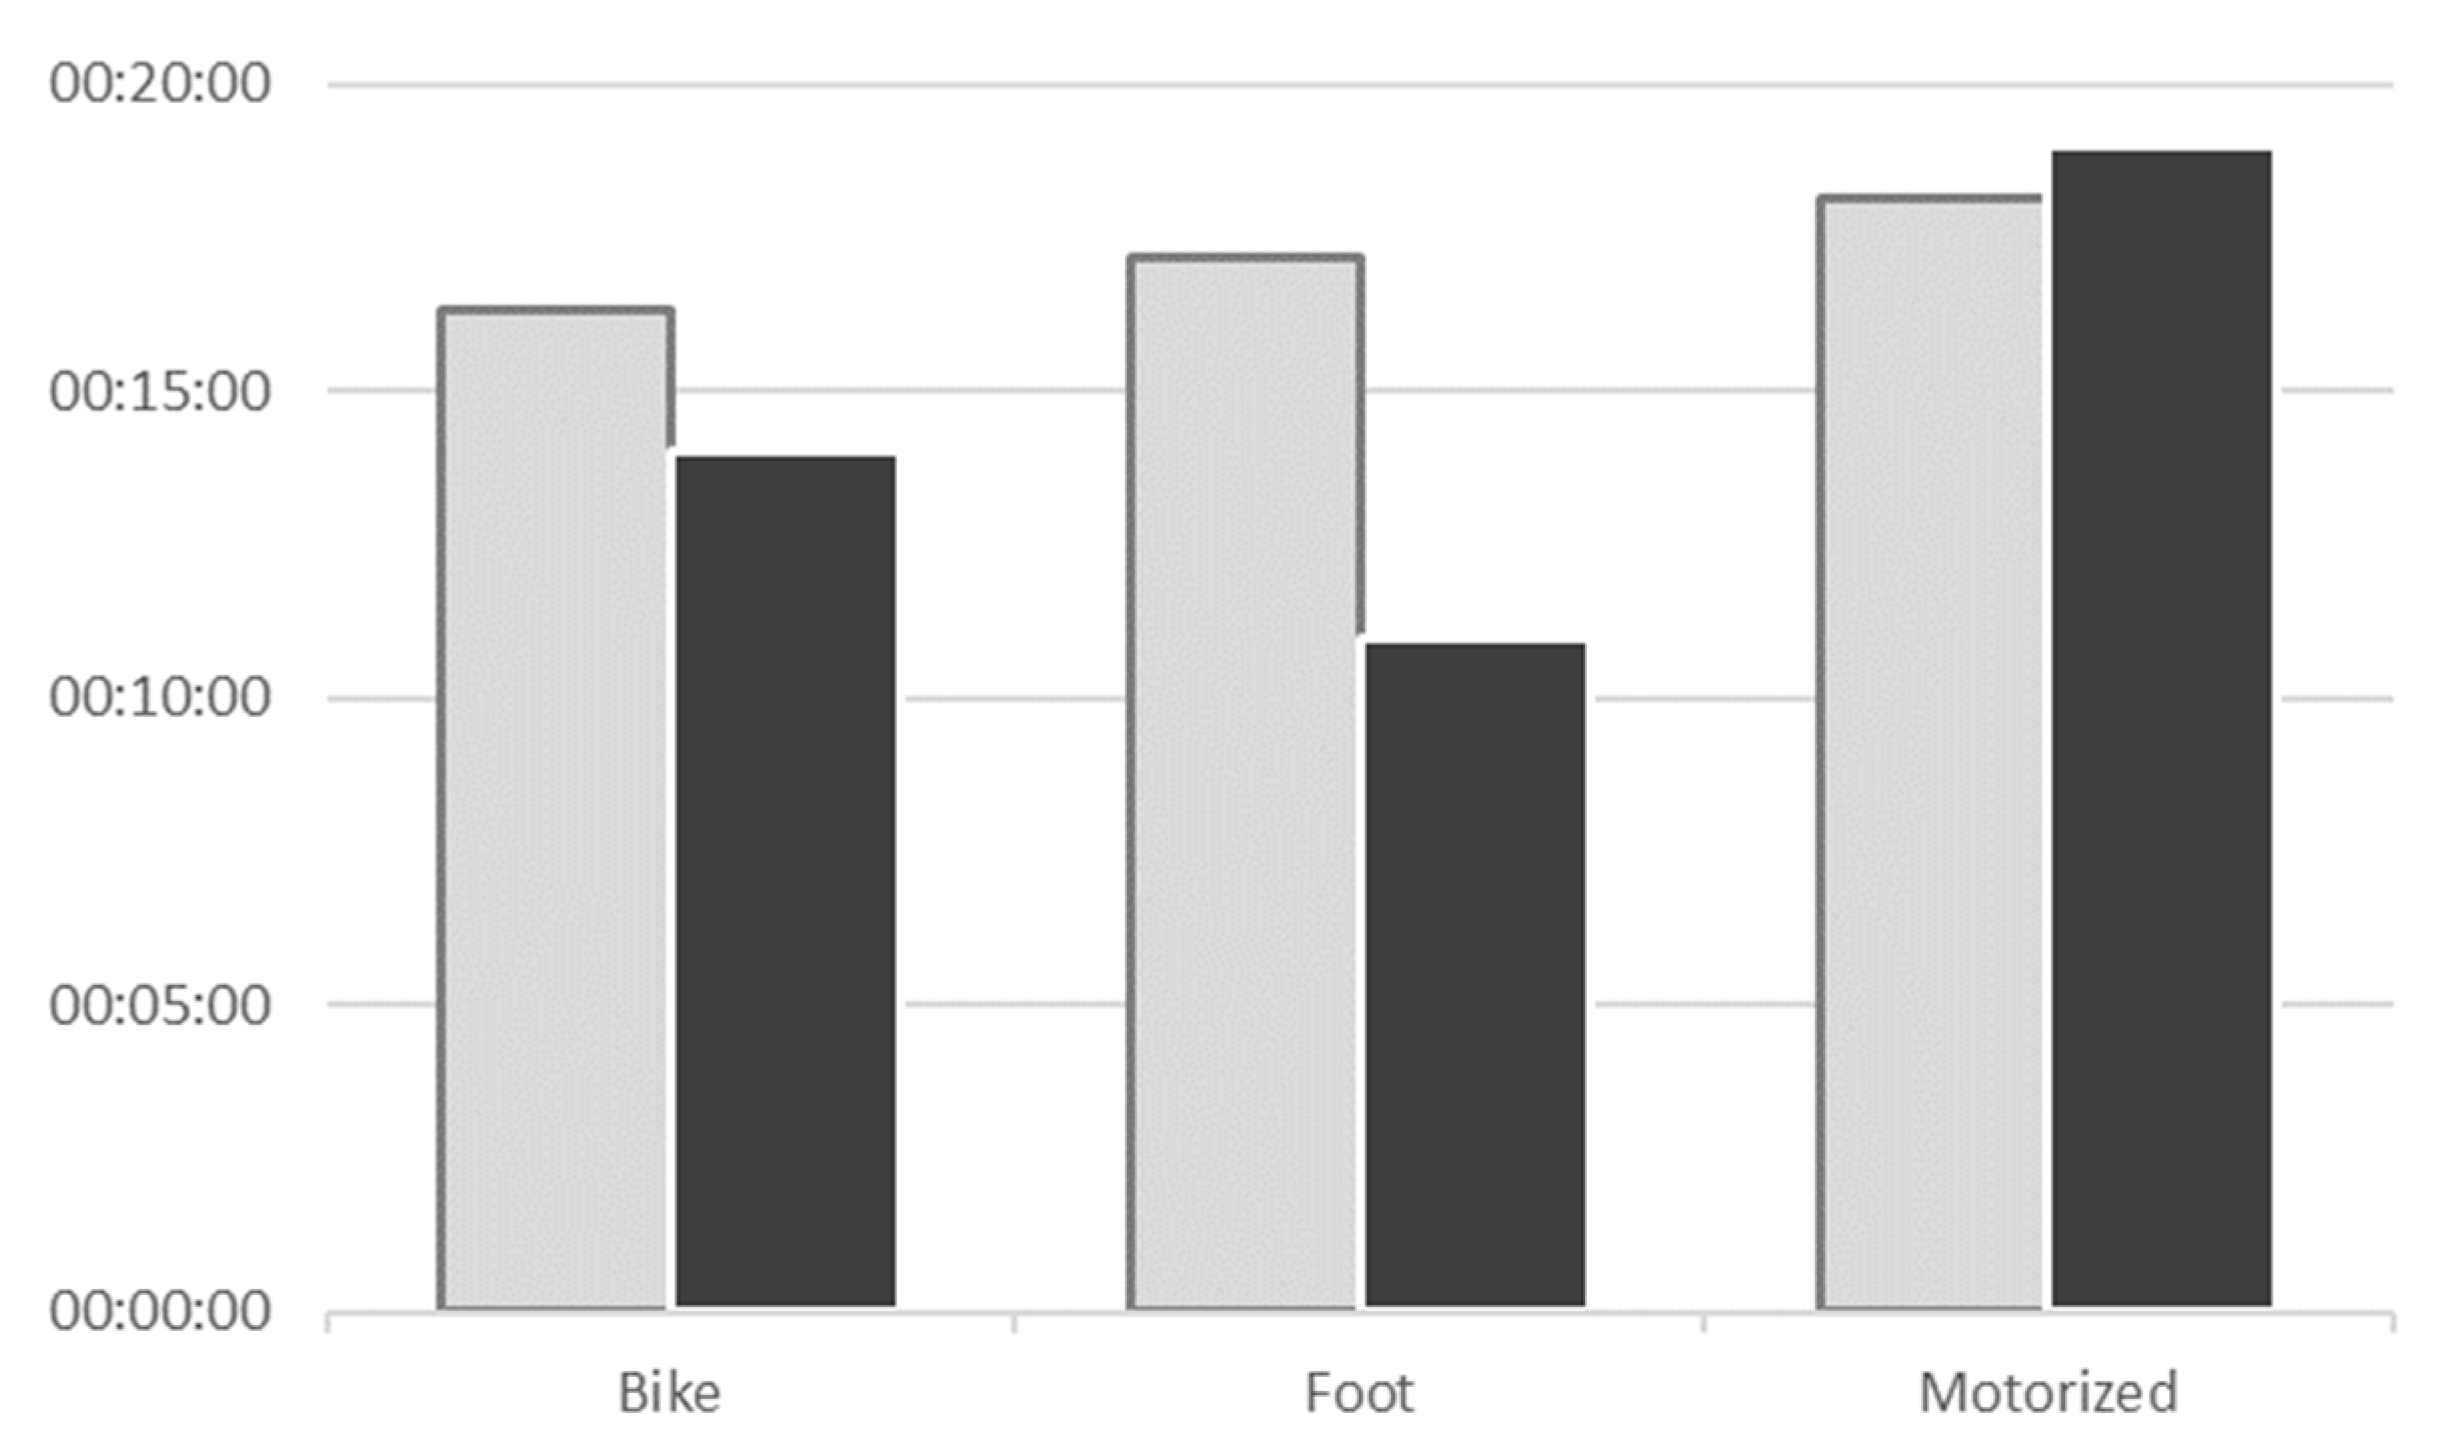
3.3.3. Trip Durations

Figure 5 shows the results for trip duration by transport mode class. Light bars represent values obtained from the GPSWAL dataset, while the dark ones indicate values from official statistics (BELDAM). It should be noted that mobile-sensed data show higher average trip durations for active transport modes (mainly walking trips and partially biking trips) than official statistics, while trip durations for motorized transport modes are comparable. These findings are in line with the Belgian trend found between 2010 and 2017, reporting an increasing average trip duration from 22 min in BELDAM to 27 min in MONITOR. It is, therefore, impossible to determine if and to which extent the use of smartphone tracking has affected the measurement of trip durations.

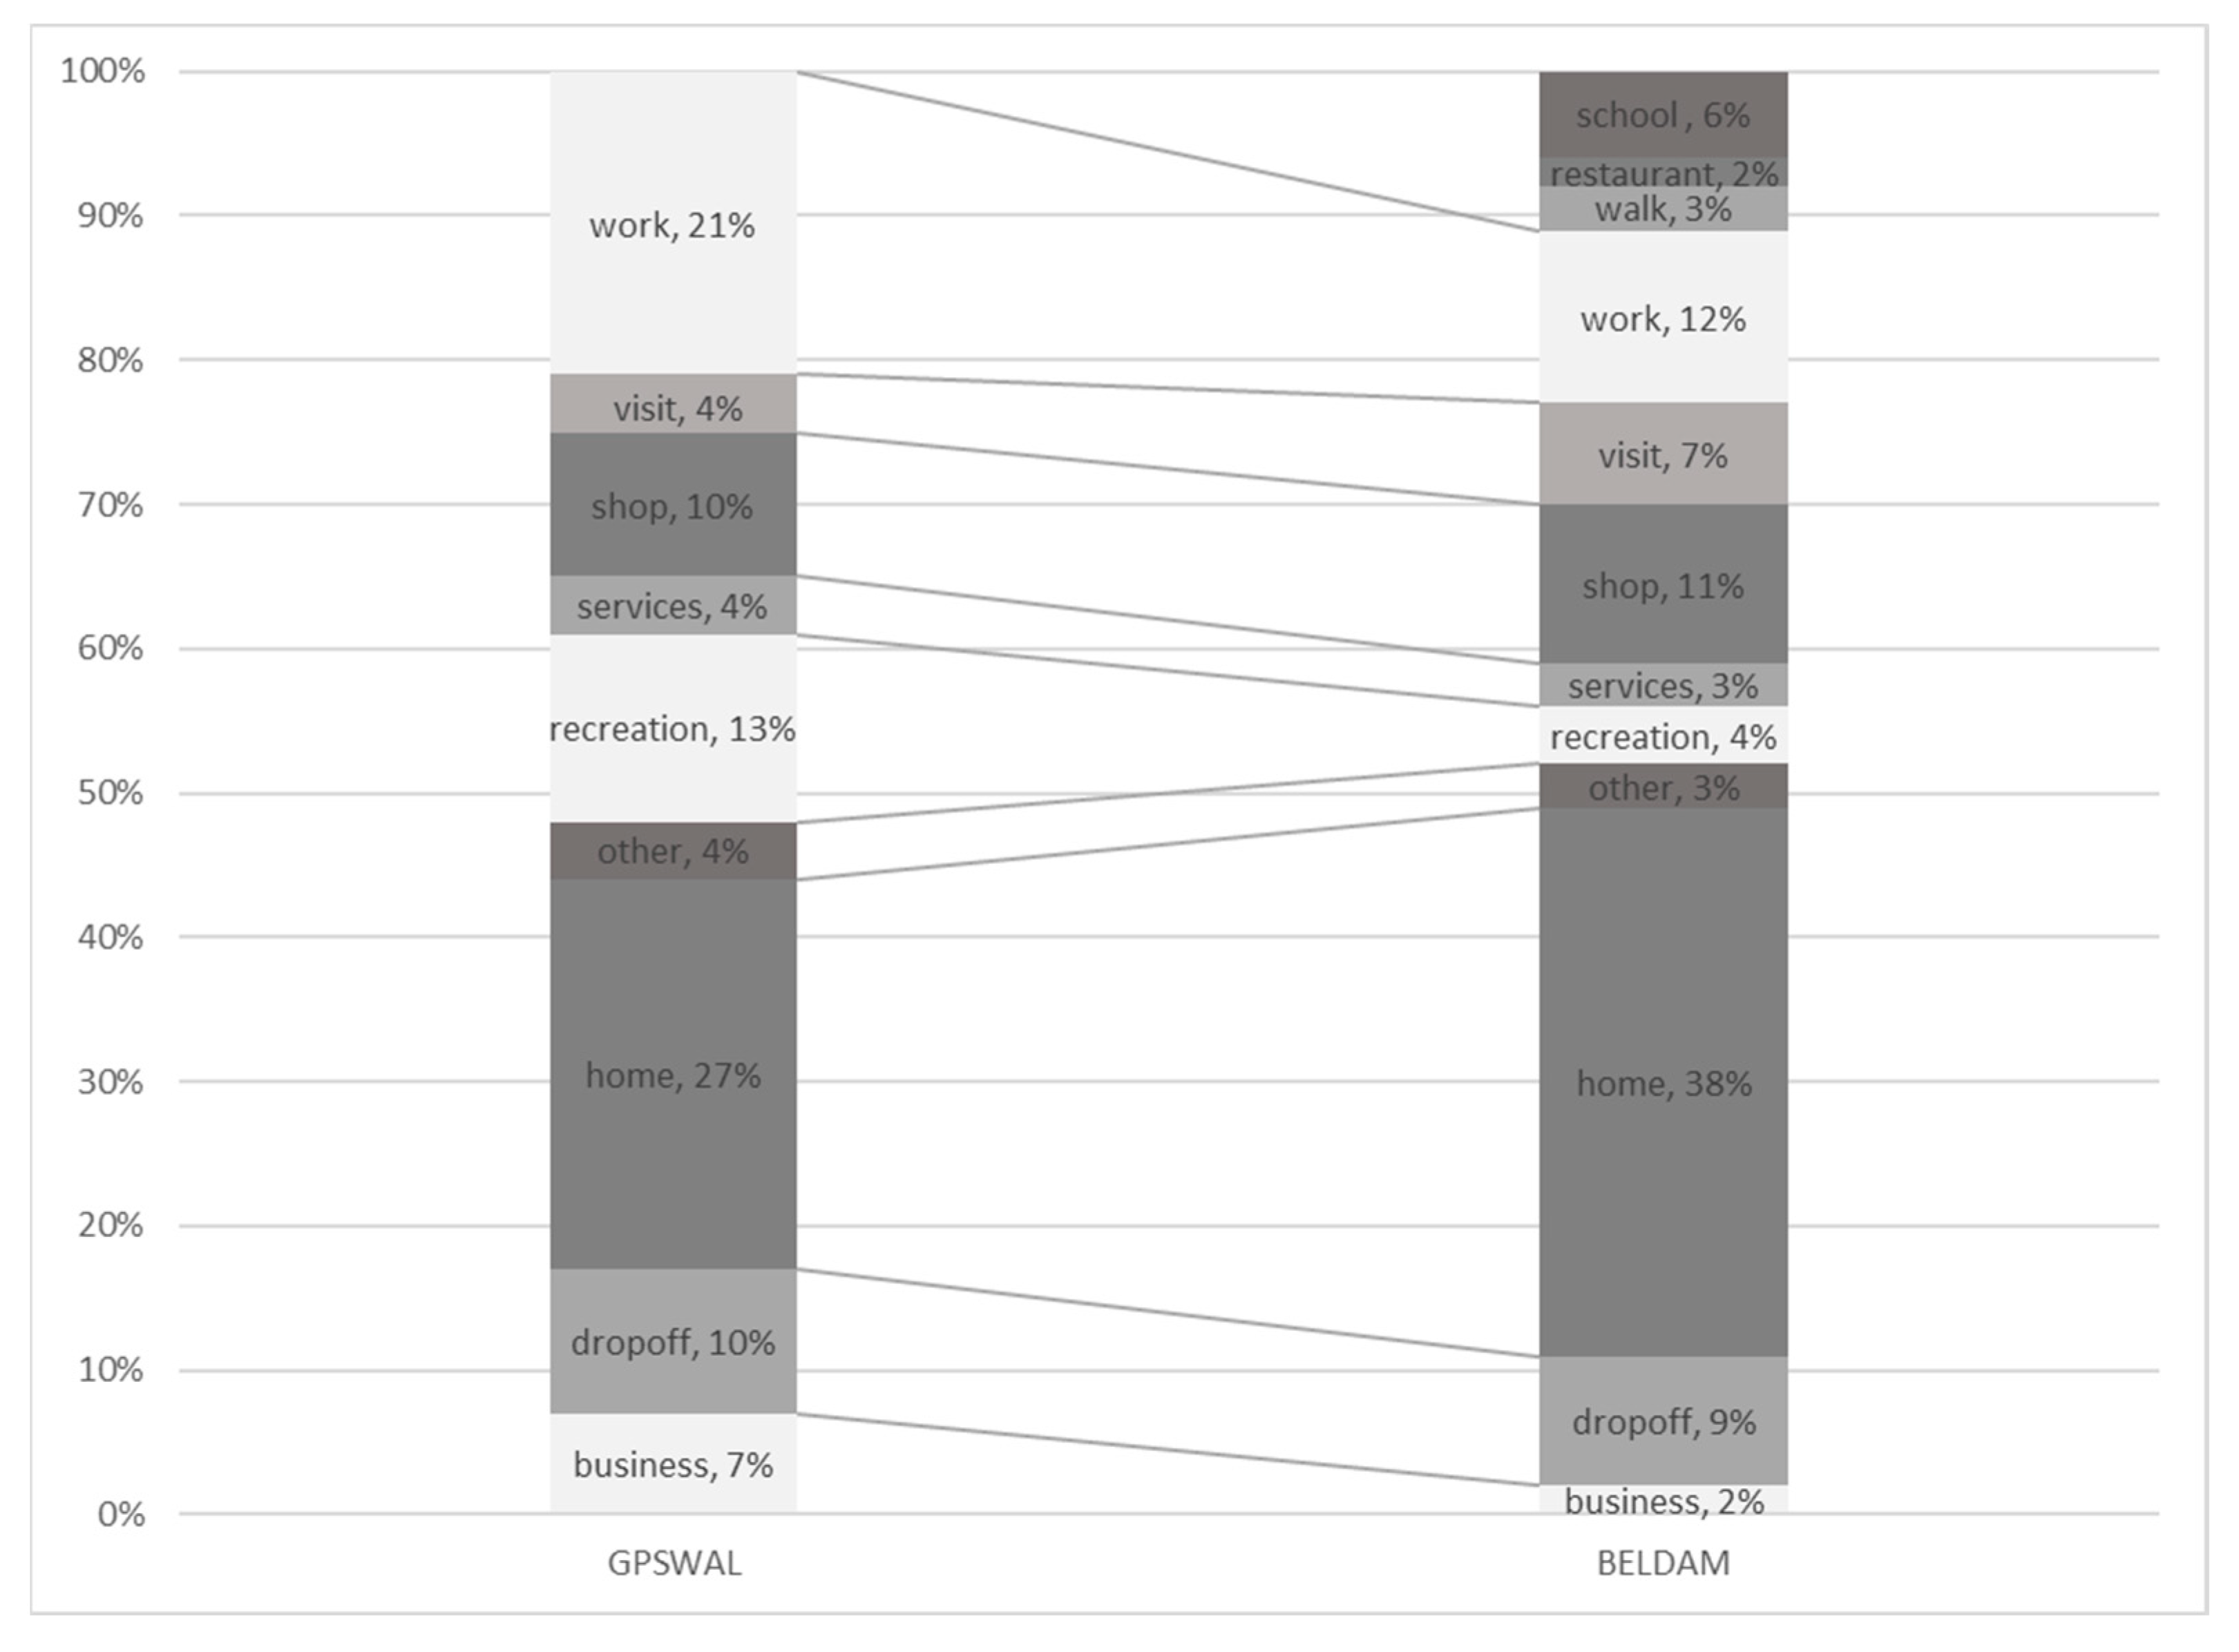
3.3.4. Trip Purposes

Figure 6 shows the reported share of trip purposes according to GPSWAL and BELDAM data. Note that in GPSWAL, the trip purpose was reported for only for 32% of trips.
Compared to the official statistics (BELDAM), a higher percentage of work-related trips is observed in GPSWAL. On the other hand, the trip purposes “school”, “restaurant” and “walk” have a total share of 11% in BELDAM. These differences may be partially due to an overrepresentation of a professional population in GPSWAL and partially by a different classification of trip purposes in both surveys. In GPSWAL, the purposes “restaurant” or “walk” belong to the category “recreation” (which, indeed, is considerably higher than in BELDAM: 13% opposed to 4%) or “other” (which amounts to 4%), while school trips would fit in the class “work”.

3.3.5. Modal Split

Modal split describes the share of different transport modes within the whole set of an individual’s trips. Modal split can be assessed at the level of trip segments (distinguishing the different transport modes used within a multimodal trip) or at the level of trips (where multimodal trips as a whole are assigned to the main transport mode during the trip, i.e., the one with which the longest distance for that trip is made or the one that was assigned to the longest trip segment within the trip).
Figure 7 compares the modal split values for the GPSWAL data at the trip segment level (left) and at the trip level (middle). Results for modal split at the trip level show a higher share of motorized transport modes, which seems aligned with the assumption that more often these are the main transport modes of a trip, while biking and walking are more often secondary parts of multimodal trips.
As BELDAM only enquires about the main transport modes of a trip, it only provides modal split values at the trip level (Figure 7 on the left). In comparison, GPSWAL reports higher shares for active transport modes (walking and biking) than BELDAM.
For biking, this may be partially due to the Belgian trend found between 2010 and 2017 reporting an increasing share of trips by bicycle in Belgium from 8% in BELDAM to 12% in MONITOR. However, this growth is expected to relate mainly to the Flemish part of Belgium which offers more favorable conditions for cycling (flatter, urbanized area), as MONITOR reports a bicycle share of 18% of all trips in Flanders, opposed to 2% in Wallonia [63]. The differences can also be related to the more complete detection of these (shorter) trips by smartphone registration, which tend to be forgotten or omitted in regular trip diaries. However, the difference may also be related to an overregistration of, for example, short displacements inside a building, which are strictly not to be considered as “trips”.

3.3.6. Comparability of the Indicators between the Surveys

The final objective of the travel behavior survey is to gain insight into (average) travel behavior, describing how and why people plan and make their trips using typical indicators referring to the number of trips and their lengths and durations or on the use of different available transport modes. An essential aspect of the feasibility of new survey methods is the impact on the derived mobility indicators and the resulting comparability against surveys based on classical methodologies. Comparability between surveys is essential both for longitudinal monitoring (comparability over consequent surveys) and for benchmarking (comparability over geographical areas).
To answer this question, we evaluated some typical indicators based on the GPSWAL data and compared them against the reference values found in the earlier BELDAM study (based on written trip diaries). We selected BELDAM as a reference in order to compare results for the same geographical area (the Walloon region of Belgium), although this selection induced a 7-year time period between both surveys. Therefore, the differences between both surveys needed to be interpreted with the behavioral trends over this period. In general terms, we found that smartphone tracking results in higher average trip rates, shorter average trip lengths and a higher share of active modes (biking, walking) than the paper survey. These effects can be related to more complete and more consistent trip registration by automatic trip detection, as data quality is determined by the technical quality of the smartphone tracking application and further data processing, regardless of users’ motivation or dedication. This avoids some of the known issues in trip diaries, like the underreporting of trips—deliberately or not—especially affecting shorter trips, which are more likely to be by bike or on foot. However, there may also be an impact of erroneous registrations, for example, oversegmentation of longer trips or registration of short displacements which are not actual trips (e.g., walking inside a building).

4. Conclusions

In this study, we have evaluated the feasibility of smartphone GPS tracking for the purpose of travel behavior studies. This technique offers some technical answers to the known limitations of the classical travel diary approach. The data quality and completeness can be determined by the smartphone application and additional data processing and, therefore, do not depend on the cooperation and motivation of respondents. As a result, more detailed and consistent data are collected, while the burden on the respondent is drastically reduced.
We have evaluated whether the innovative technique has an effect on the organization and outcomes of surveys.
As the smartphone tracking for this test used automatic background tracking, the effort demanded from the respondent was minimal after installing the smartphone application (the only requirement being to carry the smartphone during all trips, which has become a habit for many people by now). The reduced burden on participants was expected to be one of the main advantages of the new technique, compared to the more labor-intensive paper trip diaries. One would expect contacted persons to be more willing to enter the survey (increased participation rate) and to persevere until the end of the survey period (increased completion rate).
As to the participation rate, the recruitment campaign proved very cumbersome. Eventually, the initial set-up aiming at a stratified sample was relaxed to an open enrolment in order to increase the number of respondents. People’s willingness to participate in this type of (completely voluntary) survey remains low, even if the effort required is relatively lower.
However, the completion rate in the survey proved high. Although the survey period (registration for 7 days) was longer than that of most traditional travel behavior studies (typical survey period of 1 to 3 days), 69% of the participants recorded more than 7 days of mobility behavior, compared to a completion rate of 29% in a parallel 3-day paper survey. Moreover, automatic trip detection ensured consistent data quality throughout the survey period, whereas classical survey methods typically tend to cause fatigue towards the end of the survey period.
Finally, we observed that automatic and continuous trip registration affects the resulting travel behavior indicators, in terms of higher average trip rates, shorter average trip lengths and a higher share of active transportation modes (biking, walking).
Even though this is the result of more complete and more consistent trip registration, the impact that the selected methodology has on the survey outcomes raises concerns on the comparability between surveys based on different data collection methods.
Based on these findings, some important advice can be formulated:
-
It is important to be aware of the challenge of recruiting participants. The reduced burden on the user does not result in the anticipated increased willingness to participate. Dedicated communication or even campaigning is required to attract and motivate interested candidates. As described in [73], “it was also learned that deploying a smartphone application as a tool for collecting travel data required more support than expected. It is similar to launching a product, which should involve a multidisciplinary team, not only designers of the questionnaire and support system, but also for example staff making the interface more user-friendly”;
-
Once participants had entered the survey, however, we observed a higher willingness to complete the survey. Whereas in MOBWAL, only 29% of the participants completed the requested 3-day survey period, in GPSWAL, 83% registered at least 3 survey days and 69% even registered 7 or more days. The reduced burden leads to a more efficient execution of the survey and offers opportunities to perform longer survey periods;
-
As the methodology affects indicators’ values based on the survey, it is essential to document in detail the full process of data collection, data processing and data analysis, delivering reproducible results. These aspects need to be taken into account when describing or comparing results from different studies. Also, Prelipcean [78] and Bonnel [79] raise the issue of a lack of transparency and standardization when using (semi-)automated travel diary collection systems and the inability to understand and compare results and performances between systems or methods;
-
In order to account for these methodological differences, a combined approach of both written trip diaries and smartphone tracking is advised such that each method can complement the shortcomings of the other. Smartphone tracking has strong assets in terms of quality (exact locations, distance, duration, etc.) and period of the trip registrations but has its limitations in terms of trip characteristics (trip purpose or transport mode need to be inferred from sensor data). These aspects are better covered via trip diaries which, in return, are more laborious for participants. As applied in the GPSWAL test, the annotation of trip characteristics can also be integrated in smartphone apps but this increases the burden on users. The combined approach can contribute to improved insight on the exact methodological impact. Bradley [41] suggests that this combined approach can be used to transition gradually from diary-based to (more) smartphone-based methods across years.
With this research, we want to highlight the importance of comparing surveys conducted by different methods, not only on a technical level, but also from the viewpoint of the practical set-up and execution of the travel survey campaign. Existing research is limited and often based on comparing results between non-concurrent surveys, as is also the case here when comparing results from BELDAM and GPSWAL surveys. Ideally, results should be compared between integrated surveys covering the same period, area, sampling, etc., which would constitute a step forward to the described work plan but requires a large set-up in terms of effect, cost, communication, etc. With our research, however, we want to highlight that technical evolution with more detailed, more complete and less laborious data collection does not solve all issues (e.g., recruitment of participants) and even introduces new challenges (e.g., comparability and standardization between surveys).

Author Contributions

Conceptualization, Dominique Gillis, Angel J. Lopez and Sidharta Gautama; validation, Dominique Gillis, Angel J. Lopez and Sidharta Gautama; formal analysis, Angel J. Lopez; investigation, Dominique Gillis and Angel J. Lopez; data curation, Angel J. Lopez; writing—original draft preparation, Dominique Gillis and Angel J. Lopez; writing—review and editing, Sidharta Gautama; supervision, Sidharta Gautama. All authors have read and agreed to the published version of the manuscript.

Funding

This research was funded by IWEPS (Institut Wallon de l’évaluation, de la prospective et de la statistique) under the project GPSWAL. The APC was funded by Ghent University.

Data Availability Statement

The data presented in this study are not publicly available due to privacy restrictions.

Acknowledgments

The authors gratefully acknowledge IWEPS (Institut Wallon de l’évaluation, de la prospective et de la statistique) for their financing and cooperation in the GPSWAL project and for access to the smartphone data collected during the campaign.

Conflicts of Interest

The authors declare no conflict of interest.

References

  1. Ettema, D.; Timmermans, H.; Van Veghel, L. Effects of Data Collection Methods in Travel and Activity Research; European Institute of Retailing and Service Studies (EIRASS): Eindhoven, The Netherlands, 1996. [Google Scholar]
  2. Stopher, P.R.; Greaves, S.P. Household travel surveys: Where are we going? Transp. Res. Part A Policy Pract. 2007, 41, 367–381. [Google Scholar] [CrossRef]
  3. Wolf, J.; Hallmark, S.; Oliveira, M.; Guensler, R.; Sarasua, W. Accuracy issues with route choice data collection by using global positioning system. Transp. Transp. Res. Rec. 1999, 1660, 66–74. [Google Scholar] [CrossRef]
  4. Clifton, K.; Muhs, C. Capturing and Representing Multimodal Trips in Travel Surveys. Transp. Res. Rec. J. Transp. Res. Board 2012, 2285, 74–83. [Google Scholar] [CrossRef]
  5. Wolf, J.; Guensler, R.; Bachman, W. Elimination of the travel diary: Experiment to derive trip purpose from Global Positioning System travel data. Transp. Res. Rec. 2001, 1768, 125–134. [Google Scholar] [CrossRef] [Green Version]
  6. Hato, E.; Shinji, I.; Mitani, T. Development of MoALs (Mobile Activity Loggers supported by GPSphones) for travel behavior analysis. In Proceedings of the 85th Annual Meeting of the Transportation Research Board, Washington, DC, USA, 22–26 January 2006. [Google Scholar]
  7. Arentze, T.; Dijst, M.; Dugundji, E.; Joh, C.H.; Kapoen, L.; Krygsman, S.; Maat, K.; Timmermans, H. New activity diary format: Design and limited empirical evidence. Transp. Res. Rec. 2001, 1768, 79–88. [Google Scholar] [CrossRef]
  8. Forrest, T.; Pearson, D. Comparison of Trip Determination Methods in Household Travel Surveys Enhanced by a Global Positioning System. Transp. Res. Rec. 2005, 1917, 63–71. [Google Scholar] [CrossRef]
  9. Wolf, J.; Oliveira, M.; Thompson, M. Impact of Underreporting on Mileage and Travel Time Estimates: Results from Global Positioning System-Enhanced Household Travel Survey. Transp. Res. Rec. 2003, 1854, 189–198. [Google Scholar] [CrossRef]
  10. Itoh, S.; Hato, E. Combined estimation of activity generation models incorporating unobserved small trips using probe person data. J. East. Asia Soc. Transp. Stud. 2013, 10, 525–537. [Google Scholar]
  11. Sammer, G.; Gruber, C.; Roeschel, G.; Tomschy, R.; Herry, M. The dilemma of systematic underreporting of travel behavior when conducting travel diary surveys—A meta-analysis and methodological considerations to solve the problem. Transp. Res. Procedia 2018, 32, 649–658. [Google Scholar] [CrossRef]
  12. De Abreu E Silva, J.; Davis, M. Workshop synthesis: Respondent/survey interaction in a world of web and smartphone apps. Transp. Res. Procedia 2015, 11, 289–296. [Google Scholar] [CrossRef]
  13. Bonnel, P.; Bayart, C.; Smith, B. Workshop synthesis: Comparing and combining survey modes. Transp. Res. Procedia 2015, 11, 108–117. [Google Scholar] [CrossRef]
  14. Schönfelder, S.; Axhausen, K.W.; Antille, N.; Bierlaire, M. Exploring the potentials of automatically collected GPS data for travel behavior analysis: A Swedish data source. In GI-Technologien für Verkehr und Logistik; No. 13; Möltgen, J., Wytzisk, E., Eds.; Universität Munster: Munster, Germany, 2002; pp. 155–179. [Google Scholar]
  15. Schlich, R.; Axhausen, K.W. Habitual travel behaviour: Evidence from a six-week travel diary. Transportation 2003, 30, 13–36. [Google Scholar] [CrossRef]
  16. Steer, D.G. The Use of GPS to Improve Travel Data; Study Report for the DTLR New Horizons Programme; London Department for Transport: London, UK, 2003. [Google Scholar]
  17. Ohmori, N.; Nakazato, M.; Harata, N. Gps mobile phone-based activity diary survey. Proc. East. Asia Soc. Transp. Stud. 2005, 5, 1104–1115. [Google Scholar]
  18. Tsui, A. Shalaby Enhanced system for link and mode identification for personal travel surveys based on global positioning systems. Transp. Res. Rec. J. Transp. Res. Board 2006, 1972, 38–45. [Google Scholar] [CrossRef]
  19. Stopher, P.R.; Collins, A. Conducting a GPS prompted recall survey over the internet. In Proceedings of the Transportation Research Board 84th Annual Meeting, Washington, DC, USA, 9–13 January 2005. [Google Scholar]
  20. Asakura, Y.; Hato, E. Tracking survey for individual travel behaviour using mobile communication instruments. Transpl. Res. Part C Emerg. Technol. 2004, 12, 273–291. [Google Scholar] [CrossRef]
  21. Axhausen, K.W.; Schönfelder, S.; Wolf, J.; Oliveira, M.; Samaga, U. 80 weeks of GPS-traces: Approaches to enriching the trip information. Transp. Res. Rec. 2003, 178, 46–56. [Google Scholar]
  22. Du, J.; Aultman-Hall, L. Increasing the accuracy of trip rate information from passive multi-day GPS travel datasets: Automatic trip end identification issues. Transp. Res. Part A Policy Pract. 2007, 41, 220–232. [Google Scholar] [CrossRef]
  23. Stopher, P.R.; Clifford, E.; Zhang, J. Deducing Mode and Purpose from GPS Data; Working paper; Institute of Transport and Logistics Studies, University of Sydney: Camperdown, Australia, 2008. [Google Scholar]
  24. Bohte, W.; Maat, K. Deriving and validating trip purposes and travel modes for multi-day GPS-based travel surveys: A large-scale application in the Netherlands. Transp. Res. Part C Emerg. Technol. 2009, 17, 285–297. [Google Scholar] [CrossRef]
  25. Gong, H.; Chen, C.; Bialostozky, E.; Lawson, C.T. A GPS/GIS method for travel mode detection in New York City. Comput. Environ. Urban Syst. 2012, 36, 131–139. [Google Scholar] [CrossRef]
  26. Hato, E. Development of behavioral context addressable loggers in the shell for travel-activity analysis. Transp. Res. Part C Emerg. Technol. 2010, 18, 55–67. [Google Scholar] [CrossRef]
  27. Primerano, F.; Taylor, M.A.P.; Pitaksringkarn, L.; Tisato, P. Defining and understanding trip chaining behaviour. Transportation 2008, 35, 55–72. [Google Scholar] [CrossRef]
  28. Chen, C.; Gong, H.; Lawson, C.; Bialostozky, E. Evaluating the feasibility of a passive travel survey collection in a complex urban environment: Lessons learned from the New York City case study. Transp. Res. Part A Policy Pract. 2010, 44, 830–840. [Google Scholar] [CrossRef]
  29. Gadziński, J. Perspectives of the use of smartphones in travel behaviour studies: Findings from a literature review and a pilot study. Transp. Res. Part C Emerg. Technol. 2018, 88, 74–86. [Google Scholar] [CrossRef]
  30. Vlassenroot, S.; Gillis, D.; Bellens, R.; Gautama, S. The use of smartphone applications in the collection of travel behaviour data. Int. J. Intell. Transp. Syst. Res. 2015, 13, 17–27. [Google Scholar] [CrossRef]
  31. Nitsche, P.; Widhalm, P.; Breuss, S.; Maurer, P. A Strategy on How to Utilize Smartphones for Automatically Reconstructing Trips in Travel Surveys. Procedia-Soc. Behav. Sci. 2012, 48, 1033–1046. [Google Scholar] [CrossRef] [Green Version]
  32. Auld, J.; Williams, C.; Mohammadian, A.; Nelson, P. An Automated GPS-Based Prompted Recall Survey with Learning Algorithms. Transp. Lett. Int. J. Transp. Res. 2009, 1, 59–79. [Google Scholar] [CrossRef]
  33. Zhou, J.; Golledge, R. Real-time tracking of activity scheduling/schedule execution within a unified data collection framework. Transp. Res. A 2007, 41, 444–463. [Google Scholar] [CrossRef] [Green Version]
  34. Lawson, C.T.; Krans, E.; Rentz, E.G.; Lynch, J. Emerging trends in household travel survey programs. Soc. Sci. Humanit. Open 2023, 7, 100466. [Google Scholar] [CrossRef]
  35. Harding, C.; Imani, A.F.; Srikukenthiran, S.; Miller, E.J.; Habib, K.N. Are we there yet? Assessing smartphone apps as full-fledged tools for activity-travel surveys. Transportation 2021, 48, 2433–2460. [Google Scholar] [CrossRef]
  36. Feng, T.; Timmermans, H.J.P. Transportation mode recognition using GPS and accelerometer data. Transp. Res. Part C Emerg. Technol. 2013, 37, 118–130. [Google Scholar] [CrossRef]
  37. Geurs, K.T.; Thomas, T.; Bijlsma, M.; Douhou, S. Automatic trip and mode detection with move smarter: First results from the Dutch Mobile Mobility Panel. Transp. Res. Procedia 2015, 11, 247–262. [Google Scholar] [CrossRef]
  38. Harding, C. From Smartphone Apps to In-Person Data Collection: Modern and Cost-Effective Multimodal Travel Data Collection for Evidence-Based Planning; University of Toronto: Toronto, ON, Canada, 2019; p. 554. [Google Scholar]
  39. Van Gheluwe, C.; Lopez, A.J.; Gautama, S. Error Sources in the Analysis of Crowdsourced Spatial Tracking Data. In Proceedings of the 2019 IEEE International Conference on Pervasive Computing and Communications Workshops (PerCom Workshops), Kyoto, Japan, 11–15 March; 2019; pp. 183–188. [Google Scholar] [CrossRef] [Green Version]
  40. Yue, Y.; Lan, T.; Yeh, A.G.O.; Li, Q.Q. Zooming into individuals to understand the collective: A review of trajectory-based travel behaviour studies. Travel Behav. Soc. 2014, 1, 69–78. [Google Scholar] [CrossRef]
  41. Bradley, M.; Greene, E.; Spitz, G.; Coogan, M.; McGuckin, N. The millennial question: Changes in travel behaviour or changes in survey behaviour? Transp. Res. Procedia 2018, 32, 291–300. [Google Scholar] [CrossRef]
  42. Shen, L.; Stopher, P.R. Review of GPS travel survey and GPS data-processing methods. Transp. Rev. 2014, 34, 316–334. [Google Scholar] [CrossRef]
  43. Prelipcean, A.C.; Yamamoto, T. Workshop Synthesis: New developments in travel diary collection systems based on smartphones and GPS receivers. Transp. Res. Procedia 2018, 32, 119–125. [Google Scholar] [CrossRef]
  44. Joseph, L.; Neven, A.; Martens, K.; Kweka, O.; Wets, G.; Janssens, D. Measuring individuals’ travel behaviour by use of a GPS-based smartphone application in Dar es Salaam, Tanzania. J. Transp. Geogr. 2020, 88, 102477. [Google Scholar] [CrossRef]
  45. Okmi, M.; Por, L.Y.; Ang, T.F.; Ku, C.S. Mobile Phone Data: A Survey of Techniques, Features, and Applications. Sensors 2023, 23, 908. [Google Scholar] [CrossRef]
  46. Broach, J.; Dill, J.; Gliebe, J. Where do cyclists ride? A route choice model developed with revealed preference GPS data. Transp. Res. Part A Policy Pract. 2012, 46, 1730–1740. [Google Scholar] [CrossRef]
  47. Lopez, A.J.; Astegiano, P.; Gautama, S.; Ochoa, D.; Tampère, C.M.J.; Beckx, C. Unveiling e-bike potential for commuting trips from GPS traces. ISPRS Int. J. Geo-Inf. 2017, 6, 190. [Google Scholar] [CrossRef] [Green Version]
  48. Gillis, D.; Gautama, S.; van Gheluwe, C.; Semanjski, I.; Lopez, A.; Lauwers, D. Measuring delays for bicycles at signalized intersections using smartphone GPS tracking data. ISPRS Int. J. Geo-Inf. 2020, 9, 174. [Google Scholar] [CrossRef] [Green Version]
  49. Poliziani, C.; Rupi, F.; Schweizer, J.; Saracco, M.; Capuano, D. Cyclist’s waiting time estimation at intersections, a case study with GPS traces from Bologna. Transp. Res. Procedia 2022, 62, 325–332. [Google Scholar] [CrossRef]
  50. Klar, B. Understanding Changes to Human Mobility Patterns in Ontario, Canada during the COVID-19 Pandemic. Master’s Thesis, The University of Western Ontario, London, ON, Canada, 2022. [Google Scholar]
  51. Ciriaco, T.G.M.; Pitombo, C.S.; Assirati, L. Travel behavior and activity resilience regarding the COVID-19 pandemic in Brazil: An approach based on smartphone panel data. Case Stud. Transp. Policy 2022, 12, 100998. [Google Scholar] [CrossRef]
  52. Richard, O.; Rabaud, M. French household travel survey: The next generation. Transp. Res. Procedia 2018, 32, 383–393. [Google Scholar] [CrossRef]
  53. Nour, A.; Hellinga, B.; Casello, J. Classification of automobile and transit trips from Smartphone data: Enhancing accuracy using spatial statistics and GIS. J. Transp. Geogr. 2016, 51, 36–44. [Google Scholar] [CrossRef]
  54. Lee, J.S.; Zegras, P.C.; Zhao, F.; Kim, D.; Kang, J. Testing the Reliability of a Smartphone-Based Travel Survey: An Experiment in Seoul. J. Korea Inst. Intell. Transp. Syst. 2016, 15, 50–62. [Google Scholar] [CrossRef]
  55. Eftekhari, H.R.; Ghatee, M. An inference engine for smartphones to preprocess data and detect stationary and transportation modes. Transp. Res. Part C Emerg. Technol. 2016, 69, 313–327. [Google Scholar] [CrossRef]
  56. Sato, Y.; Maruyama, T. Examining difference between paper- and web-based self-reported departure/arrival time using smartphone-based survey. Transp. Res. Procedia 2020, 48, 1390–1400. [Google Scholar] [CrossRef]
  57. Nahmias-Biran, B.; Han, Y.; Bekhor, S.; Zhao, F.; Zegras, C.; Ben-Akiva, M. Enriching Activity-Based Models using Smartphone-Based Travel Surveys. Transp. Res. Rec. J. Transp. Res. Board 2018, 2672, 280–291. [Google Scholar] [CrossRef]
  58. Hong, S.; Zhao, F.; Livshits, V.; Gershenfeld, S.; Santos, J.; Ben-Akiva, M. Insights on data quality from a large-scale application of smartphone-based travel survey technology in the Phoenix metropolitan area, Arizona, USA. Transp. Res. Part A Policy Pract. 2021, 154, 413–429. [Google Scholar] [CrossRef]
  59. Roddis, S.; Winter, S.; Zhao, F.; Kutadinata, R. Respondent preferences in travel survey design: An initial comparison of narrative, structured and technology-based travel survey instruments. Travel Behav. Soc. 2019, 16, 1–12. [Google Scholar] [CrossRef]
  60. Assemi, B.; Jafarzadeh, H.; Mesbah, M.; Hickman, M. Participants’ perceptions of smartphone travel surveys. Transp. Res. Part F Traffic Psychol. Behav. 2018, 54, 338–348. [Google Scholar] [CrossRef] [Green Version]
  61. Hubert, J.; Toint, P. La Mobilité Quotidienne des Belges; Groupe de Recherche sur les Transports, FUNDP University: Namur, Belgium, 2003. [Google Scholar]
  62. Cornelis, E. La Mobilité en Belgique en 2010: Résultats de L’enquête BELDAM; SPF Mobilité & Transports: Bruxelles, Brussels, 2012. [Google Scholar]
  63. Service Public Fédéral Mobilité et Transports. Enquête MONITOR sur la Mobilité des Belges; Bruxelles Mobilité: Bruxelles, Belgium, 2017. [Google Scholar]
  64. Lopez, A.J.; Semanjski, I.; Gautama, S.; Ochoa, D. Assessment of Smartphone Positioning Data Quality in the Scope of Citizen Science Contributions. Mob. Inf. Syst. 2017, 2017. [Google Scholar] [CrossRef] [Green Version]
  65. Aguirre, A.J.L. Processing Crowdsourced Data for the Analysis of Mobility Behaviour; Ghent Universtiy: Ghent, Belgium, 2018. [Google Scholar]
  66. CBS Onderzoek Verplaatsingen in Nederland 2017—Onderzoeksbeschrijving. 2018. Available online: https://easy.dans.knaw.nl/ui/datasets/id/easy-dataset:61643 (accessed on 1 March 2023).
  67. Chlond, B.; Streit, T.; Abler, G.; Vortisch, P. Balancing innovation and continuity-Experiences with survey design adaptations of the German mobility panel. Transp. Res. Procedia 2015, 11, 43–59. [Google Scholar] [CrossRef] [Green Version]
  68. Silvano, A.P.; Eriksson, J.; Henriksson, P. Comparing respondent characteristics based on different travel survey data collection and respondent recruitment methods. Case Stud. Transp. Policy 2020, 8, 870–877. [Google Scholar] [CrossRef]
  69. Van Acker, V.; Van Wee, B.; Witlox, F. When Transport Geography Meets Social Psychology: Toward a Conceptual Model of Travel Behaviour. Transp. Rev. 2010, 30, 219–240. [Google Scholar] [CrossRef] [Green Version]
  70. Prillwitz, J.; Barr, S. Moving towards sustainability? Mobility styles, attitudes and individual travel behaviour. J. Transp. Geogr. 2011, 19, 1590–1600. [Google Scholar] [CrossRef]
  71. Feng, J.; Dijst, M.; Wissink, B.; Prillwitz, J. The impacts of household structure on the travel behaviour of seniors and young parents in China. J. Transp. Geogr. 2013, 30, 117–126. [Google Scholar] [CrossRef]
  72. Oakil, A.T.M.; Manting, D.; Nijland, H. Determinants of car ownership among young households in the Netherlands: The role of urbanisation and demographic and economic characteristics. J. Transp. Geogr. 2016, 51, 229–235. [Google Scholar] [CrossRef] [Green Version]
  73. Allström, A.; Kristoffersson, I.; Susilo, Y. Smartphone based travel diary collection: Experiences from a field trial in Stockholm. Transp. Res. Procedia 2017, 26, 32–38. [Google Scholar] [CrossRef]
  74. Cornelis, E. La Mobilité en Belgique en 2010: Résultats de L’enquête BELDAM; Groupe de Recherche sur les Transports, FUNDP University: Namur, Belgium, 2012. [Google Scholar]
  75. Montini, L.; Prost, S.; Schrammel, J.; Rieser-Schüssler, N.; Axhausen, K.W. Comparison of travel diaries generated from smartphone data and dedicated GPS devices. Transp. Res. Procedia 2015, 11, 227–241. [Google Scholar] [CrossRef] [Green Version]
  76. Maruyama, T.; Sato, Y.; Nohara, K.; Imura, S. Increasing smartphone-based travel survey participants. Transp. Res. Procedia 2015, 11, 280–288. [Google Scholar] [CrossRef]
  77. Bricka, S.G.; Sen, S.; Paleti, R.; Bhat, C.R. An analysis of the factors influencing differences in survey-reported and GPS-recorded trips. Transp. Res. Part C Emerg. Technol. 2012, 21, 67–88. [Google Scholar] [CrossRef] [Green Version]
  78. Prelipcean, A.C.; Susilo, Y.O.; Gidófalvi, G. Collecting travel diaries: Current state of the art, best practices, and future research directions. Transp. Res. Procedia 2018, 32, 155–166. [Google Scholar] [CrossRef]
  79. Bonnel, P.; Munizaga, M.A. Transport survey methods-in the era of big data facing new and old challenges. Transp. Res. Procedia 2018, 32, 1–15. [Google Scholar] [CrossRef]
Figure 1. Samples of the CONNECT app: during trip registration, the distance and duration can be tracked (left); under the question marks, users can select the applicable travel mode and purpose from a list (right).
Ijgi 12 00335 g001
Figure 2. Number of logging days per device.
Ijgi 12 00335 g002
Figure 3. Duration of discontinuity for devices with non-continuous logging.
Ijgi 12 00335 g003
Figure 4. Trip distance distribution according to GPSWAL (light) and BELDAM (dark).
Ijgi 12 00335 g004
Figure 5. Average trip durations per transport mode based on GPSWAL (light) and BELDAM (dark).
Ijgi 12 00335 g005
Figure 6. Distribution of trip purposes according to GPSWAL (left) and BELDAM (right).
Ijgi 12 00335 g006
Figure 7. Modal split according to GPSWAL at trip segment level (left) and at trip level (middle) and according to BELDAM (right).
Ijgi 12 00335 g007
Table 1. Summary of the GPSWAL data collection process.
UsersTripsTrip LegsKilometers
Official survey period23710,39514,047121,008
First campaign1103689482746,673
Second campaign1456709923275,034
Table 2. Number of trip segments collected in “survey” mode.
Transport ModeNo RevisionsRevisedTotal
Foot1384142
Bike27027
Motorized5627569
Unknown000
Total72711738
Table 3. Number of trip segments detected in “background” mode.
Transport modeNo RevisionsRevisedTotal
Foot34779624439
Bike8653821247
Motorized597214737445
Unknown2360236
Total10,550281713,367
Disclaimer/Publisher’s Note: The statements, opinions and data contained in all publications are solely those of the individual author(s) and contributor(s) and not of MDPI and/or the editor(s). MDPI and/or the editor(s) disclaim responsibility for any injury to people or property resulting from any ideas, methods, instructions or products referred to in the content.

