Article

Assessment of Fine-Scale Urban Heat Health Risk and Its Potential Driving Factors Based on Local Climate Zones in Shenzhen, China

1
Key Laboratory of Urban Land Resources Monitoring and Simulation, Ministry of Natural Resources, Shenzhen 518040, China
2
College of Agricultural Engineering and Food Science, Shandong University of Technology, Zibo 255000, China
3
School of Civil Engineering and Geomatics, Shandong University of Technology, Zibo 255000, China
4
State Key Laboratory of Urban and Regional Ecology, Research Center for Eco-Environmental Sciences, Chinese Academy of Sciences, Beijing 100085, China
5
State Key Laboratory of Green Building in Western China, Xi’an University of Architecture & Technology, Xi’an 710055, China
*
Author to whom correspondence should be addressed.
ISPRS Int. J. Geo-Inf. 2024, 13(10), 367; https://doi.org/10.3390/ijgi13100367
Submission received: 12 September 2024 / Revised: 14 October 2024 / Accepted: 16 October 2024 / Published: 18 October 2024

Abstract

:
Cities are facing increased heat-related health risks (HHRs) due to the combined effects of global warming and rapid urbanization. However, few studies have focused on HHR assessment based on fine-scale information. Moreover, most studies only analyze spatial HHR patterns and do not explore the potential driving factors. In this study, we estimated the potential HHRs based on the “hazard–exposure–vulnerability” framework by using multisource data, including the modified thermal–humidity index (MTHI), population density, and land cover. Then, the variations in the HHRs among different local climate zones (LCZs) at the fine spatial scale were analyzed in detail. Finally, we compared the different contributions of the LCZs and types of land cover to the HHRs and their three components by using multiple linear regression models. The results indicate that the spatial pattern of the HHRs was different from those of the individual components, and high-hazard regions do not mean high HHRs. There were huge variations in the HHRs among the different LCZs. The built-up LCZs typically had much higher HHRs than the natural ones, with compact LCZs facing the most severe risk. LCZ 6 (open low-rise buildings) had a relatively low HHR and should be paid more attention in future urban planning. Compared to the LCZs, the land covers better explained the variations in the HHR. In contrast, the LCZs better predicted the land surface temperatures. However, both the LCZs and land covers made only slight contributions to the heat exposure and vulnerability. Furthermore, the manmade buildings and impervious surface areas contributed much more to the HHR than the natural land covers. Therefore, the arrangement of the warming LCZs and land cover types is worthy of further investigation from the perspective of HHR mitigation.

1. Introduction

The global surface temperature increased by 1.1 °C from 2011 to 2020, which was much higher compared to the increase from 1850 to 1900 due to the high concentrations of human activities in cities [1]. Moreover, many countries around the world, such as the U.K., Australia, and Russia, face severe heat-related health risks with increases in mortality due to extreme heatwave exposure [2,3,4,5]. As the whole planet is still rapidly urbanizing, it is projected that more people in the future will live in cities and face higher potential heat health risks due to increases in the intensity, duration, and spatial range of extreme heatwaves [6,7,8,9], consequently creating unprecedented challenges for both governments and residents that require more attention and action [10,11]. However, systemic studies on the heat-related health risks (HHRs) in cities with detailed spatially explicit information are still lacking.
Numerous previous studies have attempted to conduct HHR assessments, which are the basis of understanding urban thermal environments, to identify vulnerable people and places, as well as the extent of the risk [12,13,14,15,16,17]. Accordingly, a comprehensive HHR assessment framework is the fundamental paradigm. The “Crichton Risk Triangle” framework and its related modifications are the most widely employed frameworks in the current literature [18]. In addition, the IPCC also proposes a similar climate change risk model. These frameworks and models consist of three main components: hazard, exposure, and vulnerability. The final HHR is estimated as a function of these three factors [17,19,20,21,22].
The selection of the variables used to characterize these three factors influences HHR assessment. The hazard index is usually characterized by the air temperature or land surface temperature (LST) [15,23]. Air temperature can provide hourly weather conditions but is constrained by the limited number of observation stations [24,25]. LST, retrieved from thermal infrared remote sensing, can overcome these spatial limitations with a good spatial resolution, accessibility, and wide distribution [26,27]. However, most of the previous studies only used single remote sensing images to retrieve the LST, thereby potentially causing uncertainty due to the past weather conditions being constrained by the satellite transit time. Furthermore, humidity is another important factor that has a substantial influence on the thermal perception of urban heat, which should be considered in the characterization of the hazard index [28,29,30]. The modified thermal–humidity index (MTHI) is a good indicator that reflects both LST and humidity information [30]. The influence of heatwaves on human health is also related to the population density, the sensitive population count, the physiological state of residents, and their capacity to adapt to high temperatures [31,32,33]. It is evident that elder and younger people are more easily affected by heatwaves due to their special somatic functions [34,35,36]. Moreover, infrastructure levels and environmental factors also affect the adaptation of people to heat risks. For instance, more urban green space changes the absorption, release, and exchange of surface energy and therefore regulates the urban microclimate to generate a comfortable thermal environment [37,38,39]. In contrast, high manmade building and impervious surface coverage increases the heat-related health risks [40,41].
The analysis scale for HHR assessment is another important issue that should be further explored. As mentioned, the population is usually employed to characterize heat exposure and vulnerability. Therefore, census data, which are collected from specific statistical areas (such as administrative units), are the main data sources for HHR assessment [20,42]. However, the relatively coarse resolution of these census data fails to provide detailed HHR spatial information and therefore they cannot be used to generate specific urban planning policies. The lack of detailed spatial distribution information on populations is a major challenge for HHR assessment [11,32]. The local climate zone (LCZ) concept was proposed in 2012, after which it became one of the most popular frameworks in urban climate-related studies [43,44,45]. Fortunately, the world famous WUDAPT project allows researchers to download high-resolution LCZ maps (100 m resolution) with a high accuracy [46]. However, studies that explore HHRs by using the LCZ framework in the current literature are limited. In addition, most HHR studies only focus on spatial patterns without investigating the potential impact factors. The identification of the dominant driving factors of HHR is of vital importance to taking action to reduce the HHRs.
In order to address the mentioned research gaps, in this study, we selected Shenzhen, a coastal city with a hot and humid climate in China, to explore the relationships between the HHRs and LCZs at fine spatial scales. The main objectives of this study were to select representative evaluation indicators to characterize the hazard (i.e., the MTHI for assessing urban heat stress), exposure, and vulnerability, analyze the spatial HHR patterns, and then compare the different contributions of the LCZs and land covers to the HHRs by using multiple linear regression models. It is hoped that our study will provide interesting and useful results for HHR mitigation and future urban planning.

2. Materials and Methods

2.1. Study Area

Shenzhen (113.43° E–114.38° E, 22.24° N–22.52° N), a coastal city in Guangdong Province, China, is located on the eastern bank of the Pearl River Estuary. Shenzhen was established in March 1979 and became China’s first special economic zone, signaling the start of the reform and opening up of China. It is a modern and international metropolis now, with 17.66 million permanent residents, and its GDP was CNY 3.46 trillion in 2023. Shenzhen has a subtropical monsoon climate, and its annual average temperature and precipitation are 23.0 °C and 1932.9 mm, respectively, giving the city a sultry warmth and plenty of precipitation. The summer in Shenzhen can last for over 6 months, with plenty of hot days. The hottest July had an average temperature of 29.0 °C. Therefore, Shenzhen is an ideal study area for conducting heat risk assessment research due to its large population and hot weather. The western part of Shenzhen was selected as the main study area, covering an area of 1150.70 km2, as shown in Figure 1.

2.2. Data Sources

The three data sources employed in this study were as follows: (1) Landsat 8 images, collected from the Geospatial Data Cloud. Three cloud-free Landsat 8 images were employed to retrieve the LST and MTHI maps. Then, the average LST and MTHI based on these three maps were used to characterize the spatial patterns of heat hazards in the area. Pre-processing, such as radiometric correction, was applied to these original Landsat 8 images in ENVI 5.5 before the LST retrieval. (2) The LCZ dataset and land cover map. The LCZ map for Shenzhen city was downloaded from WUDART, a famous community-based project that gathers censuses from cities around the world. However, it should be noted that the WUDART project and portal and its underlying procedures are no longer maintained nor updated. Therefore, obtaining the latest LCZ maps in n the future may be difficult. In addition, a 1-meter-resolution land cover map including seven subtypes for Shenzhen city was obtained from Zendo [47]. The LCZ and land cover maps for Shenzhen were used to depict the urban morphology features that have potential effects on heat-related risks. (3) Population data. The population data for Shenzhen were downloaded from World Pop Hub, a population dataset that contains density information on different gender and age groups, and were used to assess the heat exposure and sensitivity. In addition to these three main data sources, Baidu Street View, Google Earth images, and socioeconomic data served as supplementary data. All the data sources used in this study are presented in Table 1.

2.3. Methods

2.3.1. LST Retrieval

Because any single LST image might cause uncertainty in the characterization of the urban thermal environment, the averaged LST of three Landsat 8 images was adopted in this study to minimize the influences of the past weather conditions. For the Landsat 8 images, TIRS band 10 was used to calculate the LST using the following formulas:
R a d i a n c e = g a i n × D N + o f f s e t
T b = K 2 / l n ( K 1 R a d i a n c e + 1 )
L S T = T b 1 + ( λ T b / ρ ) l n ε
where Radiance is the spectral radiance at the top of the atmosphere, and DN is the digital number for band 10. The gain and offset values can be found in the head file. Then, the Radiance was transformed into the Tb (bright temperature), K1 was equal to 774.89 W/(m2 sr μm), and K2 was equal to 1321.08 K. Finally, the LST could be estimated by considering the differences in the ε , which represents the LSE (land surface emissivity) for different land covers, which is calculated by using the NDVI threshold method, which has been largely employed in previous studies [48,49].

2.3.2. MTHI Calculation

In addition to temperature, people are also easily affected by humidity. Therefore, the MTHI was used to characterize the heat hazard, as it reflects the outdoor thermal comfort [30]. The MTHI can be estimated as follows:
M T H I = 1.8 × L S T + 32 0.55 × ( 1 N D M I ) × ( 1.8 × L S T 26 )
where NDMI is the normalized difference moisture index, which can be calculated as follows:
N D M I = N I R S W I R N I R + S W I R
where NIR is the near-infrared wavelengths, and SWIR is the short-wave infrared wavelengths. The final MTHI was also the average value used for the three LST maps to generate solid results.

2.3.3. HHR Assessment Framework

The effects of the urban climate on human beings depend on the following elements: the severity of the extremes, individuals’ exposure, and their vulnerability to potential heat health risks [50]. Hence, to assess the heat health risk in a comprehensive way, the widely used conceptual “Crichton Risk Triangle” framework was utilized in this study which consists of the heat hazard, exposure, and vulnerability [18]. In essence, the final HHR index was calculated via the linear combination of these three components with equal weights, as follows [20,51,52]:
H H R = H a z a r d + E x p o s u r e + V u l n e r a b i l i t y
As these three components are characterized by different types of data, they cannot be directly applied using their original values. Therefore, all of them were reclassified into seven classes by using the relationships between the mean value and standard deviation, and each class was assigned a numerical value from seven to one based on its contribution to the HHR. For instance, the highest severity of the hazard class was set to seven, while the weakest level was set to one.
Hazard refers to “the potential influence on human health, property and environmental resources caused by natural or human induced physical event” [20]. In the context of HHR assessment, the MTHI is used as the key indicator to characterize the heat hazard. Compared to the traditional use of the LST or air temperature, the MTHI better reflects the combined effects of temperature and humidity, as well as people’s thermal perceptions. Exposure refers to potential adverse heat hazard effects. The population density is usually selected as one of the indicators of exposure in studies [20,42,53]. In this context, both the population density (for all people) and impervious surface area coverage were selected to characterize exposure with the assumption that larger populations and higher ISA percentages imply higher risks of heat exposure. The ISA values were calculated based on the 1 m land cover dataset. Vulnerability refers to people’s capacity to deal with, adapt to, and recover from potential hazards, as well as their sensitivity to harm. In this study, more attention was paid to sensitive populations, including elderly people aged 65 years and older and children aged 14 years and younger. These individuals were selected to depict heat vulnerability due to their heat tolerance mechanisms.

2.3.4. Grid and Statistical Analysis

To obtain explicit spatial information related to these three indicators to carry out the HHR assessment and calculate the final result for the heat risk, a 1km × 1 km grid was built for the whole study area. The grid cells were treated as the basic analysis units for the spatial pattern mapping and the following statistical analysis. First, Pearson correlation analysis was performed to explore the relationships between the urban heat risk and urban morphology characterized by the LCZs and land cover. Second, multiple linear regression models were constructed to explore and compare the different LCZ and land cover contributions to the variations in the three heat risk indicators and the final heat risk result. All these mappings and analyses were performed with the help of ArcGIS 10.8, Origin 2022, and IBM SPSS Statistics 25.

3. Results

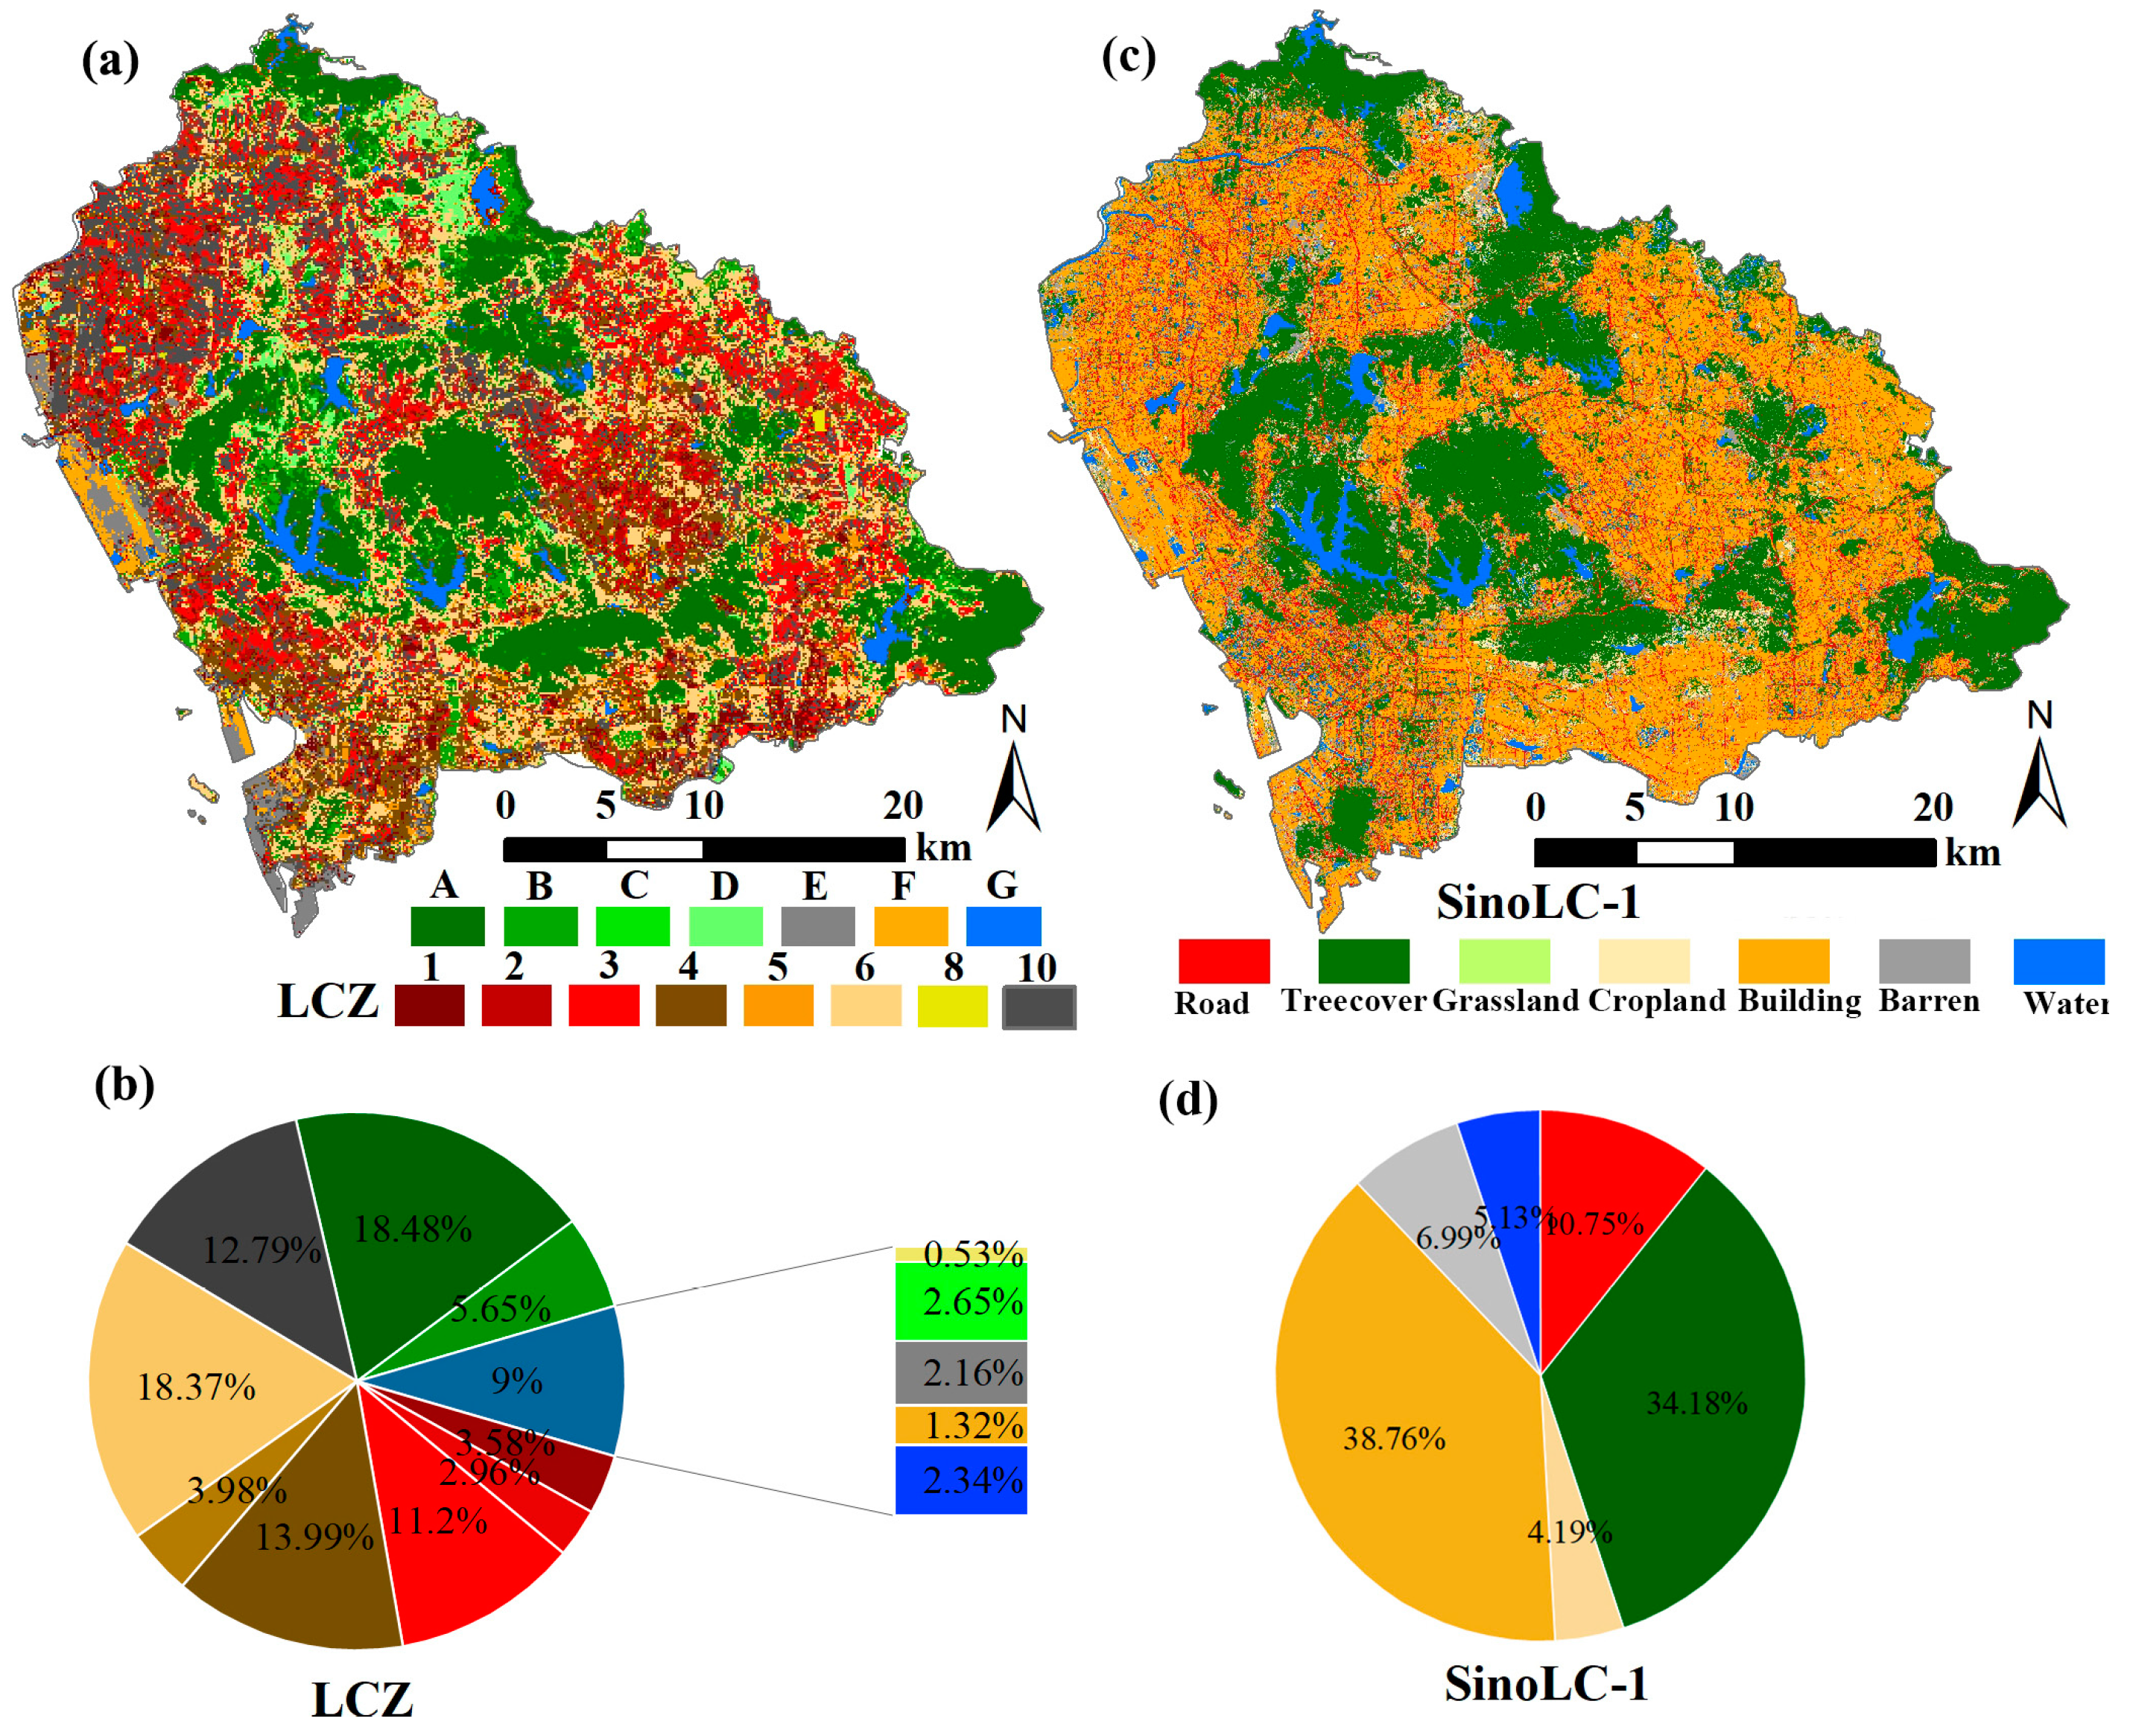
3.1. LCZ and Land Cover Spatial Patterns

The LCZ and land cover spatial patterns are shown in Figure 2a,c, respectively. The overall accuracy (OA) of the LCZ map was 0.80, which was sufficient to meet the requirements of the HHR assessment. Figure 2a shows that LCZ A (dense trees) was mostly located in the central and eastern parts, which accounted for 18.48% of the total area. LCZ A included the largest proportion of the area, indicating that Shenzhen has a relatively high green space coverage. Among the built-up LCZ types, the compact LCZ types, including LCZ 1–3, were concentrated in the western and southern coastal zones, indicating a high land use efficiency along the coastline. LCZ 6 (open low-rise) and LCZ 10 (industry) were distributed all over the study area, occupying 18.37% and 13.99%, respectively.
In the context of land cover, Figure 2 c,d show similar spatial patterns to those of the LCZs. As the spatial resolution was quite different between the LCZs and land cover, there are differences in the statistics. Figure 2d shows that the proportions of tree cover and building area were 34.18% and 38.76%, respectively. In addition, roads were the third largest type of land cover in Shenzhen, accounting for 10.75%. The LCZs provide information about the density and height of buildings, while land cover provides detailed information about the components inside the different types of LCZs. Therefore, the combination of LCZs and land cover better depicts the urban morphology features of Shenzhen city.

3.2. Spatial Patterns of Different Risk Indicators

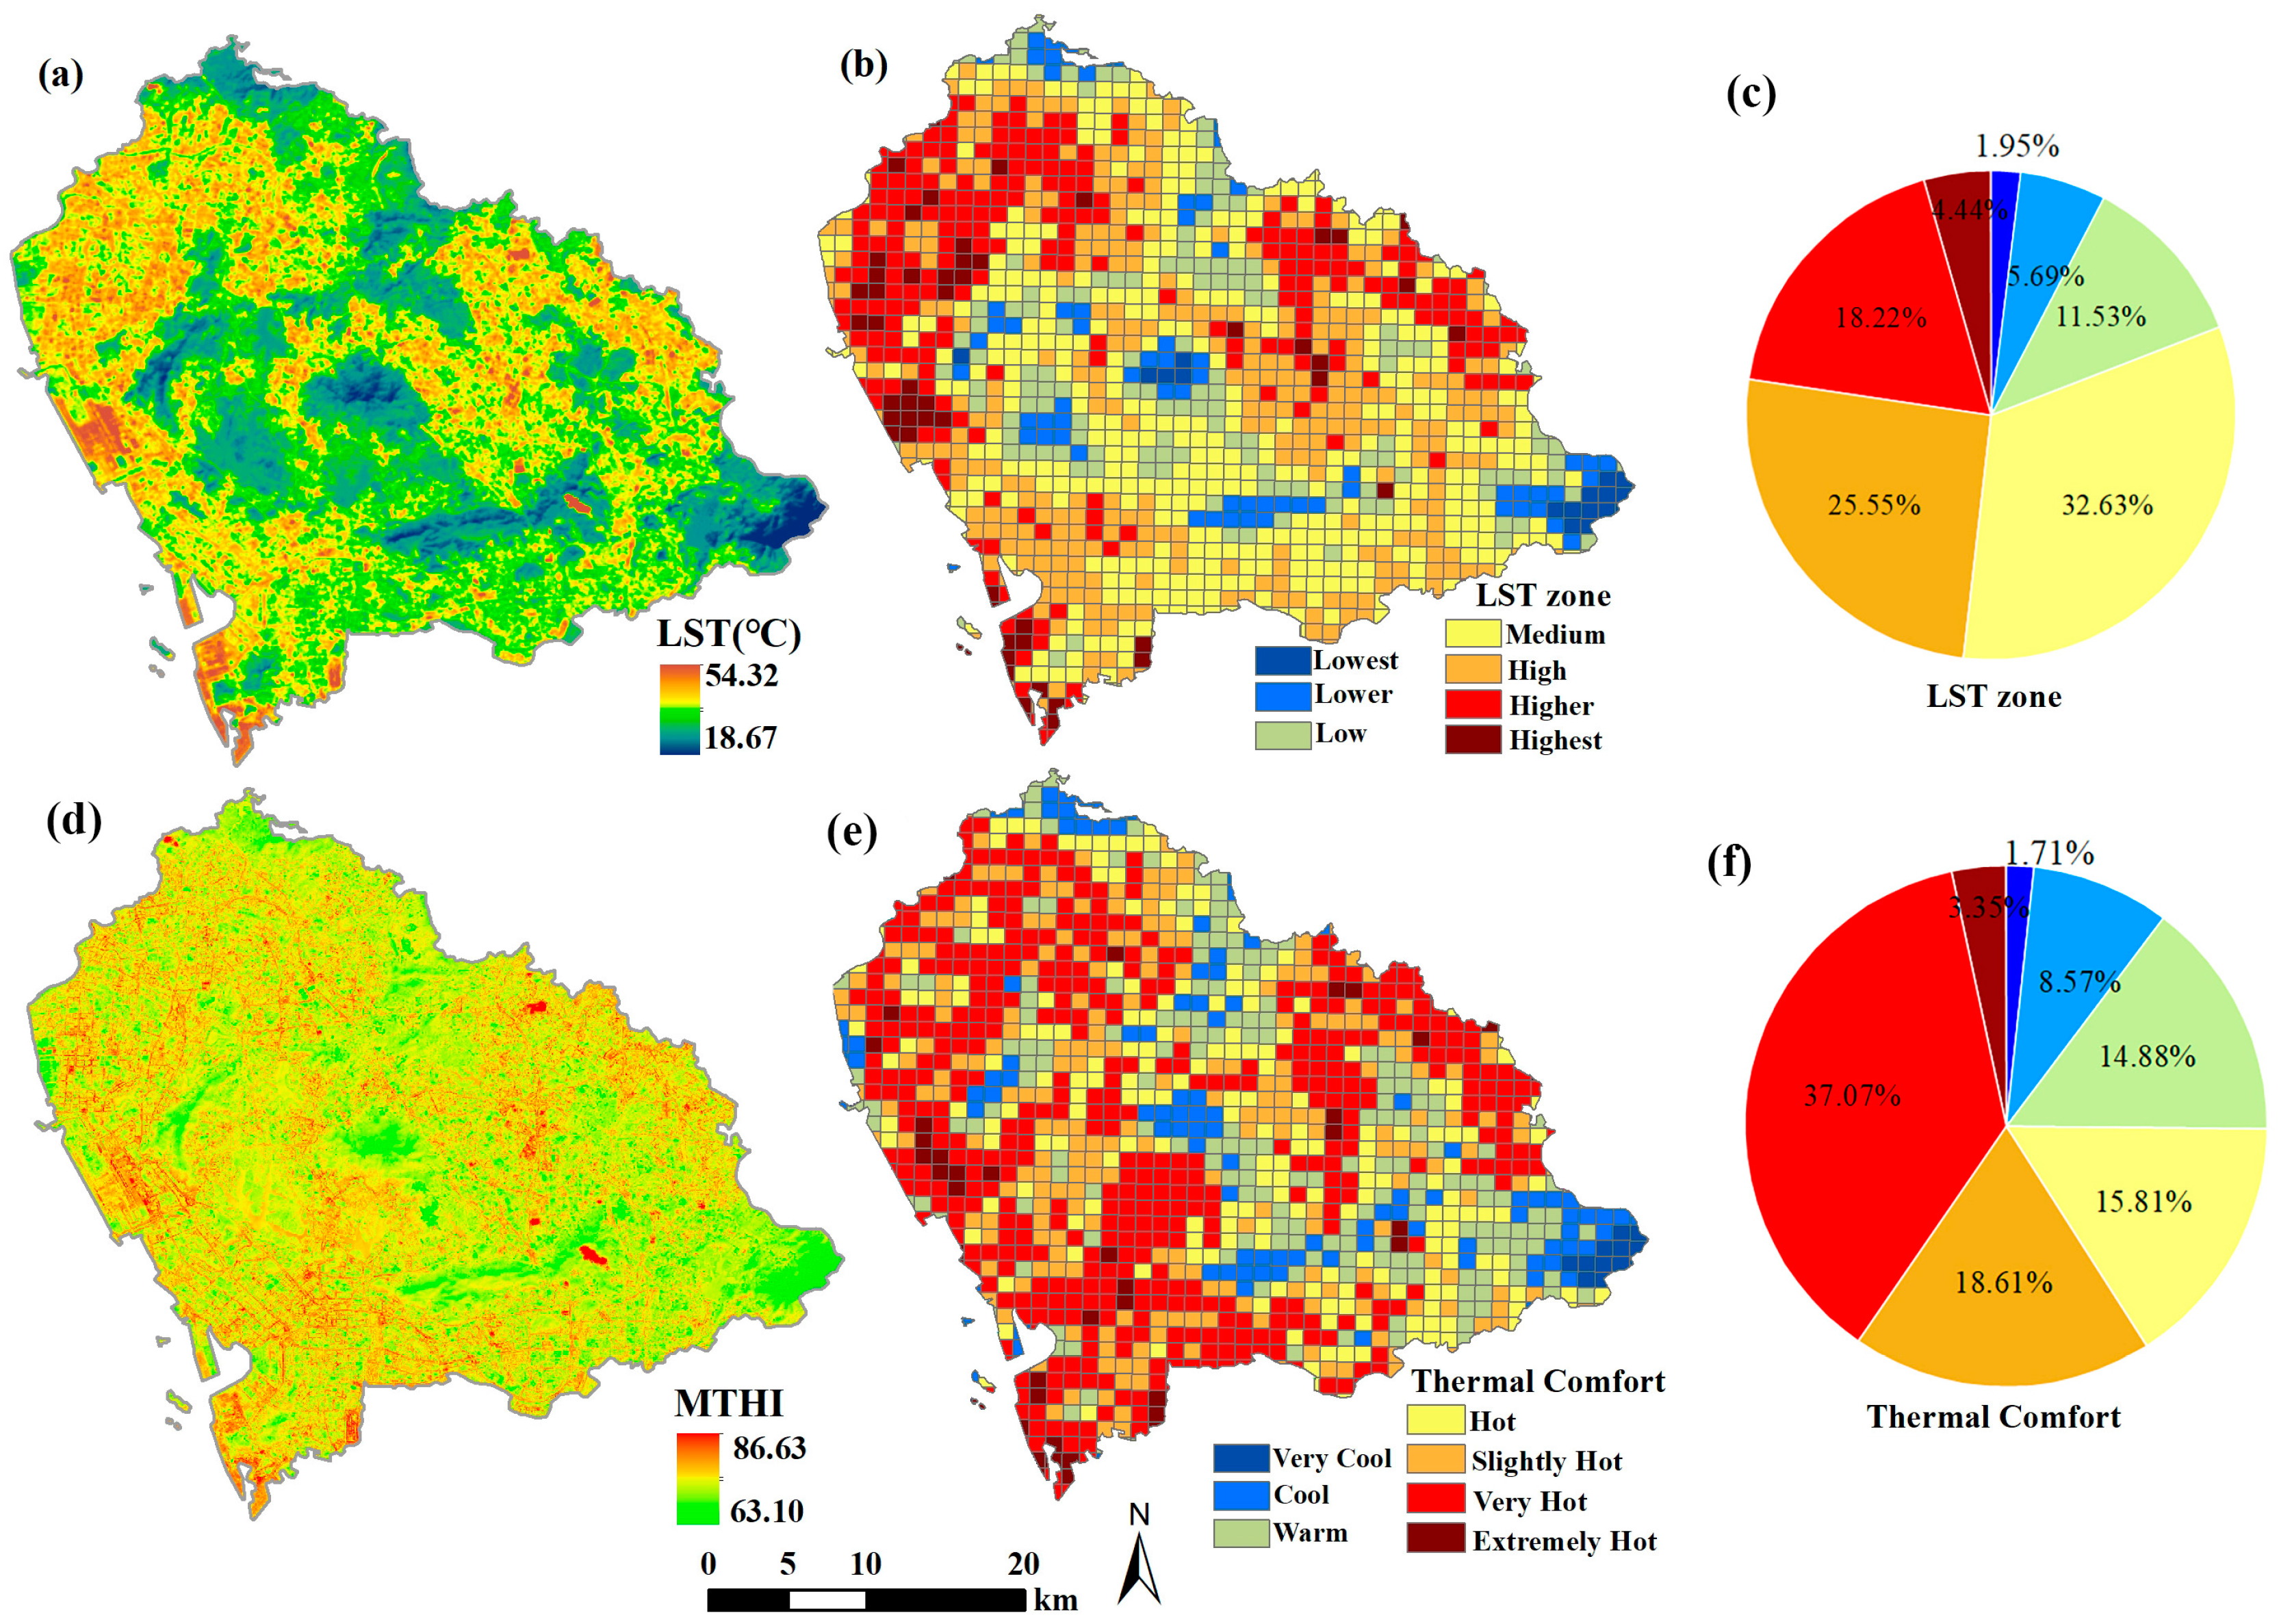
3.2.1. LST and MTHI Spatial Patterns

The spatial patterns of the original LST and MTHI are shown in Figure 3a,d, respectively. The reclassified LST and MTHI used to characterize the heat hazard are shown in Figure 3b,e, respectively, and their area proportions are provided in Figure 3c,f.
Figure 3a,b show that high LSTs were mainly located in the northwestern and eastern parts, while low LSTs were distributed in the central and eastern parts. Typically, natural LCZs and land cover, such as LCZ A, LCZ G (water), and tree cover, usually have much lower LSTs compared to those of artificial surfaces and buildings. The highest region in the western part was Shenzhen Bao’an International Airport, where a large ISA and the heat emitted by airplanes made it a hotspot. The total area proportions of the high, higher, and highest regions accounted for over 48.21%. The spatial distribution of the original MTHI was similar to that for the LST. However, the thermal comfort spatial pattern based on the reclassified MTHI was quite different from that in the LST zone. Because the MTHI was calculated according to the LST and NDMI, it reflects the humidity to some extent. Therefore, some high-LST regions might become very hot regions due to their higher humidity, which would affect human health. Figure 3f shows that the area proportions of the very hot and extremely hot regions accounted for 37.07% and 3.35%, respectively. These results indicate that Shenzhen faces a relatively high heat hazard.

3.2.2. Exposure and Vulnerability Spatial Patterns

The spatial patterns of the population density and ISA are shown in Figure 4, in which 1km × 1 km cells are treated as the basic units. As mentioned in Section 2.3.3, all of these indicators were reclassified into seven classes, wherein the large red points have higher values. Dense populations were found in the southeastern and southwestern parts. There are several dense population grid cells in the northwest part. However, the sensitive population density was not large in this northwestern region. Compared to Figure 4a,b, the ISA distribution is quite different. High-ISA grid cells were found in the northwestern and eastern parts. In particular, the ISA was very high in the northeastern part where the population density is relatively low. The combination of population density and ISA was used to characterize the heat exposure, and the sensitive population was treated as the heat vulnerability indicator.

3.2.3. Spatial Pattern of Heat Health Risk

Based on the three indicators used for HHR assessment, the spatial pattern of the heat risk was obtained and is shown in Figure 5a. Overall, the heat risk has a similar spatial distribution compared to those obtained for the thermal comfort and population density. However, the final HHR also had its own features. The extremely high HHR zones (dark-red regions) were mainly located in the southeastern part and along the western coastline. These regions are usually characterized by hot, humid weather and high population densities. The very low and lower HHR zones were found in the northern, central, and eastern parts, where LCZ A (dense trees) and LCZ G (water) were the dominant LCZ types. Regarding the statistics, the total area proportion for the very high and extremely high HHR zones was over 25%. Taking the high-HHR zone into account, approximately 46.30% of the whole study area could potentially face serious heat health risks.
The differences in HHR among the LCZ types are shown in Figure 5c Overall, the HHR values for the built-up LCZs (LCZ 1–10) were much higher than those for the natural LCZ types. Specifically, LCZ 2 (compact mid-rise) faces the highest heat risk, while LCZ A (dense trees) has the lowest HHR value. The three LCZs that face severe risks are LCZ 2 (compact midrise buildings), LCZ 8 (large low-rise buildings), and LCZ 10 (industry), while LCZ 6 (open low-rise buildings) faces a much lower heat risk than the other built-up LCZs due to its relatively high vegetation coverage and smaller building volume. LCZ G (water) also has a low heat risk due to its strong cooling effect.

3.3. Effects of LCZs and Land Covers on HHR

3.3.1. Relationships between LCZ, Land Cover, and Risk Indicators

As mentioned in Section 2.3.4, a Pearson analysis was employed to explore the relationships between the land cover, LCZ, and HHR indicators. The results for their coefficients are shown in Table 2 and Table 3. Table 2 shows that all of the roads, buildings, and impervious surfaces were positively related to the LST, the three risk indicators, and the final heat risk. Among these three land covers, the impervious surface land cover had the largest coefficients, indicating that it had the strongest relationship with the LST and HHR, while tree cover had negative correlations with the LST and risk metrics. However, most of the tree cover coefficients were smaller than those of the impervious surface areas, except for the relationship with the heat hazard, indicating that trees reduce the adverse effects caused by the heat hazard.
The results in Table 2 show that grass had a positive relationship with the LST, hazard, exposure, vulnerability, and HHR. However, the values of these correlation coefficients were very small, with most of them being smaller than 0.1. Vegetation has a cooling effect due to the shade it provides and evapotranspiration. However, grass produces almost no shade, and it can absorb solar radiation to increase the LST. Similar results for the relationship between the LST and grass have also been found in previous studies [49]. Therefore, grass has a warming effect to some degree. In addition, more grass is usually related to more outdoor activities and people. Therefore, it has a positive relationship with exposure and vulnerability.
Table 3 shows that all of the built-up LCZs had positive relationships with the LST and risk indicators, except for the coefficient (−0.042) between LCZ 6 and the LST. In addition, LCZ E (bare rock or paved) was positively related to heat risk. Specifically, LCZ 3 (compact low-rise) and LCZ 10 (industry) had the largest positive coefficients. LCZ A (dense trees) had the strongest negative correlations with the risk indicators, which were much larger than those for LCZ G (water).

3.3.2. Impacts of Land Cover on Risk Indicators

Linear regression models were built to explore the effect of key land cover types on the LST, MTHI, and population based on the strength of their relationships. Therefore, roads, buildings, tree covers, and impervious surface areas with large coefficients were selected as the independent variables. In Figure 6, it can be seen that all three land cover types had much stronger effects on the LST than the MTHI and population. Specifically, the impervious surface area had the largest warming effect. For example, a 10% increase in the impervious surface area would warm the thermal environment by approximately 0.42 °C. However, the effects of the key land covers on the MTHI were not that strong. In addition, the relationships between the land covers and population were very complicated. Overall, higher area proportions of roads, buildings, and impervious surfaces were related to larger populations.
The effects of land cover on the final HHR were examined by mapping them as scatter diagrams (Figure 7). Overall, roads, buildings, and impervious surfaces had positive effects on the HHR, indicating that higher area proportions usually generate higher heat risks. The relationships between the key land covers and low HHRs was more complicated than those for the very high and extremely high HHR zones. Typically, the low and lower HHR zones were mostly located in grid cells with few buildings and impervious surfaces. However, there were still some regions with higher numbers of manmade buildings that had low HHRs. In contrast, the extremely high HHR zones were only found in regions with dense buildings and high area proportions of impervious surfaces. The possible reason is that the final HHR was influenced by the combined effects of different land covers rather than by any single one.

4. Discussion

4.1. Spatial Pattern of HHR and Its Indicators

In this study, the HHR was quantified and analyzed based on the widely used “hazard–exposure–vulnerability” framework for Shenzhen, a hot coastal city with a large population. The metrics selected for HHR assessments can impact their justification and effectiveness [53,54]. Numerous related metrics have been employed in previous studies, such as LST and air temperature [20,44,55]. Specifically, the MTHI indicator that reflects people’s thermal environmental comfort was selected as the main metric to characterize the heat hazard. The MTHI provided explicit spatial heat hazard information for every pixel across the whole study area, which the limited air temperature failed to do. Moreover, the MTHI takes the humid element into account, whereas the LST only reflects the temperature. Therefore, the MTHI used in this study better depicts the heat hazard in a more comprehensive and reasonable way.
Due to the limited knowledge and literature on HHR distributions at the fine spatial scale inside cities, in this study, we mapped the detailed spatial patterns of the HHR and its risk indicators based on a 100 m spatial resolution LCZ and World Pop Hub population dataset. Notably, this study makes contributions to HHR assessment research. By comparing Figure 3, Figure 4 and Figure 5, it becomes clear that there is spatial heterogeneity between the HHR and its indicators, indicating the complexity of the heat risk inside cities. The high-HHR zones were mainly located in the western and southeast parts (Figure 5), while the high-risk hazards characterized by the MTHI were mostly distributed in the west, and the southeast part did not face a severe hazard, which further indicated that the final HHR was the result of the combination of these three indicators. High-hazard areas did not mean high HHR levels if the regions had small populations. However, the distribution of the low-HHR regions was usually consistent with that of the low-hazard areas.

4.2. Relationships between LCZ and HHR

Most of the current studies on the HHR focus on its spatiotemporal patterns, and few explore the potential relationships between LCZs, land cover, and HHRs. In Section 3.3, the effect of a single LCZ type or land cover on the HHR was analyzed. A final HHR score was calculated for each analysis grid cell in this study. The 1 × 1 km grid consisted of different LCZ pixels or land cover types. The final HHR score was influenced by the combined effects of the LCZs. Therefore, multilinear regression models were built for the LCZs, land covers, and HHRs with their indicators.
The data in Table 4 and Table 5 indicate that different numbers and types of independent variables were entered into the final regression model. As for the effects of land cover on the HHR, it was found that impervious surface areas made the largest contribution to the LST and HHR, while buildings had the largest positive effect on the population. Tree cover had a negative impact on the LST, while it was not entered into the model built for the HHR. The results from Table 4 show that impervious surface areas and buildings were the two dominant types of land cover that had significantly positive effects on the HHR. Similarly, the areas of the LCZs in each analysis unit are treated as independent variables in Table 5. Shenzhen had fourteen types of LCZs in total, while there were only seven types of land cover. The adjusted R2 of the model built for the LST was 0.866, indicating that the combined effects of the LCZs could explain 86.6% of the LST variations, and it was much higher than that for the land cover, which was 0.742. Table 5 also shows that most of the built-up LCZs have increased HHR values, and that LCZ 3 and LCZ 10 made the largest contributions to the HHR. By comparing the adjusted R2 values, it was found that the land covers had a slightly stronger ability to explain the variations in the HHR than the LCZs, while the LCZs were better at predicting the changes in the LST. One possible reason for this is that the LCZs contain both 2D and 3D urban structure features.

4.3. Limitations

This study had some limitations. Although the HHRs characterized by the MTHI and other factors provided detailed spatial patterns, additional potential natural and social impact factors should be taken into account, such as air temperature, income, and so forth. Second, the hourly variations in the HHR during the course of a day also need further investigation to provide better advice to individuals participating in outdoor activities. Finally, in this study, we explored the impacts of LCZ and land cover on the HHR using only traditional statistical methods. In the future, the impacts on the HHR will be investigated through the combination of machine learning and simulation.

5. Conclusions

In this study, we conducted a thorough HHR assessment in Shenzhen, a high-density city with a hot and humid climate, using the hazard–exposure–vulnerability framework based on multisource geo-information data. Specifically, the MTHI, which combines both temperature and humidity information, was used to characterize the hazard. Moreover, the relationships between the HHR and LCZs with different types of land cover were investigated by using correlation analysis and multiple linear regression models.
The results indicate that the spatial pattern of the final HHR was different from those of its three elements. In other words, regions of high temperature or humidity did not generate high-HHR zones if they had small populations. However, the low-hazard zones were usually consistent with the low-HHR regions. Typically, built-up LCZs have much higher heat-related health risks than natural LCZs, and this phenomenon was also observed for the land covers. Specifically, compact, built-up LCZs, including LCZ1, LCZ2, and LCZ3, face more serious risks, while LCZ 6 has a much lower HHR. This result further indicates substantial variations in the HHR among different LCZs at the community level, which could influence individual- and community-level policies for mitigating the negative effects of heatwaves. Compared to the LCZs, the types of land cover were better able to explain the variations in the HHR, while they did not perform better in predicting the LST. Therefore, the combination of LCZs and high-spatial-resolution land cover information would deepen our knowledge of the impact of HHR. This study contributes valuable insights for future HHR mitigation strategies and policymaking.

Author Contributions

Conceptualization, Chaobin Yang; methodology, Riguga Su; software, Lilong Yang; validation, Lilong Yang; formal analysis, Zhibo Xu; investigation, Riguga Su; resources, Tingwen Luo; data curation, Zhibo Xu; writing—original draft preparation, Riguga Su; writing—review and editing, Chaobin Yang; visualization, Lilong Yang; supervision, Chaobin Yang; funding acquisition, Tingwen Luo. All authors have read and agreed to the published version of the manuscript.

Funding

This study was funded by the National Natural Science Foundation of China (grant number 32471645, 42201123), the Open Fund of the Key Laboratory of Urban Land Resources Monitoring and Simulation (KF-2022-07-002), Ministry of Natural Resources, and the Opening Fund of the State Key Laboratory of Green Building in Western China (project number LSKF202308).

Data Availability Statement

The data presented in this study are available upon request from the corresponding author.

Conflicts of Interest

The authors declare no conflicts of interest.

References

  1. Allan, R.P.; Arias, P.A.; Berger, S.; Canadell, J.G.; Cassou, C.; Chen, D.; Cherchi, A.; Connors, S.L.; Coppola, E.; Cruz, F.A. Intergovernmental Panel on Climate Change (IPCC). Summary for Policymakers. In Climate Change 2021: The Physical Science Basis. Contribution of Working Group I to the Sixth Assessment Report of the Intergovernmental Panel on Climate Change; Cambridge University Press: Cambridge, UK, 2023; pp. 3–32. [Google Scholar]
  2. Coates, L.; van Leeuwen, J.; Browning, S.; Gissing, A.; Bratchell, J.; Avci, A. Heatwave fatalities in Australia, 2001–2018: An analysis of coronial records. Int. J. Disaster Risk Reduct. 2022, 67, 102671. [Google Scholar] [CrossRef]
  3. Otto, F.E.L.; Massey, N.; van Oldenborgh, G.J.; Jones, R.G.; Allen, M.R. Reconciling two approaches to attribution of the 2010 Russian heat wave. Geophys. Res. Lett. 2012, 39, L04702. [Google Scholar] [CrossRef]
  4. Ravishankar, S.; Howarth, C. Exploring heat risk adaptation governance: A case study of the UK. Environ. Sci. Policy 2024, 157, 103761. [Google Scholar] [CrossRef]
  5. Giannaros, C.; Agathangelidis, I.; Papavasileiou, G.; Galanaki, E.; Kotroni, V.; Lagouvardos, K.; Giannaros, T.M.; Cartalis, C.; Matzarakis, A. The extreme heat wave of July–August 2021 in the Athens urban area (Greece): Atmospheric and human-biometeorological analysis exploiting ultra-high resolution numerical modeling and the local climate zone framework. Sci. Total Environ. 2023, 857, 159300. [Google Scholar] [CrossRef]
  6. Levermore, G.; Parkinson, J.; Lee, K.; Laycock, P.; Lindley, S. The increasing trend of the urban heat island intensity. Urban Clim. 2018, 24, 360–368. [Google Scholar] [CrossRef]
  7. Li, Z.W.; Fan, Y.G.; Su, H.; Xu, Z.W.; Ho, H.C.; Zheng, H.; Tao, J.W.; Zhang, Y.Q.; Hu, K.J.; Hossain, M.Z.; et al. The 2022 Summer record-breaking heatwave and health information-seeking behaviours: An infodemiology study in Mainland China. BMJ Glob. Health 2023, 8, e013231. [Google Scholar] [CrossRef]
  8. Si, M.; Li, Z.-L.; Nerry, F.; Tang, B.-H.; Leng, P.; Wu, H.; Zhang, X.; Shang, G. Spatiotemporal pattern and long-term trend of global surface urban heat islands characterized by dynamic urban-extent method and MODIS data. ISPRS J. Photogramm. Remote Sens. 2022, 183, 321–335. [Google Scholar] [CrossRef]
  9. Li, D.; Wang, L.; Liao, W.; Sun, T.; Katul, G.; Bou-Zeid, E.; Maronga, B. Persistent urban heat. Sci. Adv. 2023, 10, eadj7398. [Google Scholar] [CrossRef]
  10. He, B.-J.; Wang, J.; Zhu, J.; Qi, J. Beating the urban heat: Situation, background, impacts and the way forward in China. Renew. Sustain. Energy Rev. 2022, 161, 112350. [Google Scholar] [CrossRef]
  11. Ebi, K.L.; Capon, A.; Berry, P.; Broderick, C.; de Dear, R.; Havenith, G.; Honda, Y.; Kovats, R.S.; Ma, W.; Malik, A.; et al. Hot weather and heat extremes: Health risks. Lancet 2021, 398, 698–708. [Google Scholar] [CrossRef]
  12. Tan, J.; Zheng, Y.; Tang, X.; Guo, C.; Li, L.; Song, G.; Zhen, X.; Yuan, D.; Kalkstein, A.J.; Li, F.; et al. The urban heat island and its impact on heat waves and human health in Shanghai. Int. J. Biometeorol. 2010, 54, 75–84. [Google Scholar] [CrossRef] [PubMed]
  13. Bao, J.; Li, X.; Yu, C. The Construction and Validation of the Heat Vulnerability Index, a Review. Int. J. Environ. Res. Public Health 2015, 12, 7220–7234. [Google Scholar] [CrossRef] [PubMed]
  14. Leroyer, S.; Bélair, S.; Spacek, L.; Gultepe, I. Modelling of radiation-based thermal stress indicators for urban numerical weather prediction. Urban Clim. 2018, 25, 64–81. [Google Scholar] [CrossRef]
  15. Heo, S.; Bell, M.L.; Lee, J.-T. Comparison of health risks by heat wave definition: Applicability of wet-bulb globe temperature for heat wave criteria. Environ. Res. 2019, 168, 158–170. [Google Scholar] [CrossRef]
  16. Arbuthnott, K.G.; Hajat, S. The health effects of hotter summers and heat waves in the population of the United Kingdom: A review of the evidence. Environ. Health 2017, 16, 119. [Google Scholar] [CrossRef]
  17. Wu, H.; Xu, Y.; Zhang, M.; Su, L.; Wang, Y.; Zhu, S. Spatially explicit assessment of the heat-related health risk in the Yangtze River Delta, China, using multisource remote sensing and socioeconomic data. Sustain. Cities Soc. 2024, 104, 105300. [Google Scholar] [CrossRef]
  18. Crichton, D. The risk triangle. In Natural Disaster Management; Tudor Rose: London, UK, 1999; Volume 102, pp. 102–103. [Google Scholar]
  19. Pramanik, S.; Punia, M.; Yu, H.; Chakraborty, S. Is dense or sprawl growth more prone to heat-related health risks? Spatial regression-based study in Delhi, India. Sustain. Cities Soc. 2022, 81, 103808. [Google Scholar] [CrossRef]
  20. Ma, L.; Huang, G.; Johnson, B.A.; Chen, Z.; Li, M.; Yan, Z.; Zhan, W.; Lu, H.; He, W.; Lian, D. Investigating urban heat-related health risks based on local climate zones: A case study of Changzhou in China. Sustain. Cities Soc. 2023, 91, 104402. [Google Scholar] [CrossRef]
  21. Estoque, R.C.; Ooba, M.; Seposo, X.T.; Togawa, T.; Hijioka, Y.; Takahashi, K.; Nakamura, S. Heat health risk assessment in Philippine cities using remotely sensed data and social-ecological indicators. Nat. Commun. 2020, 11, 1581. [Google Scholar] [CrossRef]
  22. Dong, J.; Peng, J.; He, X.; Corcoran, J.; Qiu, S.; Wang, X. Heatwave-induced human health risk assessment in megacities based on heat stress-social vulnerability-human exposure framework. Landsc. Urban Plan. 2020, 203, 103907. [Google Scholar] [CrossRef]
  23. Jedlovec, G.; Crane, D.; Quattrochi, D. Urban heat wave hazard and risk assessment. Results Phys. 2017, 7, 4294–4295. [Google Scholar] [CrossRef]
  24. Yang, C.; Kui, T.; Zhou, W.; Fan, J.; Pan, L.; Wu, W.; Liu, M. Impact of refined 2D/3D urban morphology on hourly air temperature across different spatial scales in a snow climate city. Urban Clim. 2023, 47, 101404. [Google Scholar] [CrossRef]
  25. Rizwan, A.M.; Dennis, L.Y.C.; Liu, C. A review on the generation, determination and mitigation of Urban Heat Island. J. Environ. Sci. 2008, 20, 120–128. [Google Scholar] [CrossRef] [PubMed]
  26. Bahi, H.; Mastouri, H.; Radoine, H. Review of methods for retrieving urban heat islands. Mater. Today Proc. 2020, 27, 3004–3009. [Google Scholar] [CrossRef]
  27. Li, Z.-L.; Tang, B.-H.; Wu, H.; Ren, H.; Yan, G.; Wan, Z.; Trigo, I.F.; Sobrino, J.A. Satellite-derived land surface temperature: Current status and perspectives. Remote Sens. Environ. 2013, 131, 14–37. [Google Scholar] [CrossRef]
  28. Pradeep Kumar, B.; Anusha, B.N.; Raghu Babu, K.; Padma Sree, P. Identification of climate change impact and thermal comfort zones in semi-arid regions of AP, India using LST and NDBI techniques. J. Clean. Prod. 2023, 407, 137175. [Google Scholar] [CrossRef]
  29. Binarti, F.; Koerniawan, M.D.; Triyadi, S.; Utami, S.S.; Matzarakis, A. A review of outdoor thermal comfort indices and neutral ranges for hot-humid regions. Urban Clim. 2020, 31, 100531. [Google Scholar] [CrossRef]
  30. Feng, L.; Zhao, M.; Zhou, Y.; Zhu, L.; Tian, H. The seasonal and annual impacts of landscape patterns on the urban thermal comfort using Landsat. Ecol. Indic. 2020, 110, 105798. [Google Scholar] [CrossRef]
  31. Jiang, L.; Xie, M.; Chen, B.; Su, W.; Zhao, X.; Wu, R. Key areas and measures to mitigate heat exposure risk in highly urbanized city: A case study of Beijing, China. Urban Clim. 2024, 53, 101748. [Google Scholar] [CrossRef]
  32. Wang, S.; Sun, Q.C.; Huang, X.; Tao, Y.; Dong, C.; Das, S.; Liu, Y. Health-integrated heat risk assessment in Australian cities. Environ. Impact Assess. Rev. 2023, 102, 107176. [Google Scholar] [CrossRef]
  33. Krstic, N.; Yuchi, W.; Ho, H.C.; Walker, B.B.; Knudby, A.J.; Henderson, S.B. The Heat Exposure Integrated Deprivation Index (HEIDI): A data-driven approach to quantifying neighborhood risk during extreme hot weather. Environ. Int. 2017, 109, 42–52. [Google Scholar] [CrossRef] [PubMed]
  34. Zhang, H.; Chen, Y.; Rui, J.; Yoshino, H.; Zhang, J.; Chen, X.; Liu, J. Effects of thermal environment on elderly in urban and rural houses during heating season in a severe cold region of China. Energy Build. 2019, 198, 61–74. [Google Scholar] [CrossRef]
  35. Xiong, J.; Ma, T.; Lian, Z.; de Dear, R. Perceptual and physiological responses of elderly subjects to moderate temperatures. Build. Environ. 2019, 156, 117–122. [Google Scholar] [CrossRef]
  36. Taczanowska, K.; Tansil, D.; Wilfer, J.; Jiricka-Pürrer, A. The impact of age on people’s use and perception of urban green spaces and their effect on personal health and wellbeing during the COVID-19 pandemic—A case study of the metropolitan area of Vienna, Austria. Cities 2024, 147, 104798. [Google Scholar] [CrossRef]
  37. Wong, N.H.; Tan, C.L.; Kolokotsa, D.D.; Takebayashi, H. Greenery as a mitigation and adaptation strategy to urban heat. Nat. Rev. Earth Environ. 2021, 2, 166–181. [Google Scholar] [CrossRef]
  38. Kumar, P.; Debele, S.E.; Khalili, S.; Halios, C.H.; Sahani, J.; Aghamohammadi, N.; Andrade, M.d.F.; Athanassiadou, M.; Bhui, K.; Calvillo, N.; et al. Urban heat mitigation by green and blue infrastructure: Drivers, effectiveness, and future needs. Innov. 2024, 5, 100588. [Google Scholar] [CrossRef]
  39. Sousa-Silva, R.; Zanocco, C. Assessing public attitudes towards urban green spaces as a heat adaptation strategy: Insights from Germany. Landsc. Urban Plan. 2024, 245, 105013. [Google Scholar] [CrossRef]
  40. Ren, J.; Yang, J.; Zhang, Y.; Xiao, X.; Xia, J.C.; Li, X.; Wang, S. Exploring thermal comfort of urban buildings based on local climate zones. J. Clean. Prod. 2022, 340, 130744. [Google Scholar] [CrossRef]
  41. Qavidel Fard, Z.; Zomorodian, Z.S.; Korsavi, S.S. Application of machine learning in thermal comfort studies: A review of methods, performance and challenges. Energy Build. 2022, 256, 111771. [Google Scholar] [CrossRef]
  42. Zha, F.; Lu, L.; Wang, R.; Zhang, S.; Cao, S.; Baqa, M.F.; Li, Q.; Chen, F. Understanding fine-scale heat health risks and the role of green infrastructure based on remote sensing and socioeconomic data in the megacity of Beijing, China. Ecol. Indic. 2024, 160, 111847. [Google Scholar] [CrossRef]
  43. Stewart, I.D.; Oke, T.R. Local Climate Zones for Urban Temperature Studies. Bull. Am. Meteorol. Soc. 2012, 93, 1879–1900. [Google Scholar] [CrossRef]
  44. Xiang, Y.; Yuan, C.; Cen, Q.; Huang, C.; Wu, C.; Teng, M.; Zhou, Z. Heat risk assessment and response to green infrastructure based on local climate zones. Build. Environ. 2024, 248, 111040. [Google Scholar] [CrossRef]
  45. Chen, G.; Chen, Y.; Tan, X.; Zhao, L.; Cai, Y.; Li, L. Assessing the urban heat island effect of different local climate zones in Guangzhou, China. Build. Environ. 2023, 244, 110770. [Google Scholar] [CrossRef]
  46. Ching, J.; Mills, G.; Bechtel, B.; See, L.; Feddema, J.; Wang, X.; Ren, C.; Brousse, O.; Martilli, A.; Neophytou, M. WUDAPT: An urban weather, climate, and environmental modeling infrastructure for the anthropocene. Bull. Am. Meteorol. Soc. 2018, 99, 1907–1924. [Google Scholar] [CrossRef]
  47. Li, Z.; He, W.; Cheng, M.; Hu, J.; Yang, G.; Zhang, H. SinoLC-1: The first 1 m resolution national-scale land-cover map of China created with a deep learning framework and open-access data. Earth Syst. Sci. Data 2023, 15, 4749–4780. [Google Scholar] [CrossRef]
  48. Yang, C.; Zhu, W.; Sun, J.; Xu, X.; Wang, R.; Lu, Y.; Zhang, S.; Zhou, W. Assessing the effects of 2D/3D urban morphology on the 3D urban thermal environment by using multi-source remote sensing data and UAV measurements: A case study of the snow-climate city of Changchun, China. J. Clean. Prod. 2021, 321, 128956. [Google Scholar] [CrossRef]
  49. Yang, C.; He, X.; Wang, R.; Yan, F.; Yu, L.; Bu, K.; Yang, J.; Chang, L.; Zhang, S. The Effect of Urban Green Spaces on the Urban Thermal Environment and Its Seasonal Variations. Forests 2017, 8, 153. [Google Scholar] [CrossRef]
  50. Yu, W.; Yang, J.; Sun, D.; Xue, B.; Sun, W.; Ren, J.; Yu, H.; Xiao, X.; Xia, J.; Li, X. Shared insights for heat health risk adaptation in metropolitan areas of developing countries. iScience 2024, 27, 109728. [Google Scholar] [CrossRef]
  51. Paranunzio, R.; Dwyer, E.; Fitton, J.M.; Alexander, P.J.; O’Dwyer, B. Assessing current and future heat risk in Dublin city, Ireland. Urban Clim. 2021, 40, 100983. [Google Scholar] [CrossRef]
  52. Hu, K.; Yang, X.; Zhong, J.; Fei, F.; Qi, J. Spatially Explicit Mapping of Heat Health Risk Utilizing Environmental and Socioeconomic Data. Environ. Sci. Technol. 2017, 51, 1498–1507. [Google Scholar] [CrossRef]
  53. Zhu, W.; Yuan, C. Urban heat health risk assessment in Singapore to support resilient urban design—By integrating urban heat and the distribution of the elderly population. Cities 2023, 132, 104103. [Google Scholar] [CrossRef]
  54. Muccione, V.; Biesbroek, R.; Harper, S.; Haasnoot, M. Towards a more integrated research framework for heat-related health risks and adaptation. Lancet Planet. Health 2024, 8, e61–e67. [Google Scholar] [CrossRef] [PubMed]
  55. Kim, Y.; Li, D.; Xu, Y.; Zhang, Y.; Li, X.; Muhlenforth, L.; Xue, S.; Brown, R. Heat vulnerability and street-level outdoor thermal comfort in the city of Houston: Application of google street view image derived SVFs. Urban Clim. 2023, 51, 101617. [Google Scholar] [CrossRef]
Figure 1. Location of Shenzhen city.
Ijgi 13 00367 g001
Figure 2. (a) Spatial patterns of LCZs; (b) area proportions for LCZs; (c) Sino LC-1 in Shenzhen; (d) area proportions for land cover in Sino LC-1.
Ijgi 13 00367 g002
Figure 3. (a) Spatial patterns of LSTs; (b) spatial patterns of reclassified LSTs; (c) area proportions of LST zones; (d) spatial patterns of MTHI; (e) spatial patterns of reclassified MTHI; and (f) area proportions of thermal comfort (reclassified MTHI).
Ijgi 13 00367 g003
Figure 4. Spatial patterns of (a) population density; (b) sensitive population density; (c) area proportion of impervious surface area (ISA).
Ijgi 13 00367 g004
Figure 5. (a) Spatial pattern of HHRs; (b) area proportions of different HHR zones; (c) HHR differences among LCZ types.
Ijgi 13 00367 g005
Figure 6. Linear regression models built for land covers and LST (a1,b1,c1,d1), MTHI (a2,b2,c2,d2), and populations (a3,b3,c3,d3).
Ijgi 13 00367 g006
Figure 7. The relationships between (a) roads, (b) buildings, (c) impervious areas, (d) tree cover, and HHR.
Ijgi 13 00367 g007
Table 1. The main data sources used in this study.
ThemeSourcePeriodResolutionApplication
Landsat 8https://www.gscloud.cn/home (accessed on 15 May 2023)2020,
2022
30 mHazard assessment
LCZhttps://www.wudapt.org (accessed on 8 November 2023)2020100 mImpact on HHR
Land coverhttps://zenodo.org/records/8214871 (accessed on 10 March 2024)20211 mImpact on HHR and vulnerability calculation
Population density (>65 or <14)https://hub.worldpop.org/ (accessed on 12 March 2024)2020100 mExposure and vulnerability calculation
Table 2. Coefficients between land cover, LST, heat risk indicators, and HHR.
Land CoverLSTHazardExposureVulnerabilityHHR
Road0.652 **0.408 **0.486 **0.424 **0.775 **
Tree cover−0.801 **−0.495 **−0.412 **−0.385 **0.693 **
Grassland0.076 **0.0420.069 *0.070 **0.312 **
Cropland−0.0440.075 **−0.240 **−0.210 **0.259
Building0.792 **0.395 **0.475 **0.450 **0.805 **
Barren0.178 **0.120 **−0.126 **−0.125 **0.033
Water−0.207 **0.024−0.125 **−0.117 **0.124 **
Impervious area0.820 **0.428 **0.513 **0.478 **0.848 **
** p < 0.01 (two-tailed). * p < 0.05 (two-tailed).
Table 3. Coefficients between LCZs and LST, heat risk indicators, and HHR.
LCZ TypeLSTHazardExposureVulnerabilityHHR
LCZ10.498 **0.205 **0.515 **0.509 **0.582 **
LCZ 20.469 **0.172 **0.528 **0.499 **0.546 **
LCZ 30.672 **0.337 **0.665 **0.647 **0.725 **
LCZ 40.244 **0.247 **0.497 **0.499 **0.508 **
LCZ 50.232 **0.250 **0.485 **0.494 **0.482 **
LCZ 6−0.0420.167 **0.173 **0.184 **0.138 **
LCZ 80.348 **0.238 **0.230 **0.225 **0.310 **
LCZ 100.757 **0.453 **0.573 **0.553 **0.686 **
LCZ A−0.777 **−0.459 **−0.399 **−0.385 **−0.624 **
LCZ B−0.490 **−0.120 **−0.323 **−0.314 **−0.428 **
LCZ D−0.0020.086 **−0.127 **−0.136 **−0.113 **
LCZ E0.465 **0.275 **0.112 **0.110 **0.265 **
LCZ G0.204 **0.080 **−0.095 **−0.099 **−0.015
LCZ F−0.274 **−0.073 **−0.220 **−0.220 **−0.257 **
** p < 0.01 (two-tailed).
Table 4. Regression results for land cover and HHR and its indicators.
LSTMTHIPopHHR
Land CoverβSig.βSig.βSig.βSig.
Road0.081 0.2210.00
Tree cover−0.1320.00−0.3490.00
Cropland 0.1070.00−0.0710.012
Building 0.874 0.7910.00
Barren 0.2190.00 −0.0650.019
Water
Impervious0.6650.00 0.7510.000.8850.00
Constant36.70 69.38 1813.870 7.903
R0.862 0.521 0.550 0.885
Adjusted R20.742 0.269 0.301 0.782
The color in the table indicates the value of β, where the color scales of red and blue represent high positive and negative values, respectively.
Table 5. Regression results for LCZs and HHR and its indicators.
LCZLSTMTHIPopHHR
βSig.βSig.βSig.βSig.
LCZ1 −0.1330.0000.170.0000.10000.000
LCZ20.0920.000−0.0560.0260.0510.0420.1620.000
LCZ30.2520.000 0.2840.0000.3820.000
LCZ40.0870.0000.1210.0000.2520.0000.3120.000
LCZ5 0.0740.0040.1490.000
LCZ60.0870.0000.1000.001 0.2180.000
LCZ80.1030.0000.0920.000 0.0770.000
LCZ100.3650.0000.2340.0000.1140.0000.3960.000
LCZA−0.3680.000−0.4110.000
LCZB 0.0780.003
LCZD0.0510.000 −0.0790.001−0.0340.021
LCZE0.2890.0000.170.000 0.1610.000
LCZF0.1250.000−0.0630.012−0.0530.025
LCZG−0.1310.000 −0.0490.042
Constant336.626 755.634 1.50132.506
R 0.931 0.625 0.570 0.859
Adjusted R20.866 0.385 0.320 0.736
The color in the table indicates the value of β, where the color scales of red and blue represent high positive and negative values, respectively.
Disclaimer/Publisher’s Note: The statements, opinions and data contained in all publications are solely those of the individual author(s) and contributor(s) and not of MDPI and/or the editor(s). MDPI and/or the editor(s) disclaim responsibility for any injury to people or property resulting from any ideas, methods, instructions or products referred to in the content.

