Abstract
Geodata, geographical information science (GISc), and GeoAI (geo-intelligence workflows) play an increasingly important role in predictive disaster risk reduction and management (DRRM), aiding decision-makers in determining where and when to allocate resources. There have been discussions on the ethical pitfalls of these predictive systems in the context of DRRM because of the documented cases of biases in AI systems in other socio-technical systems. However, none of the discussions expound on how to audit geo-intelligence workflows for biases from data collection, processing, and model development. This paper considers a case study that uses AI to characterize housing stock vulnerability to flooding in Karonga district, Malawi. We use Friedman and Nissenbaum’s definition and categorization of biases that emphasize biases as a negative and undesirable outcome. We limit the scope of the audit to biases that affect the visibility of different housing typologies in the workflow. The results show how AI introduces and amplifies these biases against houses of certain materials. Hence, a group within the population in the area living in these houses would potentially miss out on DRRM interventions. Based on this example, we urge the community of researchers and practitioners to normalize the auditing of geo-intelligence workflows to prevent information disasters from biases.
1. Introduction
Geodata, geographical information science (GISc), and GeoAI are increasingly important in predictive disaster risk reduction and management (DRRM). This collective use of geodata, GISc, and GeoAI (hereafter referred to as geo-intelligence workflows) promises a timely, efficient distribution of limited resources to communities. Exemplar predictive DRRM systems include forecast-based financing and impact-based forecasting, which aid decision-makers in determining where and when to allocate resources before a disaster occurs [1]. However, the significant uptake of such predictive systems has prompted discussions on potential ethical pitfalls, e.g., [2,3] given the documented cases of biases in other AI socio-technical systems, for example, in predicting recidivism [4].
DRRM is inherently a multidisciplinary practice requiring diverse types of datasets, each of which may demand a unique method of analysis. However, the complexity of using multiple datasets and analysis methods amplifies the concern for biases as individual datasets and analysis methods can introduce unique challenges to the geo-intelligence workflow. These challenges affect the reliability and trustworthiness of predictions and, consequently, the decisions that follow. For instance, AI systems (as they relate to GeoAI) are known to replicate, amplify, and reinforce biases present in data, partly due to the autonomy these systems exercise in decision-making [5]. Quintessential examples of biased AI systems include the hiring algorithms that were found to be biased against women, e.g., [6], and the recidivism systems that were identified as racially discriminatory in their predictions of re-offense risk for formerly incarcerated individuals [4].
Specific examples in DRRM applications include the under-representation of buildings in vulnerable areas within building datasets [7] and under-estimation of vulnerable populations when using call detail records for DRRM [8,9]. These biases could lead to critical oversights, resulting in fewer resources directed toward highly vulnerable populations or the misallocation of aid to less vulnerable groups. Such outcomes may not only reduce the effectiveness of disaster response but also exacerbate existing inequalities in aid distribution [10,11].
Moreover, biases in AI decision-making systems have far-reaching social implications. Kruipy [12] argues that biased AI systems have the potential to reconfigure relationships between individuals and between individuals and institutions. Individuals can develop mistrust toward the institutions that deploy biased AI systems, which subjugate them. Furthermore, biased AI decisions can additionally cause tensions between groups as Krupiy [12] notes in the following: “There is a danger that the operation of AI decision-making processes will act as a divisive force.” In the context of biased DRRM geo-intelligence workflows, biases may erode trust between communities and organizations and may increase tensions between communities, see [13]. Therefore, geo-intelligence workflows can result in information disasters, whereby information causes unintended harm to communities.
It is, therefore, critical for DRRM practitioners and stakeholders to interrogate geo-intelligence workflows when they were applied to such sensitive situations. Audits allow the interrogation of whether a system meets the design requirements (design requirements stipulate the desired functionalities and objectives of a system) and does not cause harm to society [14,15]—for example, through replicating or amplifying biases. Auditing for biases is still nascent in GISc and disaster risk management. An example of auditing is by Gevaert et al. [7], who audited global building footprints commonly used in disaster risk management for biases. Their results show that biases could lead to the exclusion of vulnerable households in disaster assistance programs. It is also important to note that auditing in this context is different from the use of geo-intelligence workflows for auditing the built environment (e.g., [16]).
We adopt the bias definition by Friedman and Nissenbaum: “Computer systems that systematically and unfairly discriminate against certain individuals or groups of individuals in favor of others” [17]. Friedman and Nissenbaum [17] developed a framework for understanding biases in computer systems. They categorize a bias as either a preexisting bias, technical bias, or emergent bias. Preexisting biases come from a biased world. For example, from institutional or societal norms that predate the creation of the computer system. A technical bias results from the technical limitations of a computer system. An example of a technical bias is when we try to “give social meaning to algorithms” or “quantify the qualitative”. For example, legal expert systems recommending pleas to defendants assume that the law is not subject to human interpretations and context [17]. While preexisting biases and technical biases occur before and during the design and implementation stage, emergent biases, in contrast, occur during a use phase when there is a change in societal knowledge or values/norms. This shows that the framework is based on a timeline, and biases commonly attributed to AI, e.g., [18] can be classified as per the framework by Friedman and Nissenbaum [17], depending on when they occur. The emphasis here, and as per the definition, is that we do not consider a bias to be a deviation from true estimates but rather how these deviations systematically discriminate against individuals or groups of people. Therefore, we consider biases as a negative and undesirable outcome.
In addition to using the bias framework by Friedman and Nissenbaum [17] to systematically identify biases that occur in the workflow, we use model cards [19] and datasheets [20], drawing inspiration from the Scoping, Mapping, Artifact Collection, Testing (SMACTR) framework by Raji et al. [21]. We use these documents to compare group representations between the models and the datasets and how model performance could disproportionately affect the visibility of groups.
Our objective, therefore, is to audit a flood vulnerability geo-intelligence workflow for biases. We highlight how and where the types of biases occur in the workflow. The case study (discussed in Section 2.1) is an experimental geo-intelligence workflow incorporating disparate geodata datasets and AI. Even though it is experimental for the study area (Karonga, Malawi) and at a higher granularity level (household level), such workflows are already in use for research and DRRM programs by non-governmental organizations, see [22,23]. They are likely to become even more common as the DRRM becomes more anticipatory and predictive. Therefore, this work brings the following issues to the foreground: (i) How biases can emerge in geo-intelligence workflows; (ii) Examples of biased situations to avoid. We highlight stages where workflow biases arise and we untangle biases in data vs. biases in models. Lastly, we holistically evaluate the implications posed by the identified biases. Consequently, this paper bridges the gap between the DRRM literature and the literature on AI ethics.
2. Geo-Intelligence Workflows in DRRM
Risk in disaster risk reduction and management (DRRM) is expressed as a function of hazard, exposure, and vulnerability [24]. The risk function accounts for the multiplicity or frequency of hazards, exposed assets (e.g., critical infrastructures), exposed populations, and the intersectionality of socio-political and socio-economic status that makes population sub-groups disproportionately vulnerable compared to others. Notably, the three components (hazard, exposure, and vulnerability) are encapsulated with the dimensions of location (where) and time (when). Therefore, the data used for DRRM have a location and time reference. The goal of the risk function is to predict the probability of incurring loss [25] given a hazard, the variations in location, and population dynamics, for example, health, income, and food security [26].
Quantification of risk requires granular geodata on all risk dimensions. Different strands of research studying the vulnerability component (e.g., the capability approach and social vulnerability) highlight the necessity of using granular data, see [26,27,28]. For example, Cutter [26] notes that data need to be collected at sub-national levels to be useful. However, granular geodata are often either lacking in many disaster-prone jurisdictions or not readily accessible or shared among different actors or organizations carrying out DRRM [29]. Therefore, DRRM often requires the collection of novel data (e.g., unmanned aerial vehicle (UAV) imagery), the integration of disparate secondary datasets, or a combination of both.
Integrating disparate datasets captures the different aspects of disaster risk and increases accuracy [23]. Common examples include integrating remote sensing (satellite or UAV imagery) and street view images (either from the Mapillary platform or Google Street View). For example, Xing et. al. [23] (quoting costs of field surveys) develop an integrated flood vulnerability assessment framework that uses remote sensing (high-resolution satellite images and deep learning) and street view images. Remote sensing and street view images have also been used for assessing the structural vulnerability of buildings to earthquakes e.g., [30]. Census data (used to infer social vulnerability) have also been integrated with remote sensing in flood vulnerability mapping, e.g., [31,32,33].
Some elements of DRRM (e.g., early warning, early action systems) require near-real-time decision-making, hence the use of automated data science workflows, especially if various primary and secondary datasets need to be combined. GeoAI is increasingly being used to detect or classify objects in remote-sensing images [3,34], for example, damaged building detection after an earthquake [35,36,37] and flood mapping [38]. Geographical information science (GISc) provides methodologies and tools to combine the processed remote sensing images with other geodata and conduct spatial analysis. An example is the spatial distribution of essential services (e.g., health facilities). Following [39], the holistic workflow involving all these processes (remote sensing, GeoAI, and GISc) to plan and execute DRRM interventions, for example, through creating vulnerability maps, is what we refer to as geo-intelligence workflows.
Non-governmental organizations are also exploring how to use geo-intelligence workflows for DRRM. An example is the World Bank’s integration of remote sensing (specifically UAVs), street view images, and OpenStreetMap building footprints to estimate hurricane rooftop vulnerability in St. Lucia [22]. Among the national Red Cross and Red Crescent societies, there is increased use of UAVs at various DRRM stages [40]. An example is by the Philippines Red Cross Society, where UAV data and street view images are experimented with for disaster mapping [41].
2.1. Case Study: Flood Vulnerability Geo-Intelligence Workflow
Malawi, in general, is considered a data-scarce country, and this hinders data-driven DRRM programs [42,43,44]. Data scarcity on housing stock particularly hinders the assessment of the physical vulnerability of communities in Malawi [44]. As a case study, we consider an experimental geo-intelligence workflow in Karonga district (northern Malawi) that characterizes housing stock vulnerability to flooding. Karonga district is prone to riverine and flash flooding [45].
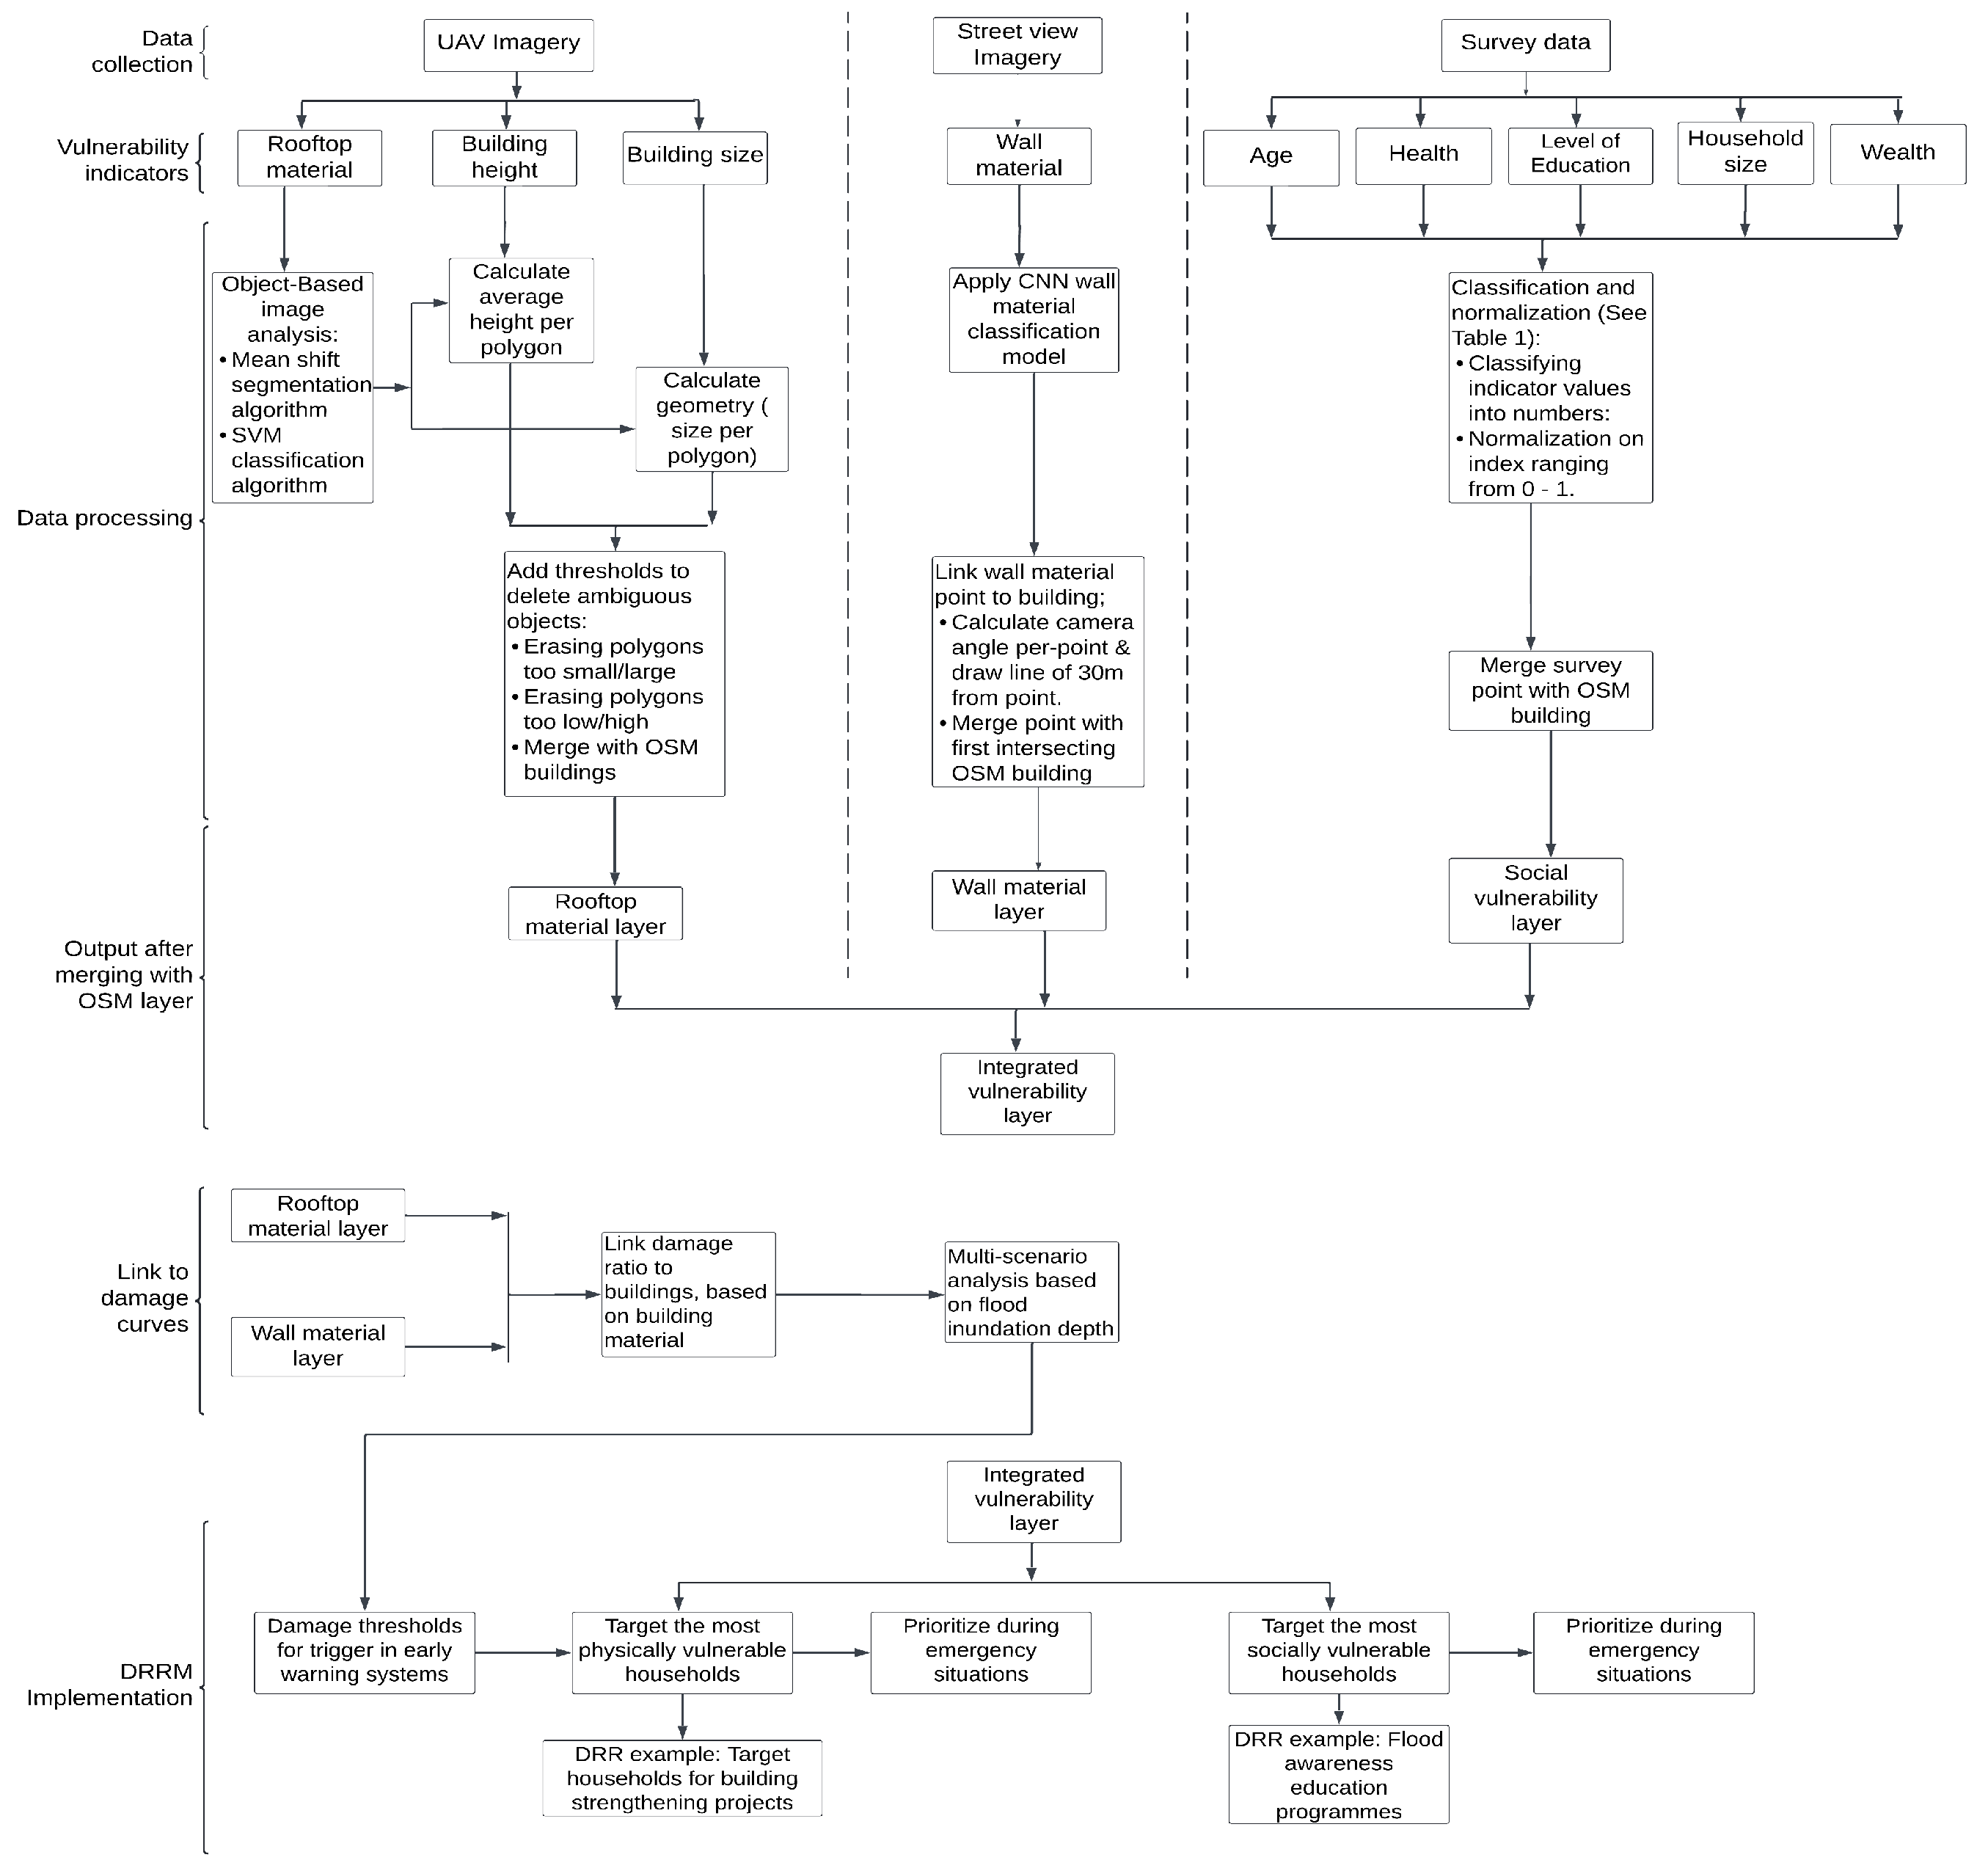
The workflow (represented by Figure 1) combines the use of UAV imagery, street view images, OpenStreetMap (OSM) data, and the Unified Beneficiary Registry (UBR) data (social registry data) to quantify vulnerability to flooding. The UAV imagery and street view images are used to detect the building typology by classification of roof types and wall materials, respectively. The workflow had minimal involvement of data subjects in the data collection of UAV and street view images and data processing.
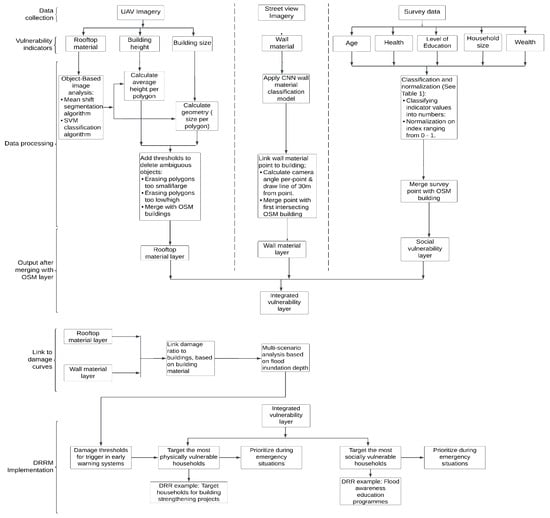
Figure 1.
Geo–intelligence workflowcharacterizing housing stock vulnerability to floods [46].
2.1.1. Workflow Datasets and Vulnerability Indicators
UAV flight plans were constructed for three traditional authorities (Traditional authorities are administrative units in Malawi that are lower than districts) in Karonga–Malawi. A total of 436 images were collected (in the year 2020) in the district as a joint effort between the Malawi Red Cross Society and 510, an initiative of the Netherlands Red Cross (510, an initiative of the Netherlands Red Cross, is a humanitarian organization that supports over 40 Red Cross National Societies in developing countries to improve the speed, quality, and cost-effectiveness of humanitarian aid and disaster risk management by leveraging data and digital tooling). The orthomosaics of the UAV images have a spatial resolution of 0.11 m [46]. The UAV images are used to derive the vulnerability indicators: rooftop material building height and building size.
Street view images were collected in 2020 by enumerators of the Malawi Red Cross Society in both Karonga and Blantyre (a southern city in Malawi). Cameras were mounted on the helmet of a Red Cross volunteer driving a motorbike, and images were captured along the roads in Karonga. The street view images in the southern part of Malawi were captured by a camera on the hood of a car. The street view images are publicly available at https://mapillary.com (accessed on 7 November 2024). Mapillary is a crowd-sourcing platform that allows contributors to upload and share street view images [47,48].
UBR survey data are a social registry on households eligible for social support in Malawi [49]. Data collection for the social registry involves boundary demarcation for districts and traditional authorities and a registration process where the communities in each traditional authority select vulnerable households to be registered. The data contain coordinates and vulnerability indicators for households (i.e., age, health, level of education of household head, and household size). The survey data for this case study cover one traditional authority, and within our audit and research area, the UBR data contained 316 households. These data were used to estimate social vulnerability among households. We assume the household registration process is fair, and the registry is updated regularly.
OSM is a community-driven platform that provides openly available volunteer-generated building footprints [50]. In this case, the OSM data constitute geo-referenced polygons of buildings in Karonga. Moreover, 1400 buildings were delineated in Karonga in a 2020 mapathon from a satellite image captured in 2018. The OSM data are available at https://www.openstreetmap.org (accessed on 7 November 2024).
2.1.2. Data Processing
Object-based image analysis (OBIA) via mean shift segmentation and support vector machine algorithm (SVM) was used on UAV imagery to classify buildings by their roofing materials. Digital terrain models (DTM) and digital surface models (DSM) derived from the UAV point cloud data were used to estimate the height and size of buildings [46]. Polygons that were too small/large or had low/high height were considered non-buildings. Removing such polygons improves the accuracy of separating buildings from the bare ground and flooded plains, which have a color similar to that of roof materials. The polygons were then merged with the OSM building footprint. This process outputs the identified buildings classified by their roof materials, either thatch or iron-sheet roofs.
To classify buildings by their wall materials, a convolutional neural network (CNN) was trained and tested on 1812 street view images from Blantyre (889 images) and Karonga (923). Three volunteers annotated each image, and the final labels were chosen by majority voting (where 2 out of 3 volunteers had to agree on a label). The volunteers (occupations unknown) were recruited from Amazon Mechanical Turk (AMT) and labeling was performed on the same platform. Repeated labeling and majority voting were used to tackle the known data quality drawbacks of using AMT, for example, malicious worker spamming [51] and human error. Majority voting has been proven to be a simple and effective method of ensuring the quality of crowd-sourced labeling, for example, [52] state that majority voting can tackle a lack of expertise and human error. The quality of labels was assessed based on a random sample and found to be of good quality. The model was then trained and evaluated on the labeled images.
The model is based on a residual learning architecture with 50 layers (ResNet50) pre-trained on the ImageNet dataset [53], to which two fully connected layers and a classification layer were attached. The weights of the last three layers were re-trained on the street view images. The ResNet50 layers were not re-trained on the street view images. After classification, the street view images were linked to the OSM building footprint and the corresponding rooftop material from the OBIA classification.
The indicators in the UBR dataset were divided into categorical values (see Table 1) and standardized [46] to derive the social vulnerability layer. The social-vulnerability score for each household is derived by averaging the standardized scores of the indicators. Since each household in the UBR dataset has coordinates, this is linked to the OSM building footprint and the output of the rooftop classification and street view classification.

Table 1.
Minimum and maximum categories of the social indicators from the UBR dataset [46].
Each building was grouped as permanent, semi-permanent, or traditional for later use in deriving the integrated vulnerability layer: Permanent if the building had both iron roofs and bricks/concrete as building materials, traditional if the building had thatched roofs and walls considered as non-permanent (e.g., mud), and semi-permanent if it had a combination of permanent and traditional building materials [46]. These three building groups are commonly used to describe building typologies and damage curve construction in Malawi [44,54].
The integrated vulnerability score combines both physical and social vulnerability scores. Table 2 is used as a ranking schema to determine the integrated vulnerability score of each household based on both the building typology (i.e., traditional, semi-permanent, or permanent) and the social vulnerability score. The build typologies are first assigned a rank score of 1 to 3. Permanent house typologies are assigned a rank of 1 because they are less vulnerable to damage due to flooding. In contrast, traditional house typologies are ranked 3 because they are most susceptible to flood damage. The social vulnerability score from the previous steps is categorized into a rank score of 1 (low social vulnerability) to 5 (high social vulnerability). Therefore, within each building typology, there is variation in social vulnerability. Finally, the socio-physical vulnerability is computed by dividing the social vulnerability index (Table 2) by the total number of ranks (15). This division standardizes the socio-physical score from 0 to 1 so that households living in permanent build typologies would have a low integrated vulnerability score compared to semi-permanent and traditional build typologies, which are expected to be vulnerable to flood damage.

Table 2.
Ranking schema that combines physical vulnerability score and social vulnerability score to obtain the integrated vulnerability score. This table shows that semi-permanent and traditional building typologies are considered more vulnerable to flooding compared to permanent building typologies.
2.1.3. Flood Damage Curves
Flood damage curves estimate the probability of damage to expect for buildings of different materials at various levels of flooding [46]. The workflow used CAPRA (Comprehensive Probabilistic Risk Assessment) an open-source platform to calculate damage probabilities at different flood levels [55]. Flood damage curves enable decision-makers to understand the extent of building damage to expect at different levels of flooding. Damage curves are based on building typologies aggregated into traditional, semi-permanent, and permanent.
2.1.4. DRRM Implementation
Operationalizing the workflow for DRRM would include pre-disaster preparation and trigger warnings for damage levels, thus targeting the most physically vulnerable households for building strengthening projects and the most socially vulnerable in flood awareness programs. The workflow aids in post-disaster response measures by prioritizing both physically and socially vulnerable households.
2.2. Case Study Ethical Concerns
The case study described above uses multiple datasets and processing methods. Each dataset and processing method comes with its challenges (e.g., under-representation) that can inadvertently favor some groups over others. For example, Fan et al. [56] highlight how irregular coverage, under-representation, and data quality in street view images can induce biases in mapping urban environments. In addition, biases have also been known to occur in remote sensing techniques, for example, in land use characterization using satellite imagery [57] and in building damage assessments [58].
The workflow also poses privacy concerns. Vulnerability mapping at an individual household level based on socio-economic status (which includes proxies for health) is a concern when unauthorized people can view the maps. In addition, data with personal information (such as the UBR) require extra data protection measures to limit re-identification and preserve the autonomy of the data subjects. These datasets also pose group privacy concerns [59].
3. Methodology
3.1. Types of Biases
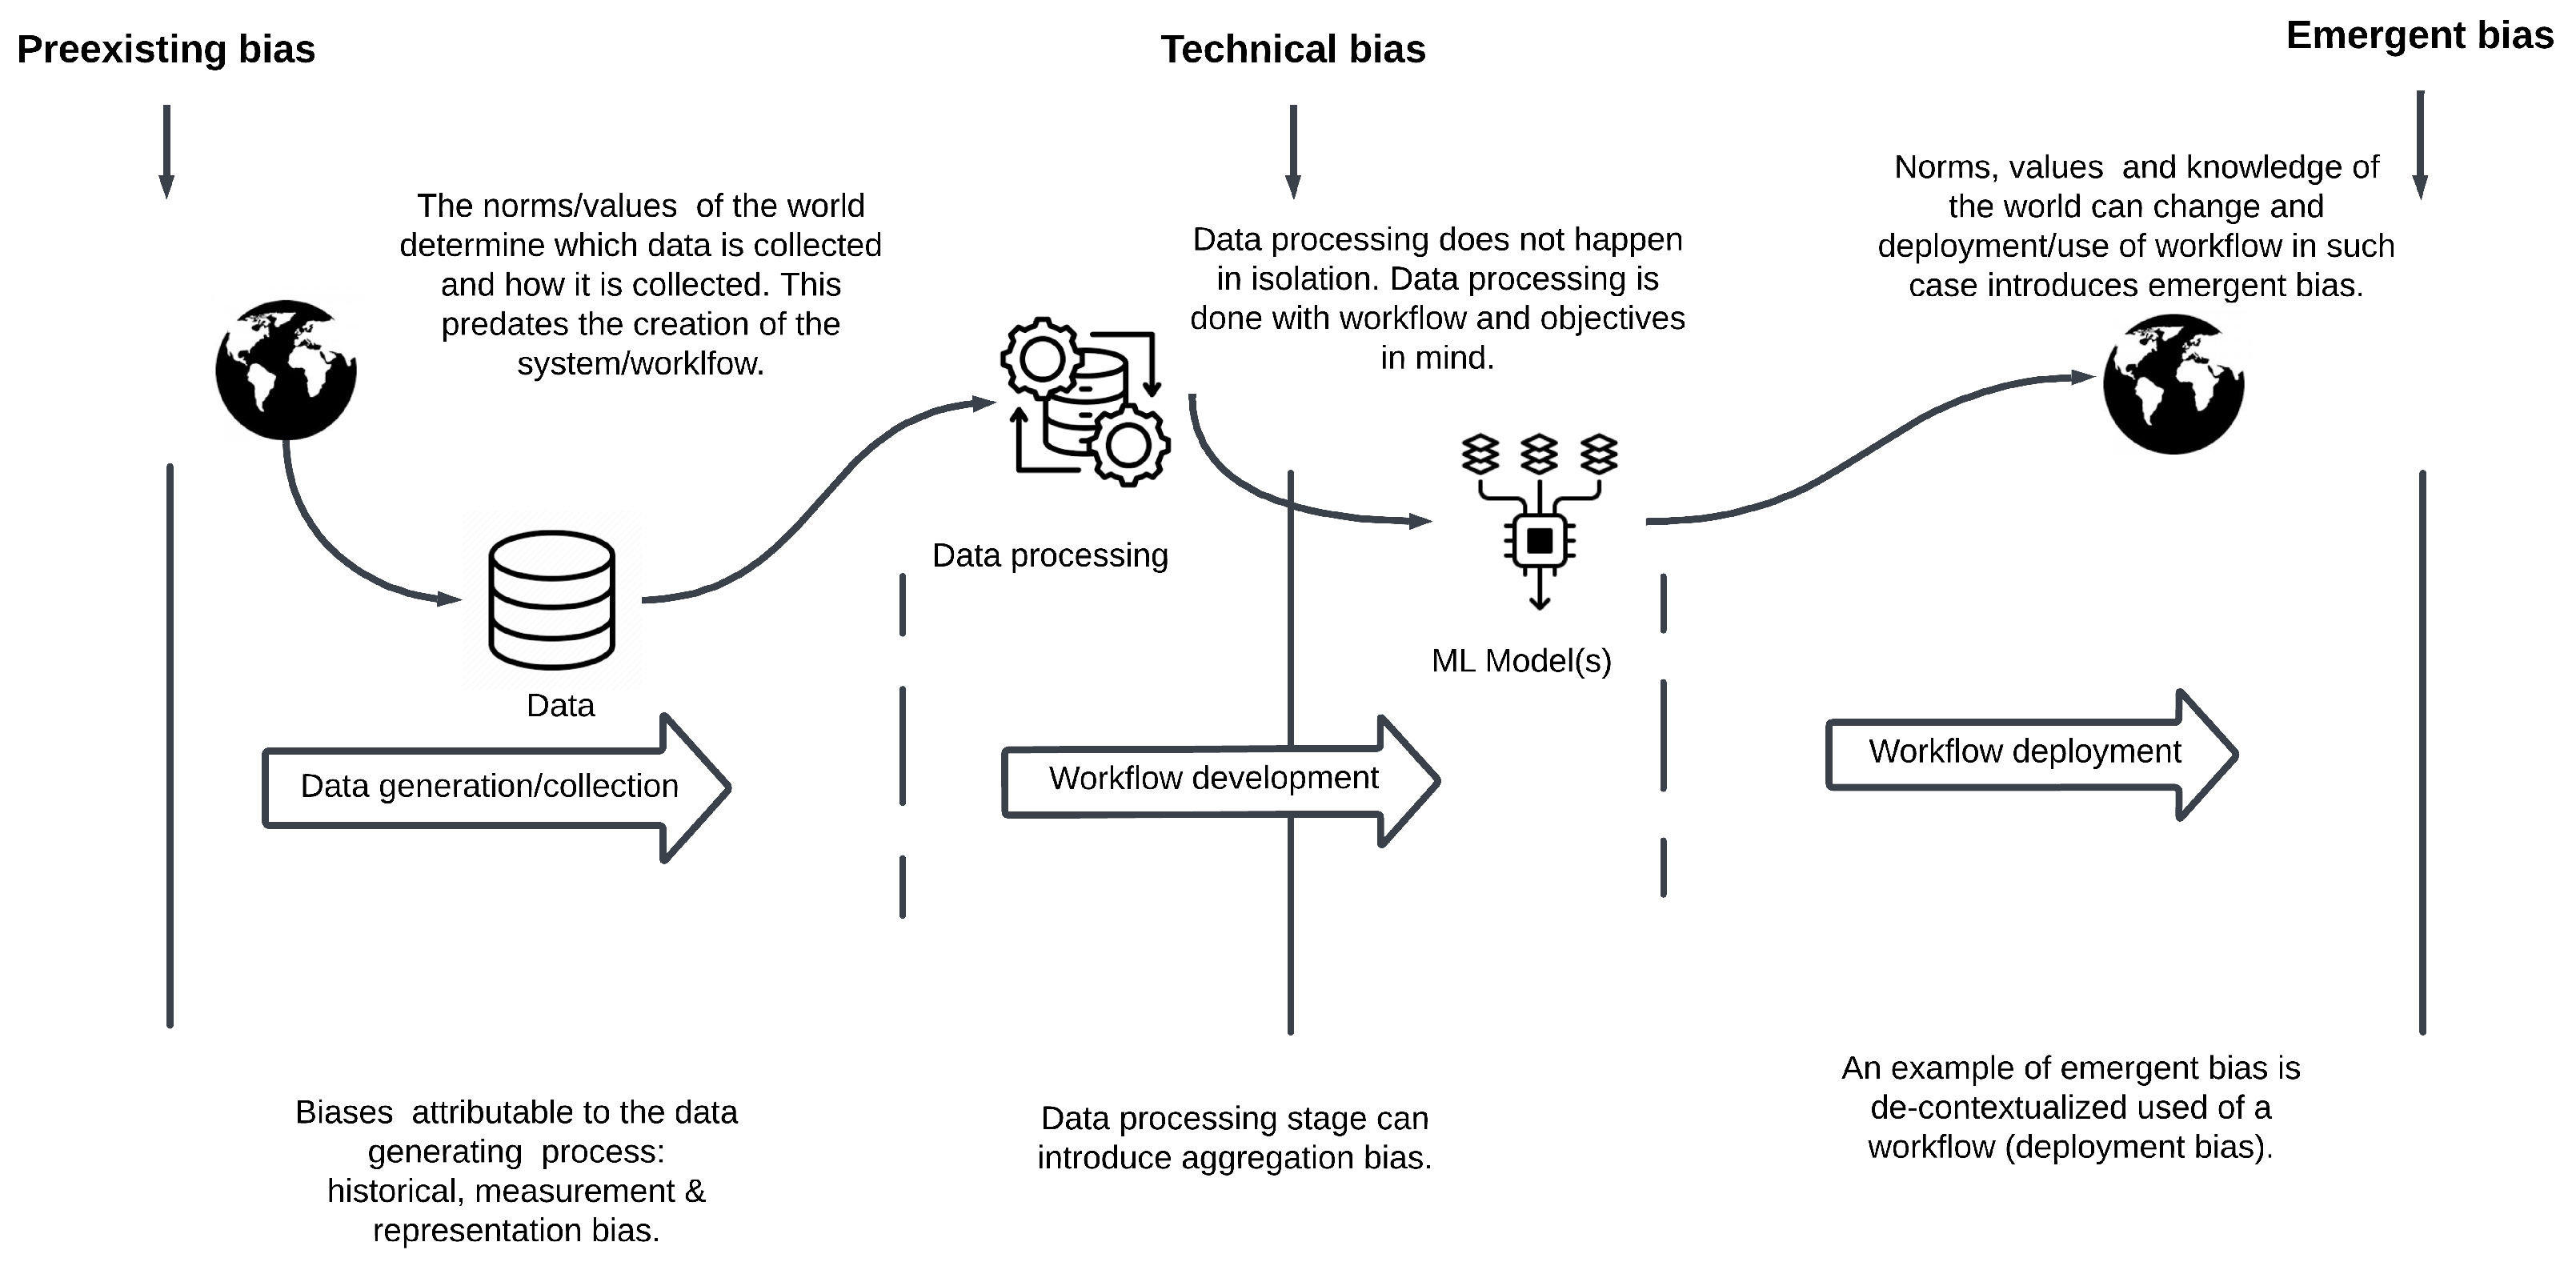
The framework by Friedman and Nissenbaum [17] categorizes biases by defining biases that occur before the development (preexisting bias), during development (technical bias), and after development or during the deployment (emergent bias) of a system. Other variants of biases (for example, the 23 biases discussed by Mehrabi et al. [60]) can be categorized into Friedman and Nissenbaum’s framework, depending on when they occur in the life cycle of a system and the circumstances under which they occur. For example, data biases (e.g., representation bias) resulting from a biased world (the data-generating process) are considered preexisting biases because the biases are independent and antedate the development of the system. However, if technical limitations influence the data processing with biased outcomes, then that becomes a technical bias. Suresh and Guttag [18] present a similar framework of understanding biases, showing how nuanced bias types emerge and are replicated through the different stages in data-driven AI systems. They find that a historical and representation bias in data usually precedes the development of an AI system, while an aggregation bias occurs at the development stage.
To untangle biases in the data vs. models used in the geo-intelligence workflow, we follow the frameworks by Friedman and Nissenbaum [17] for a concise definition of biases and Suresh and Guttag [18] for a more nuanced discussion on biases. In general, data biases would be attributed to the data-generating process pre-dating design/conceptualization of the system while model/workflow bias are as a result of the design choices and technical limitations (including when/how they affect data quality after data processing). Figure 2 shows how the frameworks by Friedman and Nissenbaum [17] and Suresh and Guttag [18] can be used to differentiate between types of biases and biases in data vs. biases in the models.
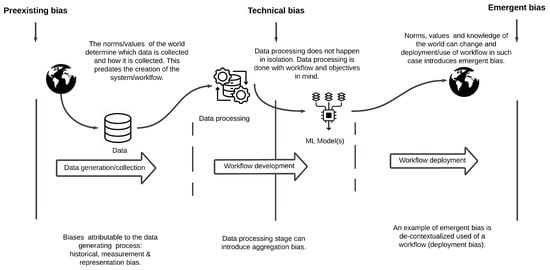
Figure 2.
Coalescing results from Friedman and Nissenbaum [17] and Suresh and Guttag [18] to show how to differentiate between types of biases, biases in data, and in models. The diagram shows where biases emerge and that biases in early stages can have a cascading effect (i.e., be replicated, reinforced, and amplified) in later stages.
In this paper, we limit the discussion to representation and aggregation biases because these biases affect the composition and visibility of different groups in the respective datasets and in the overall workflow. Because the purpose of the workflow (Figure 1) is to identify and characterize building typologies, it then follows that the various building typologies are the groups of interest with respect to our definition of biases.
Representation bias occurs in the data generation process or data collection. A bias arises when the sample used does not represent the population well. As explained by [18], this can occur in three ways: a mismatch between the target population and the used population (that is the population where the model would be used), underrepresented groups of people, and an uneven sampling strategy. One way of detecting a representation bias is to juxtapose the group representations in the data to the real-world scenario, which can show missing sub-populations. Furthermore, calculating the frequencies of a variable that represents various groups across other related variables can show the presence of a representation bias (e.g., how many people belonging to group X are represented in variable Y).
Aggregation bias occurs when it is assumed that the trends in the overall population apply to its distinct subgroups or to individuals [18,60]. An aggregation bias becomes more of a problem when there is a representation bias as minority groups would often be aggregated into larger groups [18].
3.2. Auditing
To audit the flood vulnerability geo-intelligence workflow, we assembled information on the datasets (i.e., how they were collected, purpose, and composition) and the model performance for the AI models that classify buildings by roofing materials in UAV images and facade materials in street view images. Drawing inspiration from the auditing framework Scoping, Mapping, Artifact Collection, Testing and Reflection (SMACTR), we use model cards proposed by Mitchell et al. [19] for transparent AI model reporting and datasheets by Gebru et al. [20] for detailed data documentation. These documents (model cards and datasheets) facilitate the auditing for biases by showing model performance for the building classification models (which are proxies for physical vulnerability) and describe in detail the collection, composition, processing, and purpose of the datasets, respectively. Comparing the model cards to the corresponding datasheets shows which group of building typologies are not adequately represented or made invisible by either representation or aggregation biases.
This method of auditing for biases offers a fast, inexpensive, simple, and yet effective way of auditing. This is because model cards and datasheets are relatively easy to assemble during data collection and model development. Separately auditing the data and models enables auditors to pinpoint the source of the biases. Furthermore, since they are becoming an accepted standard practice, assembling datasheets and model cards comes at no extra cost. This is in comparison to adversarial testing where one would need to set up an experiment (e.g., synthetic data generation) to simulate the model behavior under a wide range of data than offered by the train-test data sample used for model development, e.g., [61].
4. Model Cards and Datasheets
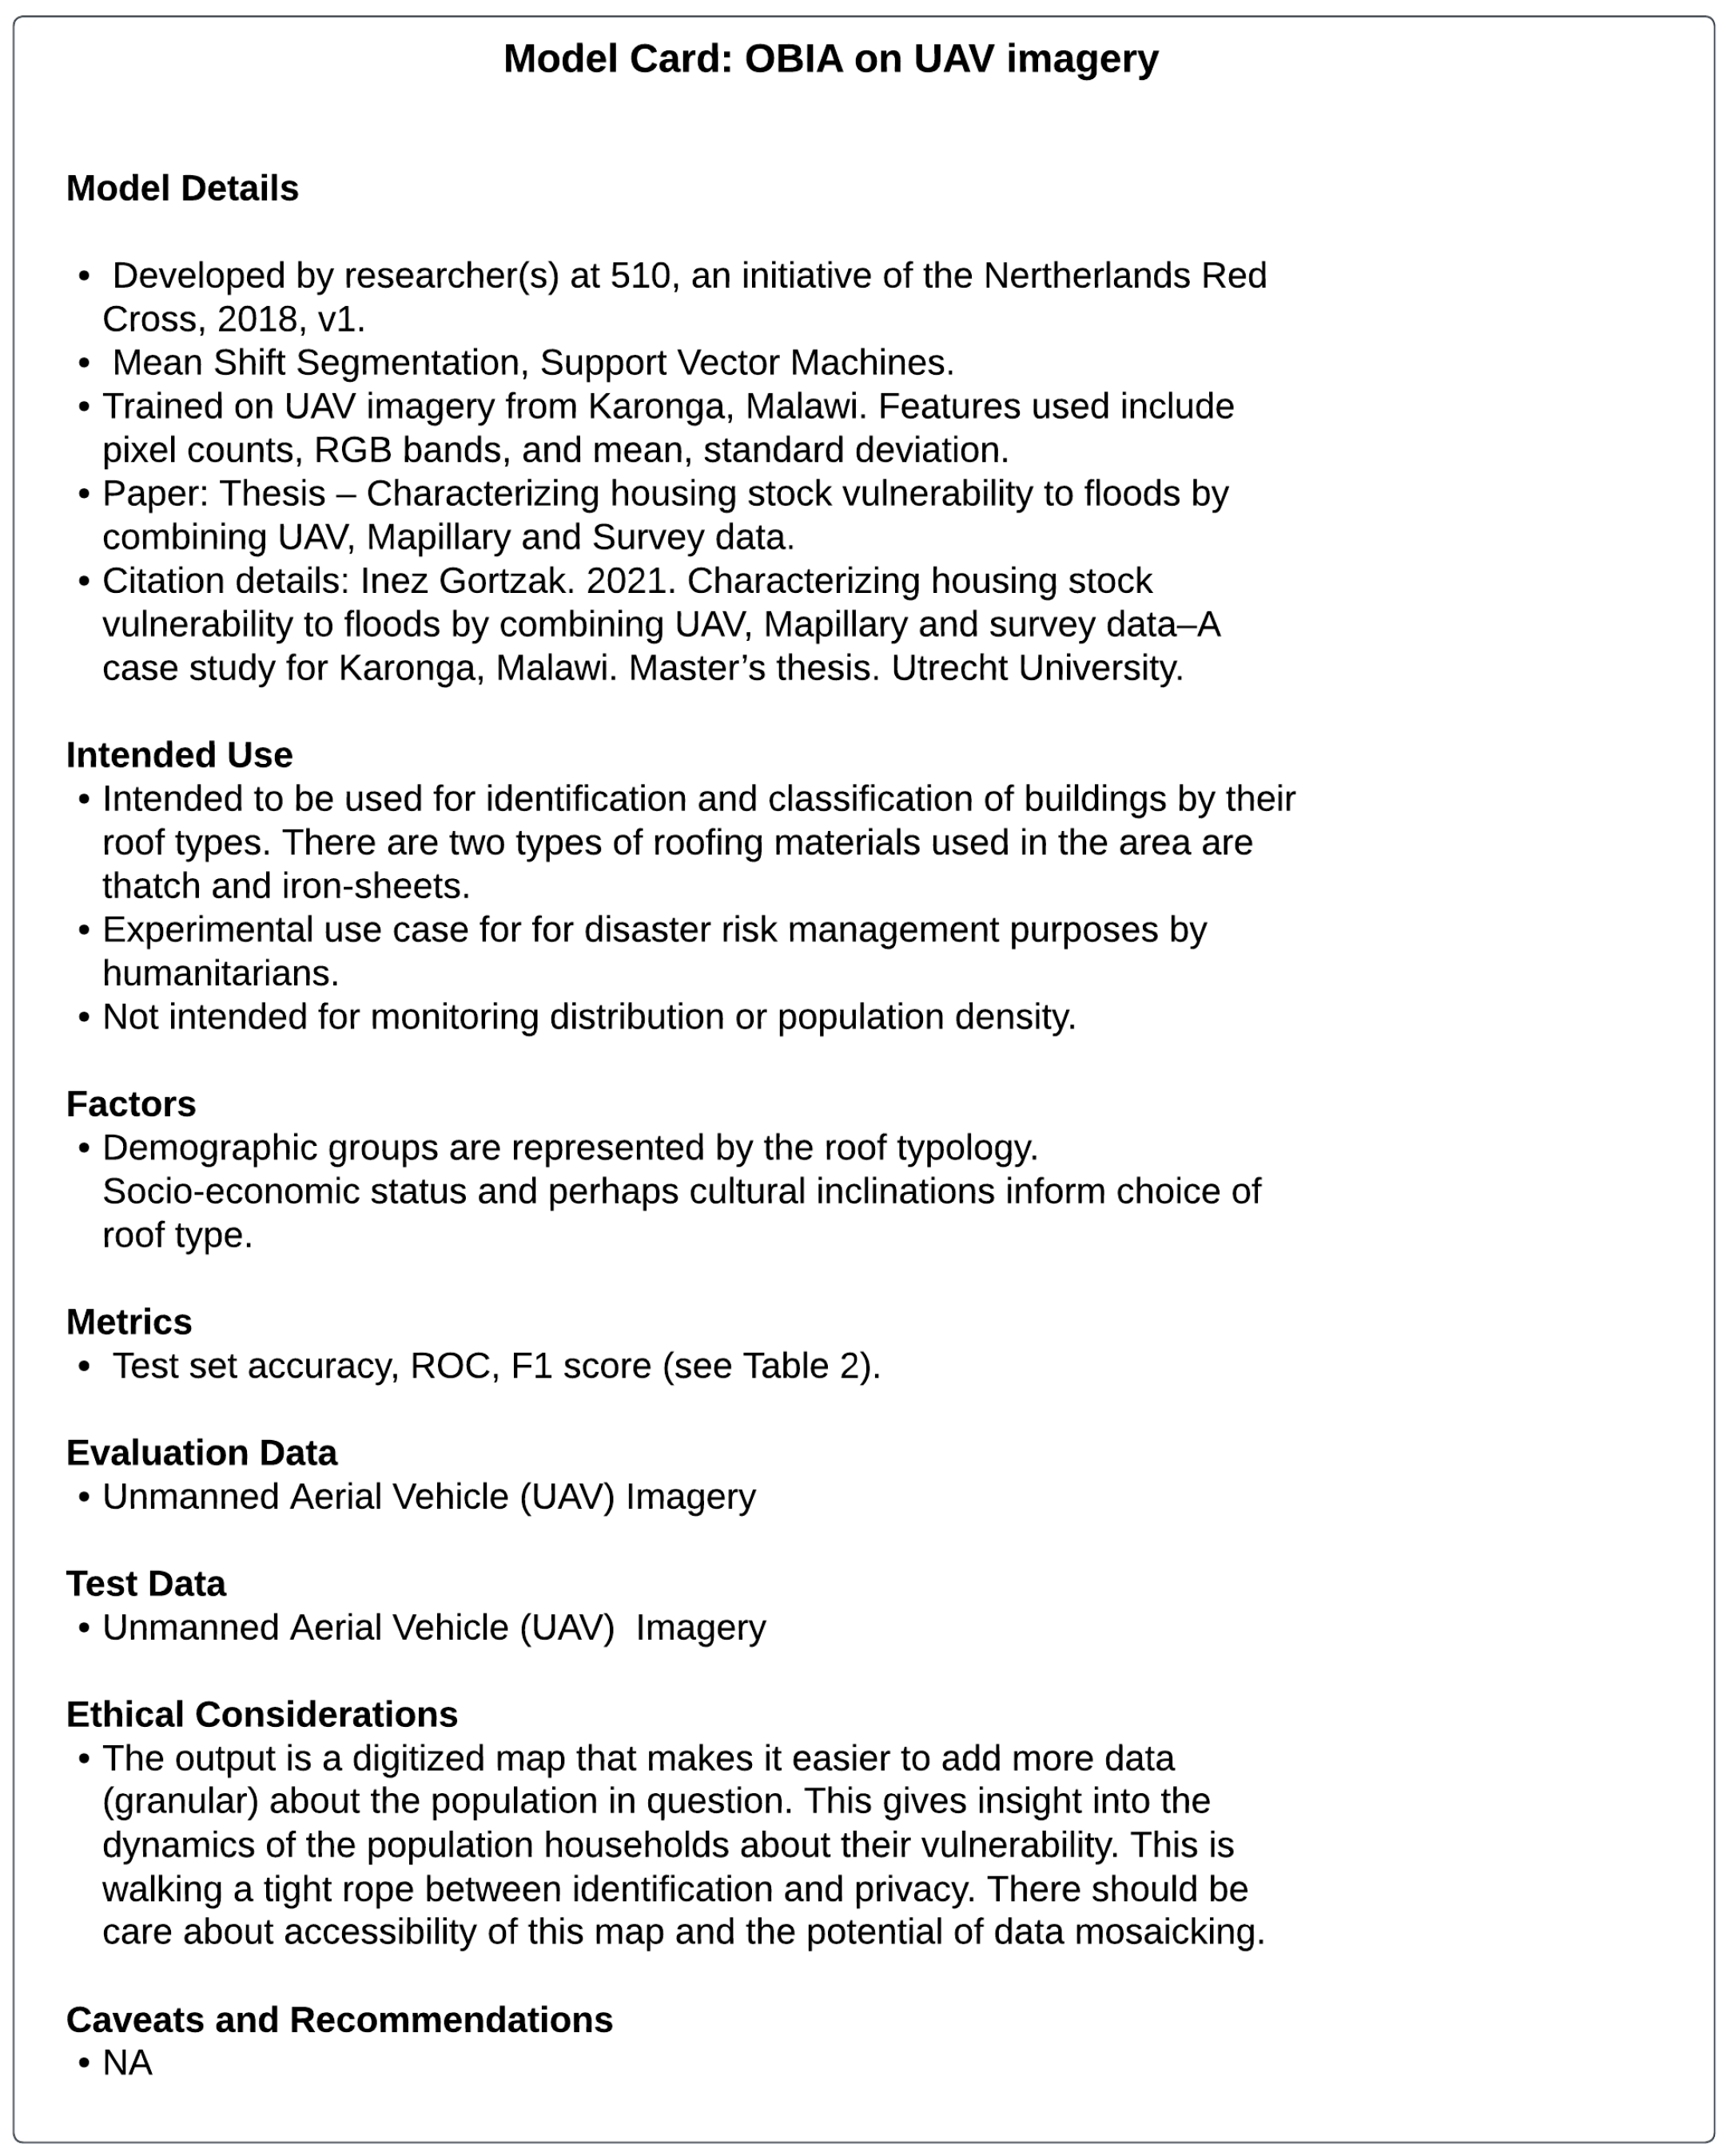
Table 3 and Table 4 give the reported metrics of the wall and roof classification algorithms, respectively. The detailed model cards are in the appendix. Figure A1 gives the model card for CNN used to classify wall materials, while Figure A2 reports the model cards of the roof classification algorithm.

Table 3.
Wall material classification metrics (CNN).

Table 4.
Roof type classification metrics (OBIA) [46].
We present detailed datasheets in the appendix of the following datasets: UAV imagery (Karonga) in Figure A3, street view images (Figure A4), household survey data (Figure A5), the unified beneficiary registry data (Figure A6), and the OSM data (Figure A7). The use of each dataset in the geo-intelligence workflow is described in Section 2.1. For auditing the building facades, we use the household survey data (datasheet Figure A5). Enumerators recorded the building materials used by each household they interviewed during the household survey. The survey was conducted in one traditional authority in Karonga. The household survey data gives reliable information on the build types commonly used in Karonga, Malawi.
5. Results
5.1. Representation Bias
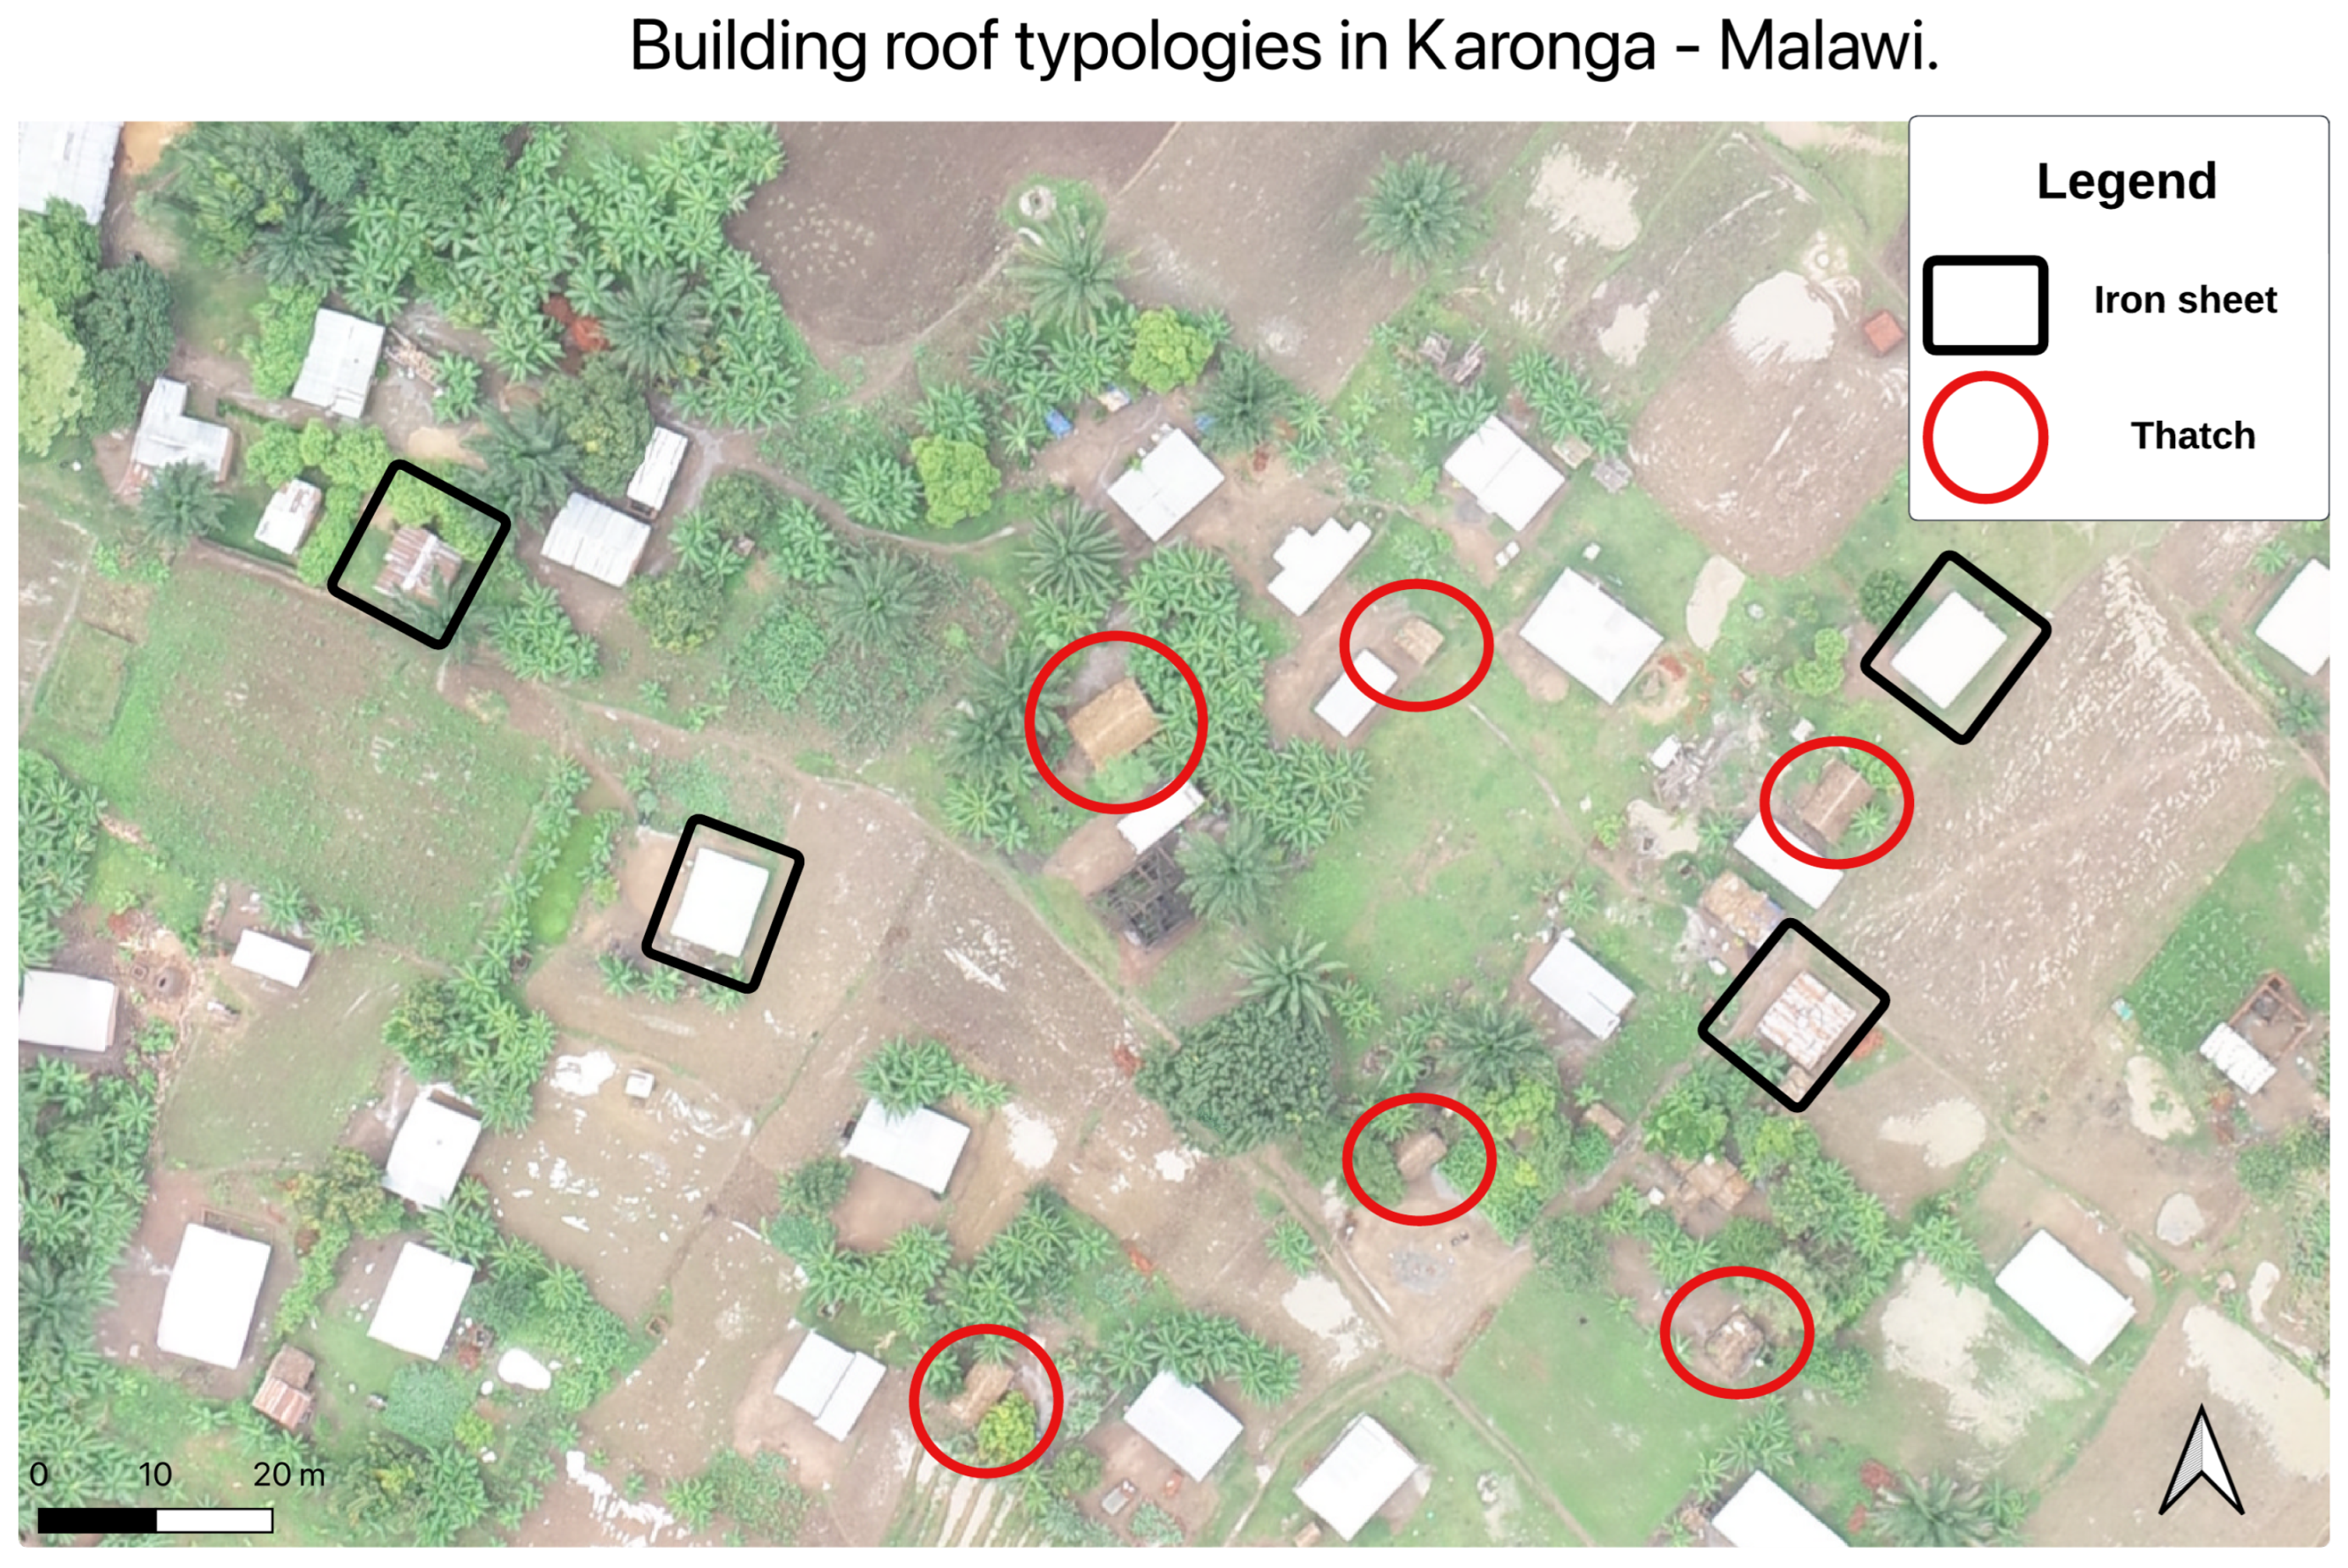
The UAV imagery had fewer thatched rooftops than iron rooftops (approximately 40 out of the 1451 buildings). Though this is the reality on the ground and, therefore, not a data bias, the class imbalance and the similarity between thatched roofs and the bare ground made it difficult to classify thatched roofs. The representation bias materializes in the workflow as a result of low identification rates of thatched-roofed buildings. Despite the high overall accuracy (0.81), the thatched roof class had a lower precision (model performance in identifying a thatched roof even if the prediction is wrong—0.67) and recall (model performance in correctly identifying a thatched roof—0.49) (Precision and recall range from 0 to 1) compared to iron sheet classification (see Table 4). The disparity in classification accuracy of roof materials has a ripple effect on the workflow; households living in buildings with thatched roofs would be missed at a higher rate in the workflow compared to households living in buildings with iron sheet roofs, thus causing a representation bias in the outcome of the geo-intelligence workflow. This instance of bias can be classified under the broad category of technical biases as the human eye can easily identify and distinguish between the roof types despite an imbalance in samples between the two roof typologies. Figure 3 shows examples of thatched roofs and iron sheet roofs in Karonga.
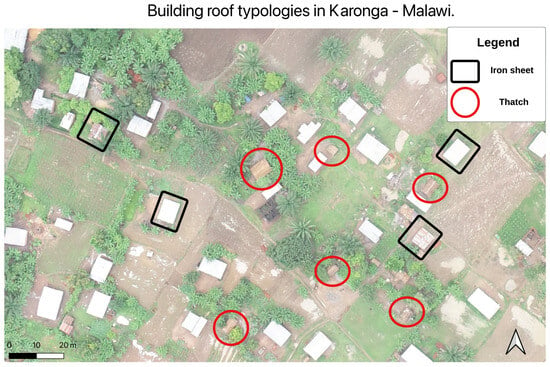
Figure 3.
A map of an area in Karonga showing the different roof types.
Regarding the classification of wall materials, the training data comprised street view images collected in both Blantyre (a city in the south of Malawi) and Karonga. The training data were labeled as either concrete, bricks, corrugated metal sheet, steel, glass, wood, thatch/grass, or “unclear”. Corrugated metal sheet, steel, glass, wood, and thatch/grass classes were the minority classes—about 5% of the data. Unclear images were about 20% of the data. Due to poor image quality and a high-class imbalance, the CNN model was only trained to classify between two building materials, bricks and concrete. The evaluation of the model was based on the ability of the model to classify between bricks and concrete (see classification metrics in Table 3). Yet, from the household survey data (which we consider as ground truth data), concrete does not seem to be a common building material used in Karonga. It is likely a common building material in Blantyre (see Table 5).

Table 5.
A comparison of the class labels in the CNN classification and household survey data from one traditional housing area. This table shows the diversity of wall facades in Karonga.
Furthermore, the frequencies of the building materials in the traditional authority (Table 5) indicates that more materials are used to construct facades. In this particular traditional housing area, approximately 26% of households (from a sample of 955) were non-brick (or mixed materials). These households become invisible in the workflow due to a representation bias in the algorithm’s training data. If the algorithm is used to classify the unrepresented building typologies, they would be misclassified (as either brick or concrete) and assigned to an unsuitable vulnerability group. Extrapolating to the larger Karonga district, we can expect similar trends in the building materials used for facades. This is an unjust situation as the households living in buildings constructed of mud/bamboo are equally deserving of recognition and aid intervention, if not more so than the other groups.
Class imbalance is a well-studied problem in machine learning. Guo et al. [62] give two situations that result in class imbalance. It could occur naturally, such as in rare events or as a result of sampling. Sampling is always constrained by funding, and it may be more expensive to collect more data on the minority class [63]. The minority classes in the sample are, in many machine learning applications, the group of interest [63] in the classification. For example, ref. [64] report five fraud instances in 300,0000 transactions in their work on fraud detection in banking. More examples include detecting oil spillage along coasts from satellite images [65] and classifying medical images for diagnostics e.g., [66]. In the context of the flood vulnerability geo-intelligence workflow, it is optimized to prioritize those living in semi-permanent and traditional housing, including build types in the minority classes in the dataset. In the wall classification model, it is essential to note that even if the minority classes were accounted for in the training, due to the class imbalance problem, we would be concerned about the performance if effective class-balancing methods were not employed. A similar case applies to class imbalance (“rarity”) of thatch roof types in the UAV imagery.
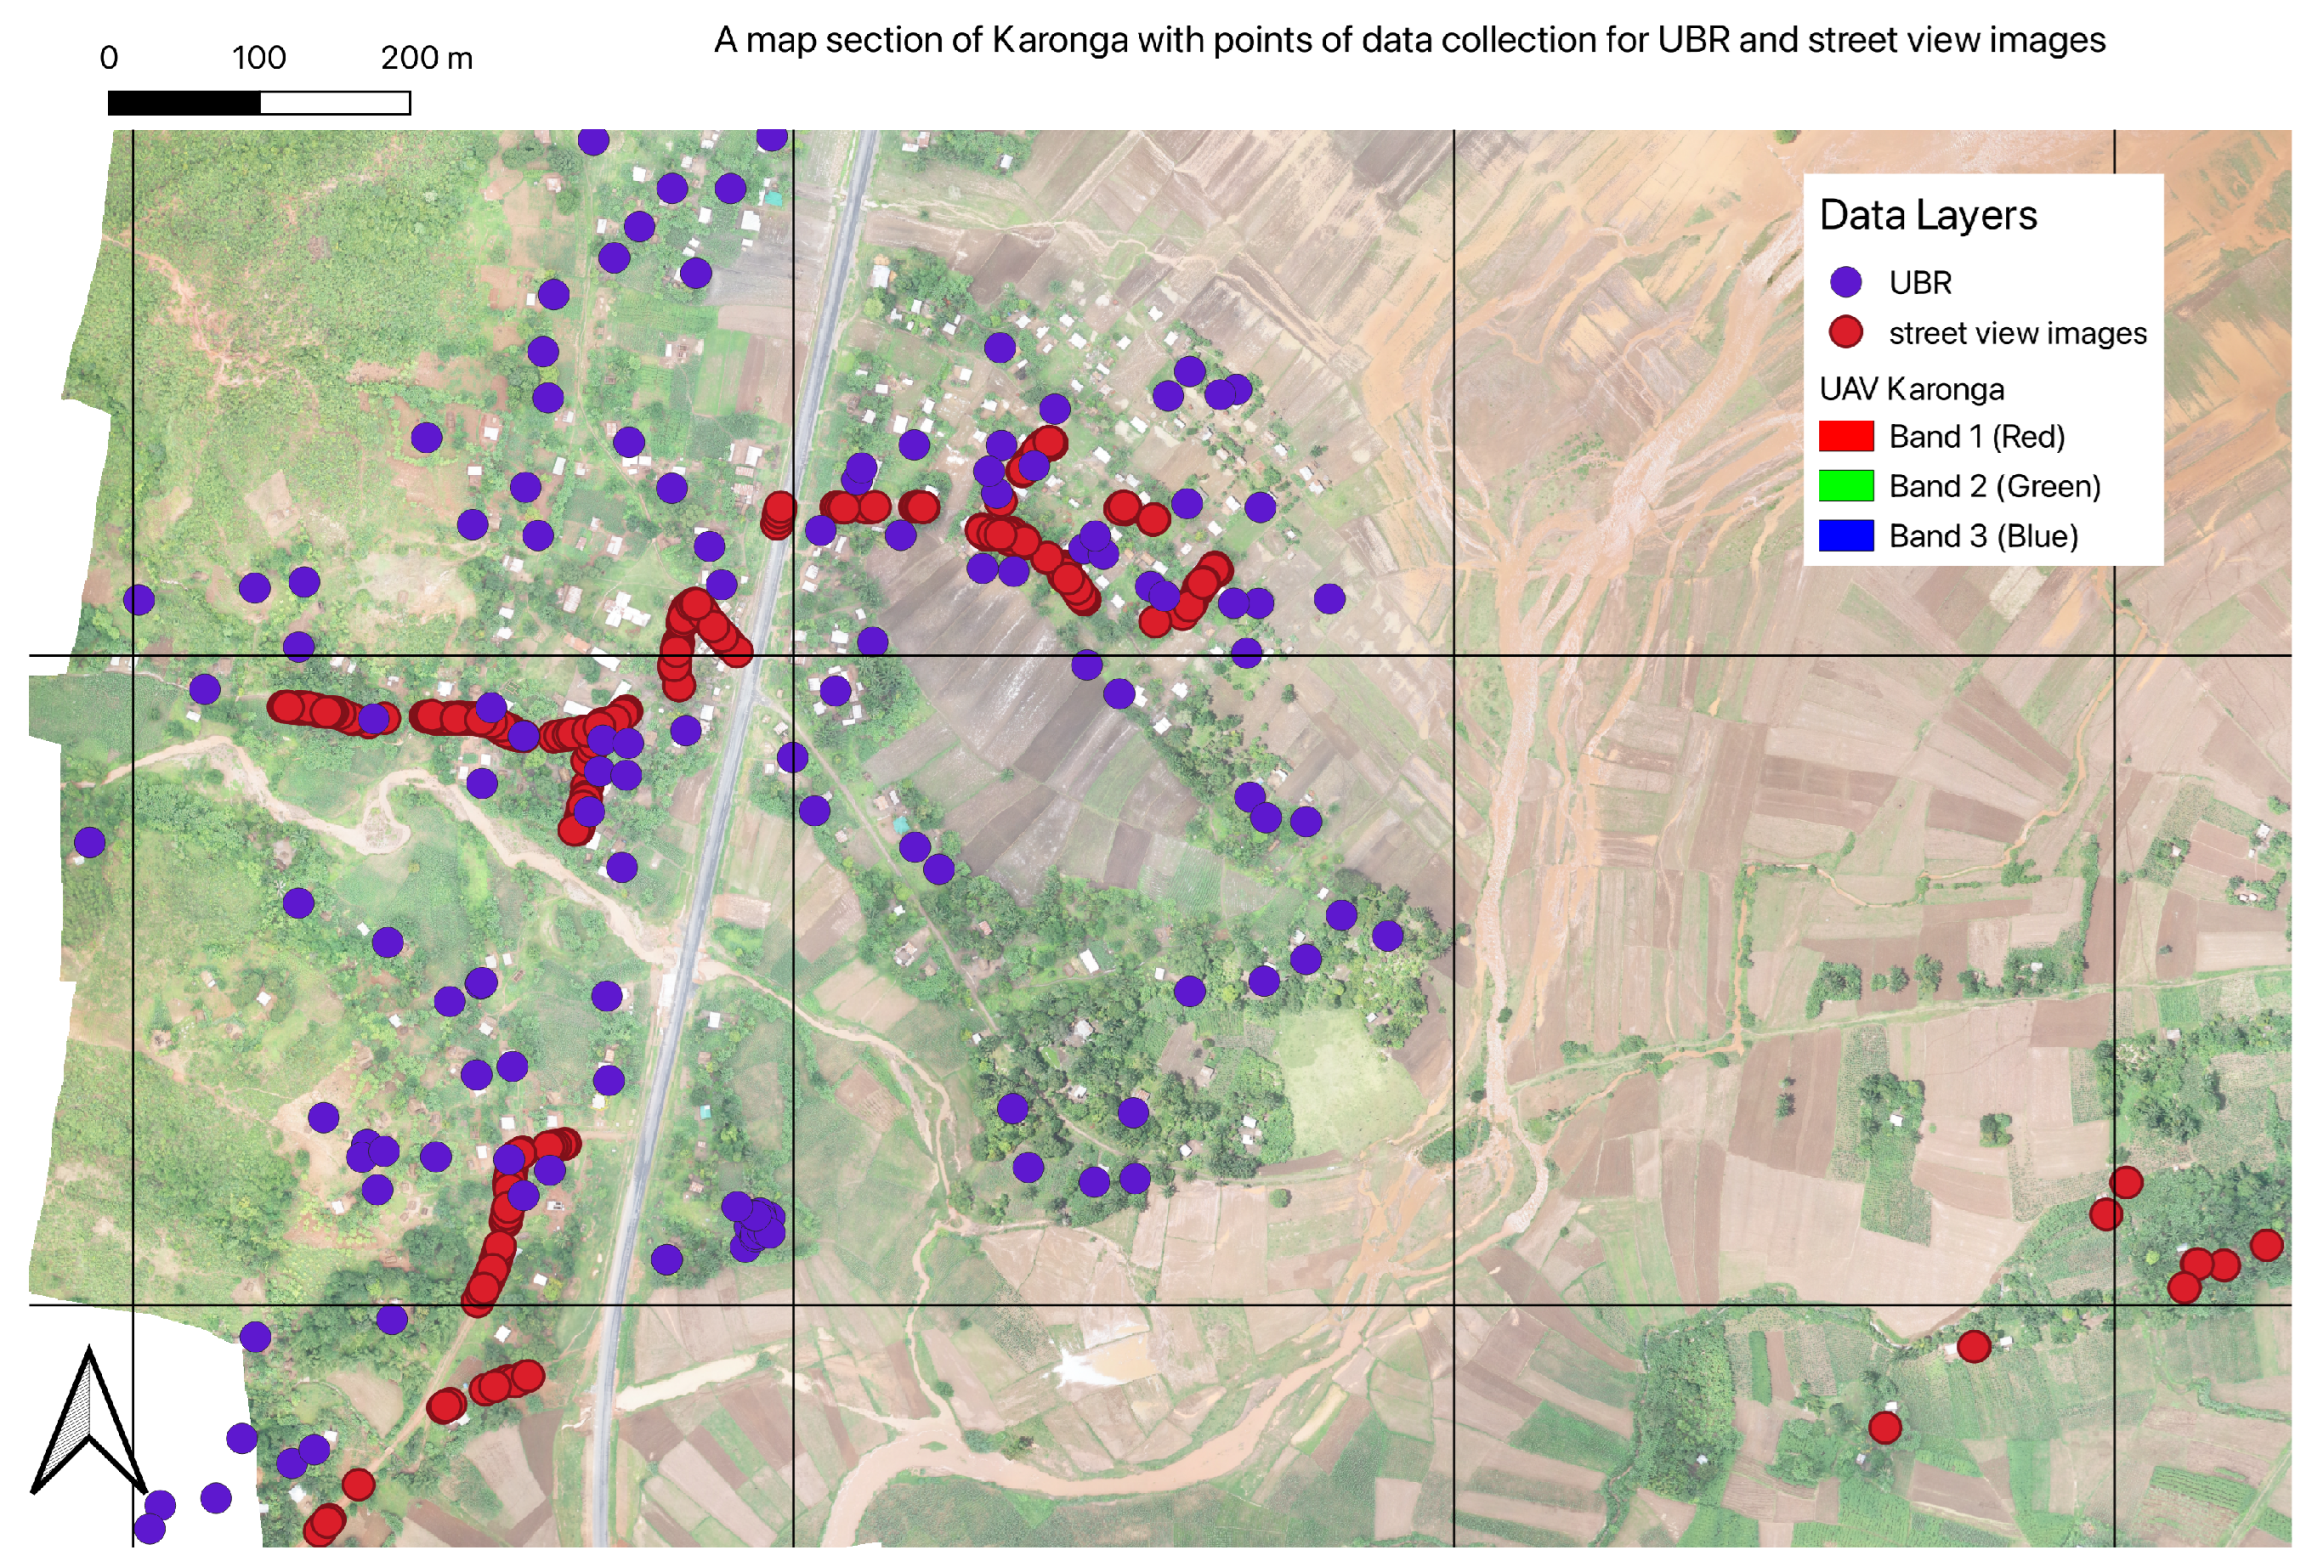
Furthermore, we noted that the collection of street-view images did not cover the entire study area, covering some parts more than others. This low coverage caused a low overlap with the UBR data needed for social vulnerability scoring (see Figure 4). The low coverage is a limitation of the workflow (in the data collection stage) that generally affects the total number of households that can be fully characterized based on physical and social vulnerability.
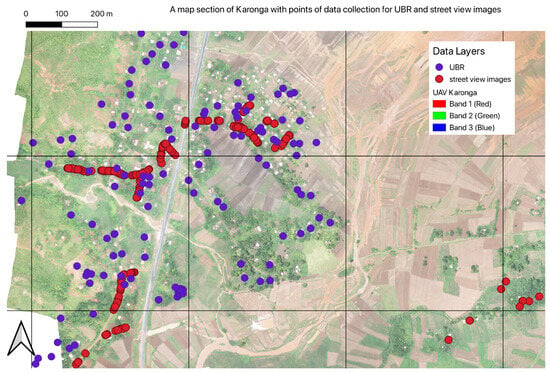
Figure 4.
Coverage between the UBR data and street view images. Purple points represent the UBR data, while red points represent the point of collection of street-view images.
5.2. Aggregation Bias
Aggregation bias concerns arise from the groupings of buildings by their house materials (see Table 6). We find that the semi-permanent category hosts many building materials (at least nine different combinations). For example, a building with a thatched roof and brick walls would be classified as semi-permanent. Similarly, a building with an iron sheet roof and a combination of bricks/concrete with mud/bamboo/grass would be classified as semi-permanent. Both are assigned the same physical vulnerability rank in the damage curve model. However, the first example (thatch and brick walls) is not necessarily unfair or unjust since it would give attention to a household that may not need as much. This is because it may be acceptable to consider more households for aid, thus minimizing the chances of missing households that need it. However, if there are very limited resources, there is the risk of underserving households in need. The point here is that this kind of aggregation hides the variations in the physical vulnerability of the buildings. Damage curve studies from other countries may suggest otherwise, but the situation in Malawi concerning build quality may differ entirely.

Table 6.
Categorization of housing by building materials. Build type is dependent on the combination of roof type and wall material.
6. Discusssion
6.1. Data Biases vs. Model Biases
In this audit, the review of the datasheets of the street view images (Figure A4) shows a bias in the representation of vulnerable housing typologies in the training data for the CNN. While there were other building materials used as facades (e.g., mud), the training data only consisted of bricks and concrete, which are categorized as permanent and less vulnerable to flooding. This data bias occurs at the data processing stage, according to the framework that we used to categorize biases (see Figure 2).
The performance of the OBIA model (see the model card Figure A1 and Table 4) introduces a representation bias in the later stage of the workflow. The OBIA shows systematic misclassification of thatched roofs, which means these cannot be identified adequately for use in the later stages. Temporary building typologies are characterized by thatched roofs. In contrast to the representation bias in the street view images, which occurs at the data level (data processing for the training data), the bias against thatched roof buildings in the workflow results from the OBIA model’s limitations and, thus, a technical bias. The UAV imagery data in itself is not biased by the bias definition by Friedman and Nissenbaum [17]. This is despite the imbalance between thatched and iron roofs since the image covered the required geographical extent.
Table 7 summarises how the identified biases are introduced, replicated, and amplified through the workflow (from data collection to implementation). During the data collection, we do not identify any representation or aggregation bias. For example, even though the collection process of the street view images could have covered more area, this does not exhibit systematic patterns (as seen in Figure 4) that could lead to biases (e.g., favoring collection along tarmacked roads). The biases discussed in Section 5.1 are further amplified and reinforced in the saylink to damage curves where Section 5.2 occurs. At the “link to damage curves” (see workflow in Figure 1) stage, where quantification of expected flood damage occurs, individual buildings are categorized into permanent, semi-permanent, and traditional types, which obscures the underrepresented and omitted individual build types in the previous steps. The failure to adequately represent the various groups of house typologies is further reinforced in the damage curves step in the workflow (Figure 1).

Table 7.
Summary of biases through the workflow as explained in Figure 1.
6.2. Overall Implications of the Biases
The design of this flood vulnerability geo-intelligence workflow prioritizes households living in semi-permanent and traditional buildings. This is because they are damaged at lower flood levels than permanent buildings. Hence, households living in such buildings are considered more vulnerable. However, with the representation and aggregation biases discussed above, these types of buildings are not appropriately catered for. Placing a household living in a traditional building into the category of semi-permanent is unfair and raises a justice concern. The same occurs if a household living in a semi-permanent building is placed in the permanent category. In both cases, these households would receive less DRRM support than required.
During the decision process in DRRM, decision-makers can choose to perform one of the following: (i) Minimize the damage or loss by acting upon forecasts with a relatively low threshold of predicted damage/loss but constraint to costs of action not exceeding the cost of damages/losses (“Prevented event maximization”) [67]; (ii) Minimize expenditure by acting upon forecasts with high thresholds of predicted damage/loss (“Expense Minimization”) [67]. The current workflow would fail under the two criteria because while it adequately caters to households living in permanent buildings, it does not equally cater to households living in semi-permanent and traditional housing. Considering that these two groups (i.e., semi-permanent and traditional housing households) are generally considered more vulnerable see [49] it means that this workflow should not be implemented until a solution is found to mitigate the biases.
Furthermore, the various datasets represent people’s ways of life and socio-economic status. For example, in this case, the choice of building materials may often be informed by availability, culture, and traditions. Malawi is a multi-ethnic country, so it is reasonable to assume that customs and traditions vary; hence, the architecture may differ across these traditions. Except for the most popular building materials, there is quite a difference between the materials used in this work and the materials used in Karonga and Blantyre.Hence, if a socio-technical system systematically fails to identify some building types, we cannot rule out the possibility of a bias against individuals based on the factors determining their choice of building materials.
These findings extend to other similar geo-intelligence workflows that assess physical vulnerability. Since remote sensing is increasingly used in mapping, practitioners and researchers should consider how AI models can inadvertently make groups of people invisible to decision-makers. Practitioners also need to consider how they can adapt global damage curves to create localized estimates for specific locations and their corresponding build typologies. The results also highlight the importance of geographical context. In our case study, the building typology of Karonga is, to some extent, different from that of Blantyre. Table 5 shows that concrete is not commonly used in Karonga. While this did not explicitly cause a bias, it shows the challenges of generalizing AI models across geographical contexts. It is also important to consider the challenges of data sparsity, which can materialize as a bias when missing observations correlate with a particular marginalized group. Our case study shows the low overlap between the UBR dataset and the street view images. This impacts the total number of households that can be fully characterized based on both social and physical vulnerability.
This work is one of few studies that audit for biases in the context of DRRM. One other example of bias auditing is by Gevaert et al., e.g, [7], who audit for biases in global building footprint datasets used in DRRM. In contrast, however, our study audits a workflow. This is not just about the datasets but also how challenges in processing the data result in biases and how these biases are propagated through the workflow and reinforced by AI models. Our study highlights the importance of auditing each step in a geo-intelligence workflow, from data collection to processing and output of AI models.
6.3. Strategies for Reducing Biases in Geo-Intelligence Workflows
One approach to reducing biases in geo-intelligence workflows is to address the underlying data-related issues. As demonstrated in the Results Section 5, biased training data and severe class imbalances are primary sources of unfair outcomes for vulnerable households. By implementing strategies such as data augmentation and generating synthetic datasets, developers of geo-intelligence workflows can reduce the risk of these biases.
In the Results Section 5, we discussed how the severe class imbalance between thatched roofs and iron sheet roofs causes accuracy disparities between these classes. This imbalance introduces representation bias, as thatched roofs are more frequently missed or misclassified. Data augmentation could help by artificially increasing the sample size for thatched roofs through techniques like adding noise (e.g., Gaussian noise) and applying geometric transformations (e.g., flipping or rotation) [68]. For example, Wang et al. [69] used data augmentation in remote sensing to improve object detection in satellite images.
Regarding the initial step to address biases in street view image classification using CNNs, the initial step should involve including images of buildings made of other materials that were excluded (e.g., wood, bamboo, mud). In Section 5, we discussed how excluding these types results in workflow biases, making vulnerable households invisible to DRRM decision-makers. Simply including these images alone may not resolve the issue due to severe class imbalances (the reason they were excluded in the training and testing phases). Therefore, we recommend using class balancing techniques (e.g., data augmentation or synthetic data) to increase sample sizes for these classes.
7. Limitations
This audit did not critically evaluate stakeholder involvement. For example, the involvement of the data subjects in the workflows. Research by Costanza-Chock et al. [70] on auditing the auditors shows the importance of involving affected communities despite the challenges (e.g., costs and time). Data subjects’s involvement is important because they would have in-depth knowledge of the preexisting biases and injustices that can be replicated in the workflow. In some instances, the developers of such predictive systems are remote from the vulnerable communities and, therefore, unaware of the context and history of the communities they serve [71]. Therefore, participation by the data subjects would provide a more critical audience [72], and they can hold those actors responsible for the DRRM predictive systems accountable, as in the case in public accountability as defined by [73]. The same citizen engagement strategies used by participatory design could be used to involve data subjects in auditing. Importantly, an audit can give a platform for the data subjects to share knowledge on biases, historical injustices and to hold to account the designers of the geo-intelligence workflow. While the expertise of the data subjects may be limited for audits, the designers are nonetheless obliged to explain the workings of the workflows [14,73]. Future research should investigate how to accommodate for the data subjects in auditing geo-intelligence workflows as has been done for medical AI, e.g., [74].
8. Conclusions
In this paper, we audited an experimental flood vulnerability geo-intelligence workflow for biases. Our objective was to examine how biases can emerge in geo-intelligence workflows and give examples of biased situations we would like to avoid. We coalesced Friedman and Nissenbaum’s [17] definition and framework for biases with those of Suresh and Guttag [18]. These frameworks enabled us to differentiate between preexisting and technical biases and to further discuss the biases’ root cause (i.e., representation and aggregation biases).
Our results show how technical limitations of classifying roof materials in the UAV imagery caused a high misclassification rate for the thatched roof (which we consider as an indicator of physical vulnerability). Furthermore, comparing street view data with the ground truth data samples shows that some wall materials (facades) were not included in the training models. The aggregation methods (classifying individual build typologies into broader categories) for damage curves further obscured these biases. This aggregation bias also highlights the need to localize damage curve estimations since global categorization of building typologies may not always be transferable to local contexts. Compounding the technical bias in roof type classification, the representation bias in facade classification, and the aggregation bias causes vulnerable groups housed in semi-permanent or traditional building typologies to be invisible. This shows that biases can be reinforced and amplified in geo-intelligence workflows. Therefore, an important lesson for auditing geo-intelligence workflows is that it is important to identify biases at each stage of a workflow.
A limitation of this audit was the non-involvement of stakeholders, particularly the data subjects. Data subjects would have an in-depth knowledge of the preexisting biases and injustices that can be replicated in the workflow. This is especially useful when the developers of the geo-intelligence workflows are remote and lack an in-depth understanding of the context and history of the communities they serve.
To advance the field of DRRM, we urge the community of researchers and practitioners to perform routine auditing of geo-intelligence workflows. Audits are essential to identify biases and other ethical concerns (e.g., privacy). Normalizing auditing will help prevent information disasters and enhance transparency and trust in the DRRM field.
Author Contributions
Conceptualization, Caroline M. Gevaert and Michael H. Nagenborg; Methodology, Brian K. Masinde; resources, Marc J. C. van den Homberg and Jacopo Margutti and Inez Gortzak; data curation, Marc J. C. van den Homberg and Jacopo Margutti and Inez Gortzak; Analysis, Brian K. Masinde; writing—original draft preparation, Brian K. Masinde and Caroline M. Gevaert and Michael H. Nagenborg and Marc J. C. van den Homberg; writing—review and editing, Brian K. Masinde and Caroline M. Gevaert and Michael H. Nagenborg; supervision Caroline M. Gevaert and Michael H. Nagenborg and Jaap A. Zevenbergen, project administrator, Jaap A. Zevenbergen. All authors have read and agreed to the published version of the manuscript.
Funding
This manuscript is part of the Disastrous Information: Embedding “Do No Harm” principles into innovative geo-intelligence workflows for effective humanitarian action’ project (grant number MVI.19.007) funded by the Netherlands Organization for Scientific Research (NWO) and UNICEF. The project also benefits from collaborations with 510, an initiative of the Netherlands Red Cross.
Data Availability Statement
Building material classification (CNN) codes are available at https://anonymous.4open.science/r/building-material-classification-E581/README.md (accessed on 7 November 2024). The raw training data (Mapillary street view images) are available at https://figshare.com/s/02d7223e7674ecccf04b (accessed on 7 November 2024). street view images are also available at https://mapillary.com (accessed on 7 November 2024). OSM data are available at https://www.openstreetmap.org (accessed on 7 November 2024). UAV imagery data are available on request. For the household survey data and Unified Beneficiary Registry data—510, an initiative of the Netherlands Red Cross, there is an agreement for data sharing with the Department of Economic Planning and Development—Malawi, which does not allow us to share data beyond research purposes. Unified Beneficiary Registry data, in particular, contains sensitive personal information (health status of household head). However, we provide the data schema for the household survey and Unified Beneficiary Registry data in their respective datasheets under composition.
Conflicts of Interest
The authors declare no conflict of interest.
Appendix A. Model Cards
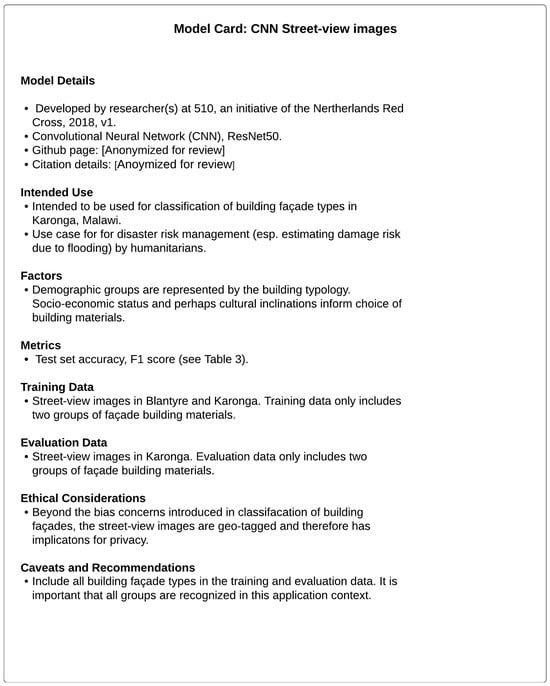
Figure A1.
Model card for CNN on street view images.
Figure A1.
Model card for CNN on street view images.
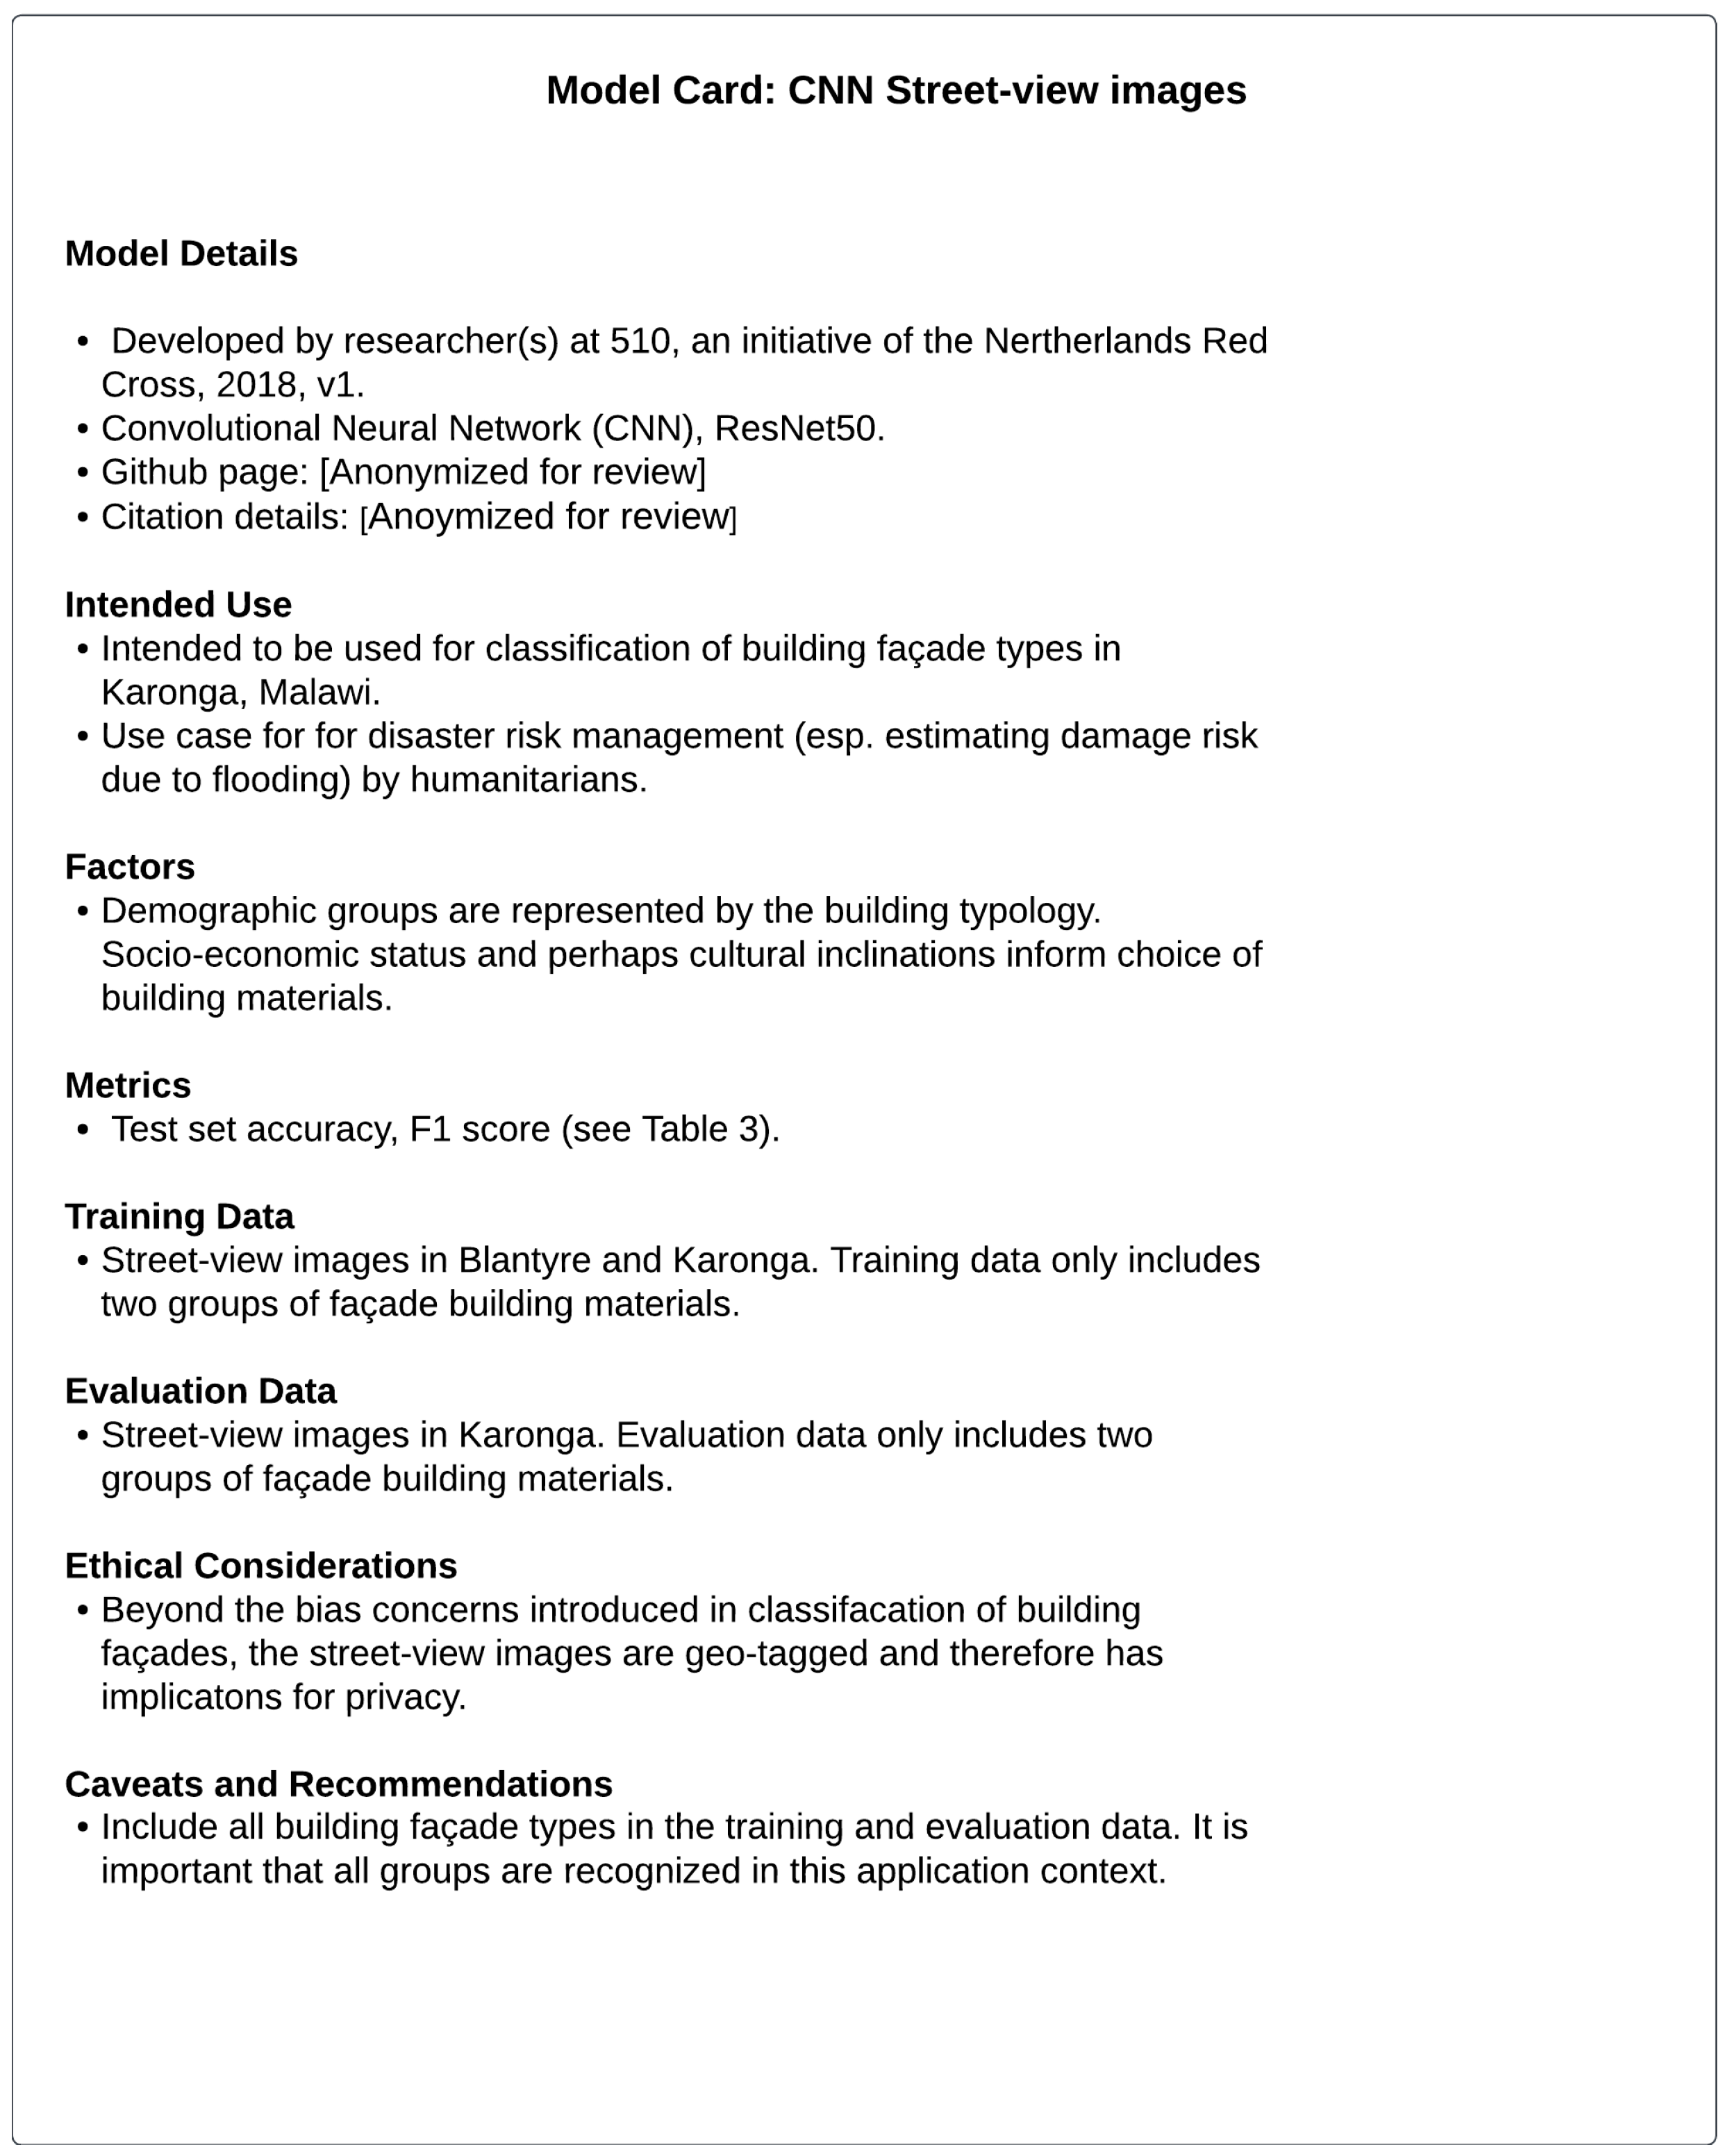
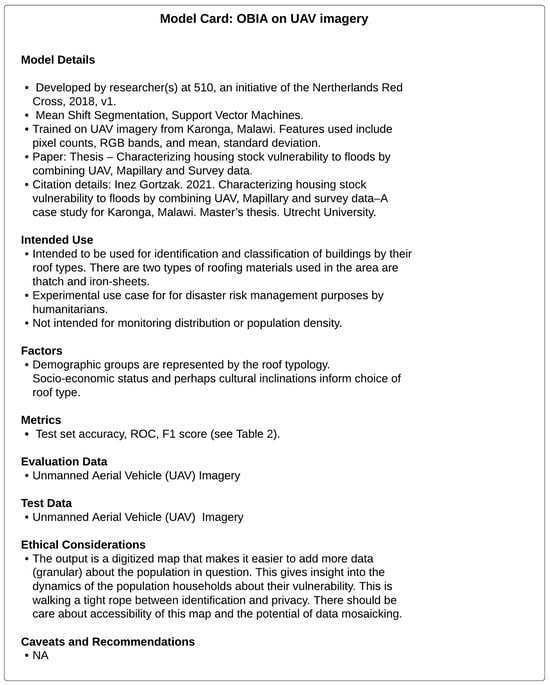
Figure A2.
Model card for OBIA on UAV Imagery.
Figure A2.
Model card for OBIA on UAV Imagery.
Appendix B. Datasheets
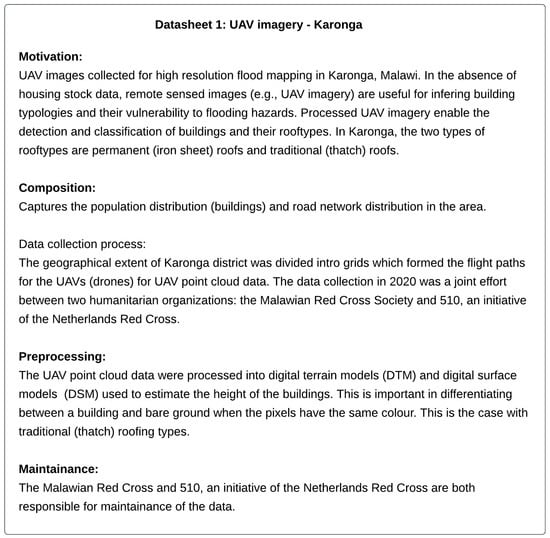
Figure A3.
Datasheet of the UAV imagery of Karonga.
Figure A3.
Datasheet of the UAV imagery of Karonga.
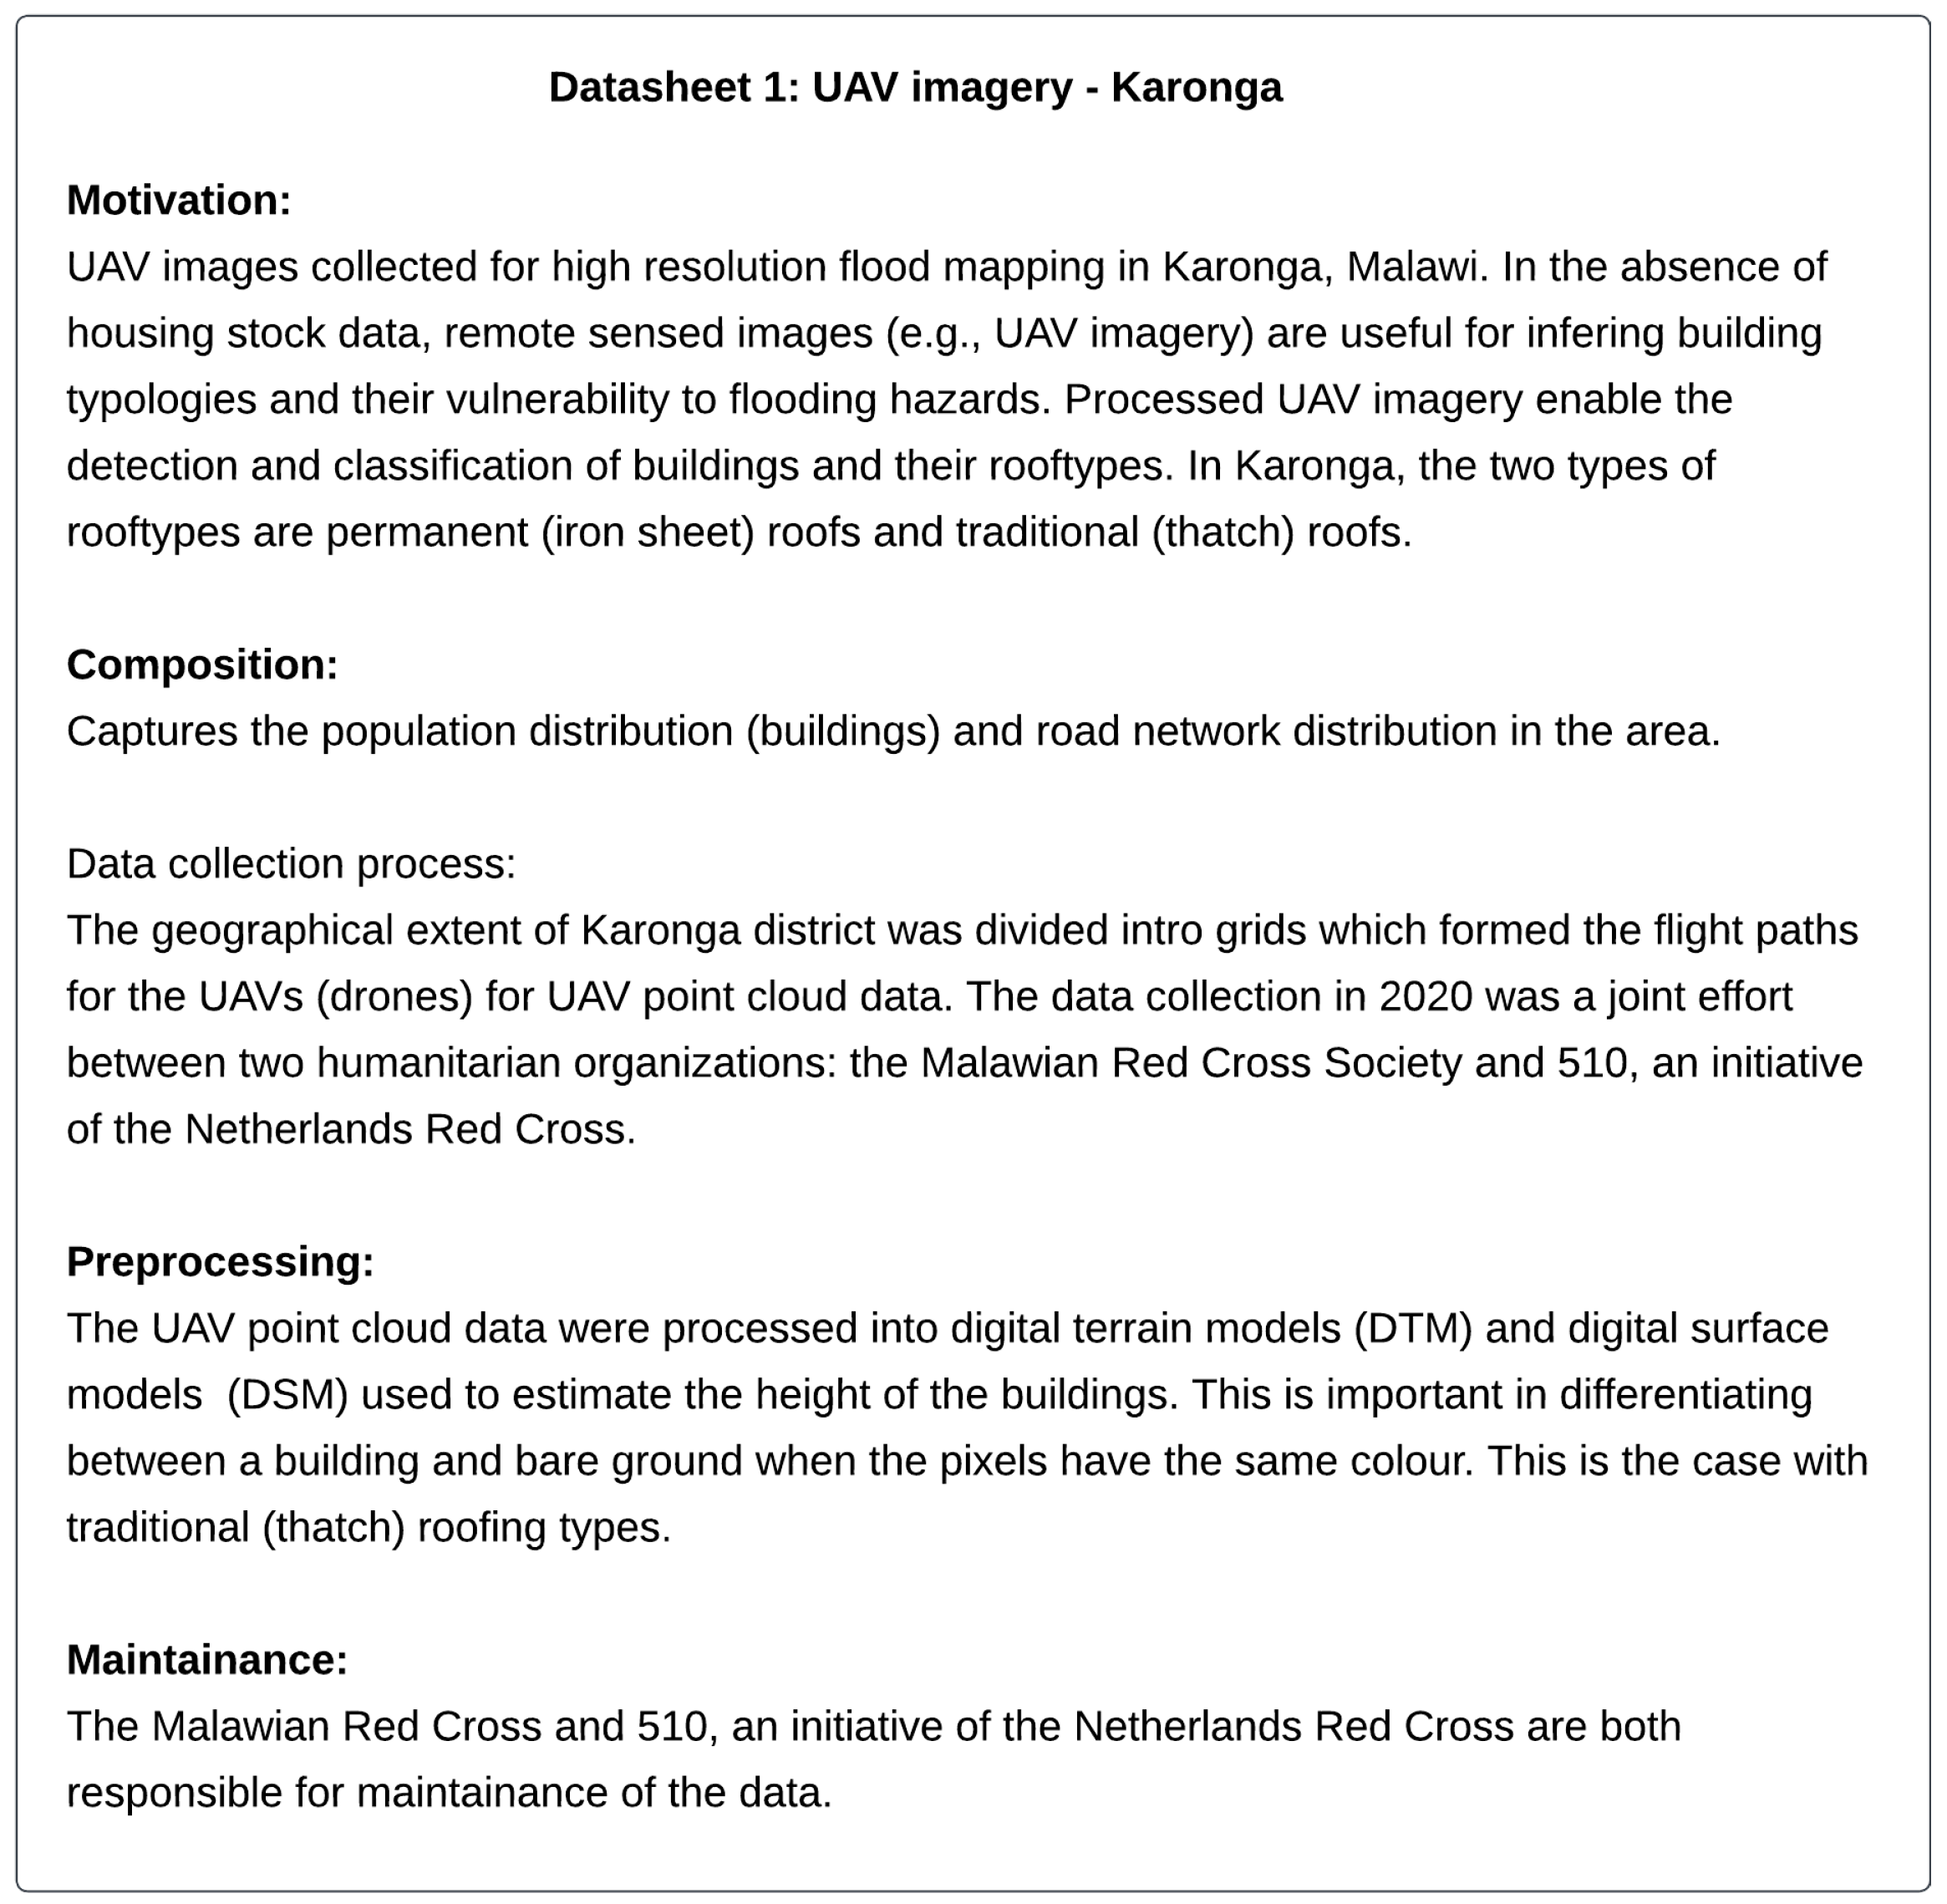
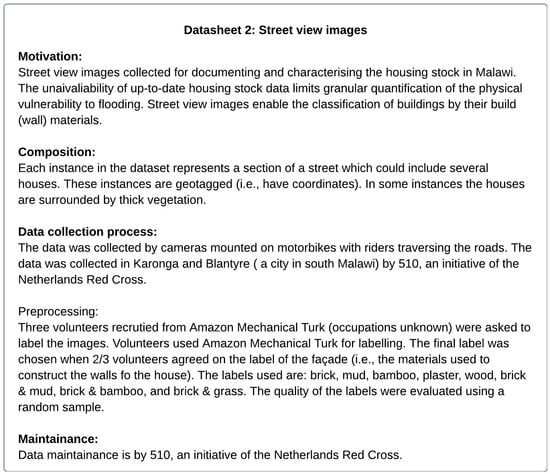
Figure A4.
Datasheet of street view images.
Figure A4.
Datasheet of street view images.
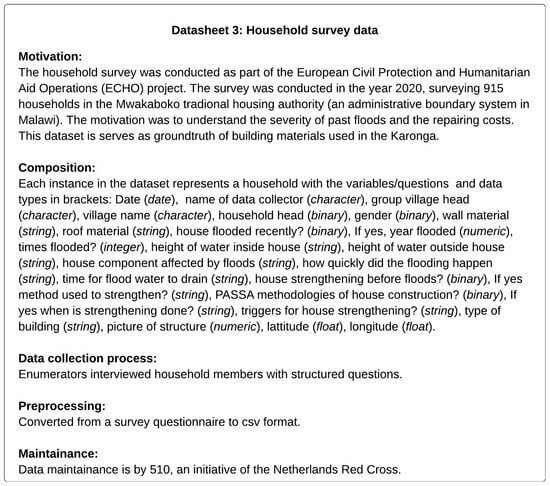
Figure A5.
Household survey data datasheet.
Figure A5.
Household survey data datasheet.
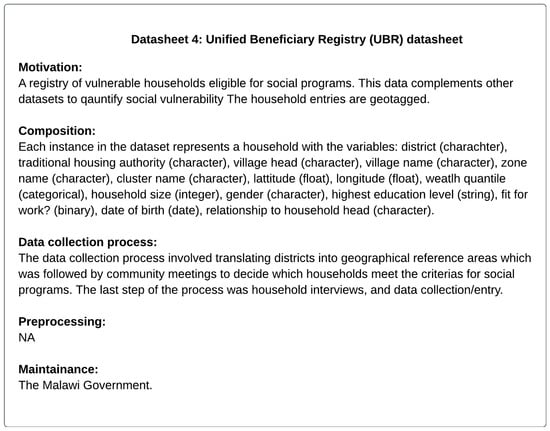
Figure A6.
Unified Beneficiary Registry datasheet. Compiled from [49].
Figure A6.
Unified Beneficiary Registry datasheet. Compiled from [49].
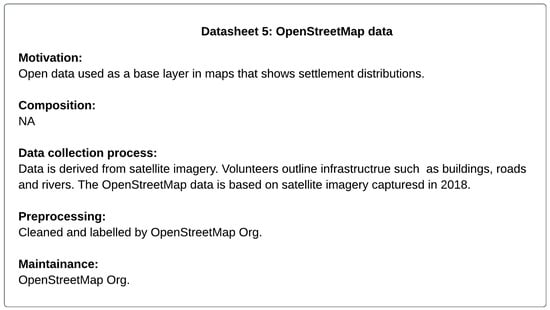
Figure A7.
OpenStreetMap data datasheet.
Figure A7.
OpenStreetMap data datasheet.
References
- Šakić Trogrlić, R.; van den Homberg, M.; Budimir, M.; McQuistan, C.; Sneddon, A.; Golding, B. Early Warning Systems and Their Role in Disaster Risk Reduction. In Towards the “Perfect” Weather Warning: Bridging Disciplinary Gaps Through Partnership and Communication; Golding, B., Ed.; Springer International Publishing: Cham, Switzerland, 2022; pp. 11–46. [Google Scholar] [CrossRef]
- Soden, R.; Wagenaar, D.; Luo, D.; Tijssen, A. Taking ethics, fairness, and bias seriously in machine learning for disaster risk management. arXiv 2019, arXiv:1912.05538. [Google Scholar]
- Gevaert, C.M.; Carman, M.; Rosman, B.; Georgiadou, Y.; Soden, R. Fairness and accountability of AI in disaster risk management: Opportunities and challenges. Patterns 2021, 2, 100363. [Google Scholar] [CrossRef] [PubMed]
- Angwin, J.; Larson, J.; Mattu, S.; Kirchner, L. Machine bias. In Ethics of Data and Analytics; Martin, K., Ed.; CRC Press: Boca Raton, FL, USA, 2022. [Google Scholar] [CrossRef]
- Mayson, S.G. Bias in, bias out. Yale Law J. 2018, 128, 2218. [Google Scholar]
- Dastin, J. Amazon scraps secret AI recruiting tool that showed bias against women. In Ethics of Data and Analytics; Auerbach Publications: Boca Raton, FL, USA, 2022; pp. 296–299. [Google Scholar]
- Gevaert, C.M.; Buunk, T.; Van Den Homberg, M.J.C. Auditing geospatial datasets for biases: Using global building datasets for disaster risk management. IEEE J. Sel. Top. Appl. Earth Obs. Remote Sens. 2024, 17, 12579–12590. [Google Scholar] [CrossRef]
- Yu, M.; Yang, C.; Li, Y. Big data in natural disaster management: A review. Geosciences 2018, 8, 165. [Google Scholar] [CrossRef]
- Pestre, G.; Letouzé, E.; Zagheni, E. The ABCDE of big data: Assessing biases in call-detail records for development estimates. World Bank Econ. Rev. 2020, 34, S89–S97. [Google Scholar] [CrossRef]
- Paulus, D.; Fathi, R.; Fiedrich, F.; de Walle, B.V.; Comes, T. On the interplay of data and cognitive bias in crisis information management: An exploratory study on epidemic response. Inf. Syst. Front. 2024, 26, 391–415. [Google Scholar] [CrossRef]
- Dodgson, K.; Hirani, P.; Trigwell, R.; Bueermann, G. A Framework for the Ethical Use of Advanced Data Science Methods in the Humanitarian Sector; Technical Report; Data Science and Ethics Group (DSEG). 2020. Available online: https://migrationdataportal.org/sites/g/files/tmzbdl251/files/2020-06/Framework%20Advanced%20Data%20Science%20In%20The%20Humanitarian%20Sector.pdf (accessed on 7 November 2024).
- Krupiy, T.T. A vulnerability analysis: Theorising the impact of artificial intelligence decision-making processes on individuals, society and human diversity from a social justice perspective. Comput. Law Secur. Rev. 2020, 38, 105429. [Google Scholar] [CrossRef]
- Khaled, A.F.M. Do No Harm in refugee humanitarian aid: The case of the Rohingya humanitarian response. J. Int. Humanit. Action 2021, 6, 7. [Google Scholar] [CrossRef]
- Wieringa, M. What to account for when accounting for algorithms: A systematic literature review on algorithmic accountability. In Proceedings of the 2020 Conference on Fairness, Accountability, and Transparency, Barcelona, Spain, 27–30 January 2020; pp. 1–18. [Google Scholar] [CrossRef]
- Kemper, J.; Kolkman, D. Transparent to whom? No algorithmic accountability without a critical audience. Inf. Commun. Soc. 2019, 22, 2081–2096. [Google Scholar] [CrossRef]
- Dai, S.; Li, Y.; Stein, A.; Yang, S.; Jia, P. Street view imagery-based built environment auditing tools: A systematic review. Int. J. Geogr. Inf. Sci. 2024, 38, 1136–1157. [Google Scholar] [CrossRef]
- Friedman, B.; Nissenbaum, H. Bias in computer systems. ACM Trans. Inf. Syst. (Tois) 1996, 14, 330–347. [Google Scholar] [CrossRef]
- Suresh, H.; Guttag, J. A framework for understanding sources of harm throughout the machine learning life cycle. In Equity and Access in Algorithms, Mechanisms, and Optimization; ACM: New York, NY, USA, 2021; pp. 1–9. [Google Scholar] [CrossRef]
- Mitchell, M.; Wu, S.; Zaldivar, A.; Barnes, P.; Vasserman, L.; Hutchinson, B.; Spitzer, E.; Raji, I.D.; Gebru, T. Model cards for model reporting. In Proceedings of the Conference on Fairness, Accountability, and Transparency, Atlanta, GA, USA, 29–31 January 2019; pp. 220–229. [Google Scholar] [CrossRef]
- Gebru, T.; Morgenstern, J.; Vecchione, B.; Vaughan, J.W.; Wallach, H.; Iii, H.D.; Crawford, K. Datasheets for datasets. Commun. ACM 2021, 64, 86–92. [Google Scholar] [CrossRef]
- Raji, I.D.; Smart, A.; White, R.N.; Mitchell, M.; Gebru, T.; Hutchinson, B.; Smith-Loud, J.; Theron, D.; Barnes, P. Closing the AI accountability gap: Defining an end-to-end framework for internal algorithmic auditing. In Proceedings of the 2020 Conference on Fairness, Accountability, and Transparency, New York, NY, USA, 27–30 January 2020; pp. 33–44. [Google Scholar] [CrossRef]
- Deparday, V.; Gevaert, C.; Molinario, G.; Soden, R.; Balog-Way, S.A.B. Machine Learning for Disaster Risk Management; Technical Report; World Bank Group: Washington, DC, USA, 2019. [Google Scholar]
- Xing, Z.; Yang, S.; Zan, X.; Dong, X.; Yao, Y.; Liu, Z.; Zhang, X. Flood vulnerability assessment of urban buildings based on integrating high-resolution remote sensing and street view images. Sustain. Cities Soc. 2023, 92, 104467. [Google Scholar] [CrossRef]
- Wang, Y.; Gardoni, P.; Murphy, C.; Guerrier, S. Empirical predictive modeling approach to quantifying social vulnerability to natural hazards. Ann. Am. Assoc. Geogr. 2021, 111, 1559–1583. [Google Scholar] [CrossRef]
- Kaplan, S.; Garrick, B.J. On the quantitative definition of risk. Risk Anal. 1981, 1, 11–27. [Google Scholar] [CrossRef]
- Cutter, S.L. Social Science Perspectives on Hazards and Vulnerability Science. In Geophysical Hazards: Minimizing Risk, Maximizing Awareness; Beer, T., Ed.; Springer: Dordrecht, The Netherlands, 2010; pp. 17–30. [Google Scholar] [CrossRef]
- Murphy, C.; Gardoni, P. The capability approach in risk analysis. In Handbook of Risk Theory: Epistemology, Decision Theory, Ethics, and Social Implications of Risk; Springer: Dordrecht, The Netherlands, 2012; pp. 979–997. [Google Scholar] [CrossRef]
- Gardoni, P.; Murphy, C. Gauging the societal impacts of natural disasters using a capability approach. Disasters 2010, 34, 619–636. [Google Scholar] [CrossRef]
- Omukuti, J.; Megaw, A.; Barlow, M.; Altink, H.; White, P. The value of secondary use of data generated by non-governmental organisations for disaster risk management research: Evidence from the Caribbean. Int. J. Disaster Risk Reduct. 2021, 56, 102114. [Google Scholar] [CrossRef]
- Geiß, C.; Pelizari, P.A.; Marconcini, M.; Sengara, W.; Edwards, M.; Lakes, T.; Taubenböck, H. Estimation of seismic building structural types using multi-sensor remote sensing and machine learning techniques. ISPRS J. Photogramm. Remote Sens. 2015, 104, 175–188. [Google Scholar] [CrossRef]
- Islam, M.M.; Ujiie, K.; Noguchi, R.; Ahamed, T. Flash flood-induced vulnerability and need assessment of wetlands using remote sensing, GIS, and econometric models. Remote Sens. Appl. Soc. Environ. 2022, 25, 100692. [Google Scholar] [CrossRef]
- Schwarz, B.; Pestre, G.; Tellman, B.; Sullivan, J.; Kuhn, C.; Mahtta, R.; Pandey, B.; Hammett, L. Mapping Floods and Assessing Flood Vulnerability for Disaster Decision-Making: A Case Study Remote Sensing Application in Senegal. In Earth Observation Open Science and Innovation; Mathieu, P.P., Aubrecht, C., Eds.; Springer International Publishing: Cham, Switzerland, 2018; pp. 293–300. [Google Scholar] [CrossRef]
- Cian, F.; Giupponi, C.; Marconcini, M. Integration of earth observation and census data for mapping a multi-temporal flood vulnerability index: A case study on Northeast Italy. Nat. Hazards 2021, 106, 2163–2184. [Google Scholar] [CrossRef]
- Valentijn, T.; Margutti, J.; van den Homberg, M.; Laaksonen, J. Multi-hazard and spatial transferability of a cnn for automated building damage assessment. Remote Sens. 2020, 12, 2839. [Google Scholar] [CrossRef]
- Kerle, N.; Nex, F.; Gerke, M.; Duarte, D.; Vetrivel, A. UAV-based structural damage mapping: A review. ISPRS Int. J. Geo-Inf. 2020, 9, 14. [Google Scholar] [CrossRef]
- Matin, S.S.; Pradhan, B. Earthquake-induced building-damage mapping using Explainable AI (XAI). Sensors 2021, 21, 4489. [Google Scholar] [CrossRef]
- Adriano, B.; Xia, J.; Baier, G.; Yokoya, N.; Koshimura, S. Multi-source data fusion based on ensemble learning for rapid building damage mapping during the 2018 sulawesi earthquake and tsunami in Palu, Indonesia. Remote Sens. 2019, 11, 886. [Google Scholar] [CrossRef]
- Gebrehiwot, A.; Hashemi-Beni, L.; Thompson, G.; Kordjamshidi, P.; Langan, T.E. Deep convolutional neural network for flood extent mapping using unmanned aerial vehicles data. Sensors 2019, 19, 1486. [Google Scholar] [CrossRef]
- Lemmens, R.; Toxopeus, B.; Boerboom, L.; Schouwenburg, M.; Retsios, B.; Nieuwenhuis, W.; Mannaerts, C. Implementation of a comprehensive and effective geoprocessing workflow environment. Int. Arch. Photogramm. Remote Sens. Spat. Inf. Sci. 2018, 42, 123–127. [Google Scholar] [CrossRef]
- Greenwood, F.; Joseph, D. Aid from the Air: A Review of Drone Use in the RCRC Global Network; Technical Report; The International Red Cross and Red Crescent Movement: Geneva, Switzerland, 2020. [Google Scholar]
- Leyteño, T.T. Detailed Drone and Street-Level Imagery for Mapping in the Philippines; Technical Report; The Philippine Red Cross: Mandaluyong, Philippines, 2017. [Google Scholar]
- Mokkenstorm, L.C.; van den Homberg, M.J.C.; Winsemius, H.; Persson, A. River Flood Detection Using Passive Microwave Remote Sensing in a Data-Scarce Environment: A Case Study for Two River Basins in Malawi. Front. Earth Sci. 2021, 9, 552. [Google Scholar] [CrossRef]
- Ngongondo, C.; Xu, C.Y.; Gottschalk, L.; Alemaw, B. Evaluation of spatial and temporal characteristics of rainfall in Malawi: A case of data scarce region. Theor. Appl. Climatol. 2011, 106, 79–93. [Google Scholar] [CrossRef]
- Wouters, L.; Couasnon, A.; De Ruiter, M.C.; van den Homberg, M.J.C.; Teklesadik, A.; De Moel, H. Improving flood damage assessments in data-scarce areas by retrieval of building characteristics through UAV image segmentation and machine learning–a case study of the 2019 floods in southern Malawi. Nat. Hazards Earth Syst. Sci. 2021, 21, 3199–3218. [Google Scholar] [CrossRef]
- Bucherie, A.; Werner, M.; van den Homberg, M.; Tembo, S. Flash flood warnings in context: Combining local knowledge and large-scale hydro-meteorological patterns. Nat. Hazards Earth Syst. Sci. 2022, 22, 461–480. [Google Scholar] [CrossRef]
- Gortzak, I. Characterizing Housing Stock Vulnerability to Floods by Combining UAV, Mapillary and Survey Data—A Case Study for Karonga, Malawi. Master’s Thesis, Utrecht University, Utrecht, The Netherlands, 2021. [Google Scholar]
- Mapillary. 2024. Available online: https://www.mapillary.com/open-data (accessed on 7 November 2024).
- Ma, D.; Fan, H.; Li, W.; Ding, X. The state of mapillary: An exploratory analysis. ISPRS Int. J. Geo-Inf. 2019, 9, 10. [Google Scholar] [CrossRef]
- Lindert, K.; Andrews, C.; Msowoya, C.; Paul, B.V.; Chirwa, E.; Mittal, A. Rapid Social Registry Assessment; Working Paper; World Bank Group: Washington, DC, USA, 2018. [Google Scholar]
- Haklay, M.; Weber, P. Openstreetmap: User-generated street maps. IEEE Pervasive Comput. 2008, 7, 12–18. [Google Scholar] [CrossRef]
- Ipeirotis, P.G.; Provost, F.; Wang, J. Quality management on amazon mechanical turk. In Proceedings of the ACM SIGKDD Workshop on Human Computation, Washington, DC, USA, 25 July 2010; pp. 64–67. [Google Scholar] [CrossRef]
- Zhang, J.; Wu, X.; Sheng, V.S. Learning from crowdsourced labeled data: A survey. Artif. Intell. Rev. 2016, 46, 543–576. [Google Scholar] [CrossRef]
- He, K.; Zhang, X.; Ren, S.; Sun, J. Deep Residual Learning for Image Recognition. arXiv 2015, arXiv:1512.03385. [Google Scholar] [CrossRef]
- Rudari, R.; Beckers, J.; De Angeli, S.; Rossi, L.; Trasforini, E. Impact of modelling scale on probabilistic flood risk assessment: The Malawi case. E3S Web Conf. 2016, 7, 04015. [Google Scholar] [CrossRef]
- Cardona, O.D.; Ordaz, M.; Reinoso, E.; Yamín, L.; Barbat, A. CAPRA–comprehensive approach to probabilistic risk assessment: International initiative for risk management effectiveness. In Proceedings of the 15th World Conference on Earthquake Engineering, Lisbon, Portugal, 24–28 September 2012; Volume 1. [Google Scholar]
- Fan, Z.; Feng, C.C.; Biljecki, F. Coverage and Bias of Street View Imagery in Mapping the Urban Environment. arXiv 2024, arXiv:2409.15386. [Google Scholar] [CrossRef]
- Kim, D.H.; López, G.; Kiedanski, D.; Maduako, I.; Ríos, B.; Descoins, A.; Zurutuza, N.; Arora, S.; Fabian, C. Bias in Deep Neural Networks in Land Use Characterization for International Development. Remote Sens. 2021, 13, 2908. [Google Scholar] [CrossRef]
- Melamed, D.; Johnson, C.; Gerg, I.D.; Zhao, C.; Blue, R.; Hoogs, A.; Clipp, B.; Morrone, P. Uncovering Bias in Building Damage Assessment from Satellite Imagery. In Proceedings of the IGARSS 2024-2024 IEEE International Geoscience and Remote Sensing Symposium, Athens, Greece, 7–12 July 2024; IEEE: Piscataway, NJ, USA, 2024; pp. 8095–8099. [Google Scholar]
- Masinde, B.K.; Gevaert, C.M.; Nagenborg, M.H.; Zevenbergen, J.A. Group-Privacy Threats for Geodata in the Humanitarian Context. ISPRS Int. J. Geo-Inf. 2023, 12, 393. [Google Scholar] [CrossRef]
- Mehrabi, N.; Morstatter, F.; Saxena, N.; Lerman, K.; Galstyan, A. A Survey on Bias and Fairness in Machine Learning. ACM Comput. Surv. 2021, 54, 1–35. [Google Scholar] [CrossRef]
- Ruiz, N.; Kortylewski, A.; Qiu, W.; Xie, C.; Bargal, S.A.; Yuille, A.; Sclaroff, S. Simulated adversarial testing of face recognition models. In Proceedings of the IEEE/CVF Conference on Computer Vision and Pattern Recognition, New Orleans, LA, USA, 18–24 June 2022; pp. 4145–4155. [Google Scholar] [CrossRef]
- Guo, X.; Yin, Y.; Dong, C.; Yang, G.; Zhou, G. On the class imbalance problem. In Proceedings of the 2008 Fourth International Conference on Natural Computation, Jinan, China, 18–20 October 2008; IEEE: Piscataway, NJ, USA, 2008; Volume 4, pp. 192–201. [Google Scholar] [CrossRef]
- Johnson, J.M.; Khoshgoftaar, T.M. Survey on deep learning with class imbalance. J. Big Data 2019, 6, 27. [Google Scholar] [CrossRef]
- Wei, W.; Li, J.; Cao, L.; Ou, Y.; Chen, J. Effective detection of sophisticated online banking fraud on extremely imbalanced data. World Wide Web 2013, 16, 449–475. [Google Scholar] [CrossRef]
- Kubat, M.; Holte, R.C.; Matwin, S. Machine learning for the detection of oil spills in satellite radar images. Mach. Learn. 1998, 30, 195–215. [Google Scholar] [CrossRef]
- Bria, A.; Marrocco, C.; Tortorella, F. Addressing class imbalance in deep learning for small lesion detection on medical images. Comput. Biol. Med. 2020, 120, 103735. [Google Scholar] [CrossRef] [PubMed]
- Lopez, A.; de Perez, E.C.; Bazo, J.; Suarez, P.; van den Hurk, B.; van Aalst, M. Bridging forecast verification and humanitarian decisions: A valuation approach for setting up action-oriented early warnings. Weather Clim. Extrem. 2020, 27, 100167. [Google Scholar] [CrossRef]
- Shorten, C.; Khoshgoftaar, T.M. A survey on image data augmentation for deep learning. J. Big Data 2019, 6, 60. [Google Scholar] [CrossRef]
- Wang, Z.; Du, L.; Mao, J.; Liu, B.; Yang, D. SAR target detection based on SSD with data augmentation and transfer learning. IEEE Geosci. Remote Sens. Lett. 2018, 16, 150–154. [Google Scholar] [CrossRef]
- Costanza-Chock, S.; Raji, I.D.; Buolamwini, J. Who Audits the Auditors? Recommendations from a field scan of the algorithmic auditing ecosystem. In Proceedings of the 2022 ACM Conference on Fairness, Accountability, and Transparency, Seoul, Republic of Korea, 21–24 June 2022; pp. 1571–1583. [Google Scholar] [CrossRef]
- van den Homberg, M.J.C.; Gevaert, C.M.; Georgiadou, Y. The changing face of accountability in humanitarianism: Using artificial intelligence for anticipatory action. Politics Gov. 2020, 8, 456–467. [Google Scholar] [CrossRef]
- Kasy, M.; Abebe, R. Fairness, equality, and power in algorithmic decision-making. In Proceedings of the 2021 ACM Conference on Fairness, Accountability, and Transparency, New York, NY, USA, 3–10 March 2021; pp. 576–586. [Google Scholar] [CrossRef]
- Bovens, M. Analysing and assessing accountability: A conceptual framework. Eur. Law J. 2007, 13, 447–468. [Google Scholar] [CrossRef]
- McKay, F.; Williams, B.J.; Prestwich, G.; Treanor, D.; Hallowell, N. Public governance of medical artificial intelligence research in the UK: An integrated multi-scale model. Res. Involv. Engagem. 2022, 8, 21. [Google Scholar] [CrossRef]
Disclaimer/Publisher’s Note: The statements, opinions and data contained in all publications are solely those of the individual author(s) and contributor(s) and not of MDPI and/or the editor(s). MDPI and/or the editor(s) disclaim responsibility for any injury to people or property resulting from any ideas, methods, instructions or products referred to in the content. |
© 2024 by the authors. Published by MDPI on behalf of the International Society for Photogrammetry and Remote Sensing. Licensee MDPI, Basel, Switzerland. This article is an open access article distributed under the terms and conditions of the Creative Commons Attribution (CC BY) license (https://creativecommons.org/licenses/by/4.0/).

