

A Novel and Extensible Remote Sensing Collaboration Platform: Architecture Design and Prototype Implementation
 ,
,
Abstract
1. Introduction
2. Methods
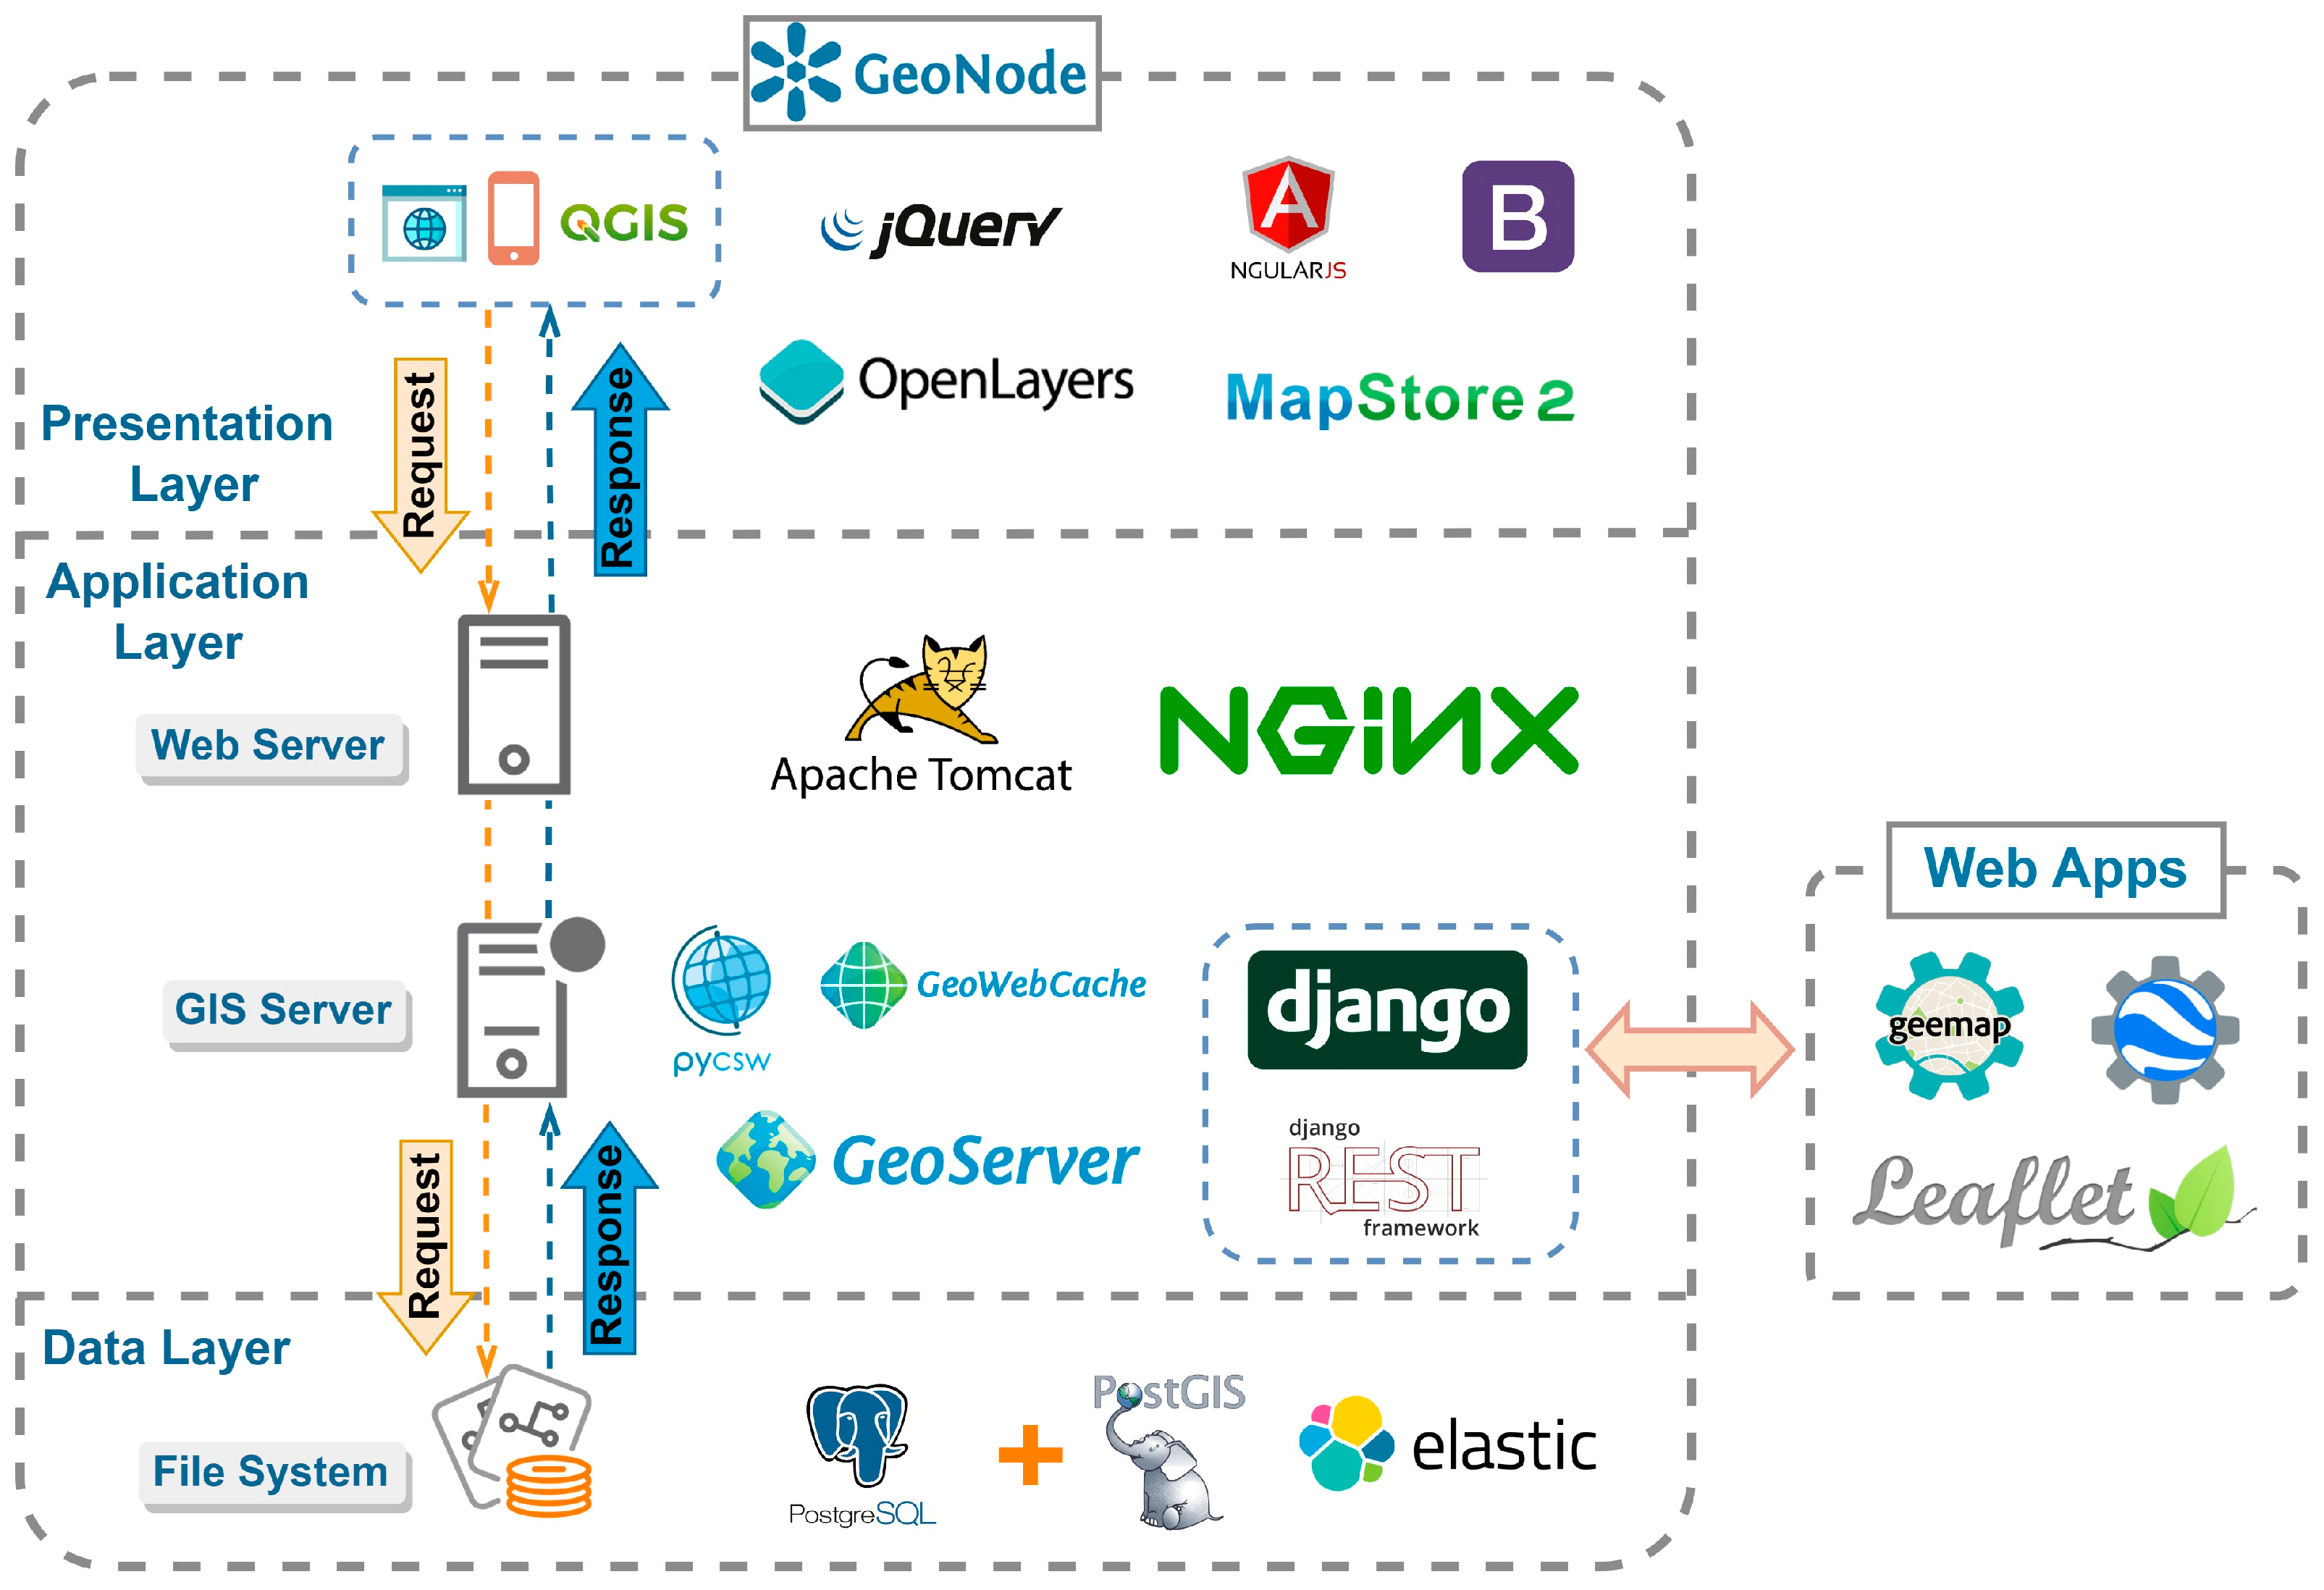
2.1. The Architecture for the GDS Platform
2.2. Interactive Solution with Leading Web Technology
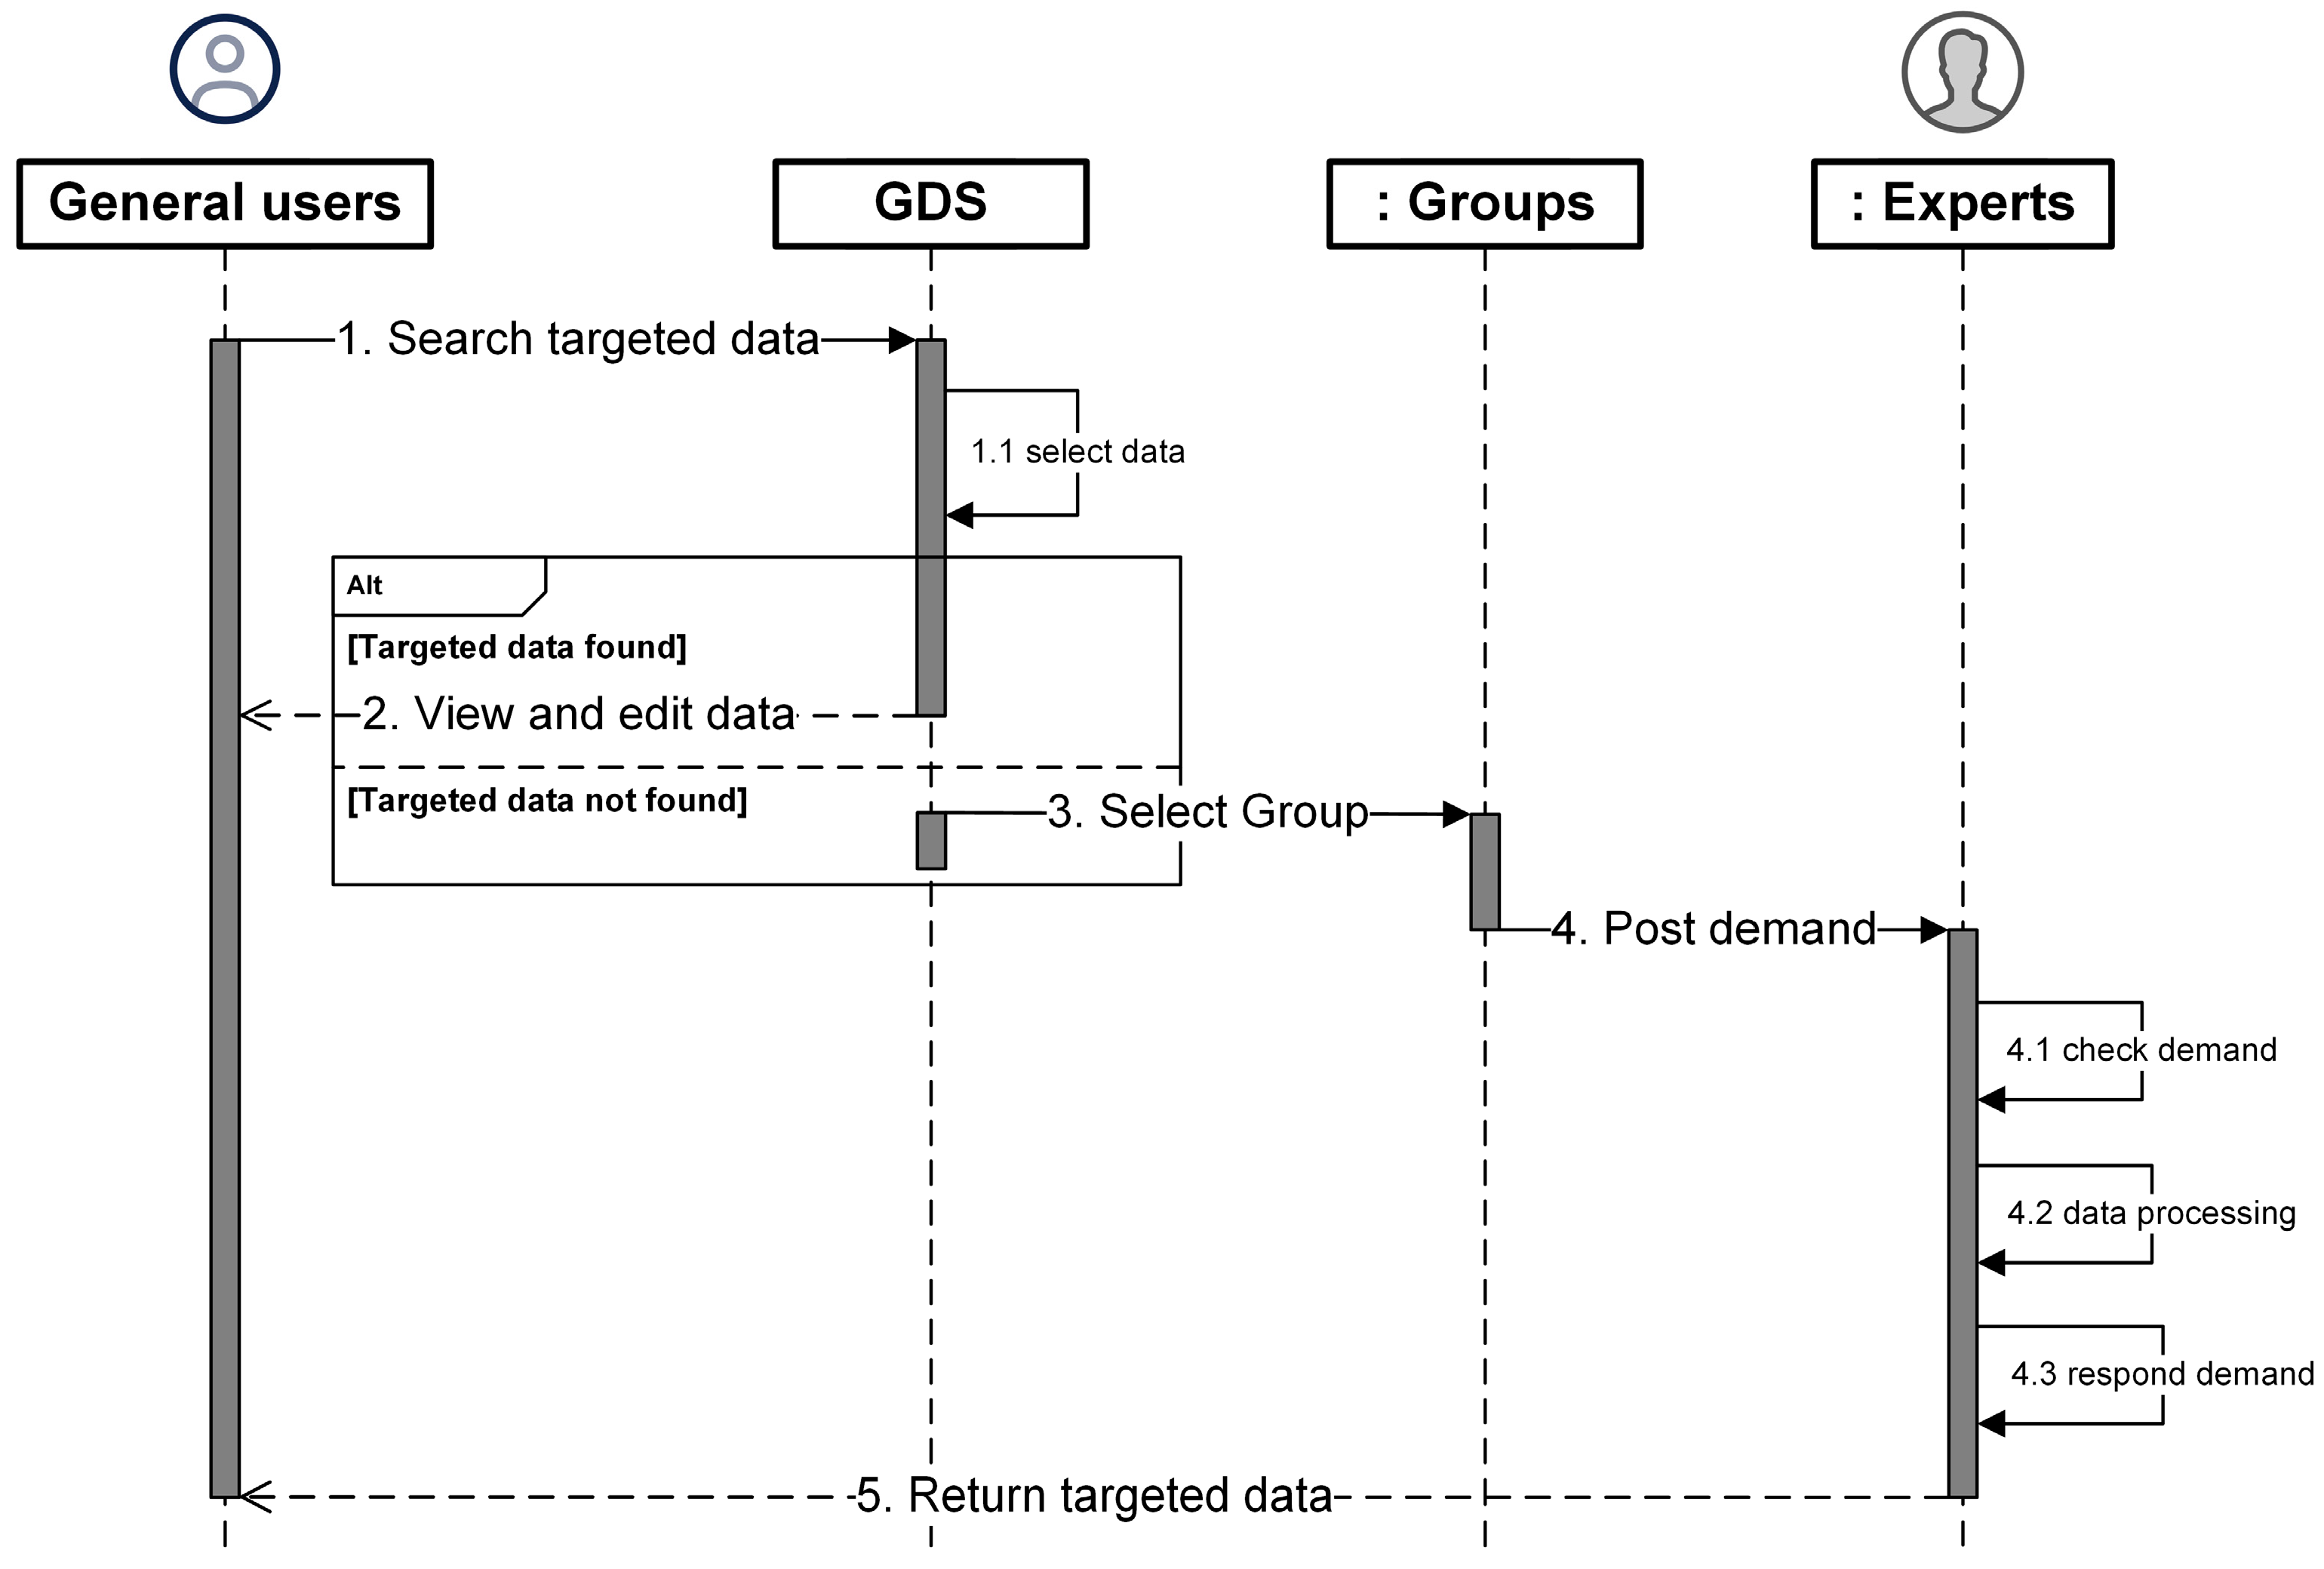
2.3. The Collaboration between General Users and Domain Experts
3. Datasets and Documents
4. Use Cases
4.1. Geology Case
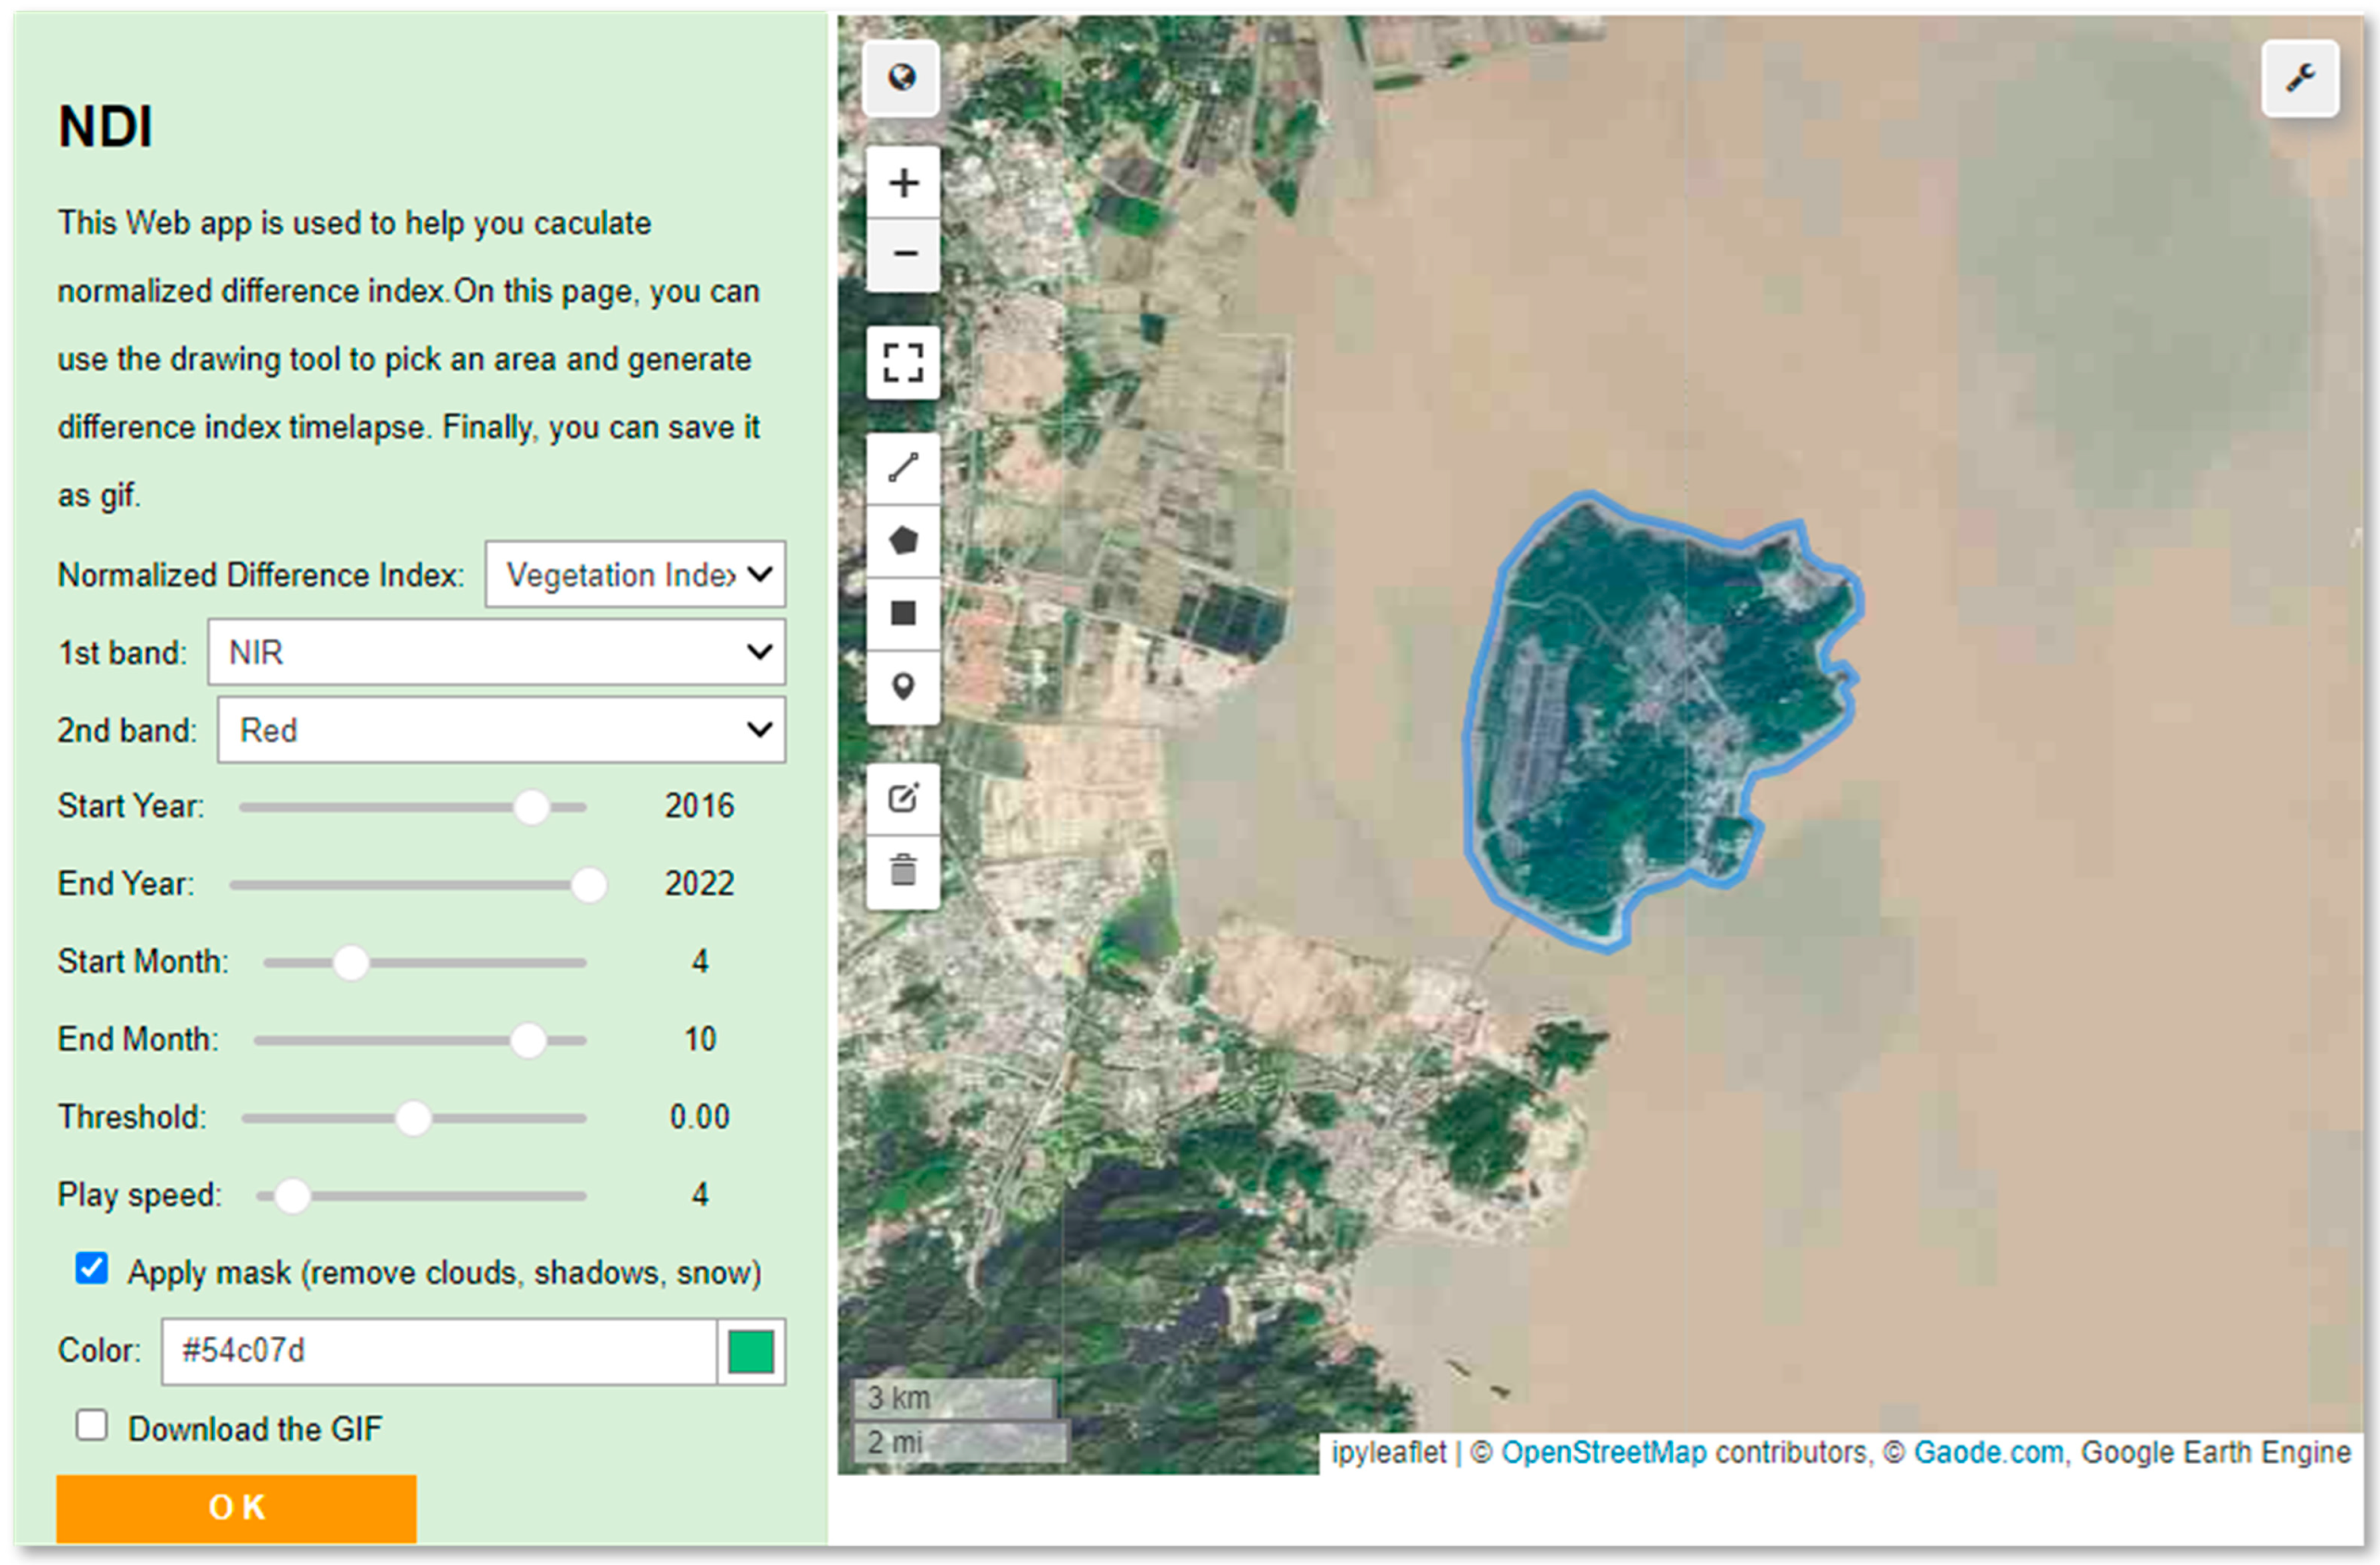
4.2. Ecology Case
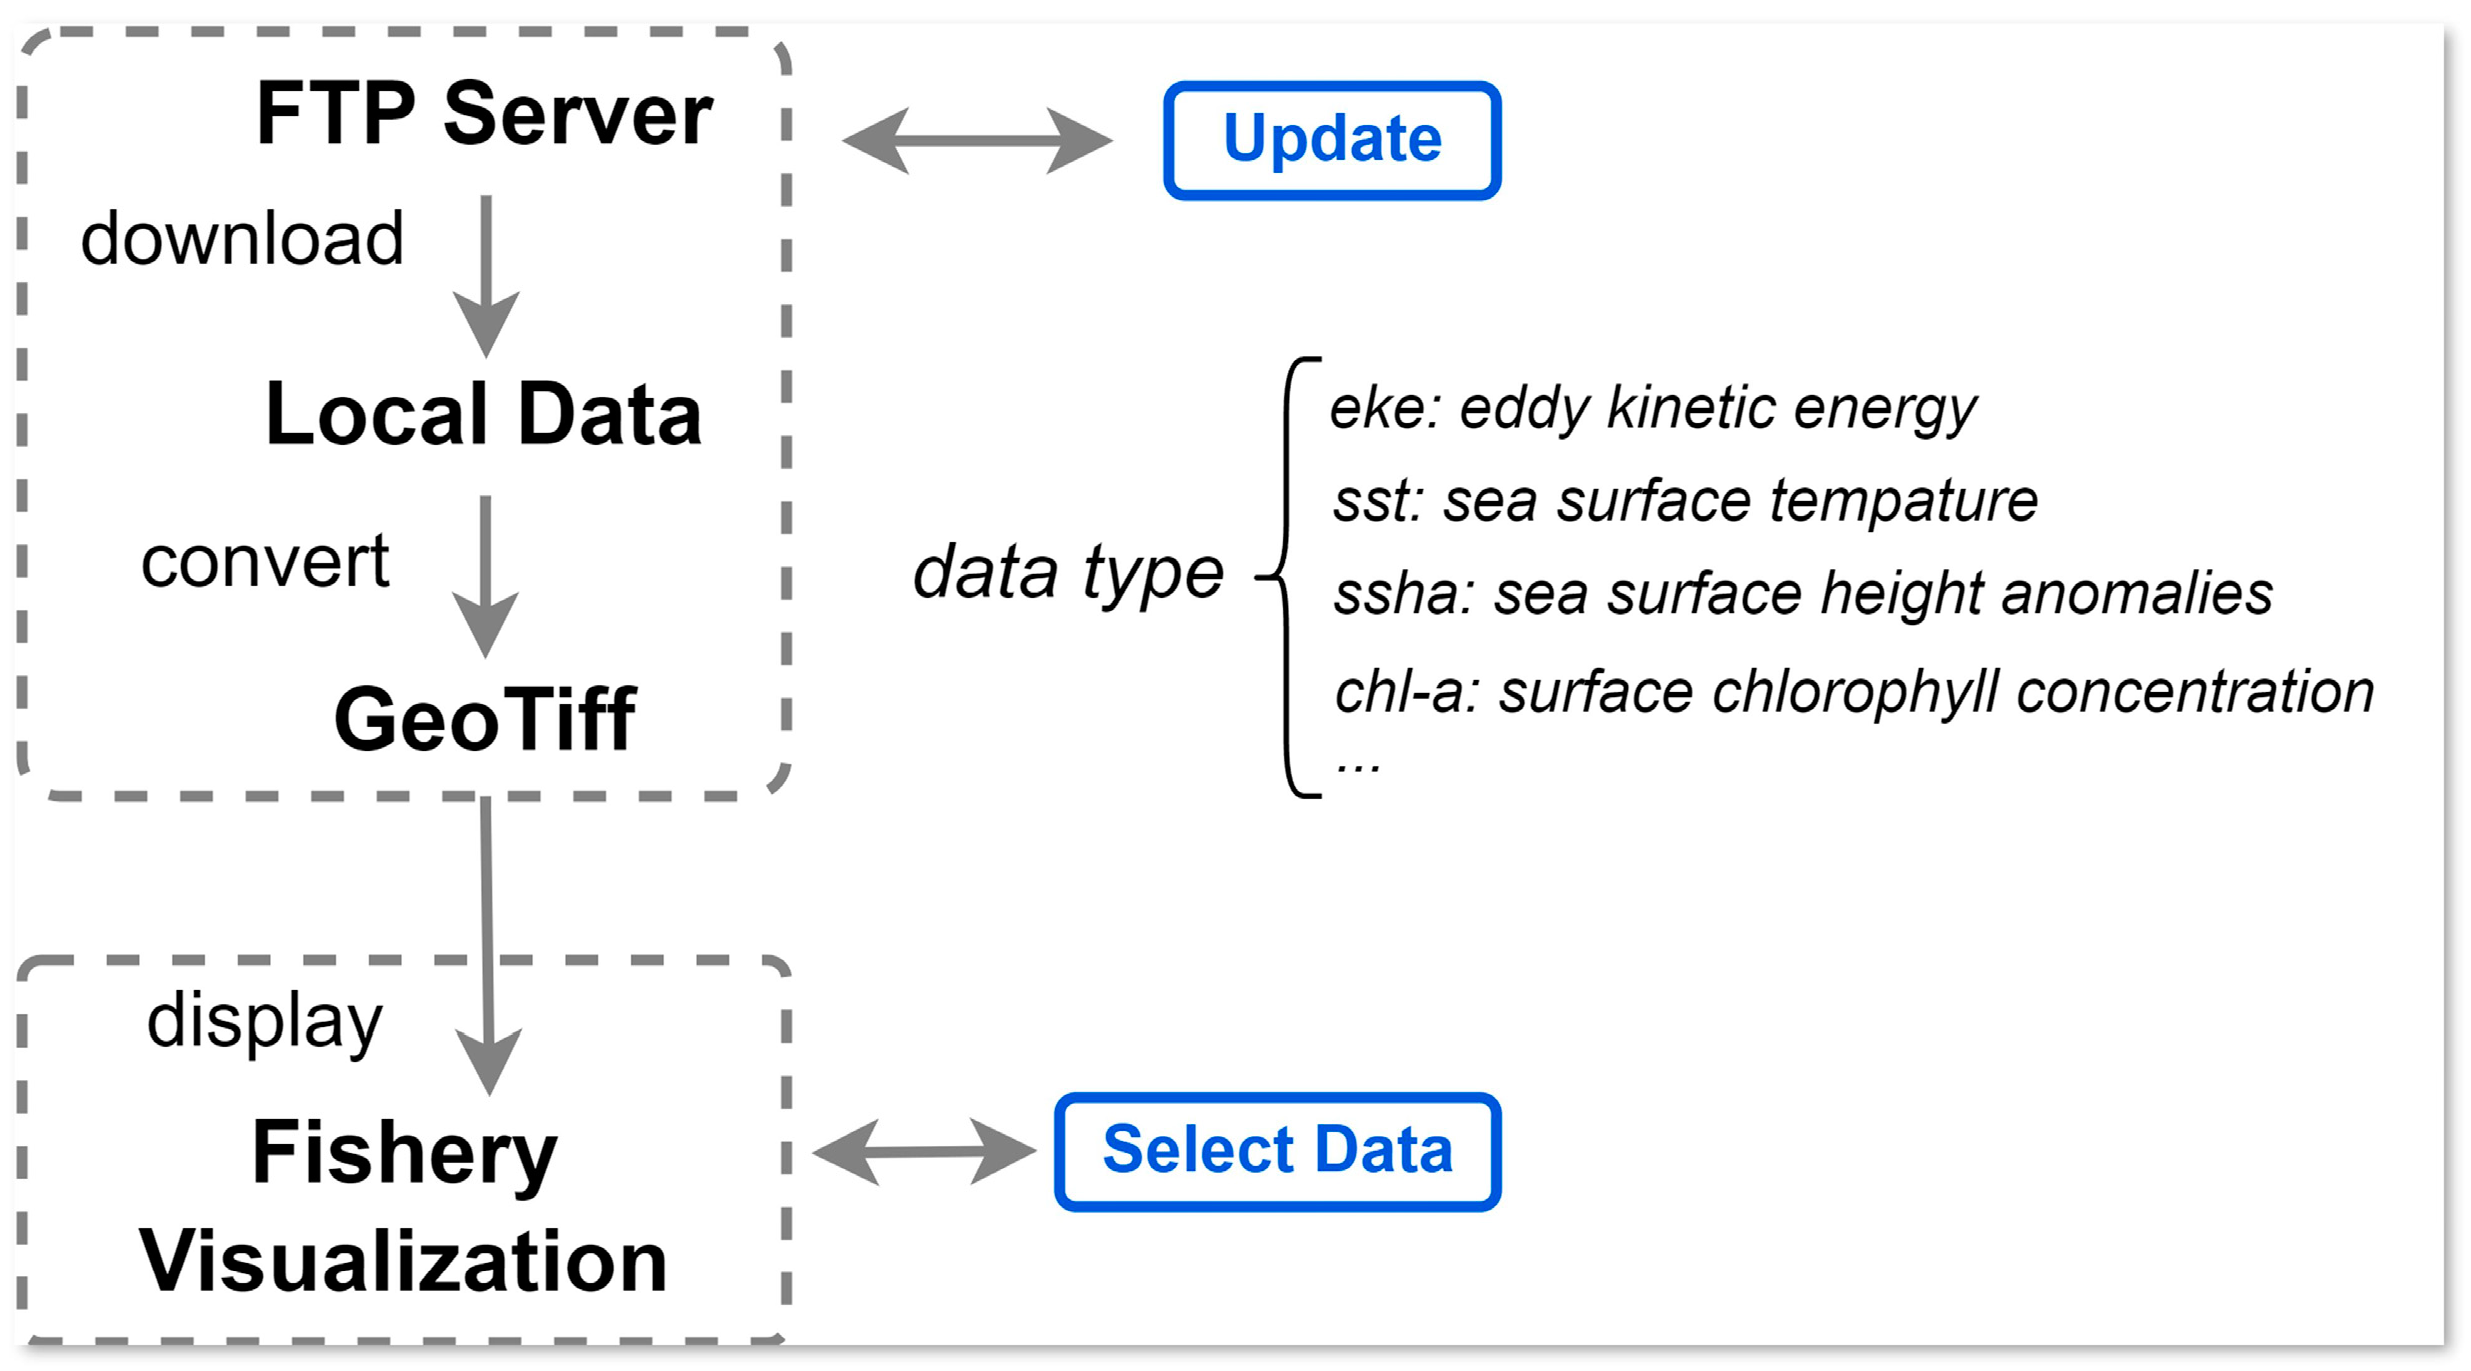
4.3. Oceanography Case
5. Discussion
5.1. Capabilities Analysis for Building GeoNode-Based SDI
5.2. Limitations and Future Improvements
6. Conclusions
Author Contributions
Funding
Data Availability Statement
Acknowledgments
Conflicts of Interest
References
- Afaq, Y.; Manocha, A. Analysis on Change Detection Techniques for Remote Sensing Applications: A Review. Ecol. Inform. 2021, 63, 101310. [Google Scholar] [CrossRef]
- Tan, Z.; Yue, P.; Gong, J. An Array Database Approach for Earth Observation Data Management and Processing. ISPRS Int. J. Geo-Inf. 2017, 6, 220. [Google Scholar] [CrossRef]
- Wu, S.; Lin, X.; Bian, Z.; Lipson, M.; Lafortezza, R.; Liu, Q.; Grimmond, S.; Velasco, E.; Christen, A.; Masson, V.; et al. Satellite Observations Reveal a Decreasing Albedo Trend of Global Cities over the Past 35 Years. Remote Sens. Environ. 2024, 303, 114003. [Google Scholar] [CrossRef]
- Huang, X.; Wang, S.; Lu, T.; Liu, Y.; Serrano-Estrada, L. Crowdsourced Geospatial Data Is Reshaping Urban Sciences. Int. J. Appl. Earth Obs. Geoinf. 2024, 2024, 103687. [Google Scholar] [CrossRef]
- Li, H.; Yang, X.; Scuderi, L.A.; Hu, F.; Liang, P.; Jiang, Q.; Buylaert, J.-P.; Wang, X.; Du, J.; Kang, S.; et al. East Gobi Megalake Systems Reveal East Asian Monsoon Dynamics over the Last Interglacial-Glacial Cycle. Nat. Commun. 2023, 14, 2103. [Google Scholar] [CrossRef]
- Dervisoglu, A. Investigation of Long and Short-Term Water Surface Area Changes in Coastal Ramsar Sites in Turkey with Google Earth Engine. ISPRS Int. J. Geo-Inf. 2022, 11, 46. [Google Scholar] [CrossRef]
- Wang, J.; Xiao, L.; Reiss, D.; Hiesinger, H.; Huang, J.; Xu, Y.; Zhao, J.; Xiao, Z.; Komatsu, G. Geological Features and Evolution of Yardangs in the Qaidam Basin, Tibetan Plateau (NW China): A Terrestrial Analogue for Mars. J. Geophys. Res. Planets 2018, 123, 2336–2364. [Google Scholar] [CrossRef]
- Tong, Y.; Feng, L.; Wang, X.; Pi, X.; Xu, W.; Woolway, R.I. Global Lakes Are Warming Slower than Surface Air Temperature Due to Accelerated Evaporation. Nat. Water 2023, 1, 929–940. [Google Scholar] [CrossRef]
- Karimli, N.; Selbesoğlu, M.O. Remote Sensing-Based Yield Estimation of Winter Wheat Using Vegetation and Soil Indices in Jalilabad, Azerbaijan. ISPRS Int. J. Geo-Inf. 2023, 12, 124. [Google Scholar] [CrossRef]
- Su, N.-J.; Chang, C.-H.; Hu, Y.-T.; Chiang, W.-C.; Tseng, C.-T. Modeling the Spatial Distribution of Swordfish (Xiphias Gladius) Using Fishery and Remote Sensing Data: Approach and Resolution. Remote Sens. 2020, 12, 947. [Google Scholar] [CrossRef]
- McCormack, T.; Campanyà, J.; Naughton, O. Reconstructing Flood Level Timeseries at Seasonal Wetlands in Ireland Using Sentinel-1. Remote Sens. Environ. 2023, 299, 113839. [Google Scholar] [CrossRef]
- Zhang, B.; Yin, J.; Jiang, H.; Qiu, Y. Application of Social Network Analysis in the Economic Connection of Urban Agglomerations Based on Nighttime Lights Remote Sensing: A Case Study in the New Western Land-Sea Corridor, China. ISPRS Int. J. Geo-Inf. 2022, 11, 522. [Google Scholar] [CrossRef]
- Camps-Valls, G.; Tuia, D.; Gómez-Chova, L.; Jiménez, S.; Malo, J. Remote Sensing Image Processing; Synthesis Lectures on Image, Video, and Multimedia Processing; Springer International Publishing: Cham, Switzerland, 2012; ISBN 978-3-031-01119-1. [Google Scholar]
- Elachi, C.; van Zyl, J.J. Introduction to the Physics and Techniques of Remote Sensing; John Wiley & Sons: Hoboken, NJ, USA, 2021; ISBN 978-1-119-52308-6. [Google Scholar]
- Zhu, A.-X.; Zhao, F.-H.; Liang, P.; Qin, C.-Z. Next Generation of GIS: Must Be Easy. Ann. GIS 2021, 27, 71–86. [Google Scholar] [CrossRef]
- Maphale, L.; Smit, J.L. A Theoretical Proposition for Spatial Data Infrastructure On-Going Improvement. ISPRS Int. J. Geo-Inf. 2021, 10, 9. [Google Scholar] [CrossRef]
- Maguire, D.; Longley, P. The Emergence of Geoportals and Their Role in Spatial Data Infrastructures. Comput. Environ. Urban Syst. 2005, 29, 3–14. [Google Scholar] [CrossRef]
- Vockner, B.; Mittlböck, M. Geo-Enrichment and Semantic Enhancement of Metadata Sets to Augment Discovery in Geoportals. ISPRS Int. J. Geo-Inf. 2014, 3, 345–367. [Google Scholar] [CrossRef]
- Friis-Christensen, A.; Lucchi, R.; Lutz, M.; Ostländer, N. Service Chaining Architectures for Applications Implementing Distributed Geographic Information Processing. Int. J. Geogr. Inf. Sci. 2009, 23, 561–580. [Google Scholar] [CrossRef]
- Wu, H.; You, L.; Gui, Z.; Hu, K.; Shen, P. GeoSquare: Collaborative Geoprocessing Models’ Building, Execution and Sharing on Azure Cloud. Ann. GIS 2015, 21, 287–300. [Google Scholar] [CrossRef]
- Ma, Z.; Chen, M.; Zheng, Z.; Yue, S.; Zhu, Z.; Zhang, B.; Wang, J.; Zhang, F.; Wen, Y.; Lü, G. Customizable Process Design for Collaborative Geographic Analysis. GISci. Remote Sens. 2022, 59, 914–935. [Google Scholar] [CrossRef]
- Corti, P.; Bartoli, F.; Fabiani, A.; Giovando, C.; Kralidis, A.T.; Tzotsos, A. GeoNode: An Open Source Framework to Build Spatial Data Infrastructures. PeerJ 2019, 7, e27534v1. [Google Scholar]
- Wu, Q. Geemap: A Python Package for Interactive Mapping with Google Earth Engine. J. Open Source Softw. 2020, 5, 2305. [Google Scholar] [CrossRef]
- Bégin, D.; Devillers, R.; Roche, S. Contributors’ Withdrawal from Online Collaborative Communities: The Case of OpenStreetMap. ISPRS Int. J. Geo-Inf. 2017, 6, 340. [Google Scholar] [CrossRef]
- Greeley, R.; Iversen, J.D. Wind as a Geological Process on Earth, Mars, Venus and Titan; Cambridge University Press: Cambridge, UK, 1987. [Google Scholar]
- Antoniou, V.; Ragia, L.; Nomikou, P.; Bardouli, P.; Lampridou, D.; Ioannou, T.; Kalisperakis, I.; Stentoumis, C. Creating a Story Map Using Geographic Information Systems to Explore Geomorphology and History of Methana Peninsula. ISPRS Int. J. Geo-Inf. 2018, 7, 484. [Google Scholar] [CrossRef]
- Graves, M.E. Spatial Narratives of Struggle and Activism in the Del Amo and Montrose Superfund Cleanups: A Community-Engaged Web GIS Story Map. Master’s Thesis, University of Southern California, Los Angeles, CA, USA, 2015. [Google Scholar]
- Montero, D.; Aybar, C.; Mahecha, M.D.; Martinuzzi, F.; Söchting, M.; Wieneke, S. A Standardized Catalogue of Spectral Indices to Advance the Use of Remote Sensing in Earth System Research. Sci. Data 2023, 10, 197. [Google Scholar] [CrossRef]
- Zha, Y.; Gao, J.; Ni, S. Use of Normalized Difference Built-up Index in Automatically Mapping Urban Areas from TM Imagery. Int. J. Remote Sens. 2003, 24, 583–594. [Google Scholar] [CrossRef]
- Tucker, C.J. Red and Photographic Infrared Linear Combinations for Monitoring Vegetation. Remote Sens. Environ. 1979, 8, 127–150. [Google Scholar] [CrossRef]
- Smith, A.M.S.; Wooster, M.J.; Drake, N.A.; Dipotso, F.M.; Falkowski, M.J.; Hudak, A.T. Testing the Potential of Multi-Spectral Remote Sensing for Retrospectively Estimating Fire Severity in African Savannahs. Remote Sens. Environ. 2005, 97, 92–115. [Google Scholar] [CrossRef]
- Chen, B.; Xiao, X.; Li, X.; Pan, L.; Doughty, R.; Ma, J.; Dong, J.; Qin, Y.; Zhao, B.; Wu, Z.; et al. A Mangrove Forest Map of China in 2015: Analysis of Time Series Landsat 7/8 and Sentinel-1A Imagery in Google Earth Engine Cloud Computing Platform. ISPRS J. Photogramm. Remote Sens. 2017, 131, 104–120. [Google Scholar] [CrossRef]
- Mugo, R.; Saitoh, S.-I.; Nihira, A.; Kuroyama, T. Application of Multi-Sensor Satellite and Fishery Data, Statistical Models and Marine-GIS to Detect Habitat Preferences of Skipjack Tuna. In Handbook of Satellite Remote Sensing Image Interpretation: Applications for Marine Living Resources Conservation and Management; EU PRESPO & IOCCG: Dartmouth, NC, Canada, 2011; pp. 169–185. [Google Scholar]
- Valavanis, V.D.; Pierce, G.J.; Zuur, A.F.; Palialexis, A.; Saveliev, A.; Katara, I.; Wang, J. Modelling of Essential Fish Habitat Based on Remote Sensing, Spatial Analysis and GIS. In Essential Fish Habitat Mapping in the Mediterranean; Valavanis, V.D., Ed.; Developments in Hydrobiology; Springer: Dordrecht, The Netherlands, 2008; pp. 5–20. ISBN 978-1-4020-9141-4. [Google Scholar]
- Trilles, S.; Díaz, L.; Huerta, J. Approach to Facilitating Geospatial Data and Metadata Publication Using a Standard Geoservice. ISPRS Int. J. Geo-Inf. 2017, 6, 126. [Google Scholar] [CrossRef]


| Name | Stakeholder or Coordinator | Scope (International, National, Local) | Website |
|---|---|---|---|
| GeoINTA | National Institute of Agricultural Technology of Argentine | National | https://geo-backend.inta.gob.ar/#/ (accessed on 6 December 2023) |
| GeoMOP | Public Works Ministry of Argentine | National | https://geoportal.obraspublicas.gob.ar/ (accessed on 6 December 2023) |
| Geoportal 3F | Buenos Aires province, Argentine | Local | https://geoportal.tresdefebrero.gob.ar/ (accessed on 6 December 2023) |
| Geoportal Lujan de Cuyo | Mendoza province, Argentine | Local | https://geoportal.lujandecuyo.gob.ar/ (accessed on 6 December 2023) |
| DECAT | Cyprus | National | https://decatastrophize.eu/ (accessed on 6 December 2023) |
| Ocean Observatory | Mauritius | National | https://gococeanobservatory.govmu.org/ (accessed on 6 December 2023) |
| CEPAL | UN—ECLAC | International | https://geoportal.cepal.org/ (accessed on 6 December 2023) |
| THAL CHOR | Greece | National | https://thalchor-2.ypen.gov.gr/ (accessed on 6 December 2023) |
Disclaimer/Publisher’s Note: The statements, opinions and data contained in all publications are solely those of the individual author(s) and contributor(s) and not of MDPI and/or the editor(s). MDPI and/or the editor(s) disclaim responsibility for any injury to people or property resulting from any ideas, methods, instructions or products referred to in the content. |
© 2024 by the authors. Licensee MDPI, Basel, Switzerland. This article is an open access article distributed under the terms and conditions of the Creative Commons Attribution (CC BY) license (https://creativecommons.org/licenses/by/4.0/).
Share and Cite
Gao, W.; Chen, N.; Chen, J.; Gao, B.; Xu, Y.; Weng, X.; Jiang, X. A Novel and Extensible Remote Sensing Collaboration Platform: Architecture Design and Prototype Implementation. ISPRS Int. J. Geo-Inf. 2024, 13, 83. https://doi.org/10.3390/ijgi13030083
Gao W, Chen N, Chen J, Gao B, Xu Y, Weng X, Jiang X. A Novel and Extensible Remote Sensing Collaboration Platform: Architecture Design and Prototype Implementation. ISPRS International Journal of Geo-Information. 2024; 13(3):83. https://doi.org/10.3390/ijgi13030083
Chicago/Turabian StyleGao, Wenqi, Ninghua Chen, Jianyu Chen, Bowen Gao, Yaochen Xu, Xuhua Weng, and Xinhao Jiang. 2024. "A Novel and Extensible Remote Sensing Collaboration Platform: Architecture Design and Prototype Implementation" ISPRS International Journal of Geo-Information 13, no. 3: 83. https://doi.org/10.3390/ijgi13030083
APA StyleGao, W., Chen, N., Chen, J., Gao, B., Xu, Y., Weng, X., & Jiang, X. (2024). A Novel and Extensible Remote Sensing Collaboration Platform: Architecture Design and Prototype Implementation. ISPRS International Journal of Geo-Information, 13(3), 83. https://doi.org/10.3390/ijgi13030083