Article

Knowledge Graph Representation of Multi-Source Urban Storm Surge Hazard Information Based on Spatio-Temporal Coding and the Hazard Events Ontology Model

1
The International Research Center of Big Data for Sustainable Development Goals, Beijing 100094, China
2
School of Computer Science, China University of Geosciences, Wuhan 430078, China
3
Hubei Key Laboratory of Intelligent Geo-Information Processing, China University of Geosciences, Wuhan 430078, China
*
Author to whom correspondence should be addressed.
ISPRS Int. J. Geo-Inf. 2024, 13(3), 88; https://doi.org/10.3390/ijgi13030088
Submission received: 6 November 2023 / Revised: 20 February 2024 / Accepted: 6 March 2024 / Published: 11 March 2024
(This article belongs to the Topic Geospatial Knowledge Graph)

Abstract

:
Coastal cities are increasingly vulnerable to urban storm surge hazards and the secondary hazards they cause (e.g., coastal flooding). Accurate representation of the spatio-temporal process of hazard event development is essential for effective emergency response. However, current knowledge graph representations face the challenge of integrating multi-source information with various spatial and temporal scales. To address this challenge, we propose a new information model for storm surge hazard events, involving a two-step process. First, a hazard event ontology is designed to model the components and hierarchical relationships of hazard event information. Second, we utilize multi-scale time segment integer coding and geographical coordinate subdividing grid coding to create a spatio-temporal framework, for modeling spatio-temporal features and spatio-temporal relationships. Using the 2018 typhoon Mangkhut storm surge event in Shenzhen as a case study and the hazard event information model as a schema layer, a storm surge event knowledge graph is constructed, demonstrating the integration and formal representation of heterogeneous hazard event information and enabling the fast retrieval of disasters in a given spatial or temporal range.

1. Introduction

Urban storm surge hazards and the secondary hazards they cause, such as coastal flooding, can have devastating effects on the infrastructure and people in coastal cities [1,2]. To reduce the risk of urban storm surge hazards to urban public safety, there is an urgent need to develop more accurate emergency management plans to improve the emergency management capabilities of coastal cities in the face of storm surge events [3]. The first task to achieve this goal requires an accurate understanding of the dynamic evolution of a hazard situation [4]. Hazard event information includes data from various sources, such as hazard simulation data, which are used to model and predict the potential development trend of hazards [5,6] and hazard-related text data, including news reports [7] and social media data [8,9,10], which are used to obtain real-time disasters and social responses to hazards. The comprehensive analysis of these diverse data resources is essential for a comprehensive understanding of the dynamic evolution of hazard events and the adoption of appropriate response measures. The inconsistent spatial and temporal resolutions and formats of the available data make it challenging to organize and manage them in a standardized manner. Consequently, the full potential of these data remains underutilized, leading to an incomplete understanding of the dynamics of hazard events. Therefore, we first need to model this heterogeneous hazard event information from multiple sources to organize it in a unified framework; and then formally represent the change process of disaster situations based on this framework.
In the field of natural hazards, information models can be broadly classified into three categories: static conceptual models [11,12,13,14,15,16], time-slice snapshot models [17,18], and spatio-temporal models [19,20,21,22]. Static conceptual models are designed to represent the static information of hazard events and, therefore, cannot capture the dynamic evolution of hazard events. Conversely, time-slice snapshot models can reflect temporal changes in hazard events to a limited extent, but they capture only a portion of the characteristics of hazards over a specific time interval and cannot characterize the spatial variations of hazards. To address these limitations, researchers have developed spatio-temporal models oriented toward the spatio-temporal process of disaster events. Such models are designed to capture the spatio-temporal characteristics of the constituent objects in hazard event information and the spatio-temporal relationships among these objects. However, these models struggle to effectively represent implicit relationships between objects that are not expressed in the text or location relationships between objects on smaller spatial scales that are not viable to represent (e.g., the relationship between different roads and flooded areas within the same community).
To address these challenges, we propose using multi-scale time segment integer coding (MTSIC) [23] and a geographical coordinate subdividing the grid with one-dimension integer coding on a 2n tree (GeoSOT) [24] to represent the temporal and spatial characteristics of hazard event constituents, respectively. By calculating the spatio-temporal relationships between objects and establishing a spatio-temporal framework of hazard event information, we build a multi-source heterogeneous hazard event information model that combines our designed hazard event ontology model. Furthermore, we conduct a case study of the 2018 storm surge event in Shenzhen City and formalize the hazard event information model by constructing a knowledge graph of the storm surge hazard event. The results of the case study show that our knowledge graph can effectively represent the evolution of urban storm surge hazard events. The main contributions of this study are summerized as follows.
  • We developed a storm surge hazard event ontology model and a spatio-temporal framework that unifies multiple spatial and temporal scales to create an information model that integrates storm surge hazard event information from multiple sources in multiple formats and on multiple spatial and temporal scales.
  • Based on the constructed multi-source hazard event information model, we design methods for constructing a knowledge graph to formalize disaster knowledge from multi-source heterogeneous hazard event information.
  • Finally, we used basic geographic data, multitemporal water depth simulation data (provided by Wang et al., 2022 [25]), and microblog text data to construct a knowledge graph for the 2018 typhoon Mangkhut storm surge event in Shenzhen, revealing the spatial and temporal distribution of the different categories of hazard-bearing bodies affected by the storm surge hazard and providing the retrieval of all affected hazard-bearing bodies within a given spatial or temporal range.
The paper is organized as follows: Section 2 briefly reviews hazard event information models and representation methods. Section 3 provides an overview of the proposed method, and Section 4 analyzes a case study in Shenzhen, Guangdong Province, China, for the storm surge caused by typhoon Mangkhut in 2018. Section 6 summarizes our work and draws conclusions.

2. Related Work

2.1. Hazard Event Information Modeling

An information model represents information through which different entities, entity characteristics, and their relationships with the object being modeled can be expressed. In the following, we will introduce the information models based on static concepts and time-slice snapshots oriented toward spatio-temporal processes in detail.
Static conceptual models are used to classify the hierarchy between concepts based on the semantic relationships between concepts after analyzing the different types of concepts involved in a hazard event. An existing class of static conceptual models is the generic information model constructed for hazards. To enable the sharing of data between different disaster sectors during a disaster response, many organizations have developed common metadata standards for disaster events, including the common alerting protocol  [13] and the emergency data exchange language  [14], among others. Although these common information models contain definitions of the main attributes and characteristics of hazard events and related elements, such as stages of development, these definitions are coarse-grained, can only describe the basic framework of a hazard, and do not address the various specific elements of a hazard event for a particular hazard type. Another category of static conceptual models for specific hazard types is based on ontology language [15,16]. Ref. [15] used the web ontology language (OWL) to build an ontology model in the domain of typhoon hazards, clarifying the relationships among three aspects of typhoon hazards, namely, the hazard-pregnant environment, the hazard-causing factors, and the disaster-bearing bodies, and using the Jena inference engine and custom rules to achieve the mining of information about the influencing factors or hazard chains of typhoon hazards. Liu et al. [16] constructed a typhoon hazard ontology using formal concept analysis, a Chinese taxonomic thesaurus, and WordNet. This ontology includes the main concepts of typhoon forecasting, direct and secondary hazards caused by typhoons, and typhoon emergency management. However, these static conceptual models mainly represent static information and lack the ability to represent the dynamic evolutionary process of disaster events (Figure 1A).
The time-slice snapshot model records the various characteristics of typhoon disaster events in the form of snapshots at different moments and forms a time series according to the sequence of moments to reflect the changes of typhoon disaster events [17,18]. These models reflect the dynamic changes in typhoons to a certain extent. However, they usually only record part of the characteristic information of typhoons (e.g., typhoon intensity, typhoon track, etc.) according to certain time intervals, cannot express the characteristics of typhoons at different spatial locations, and lack the overall and hierarchical representation of typhoon hazard events and their constituent objects (see Figure 1B).
To further improve the ability to represent the dynamic evolution of disaster events and their constituent objects, researchers have proposed disaster event information models oriented toward spatio-temporal process modeling. Ref. [19] studied a meteorological hazard domain ontology that contains four types of constituent objects: hazard events, hazard-pregnant environments, hazard-bearing bodies, and emergency management. Specifically, to represent the spatial and temporal characteristics of these constituent objects, they introduced a geospatial ontology and an OWL-time ontology [26]. Finally, they used the spatial analysis functions provided by ArcGIS to calculate the spatial relationships between geospatial objects. However, their reused OWL-time ontology focuses on deterministic and accurate timestamp-based temporal representations, which cannot satisfy a more complex temporal feature representation, such as fuzzy time and multi-granularity time [20]. Ref. [21] constructed a multi-level typhoon event information model (TEIM) based on “object–process–state–feature”. To aggregate typhoon disaster information with multiple spatial and temporal granularities in the microblogs, they normalized the spatial and temporal information extracted from the texts based on a unified spatial and temporal framework and then established transferring relationships between states. For comparison, we utilized the TEIM model to model the typhoon Mangkhut’s track information, as shown in Figure 1C.
Figure 1. The typhoon MANGKHUT event examples with structures of (A) the static conceptual model [16], (B) the timeslice snapshot model, and (C) the spatio-temporal process model [21,27].
Ijgi 13 00088 g001
Ref. [22] also developed a multi-level typhoon event information model based on “object–process–state–feature” and added the object of response behavior to Peng Ye’s TEIM [21]. However, the spatial framework Huang built is composed of both Chinese administrative divisions and meteorological–geographical administrative divisions, and its finest granularities are district and county, which are not sufficient. Moreover, the spatial relationships Huang defined only include “contain”, “contained”, and “equivalent”. Furthermore, these information models are mainly intended for web text information. However, in addition to web texts, remote sensing images, basic geographic information data, and numerical hazard simulation data are also important for understanding the evolution of hazard events [5,25,28]. Therefore, we also investigate modeling methods for multi-source hazard event information.

2.2. Formal Methods for Hazard Event Information

Formal methods are an important element in the representation of information and are the basis for the application of information resources. On the one hand, the acquired information must be represented, organized, and stored. On the other hand, the formal representation of information determines the efficiency of information processing and the scope of the application. Currently, finite state machines and knowledge graphs are the main methods used to formalize hazard event information. Ref. [27] used an extended finite state machine to formalize the process of the dynamic state change of the constituent objects of a typhoon hazard event, and obtained the state transfer sequences of different objects. However, finite state machines can only represent a finite number of states. A knowledge graph is essentially a large-scale semantic network that can represent richer semantic relationships and contain more entities than a standard semantic network [29]. Several studies on different areas of hazards have used knowledge graphs to formally represent hazard information. For example, ref. [30] developed a knowledge graph of typhoon hazard events based on TEIM with “concept layer–object layer–state layer–feature layer–relationship layer” as the schema layer. This knowledge graph can formally represent the spatial and temporal processes of changes in the constituent objects of typhoon hazard events and the influential relationships among the constituent objects. However, as no rules for calculating spatial relationships are given in the schema layer, this knowledge graph is still unable to automatically reason the implied spatial relationships between object nodes. Therefore, methods for modeling and representing multiscale spatio-temporal information in storm surge hazard events need to be further explored.
Many studies have been conducted on the organization and management of large-scale spatio-temporal data [23,31,32,33]. These studies have shown that the multi-scale temporal integer coding MTSIC and the spatial grid coding GeoSOT are effective tools for identifying, recording, computing, and counting spatio-temporal information [23,33]. Therefore, to better model the multi-scale spatio-temporal characteristics of storm surge hazard events and to automatically compute the spatio-temporal relationships between constituent objects, we adopt the MTSIC and the GeoSOT to represent the spatio-temporal information in hazard information.

3. Materials and Methods

Urban storm surge hazard information contains hazard-related data obtained from various sources. These data provide a description of the destructive impact of storm surges and secondary disasters on humans, urban infrastructure, and social activities in terms of various spatial and temporal perspectives. However, as the format and spatial and temporal resolutions of these data are not uniform, it is difficult to obtain comprehensive and accurate disaster knowledge directly from this fragmented information. Therefore, we use a knowledge graph to model and represent the disaster knowledge embedded in the disaster event information. A knowledge graph is a knowledge-based representation method that can integrate heterogeneous data from multiple sources, mine the implicit relationships between data objects, and formalize them in the form of graphs.
To create a knowledge graph, it is necessary to use the hazard event information modeling approach to construct the schema layer. The schema layer is the framework of the knowledge graph. Multi-scale spatio-temporal coding is introduced to represent the temporal and spatial features of hazard event data and to incorporate them into a unified spatio-temporal framework. A hazard event ontology model is designed to model semantic relationships. By combining the hazard event ontology model with the spatio-temporal framework, the capability of existing hazard event information models to represent multi-scale spatio-temporal features and relations has been improved. We then conduct knowledge extraction and reasoning based on the established information model in order to complete the construction of the knowledge graph and obtain comprehensive hazard knowledge.
The workflow of our methodology is depicted in Figure 2. In the following section, we introduce the storm surge hazard event information model we designed and the process of knowledge graph construction.

3.1. Modeling of Multi-Source Heterogeneous Hazard Event Information

When modeling information related to storm surge hazard events, one must consider the diverse objects and hierarchical structure comprising such events and their changing spatio-temporal characteristics. To efficiently construct an ontology model for storm surge hazard events, we adopt an approach that reuses and extends the generic event ontology, design the storm surge hazard event ontology based on the generic event ontology, and construct a unified spatio-temporal framework using spatio-temporal coding technologies. We use this event ontology model and spatio-temporal framework to model the change process of different constituent objects during the occurrence of the hazard event, thereby enabling us to model multi-source heterogeneous storm surge hazard event data. In the following, we introduce our designed hazard event ontology and the spatio-temporal framework based on spatio-temporal coding.

3.1.1. Hazard Event Ontology

In this paper, we choose the event ontology model ABC proposed by [34], as the top-level ontology because of its generality and expandability. ABC ontology is a generic conceptual model for event ontology modeling, which consists of concepts, attributes, and relationships between concepts. The concepts in the ABC ontology include a top-level concept of the entity and five entity subclasses: temporality, actuality, abstraction, time, and place. The actuality subclass is a collection of entities that actually exist in an event. These concepts provide a generic description of the characteristics common to various events. However, these concepts and attributes are broad for hazard events and cannot accurately express the knowledge of the disaster situation described in the information about the disaster event. Therefore, we expand the concepts in the ABC ontology. A hazard event is composed of three types of entities, namely, the hazard-inducing environment, the hazard-bearing body, and the hazard-causing factor. Therefore, the actuality class can be expanded into three subclasses: hazard-inducing environment, hazard-bearing body, and hazard-causing factor. The hazard-bearing body class is further expanded into four subclasses: building, social daily activities, urban infrastructure, and people. The temporality subclass is a collection of temporal concepts in event information, including situation, event, action, and agent. In a hazard event, an emergency disaster situation describes the damage situation of a hazard-bearing body at different times, while an emergency action represents the emergency measures taken by individuals at different times in response to a disaster. Thus, we refer to the emergency situation and emergency action concepts as the subclasses of the situation and the action classes, respectively. We reuse the time and place concepts to represent temporal and spatial information in the hazard event information, respectively.
The emergency situation concept is linked to the event concept through the at_Time relation, which represents the time at which an emergency disaster situation happens at the time. The has_influenced relation, which represents the hazard-bearing body that is affected in a disaster situation, describes the relationship between the emergency situation and the hazard-bearing body. The in_Place relation connects the hazard-bearing body concept to the place concept, indicating the spatial location of the hazard-bearing body. The relationships between the concepts of the hazard event ontology model are shown in the Figure 3.

3.1.2. Spatio-Temporal Framework Based on Spatio-Temporal Coding

The spatio-temporal framework is the basis for describing the evolutionary process of urban storm surge hazard events. This evolutionary process is composed of the change processes of multiple objects. Different sources of hazard information describe the change processes of different objects and contain spatio-temporal information on different spatio-temporal scales. Using the developed spatio-temporal framework, we can integrate disaster-related information from different scales. Two coding techniques, MTSIC and GeoSOT, are introduced for representing temporal and spatial information in multi-source urban storm surge hazard data. By applying MTSIC and GeoSOT, we calculate the relationships between the spatial and temporal information and use them to construct a spatio-temporal framework for urban storm surge hazard information. In the following section, we describe these two coding techniques and the methods of computing temporal and spatial relationships using them.

MTSIC

Considering the shortcomings of traditional time identification methods and string identification methods, we use the MTSIC method proposed by [23] to normalize the time information contained in disaster data on multiple time scales. The principle of MTSIC is to take a bounded time interval (e.g., 1990–2022), bifurcate the time scales of year, month, day, hour, minute, and second through multiple temporal binary expansions, and finally assign a unique m-bit integer to each segmentation unit. The whole MTSIC system corresponds to an m-level binary tree, and the different levels of the binary tree correspond to different time scales. The main computational process of the MTSIC is to first convert the input time period information (e.g., A Year B Month C Day D:E:F) into a single-scale time period integer code (STSIC) and then convert the generated STSIC into the MTSIC according to the time scale of the time segment. Convert intergers (A-1990) into a 6-bit binary number, B into a 4-bit binary number, C and D each into a 5-bit binary number, and both E and F into 6-bit binary numbers. Then, the STSIC T c is obtained by concatenating these binary numbers in order. Finally, the MTSIC M T c (an m bit integer) with N corresponding levels is converted by calculating the following equations.
T c = T c < < 1 M T c = ( ( T c > > ( m N ) ) < < ( m N ) ) + D e t a T 1
where D e t a T denotes the time period coding in the N-th level of codings ordered closest to the integer 0, D e t a T = 1 < < ( m N 1 ) . N represents the level of time coding. Different time coding levels correspond to various time scales. The annual scale corresponds to coding level 5, the monthly scale to coding level 9, the daily scale to coding level 14, and the hourly scale to level 19.

GeoSOT Spatial Coding

GeoSOT [24] subdivides the projected global surface space into a 32-level multi-scale spatial grid through the recursive subdivision of a quadtree. The levels of the grid correspond to the scale of the grid, with level 0 representing the entire surface of the Earth and level 32 representing the smallest dissected grid. As shown in Figure 4, each grid cell has a globally unique code using the spatial Z-order encoding method.

Computing Temporal and Spatial Relationships

In multi-source heterogeneous hazard data, the description types of temporal information can be divided into time points and time periods. To facilitate the calculation of the relationship between any two temporal information points, we represent a time point as a time period with the same start time and end time, and then develop a method to calculate the temporal relationship between any two time periods based on the calculation of temporal relationships provided by Tong et al. [23]. Our study defines four temporal relationships: adjacent, inclusion, overlap, and disjoint. Algorithm 1 depicts the process of computing various temporal relations based on time encoding.
Similarly, in order to calculate the spatial relationship between any two spatial information points, we define the calculation method for spatial relations based on spatial encoding. The spatial relations include touches, overlaps, disjoint, and contains. These relations are derived from the dimensionally extended nine-intersection model [35]. Algorithm 2 describes the method for calculating various spatial relations.
Algorithm 1 Temporal relations calculation
Input: Time periods P1 and P2
Output: Relationship between P1 and P2
  1:
Calculate the sub time coding intervals [A1, B1] and [A2, B2] of time periods P1 and P2 respectively.
  2:
if B1 < A2 then
  3:
      P1 and P2 are disjointed, with P1 earlier than P2.
  4:
else if B2 < A1 then
  5:
      P1 and P2 are disjointed, with P2 earlier than P1.
  6:
end if
  7:
      if A1  < =  A2 and B2  < =  B1 then
  8:
            P1 contains P2.
  9:
      else if A2  < =  A1 and B1  < =  B2 then
10:
            P2 contains P1.
11:
      end if
12:
      if A1 < A2 and A2 < B1 and B1 < B2 then
13:
            P1 and P2 intersect, with P1 earlier than P2.
14:
      else if A2 < A1 and A1 < B2 and B2 < B1 then
15:
            P1 and P2 intersect, with P2 earlier than P1.
16:
      end if
17:
      if A2 == B1 + 2 then
18:
            P1 and P2 are adjacent, with P1 earlier than P2.
19:
      else if A1 == B2 + 2 then
20:
            P2 and P1 are adjacent, with P2 earlier than P1.
21:
      end if
Algorithm 2 Spatial relationship calculation
Input: Spatial information SP1 and SP2
Output: Spatial relationship between SP1 and SP2
  1:
Calculate coding levels Level1 and Level2 for spatial information SP1 and SP2, respectively.
  2:
Set Level to the maximum of Level1 and Level2. Calculate spatial code sets G1 and G2 for SP1 and SP2 at Level.
  3:
Calculate the 8-neighborhood spatial codes for each code in G1 and G2, record them as G1_neighbor and G2_neighbor.
  4:
Compute intersection(G1, G2), intersection(G1, G2_neighbor), and intersection(G2, G1_neighbor).
  5:
if Length of intersection(G1, G2), intersection(G1, G2_neighbor), and intersection(G2, G1_neighbor) is 0 then
  6:
      The spatial relationship is disjoint.
  7:
end if
  8:
if Length of intersection(G1, G2) is 0 and (Length of intersection(G1, G2_neighbor) or Length of intersection(G2, G1_neighbor) is not 0) then
  9:
      The spatial relationship is touches.
10:
end if
11:
if Length of intersection(G1, G2) is not 0 and is smaller than lengths of G1 and G2 then
12:
      The spatial relationship is overlap.
13:
end if
14:
if Length of intersection(G1, G2) is equal to length of G1 or G2 then
15:
      The spatial relationship is contains.
16:
end if

3.2. Representation of Multi-Source Heterogeneous Hazard Event Information Based on a Knowledge Graph

In this section, we design various knowledge extraction strategies for many types of data. We then use the previous section’s urban storm surge hazard event information model as the knowledge graph’s schema layer and map the data objects and their attributes as well as the spatio-temporal information in the data to the concepts, attributes, and spatio-temporal frameworks in the schema layer. We build the knowledge graph’s data layer during this procedure. Lastly, we enrich the knowledge graph’s data layer by mining implicit disaster knowledge through knowledge reasoning, resulting in the final hazard knowledge graph. This procedure formalizes the heterogeneous hazard event information gathered from various sources. In the following section, we present in detail the process of knowledge extraction and knowledge reasoning to further demonstrate our research methodology.

3.2.1. Knowledge Extractions for Various Data

Hazard event information can be divided into two types of data formats: graphical data and textual data. Graphical data include static basic geospatial data and dynamic numerical simulation data, while textual data are mainly textual data related to hazard events published on news and social media platforms. We introduce the following processing methods for different types of data.

Graphical Data

Static basic geospatial data are classified into vector data and raster data according to the data format. Vector data are divided into vector point, vector line, and vector surface data.
For the vector point data, we first determine the spatial encoding level, convert the latitude and longitude coordinates of the points to the corresponding level of spatial encoding, and then output and store them in Neo4j in the format of “vector name, spatial encoding”. For the vector line and vector surface data, the spatial code level is also determined first, and then the spatial code of the corresponding level is calculated. The difference is that the vector line and surface data are obtained as a collection of spatial codes. The steps to calculate the set of spatial codes for the vector line or surface data are described in Algorithm 3.
For the raster data, we obtain the set of spatial codes and the attribute values corresponding to each spatial code in the set. The specific calculation steps are described in Algorithm 4.
Dynamic simulation data refer to the multi-temporal unstructured grid numerical simulation data obtained through the numerical simulation model. Algorithm 5 describes the processing procedure for the dynamic simulation data, taking the inundation depth simulation data obtained from [25] as an example.

Textual Data

Here, we analyze the text data using a deep learning-based named entity recognition [36] method to extract the entities in the text that describes the adverse effects of storm surge disaster on social activities (e.g., factory shutdowns, subway shutdowns, etc.) and the location and time affected. Using Baidu Map’s inverse geocoding API, the location entities (e.g., cities, streets, etc.) are converted into latitude and longitude coordinates, which are then converted into spatial codes of the corresponding coding levels, determined based on specific semantics. The larger the spatial extent corresponding to the location entity, the larger the spatial coding level set. For example, the corresponding spatial coding level of Shenzhen City is 11, and the corresponding spatial coding level of a street in Shenzhen City is 14. The time entity is also converted into a time code of the corresponding coding level, and the coding level is determined based on specific semantics. Finally, the results are output in the format of “entity describing the adverse effects of the disaster, spatial code, temporal code” and stored in Neo4j.
Algorithm 3 Knowledge extraction for vector line or face geometry
Input: Vector line or face geometry
Output: Set of spatial codes that form the vector: Spatial_codes_group
  1:
Calculate the Minimum Bounding Rectangle (MBR) of the given vector line or face.
  2:
Determine the latitude and longitude coordinates of the MBR’s center point: Center_lat, Center_lon.
  3:
Compute the spatial code Center_geoid of MBR’s center point using Center_lat and Center_lon.
  4:
Initialize an empty queue Q.
  5:
Add the Center_geoid to Q.
  6:
while Q is not empty do
  7:
      Dequeue a spatial encoding Current_geoid from Q.
  8:
      if Current_geoid not in Spatial_codes_group then
  9:
            if MBR contains the grid corresponding to Current_geoid or overlaps the grid then
10:
                   if the vector overlaps the grid then
11:
                         Add Current_geoid to Q.
12:
                         Calculate neighbors of Current_geoid as NeighborGrids.
13:
                          for each neighbor in NeighborGrids do
14:
                               if neighbor_geoid not in Spatial_codes_group then
15:
                                     Add neighbor_geoid to Q.
16:
                               end if
17:
                          end for
18:
                   end if
19:
            end if
20:
      end if
21:
end while
22:
Return Spatial_codes_group
Algorithm 4 Knowledge extraction for raster data
Input: Vector surface data of the study area, Raster data
Output: Set of spatial grid codes, Attribute values of spatial grids
1:
Based on the vector surface data of the study area, calculate the set of spatial grid codes at a specific level using the method mentioned earlier.
2:
Utilize the raster to point function in QGIS to obtain vector point data, where each point’s attribute value corresponds to the value of the underlying raster.
3:
Aggregate and calculate attribute values of points within the same spatial grid. The calculation result becomes the attribute value of the respective spatial grid.
Algorithm 5 Knowledge extraction for dynamic simulation data
1:
Select nodes within the study range from the 180,288 nodes obtained from numerical simulations.
2:
Calculate spatial encoding based on latitude and longitude of nodes. Combine nodes with the same spatial encoding. Calculate distances between nodes and the center of corresponding spatial encoding grids. Use inverse distance weighting to obtain grid center depths at different time points.
3:
Determine temporal encoding level based on temporal resolution of simulated data. Calculate temporal encoding for each time point under the corresponding level.
4:
Output results as “spatial encoding, temporal encoding, grid center depth” format. Store results in Neo4j database.

3.2.2. Knowledge Reasoning Based on Temporal and Spatial Relations

Using the knowledge extraction method mentioned in Section 3.2.1, we can obtain four types of hazard-bearing body entities, namely, people, building, subway entry and road, and the spatial entities representing their spatial locations. As we cannot directly obtain the real-time monitoring data of these four types of hazard-bearing body entities, we cannot directly obtain their spatio-temporal processes. Neverthless, we can reason out the new disaster entities through the spatio-temporal relationship between the hazard-bearing body entities and the known flooded emergency situation entities—that is, generate the entities representing the hazard-bearing body’s flooded situation through knowledge-based reasoning. The inference rule is defined as follows:
F l o o d e d ( ? a ) i n _ P l a c e ( ? a , ? s _ a ) a t _ T i m e ( ? a , ? t ) H B B ( ? b ) i n _ P l a c e ( ? b , ? s _ b ) ( ( O v e r l a p ( ? s _ a ? s _ b ) C o n t a i n ( ? s _ a , ? s _ b ) ) H B B _ F l o o d e d ( ? c ) h a s _ i n f l u e n c e d ( ? c , ? b ) i n _ P l a c e ( ? c , ? s _ a ) a t _ T i m e ( ? c , ? t )
where C ( ? x ) represents x as an instance of class C, P ( ? x , y ) represents x being related to y via a relation to P. To the left of the right-arrow are the conditions for the rule to hold, and to the right are the results of the rule reasoning.
The specific meaning of the above rule is that if the spatial entity s _ a , which is associated with the flooded entity a, and the spatial entity s _ b , which is associated with the hazard-bearing body entity b, are in an overlap or contain relationship, it can be inferred that there exists an entity c that indicates that the hazard-bearing body is affected by the flooded disaster. Moreover, the relationship between c and b is has_influence, and the relationship between c and the time entity t associated with a is at_Time. Determining the relationship between the spatial entity s _ a and the spatial entity s _ b is conducted by calculating the spatial relationship based on the spatial coding attributes of s _ a and s _ b using the method mentioned in Section 3.1.2.
Using the process of generating the “Road_flooded” node as an example, we initially inquire about the spatial grid node connected to the “flood_grid” node and the “Spatial grid group” node connected to the road nodes. Subsequently, we calculate the spatial relationship between these two nodes to determine whether there is an overlap or intersection between the “flood_grid” node and the Road node. If such a relationship exists, we proceed to generate a “Road_flooded” node. This node is then linked to the Road node through a “has_influenced” relationship and connected to a specific time node via an “at_Time” relationship. These newly generated node and relationships indicate that flooding occurred on the road at the time point. This process is presented in Figure 5.

4. Case Study

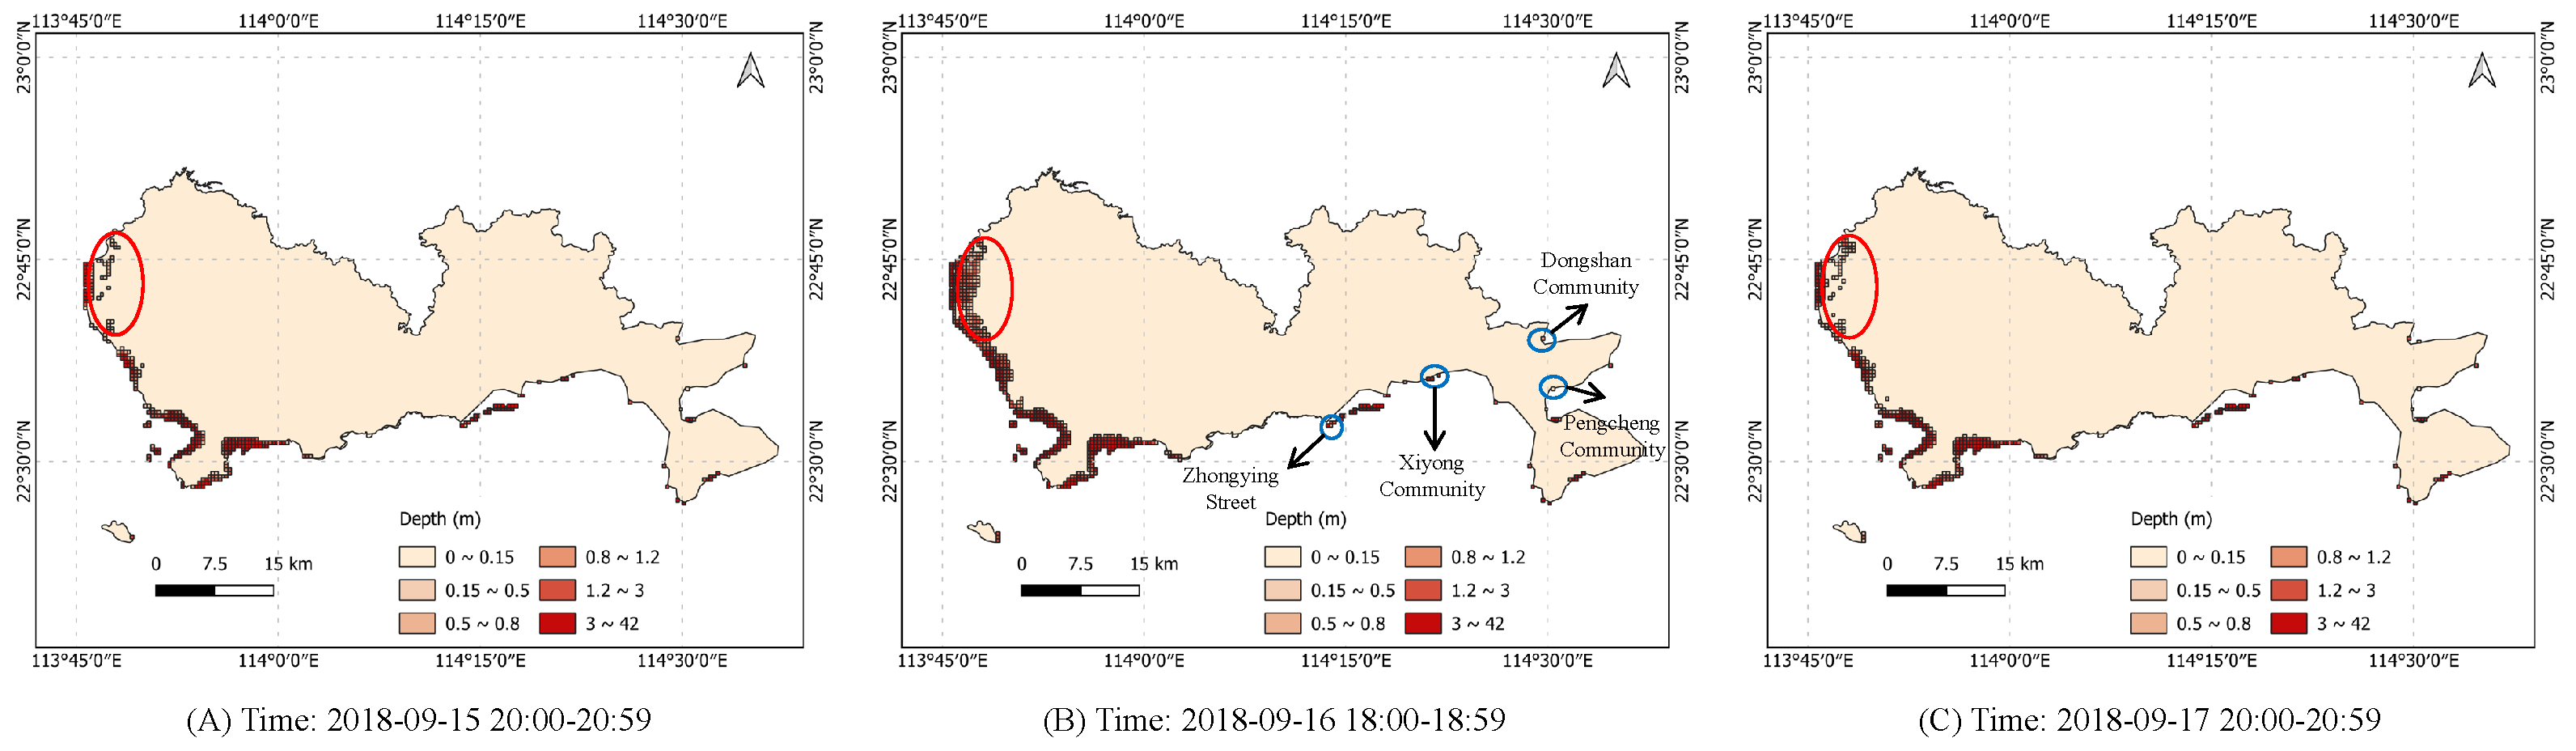
4.1. Study Area and Data

Shenzhen is located in the south of China, in the province of Guangdong. It lies between 113.43 and 114.38 degrees east longitude and 22.24 and 22.52 degrees north latitude and borders the South China Sea.
Hazard-related information has the characteristics of diverse sources and inconsistent format, time, and spatial resolution. In this study, the hazard-related information we use includes the static spatial distribution data of the main hazard-bearing bodies in the city (Figure 6), the multi-temporal simulation data of urban waterlogging depth, and the text data describing the disaster losses. The text data comprise a total of 63 microblogs with the keyword “storm surge” in Shenzhen, published on 16–18 September 2018, and crawled from the Sina Weibo website https://s.weibo.com/ (accessed on 20 August 2023) . After manual screening, we selected 28 micro-blogs that implied the time and space information of the disaster. In addition to the microblog text data, the details of the remaining data are shown in Table 1.

4.2. Data Processing

Regarding the Weibo text data, we applied the method described in Section 3.2.1. First, we extracted temporal entities, spatial location entities, and disaster entities from the text. Then, the temporal and spatial location entities were converted into temporal codes and spatial grid codes, respectively, to generate independent temporal and spatial nodes. Finally, these nodes, together with the disaster entities, were used to create multiple knowledge tuples and were stored in Neo4j. There are 12 social_activities_affected nodes (Figure 7), 6 Road_flooded nodes, 5 inundation nodes, and 1 Building_flooded node. The inundation of seawater occurred in the Xichong, Pengcheng, and Dongshan communities in Dapeng New District, Shenzhen, and in Zhongying Street and Seafood Food Street in Yantian District. The building of the Sheraton Dameisha Resort and Spa in Shenzhen was flooded.
Regarding the spatial distribution data of static hazard-bearing bodies, we used different processing methods according to the different types of data (see Section 3.2.1), resulting in four categories of hazard-bearing body nodes: Population_grid nodes, Road nodes, Building nodes, and Subway_Entry nodes. The spatial resolution of the population dataset is 100 m, which closely aligns with the size of the 19th-level spatial grid. Consequently, we set the spatial encoding level to 19 when generating the Population_grid nodes. The spatial encoding level was set to 22 when generating the road and building nodes. The spatial encoding level was set to 26 when generating the Subway_Entry nodes. For the multi-temporal simulation data of inundation depth, we set the spatial encoding level to 17, as the grid size most closely matched the spatial resolution of the data. Additionally, the temporal encoding level is set to 19, which matched the temporal resolution of the data. Then. we used the method described in Section 3.2.1 to obtain the nodes representing the flooding disaster—that is, the flood_grid nodes.
Table 2 presents the specific attributes and numbers of hazard-bearing body nodes and flooded disaster nodes. Figure 8 illustrates the mapping relationship between the hazard-bearing body nodes, the flooded disaster nodes, and the hazard event ontology. Figure 9 shows the process of the changes in the spatial and temporal distributions of the flooded disaster nodes, reflecting the following two characteristics: (1) Spatially, the serious inundation disaster caused by the storm surge was distributed in the Dapeng New District, Yantian District, and Nanshan District of Shenzhen City’s coast and in Bao’an District in the western part of the city. (2) Temporally, the inundation disaster nodes exhibited an upward trend at first, followed by a downward trend later (Figure 9A–C; location of red circles). The greatest number of inundation disaster nodes occurred between 18:00 and 18:59 on 16 September, indicating that the storm surge had the greatest impact on Shenzhen City, resulting in the most severe inundation disaster. The simulated flooded nodes indicated by blue circles in Figure 9B were located in the Zhongying Street community in Yantian District, the Xichong community in Dapeng New District, the Pengcheng community, and the Dongshan community, which corresponded with the locations extracted from the text of the microblogs in which seawater inundation disaster occurred. This result validates the effectiveness of the knowledge graph.
We then generated the independent temporal nodes and spatial nodes based on the time encoding and spatial encoding properties of the hazard-bearing body nodes and the flooded disaster nodes. We also established the relationship between the hazard-bearing body nodes, the flooded disaster nodes, and these temporal nodes and spatial nodes—that is, the in_Place and at_Time relationships.

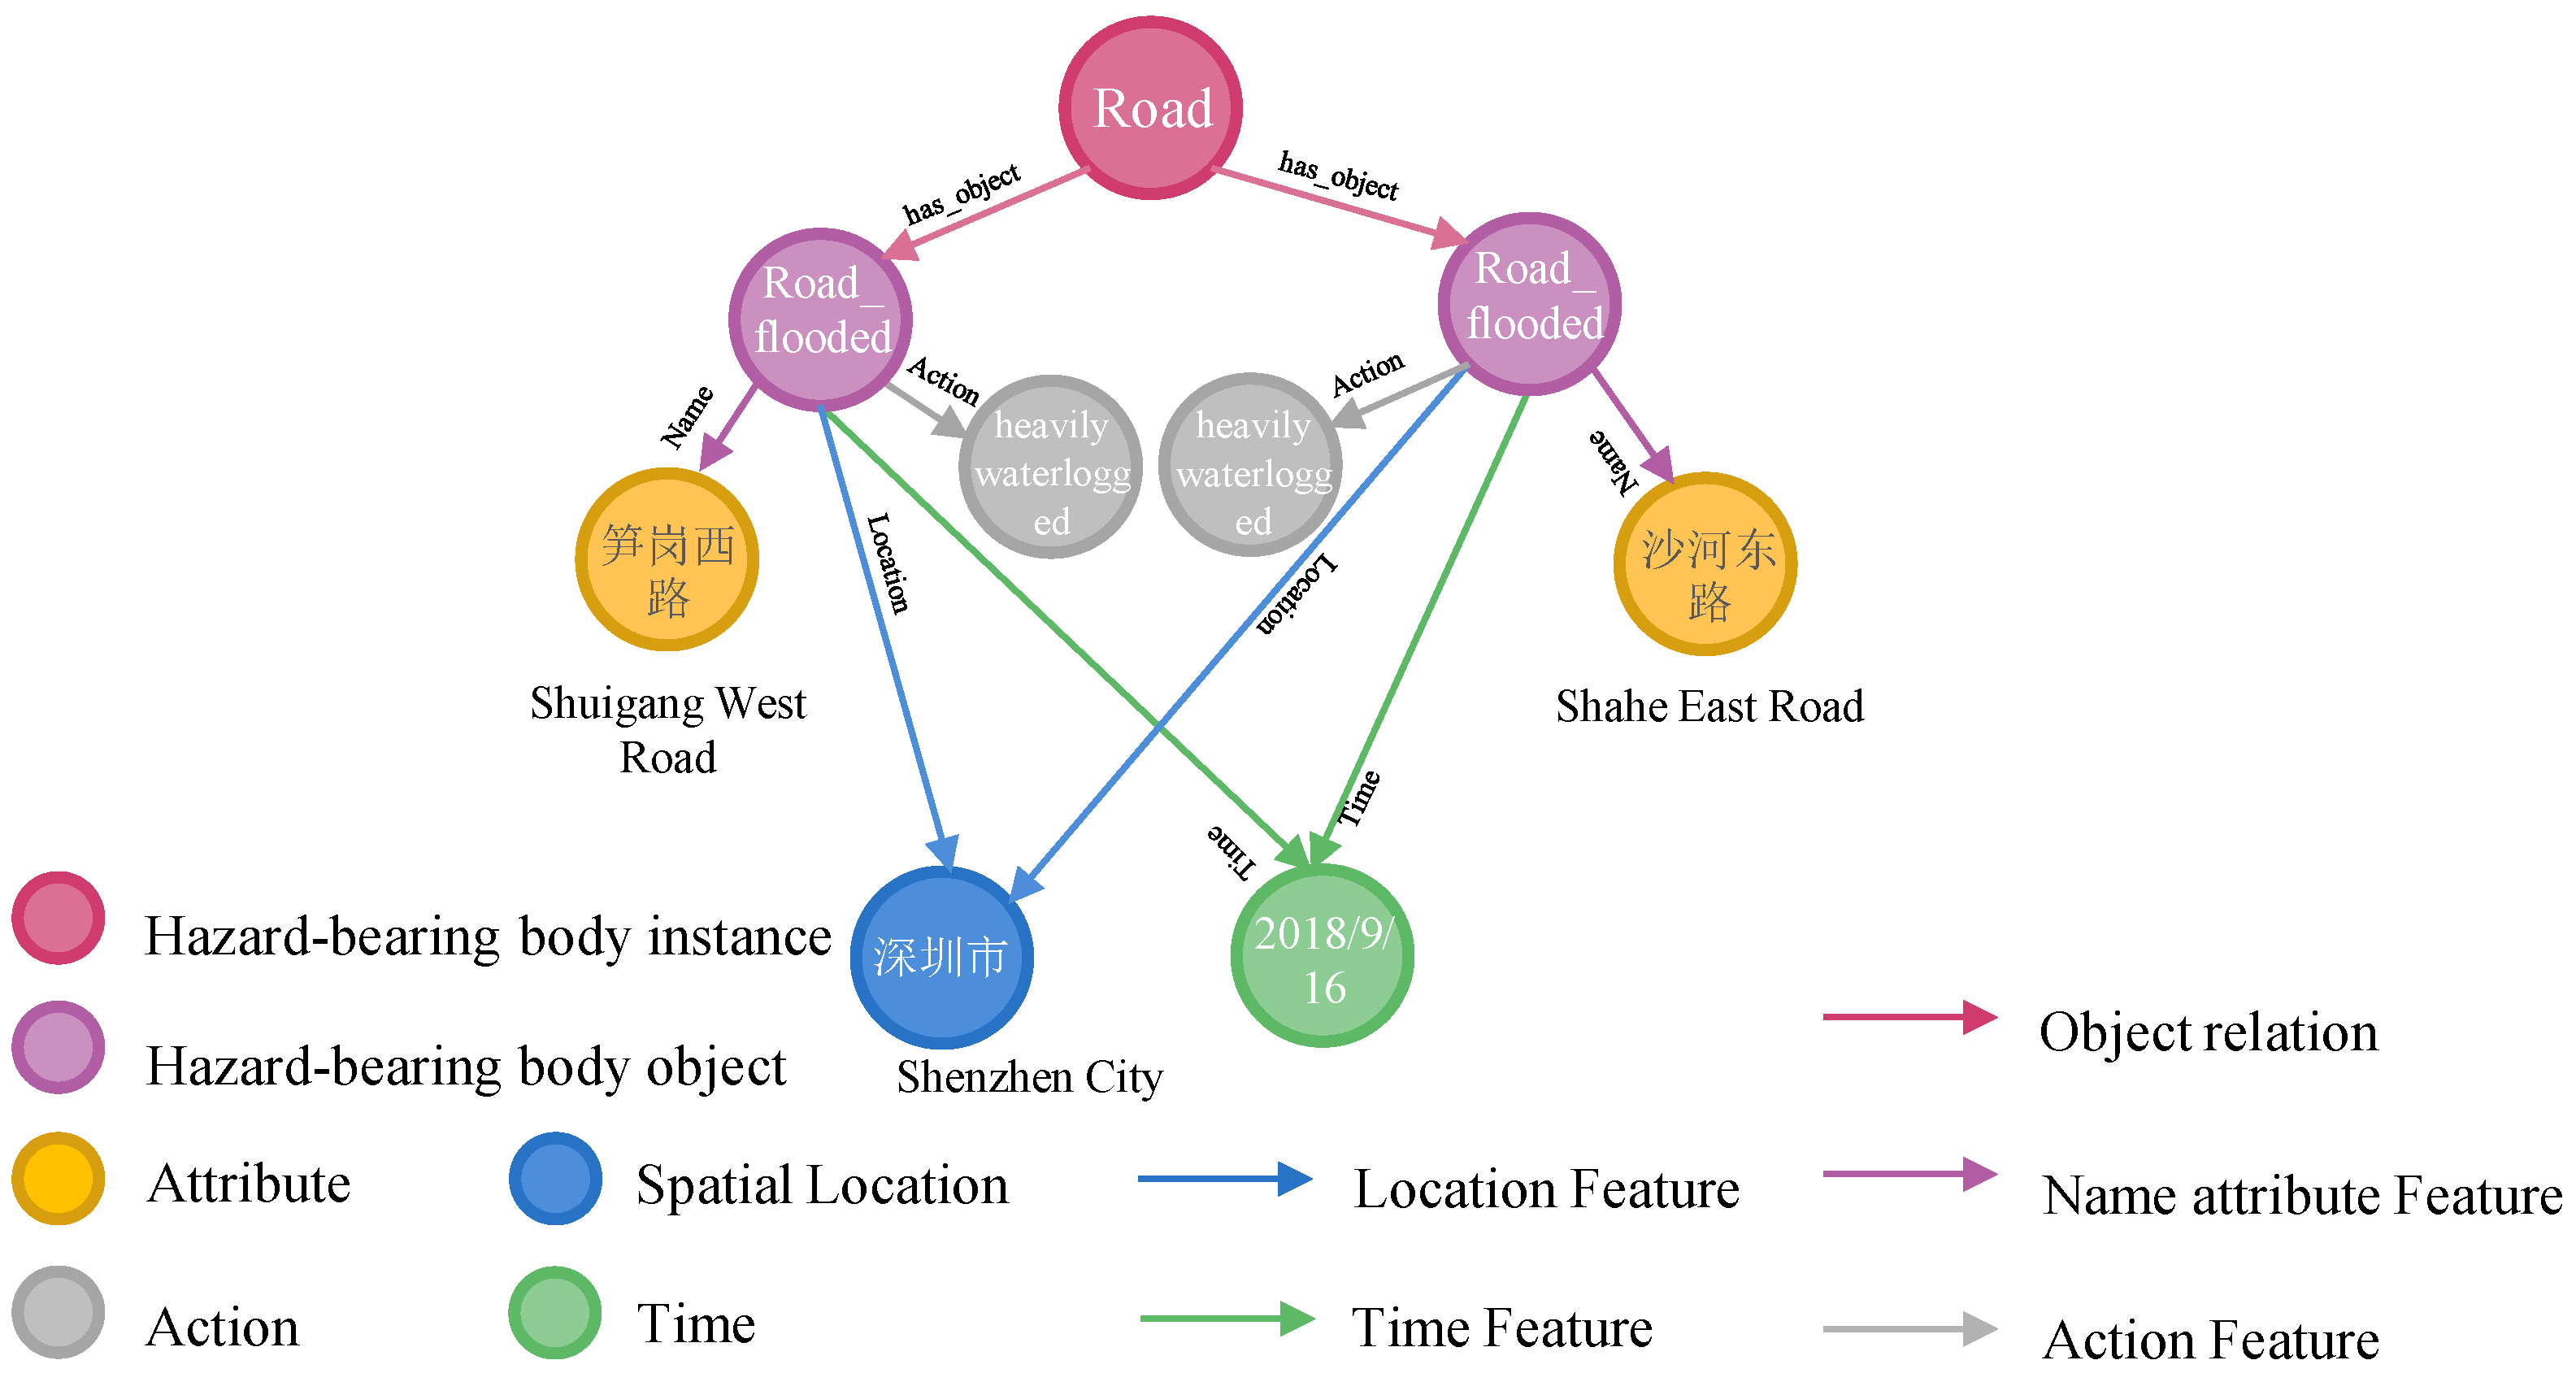
4.3. Generated Disaster Nodes

Using the method described in Section 3.2.2, we calculated the spatial relationships between the spatial nodes connected with the flooding node and the road node, generated the Road_flooded node, and established relationships with the corresponding temporal and spatial nodes. Using the same approach, we generated the remaining three types of nodes: the People_trapped node, the Subway_entry_flooded node, and the Building_flooded node.
Through the CQL statement of the knowledge graph, we queried the number of disaster nodes in each category. Table 3 lists the number of disaster nodes that indicate damage to the hazard-bearing body caused by inundation. The relationships between these disaster nodes and the spatial nodes and temporal nodes are shown in Figure 10.
By querying the disaster nodes associated with all the time nodes in the knowledge graph and according to the temporal relationship between these time nodes, the disaster situations are sorted in time order, and the entire process of the spatio-temporal evolution of the disaster is analyzed. Figure 11 shows the change pattern in the number of disaster nodes corresponding to the different categories of hazard-bearing bodies from 01:00 on 1 September 2018 to 0:00 on 19 September 2018 at 1 h intervals. Although there were significant differences in the number of hazard situation nodes of the different categories, except for the disaster nodes corresponding to the entrances of subway stations, the change trends of disaster situation nodes of the remaining categories were similar, and the peak occurrence times were also close. The highest number of affected buildings and roads was between 18:00 and 18:59 on 16 September 2018, and the highest range of affected people was between 19:00 and 19:59 on the same day.
For comparison, as the disaster knowledge graph representation model proposed by Wang et al. [30] is mainly for unstructured textual information, we used their knowledge graph representation model to represent the spatial and temporal processes of the road waterlogging situation by focusing on microblog texts and targeting the road hazard-bearing body. The results are shown in Figure 12. The comparison between Figure 10 and Figure 12 shows that [30] the disaster knowledge graph representation model was able to represent the roads on which severe flooding disasters occurred and the time of the flood, but it was not able to describe the depth of flooded roads because this information was not mentioned in the micro-blog texts. Conversely, our method can use the inference ability of the knowledge graph to obtain a more comprehensive knowledge of flooded roads because it integrates multi-temporal water depth simulation data and road spatial distribution data, represents the flooded depth and the location and time of flooded roads with the aid of spatio-temporal coding, and designs inference rules for determining whether a road is flooded or not.

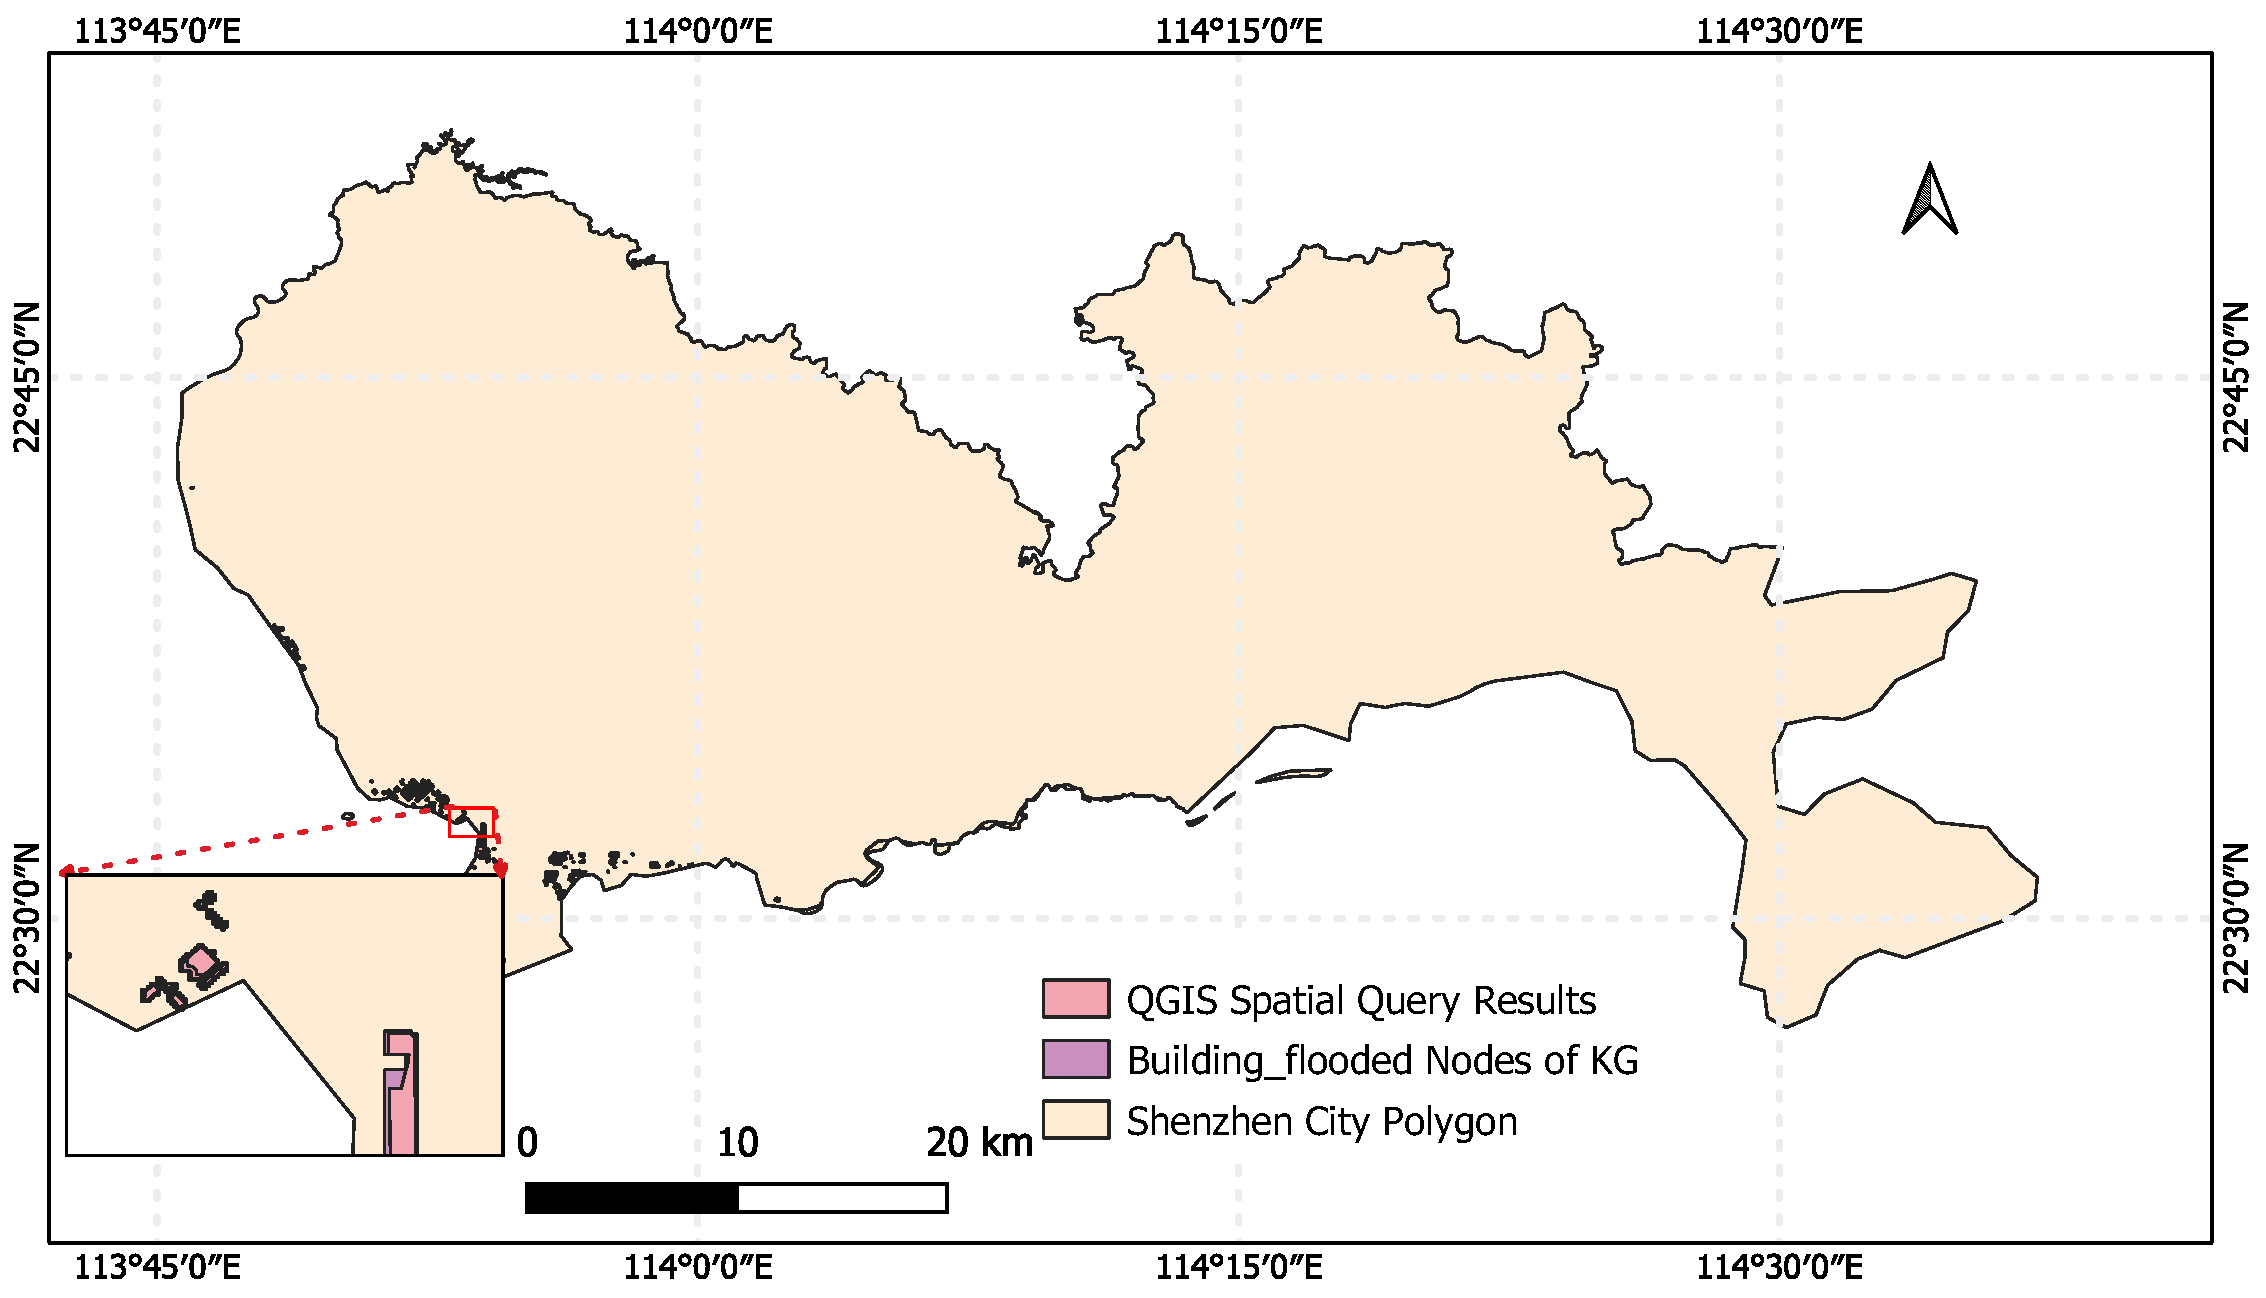
4.4. Validation of the Accuracy in Disaster Nodes Generation Process

To validate the accuracy of the disaster nodes generation process, we overlaid the results (spatial and temporal distribution of the flooded nodes) with data on exposed elements. The validation process, illustrated with the example of Building_flooded nodes, is as follows.
(1) First, we extracted all flood_grid nodes with a flooded depth exceeding 3 m from the knowledge graph for the specific time of 16 September 2016, at 20:00, generating vector map A. This map was then visualized in QGIS to clearly observe the spatial distribution of flood nodes at the specified time. (2) Using the “Spatial Query” function in QGIS, we queried the building vector data for all buildings that intersect or are contained within the flood_grid nodes in vector map A. (3) The number of buildings identified through the query was compared with the number of Building_flooded nodes connected to the same time point in the knowledge graph. The matching numbers preliminarily validated the accuracy of the knowledge graph’s disaster node generation process regarding buildings’ flooding disasters. (4) The queried buildings and the Building_flooded nodes were then overlaid in QGIS. Upon overlaying, we compared the positions of the buildings with the positions of the Building_flooded nodes and found spatial consistency between them (see Figure 13). This further validated the accuracy of the disaster node generation process in the knowledge graph.

4.5. Queries on the Knowledge Graph of Storm Surge Hazard Events

To assess the effectiveness of the knowledge graph in identifying disaster-affected nodes in space, we measured the time required to locate the nodes of the affected roads and buildings within varying query space ranges. Table 4 presents the number of affected road nodes and building nodes, along with the search time, for different space ranges. We also used the traditional spatial analysis tool QGIS to query the affected roads and buildings through multi-layer overlap analysis. The search procedure is illustrated in Figure 14. The results show that the search function of the knowledge graph can quickly identify the disaster-affected targets within the specified spatial range.
We also tested the time required to find the affected road and building nodes for different time ranges of the queries. Table 5 shows the number of affected road nodes and building nodes and the time taken by the query at different time ranges. The query process is shown in Figure 15. The results show that it is faster to query the affected nodes in the specified time range than to query the affected nodes in the specified spatial range. This is mainly due to (1) the number of temporal nodes being much smaller than the number of spatial nodes and (2) the time spent calculating the inclusion relationship between temporal intervals once being shorter than the time spent calculating the inclusion relationship between spatial grids once.

5. Discussion

In this paper, we emphasize multi-scale spatio-temporal features, which refer to the data features of the multi-source data used in the storm surge hazard events modeling. To accommodate this feature, we constructed a unified multiscale spatio-temporal framework that is based on multiscale temporal and spatial coding and enables the integration of data from multiple sources. Specifically, we first convert the temporal and spatial attributes of each data into the corresponding level of coding based on its temporal and spatial resolution, resulting in temporal and spatial nodes of different coding levels. These nodes are connected to the corresponding object nodes, and through the spatio-temporal relationships between these spatio-temporal nodes, we construct the spatio-temporal relationships between objects. This approach allows us to integrate diverse data sources with varying temporal and spatial scales, while maintaining the original resolution of the data.
Compared to the disaster knowledge graph representation model proposed by Wang et al. [30], which focuses on microblog texts, our method not only incorporates microblog texts but also integrates water depth simulation data and spatial distribution data of hazard-bearing objects. Furthermore, we design reasoning rules to determine whether hazard-bearing bodies are flooded, enabling a more comprehensive assessment of disasters. Additionally, our knowledge graph supports queries across different spatiotemporal scopes, providing multi-scale disaster knowledge to meet varying assessment needs. The minimum scale of disaster simulation depends on the resolution of spatial distribution data for the hazard-bearing body. This capability offers valuable support for subsequent disaster response and rescue efforts.

6. Conclusions

The spatio-temporal process of the evolution of a hazard event is reflected in the hazard event information from multiple sources, formats, and spatio-temporal scales. However, existing knowledge graph representation-based hazard event modeling and formal methods struggle to integrate the information and accurately represent the spatio-temporal characteristics of hazard situation changes. Thus, in this study, a hazard event ontology model was developed based on an analysis of the composition structure of the hazard event information. The hazard event ontology reuses the ABC ontology’s top-level concepts, divides the actuality class into three subclasses (i.e., hazard-inducing environment, hazard-bearing bodies, and hazard-causing factors), and divides the situation and action classes into two subclasses (i.e., emergency disaster and emergency behavior). In addition, to build the spatio-temporal framework of the hazard event information model, we reused the ABC ontology concepts of time and place and introduced spatiotemporal encoding. We developed a knowledge graph using the 2018 typhoon Mangkhut storm surge event in Shenzhen as a case and the hazard event information as a schema layer. The knowledge graph makes it possible to formalize the hazard situation in terms of spatial and temporal processes.
The microblog data used for this case study only employed the text with the keyword “Shenzhen storm surge” and mainly considered only the part describing the effects of the storm surge disaster on the daily activities of society. In the future, we need to add more microblog text data to extract more disaster entities, location entities, and time entities from them. We will also develop a deep learning-based Seq2Seq model to achieve the conversion of location entities into GeoSOT spatial coding, based on [38]. We aim to explore the integration of remote sensing datasets with our existing static spatial data, aiming to enhance the spatial precision and achieve a finer scale in hazard modeling. As multiple data may still have redundancy and spatial or logical inconsistencies after integration, and specific knowledge fusion methods should be investigated to solve them.

Author Contributions

Conceptualization, Xinya Lei; methodology, Xinya Lei; software, Xinya Lei; validation, Weijing Song; resources, Yuewei Wang and Wei Han; data curation, Yuewei Wang and Wei Han; writing—original draft preparation, Xinya Lei; writing—review and editing, Weijing Song; supervision, Weijing Song. All authors have read and agreed to the published version of the manuscript.

Funding

The authors gratefully acknowledge the financial support provided by the Open Research Program of the International Research Center of Big Data for Sustainable Development Goals (Grant No. CBAS2023ORP03) and the National Natural Science Foundation of China (Grant No. 42311530065 and Grant No. 42201415).

Institutional Review Board Statement

Not applicable.

Informed Consent Statement

Not applicable.

Data Availability Statement

The datasets used in this study comprise both publicly available data and data provided by a third party. Specifically, the spatial distribution data for the population were derived from reference [37]. Additionally, spatial distribution data for roads and buildings were accessed from OpenStreetMap (https://www.openstreetmap.org/, accessed on 20 August 2023). The original coordinates of subway entries were obtained from BaiduMap (https://map.baidu.com/, accessed on 20 August 2023). Lastly, multi-temporal inundation depth simulation data were provided by the authors of reference [25].

Acknowledgments

The authors are equally grateful to the editors and reviewers for their valuable comments on the manuscript.

Conflicts of Interest

The authors declare no conflicts of interest.

References

  1. Yang, Z.; Wang, T.; Leung, R.; Hibbard, K.; Janetos, T.; Kraucunas, I.; Rice, J.; Preston, B.; Wilbanks, T. A modeling study of coastal inundation induced by storm surge, sea-level rise, and subsidence in the Gulf of Mexico. Nat. Hazards 2014, 71, 1771–1794. [Google Scholar] [CrossRef]
  2. Lagmay, A.M.F.; Agaton, R.P.; Bahala, M.A.C.; Briones, J.B.L.T.; Cabacaba, K.M.C.; Caro, C.V.C.; Dasallas, L.L.; Gonzalo, L.A.L.; Ladiero, C.N.; Lapidez, J.P.; et al. Devastating storm surges of Typhoon Haiyan. Int. J. Disaster Risk Reduct. 2015, 11, 1–12. [Google Scholar] [CrossRef]
  3. Wang, Y.; Liu, J.; Du, X.; Liu, Q.; Liu, X. Temporal-spatial characteristics of storm surges and rough seas in coastal areas of Mainland China from 2000 to 2019. Nat. Hazards 2021, 107, 1273–1285. [Google Scholar] [CrossRef]
  4. Wang, Y.; Chen, X.; Wang, L.; Min, G. Effective IoT-facilitated storm surge flood modeling based on deep reinforcement learning. IEEE Internet Things J. 2020, 7, 6338–6347. [Google Scholar] [CrossRef]
  5. Liu, Q.; Ruan, C.; Zhong, S.; Li, J.; Yin, Z.; Lian, X. Risk assessment of storm surge disaster based on numerical models and remote sensing. Int. J. Appl. Earth Obs. Geoinf. 2018, 68, 20–30. [Google Scholar] [CrossRef]
  6. Brower, A.E.; Ramesh, B.; Islam, K.A.; Mortveit, H.S.; Hoops, S.; Vullikanti, A.; Marathe, M.V.; Zaitchik, B.; Gohlke, J.M.; Swarup, S. Augmenting the Social Vulnerability Index using an agent-based simulation of Hurricane Harvey. Comput. Environ. Urban Syst. 2023, 105, 102020. [Google Scholar] [CrossRef]
  7. Wang, W.; Stewart, K. Spatiotemporal and semantic information extraction from Web news reports about natural hazards. Comput. Environ. Urban Syst. 2015, 50, 30–40. [Google Scholar] [CrossRef]
  8. Huang, Q.; Cervone, G.; Zhang, G. A cloud-enabled automatic disaster analysis system of multi-sourced data streams: An example synthesizing social media, remote sensing and Wikipedia data. Comput. Environ. Urban Syst. 2017, 66, 23–37. [Google Scholar] [CrossRef]
  9. Songchon, C.; Wright, G.; Beevers, L. Quality assessment of crowdsourced social media data for urban flood management. Comput. Environ. Urban Syst. 2021, 90, 101690. [Google Scholar] [CrossRef]
  10. Chen, N.; Zhang, Y.; Du, W.; Li, Y.; Chen, M.; Zheng, X. KE-CNN: A new social sensing method for extracting geographical attributes from text semantic features and its application in Wuhan, China. Comput. Environ. Urban Syst. 2021, 88, 101629. [Google Scholar] [CrossRef]
  11. Asghar, S.; Alahakoon, D.; Churilov, L. A comprehensive conceptual model for disaster management. J. Humanit. Assist. 2006, 1360, 1–15. [Google Scholar]
  12. Gaur, M.; Shekarpour, S.; Gyrard, A.; Sheth, A. empathi: An ontology for emergency managing and planning about hazard crisis. In Proceedings of the 2019 IEEE 13th International Conference on Semantic Computing (ICSC), Newport Beach, CA, USA, 30 January–1 February 2019; pp. 396–403. [Google Scholar]
  13. OASIS. Common Alerting Protocol Version 1.2. Available online: http://docs.oasis-open.org/emergency/cap/v1.2/CAP-v1.2-os.pdf (accessed on 30 September 2020).
  14. OASIS. Emergency Data Exchange Language (EDXL) Common Alerting Protocol (CAP) v1.2 Australia (AU) Profile Version 1.0. Available online: http://docs.oasis-open.org/emergency/edxl-cap1.2-au/v1.0/cs01/edxl-cap1.2-au-v1.0-cs01.pdf (accessed on 30 September 2020).
  15. Huang, F.; Yan, L. Reasoning of ontology model for typhoon disasters domain based on Jena. J. Comput. Appl. 2013, 33, 771. [Google Scholar] [CrossRef]
  16. Liu, J.; Dong, Y.; Liu, Z.; Chen, D. Applying ontology learning and multi-objective ant colony optimization method for focused crawling to meteorological disasters domain knowledge. Expert Syst. Appl. 2022, 198, 116741. [Google Scholar] [CrossRef]
  17. Han, M.; Lee, J. Bayesian typhoon track prediction using wind vector data. Commun. Stat. Appl. Methods 2015, 22, 241–253. [Google Scholar] [CrossRef]
  18. Chen, Y.; Duan, Z. A statistical dynamics track model of tropical cyclones for assessing typhoon wind hazard in the coast of southeast China. J. Wind Eng. Ind. Aerodyn. 2018, 172, 325–340. [Google Scholar] [CrossRef]
  19. Zhong, S.; Fang, Z.; Zhu, M.; Huang, Q. A geo-ontology-based approach to decision-making in emergency management of meteorological disasters. Nat. Hazards 2017, 89, 531–554. [Google Scholar] [CrossRef]
  20. Hu, D.; Wang, M.; Gao, F.; Xu, F.; Gu, J. Knowledge Representation and Reasoning for Complex Time Expression in Clinical Text. Data Intell. 2022, 4, 573–598. [Google Scholar] [CrossRef]
  21. Ye, P.; Zhang, X.; Huai, A.; Tang, W. Information detection for the process of typhoon events in microblog text: A spatio-temporal perspective. ISPRS Int. J. Geo-Inf. 2021, 10, 174. [Google Scholar] [CrossRef]
  22. Huang, Z. Research on the Construction Method of Knowledge Graph for the Typhoon Disaster Events. Master’s Thesis, Nanjing Normal University, Nanjing, China, 2021. [Google Scholar]
  23. Tong, X.; Cheng, C.; Wang, R.; Ding, L.; Zhang, Y.; Lai, G.; Wang, L.; Chen, B. An efficient integer coding index algorithm for multi-scale time information management. Data Knowl. Eng. 2019, 119, 123–138. [Google Scholar] [CrossRef]
  24. Jin, A.; Cheng, C. Spatial Data Coding Method Based on Global Subdivision Grid. J. Geomat. Sci. Technol. 2013, 30, 284–287. [Google Scholar]
  25. Wang, Y.; Chen, X.; Wang, L. Differential Semi-Quantitative Urban Risk Assessment of Storm Surge Inundation. ISPRS Ann. Photogramm. Remote Sens. Spat. Inf. Sci. 2022, X-3/W1-2022, 177–185. [Google Scholar] [CrossRef]
  26. OGC. Time Ontology in OWL. 2006. Available online: https://www.w3.org/TR/owl-time/ (accessed on 20 April 2023).
  27. Ye, P.; Zhang, X.; Shi, G.; Chen, S.; Huang, Z.; Tang, W. TKRM: A formal knowledge representation method for typhoon events. Sustainability 2020, 12, 2030. [Google Scholar] [CrossRef]
  28. Wang, L.; Yan, J.; Mu, L.; Huang, L. Knowledge discovery from remote sensing images: A review. Wiley Interdiscip. Rev. Data Min. Knowl. Discov. 2020, 10, e1371. [Google Scholar] [CrossRef]
  29. Li, W.; Wang, S.; Wu, S.; Gu, Z.; Tian, Y. Performance benchmark on semantic web repositories for spatially explicit knowledge graph applications. Comput. Environ. Urban Syst. 2022, 98, 101884. [Google Scholar] [CrossRef]
  30. Wang, Y.; Zhang, X.; Dang, Y.; Ye, P. Knowledge Graph Representation of Typhoon Disaster Events Based on Spatiotemporal Processes. J. Geo-Inf. Sci. 2022, 25, 1228–1239. [Google Scholar]
  31. Sun, S.; Wang, L.; Ranjan, R.; Wu, A. Semantic analysis and retrieval of spatial data based on the uncertain ontology model in digital earth. Int. J. Digit. Earth 2015, 8, 3–16. [Google Scholar] [CrossRef]
  32. Sun, S.; Song, W.; Zomaya, A.Y.; Xiang, Y.; Choo, K.K.R.; Shah, T.; Wang, L. Associative retrieval in spatial big data based on spreading activation with semantic ontology. Future Gener. Comput. Syst. 2017, 76, 499–509. [Google Scholar] [CrossRef]
  33. Qu, T.; Wang, L.; Yu, J.; Yan, J.; Xu, G.; Li, M.; Cheng, C.; Hou, K.; Chen, B. STGI: A spatio-temporal grid index model for marine big data. Big Earth Data 2020, 4, 435–450. [Google Scholar] [CrossRef]
  34. Lagoze, C.; Hunter, J. The ABC ontology and model. J. Digit. Inf. 2001, 2, 1–18. [Google Scholar]
  35. Clementini, E.; Di Felice, P.; Van Oosterom, P. A small set of formal topological relationships suitable for end-user interaction. In Proceedings of the International Symposium on Spatial Databases, Singapore, 23–25 June 1993; Springer: Berlin/Heidelberg, Germany, 1993; pp. 277–295. [Google Scholar]
  36. Lei, X.; Song, W.; Fan, R.; Feng, R.; Wang, L. Semi-supervised geological disasters named entity recognition using few labeled data. GeoInformatica 2023, 27, 263–288. [Google Scholar] [CrossRef]
  37. WorldPop. Unconstrained Individual Countries 2000–2020 UN Adjusted (100 m Resolution). 2020. Available online: https://hub.worldpop.org/geodata/summary?id=24924 (accessed on 20 August 2023).
  38. Qian, C.; Yi, C.; Cheng, C.; Pu, G.; Liu, J. A coarse-to-fine model for geolocating Chinese addresses. ISPRS Int. J. Geo-Inf. 2020, 9, 698. [Google Scholar] [CrossRef]
Figure 2. The workflow of our work.
Ijgi 13 00088 g002
Figure 3. The hazard event ontology model.
Ijgi 13 00088 g003
Figure 4. The GeoSOT subdivision and encoding procedure.
Ijgi 13 00088 g004
Figure 5. The process of generating the Road_flooded disaster node.
Ijgi 13 00088 g005
Figure 6. Static hazard-bearing body’s spatial distribution data.
Ijgi 13 00088 g006
Figure 7. Social_activities_affected nodes and relations.
Ijgi 13 00088 g007
Figure 8. Example of hazard bearing body nodes and flooded situation nodes.
Ijgi 13 00088 g008
Figure 9. The spatial and temporal distribution of flooded disaster nodes.
Ijgi 13 00088 g009
Figure 10. Example of disaster nodes and their relations with other nodes.
Ijgi 13 00088 g010
Figure 11. Temporal distribution of the generated disaster nodes.
Ijgi 13 00088 g011
Figure 12. Representation of road flooded situations using the hazard knowledge graph model proposed by [30].
Ijgi 13 00088 g012
Figure 13. Overlay result of Building_flooded nodes and spatial queried buildings in QGIS.
Ijgi 13 00088 g013
Figure 14. The process of querying the hazard-affected roads and buildings in spatial range.
Ijgi 13 00088 g014
Figure 15. The process of searching the disaster-affected roads and buildings in temporal range.
Ijgi 13 00088 g015
Table 1. Details of the static spatial distribution data and multi-temporal simulation data.
Data TypeData SourceSpatial ResolutionTemporal Resolution
Population spatial distribution
raster data
WorldPop [37]100 m-
Building spatial distribution
vector surface data
OpenStreetMap
(https://www.openstreetmap.org/,
accessed on 20 August 2023)
--
Road spatial distribution
vector line data
OpenStreetMap
(https://www.openstreetmap.org/,
accessed on 20 August 2023)
--
Subway Entry spatial distribution
vector point data
Baidu Map
(https://map.baidu.com/,
accessed on 20 August 2023)
--
Multi-temporal
inundation depth simulation data
Provided by
[25]
500 m in Shenzhen area1 h
Table 2. The details of nodes and attributes.
Node CategoryNumber of NodesNode Attributes
Subway_Entry80GeoSOT_string, name
Road2690GeoSOT_string_group, name, Isbrige, Ischannel
Building17,793GeoSOT_string_group, name
Population_grid144,842GeoSOT_string, Population_count
flood_grid2,178,845GeoSOT_string, Time_code_int, Flooded_depth, Flooded_level
Table 3. The number of disaster nodes.
Node CategoryNumber of Nodes
Road_flooded114,302
People_trapped373,476
Building_flooded247,474
Subway_entry_flooded2592
Table 4. The results of the spatial research.
Spatial RangeThe Number
of Hazard-
Affected Roads
The Number
of Hazard-
Affected Buildings
Time (Ours)Time (QGIS)
(‘G001130221-12’, { 0 : ( 1 , 1 ) , 1 : ( 0 , 1 ) , 2 : ( 1 , 1 ) } )27260730.74 s129.13 s
(‘G001130221-30’, { 0 : ( 0 , 1 ) , 1 : ( 1 , 1 ) } )14333920.34 s129.05 s
(‘G001130230-21’, { 0 : ( 0 , 0 ) } )404.475 s128.92 s
Table 5. The results of the temporal search.
Temporal RangeThe Number of
Disaster-Affected Roads
The Number of
Disaster-Affected Buildings
Time
16 September 2018439912,4271.77 s
16 September 2018 8:00 a.m.–12:00 p.m.79824510.38 s
16 September 2018 from 19:00 to 20:202706110.12 s
Disclaimer/Publisher’s Note: The statements, opinions and data contained in all publications are solely those of the individual author(s) and contributor(s) and not of MDPI and/or the editor(s). MDPI and/or the editor(s) disclaim responsibility for any injury to people or property resulting from any ideas, methods, instructions or products referred to in the content.

