Article

Oil Palm Bunch Ripeness Classification and Plantation Verification Platform: Leveraging Deep Learning and Geospatial Analysis and Visualization

by
Supattra Puttinaovarat
*,
Supaporn Chai-Arayalert
and
Wanida Saetang
Faculty of Science and Industrial Technology, Prince of Songkla University Surat Thani Campus, Surat Thani 84000, Thailand
*
Author to whom correspondence should be addressed.
ISPRS Int. J. Geo-Inf. 2024, 13(5), 158; https://doi.org/10.3390/ijgi13050158
Submission received: 19 March 2024 / Revised: 6 May 2024 / Accepted: 6 May 2024 / Published: 8 May 2024
(This article belongs to the Special Issue Advances in AI-Driven Geospatial Analysis and Data Generation)

Abstract

:
Oil palm cultivation thrives as a prominent agricultural endeavor within the southern region of Thailand, where the country ranks third globally in production, following Malaysia and Indonesia. The assessment of oil palm bunch ripeness serves various purposes, notably in determining purchasing prices, pre-harvest evaluations, and evaluating the impacts of disasters or low market prices. Presently, two predominant methods are employed for this assessment, namely human evaluation, and machine learning for ripeness classification. Human assessment, while boasting high accuracy, necessitates the involvement of farmers or experts, resulting in prolonged processing times, especially when dealing with extensive datasets or dispersed fields. Conversely, machine learning, although capable of accurately classifying harvested oil palm bunches, faces limitations concerning its inability to process images of oil palm bunches on trees and the absence of a platform for on-tree ripeness classification. Considering these challenges, this study introduces the development of a classification platform leveraging machine learning (deep learning) in conjunction with geospatial analysis and visualization to ascertain the ripeness of oil palm bunches while they are still on the tree. The research outcomes demonstrate that oil palm bunch ripeness can be accurately and efficiently classified using a mobile device, achieving an impressive accuracy rate of 99.89% with a training dataset comprising 8779 images and a validation accuracy of 96.12% with 1160 images. Furthermore, the proposed platform facilitates the management and processing of spatial data by comparing coordinates derived from images with oil palm plantation data obtained through crowdsourcing and the analysis of cloud or satellite images of oil palm plantations. This comprehensive platform not only provides a robust model for ripeness assessment but also offers potential applications in government management contexts, particularly in scenarios necessitating real-time information on harvesting status and oil palm plantation conditions.

1. Introduction

Oil palm stands as a pivotal economic crop within Southern Thailand [1,2,3], as well as in neighboring countries such as Indonesia and Malaysia [4,5], where it serves as the primary source of income for local farmers. Typically, oil palm follows a harvest cycle occurring every 15–20 days, a timeline subject to variation based on the specific harvest schedules of each oil palm plantation under usual circumstances. However, the global landscape currently grapples with erratic climate patterns [6,7,8], leading to a range of calamities such as flooding that impede the farmers’ harvesting capabilities. In instances of severe flooding or extended periods of such conditions, production becomes unfeasible. This challenge is further compounded by palm oil purchasing yards and factories halting procurement due to transportation issues preventing the delivery of products to palm oil refineries [9,10,11]. Consequently, oil palm production often endures declines in market prices, adversely impacting the livelihoods of farmers [12,13,14]. Presently, the government has implemented a measure for farmer income insurance [2,15,16], reliant on available farmer registration data that documents the size of each garden plot. However, this data may not consistently align with the actual harvesting cycles of respective areas. The current relief processes for farmers, both in cases of disasters and lowered prices, continue to rely on manual inspection methods and non-real-time data checks. The absence of an application or platform for recording and monitoring oil palm plantation data in real time poses a challenge, particularly in scenarios where products have yet to be harvested.
A comprehensive review of the related literature and research reveals the utilization of machine learning techniques for processing images to determine the ripeness levels of harvested oil palm fruits, categorized into multiple levels to aid in sorting and assessing the quality of factory purchases for setting purchase prices [17,18,19,20,21,22,23,24,25,26,27,28,29,30]. Notably, the evaluation of classification accuracy demonstrates the high precision achieved through machine learning, particularly with the application of deep learning algorithms [18,19,20,21,22,23,24,25,26]. However, despite these advancements, the analysis underscores several limitations in existing research. Notably, the absence of an application or platform capable of real-time data processing [17,18,19,20,21,22,23,24,25,26], reliance on a limited number of datasets for model creation leading to potential overfitting issues in practical scenarios [17,21,22,23,28,29], and the lack of clarity regarding the number of datasets used for modeling and testing [24,25]. Furthermore, the digital images employed for classification predominantly feature harvested oil palm fruit with intact backgrounds, rendering them unsuitable for on-tree oil palm fruit classification [17,18,19,20,21,22,23,24,25,26]. While some research endeavors have proposed the development of real-time monitoring applications for oil palm fruit ripeness [30], these initiatives are not without limitations, as the proposed models remain static and unmodifiable, potentially impacting their accuracy during real-world applications. Considering these identified limitations within existing research paradigms and operational methods, this study introduces the development of a platform designed for inspecting the ripeness of oil palm fruits while they are still on trees. This platform integrates deep learning algorithms with geospatial analysis, enabling real-time inspection and display of inspection results. Consequently, this platform holds significant potential for applications in government management contexts, particularly in facilitating relief efforts or budget allocations. Additionally, it provides farmers with a direct channel for real-time information dissemination, enhancing their ability to make informed decisions.

2. Review of Related Literature

2.1. Oil Palm Ripeness Classification Using Machine Learning

A comprehensive review of literature and research pertaining to the utilization of machine learning and deep learning in the classification and assessment of oil palm fruit or bunch ripeness revealed the adoption of both classical machine learning [26,27,28,29,30] and deep learning [17] techniques. The findings from this investigation indicate that deep learning methodologies generally outperform other machine learning algorithms in accurately classifying the ripeness of oil palm bunches. However, classical machine learning approaches demonstrate comparable high accuracy, with the added advantage of shorter training times and less stringent hardware requirements, as they do not necessitate Graphical Processing Units (GPUs) or Tensor Processing Units (TPUs) for processing and can function effectively on less efficient computational platforms. Previous research has proposed various classical machine learning methods, such as Artificial Neural Networks (ANN), K-Nearest Neighbors (KNN), Support Vector Machines (SVM), Naïve Bayes, Regression, Decision Tree (DT), and Fuzzy Logic, for assessing the ripeness of oil palm fruit bunches or fruits, in comparison with Convolutional Neural Networks (CNN). Although studies have highlighted CNN’s superior classification accuracy [26], many prior investigations utilizing machine learning algorithms like KNN, SVM, and ANN have achieved remarkably high accuracy rates in classifying oil palm fruits or bunch ripeness, ranging between 97% and 100% [27,28,29,30]. Regarding the application of deep learning in classifying and detecting the ripeness of bunches or oil palm fruits, the analysis reveals a classification accuracy stratified into the following three levels: very accurate (accuracy exceeding 95%) [24,25], highly accurate (accuracy ranging between 80% and 94%), and moderately accurate (accuracy between 60% and 79%) [22,23], with the majority of outcomes falling within the highly accurate range. Disparities observed among previous studies indicate that classification accuracy is contingent upon several factors, including the size of training, testing, and validation datasets. For instance, studies employing small training datasets (comprising fewer than 1000 images) yield moderate to high classification accuracy [17,18,19,20]. Additionally, the choice of CNN algorithm significantly influences classification accuracy, with certain algorithms, such as YoLo, exhibiting notably high accuracy rates [18,19,20], albeit primarily designed for detection rather than classification tasks. Moreover, the number of classes classified also impacts classification accuracy; for instance, studies encompassing seven classes but utilizing small training datasets yield suboptimal accuracy [23].
Upon scrutinizing prior research, both classical machine learning and deep learning exhibit notable strengths, particularly their capability to achieve very high classification accuracy when applied in real-world scenarios. The utilization of extensive and inclusive modeling datasets enables their deployment in practical contexts, with the assessment of accuracy facilitated by k-fold cross-validation, thereby mitigating overfitting concerns. However, limitations arise from the absence of support for classifying photographs of oil palm bunches on trees or unharvested crops in most previous studies and presentations. This deficiency stems from the exclusive utilization of datasets comprising videos or images of harvested oil palm bunches [17,18,19,20,21,22,23,24,25,26,27,28,29]. Furthermore, certain studies do not facilitate real-time image processing using smartphones or mobile devices [20,24], and the limited size of datasets employed for model creation and testing adversely impacts the reliability and accuracy of the model [20,21,22,23,27,28,29]. Moreover, research endeavors that focus on the development of applications or platforms for classifying the ripeness of oil palm bunches typically employ machine learning algorithms, notably ANN. For instance, one study utilized a dataset comprising 8485 images, achieving a classification accuracy of 93.19%. While such applications demonstrate robust classification accuracy, their drawbacks include the variability introduced by using diverse smartphones or mobile devices, thereby affecting classification accuracy. Additionally, these applications lack mechanisms to update the model as additional data becomes available. Notably, the modeling and testing datasets predominantly consist of images of harvested oil palm bunches exclusively. Furthermore, the absence of Geographic Information Systems (GIS) and Global Positioning System (GPS) usage for verifying the location coordinates of oil palm plantations renders it challenging to ascertain the specific plantation area or plot to which the classification results pertain [30].

2.2. Oil Palm Plantation Management Using GIS and Remote Sensing

In a systematic literature review of oil palm plantation management, the prevailing use of GIS, Remote Sensing (RS), and machine learning methodologies is evident for classifying plantation areas [31,32,33,34,35,36]. Notably, one study achieved enhanced accuracy in classifying palm oil plantation areas using satellite imagery, particularly Sentinel-1 and Sentinel-2, coupled with the Random Forest (RF) algorithm, achieving a 90.3% classification accuracy [36]. Additionally, the classification of oil palm plantation areas using Unmanned Aerial Vehicles (UAVs) with a 5 cm image resolution is discussed. This method employs Rule-based Classification to distinguish between vegetation and non-vegetation based on the Normalized Difference Vegetation Index (NDVI), followed by the KNN technique to further classify vegetation types, achieving an 89% accuracy [37]. Furthermore, GIS and RS technologies have been applied to disease detection in oil palms, particularly in the Khlong Thom District of Krabi Province. Utilizing WorldView-2 satellite images and the Maximum Likelihood Classification algorithm, an 85.9% detection accuracy for monitoring disease occurrences in oil palm plants was reported [38]. Regarding oil palm yield estimation, various index values, including NDVI, Soil Adjusted Vegetation Index (SAVI), and Ratio Vegetation Index (RVI), have been employed, although specific accuracy evaluation results were not provided [39].
The review underscores GIS’s capability to classify oil palm plantation areas and its potential efficiently and accurately for integration with other datasets to facilitate comprehensive plantation management, such as planning transportation routes and creating spatial databases [40]. Moreover, the integration of RS and GIS with machine learning and deep learning techniques has been extensively explored in literature and research, with diverse applications including classification of plantation areas, disease detection, age assessment, biomass and carbon estimation, tree counting, suitability analysis for plantation areas, and harvesting recommendations [41]. Additionally, RS and Artificial Intelligence (AI) technologies have been utilized for various applications, including counting oil palm trees, estimating tree health and height, forecasting yield, classifying ripeness levels of oil palm bunches, and developing web applications for displaying oil palm plantation areas [42]. These findings highlight the multifaceted role of technology in enhancing oil palm plantation management practices.

3. Materials and Methods

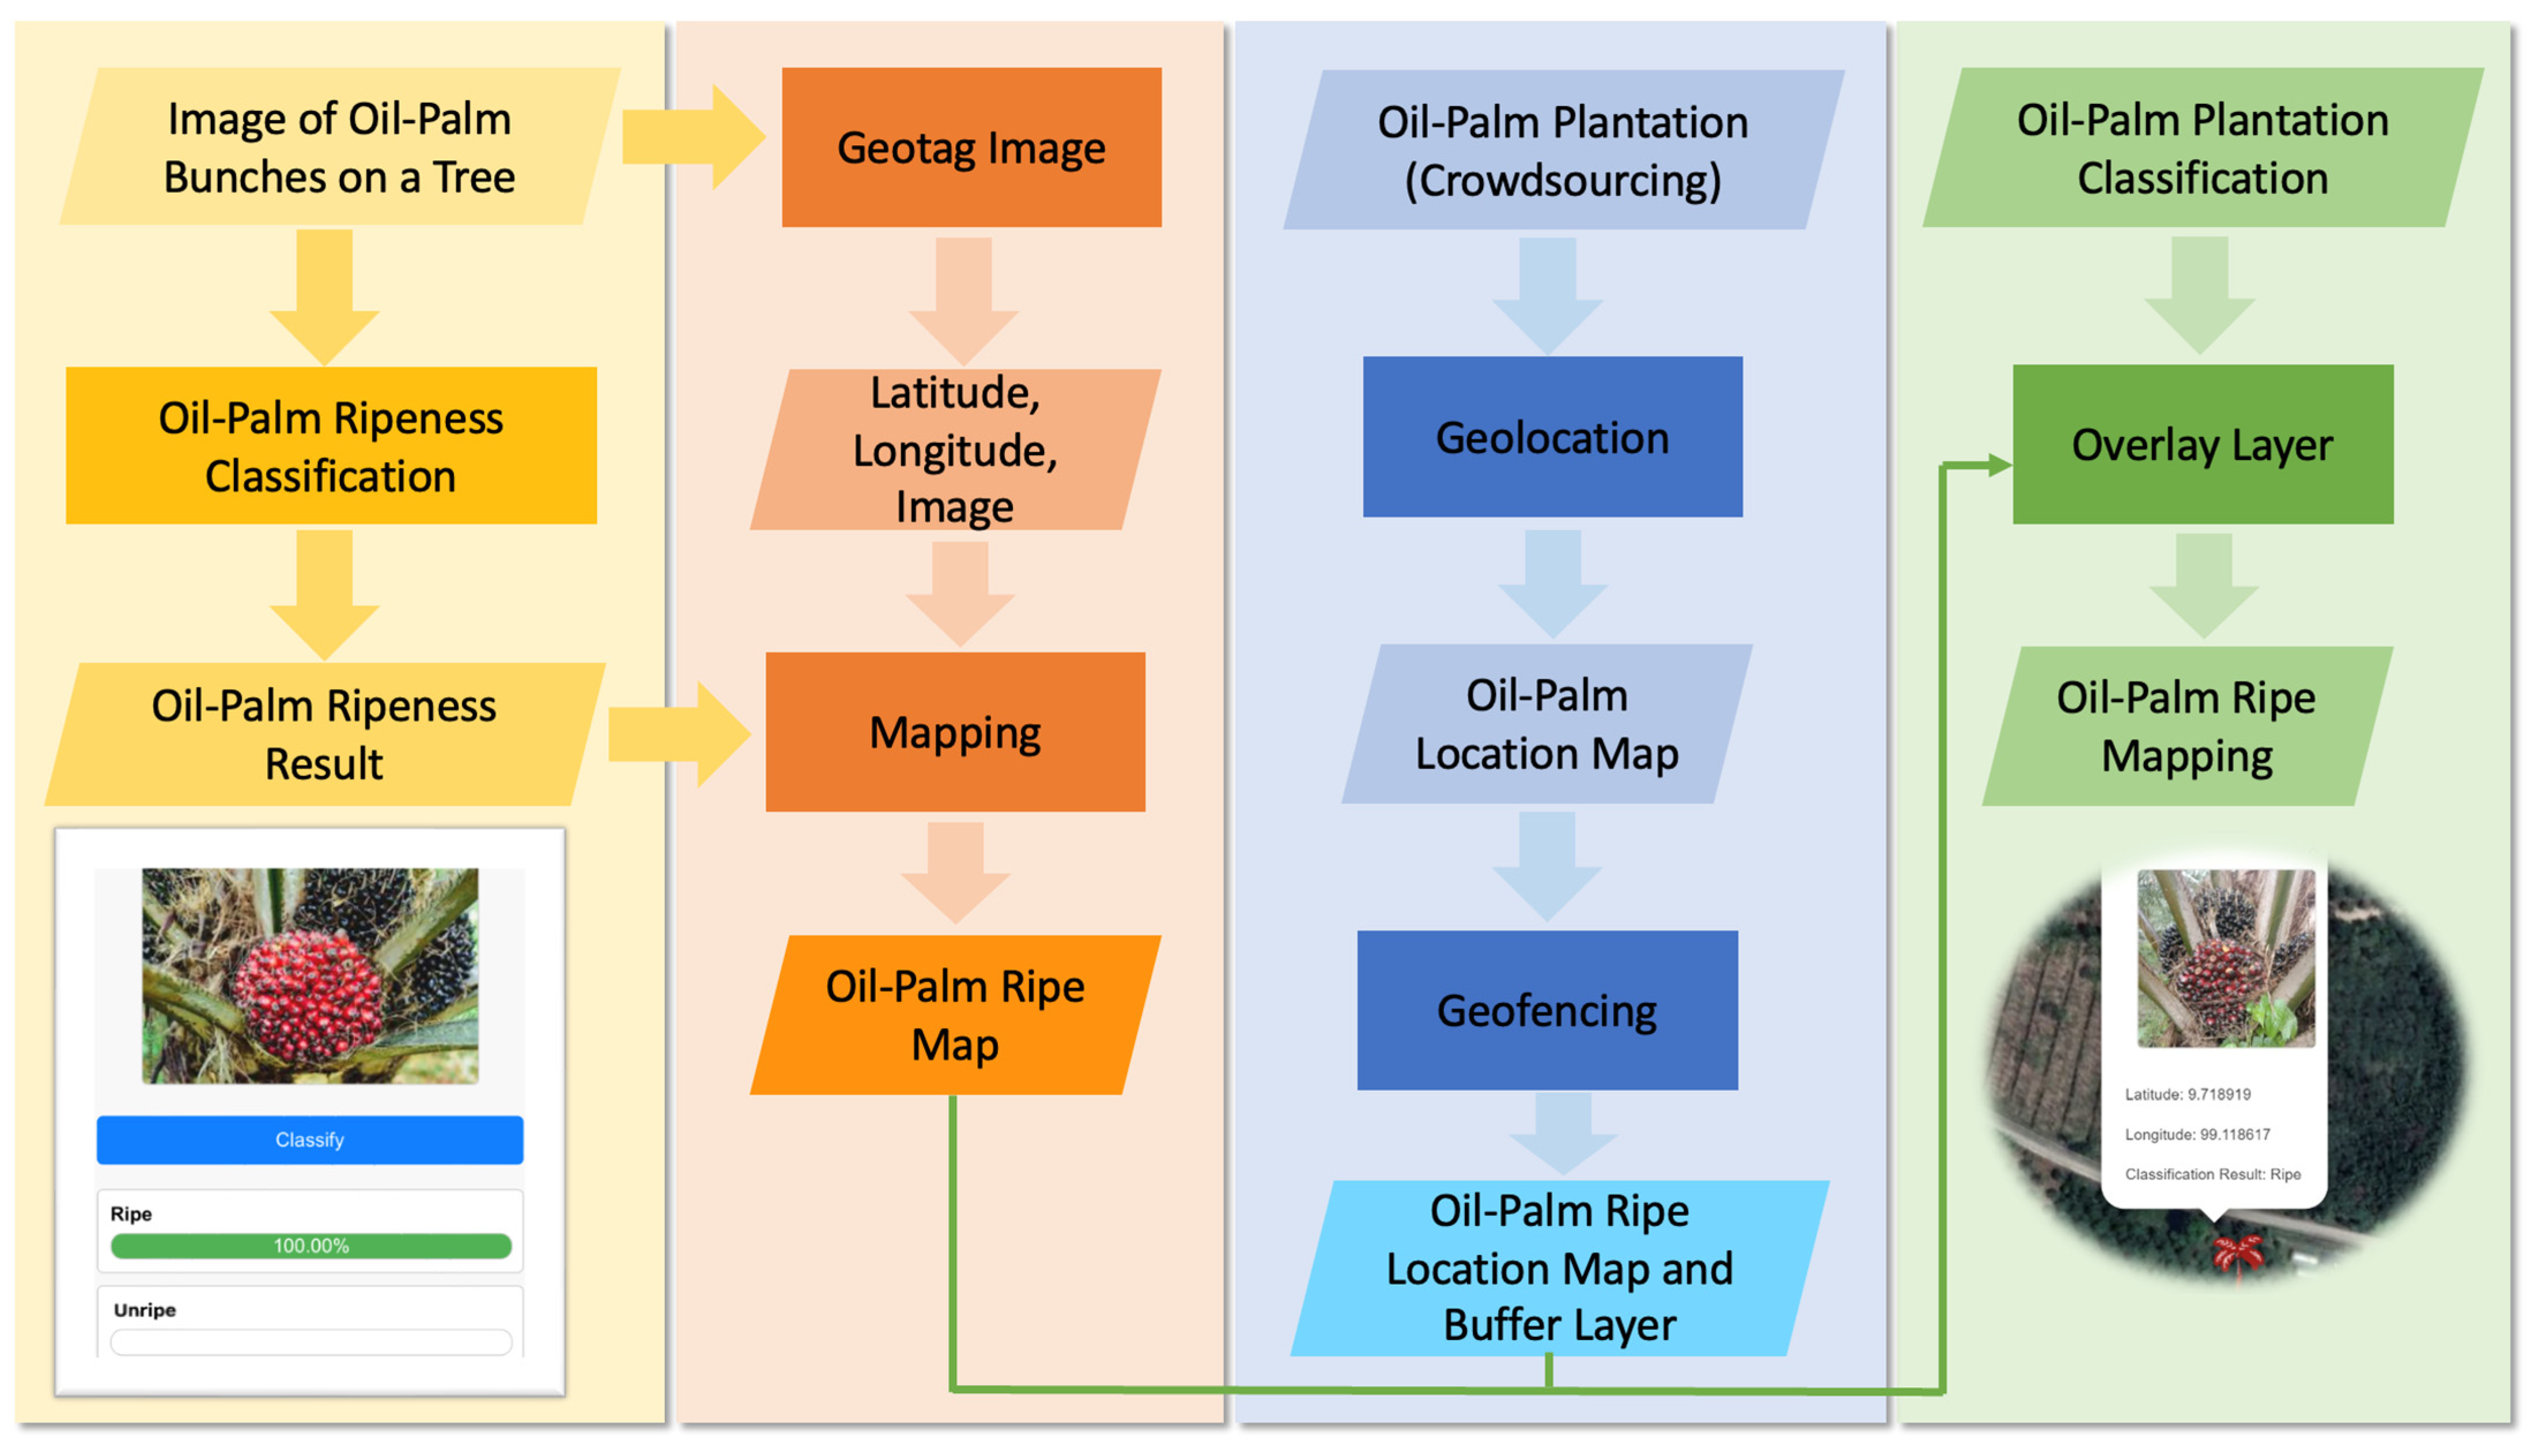
This research introduces the development of a platform or application designed to monitor the ripeness of oil palm bunches utilizing machine learning in conjunction with real-time geospatial analysis and visualization. The conceptual framework of the research is illustrated in Figure 1. The data utilized in this study are categorized into three parts, namely spatial data, attribute data, and digital images. These data are sourced from a variety of outlets including the Google Earth Engine Data Catalog, Google, and data collection efforts from volunteers or crowd-sourced information, which are then stored in a geospatial database format for utilization in platform or application development through coding or Application Programming Interface (API). The querying of data from all three sources enables the retrieval of spatial, attribute, and digital image data for subsequent geospatial analysis and visualization processes. Various machine learning algorithms are applied to process the data, with the aim of identifying the most accurate algorithm to be incorporated into the development of an application designed to classify the ripeness of oil palm bunches still on the tree or yet to be harvested. This information is intended for government agencies, aiding in budget planning and the allocation of relief funds in scenarios such as mitigating the effects of hindrances to harvesting, such as flooding, or helping in the case of low-priced produce. The research outcomes are presented through a geospatial application, displaying the coordinates of confirmed oil palm sections by cross-referencing data extracted from GPS equipment with results from satellite image processing of oil palm plantation areas. This is complemented by data on the classification of ripeness levels of oil palm bunches on trees, captured by farmers using the application.

3.1. Study Area

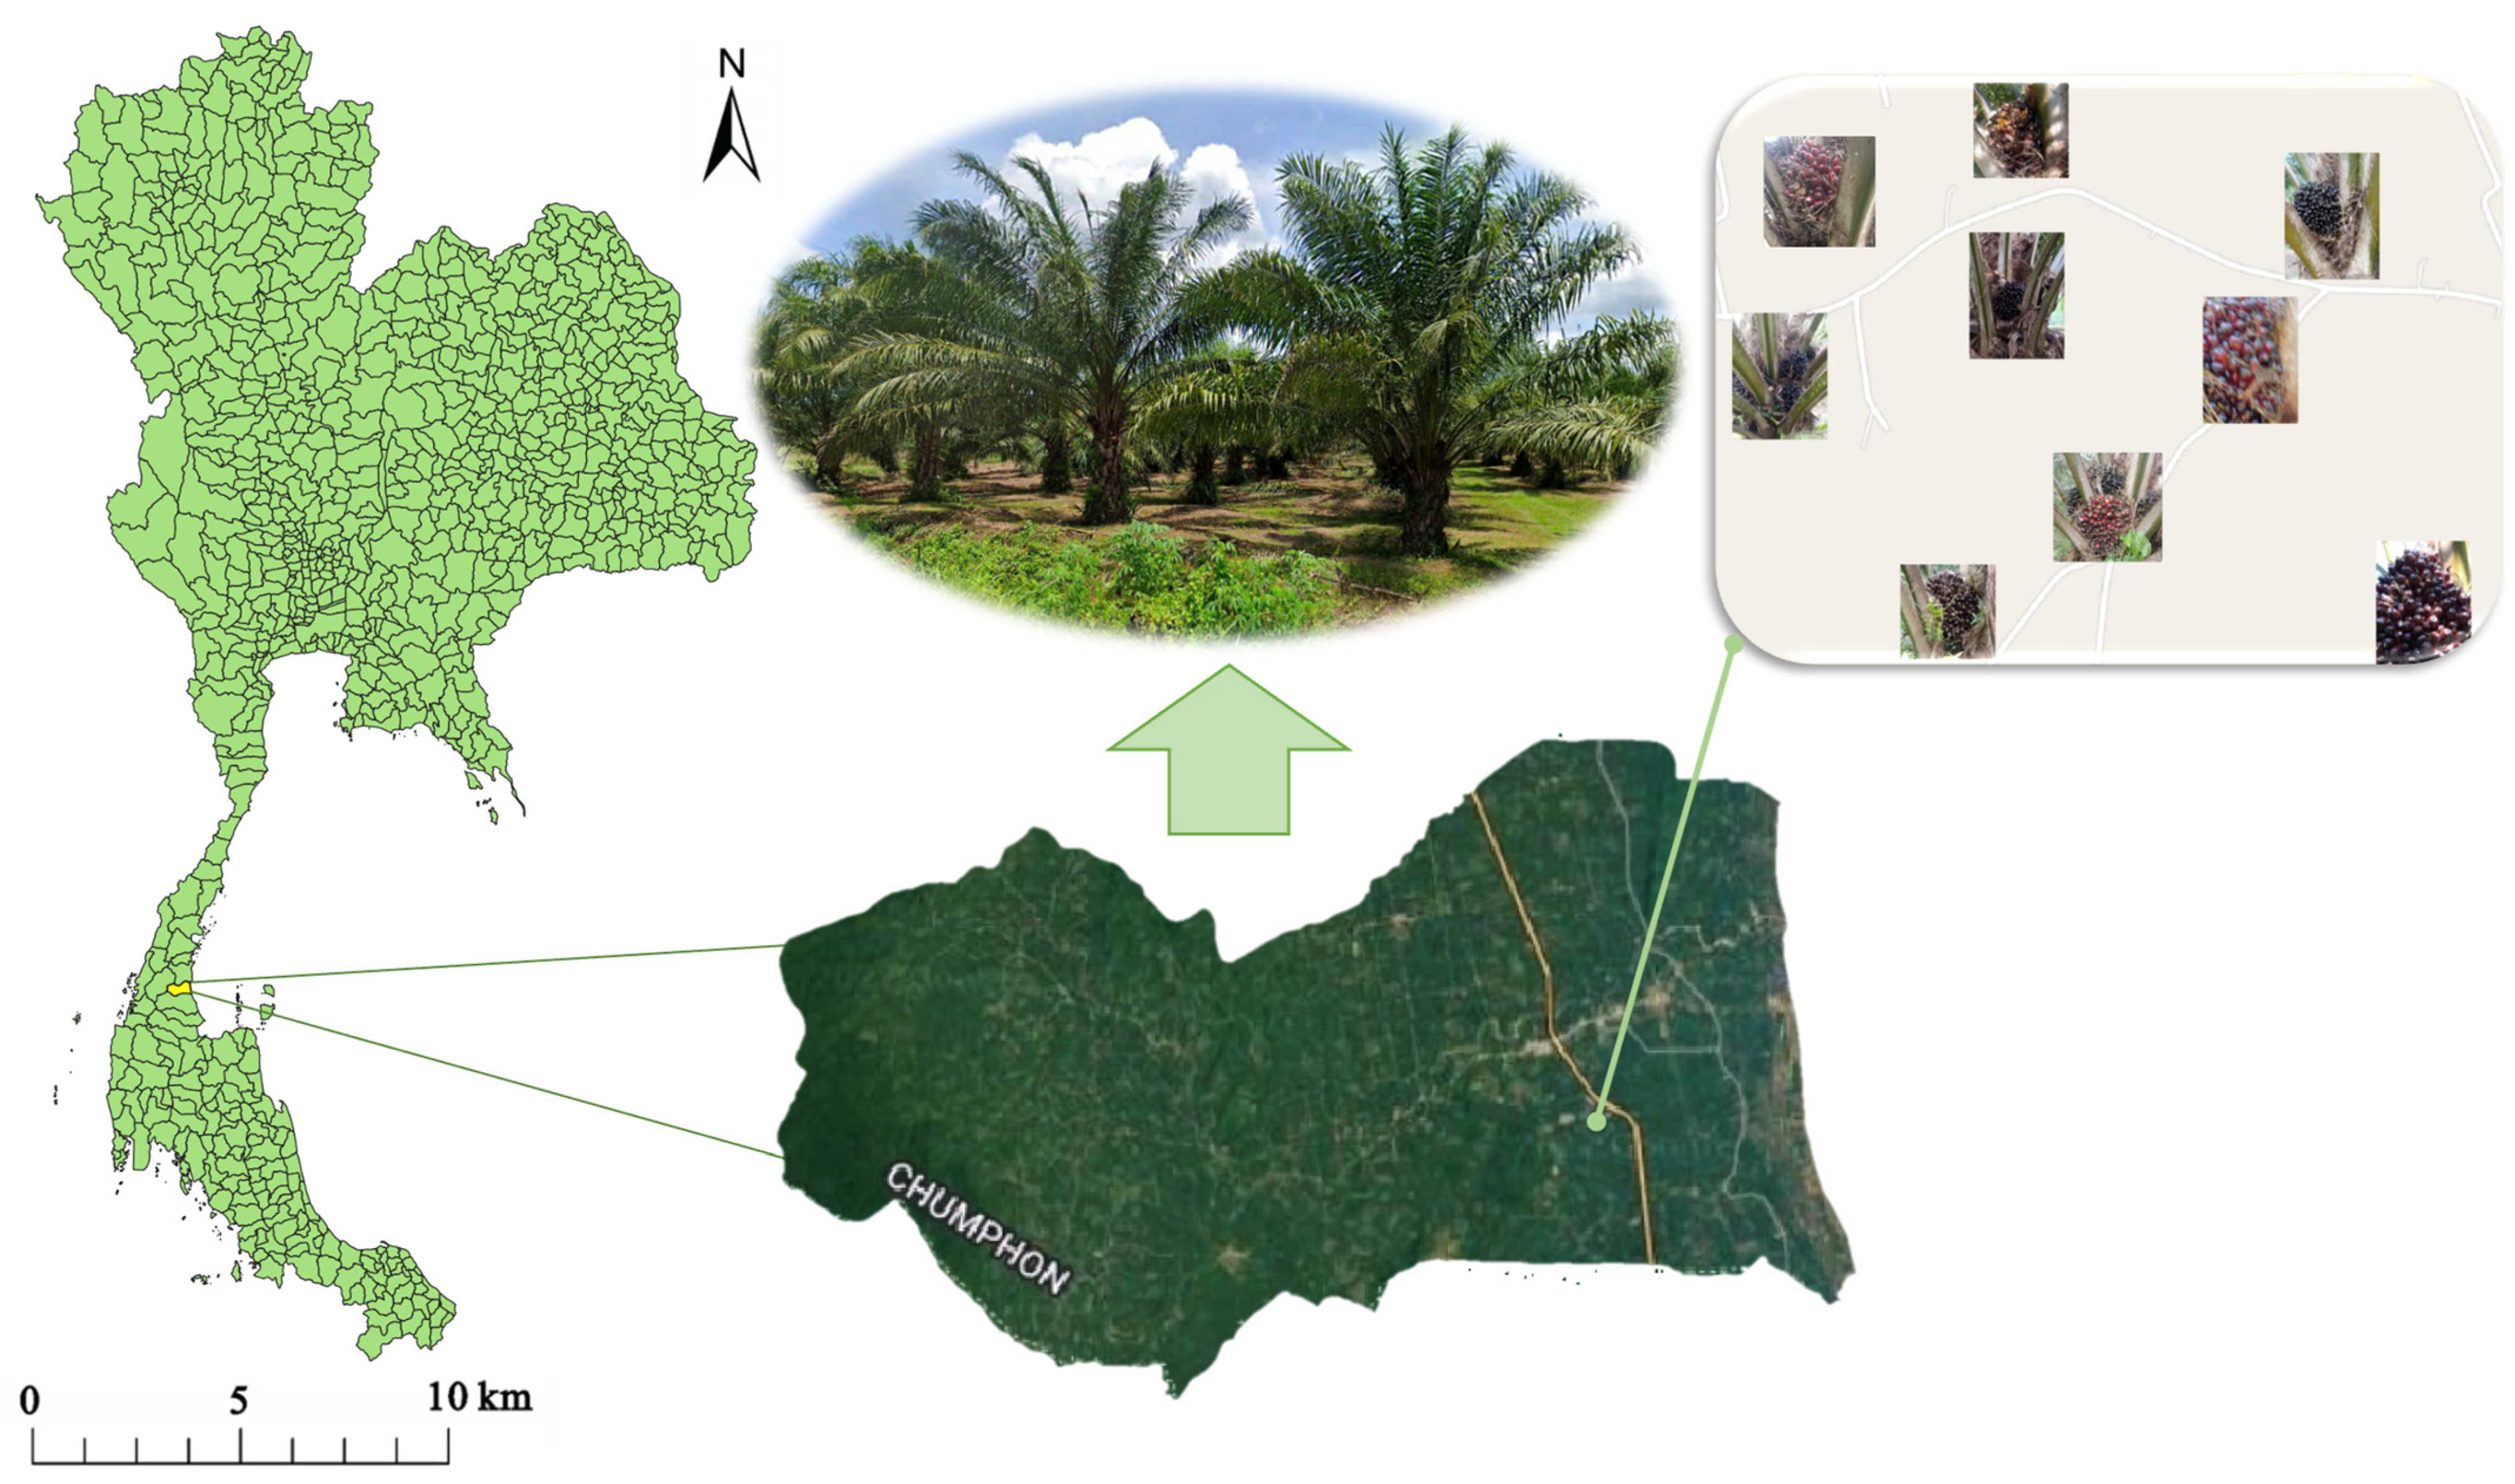
The study area for this research is the Lamae district, located in Chumphon province, Southern Thailand (9.7593° N, 99.0350° E), as illustrated in Figure 2. In this region, farmers primarily engage in palm oil plantations, which cover an extensive area of over 48,000 rai. This makes oil palm the predominant crop in the area, surpassing even rubber plantations. This agricultural landscape is consistent with the broader agricultural profile of the Chumphon Province, where oil palm accounts for 46.03% of the total agricultural land. The Lamae district is particularly prone to annual flooding, which significantly impacts the local oil palm farmers. Hence, the Lamae district was chosen as the study area for data collection to develop the proposed platform or application. Nevertheless, the methodologies and applications presented in this research are applicable to other regions, both within Thailand and internationally.

3.2. Data Collection and Preparation

The data collection and preparation process in this study involve several steps. Firstly, data is retrieved from the open data cloud server of the spatial data service provider. Additionally, field visits to the study area are conducted to collect data using crowdsourcing or Volunteered Geographic Information (VGI) methods, involving local stakeholders. The data were utilized for analysis and comprised spatial data, attribute data, and digital images. The specific details and sources of these data are presented in Table 1. These datasets are utilized to classify the ripeness of oil palm bunches on the tree and to analyze spatial data for the development of platforms or applications.

3.3. Oil Palm Ripeness Classification

In previous studies that have utilized classical machine learning algorithms to classify or detect the ripeness of oil palm bunches, several algorithms have demonstrated high accuracy. Therefore, this study incorporates four classical machine learning algorithms to explore the effects of preprocessing the input data through image embedding using InceptionV3 before conducting image classification with the four machine learning algorithms. This comparison with deep learning/CNN aims to offer guidance and alternative options for application development, recognizing that in practical scenarios, CNN may not always be feasible due to limitations in server or computer efficiency and resources for image processing. Currently, one alternative for image classification involves using pretrained models accessible through cloud services or APIs, which can be loaded for utilization. However, limitations persist, as existing models may not encompass specialized tasks like classifying the ripeness level of oil palm bunches on trees, and they may lack the flexibility for modification and improvement. For instance, a pretrained model designed for detection may not yield sufficient results when repurposed for classification, highlighting the need for tailored model development and refinement for specific applications. This ensures alignment with the stated objectives or goals and enhances the model’s accuracy and applicability across desired contexts.
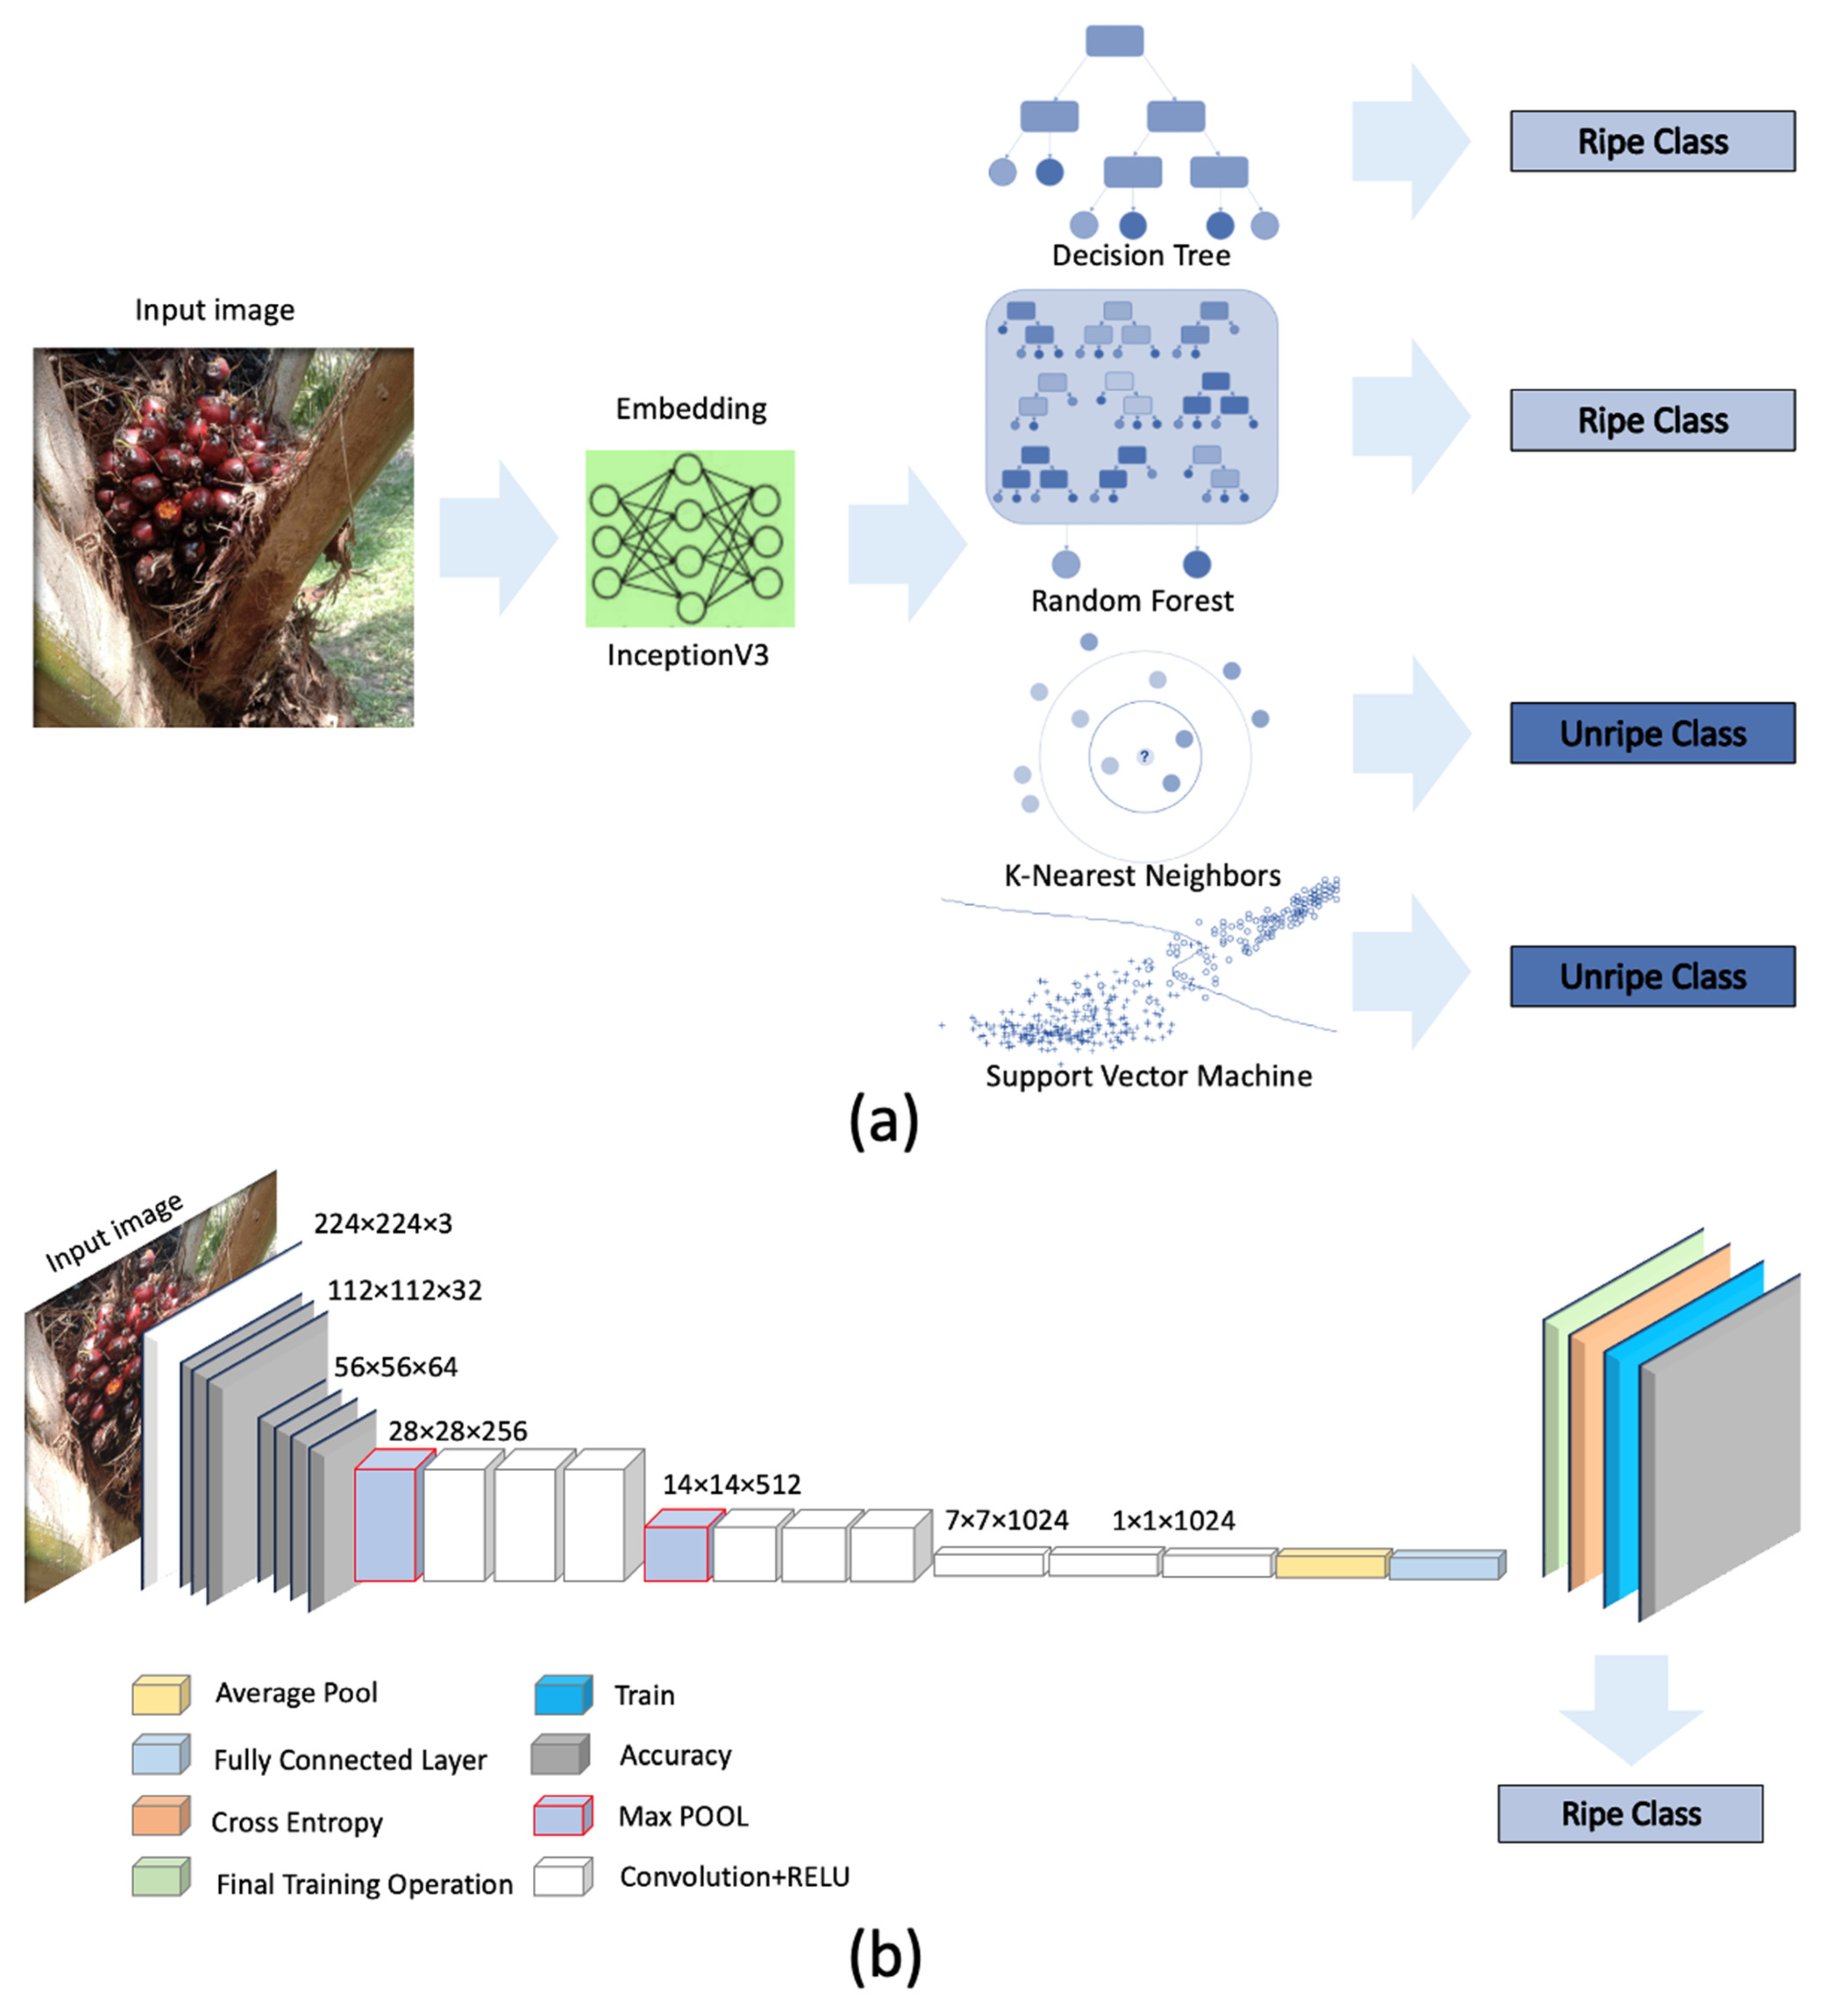
In this research, the classification of the ripeness of oil palm bunches utilized photos of bunches that were still on the tree or yet to be harvested. This approach addresses a limitation observed in previous studies, where support for images of oil palm bunches on the tree was lacking. Furthermore, the assessment of ripeness of oil palm bunches on the tree has various practical applications, such as providing relief during flooding or when faced with low-priced produce, as well as aiding in harvesting decisions. For the dataset used in this study, a total of 8779 images of oil palm bunches on the tree were collected. These images were categorized into 4004 images representing unripe oil palm bunches and 4775 images representing ripe ones. The classification task involved two target classes, namely Ripe and Unripe. This study employs the K-fold cross-validation method to evaluate the model performance of each algorithm. Specifically, 10-fold cross-validation is selected due to its optimal performance and mitigation of overfitting issues when validating the model. K-fold cross-validation aids in reducing the variance in model performance estimates by averaging results across multiple folds. This is particularly crucial in deep learning, such as CNN, where models are complex and prone to overfitting during training. By averaging performance across multiple folds, variability in performance estimates is minimized, providing a more reliable assessment of the model’s generalization ability. Therefore, 10-fold cross-validation serves as a robust and efficient method for training and evaluating CNN models, ensuring their effectiveness on unseen data, and facilitating effective generalization to new samples. This study employs the image embedding procedure utilizing the InceptionV3 model to preprocess the original image prior to conducting image classification with all four machine learning algorithms. Image embedding involves the conversion of images into numerical value vectors, facilitating the utilization of image data in vector form. The resultant vectors from embedding are of high dimensionality and can intricately represent image features, thereby enabling their use in training and evaluating machine learning models or other image-related data processing tasks with enhanced efficiency. The rationale behind selecting image embedding in this research is to leverage the model trained with embedding to address image-related issues more effectively compared to direct utilization of the original image. Figure 3a illustrates the process of classifying the ripeness of oil palm bunches using four machine learning algorithms, while Figure 3b presents the architecture of MobileNetV1. The algorithms used for classification included CNN, RF, DT, KNN, and SVM. Various parameters were set to create the classification model. Details of the parameters used for classification are presented in Table 2. In this research, the CNN chosen for implementation is MobileNetV1. This model was selected due to its design for deployment on devices with constrained processing resources, such as smartphones or mobile devices. MobileNetV1 is known for its high processing speed, making it particularly suitable for the development of a platform or application to classify the ripeness of oil palm bunches on the tree.

3.4. Accuracy Assessment

The evaluation metrics used in this assessment include accuracy, F-measure, precision, and recall, as defined by the equations presented in Table 3. These metrics provide a comprehensive understanding of the model’s performance in classifying the ripeness of oil palm bunches.

3.5. System Analysis and Design

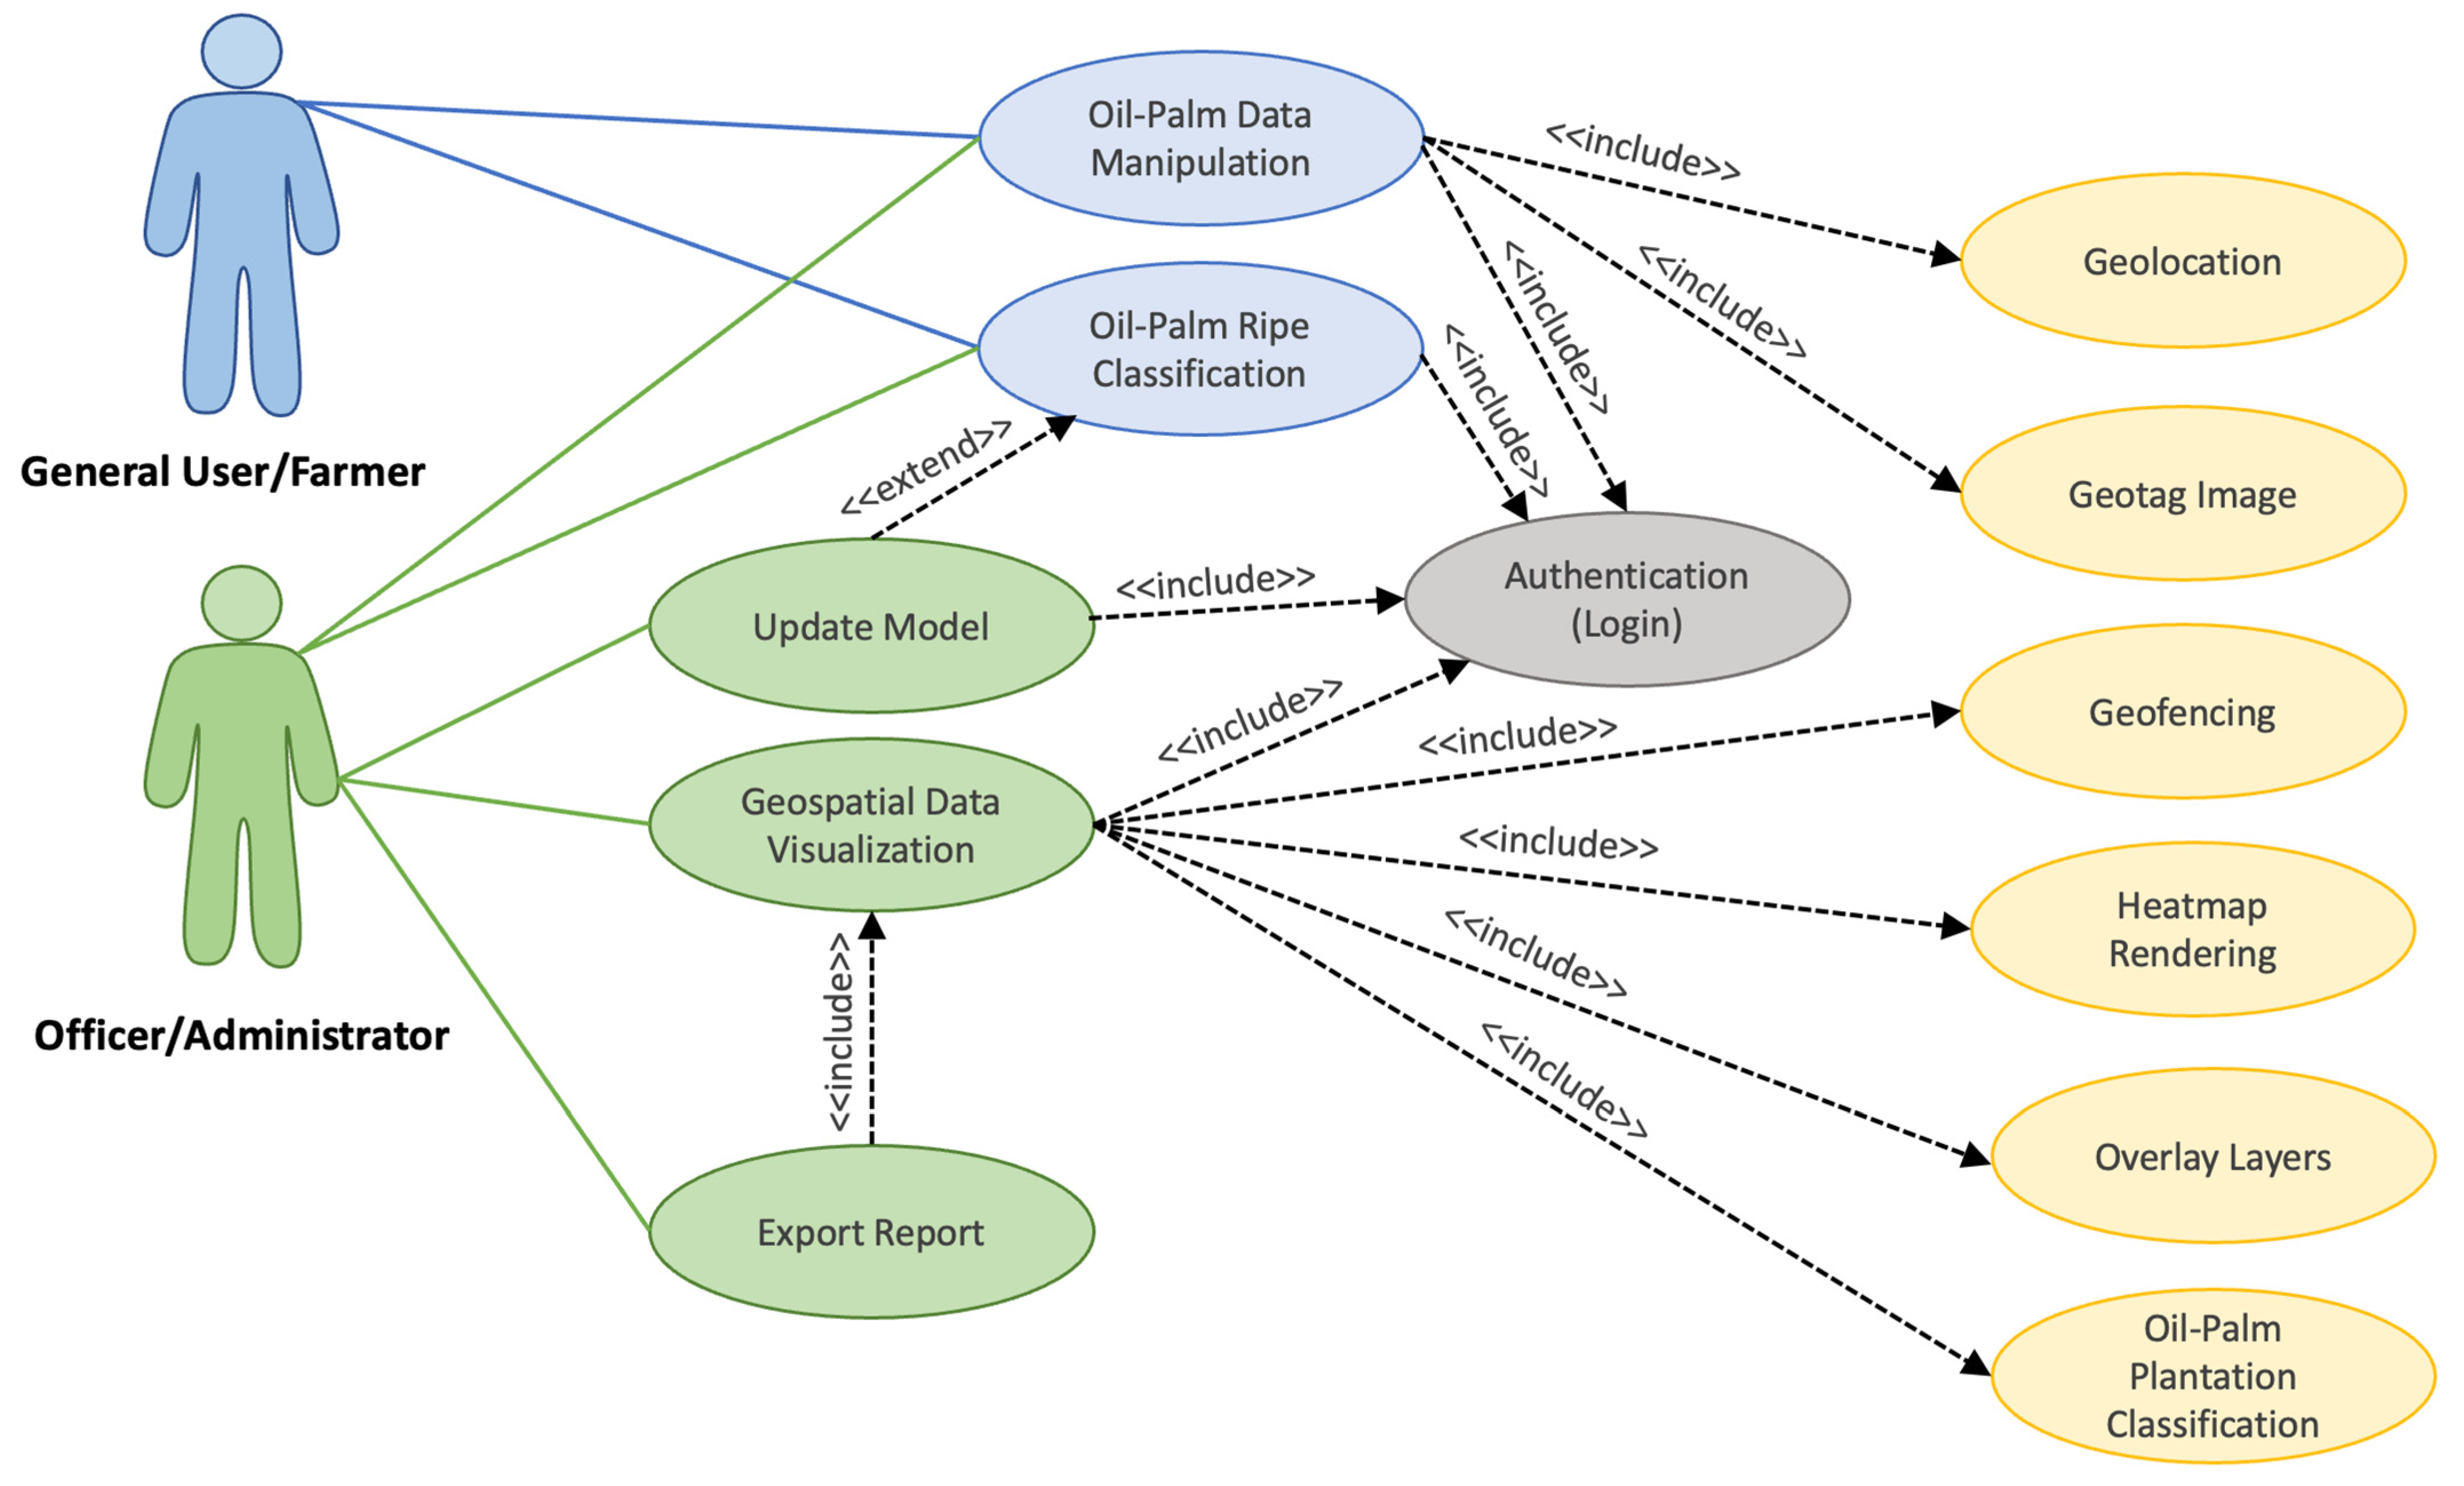
The system analysis and design in this research are presented through a use case diagram, as depicted in Figure 4. The following two main user groups interact with the platform or application: general users or farmers, and officers or administrators. General users or farmers have the capability to utilize the application for managing their oil palm plantation data (Oil-Palm Plantation Data Manipulation). Within the data management functionality, Geolocation is invoked to retrieve latitude and longitude coordinates of the oil palm plantation from the GPS device in the user’s mobile device. Additionally, they can capture images of oil palm bunches on trees to classify the ripeness of the oil palm (Oil-Palm Ripe Classification). Geotag images are employed to extract latitude and longitude information from the photos for this purpose. Authentication is required for general users or farmers to verify their identity. Similarly, officers or administrators have access to the application with the same functionalities as general users or farmers. The model implemented in the system is designed to be updatable for classifying the ripeness of oil palm bunches. This allows for the improvement of the model’s accuracy as the dataset size increases. Furthermore, it enables the application to incorporate geospatial data visualization. Geofencing is employed to process and display the distance to the surrounding area based on the current radius of the plantation location provided by the user. This information is compared with the Oil-Palm Plantation Classification data to validate that the reported area is indeed an oil palm plantation. The system also utilizes Heatmap to visually represent the density of oil palm plantation locations reported by farmers. Overlay Layers are used to display relevant spatial data to guide users through the application. Additionally, satellite image data is processed to classify oil palm plantation plots for display and comparison, ensuring the accuracy of oil palm plantation locations.
Stakeholders utilizing this system encompass farmers and oil palm plantation proprietors, categorized as users, while government agency officials or personnel fall under the classification of officers and administrators. Regarding data incorporation into the system, farmers and orchard proprietors can access the system via an application provided in the form of a web application platform, utilizing either their existing user accounts or registering as members if they do not possess one. Through the application form, farmers can input various pieces of information, including attribute data, spatial data, and images. The data provided by farmers will be stored in the database and processed using a model, with the outcomes recorded in the same database. Government officials can utilize the application to retrieve data and generate reports based on specific criteria, including the option to export files for further utilization. Administrators among government officials have the capacity to add or update model data when a new version becomes available.
The analysis and design of the application workflow are depicted in Figure 5. The workflow commences with the input stage, where oil palm bunches are either imported into the application or photographed while still on the tree. Subsequently, a classification model is employed to determine the ripeness level of the oil palm bunches. The output of this process is the classification result, which is then utilized in conjunction with Geotag image mapping to extract coordinate data from the photographs. This extracted location data is used to generate the Oil-Palm Ripe Map. Furthermore, the process of importing oil palm plantation data involves crowdsourcing, where Geolocation is utilized to retrieve the current location coordinates from the farmer’s GPS. Once the Oil-Palm Location Map is obtained, the system calculates the radius from the current location to create the Oil-Palm Location Map and Buffer Layer. These layers are crucial for comparison with the Oil-Palm Plantation Classification data, enabling the system to display the results and present the Oil-Palm Ripe Mapping data. This Oil-Palm Ripe Mapping data plays a significant role in supporting decision-making in various scenarios, such as during periods of low-priced produce or instances where oil palm plantations are affected by floods, rendering harvest impossible. Additionally, this information is valuable in cases where purchasing by the oil palm product factory is halted, providing insights for informed decision-making.
The development of a platform or application for classifying the ripeness of oil palm bunches on trees, or those not yet harvested, involved the utilization of various hardware and software components. Programming languages such as PHP, Python, and Leaflet JavaScript were employed for writing programs to process and display both attribute data and spatial data. These languages were also utilized for running models to classify the ripeness of oil palm bunches using machine learning or deep learning techniques, specifically with the TensorFlow library. The database management system utilized in this research was MySQL. In terms of hardware, a personal computer was employed as both the Web Server and Database Server. Mobile devices, including smartphones and tablets, were utilized for application use and testing purposes. The developed application is designed to support operation on all operating systems.

4. Results and Discussion

The research results presented in this study consist of two main parts, namely the outcomes of classifying the ripeness of oil palm bunches on trees using machine learning algorithms, and the findings from developing a platform or application for the ripeness classification of oil palm bunches. This platform or application integrates machine learning with geospatial analysis and visualization techniques. The detailed research results for both aspects are as follows.

4.1. Oil Palm Ripe Classification Result

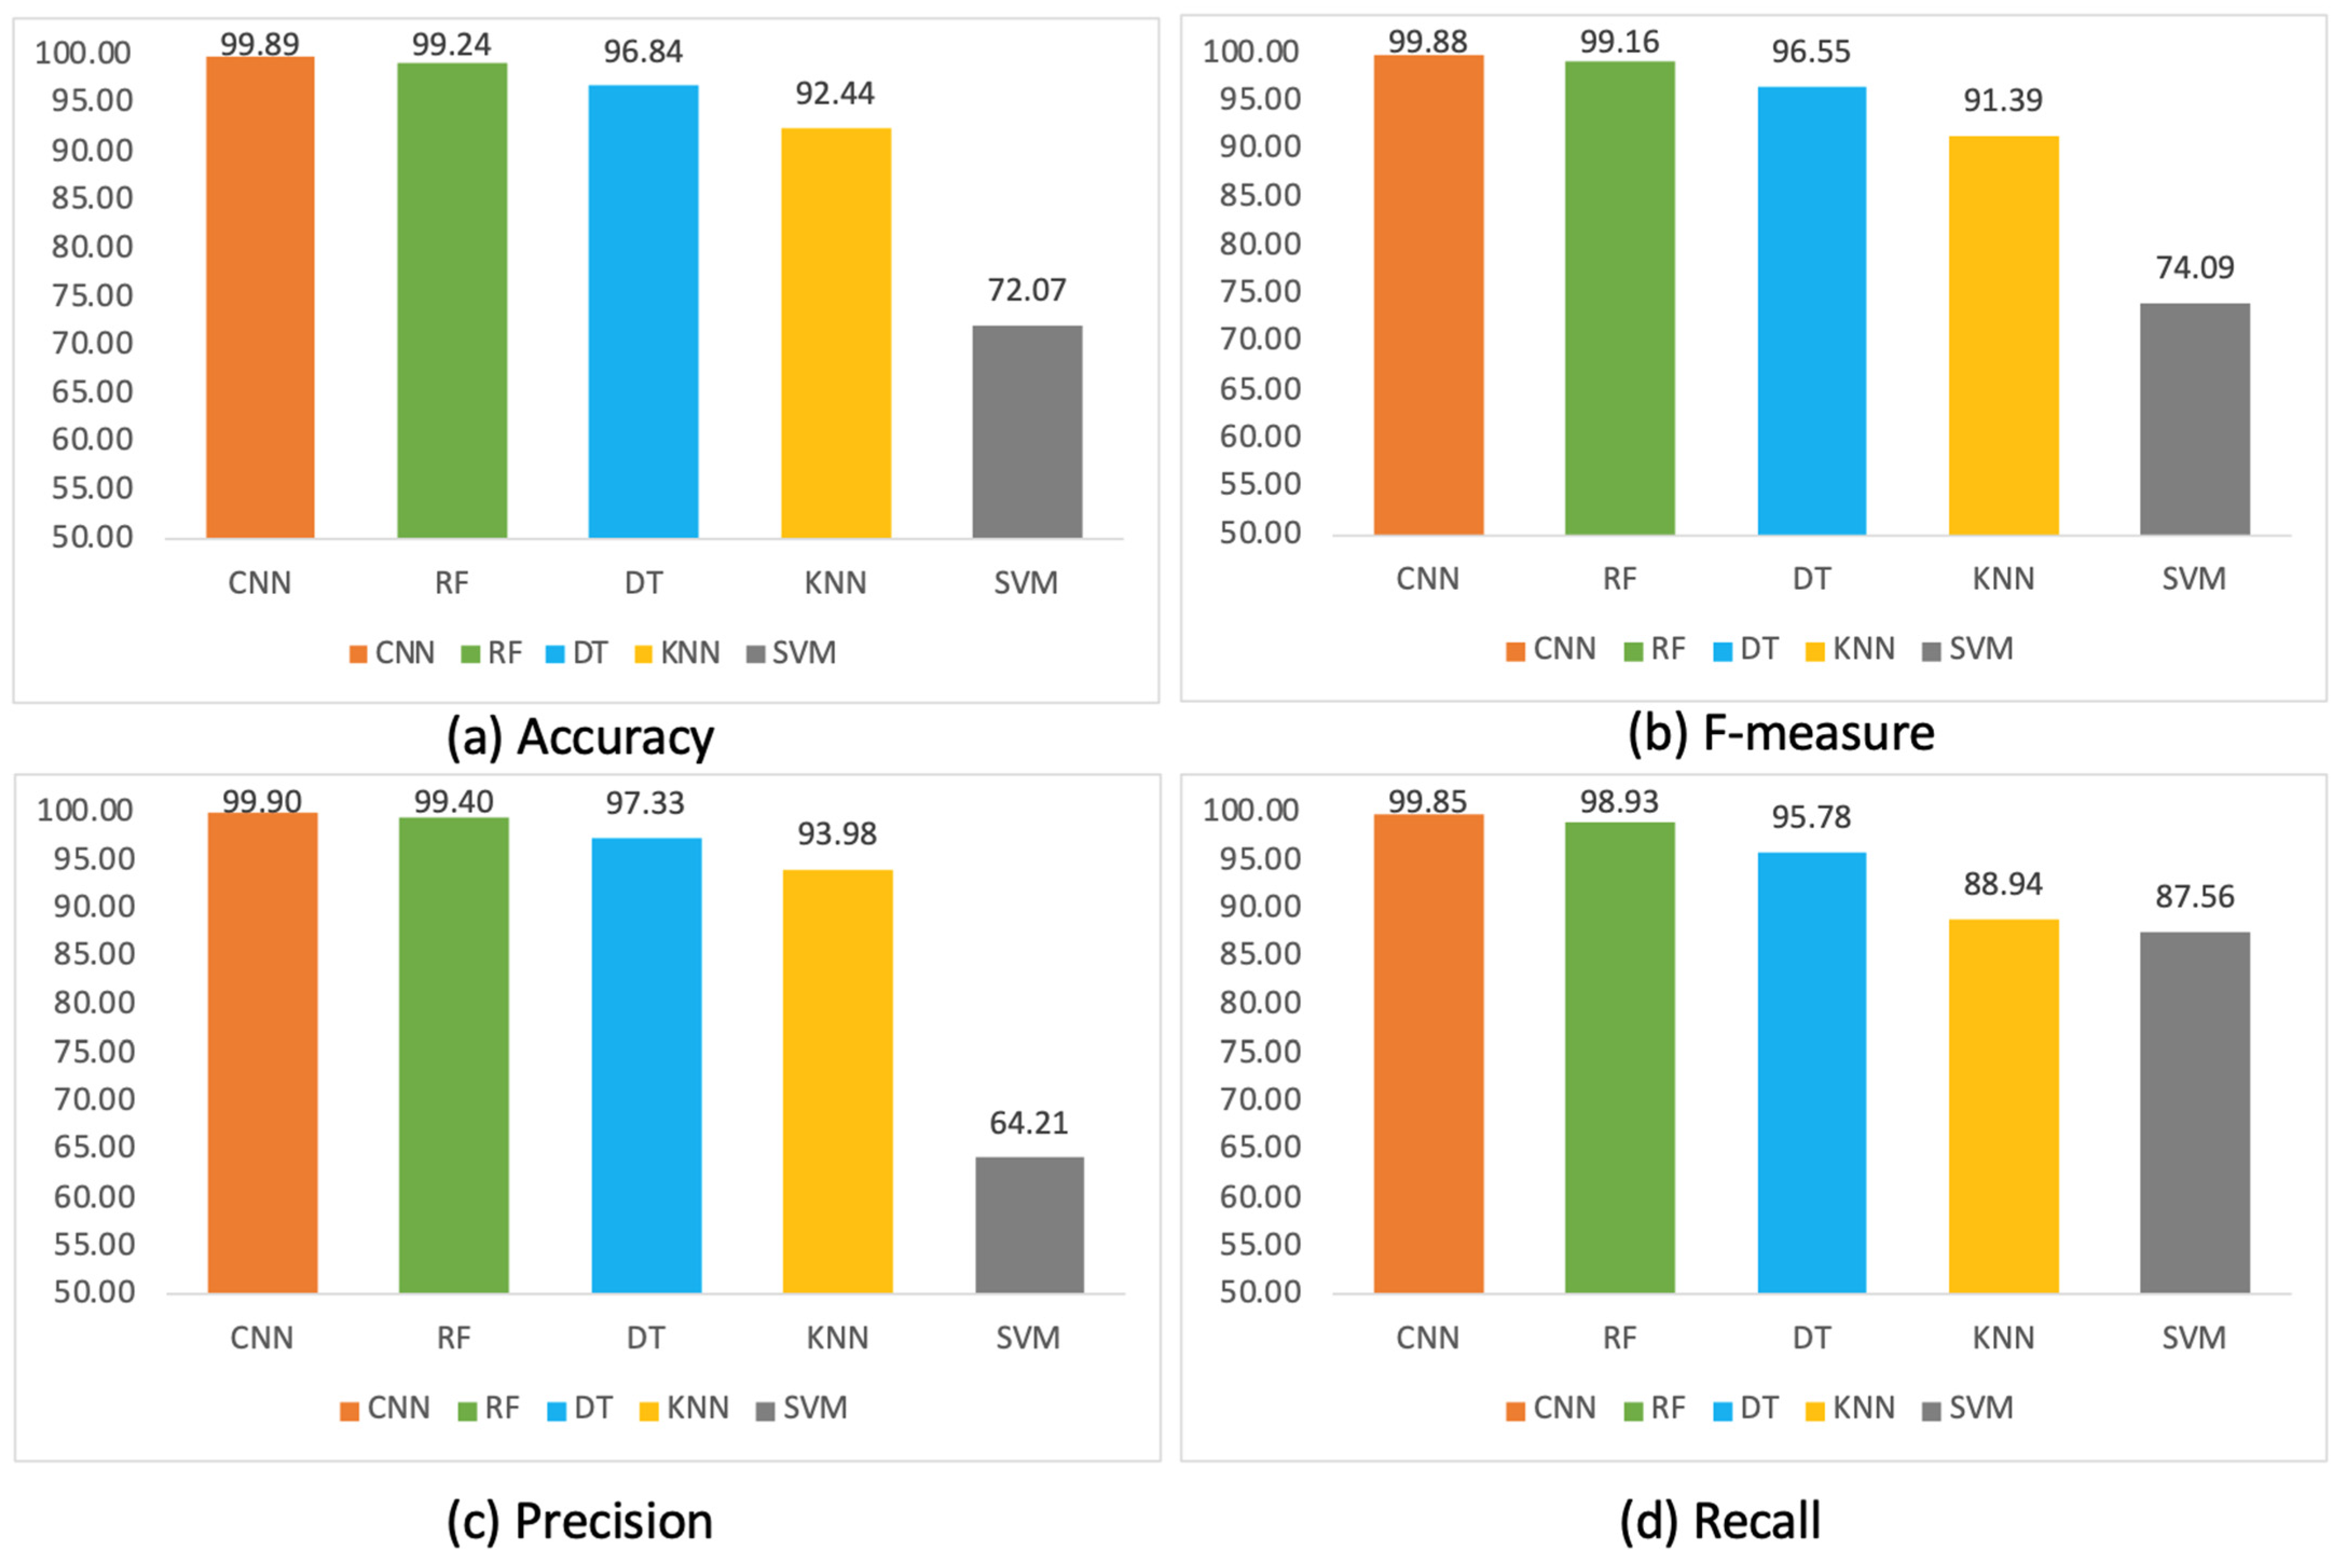
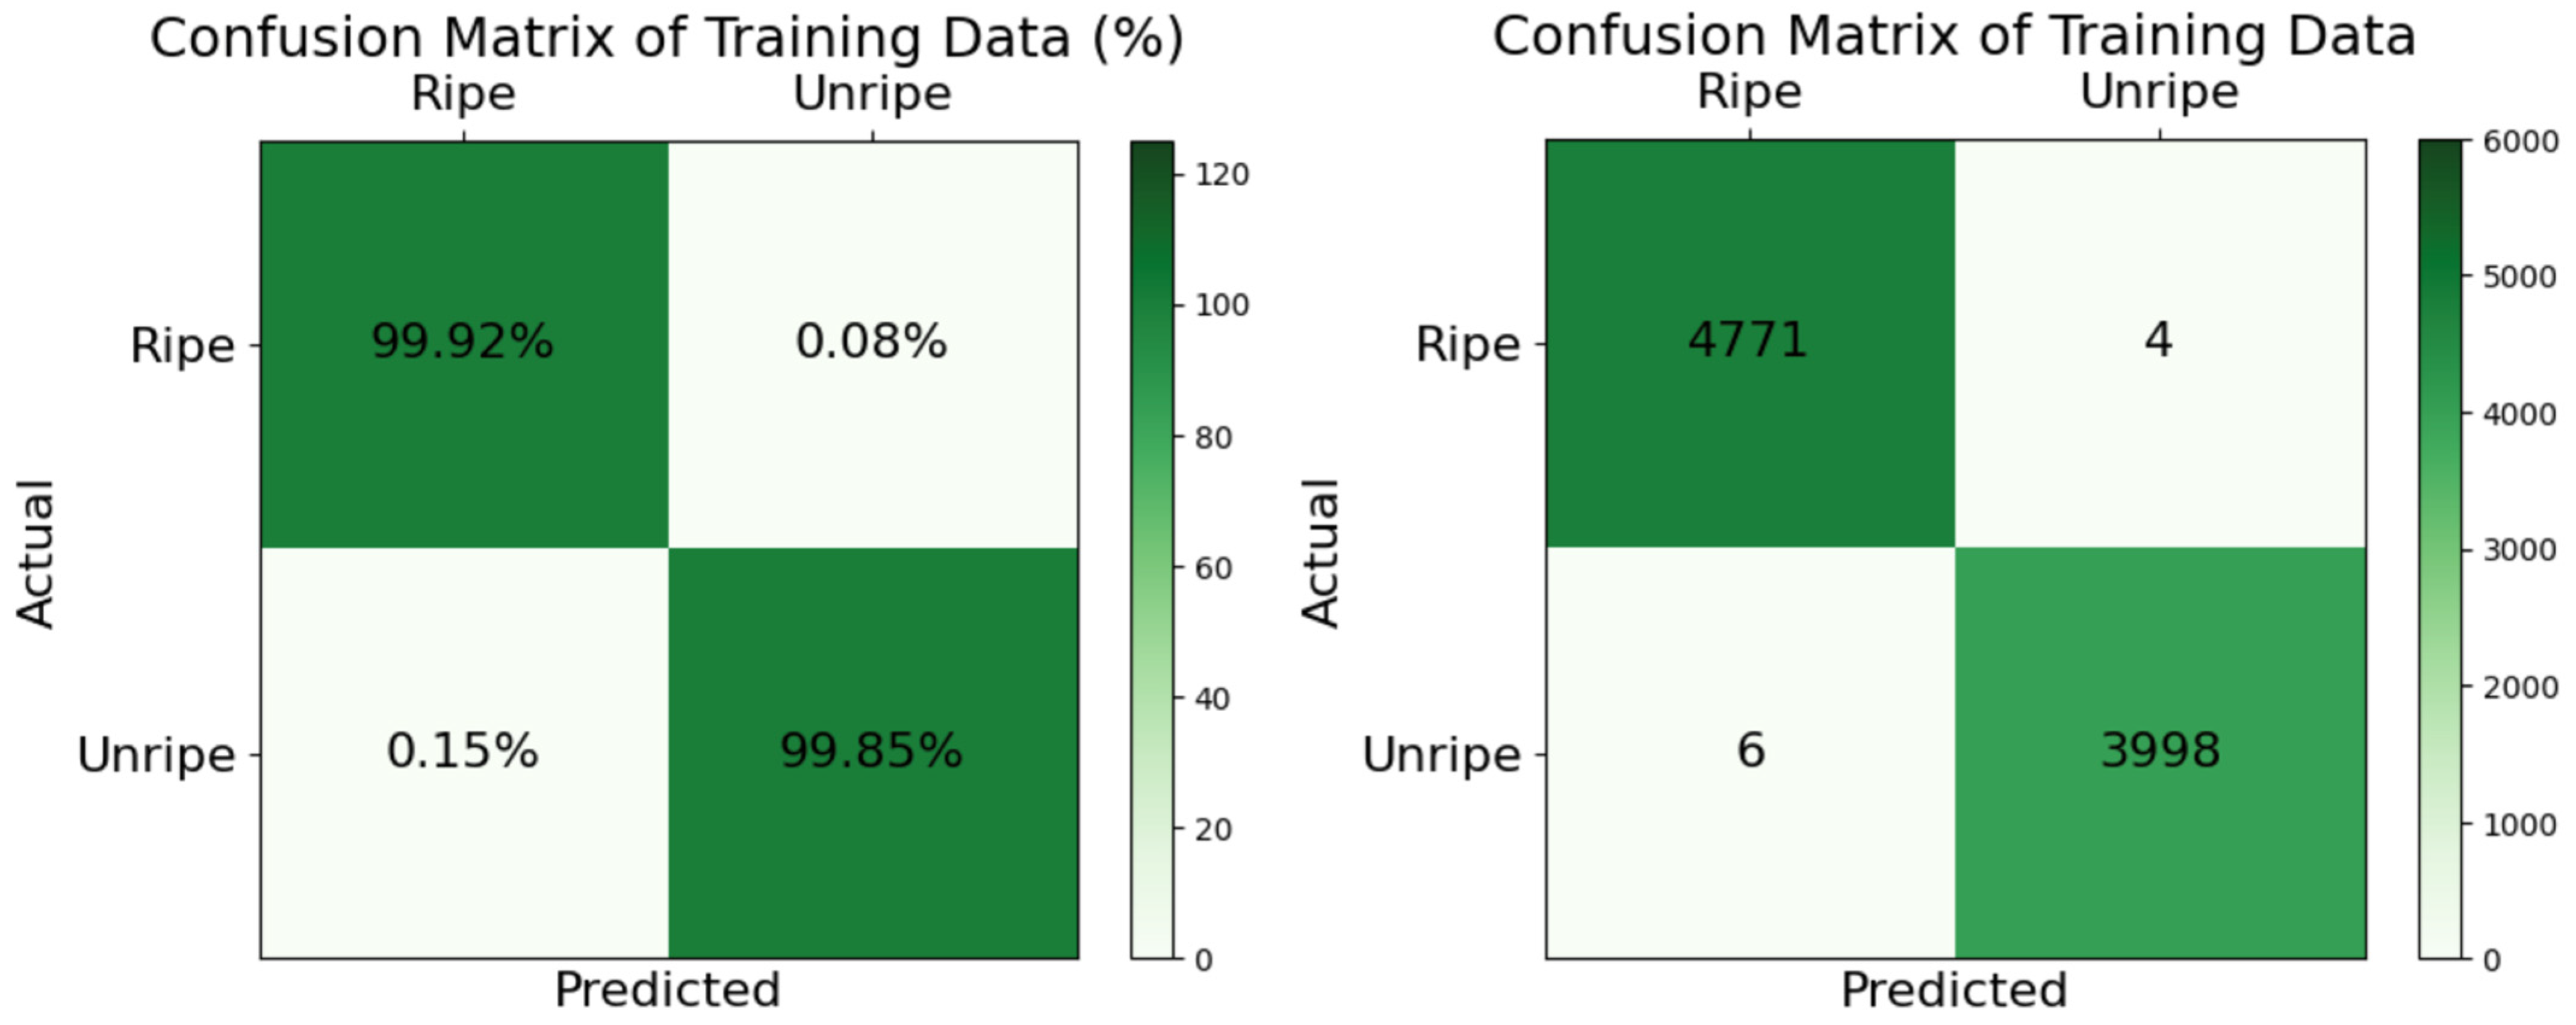
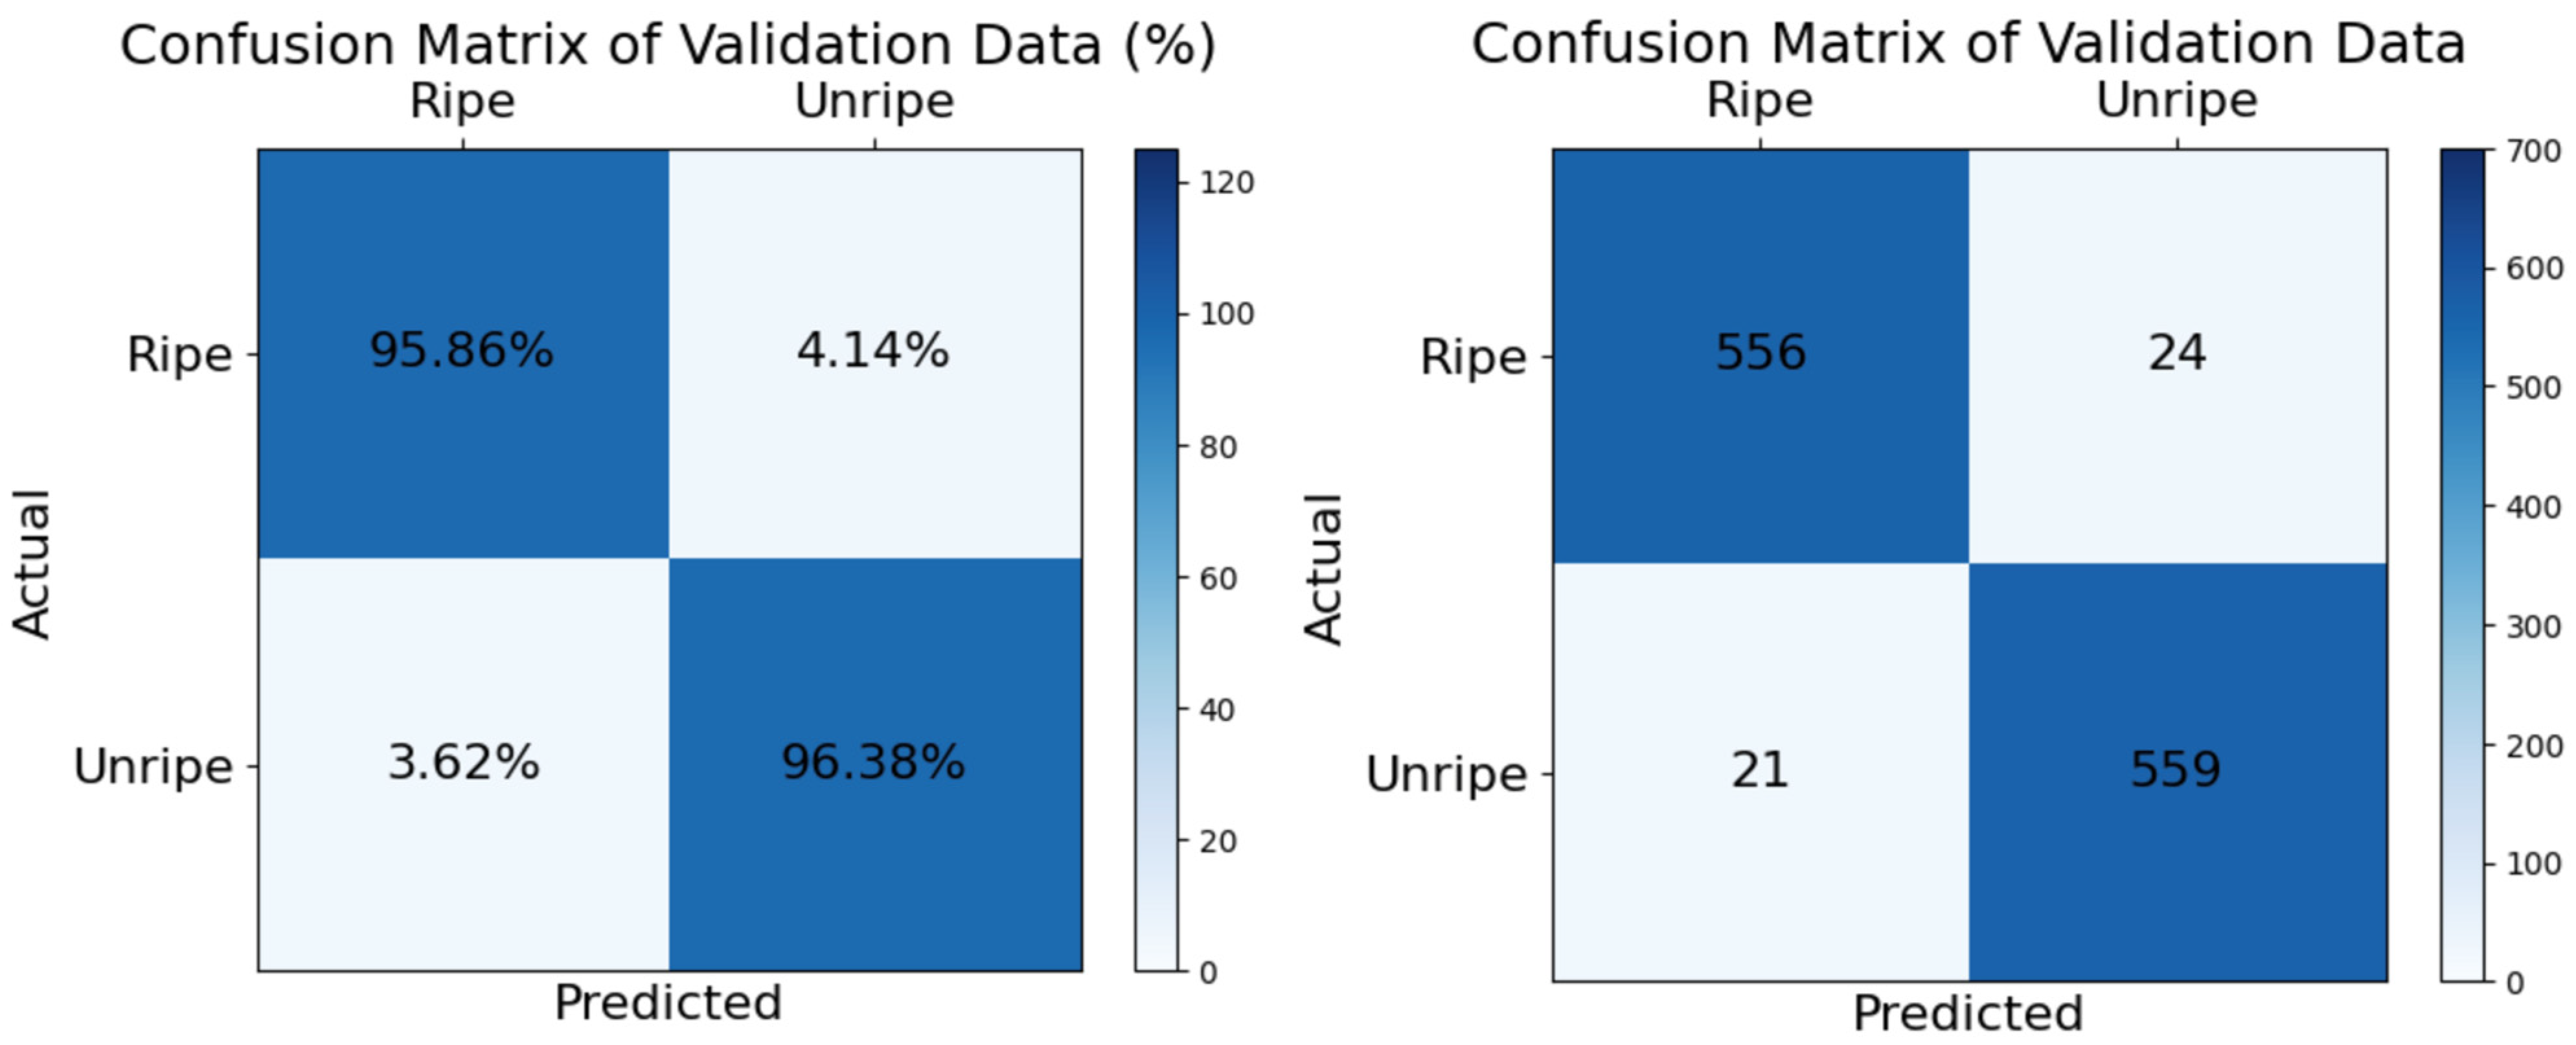
The classification of the ripeness of oil palm bunches on trees using digital photographs employed machine learning algorithms, including CNN, RF, DT, KNN, and SVM. The evaluation of the model’s accuracy, including the calculations for accuracy, F-measure, precision, and recall, is detailed in Table 4 and Figure 6. The results indicate that CNN provides the most accurate classification, achieving an accuracy of 99.89%, with F-measure, precision, and recall values of 99.88%, 99.90%, and 99.85%, respectively. Following CNN, RF, DT, KNN, and SVM achieved accuracy values of 99.24%, 96.84%, 92.44%, and 72.07%, respectively. To assess the model’s accuracy, the 10-fold cross-validation method was utilized, with a total of 8779 images used to create the model. Table 5 presents the results of assessing the accuracy in classifying the ripeness of oil palm bunches using four machine learning algorithms, RF, DT, KNN, and SVM, after applying the image embedding technique with the SqueezeNet model, replacing the previously used InceptionV3 model for comparison and analysis of accuracy. The evaluation revealed that RF achieved the highest classification accuracy, consistent with the results obtained using InceptionV3, followed by DT, KNN, and SVM, respectively. However, transitioning to SqueezeNet resulted in some variations in accuracy. Specifically, both the DT and SVM algorithms exhibited increased accuracy. While the DT algorithm’s accuracy improved by approximately 1%, the SVM algorithm’s accuracy notably increased by 8–9%. This suggests that the use of image embedding with each model affects the accuracy of the algorithms differently. Nevertheless, the CNN model’s accuracy remained the highest compared to the others. The study focused on the CNN (MobileNetV1) algorithm for evaluating both training and validation data. Results, displayed in the confusion matrix diagram in Figure 7, revealed accurate classification rates as follows: 99.92% for the Ripe class (correctly classifying 4771 out of 4775 images) and 99.85% for the Unripe class (correctly classifying 3998 out of 4004 images). The evaluation extended to the validation data, comprised of 1160 images (580 each for Ripe and Unripe classes), not used in model creation. The assessment, considering accuracy, F-measure, precision, and recall, yielded values of 96.12%, 96.11%, 95.86%, and 96.35%, respectively. Further examination in the confusion matrix diagram in Figure 8 showed correct classification rates of 95.86% for Ripe class (556 out of 580 images) and 96.38% for Unripe class (559 out of 580 images).
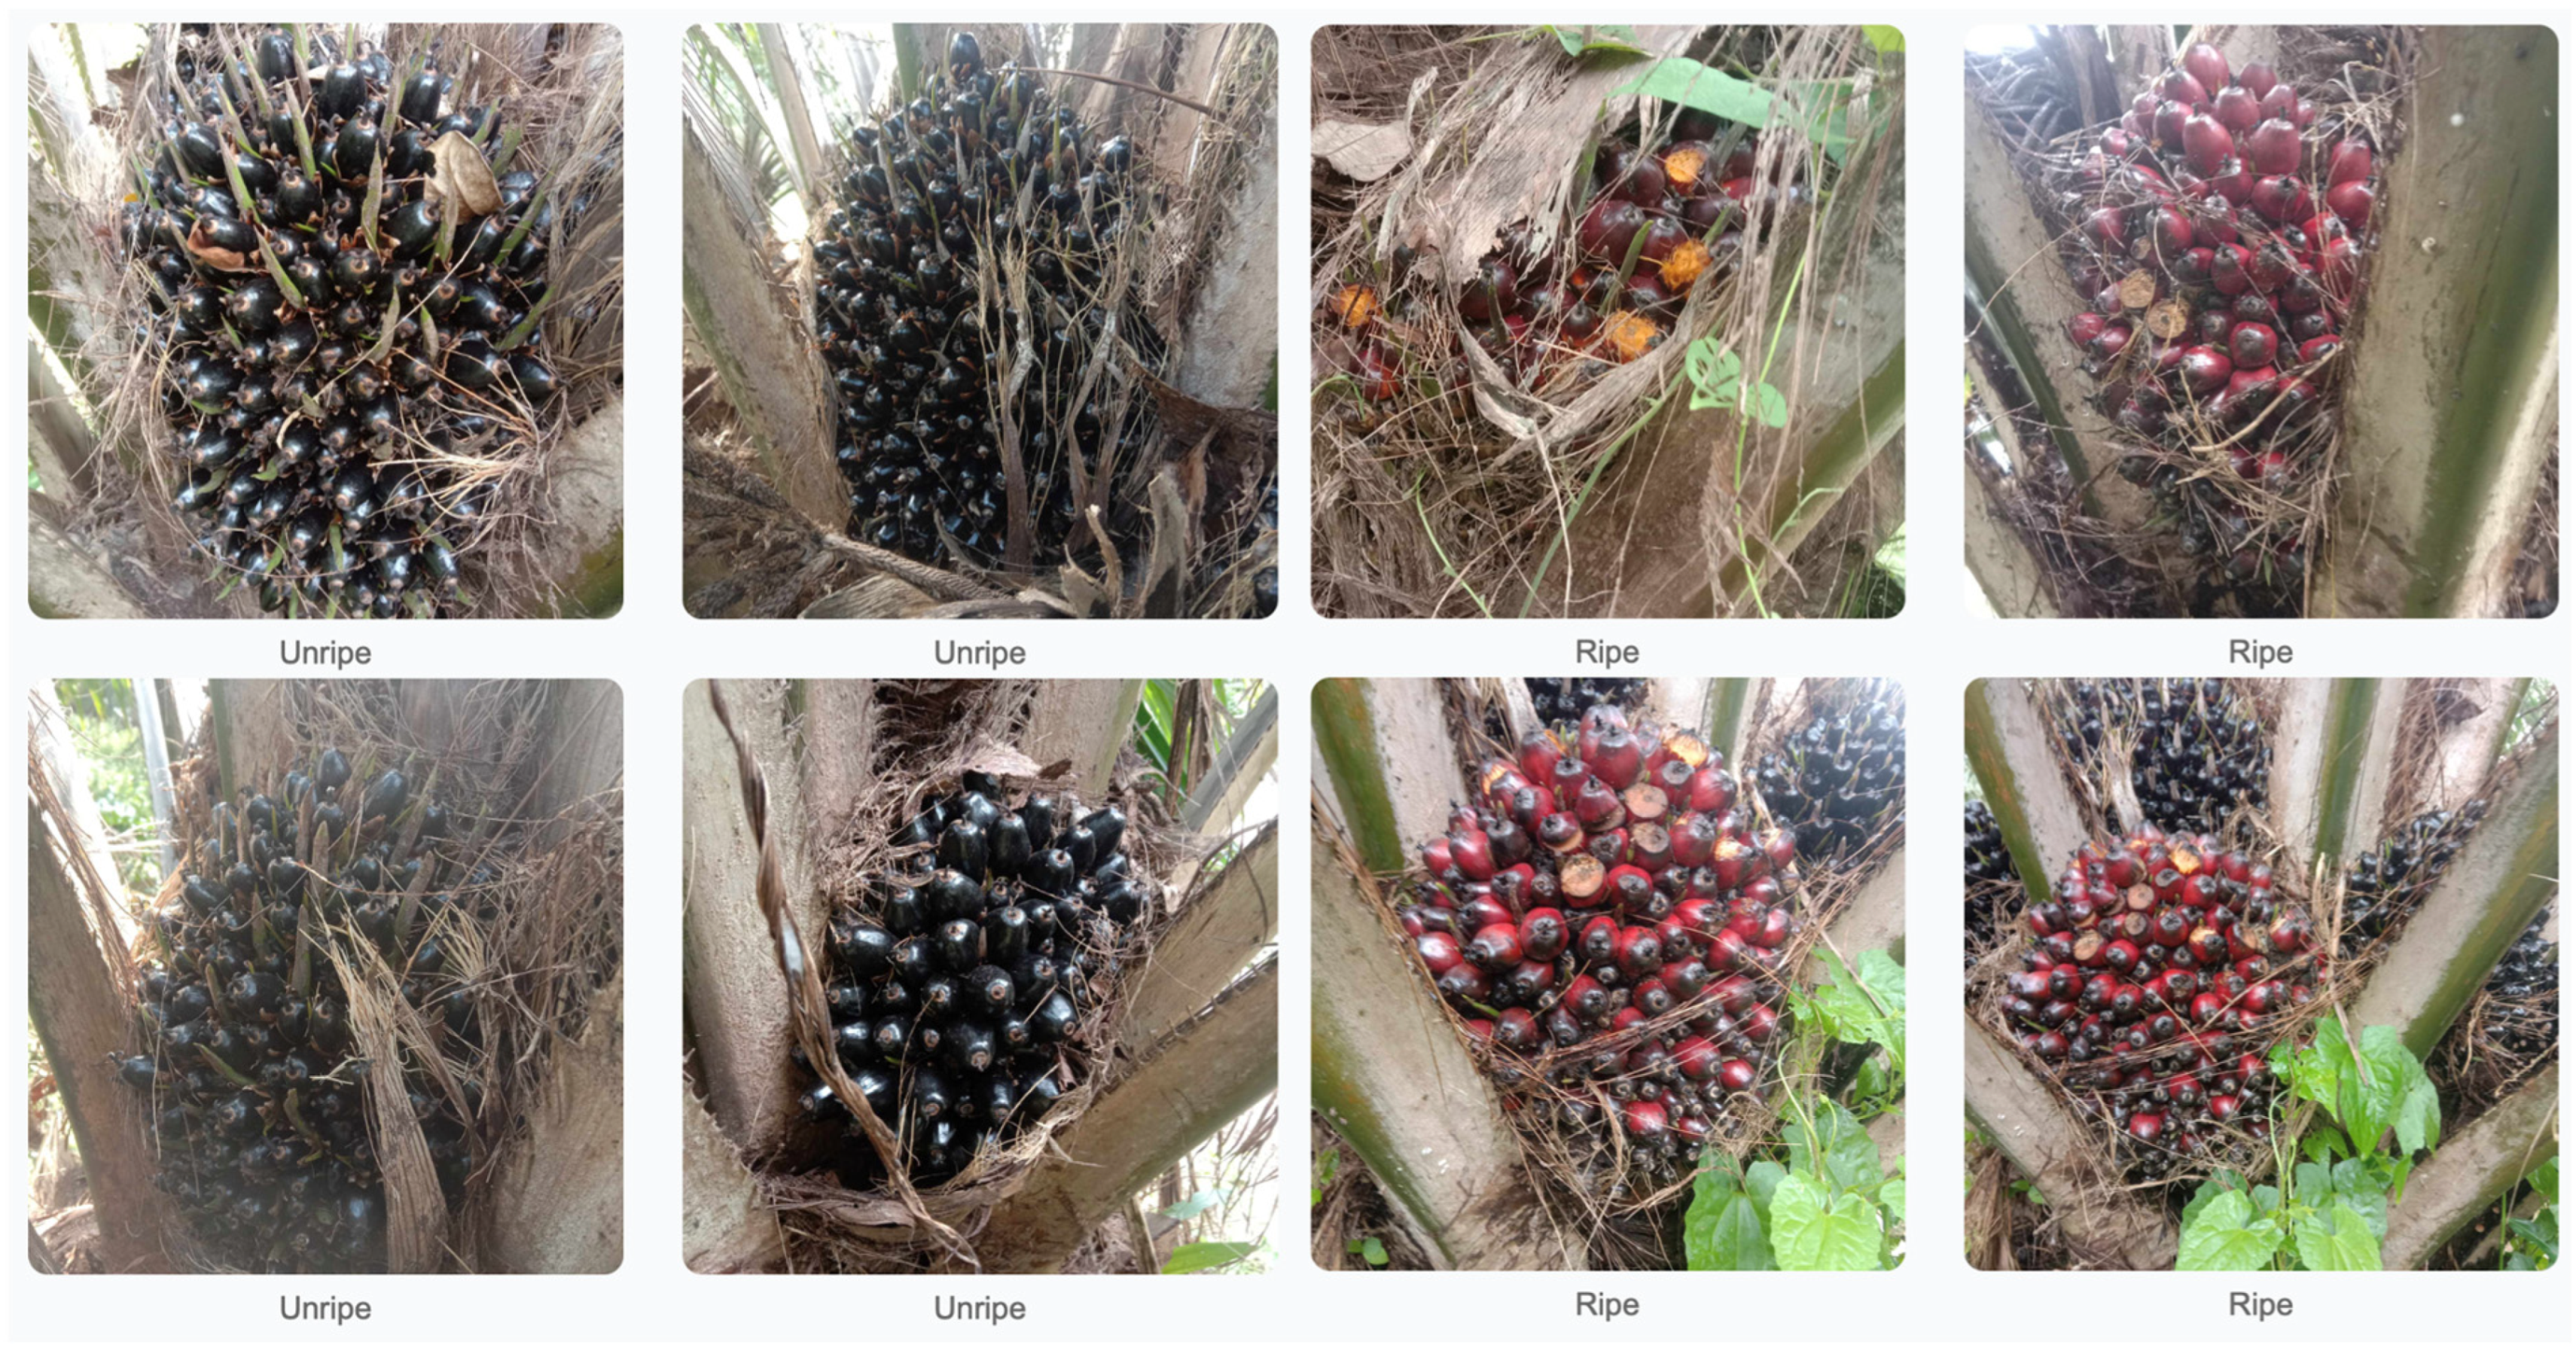
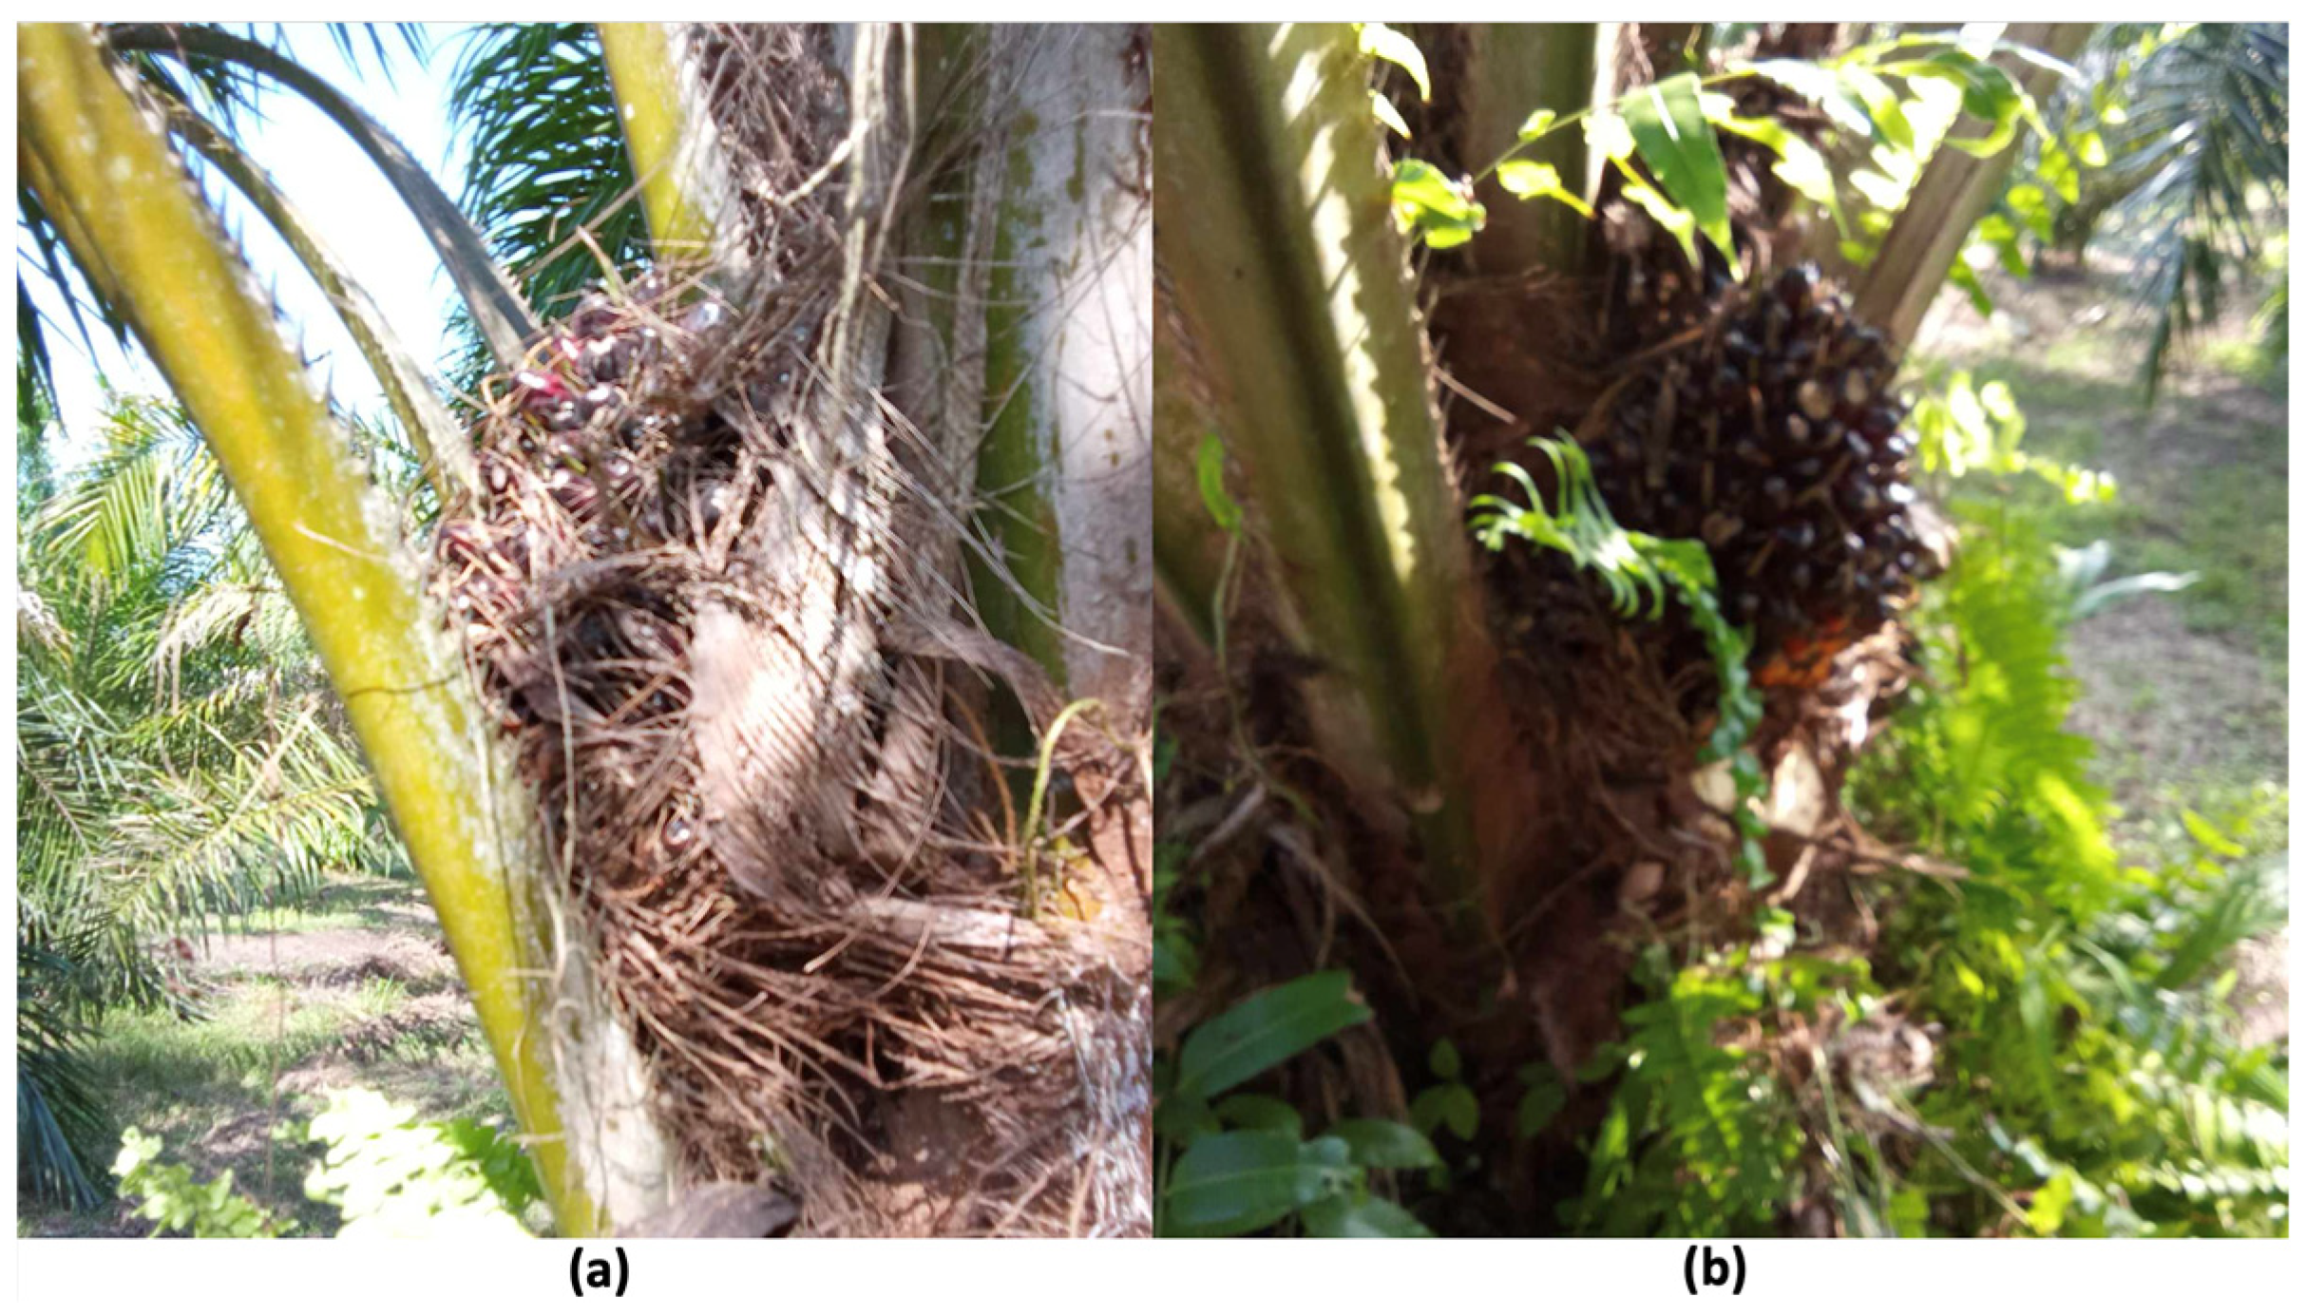
An illustration of oil palm bunch ripeness classification on a tree, with two classes (Ripe and Unripe), is provided in Figure 9, demonstrating visually accurate classification results. Moreover, this research addresses misclassification due to various factors such as lighting conditions during photography, resulting in dark or bright images affecting accuracy, and obscured oil palm fruits by weeds or other objects. Figure 10 displays an example of these errors, highlighting limitations that should be included in the user manual for the platform or application to minimize their impact on user benefits. In Figure 10a, the depicted oil palm bunch appears ripe; however, the classification outcome indicates the Unripe Class. Conversely, in Figure 10b, an unripe oil palm bunch is shown, yet the classification result suggests the Ripe Class.
In this research, we opted to utilize CNN for developing the application to classify the ripeness of oil palm fruits on the tree due to its high accuracy and robust model capabilities. Particularly, MobileNetV1, known for its rapid image processing capabilities, was selected for application development. However, findings from a comparative study of various machine learning algorithms indicate an alternative approach involving the utilization of the RF algorithm alongside image preprocessing through InceptionV3-based image embedding. This approach yields highly accurate classification results comparable to CNN. Hence, the RF model emerges as another viable option for classifying the ripeness of oil palm fruits.

4.2. Platform Implementation Result

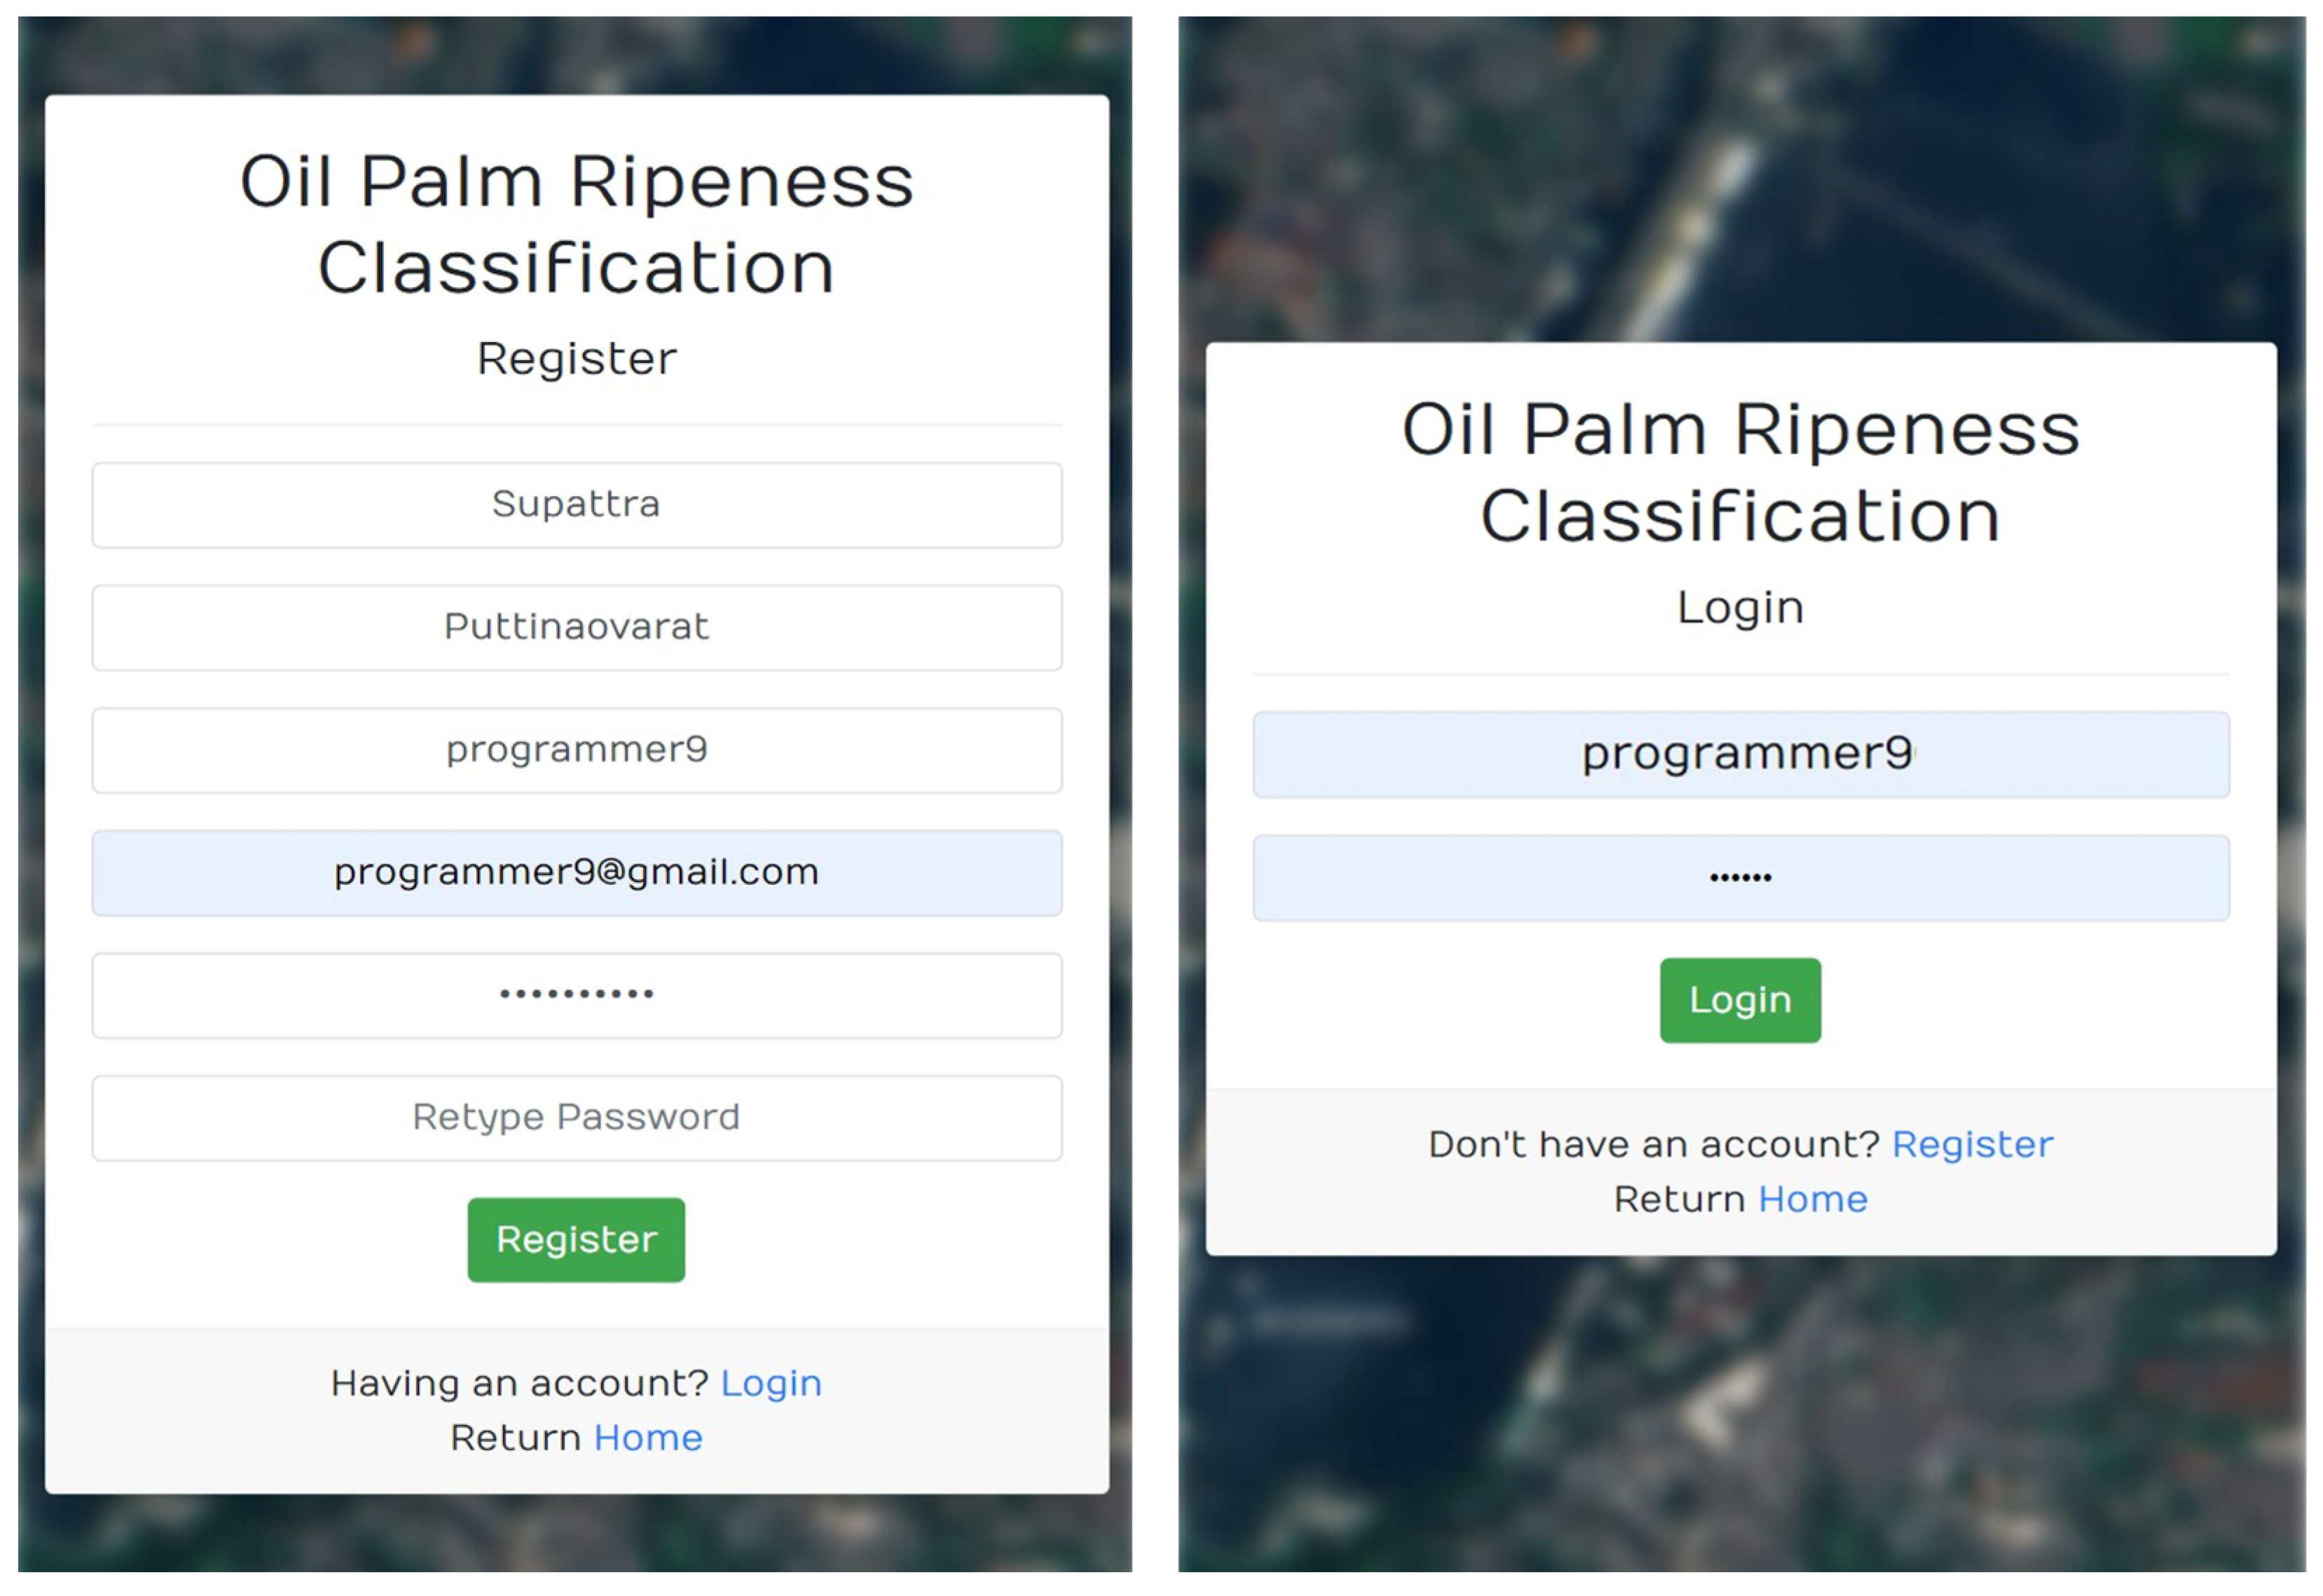
This research unveils the outcomes of creating a platform or application to assess the ripeness of oil palm bunches on trees or those yet to be harvested. The approach integrates geospatial analysis and visualization with deep learning algorithms, particularly CNN (MobileNetV1). The application development outcomes encompass user or farmer registration and identity verification, as depicted in Figure 11. The illustration provides an example of user registration data, including Name, Last Name, Username, E-mail, and Password. In the verification process, the Username and Password establish the connection between the informant or data owner and the information processed and displayed through the application.
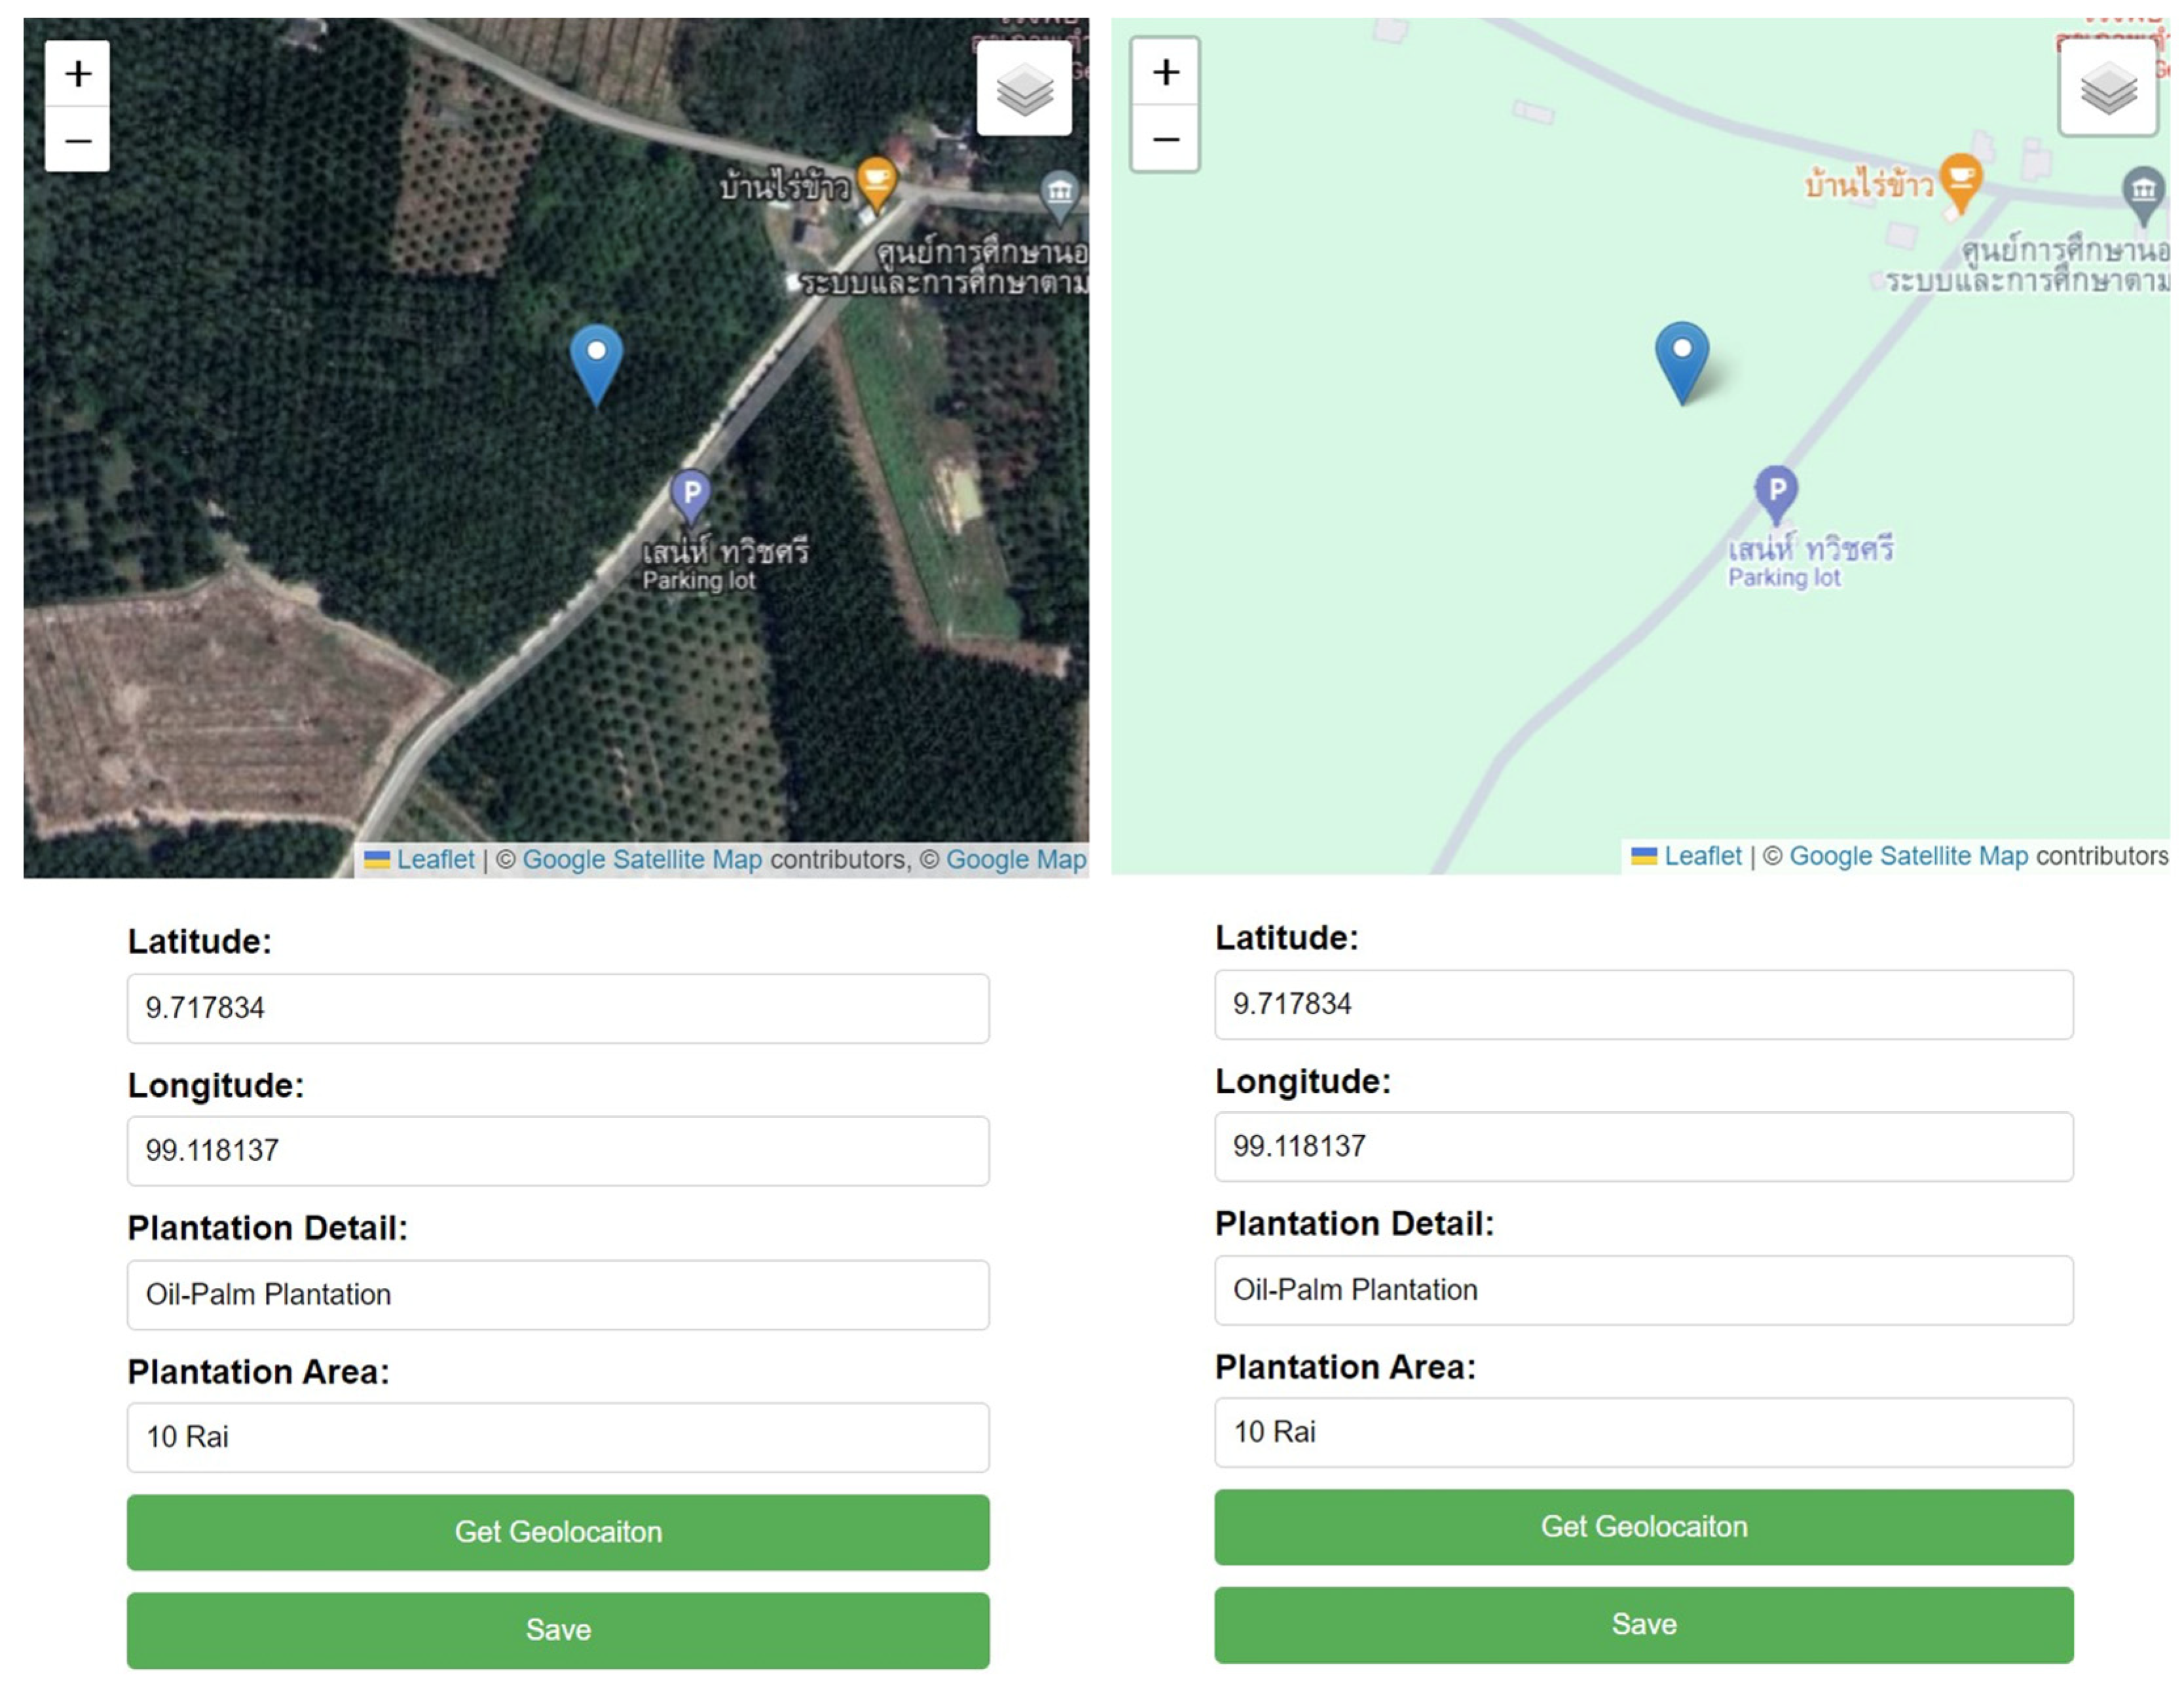
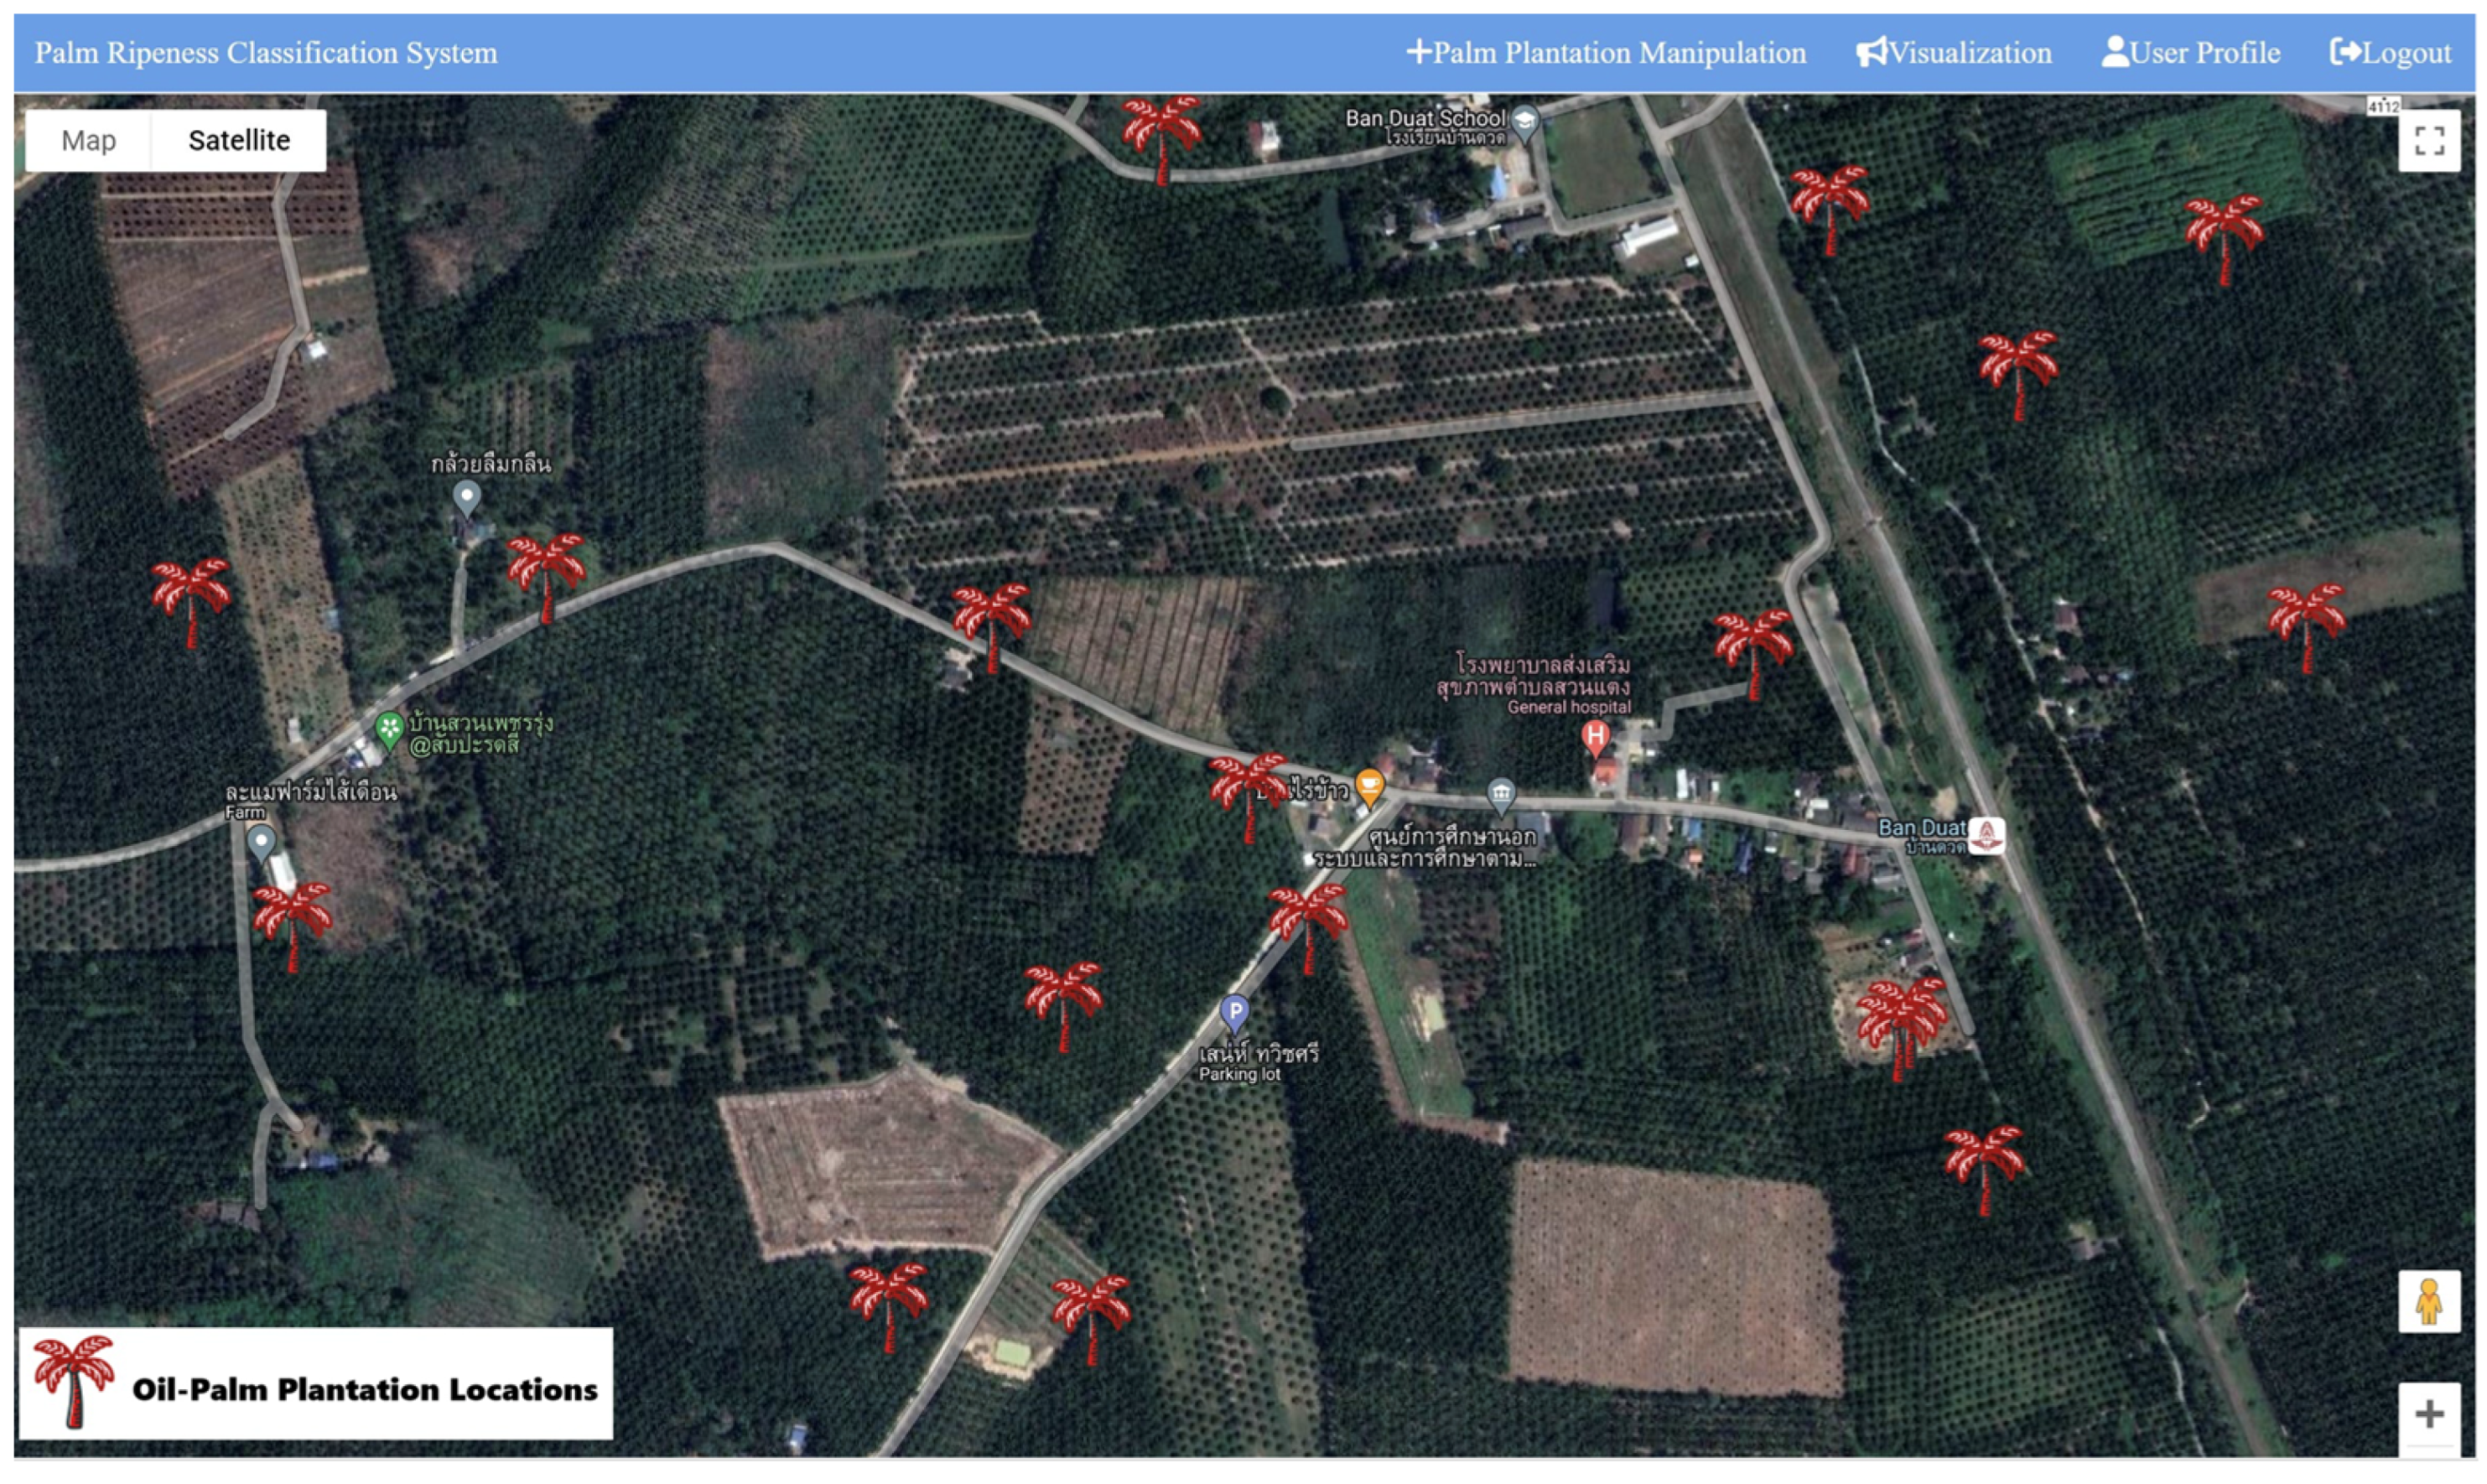
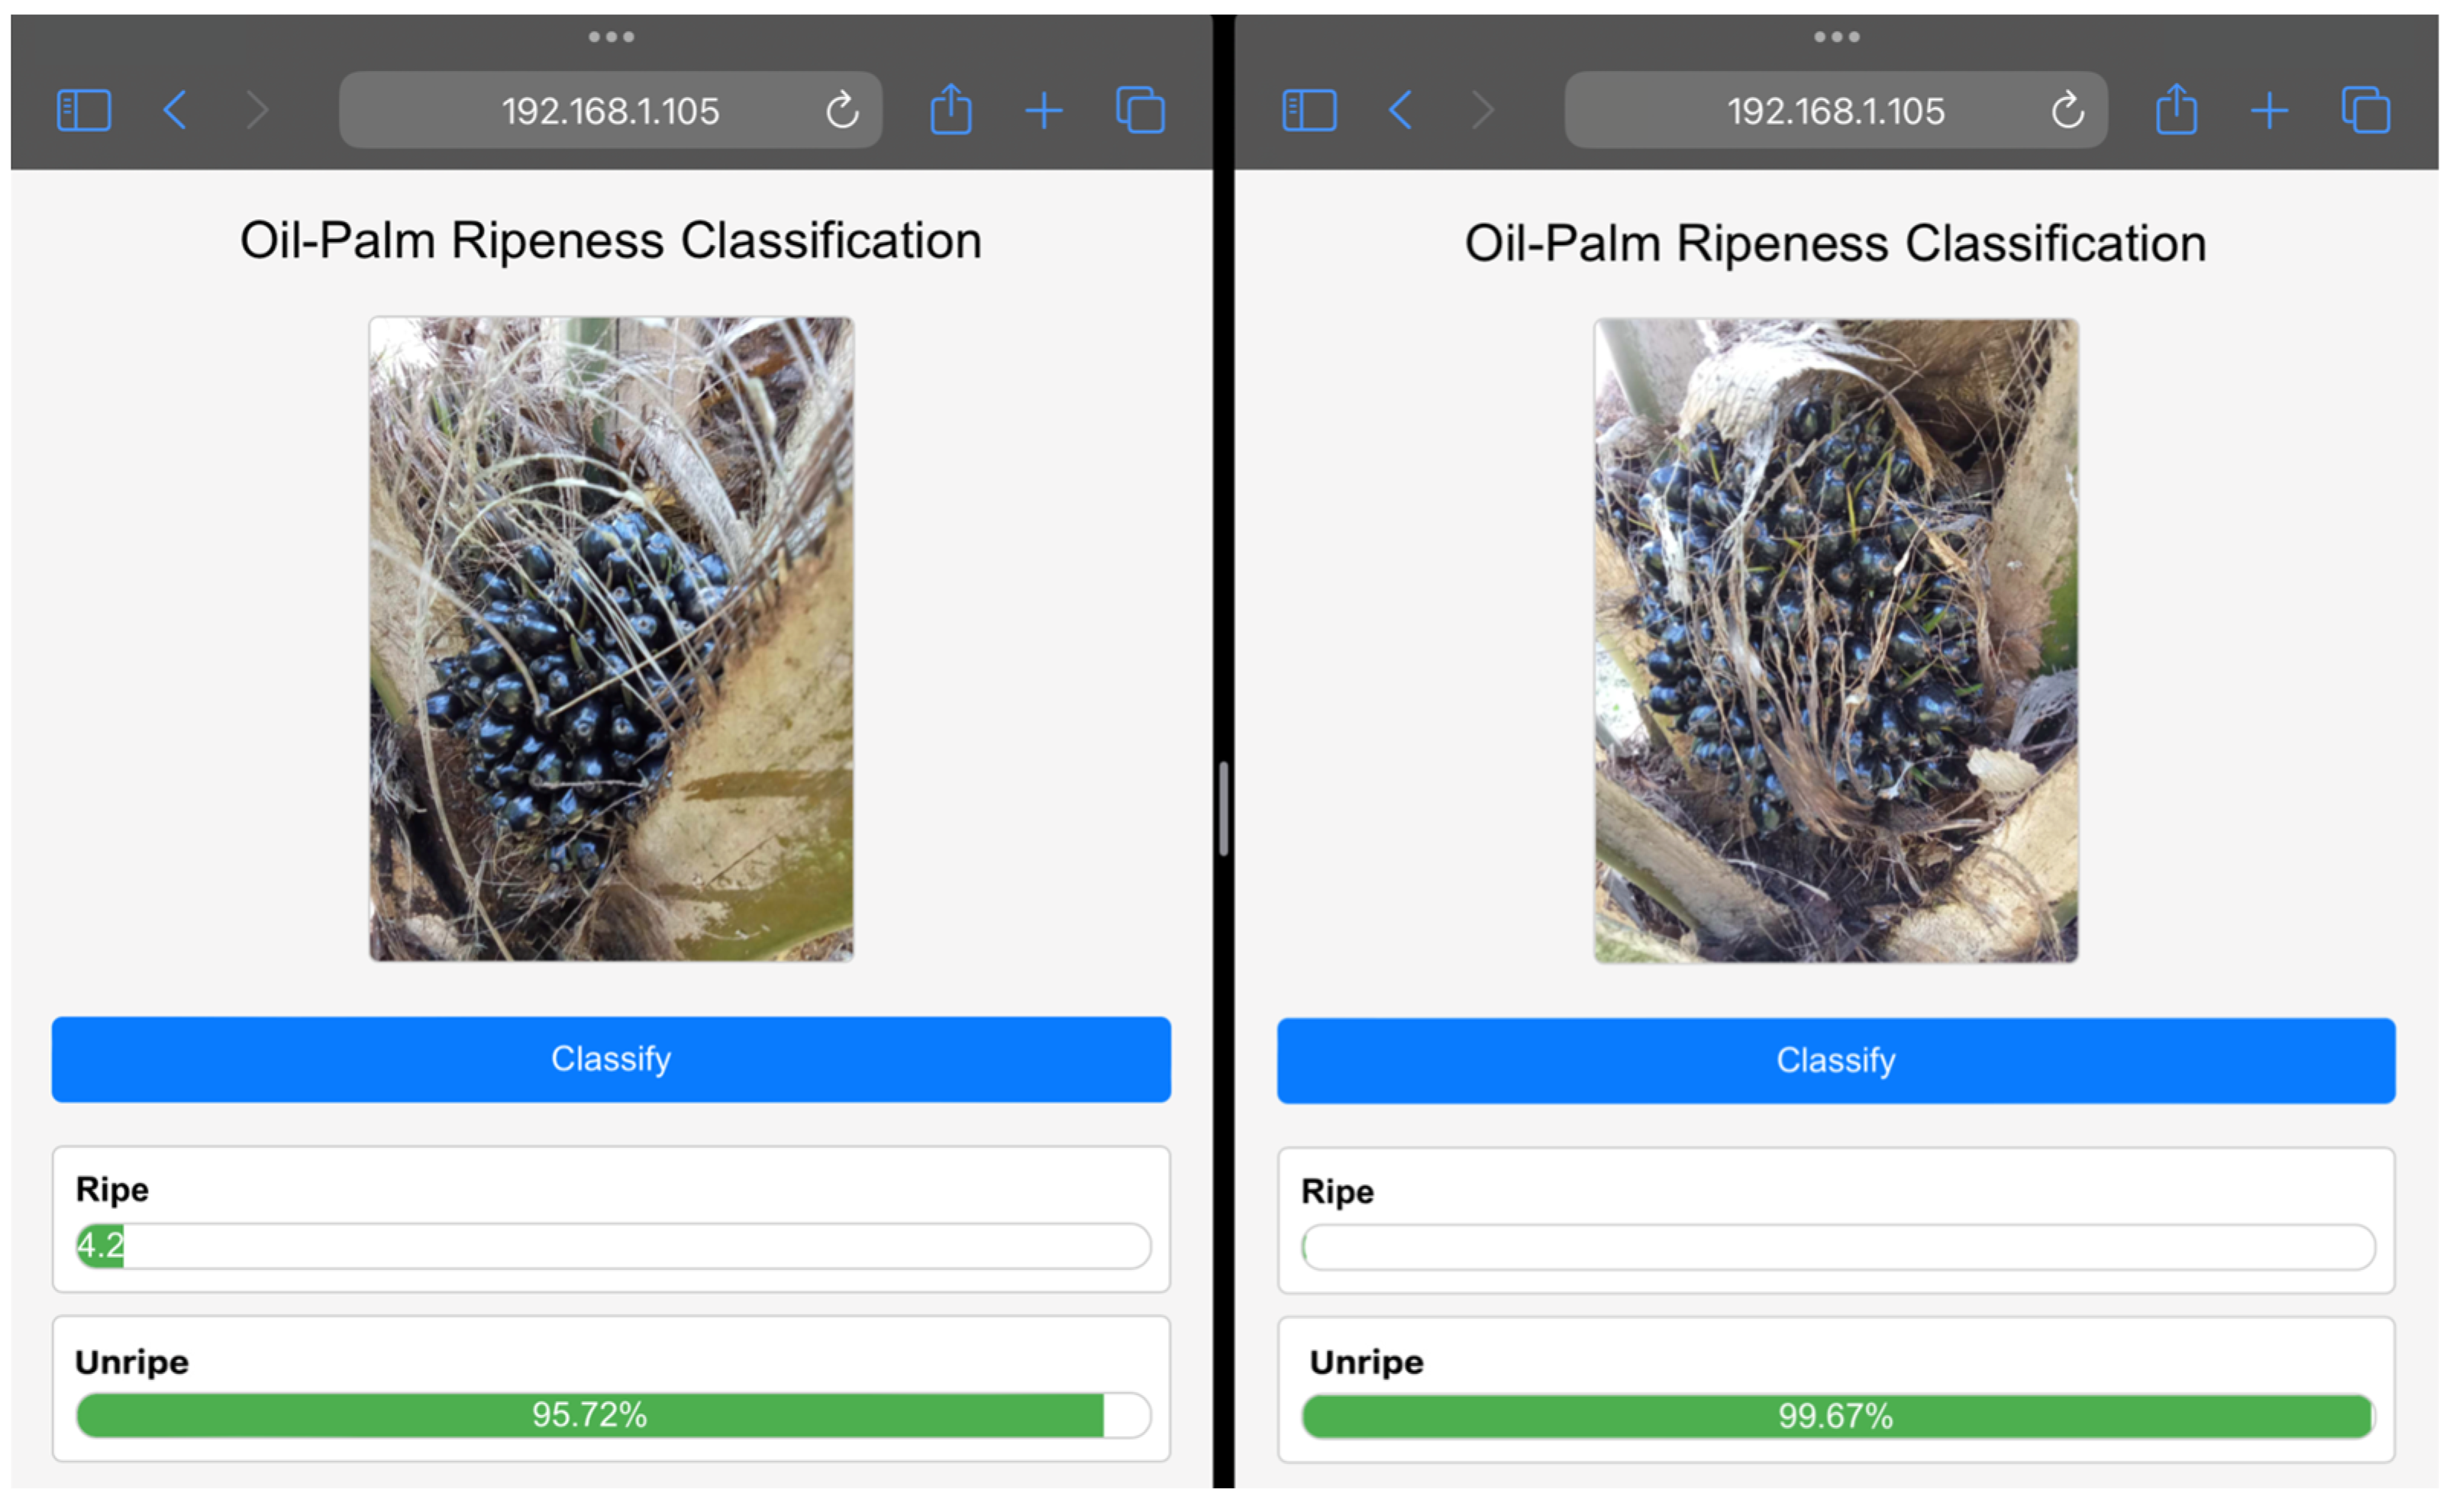
The application development also includes features for data manipulation related to data concerning farmers’ oil palm plantations, as shown in Figure 12. In this section, the farmers’ current location coordinates are extracted from the GPS in the mobile device, recording latitude and longitude when the user presses the Get Geolocation button. Additional details, such as plantation specifics and area, can be filled in by farmers through the provided form. Furthermore, farmers can review the location of oil palm planting plots from the marker displayed on the map or satellite map before recording the data to ensure the accuracy of the oil palm plantation location. When farmers input information about the locations of oil palm plantations within the application, the provided details are stored in a database and presented in the form of a satellite map, illustrated in Figure 13. A red oil palm tree marker signifies the location of oil palm plantation plots reported by farmers. This feature not only provides information on the location of oil palm plantations for the farmers’ reference but also enables farmers to capture images of oil palm bunches on trees for ripeness classification and record-keeping. In this segment, when a farmer takes a photo using the application, the image undergoes processing by running a model to assess the ripeness of the oil palm bunches in the image and display the classification results. Figure 14 and Figure 15 depict examples of the classification outcomes through the application, showcasing the Ripe class and Unripe class. Figure 14 displays the results of classifying images of ripe oil palm bunches, including cases with multiple oil palm bunches in the picture and only one bunch in the frame. The results demonstrate the application’s accurate recognition of ripe oil palm bunches. On the other hand, Figure 15 portrays the outcomes of classifying unripe oil palm bunches on the tree, highlighting the application’s correct classification ability.
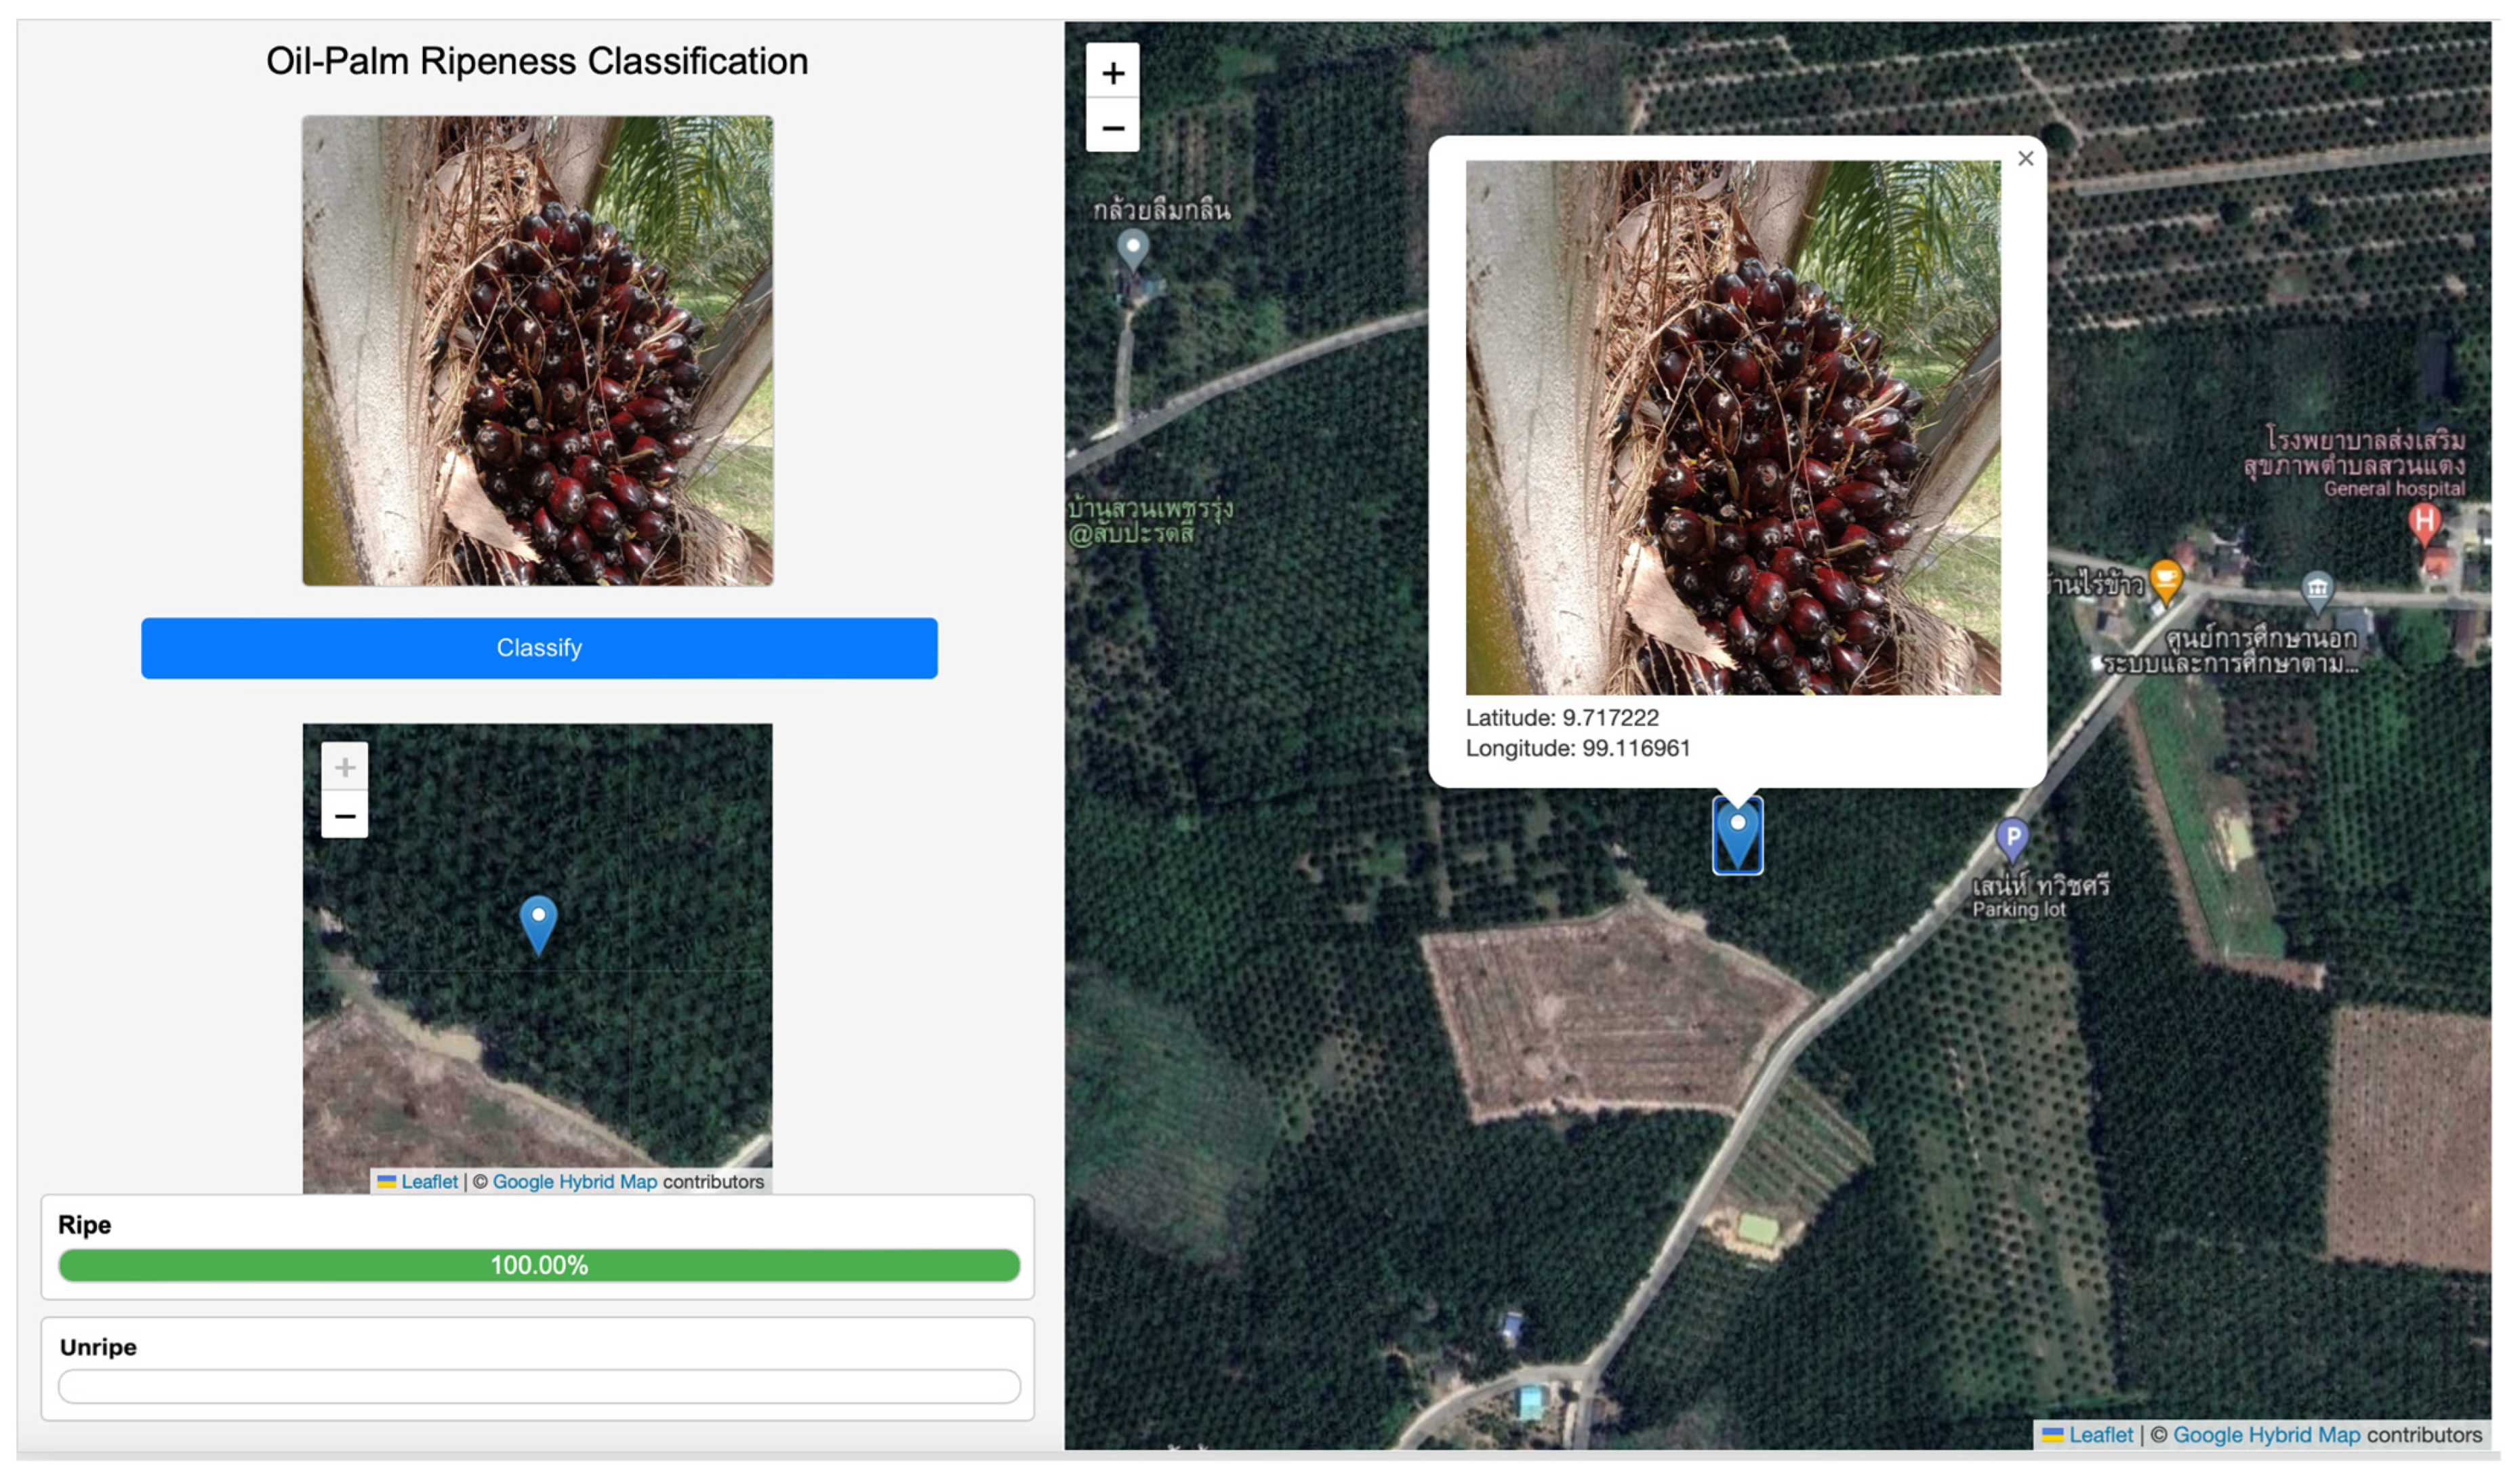
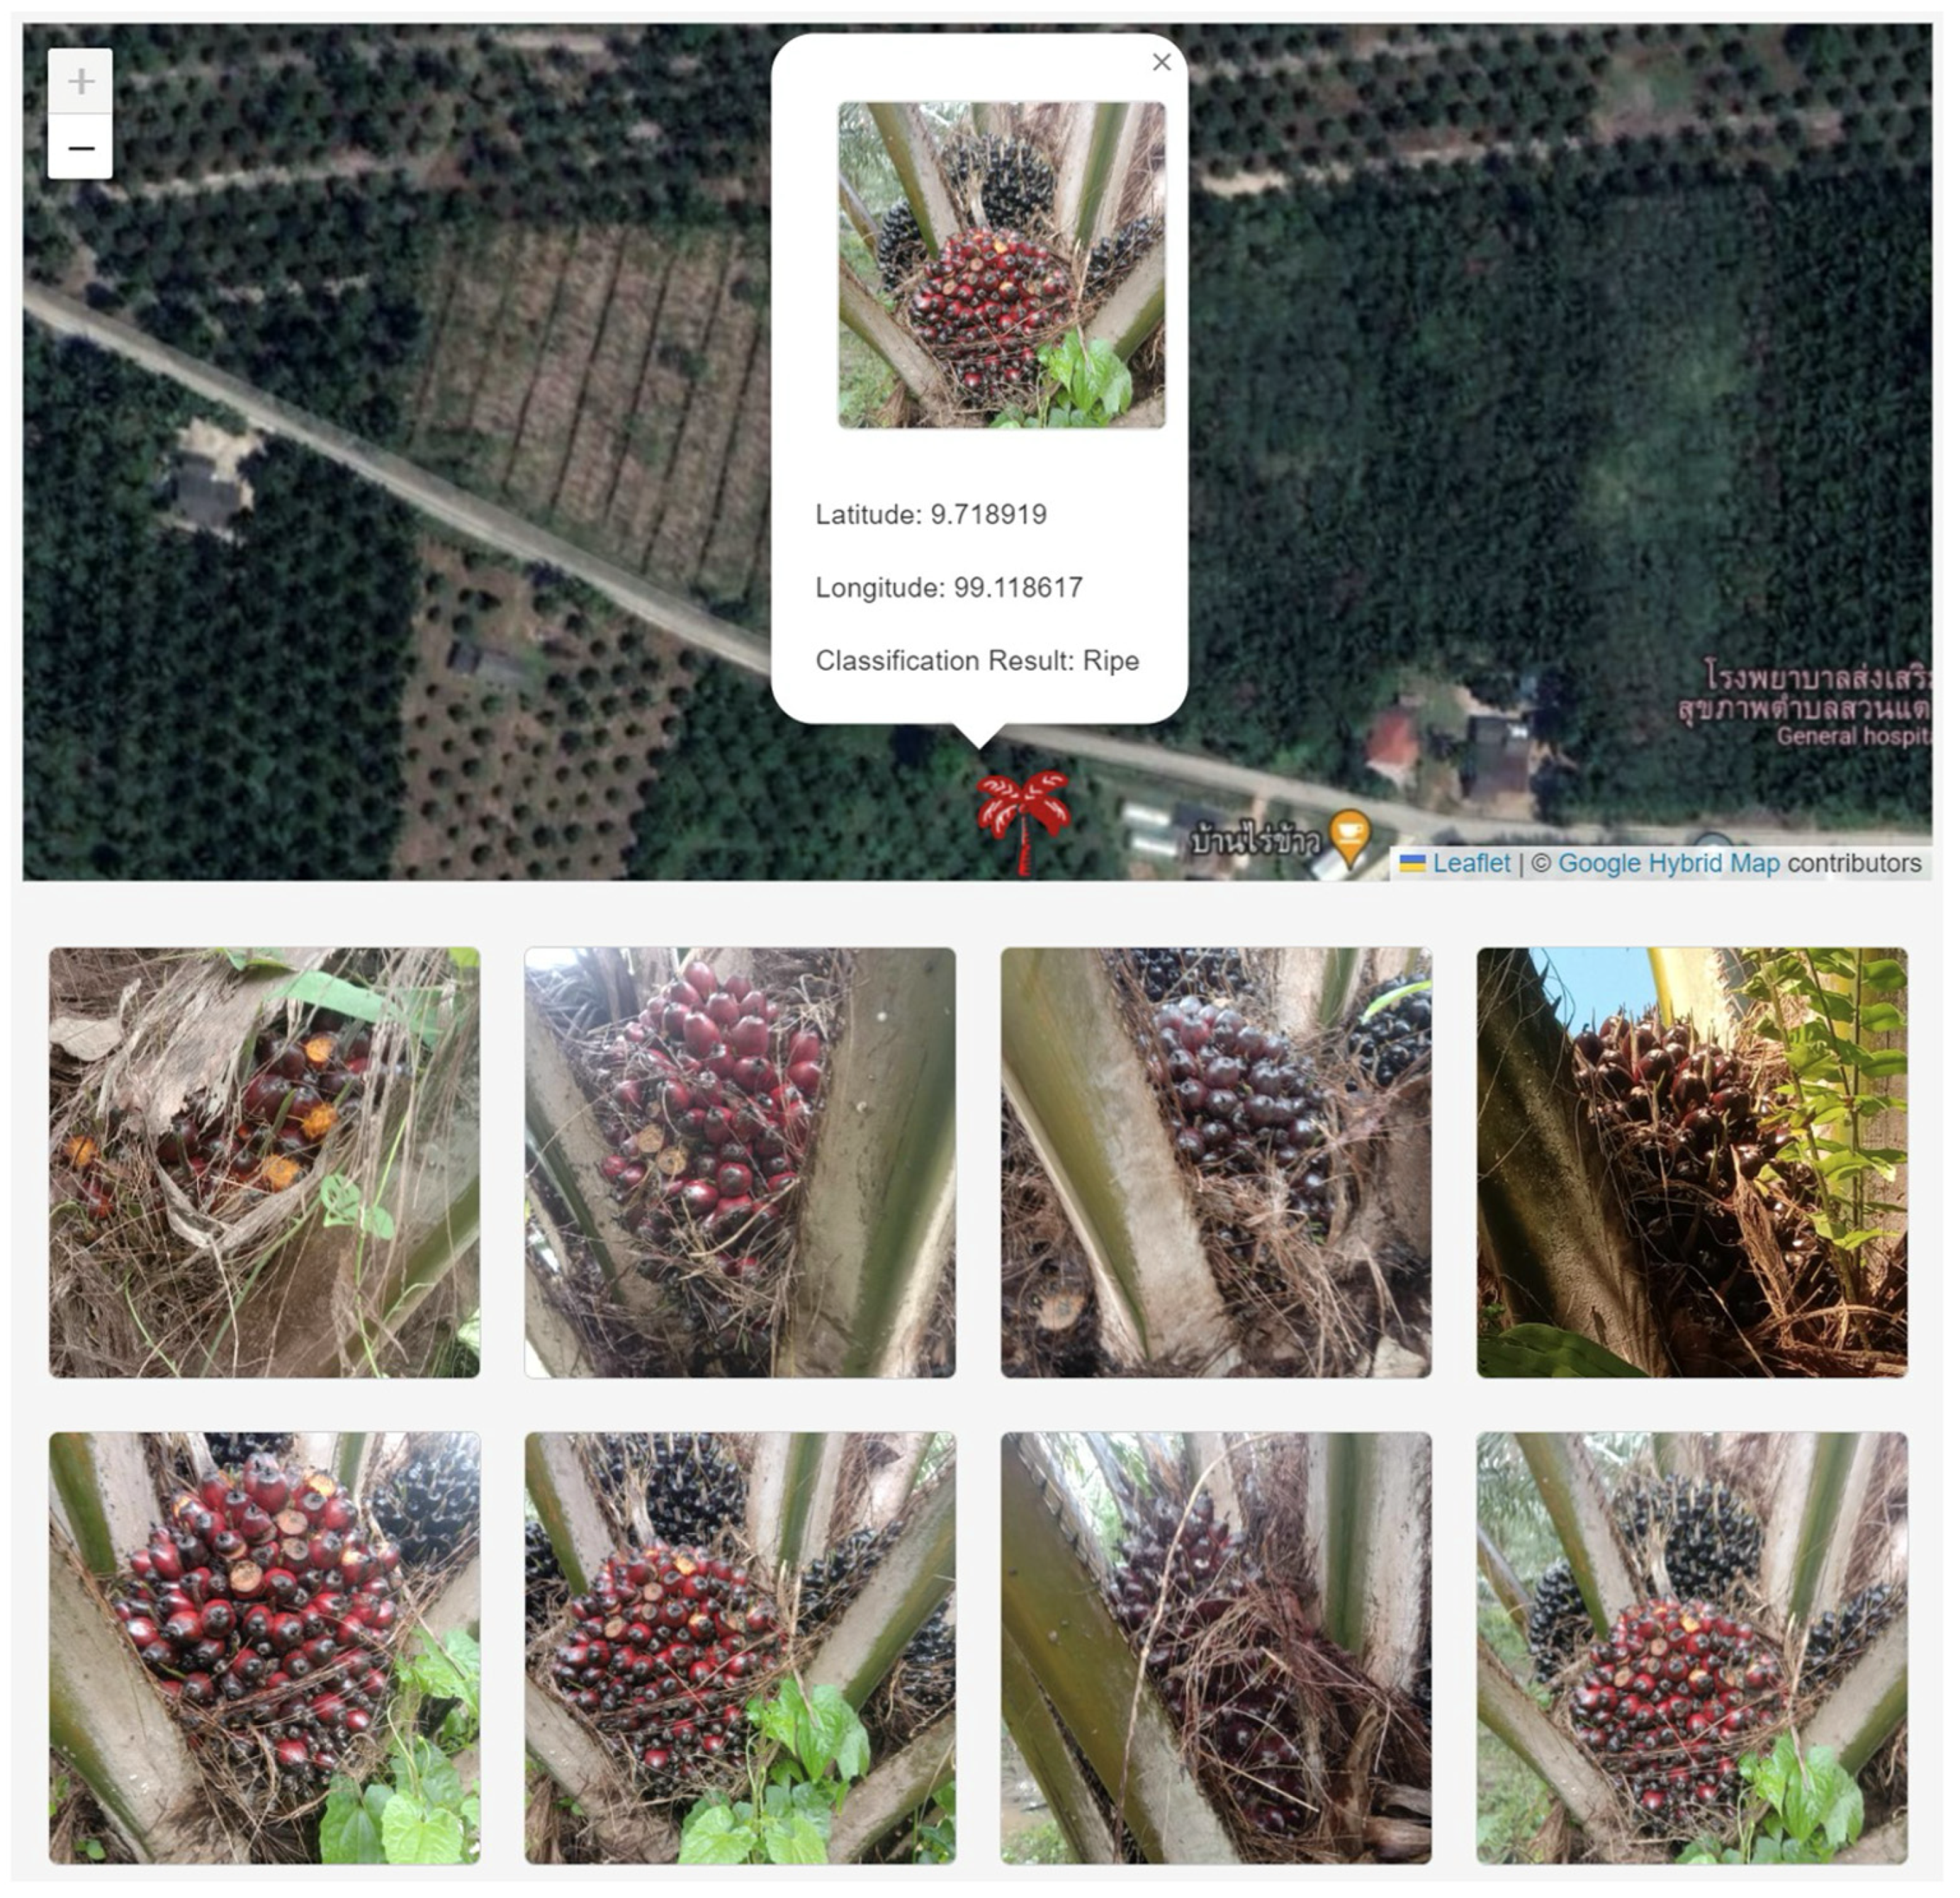
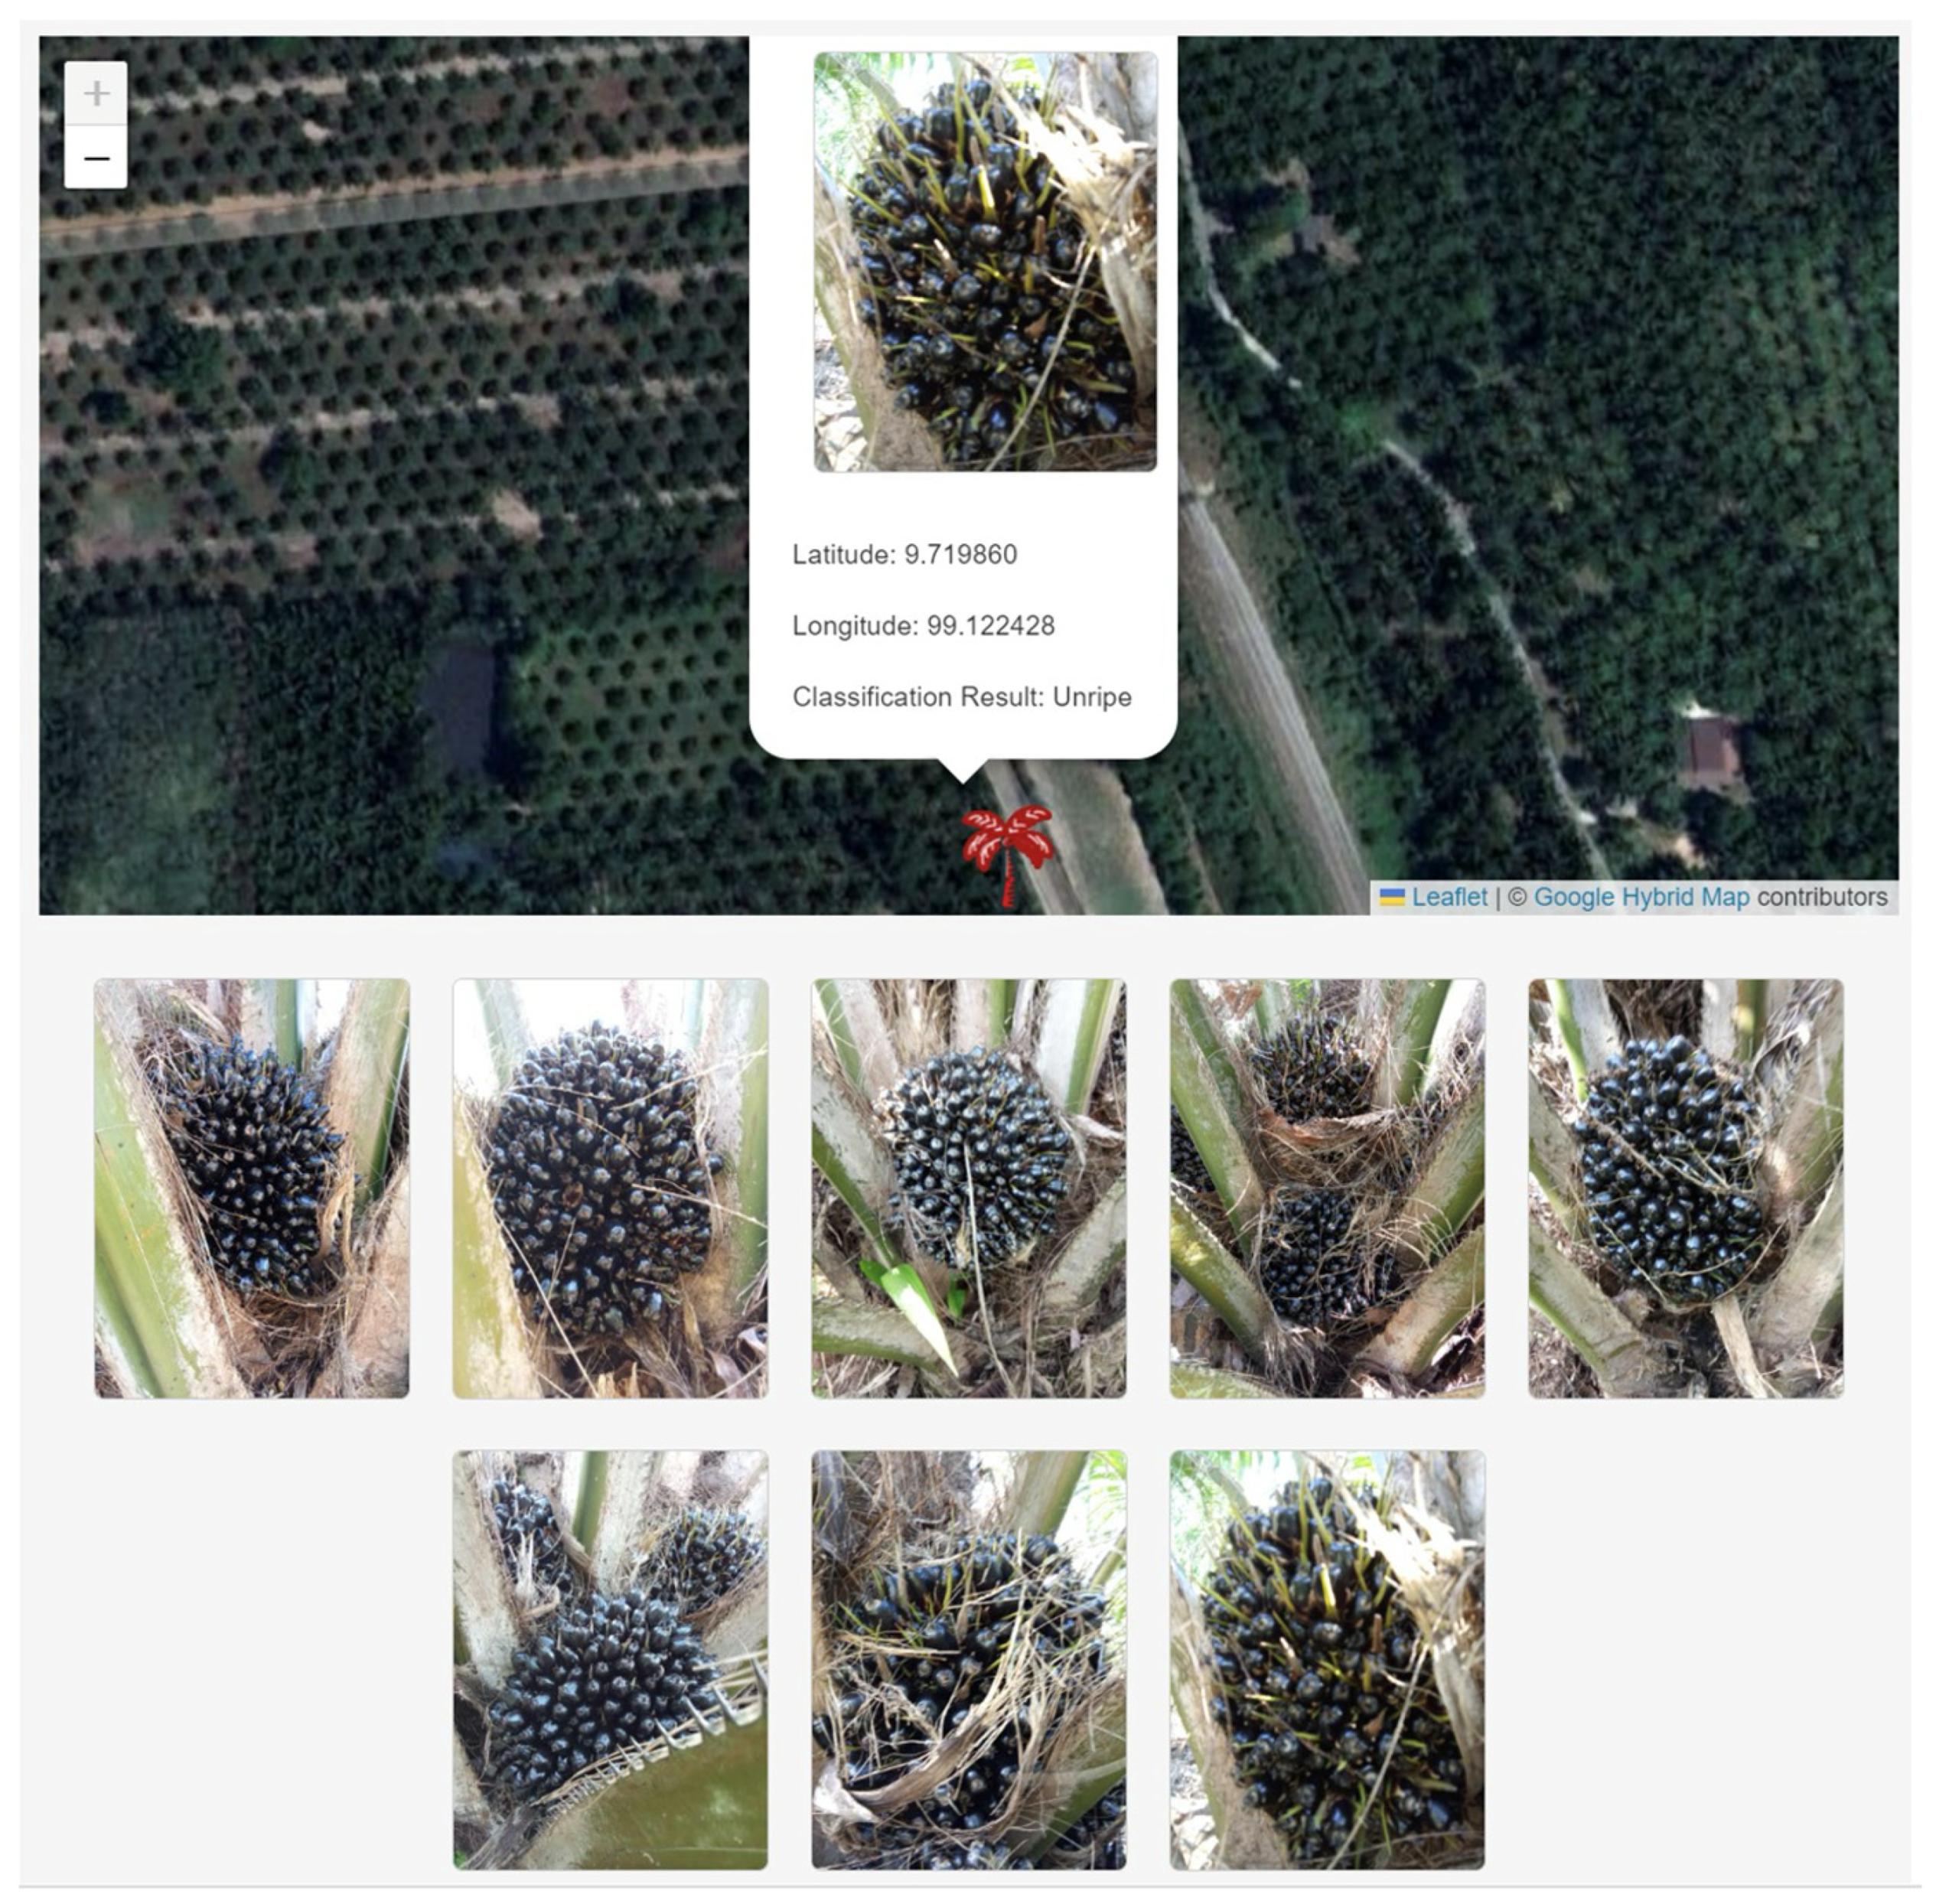
When capturing images and classifying the ripeness of oil palm bunches, the application facilitates the extraction of latitude and longitude coordinates from the image using Geotagging, as illustrated in Figure 16, Figure 17 and Figure 18. Figure 16 demonstrates the process of extracting latitude and longitude coordinates, which are then displayed via a marker on the satellite map, accompanied by an image of oil palm bunches upon clicking the marker. Figure 17 and Figure 18 exhibit the results of ripeness classification of oil palm bunches along with corresponding images from oil palm plantations. Figure 17 displays the classification outcomes for ripe oil palm bunches, while Figure 18 showcases the results for unripe bunches. These figures underscore the application’s capacity to accurately classify the ripeness of oil palm bunches, along with providing information on the photo’s coordinates, enabling verification of the association between the oil palm bunch photo and specific plantations.
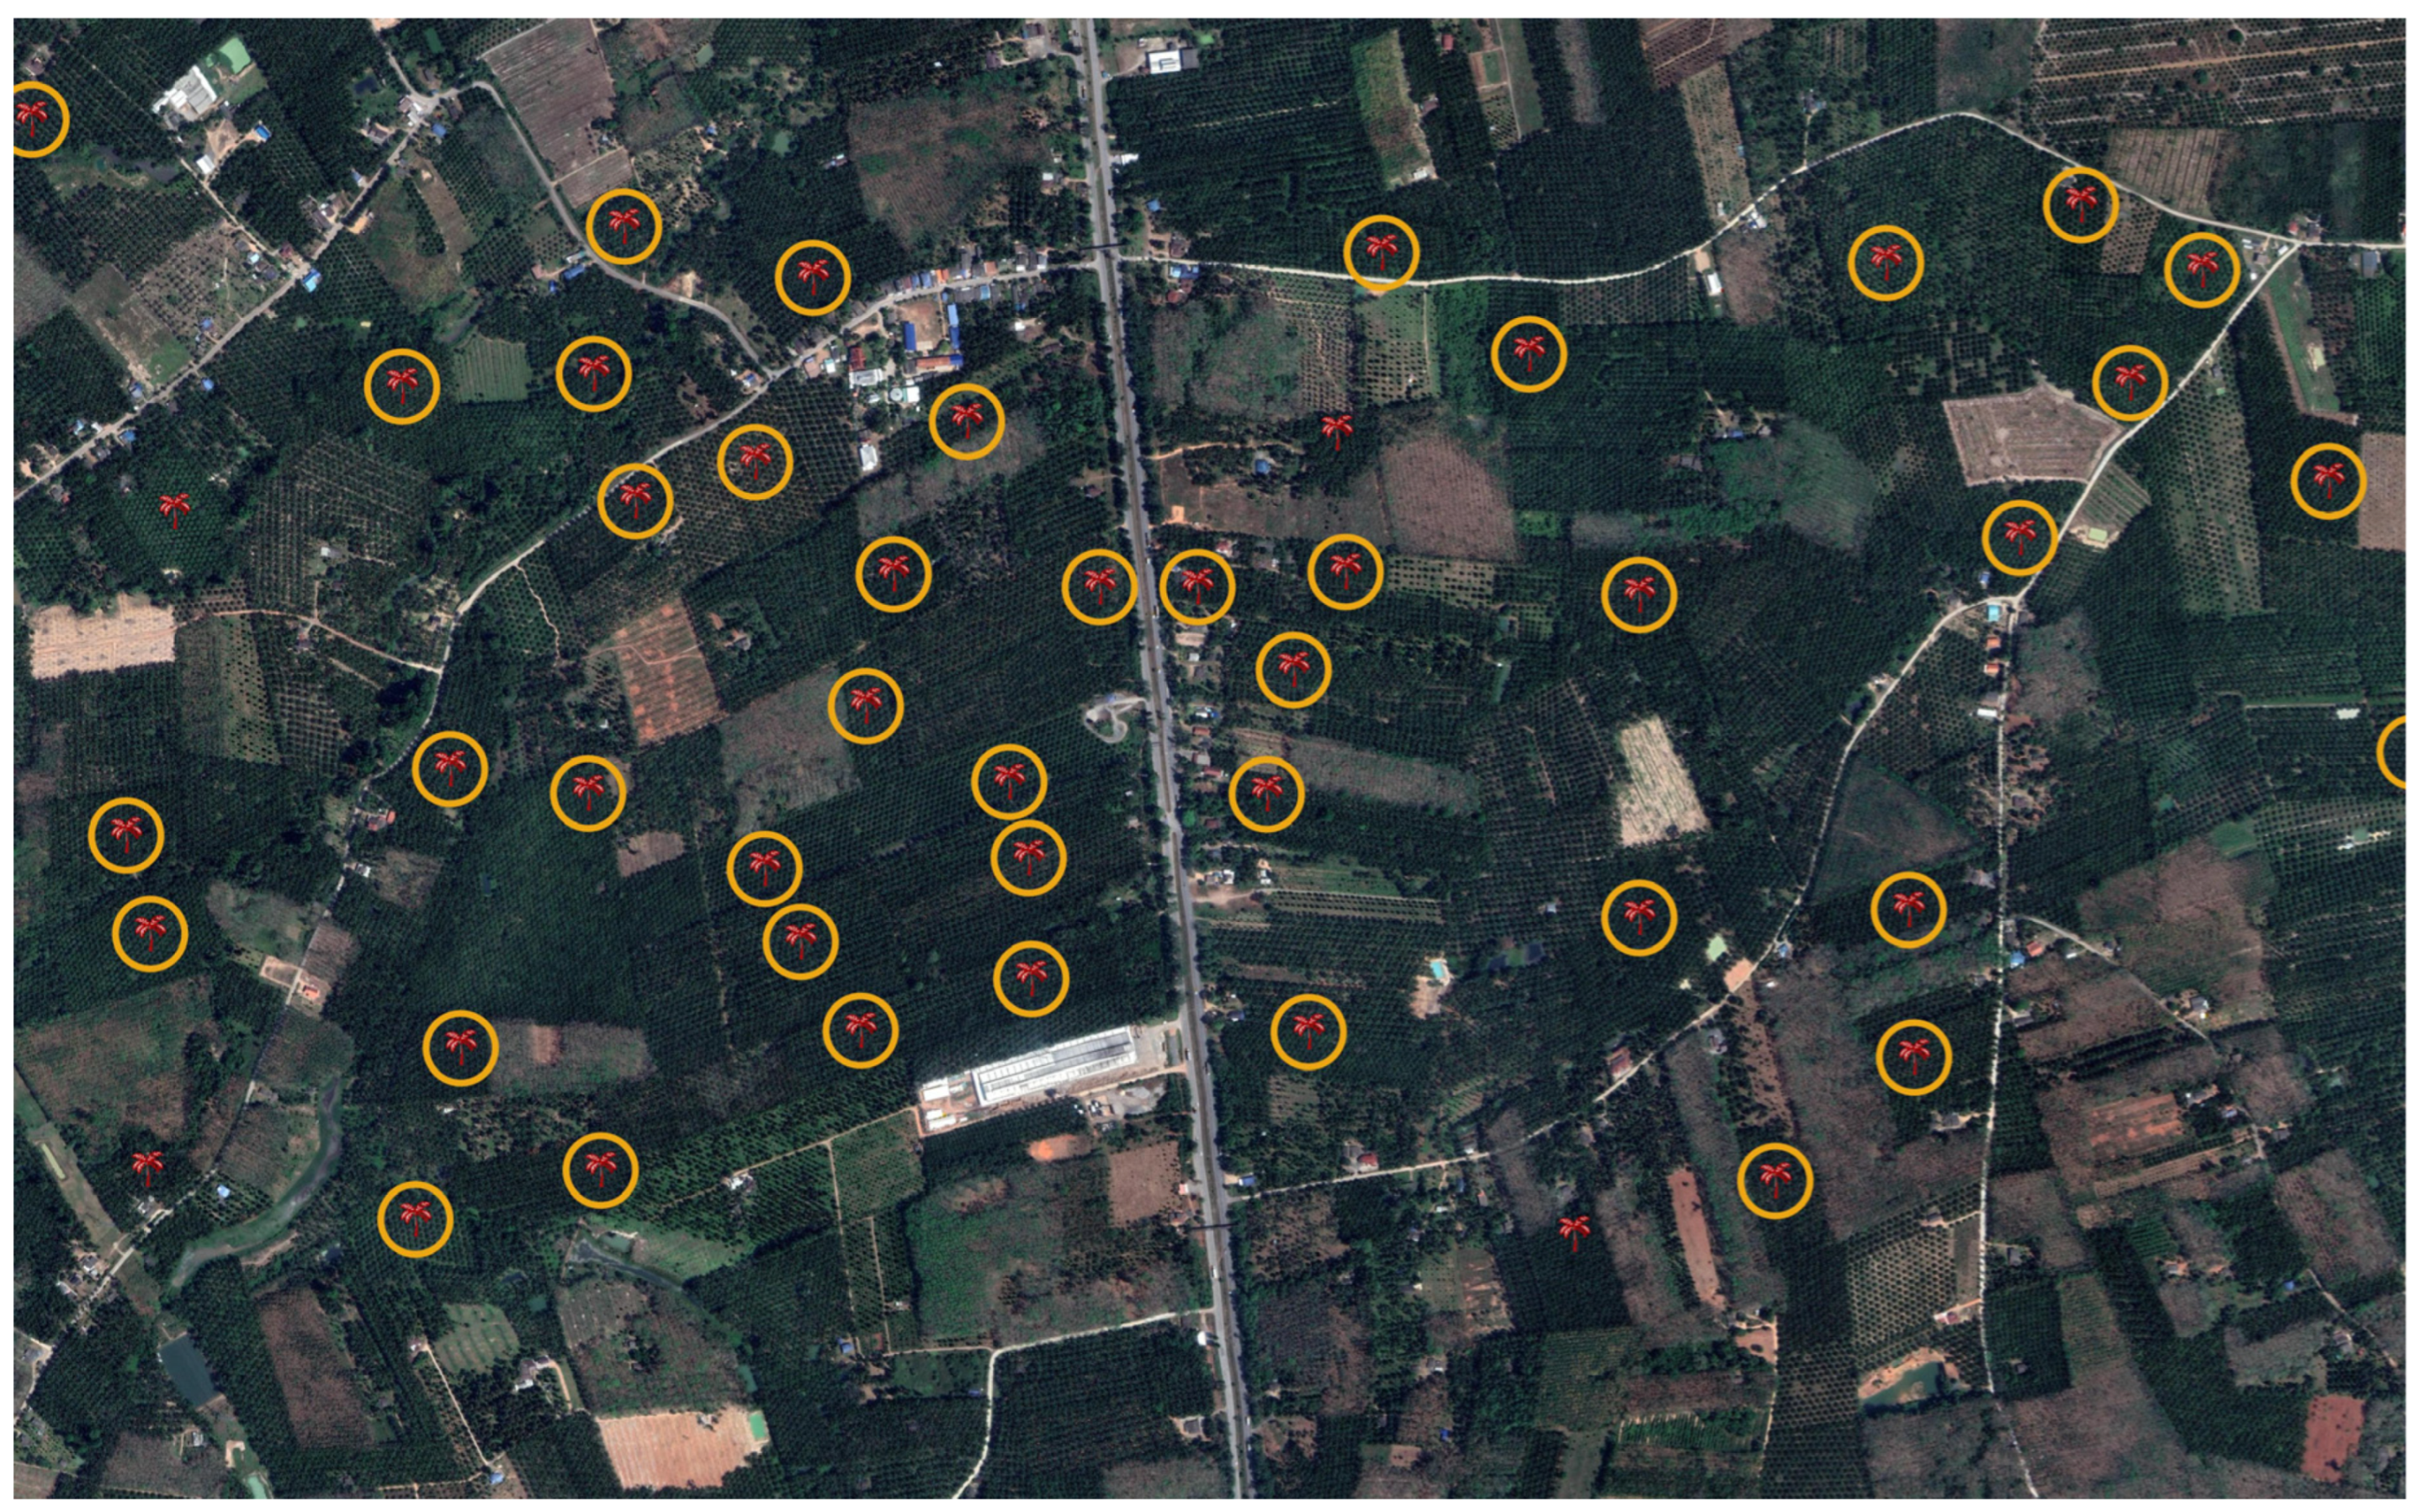
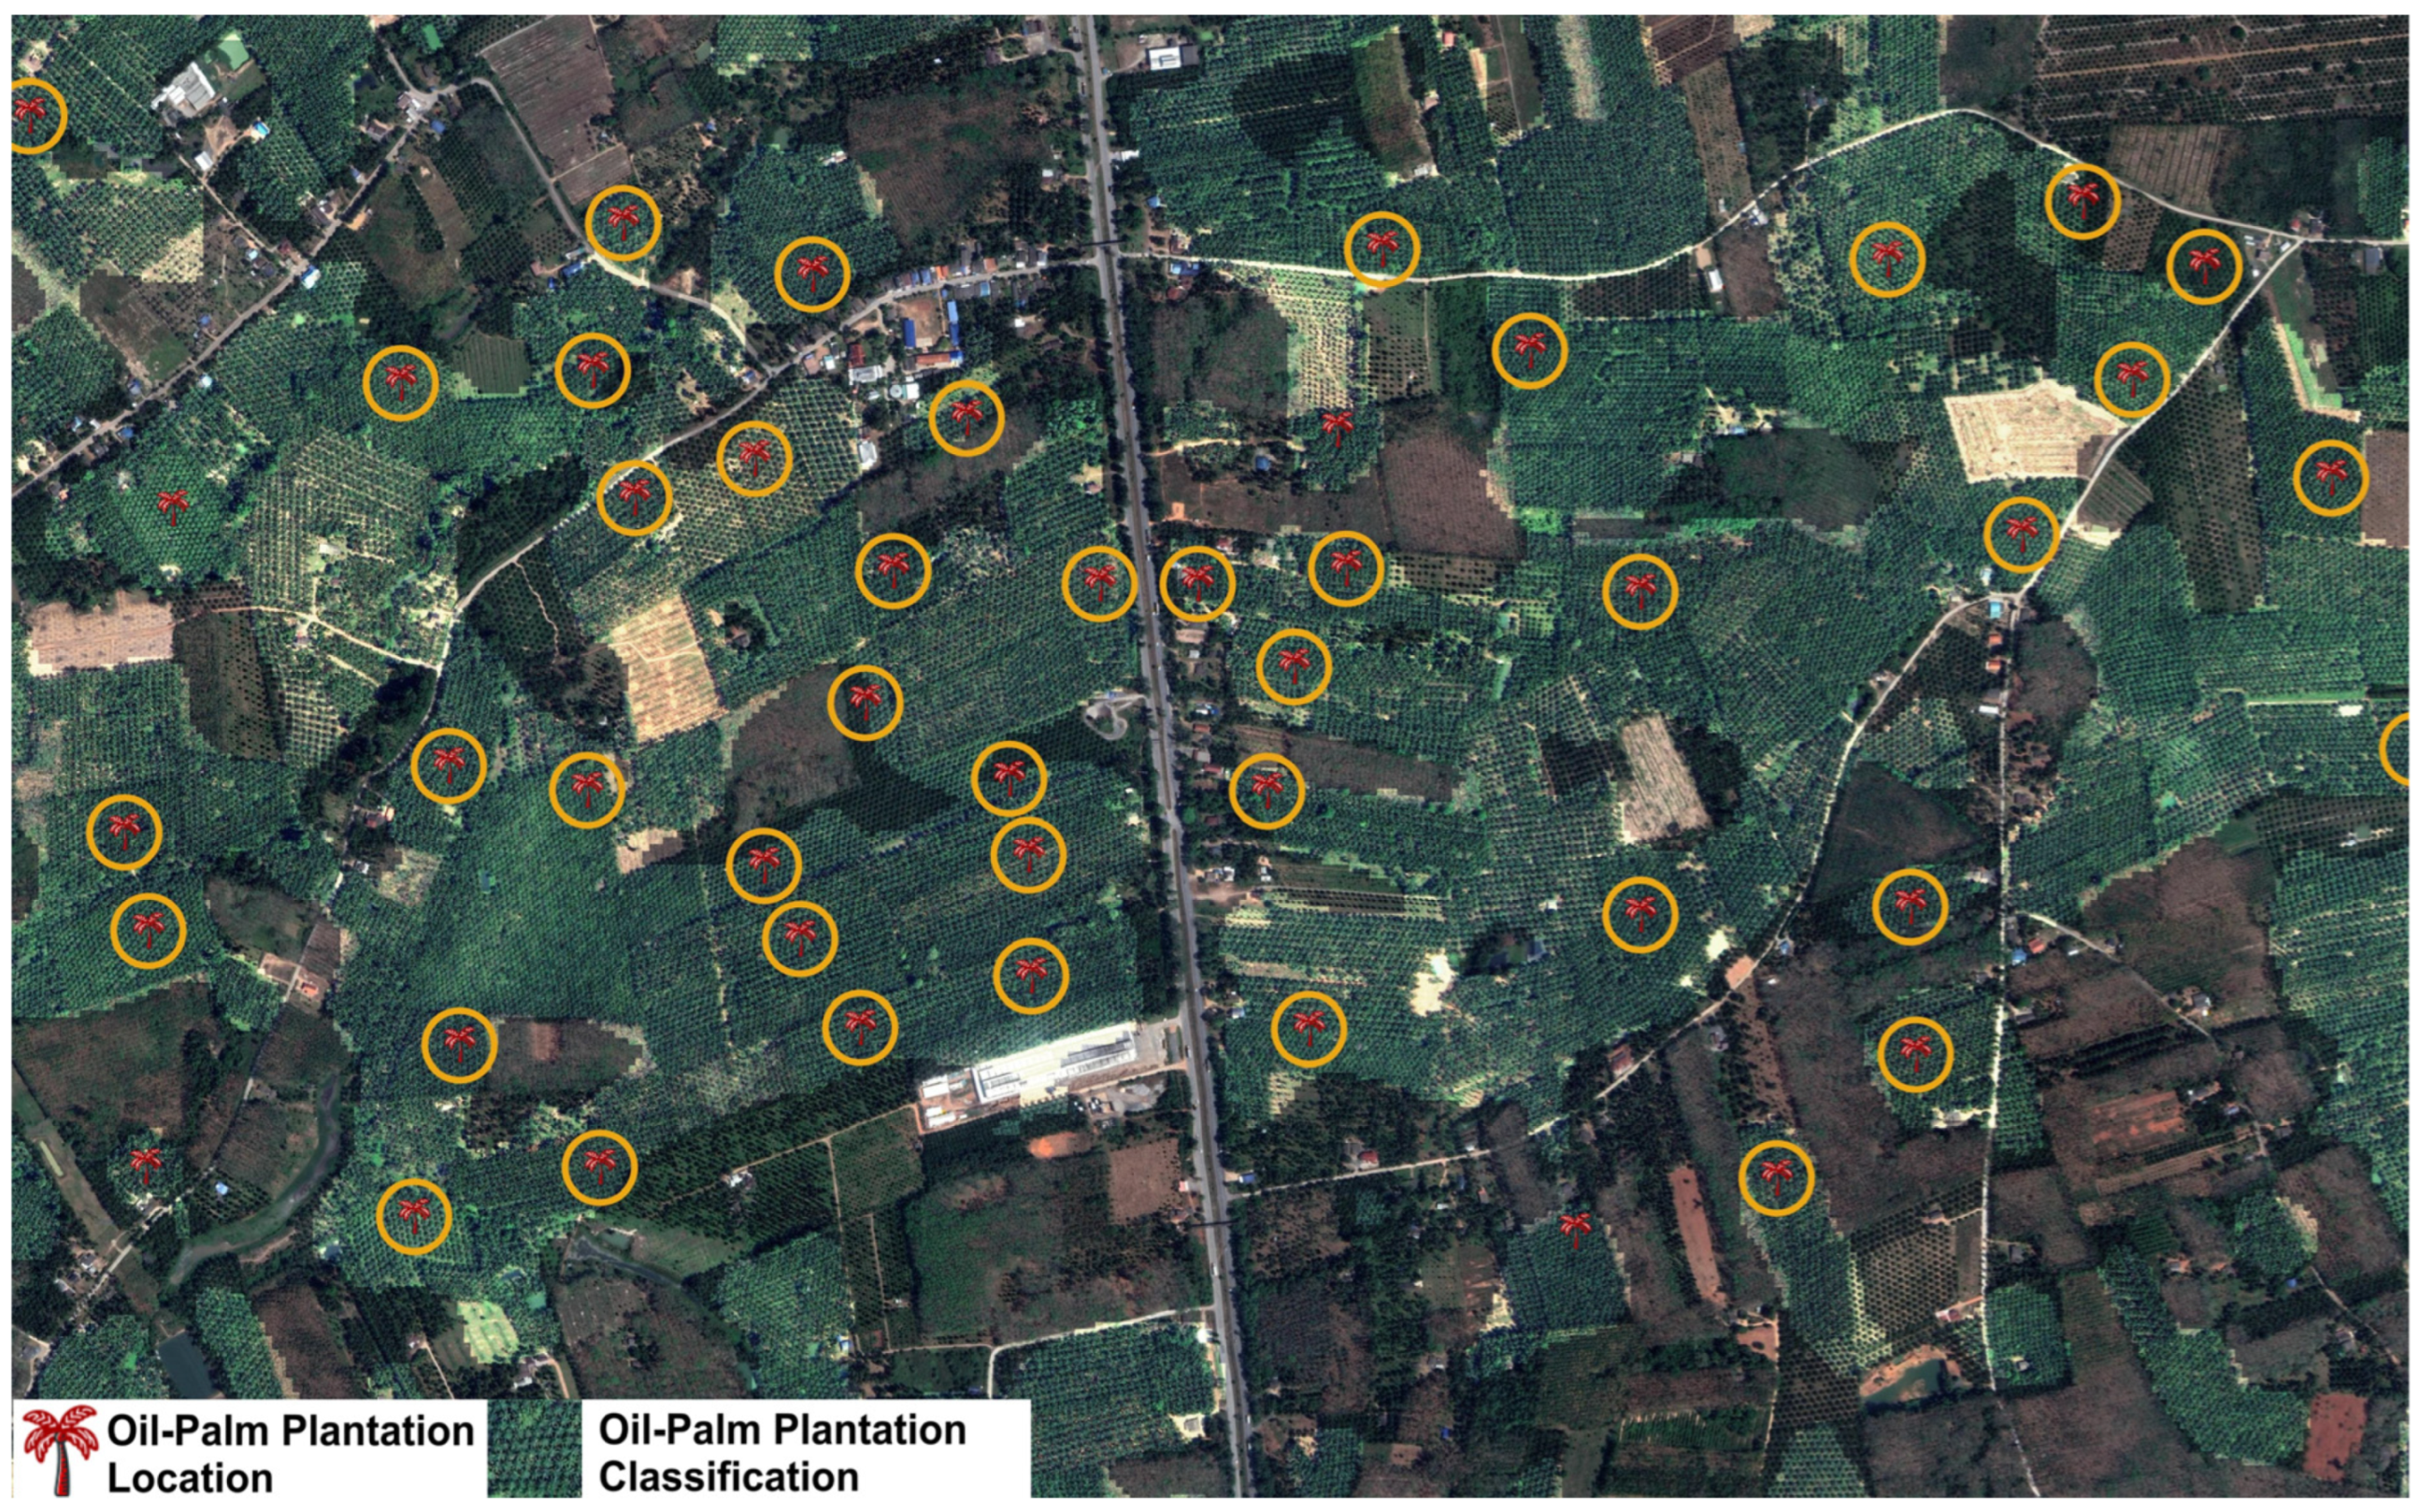
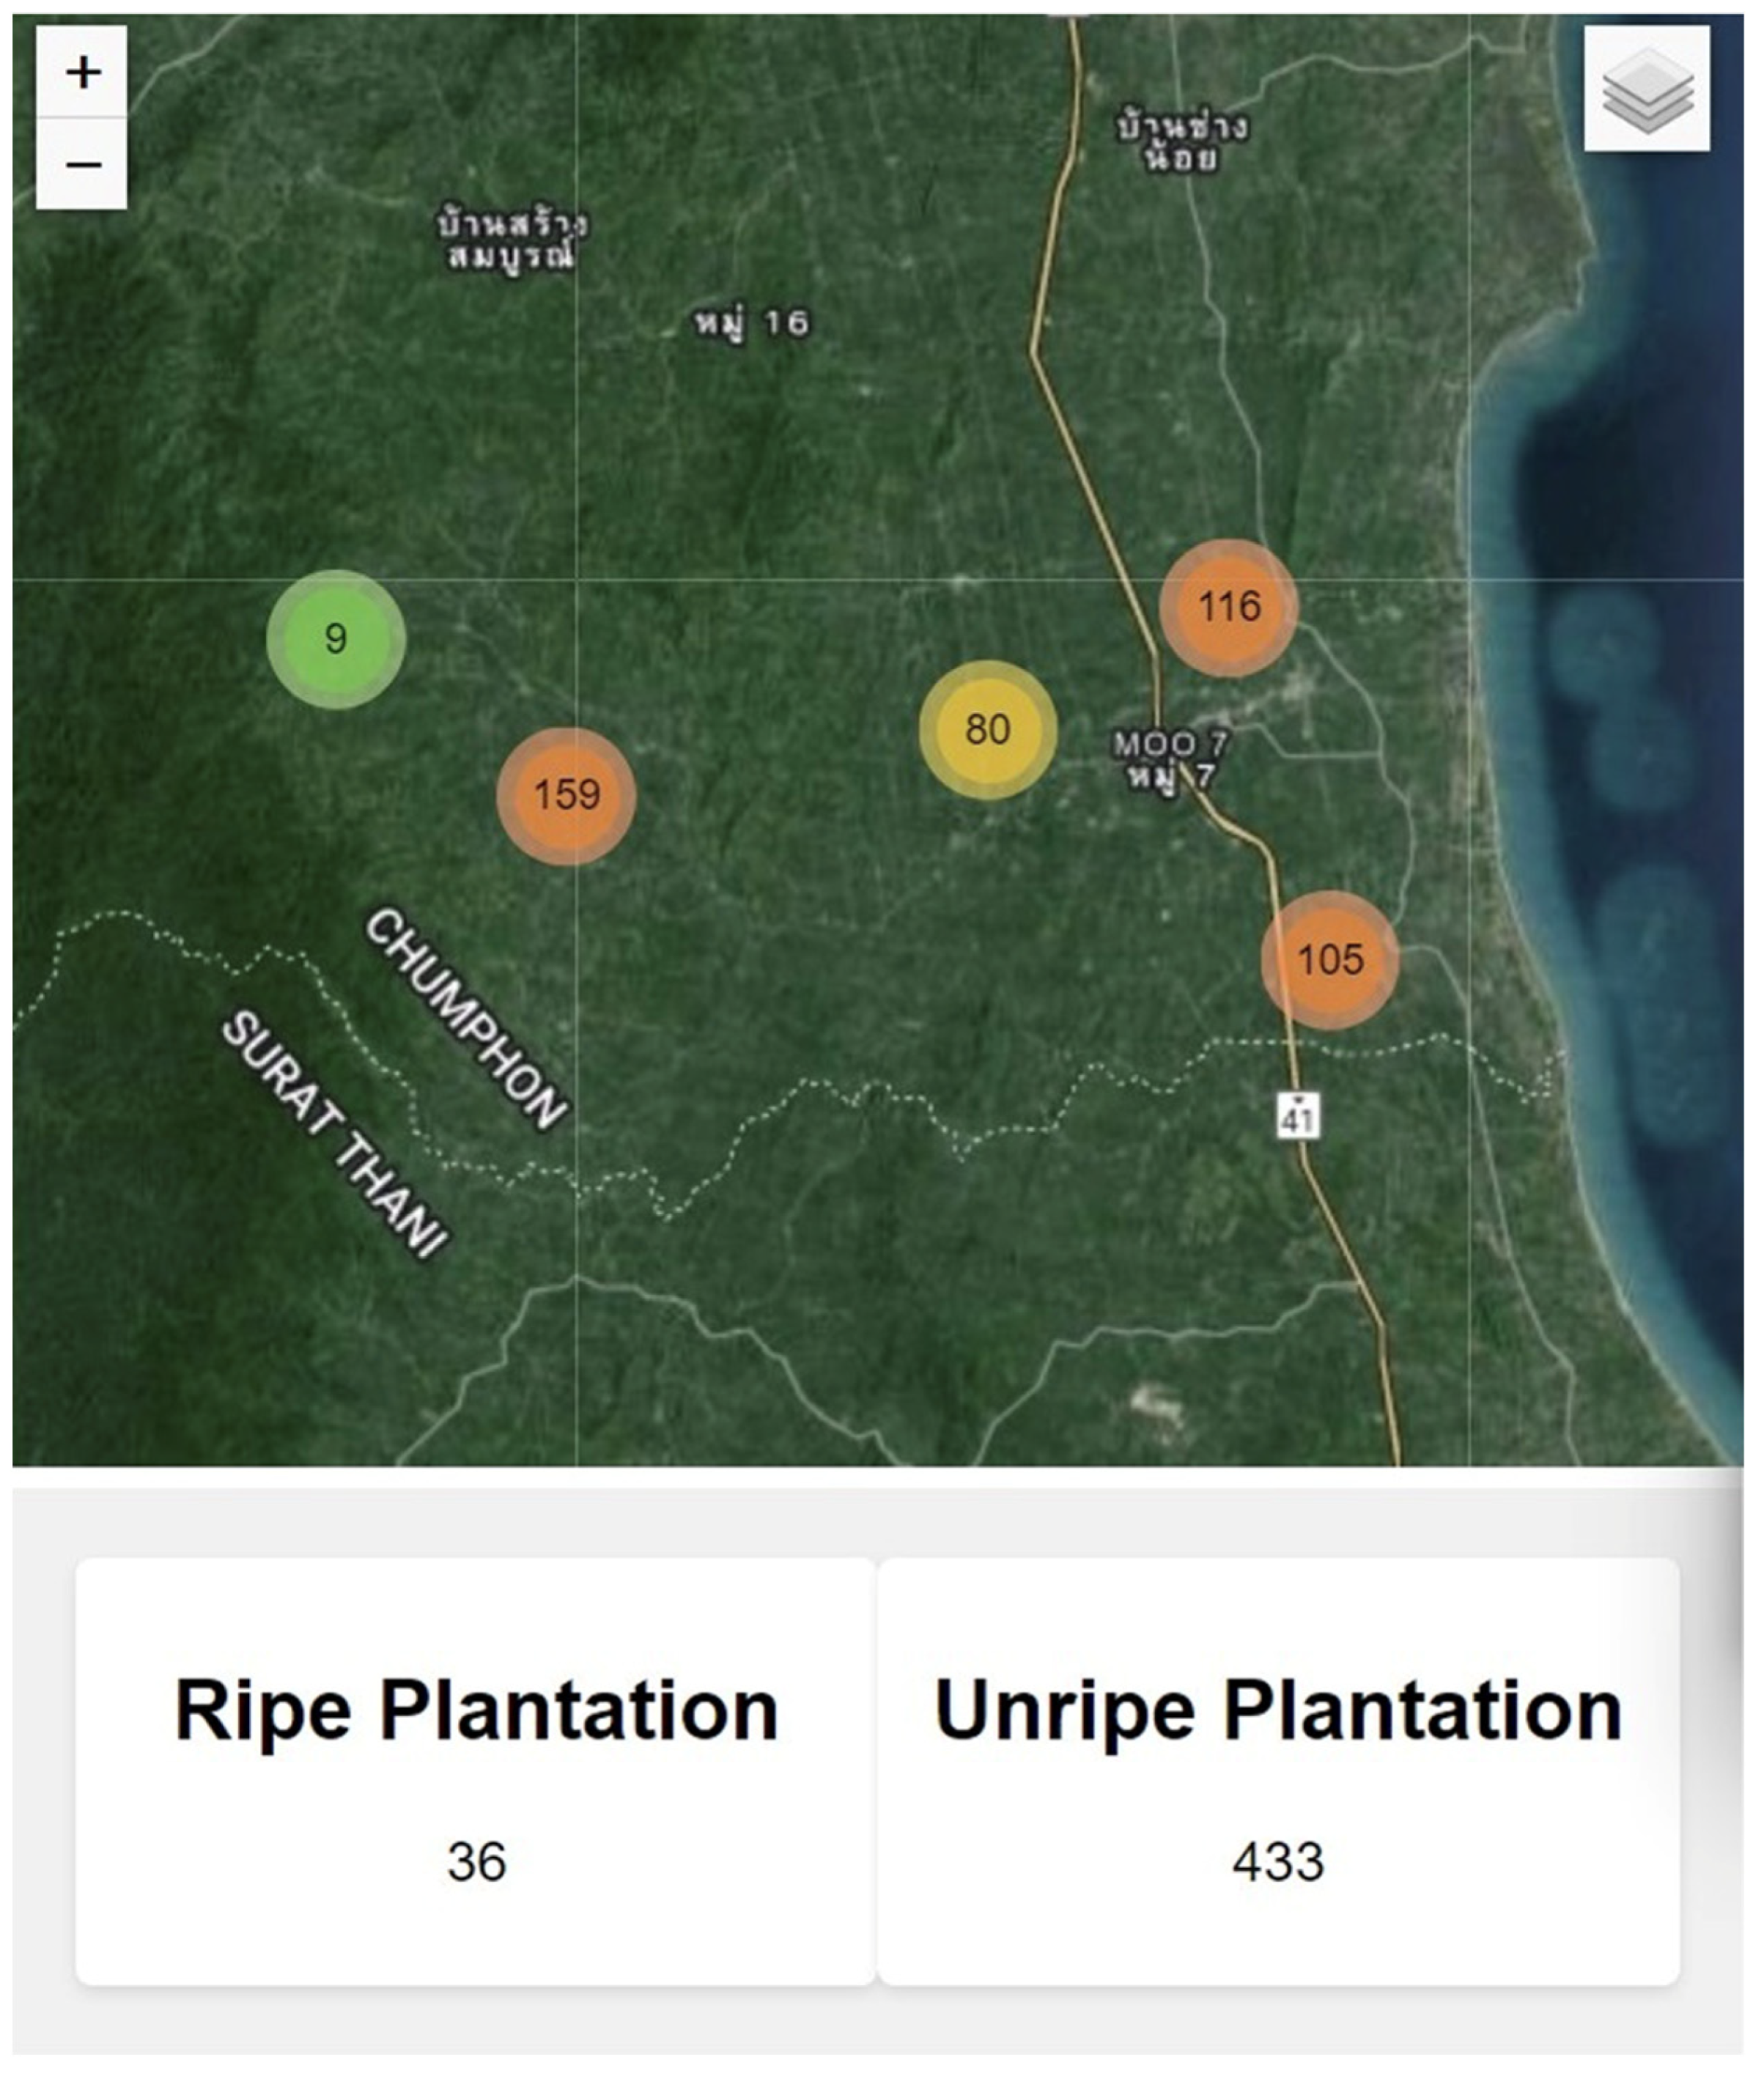
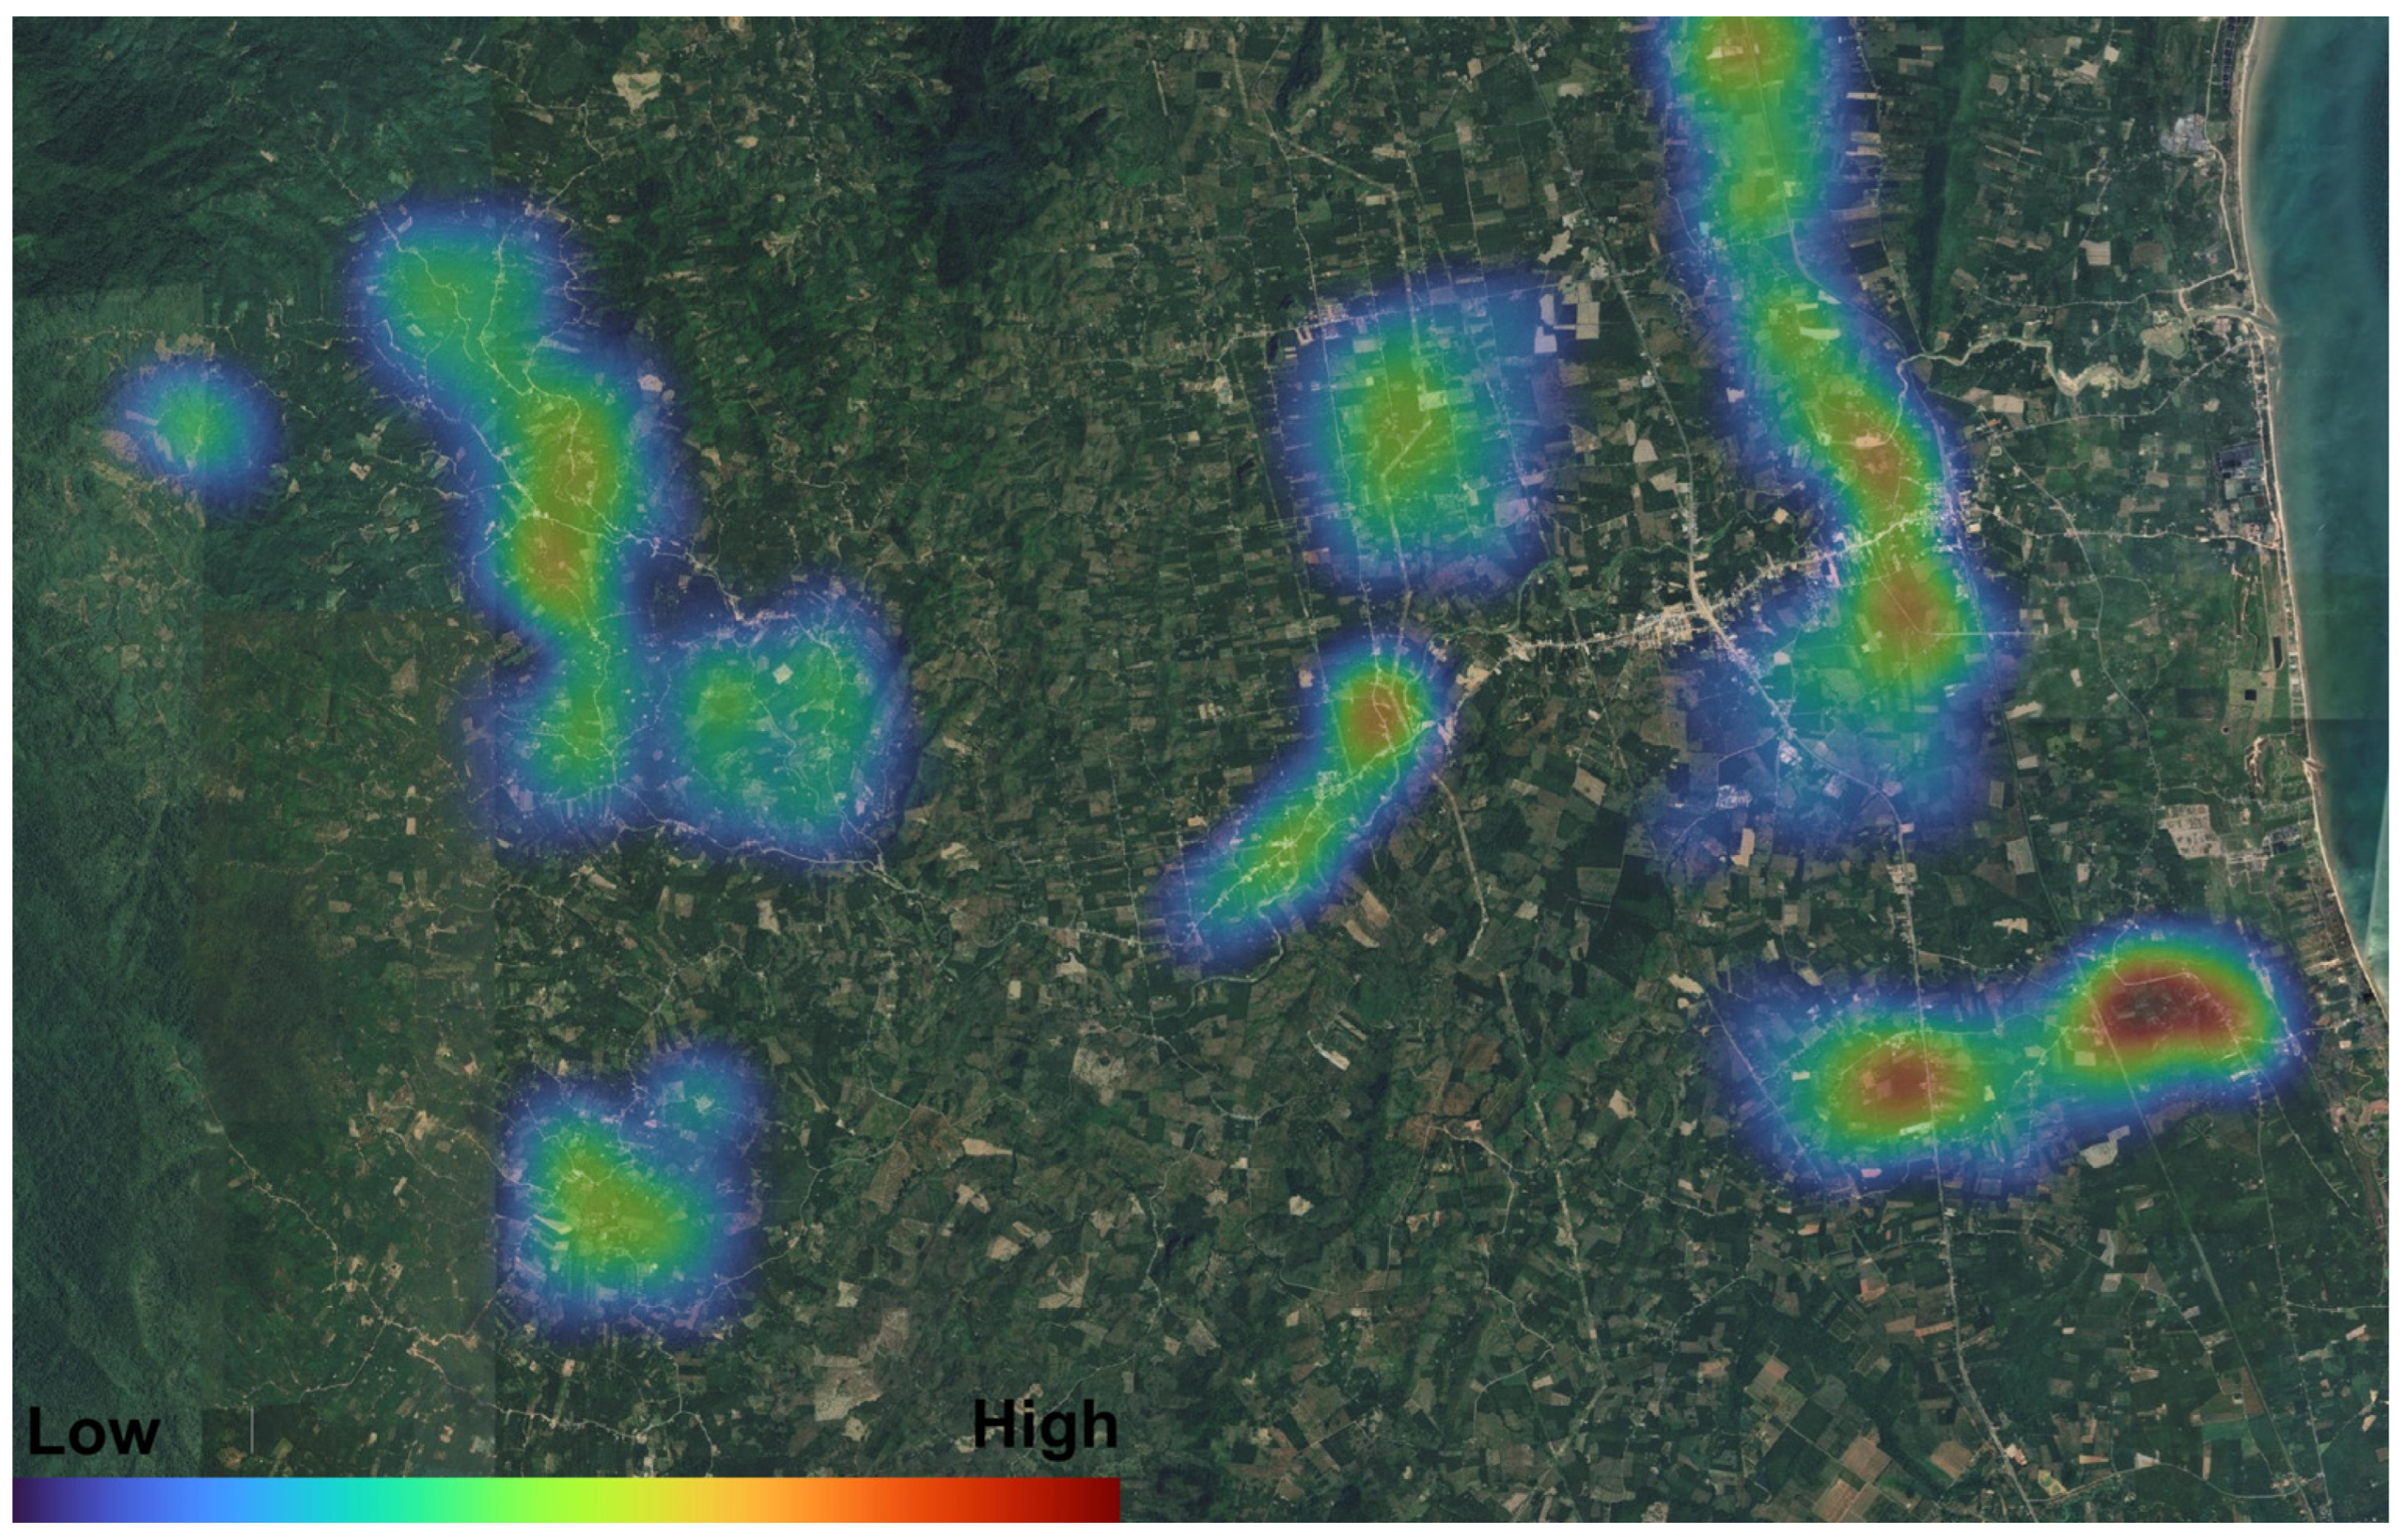
This functionality enables various applications, such as inspecting oil palm plots affected by flooding to ascertain the presence of harvestable produce, thereby aiding in decision-making and budget planning for financial support or compensation for affected farmers. It also facilitates the validation of information provided by farmers through the initial application. Additionally, concerning the validation of oil palm plantation location coordinates within the application or platform proposed in this study, Geofencing and Overlay Layers can be employed to visualize results as spatial data. This facilitates the comparison between the coordinates reported by farmers and the Oil-Palm Plantation Classification data derived from processing satellite images using machine learning, or from oil palm plantation data accessed through cloud services like the Google Earth Engine Data Catalog. Examples of mapping results are depicted in Appendix A, Figure A1 and Figure A2. Figure A1 illustrates the utilization of Geofencing in the analysis, displaying a radius from the coordinates of the reported planting plot. The orange circle represents the displayed surrounding area within a 50 m radius from the oil palm plantation location. This visualization aims to address potential GPS inaccuracies in the user’s mobile device, enabling users to verify whether the reported coordinates correspond to actual oil palm plantations. Beyond solely considering the coordinate location marker, users can assess the area within the circle to determine the presence of an oil palm plantation, thereby minimizing errors stemming from the diverse smartphone technologies utilized by farmers. Figure A2 (Appendix A) portrays the coordinates of oil palm plantation plots overlaid with the Oil-Palm Plantation Classification. Green pixels represent the Oil-Palm Plantation Classification, while red oil palm tree markers indicate the oil palm plantation plot locations. The overlap of all the markers confirms the accuracy of the received information regarding the actual oil palm plantation plots. Moreover, the presented platform or application can generate reports summarizing the number of oil palm plantation plots with ripe and unripe oil palm bunches, as exemplified in Figure A3 (Appendix A). This information presentation can support decision-making and planning for government agencies in various scenarios. Additionally, the application supports displaying information on the density of oil palm plantation plots in the form of a Heatmap, as illustrated in Figure A4 (Appendix A). Government sectors can utilize this information for planning and managing oil palm plantation zoning in respective areas.
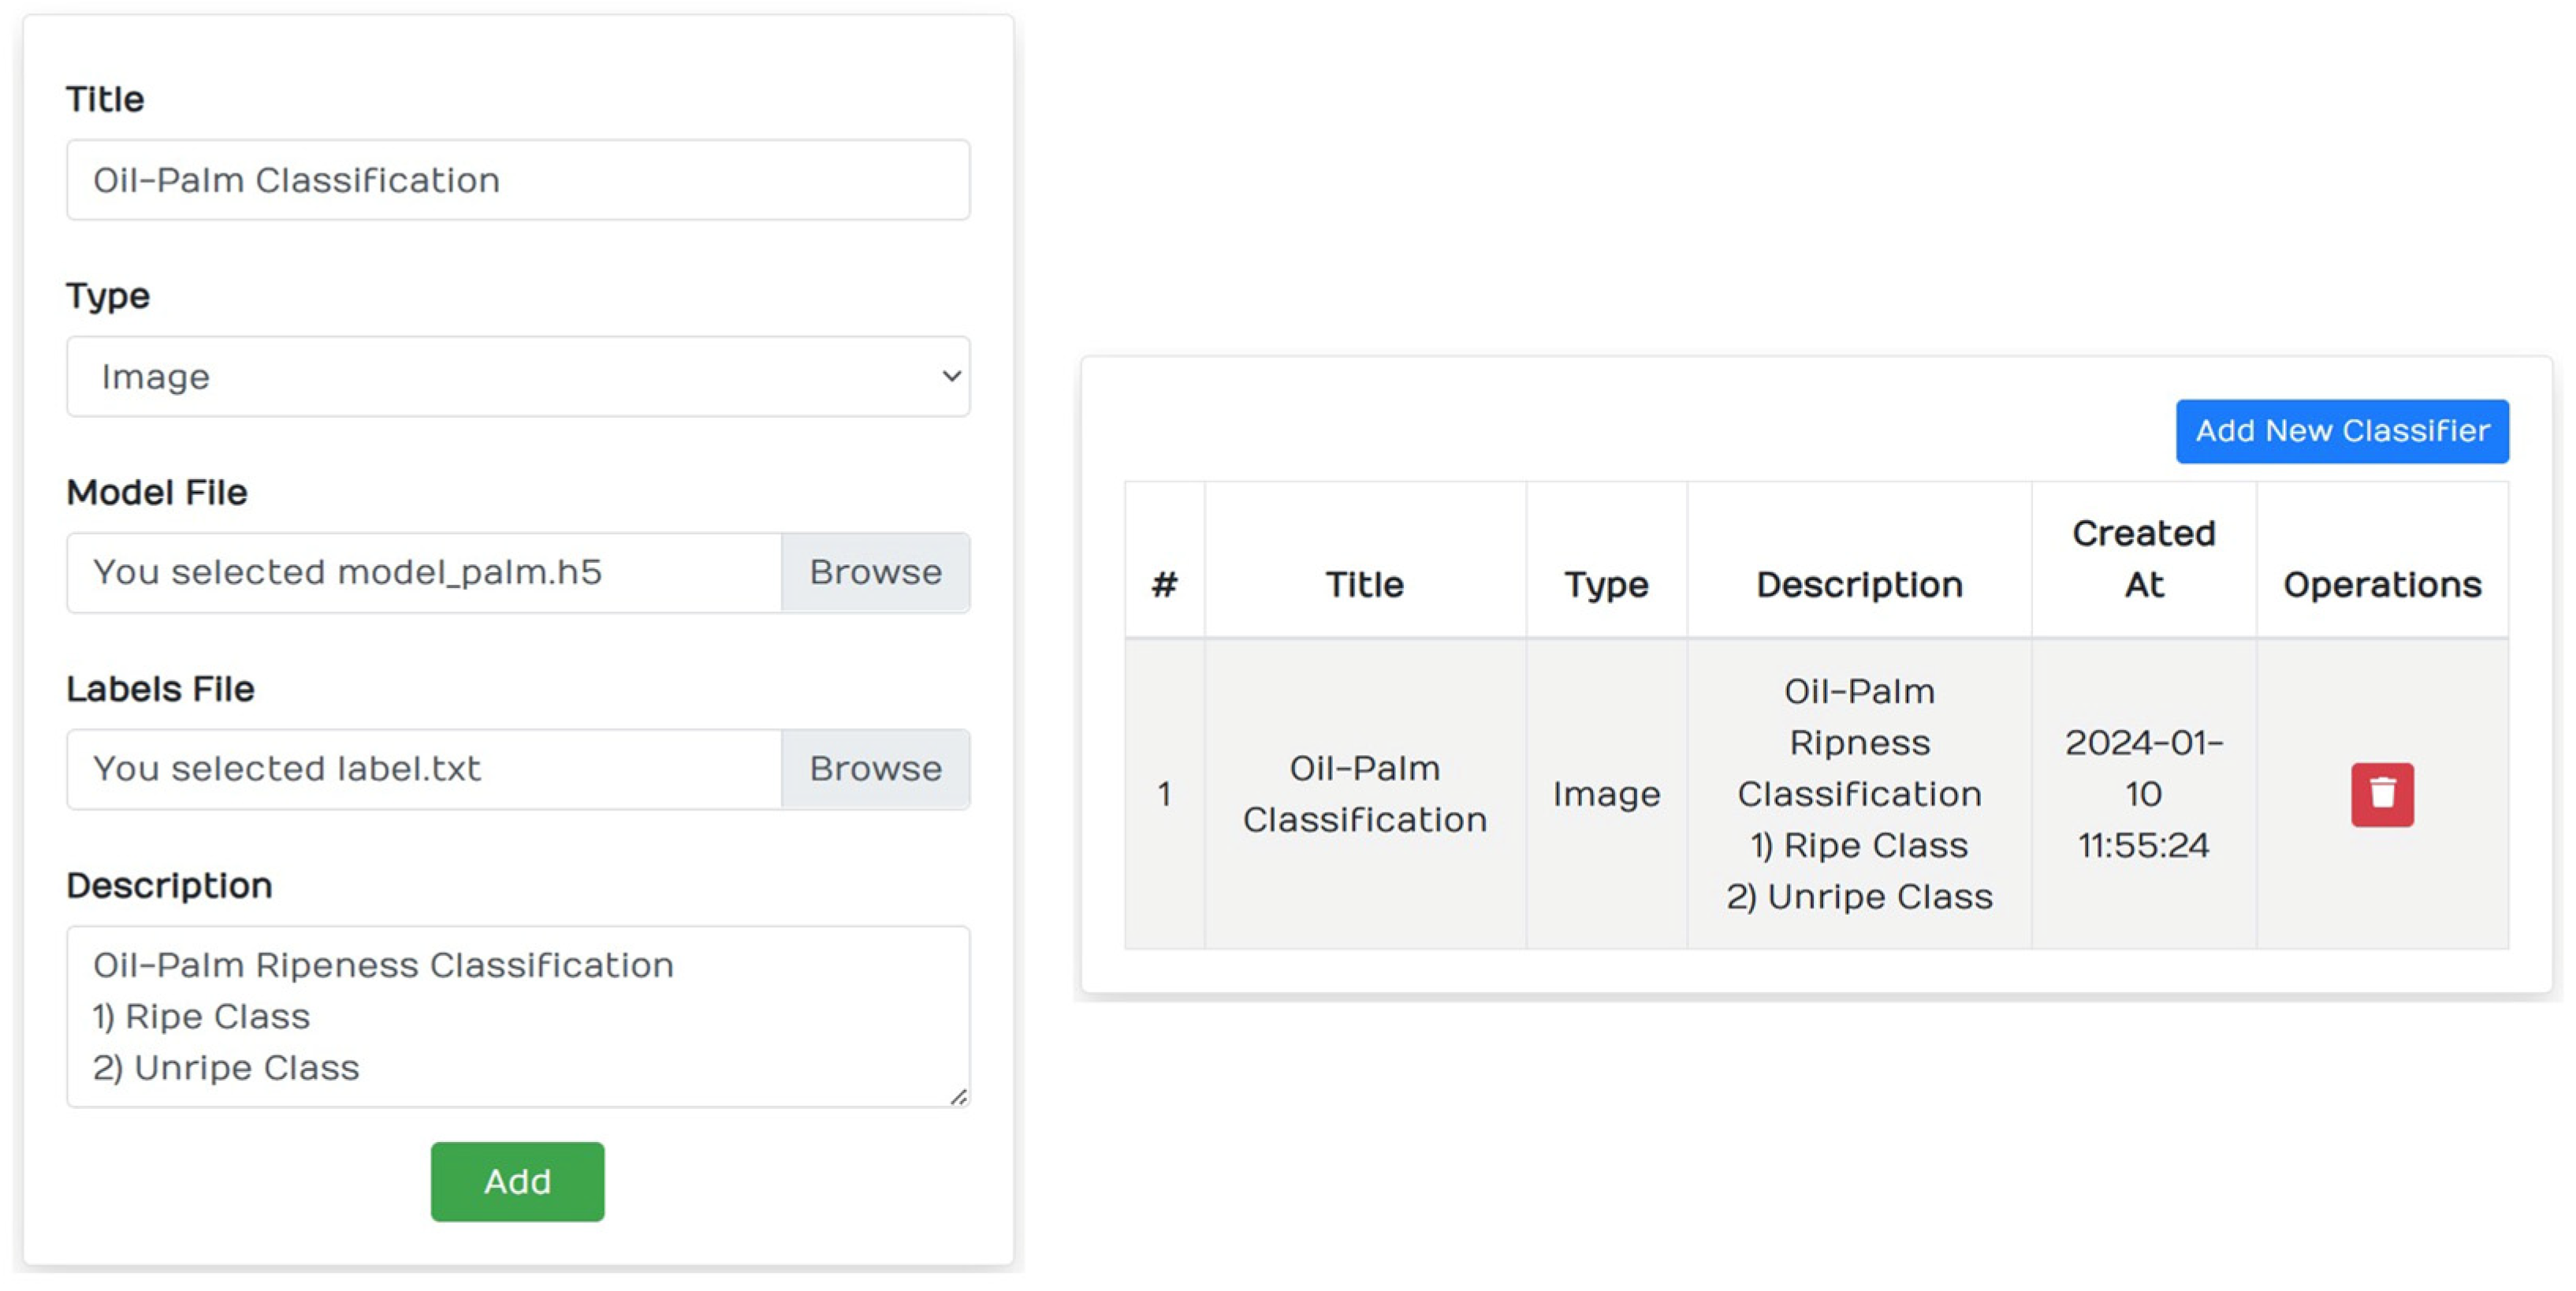
The proposed application has the capability to enhance and update models for classifying the ripeness of oil palm bunches, as illustrated in Figure A5 (Appendix A). Thus, with an increase in the number of datasets, new models can be constructed to enhance accuracy and facilitate updates within the application. This aspect represents a significant advancement for real-world applications, enabling accurate classification of images across various contexts and scenarios. Furthermore, the development of the application presented in this research extends its utility beyond the study area, as it supports the extraction of location coordinates from the GPS of the user’s mobile device. This feature is instrumental in processing and displaying data in the form of spatial visualization for every location via the online map interface. Additionally, it can be adapted for image classification in diverse scenarios, such as assessing the ripeness of fruits on trees through photographic analysis where ripeness can be discerned from the images.

4.3. Discussion

This research introduces the development of a classification platform aimed at determining the ripeness of oil palm bunches on trees through the integration of deep learning with geospatial analysis and visualization. This advancement enables real-time inspection and display of inspection outcomes, while also facilitating the management of oil palm plantation data through spatial visualization, which could be instrumental in governmental data management. Additionally, this study addresses and provides solutions for limitations identified in previous research. Prior studies predominantly focused on assessing the ripeness of oil palm bunches that had been harvested but not yet processed, supporting the analysis of images of such bunches [17,18,19,20,21,22,23,24,25,26]. In contrast, this research concentrates on presenting a model designed specifically for classifying the ripeness of oil palm bunches on trees or those yet to be harvested. Unlike previous efforts that primarily built and tested models for ripeness classification [17,18,19,20,21,22,23,24,25,26], this research stands out by developing a platform capable of real-time data processing. Additionally, previous studies lacked extensive testing and often used limited datasets for model construction, potentially impacting the accuracy of the model in practical applications [20,21,22,23,24,27,28,29]. In contrast, this study employs a dataset comprising 8779 images and employs the 10-fold cross-validation method to mitigate overfitting concerns for real-world applications. Moreover, the research tests the accuracy with a validation dataset of 1160 images.
Comparing this research with a study that developed an application for assessing oil palm bunch ripeness [30], several differences emerge. The previous work categorized ripeness into four levels, while this study divides it into two levels. However, the classification of classes or levels is contingent upon the intended use. Previous research predominantly utilized images of harvested oil palm bunches for classification. Comparing the accuracy of the models, this research demonstrates higher accuracy in both training and validation datasets, despite using a similar number of datasets. Furthermore, prior research did not support model updates within applications and lacked geospatial analysis and visualization for managing and verifying the location coordinates of oil palm plantations. This crucial functionality is integral for confirming the classification results’ association with specific areas or oil palm plots. When comparing this research with previous studies on the utilization of GIS and RS in oil palm plantation management, particularly concerning the location and acquisition of information on oil palm plantations, distinct differences and strengths emerge. This research offers the capability to manage and process data in real-time, incorporating information from crowdsourcing and satellite image processing through geospatial analysis and visualization. Consequently, this enables the verification of the accuracy of oil palm plantation plot locations. In contrast, most prior studies have focused solely on satellite image processing, including the use of UAVs [36,37,38,39]. Hence, the development of a platform for classifying and assessing the ripeness of oil palm bunches on trees in this research stands out. This study integrates AI, GIS, and RS disciplines, rendering the proposed platform applicable in diverse scenarios. It could serve as a model or tool for government agencies to engage with farmers, facilitating communication and information storage for planning and decision-making support in various contexts.
When examining the methodologies for classifying the ripeness of oil palm bunches on trees and considering the challenges and limitations inherent in this study, it was observed that despite achieving a high level of accuracy in classification, several challenges and uncertainties persist. These factors may impede the precision of the model. For instance, environmental conditions during image capture using smartphone cameras and the application’s usage may pose difficulties. For instance, excessive brightness during photography may result in images that fail to discern the ripeness of palm oil bunches. Furthermore, human error during image capture, such as hand tremors leading to blurry or unclear images, can also affect classification accuracy. Moreover, the diverse characteristics of each plantation or oil palm cultivation area, influenced by various factors like maintenance practices and environmental conditions, contribute to variations in the captured images. For instance, oil palm bunches may be obstructed by objects or weeds, or parasitic growth may be present near the bunches. These issues underscore the need for model enhancement through the inclusion of additional datasets to address such scenarios. In this study, the model was refined to handle challenges arising from diverse environmental conditions, including scenarios where photographs capture parasites or weeds near both ripe and unripe oil palm bunches. Consequently, the model demonstrates proficiency in accurately classifying the ripeness of oil palm bunches when objects or weeds partially obscure them. However, limitations persist in cases where such obstructions obscure the oil palm fruits entirely, resulting in inaccurate classification outcomes. Furthermore, user-related constraints, such as backlit photography and controlling camera shake during image capture, necessitate improvement. These aspects can be addressed by providing users with instructional materials, such as infographics and instructional videos, illustrating proper application usage, including examples of capturing images of oil palm bunches on trees.
In a comparative investigation concerning the assessment or classification of oil palm bunch ripeness on trees utilizing the application devised in this study versus human or personnel inspectors, it was discerned that the application possesses notable advantages or merits. Specifically, the proposed application’s strengths lie in its evaluation process, which entails the analysis of images captured in authentic settings employing a model renowned for its precision (Reliability). Irrespective of the frequency of testing, consistent outcomes are achieved. Furthermore, the process is devoid of emotions, prejudices, or biases. Conversely, when employing human assessors, expertise in discerning the coloration of oil palm bunches is imperative. Moreover, assessment outcomes may be susceptible to subjective considerations and biases, potentially resulting in unjust or inaccurate determinations. Consequently, the casual integration of applications employing machine learning as a component of artificial intelligence (AI) for image processing confers the advantage of mitigating human biases and subjective assessments. Such applications possess the capability to perpetually process data without being influenced by emotions or subjective interpretations typical of human judgment. This impartiality facilitates precision and fairness in outcomes, rendering them conducive for efficient utilization in planning, decision-making, and management across diverse domains.

5. Conclusions

This research introduces the development of a classification platform aimed at determining the ripeness of oil palm bunches on trees by integrating AI, GIS, and RS technologies. The model was created and developed using deep learning with the MobileNetV1 algorithm. Upon evaluating the model’s accuracy and efficiency, it was discovered to be highly accurate, allowing for quick verification without demanding excessive resources or memory on the user or farmer’s mobile device. Key strengths or contributions of this research include the ability to process and display data in real-time through spatial visualization. It effectively classifies the ripeness of oil palm bunches on trees into both Ripe and Unripe classes. Furthermore, the platform enables users to cross-reference image coordinates to determine their respective plantation origins. It also facilitates comparison between image-derived location coordinates and Oil-Palm Plantation classifications obtained from cloud services or satellite image processing. Moreover, the presented platform can be updated or enhanced when dealing with increased datasets or when used in diverse scenarios, thereby improving the model’s efficiency and accuracy in practical applications. In addition, this platform is designed for deployment in various regions.
For future research directions, the platform should be extended to include disaster detection capabilities using satellite and digital images, such as identifying areas of oil palm plantations affected by floods, rendering them unharvestable. Additionally, concerning the assessment of oil palm tree health, a model that can recognize multiple levels of ripeness should be developed. This would be beneficial for quality inspections when purchasing products or when predicting the oil percentage of the production desired by factories.

Author Contributions

Conceptualization, Supattra Puttinaovarat; methodology, Supattra Puttinaovarat, Wanida Saetang and Supaporn Chai-Arayalert; software, Supattra Puttinaovarat; validation, Supattra Puttinaovarat; investigation, Supattra Puttinaovarat, Wanida Saetang and Supaporn Chai-Arayalert; formal analysis, Supattra Puttinaovarat; writing—original draft preparation, Supattra Puttinaovarat; writing—review and editing, Supattra Puttinaovarat, Wanida Saetang and Supaporn Chai-Arayalert; visualization, Supattra Puttinaovarat; project administration, Supattra Puttinaovarat. All authors have read and agreed to the published version of the manuscript.

Funding

This research was supported by the National Science, Research and Innovation Fund (NSRF) and Prince of Songkla University (Grant No. SIT6701013S).

Data Availability Statement

Data are available on request to the authors.

Acknowledgments

The authors would like to thank Google Inc. for providing the remotely sensed data used in this paper. We also extend our gratitude to the farmers and stakeholders in Lamae district, Chumphon province, who provided the photographs of oil palm bunches on trees in the oil palm plantations, which served as the initial data for building the model and developing the platform in this research. Additionally, we acknowledge the Faculty of Science and Industrial Technology, Prince of Songkla University Surat Thani Campus, for supporting this research.

Conflicts of Interest

The authors declare no conflicts of interest.

Appendix A

Figure A1. Geofencing visualization map.
Ijgi 13 00158 g0a1
Figure A2. Oil palm location overlaid with oil palm plantation classification.
Ijgi 13 00158 g0a2
Figure A3. Map visualization report.
Ijgi 13 00158 g0a3
Figure A4. Heatmap visualization.
Ijgi 13 00158 g0a4
Figure A5. Oil palm ripe classification model update interface.
Ijgi 13 00158 g0a5

References

  1. Appelt, J.L.; Saphangthong, T.; Malek, Ž.; Verburg, P.H.; van Vliet, J. Climate change impacts on tree crop suitability in Southeast Asia. Reg. Environ. Change 2023, 23, 117. [Google Scholar] [CrossRef]
  2. Nupueng, S.; Oosterveer, P.; Mol, A.P. Global and local sustainable certification systems: Factors influencing RSPO and Thai-GAP adoption by oil palm smallholder farmers in Thailand. Environ. Dev. Sustain. 2023, 25, 6337–6362. [Google Scholar] [CrossRef]
  3. Yaseen, M.; Thapa, N.; Visetnoi, S.; Ali, S.; Saqib, S.E. Factors Determining the Farmers’ Decision for Adoption and Non-Adoption of Oil Palm Cultivation in Northeast Thailand. Sustainability 2023, 15, 1595. [Google Scholar] [CrossRef]
  4. Parveez, G.K.A.; Omar, A.R.; Ahmad, M.N.; Mat Taib, H.; Mohd-Bakri, M.A.; Sitti-Rahma, A.H.; Zainab, I. Oil palm economic performance in Malaysia and R&D progress in 2022. J. Oil Palm Res. 2023, 35, 193–216. [Google Scholar]
  5. Hashemvand Khiabani, P.; Takeuchi, W. Assessment of oil palm yield and biophysical suitability in Indonesia and Malaysia. Int. J. Remote Sens. 2020, 41, 8520–8546. [Google Scholar] [CrossRef]
  6. Paterson, R.R.M. Future climate effects on basal stem rot of conventional and modified oil palm in Indonesia and Thailand. Forests 2023, 14, 1347. [Google Scholar] [CrossRef]
  7. Paterson, R.R.M. Future Climate Effects on Yield and Mortality of Conventional versus Modified Oil Palm in SE Asia. Plants 2023, 12, 2236. [Google Scholar] [CrossRef] [PubMed]
  8. Muhadi, N.A.; Abdullah, A.F.; Muhammad Zahir, N.Z. Estimating Flood Losses in Oil Palm Plantation Using Flood Modeling. In ICDSME 2019: Proceedings of the 1st International Conference on Dam Safety Management and Engineering; Springer: Berlin/Heidelberg, Germany, 2020; pp. 359–367. [Google Scholar]
  9. Parveez, G.K.A.; Hishamuddin, E.; Loh, S.K.; Ong-Abdullah, M.; Salleh, K.M.; Bidin, M.N.I.Z.; Idris, Z. Oil palm economic performance in Malaysia and R&D progress in 2019. J. Oil Palm Res. 2020, 32, 159–190. [Google Scholar]
  10. Abubakar, A.; Ishak, M.Y.; Makmom, A.A. Nexus between climate change and oil palm production in Malaysia: A review. Environ. Monit. Assess. 2022, 194, 262. [Google Scholar] [CrossRef]
  11. Khor, J.F.; Ling, L.; Yusop, Z.; Tan, W.L.; Ling, J.L.; Soo, E.Z.X. Impact of El Niño on oil palm yield in Malaysia. Agronomy 2021, 11, 2189. [Google Scholar] [CrossRef]
  12. Lim, F.K.; Carrasco, L.R.; Edwards, D.P.; McHardy, J. Market responses to oil palm intensification could exacerbate deforestation in Indonesia. Conserv. Biol. 2023, 38, e14149. [Google Scholar]
  13. Gaveau, D.L.; Locatelli, B.; Salim, M.A.; Husnayaen; Manurung, T.; Descals, A.; Sheil, D. Slowing deforestation in Indonesia follows declining oil palm expansion and lower oil prices. PLoS ONE 2022, 17, e0266178. [Google Scholar] [CrossRef]
  14. Zhao, J.; Elmore, A.J.; Lee, J.S.H.; Numata, I.; Zhang, X.; Cochrane, M.A. Replanting and yield increase strategies for alleviating the potential decline in palm oil production in Indonesia. Agric. Syst. 2023, 210, 103714. [Google Scholar] [CrossRef]
  15. Nupueng, S.; Oosterveer, P.; Mol, A.P. Governing sustainability in the Thai palm oil-supply chain: The role of private actors. Sustain. Sci. Pract. Policy 2022, 18, 37–54. [Google Scholar] [CrossRef]
  16. Somnuek, S.; Slingerland, M.M.; Grünbühel, C.M. The introduction of oil palm in Northeast Thailand: A new cash crop for smallholders? Asia Pac. Viewp. 2016, 57, 76–90. [Google Scholar] [CrossRef]
  17. Saechen, P.; Siriborvornratanakul, T. Oil Palm Fresh Fruit Bunch Ripeness Classification by Deep Learning. KMUTT RD J. 2023, 6, 81–104. [Google Scholar]
  18. Suharjito; Junior, F.A.; Koeswandy, Y.P.; Debi; Nurhayati, P.W.; Asrol, M.; Marimin. Annotated Datasets of Oil Palm Fruit Bunch Piles for Ripeness Grading Using Deep Learning. Sci. Data 2023, 10, 72. [Google Scholar] [CrossRef] [PubMed]
  19. Junior, F.A. Video based oil palm ripeness detection model using deep learning. Heliyon 2023, 9, 1–23. [Google Scholar] [CrossRef] [PubMed]
  20. Mansour, M.A.; Dambul, K.D.; Choo, K.Y. Object Detection Algorithms for Ripeness Classification of Oil Palm Fresh Fruit Bunch. Int. J. Technol. 2022, 13, 1326. [Google Scholar] [CrossRef]
  21. Ashari, S.; Yanris, G.J.; Purnama, I. Oil Palm Fruit Ripeness Detection using Deep Learning. Sink. J. Dan Penelit. Tek. Inform. 2022, 7, 649–656. [Google Scholar] [CrossRef]
  22. Wonohardjo, E.P.; Pratama, D.; Industrial, T.R.S.; Computer, R.A.A. Effect of Pre-processing Dataset on Classification Performance of Deep Learning Model for Detection of Oil Palm Fruit Ripe. In Proceedings of the 2022 International Conference on ICT for Smart Society (ICISS), Bandung, Indonesia, 10–11 August 2022; pp. 1–6. [Google Scholar]
  23. Herman, H.; Susanto, A.; Cenggoro, T.W.; Suharjito, S.; Pardamean, B. Oil palm fruit image ripeness classification with computer vision using deep learning and visual attention. J. Telecommun. Electron. Comput. Eng. (JTEC) 2020, 12, 21–27. [Google Scholar]
  24. Saleh, A.Y.; Liansitim, E. Palm oil classification using deep learning. Sci. Inf. Technol. Lett. 2020, 1, 1–8. [Google Scholar] [CrossRef]
  25. Ghazalli, S.A.; Selamat, H.; Khamis, N.; Haniff, M.F. Short Review on Palm Oil Fresh Fruit Bunches Ripeness and Classification Technique. J. Adv. Res. Appl. Mech. 2023, 106, 37–47. [Google Scholar] [CrossRef]
  26. Lai, J.W.; Ramli, H.R.; Ismail, L.I.; Wan Hasan, W.Z. Oil palm fresh fruit bunch ripeness detection methods: A systematic review. Agriculture 2023, 13, 156. [Google Scholar] [CrossRef]
  27. Raj, T.; Hashim, F.H.; Huddin, A.B.; Hussain, A.; Ibrahim, M.F.; Abdul, P.M. Classification of oil palm fresh fruit maturity based on carotene content from Raman spectra. Sci. Rep. 2021, 11, 18315. [Google Scholar] [CrossRef] [PubMed]
  28. Tzuan, G.T.H.; Hashim, F.H.; Raj, T.; Baseri Huddin, A.; Sajab, M.S. Oil palm fruits ripeness classification based on the characteristics of protein, lipid, carotene, and guanine/cytosine from the Raman spectra. Plants 2022, 11, 1936. [Google Scholar] [CrossRef] [PubMed]
  29. Supriyatin, W. Palm oil extraction rate prediction based on the fruit ripeness levels using C4.5 algorithm. ILKOM J. Ilm. 2021, 13, 92–100. [Google Scholar] [CrossRef]
  30. Azman, H.; Suriani, N.S. Grading Oil Palm Fruit Bunch using Convolution Neural Network. Evol. Electr. Electron. Eng. 2023, 4, 185–194. [Google Scholar]
  31. Dong, R.; Li, W.; Fu, H.; Gan, L.; Yu, L.; Zheng, J.; Xia, M. Oil palm plantation mapping from high-resolution remote sensing images using deep learning. Int. J. Remote Sens. 2020, 41, 2022–2046. [Google Scholar] [CrossRef]
  32. Jarayee, A.N.; Shafri, H.Z.M.; Ang, Y.; Lee, Y.P.; Bakar, S.A.; Abidin, H.; Abdullah, R. Oil Palm Plantation Land Cover and Age Mapping Using Sentinel-2 Satellite Imagery and Machine Learning Algorithms. IOP Conf. Ser. Earth Environ. Sci. 2022, 1051, 012024. [Google Scholar] [CrossRef]
  33. Xu, K.; Qian, J.; Hu, Z.; Duan, Z.; Chen, C.; Liu, J.; Xing, X. A new machine learning approach in detecting the oil palm plantations using remote sensing data. Remote Sens. 2021, 13, 236. [Google Scholar] [CrossRef]
  34. Rustiadi, E.; Pribadi, D.O.; Pravitasari, A.E.; Nurdin, M.; Iman, L.S.; Panuju, D.R.; Anthony, D. Developing a precision spatial information system of smallholder oil palm plantations for sustainable rural development. IOP Conf. Ser. Earth Environ. Sci. 2023, 1133, 012072. [Google Scholar] [CrossRef]
  35. Puttinaovarat, S.; Horkaew, P. Deep and machine learnings of remotely sensed imagery and its multi-band visual features for detecting oil palm plantation. Earth Sci. Inform. 2019, 12, 429–446. [Google Scholar] [CrossRef]
  36. Abramowitz, J.; Cherrington, E.; Griffin, R.; Muench, R.; Mensah, F. Differentiating oil palm plantations from natural forest to improve land cover mapping in Ghana. Remote Sens. Appl. Soc. Environ. 2023, 30, 100968. [Google Scholar] [CrossRef]
  37. Wong, Y.B.; Gibbins, C.; Azhar, B.; Phan, S.S.; Scholefield, P.; Azmi, R.; Lechner, A.M. Smallholder oil palm plantation sustainability assessment using multi-criteria analysis and unmanned aerial vehicles. Environ. Monit. Assess. 2023, 195, 577. [Google Scholar] [CrossRef] [PubMed]
  38. Malinee, R.; Stratoulias, D.; Nuthammachot, N. Detection of oil palm disease in plantations in krabi province, thailand with high spatial resolution satellite imagery. Agriculture 2021, 11, 251. [Google Scholar] [CrossRef]
  39. Rahim, H.A.; Bidin, V. Evaluating Oil Palm Cultivation using Geospatial Approach in Kerdau, Temerloh District. IOP Conf. Ser. Earth Environ. Sci. 2022, 1051, 012025. [Google Scholar] [CrossRef]
  40. Zamri, S.H.; Mohamad Abdullah, N. An Overview of GIS Used in Oil Palm Plantation. Recent. Trends Civil. Eng. Built Environ. 2022, 3, 1231–1236. [Google Scholar]
  41. Baharim, M.S.A.; Adnan, N.A.; Mohd, F.A.; Seman, I.A.; Izzuddin, M.A.; Abd Aziz, N. A Review: Progression of Remote Sensing (RS) and Geographical Information System (GIS) Applications in Oil Palm Management and Sustainability. IOP Conf. Ser. Earth Environ. Sci. 2022, 1051, 012027. [Google Scholar] [CrossRef]
  42. Akhtar, M.N.; Ansari, E.; Alhady, S.S.N.; Abu Bakar, E. Leveraging on Advanced Remote Sensing-and Artificial Intelligence-Based Technologies to Manage Palm Oil Plantation for Current Global Scenario: A Review. Agriculture 2023, 13, 504. [Google Scholar] [CrossRef]
Figure 1. Proposed conceptual framework.
Ijgi 13 00158 g001
Figure 2. Study area.
Ijgi 13 00158 g002
Figure 3. Oil Palm Ripe image classification methods: (a) machine learning using four algorithms (b) deep learning.
Ijgi 13 00158 g003
Figure 4. Use case diagram.
Ijgi 13 00158 g004
Figure 5. Workflow of proposed platform.
Ijgi 13 00158 g005
Figure 6. Model Evaluation Comparison: (a) Accuracy, (b) F-measure, (c) Precision, and (d) Recall.
Ijgi 13 00158 g006
Figure 7. Confusion matrix diagram of training data.
Ijgi 13 00158 g007
Figure 8. Confusion matrix diagram of validation data.
Ijgi 13 00158 g008
Figure 9. Results of Oil Palm Bunch Ripeness Classification.
Ijgi 13 00158 g009
Figure 10. (a,b) Example of misclassified images.
Ijgi 13 00158 g010
Figure 11. User registration and login interface.
Ijgi 13 00158 g011
Figure 12. Oil palm plantation data manipulation interface.
Ijgi 13 00158 g012
Figure 13. Oil palm plantation locations mapping from crowdsourcing.
Ijgi 13 00158 g013
Figure 14. Results of classifying images of ripe oil palm bunches.
Ijgi 13 00158 g014
Figure 15. Results of classifying images of unripe oil palm bunches.
Ijgi 13 00158 g015
Figure 16. Geotagging image.
Ijgi 13 00158 g016
Figure 17. Ripe oil palm bunches with Geotagging image.
Ijgi 13 00158 g017
Figure 18. Unripe oil palm bunches with Geotagging image.
Ijgi 13 00158 g018
Table 1. Data and data source.
DataTypeData SourceProcessing Method
Google Satellite MapSpatial dataGoogleAPI
Google MapSpatial dataGoogleAPI
Oil Palm Plantation LocationSpatial and Attribute dataCrowdsourceGeospatial Analysis
Oil Palm Bunch ImagesImageCrowdsourceGeotag, Deep Learning
Oil Palm Plantation MapSpatial DataGEE Data CatalogAPI
Table 2. Training parameter detail.
AlgorithmsEpoch/Iteration/OtherLearning RateKernel/Activation/OtherImage Embedding
CNNEpoch = 100, Batch Size = 320.01RELU-
RFNumber of Tree = 100.01-InceptionV3
DTMaximum Tree = 1000.01Induce binary treeInceptionV3
KNNNumber of neighbors = 5-Euclidean/UniformInceptionV3
InceptionV3
SVMIteration = 1000.01RBFInceptionV3
Table 3. Evaluation equations.
Evaluation MethodEquationRemark
Accuracy(TP + TN)/(TP + TN + FP + FN)TP is True Positive
F-measure(2*Precision*Recall)/(Precision + Recall)TN is True Negative
Precision(TP/(TP + FP))FP is False Positive
Recall(TP/(TP + FN))FN is False Negative
Table 4. The evaluation of the model’s accuracy.
AlgorithmsAccuracyF-MeasurePrecisionRecall
CNN99.8999.8899.9099.85
RF99.2499.1699.4098.93
DT96.8496.5597.3395.78
KNN92.4491.3993.9888.94
SVM72.0774.0964.2187.56
Table 5. The evaluation of the model’s accuracy (SqueezeNet Embedding).
AlgorithmsAccuracyF-MeasurePrecisionRecall
RF99.1699.0798.7599.40
DT97.8097.6097.8397.37
KNN91.1489.9987.3692.28
SVM81.0078.0273.9382.59
Disclaimer/Publisher’s Note: The statements, opinions and data contained in all publications are solely those of the individual author(s) and contributor(s) and not of MDPI and/or the editor(s). MDPI and/or the editor(s) disclaim responsibility for any injury to people or property resulting from any ideas, methods, instructions or products referred to in the content.