Abstract
Safety from crime is a fundamental human need. In Maslow’s hierarchy, safety is one of the foundational needs of well-being. The built environment should be safe to use at all times of the day and for all groups of people. After dark, the appearance of the outdoor environment changes dramatically, and this could impact the opportunities for crime. This study investigated the impact of daylight on the rates of different types of crime by comparing the crime rates during selected periods of daylight and darkness. The study used records of crime data from the Metropolitan Police Service. By studying crimes in the week on either side of the twice-yearly clock change, it is possible to compare periods that are dark in one week and light in the other at the same clock time. Where the time at which the crime took place was known, and using the GPS coordinates of the specific crime, the solar altitude was calculated and used to determine if it was light or dark at the time of the crime. A similar calculation was used to see if the crime would have been in the dark or light in the week on the other side of the clock change. The headline result is that there was 4.8% (OR 1.07) more crime in the dark periods than the light ones. However, this increase was not uniform across all crime types, and there were some further complications in some results due to potential changes in the behavior of some victims after dark. For the crimes of theft from a person and robbery of personal property, there was a significant increase during the dark period. The availability of light had an impact on the rate of certain crimes. Whilst this does not provide any information about the impact of street lighting on crime, it does provide some idea of by how much crime could be reduced if better lighting was provided.
1. Introduction
Safety from crime is important for well-being and mental and physical health. However, environmental conditions such as darkness can cause fear of crime [1]. Whether this fear is founded in reality and supported by real crime data has yet to be conclusively determined. The importance of safety from crime is reinforced by the United Nations in their sustainable development goal to provide a peaceful and safe built environment for all citizens [2]. Features of the physical environment can have an impact on the opportunity for crime. For example, Jacobs [3] claimed that most new residential projects could cause a rise in crime and less safe streets and parks by isolating citizens from the streets and local businesses. In the book “The Death and Life of Great American Cities” she criticizes the construction of high-density social housing projects and the design of streets for car use in the USA, which began in the 1950s, forcing people to live in more unsafe and dangerous places. Jacobs [3] also claims that the presence of other people might increase surveillance of potential criminals by providing “eyes on the street”. Welsh et al. [4] support Jacob’s concept of surveillance. For example, they state that removing objects which prevent the clear sight of the windows of homes and stores enhances surveillance. Clarke, R.V. [5] explained three ways that surveillance deters offenders. Firstly, formal surveillance includes security guards and CCTV cameras, which increase the chance that offenders are seen. Secondly, place managers who are in the environment due to their duties, not for security matters, such as bus drivers, city council employees, and parking lot attendants, might act as deterrents. Lastly, natural surveillance observers are citizens who use the built environment as part of their daily routines and could also help deter offenders. Newman [6] claimed that improved street lighting as part of an enhanced built environment is also part of natural surveillance. Street lighting is important because it enables pedestrians to see other people after dark.
The problem is that lighting designers need to know how to use lighting design to contribute to the safety of the environment. However, this is difficult when there is very little convincing evidence that lighting affects crime. The research presented by this paper presents evidence that some outdoor crimes are affected by ambient lighting conditions (whether it is light or dark). This means that light does matter to the incidence of crime and that the impact of electric lighting conditions on crime should be investigated in future work. If whether it is light or dark matters to crime, then it is likely that lighting design could also have an effect. It is also proposed that this be explored for future work.
2. Literature Review
There are many complex reasons that cause someone to commit a crime. These reasons are multi-faceted, and it is impossible to provide all of them in this paper. This paper focuses on the possible influence of the built environment. However, factors such as population density and seasonal or one-off events such as widespread protesting and looting can also encourage crime. For example, after Mark Duggan was killed by a police officer in London, riots between 6 and 11 August 2011 caused looting and arson in London, which later spread across England [7]. Some types of crime may also be related to seasonal differences. Andresen, M. A., and Malleson, N. [8] examined crime records in Vancouver (Canada) in 2001 based on seasonal differences. While there are exceptions, the summer season tended to see a rise in crime across several categories, including all crimes, assault, theft, theft from vehicles, and theft of vehicles. However, other crimes, such as burglary, robbery, and sexual assault, did not display a significant seasonal pattern. Another study by Shiode et al. [9] observed 12 crime types which took place in London between 2013 and 2020. While burglary and thefts from the person peak in winter, especially in November, non-property crimes such as bicycle theft and antisocial behavior peak in the summer.
The built environment, for example, the morphology of streets, also plays a key role in mitigating fear of crime. Three main aspects, prospect, escape, and concealment, affect the fear of crime and people’s perceived safety in the outdoor environment [10,11]. For example, wide-open streets with escape routes reassure people more than narrow streets with limited escape routes. Zigzag paths, sharp edges on the turning points, and hedges on paths in the outdoor environment make it possible for criminals to hide [6] (p. 82). Boyce and Gutkowski [12] asserted that crime could also be related to the travel time and accessibility of locations where criminals tend to commit crimes; therefore, street lighting may not be enough to prevent crimes. For example, criminals might commit a crime in places that are easy to access, hide, and run away from, regardless of lighting conditions.
Other than the elements outlined above, the role of lighting conditions on crime and the fear of crime cannot be underestimated. Darkness could cause crime opportunities and encourage criminals to commit crimes. Using the 1992 British Crime Survey, Mayhew et al. [13] observed that most violent crimes take place in public places between 6:00 pm and midnight. According to the British Standard Institution [14], road lighting helps in tackling crime and the fear of crime. Combating crime by utilizing street lighting goes back to the date 16th Century. At the end of the 16th Century, Paris established street lighting under the control of the police administration. Police administration lighted Paris’s streets from the end of October to the beginning of April after 6 pm [15]. Upgrading street lighting is assumed to be a significant environmental factor in tackling crime [16]; however, convincing evidence is rare. Welsh and Farrington [17] also state that improved lighting can reduce crime. In past studies, improved lighting was generally defined as illuminating an environment that was not lit before or increasing the level of illuminance where it was already lit. One of the earlier studies by Wright et al. [18] found that replacing light sources to provide higher illuminance can decrease crime rates in high-level crime streets. The study examined the crime rates in commercial and residential areas in Missouri and Kansas Cities between 1970 and 1973, where incandescent lamps (20–23 lumens per watt) were replaced with mercury (40–55 lumens per watt) and sodium vapor (100–130 lumens per watt) lamps. The findings showed that the incidence of violence, such as robbery and assault, decreased significantly in residential and commercial areas with upgraded street lighting.
Instead of looking at larger areas, such as Wright et al. [18], Painter [19] focused on a particular location (in Edmonton), outer London. Light sources were changed from LPS (Low-Pressure Sodium) to HPS (High-Pressure Sodium), which increased the level of illuminance from 0.6–4.5 lx to 6–25 lx on the selected streets. A survey asked about people’s experiences of crime and fear of crime on the streets before and after the lighting was upgraded, with reference to the following outdoor crime types: violence against people (robbery, physical and sexual offenses, theft), vehicle offenses, and harassment. On-the-street surveys asking about pedestrians’ direct experiences of street crimes were conducted immediately before and 6 weeks after the lighting installation. The question referred to a specific 6-week time period prior to the installation and a 6-week time period after the installation. They reported that 21 of 207 people had experienced crime before the lighting installation. This was in the categories of violence against the person (4), vehicle crime (12), and harassment on the street (5). After the lighting installation, only three crime incidents were reported: vehicle crime (2) and harassment on the street (1). This suggests a reduction in crime in the 6 weeks after lighting change. In addition, the installation seemed to affect perceived safety, as shown in a follow-up after the installation survey of 153 individuals: 62% responded that they felt safer, 3% of participants felt less safe, 4% of participants said “do not know”, and 31% of participants said there was no change in their perceived safety. The questionnaire did not ask questions directly related to lighting to the participants (153 + 207 = 360). This is useful in contributing to avoiding bias related to socially desirable responses, in which participants could be included to say that lighting improves safety. The study asked participants’ feelings about going out after dark, and also whether there were changes in their perception during the 6 weeks. Of the 360 participants in total, only 105 noticed that the lighting had been changed. Only these 105 participants who noticed the changes made to lighting were asked more questions about the lighting. For example, they were asked whether the new lighting was brighter or more attractive. When the questionnaire asked 105 participants about lighting issues, the participants might have understood that this study was related to lighting improvement. That may cause bias and affect participants’ perceptions. In addition, we do not know the effect of the fact that participants lived in the same or nearby apartment blocks. Painter [19] also used the Edmonton Police records between January–March 1987 and 1988 in her study. Interestingly, police records of violence against the person increased post-lighting installation by 77% compared to the same time period the year before, whereas autocrime for the same period went down by around 6%. That result might show that reported crime could increase post-lighting installation because people could see what is happening more clearly and could, therefore, report it.
However, Nair and Ditton [20] claimed that the impact of improved lighting on crime prevention might not last in the long term. The upgrading of lighting in Bellgrove and High Blantyre indicated significant improvement in 3 months; however, this effect was not evident in interviews conducted over a year later. In addition, not all studies have found a link between lighting and crime. For example, Welsh and Farrington [17] found that despite the overall reduction in crime rates by 21% after improved street lighting, there was an increase in 3 out of 13 studies on crime rates after upgraded street lighting. Painter [21] observed the impact of upgrading the lighting in three residential high-rise buildings that are surrounded by smaller residential buildings on the West Park Estate, Ashton Under Lyne, using surveys and police records. A total of 197 households were interviewed before and after the upgrading of the lighting was completed. Of the 197 households, 65% of the residents who participated were the same people surveyed both before and after the upgrade. Although both surveys and police records demonstrate an overall decrease in the level of crime after improving the lighting, in the survey, it was reported that while the incidents of theft from vehicles increased from 5 to 15 with a 200% rise, and incidents of public physical assault increased from 9 to 19 by 89% after 12 months post-lighting installation. However, the study does not include repeated measurements beyond a year. For example, crime counts might be affected by different seasons, but this is hard to determine due to the study being confined to winter. Comparing winter and winter either side of the year is a more efficient approach than comparing autumn and winter in the same year. Additionally, if the policy for the recording of crimes by police changed during the year, the results might not be clear. For instance, the number of burglaries was 22 in 1989 before the upgrading of the lighting, and 24 in 1990 after the upgrade. However, the incident of burglaries in police records dramatically decreased to zero.
Steinbach et al. [22] observed crime records using police data in which four changes to street lighting were applied in 62 locations provided by city councils between 2010 and 2013. Firstly, the study explored crime records when street lighting was switched off; secondly, when the lighting was on for part-night only; for example, the lighting was switched off after midnight. Thirdly, when the street lighting was dimmed, and lastly, when sodium light sources were replaced with whiter light LED sources. The study found that switching off (RR 0.11; 95% CI 0.01 to 2.75)and part-night (RR 0.96; 95% CI 0.86 to 1.06) approaches did not affect the crime rates, whereas white light (RR 0.89; 95% CI 0.77 to 1.03) and dimming lighting (RR 0.84; 95% CI 0.70 to 1.02) had a small impact on reducing risk rates. Additionally, the study found that part-night lighting (RR 1.48; 95% CI 0.99 to 2.21) may increase the risk of robbery, whereas dimming (RR 0.78; 95% CI 0.60 to 1.01) may decrease the risk of violence. White lighting may decrease the risk of all types of crimes (robbery, burglary, vehicle, violence, aggregate). However, these results need to be approached cautiously as local authorities are unlikely to randomly allocate part-night lighting. The problem is that the grounds for selecting the areas to be switched off or to undergo lighting changes are unknown. It is possible that low crime rates could have played an important role in the local authorities’ choices. In addition, the study did not present the changes in the locations adjacent to the case studies. Therefore, the crime might have been displaced to the adjacent streets.
Peng et al. [23] also claimed that night-time light brightness can increase criminal arrest and prosecution rates. They investigated the correlation between the brightness of night-time lighting and the crime rate in China between 2000 and 2013. By using 1 km × 1 km grids in 227 cities using the Defense Meteorological Satellite Program (DMSP), 70% of all crime records, including homicide, robbery, and theft in the China City Statistical Yearbook, were tested. Other crime types, such as rape and arson, were excluded due to a lack of information in the dataset. The study found that a 1% increase in brightness resulted in higher crime rates in bright areas; the crime rates were found to be higher in developed cities such as Shanghai, Beijing, Foshan, and Guangzhou compared to rural areas. However, the effect of the rise in crime rates was not significant.
Another approach is to compare crimes in daylight and darkness because ambient lighting conditions could help us understand whether lighting affects crime rates. Unwin et al. [24], emphasized the importance of first exploring the effects of large-scale ambient lighting conditions before honing in on optimum electric lighting conditions as if the behavior is not affected by the former, then fine-tuning the latter might be a moot point in terms of its effect on pedestrian flows. Investigating the impact of the change in ambient lighting conditions can also provide a wide perspective on the impact of lighting on crime. If ambient light does not make a difference, variations in electric lighting conditions are less likely to matter as they are more subtle than the change from daylight to dark.
Examining crime reports using ambient lighting conditions over many years of clock changes helps reduce the effects of public bias caused by media, which can have more of an influence in the short term before and after lighting installation studies. For example, the news in South Yorkshire Times [25], “Kids Make Town A ‘Living Hell’” in the local newspapers, negatively affected Raynham and Mansfield’s [26] study, as the headline appeared after a lighting upgrade and was likely to have affected the survey results. Two sites had 35 street lights replaced and 80 new luminaires installed. Over 3500 visitors were interviewed before and after re-lighting. Two types of surveys targeted at local businesses and pedestrians in Swinton were carried out before and after re-lighting part of the town center. After the re-lighting installation, although there was a slight increase in the town center’s night visits, visitors responded that lighting alone is not enough to make streets attractive at night. They still did not feel safe because of young people, graffiti, and vandalism. Additionally, local businesses responded that there was no significant change in their perceived safety and business performance. Moreover, business owners reported that the street lighting improvements actually worsened youth nuisance by encouraging larger gangs to gather.
Ambient lighting (light/dark) depends on the time of the day. Most previous studies, such as Sullivan et al. [27], Uttley and Fotios [28], and Ferguson et al. [29], did not correctly define light, dark, or twilight conditions when they calculated daylight availability using this approach. This uncertainty might cause some miscalculations and a lack of robust analysis. For example, the twilight period was counted as dark in Fergusen et al.’s [29] work on motor vehicle crashes; however, during this period, there was a significant probability that illuminance was anywhere in the range of 10–140 lux. Muneer T. and Kambezidis H. [30] described twilight using three different levels of solar altitude. When the sun’s altitude was between 0° and −6°, −6° and −12°, and −12° and −18°, it was defined as civil twilight, nautical twilight, and astronomical twilight, respectively. Raynham et al. [31] developed a method which categorized daylight to be when the sun has an altitude of greater than 0° and darkness when solar altitude is less than −6° in their study on traffic collisions. This approach removed the uncertainty associated with twilight. The method was also later applied by Fotios and Robbins, C. [32], and Fotios et al. [33] in road collision and crime studies.
Using the spring and autumn clock changes can provide a reliable approach to understanding the impact of lighting on crime because a given time may be light one week and dark in the other and can, therefore, be compared. Some studies use this method, for example, Sullivan et al. [27], Unwin et al. [24], Umbach et al. [34], Raynham et al. [31], and Tealde, E. [35]. Umbach et al. [34] investigated the effect of the mild, short-term sleep loss/gain due to Daylight Saving time on assault rates in Chicago, New York, Philadelphia, and Los Angeles between 2001 and 2014. According to a study, there was a 2.9% decrease in assaults right after Daylight Saving Time (DST) began in spring, when we lost an hour of sleep, compared to a week later. On the other hand, there was an increase of 2.8% in assaults immediately following the return to standard time in autumn, when an hour was gained, compared to a week later. The study showed that mild and short-term changes in sleep can significantly reduce/increase the rates of assault. The study implies that mild sleepiness, which is possibly associated with an hour’s loss of sleep, could result in reduced assaults. Between 2004 and 2014, Tealde, E. [35] conducted a study in Montevideo, Uruguay that analyzed geolocated data on crime and public lighting. The study found that DST (Daylight Saving Time) resulted in a significant decrease of 17% in robberies. The decrease was even larger during sunset hours, up to 23%.
However, even research using specific time windows can have problems. For example, Fotios et al. [33] used the clock change method to analyze reports of crime in the U.S. from 2010 and 2019. This study found a significant rise in robbery in the dark. According to the findings, it appears that when it is dark, incidents of arson and loitering during curfew tend to rise, while cases of disorderly conduct, non-violent family offenses, and prostitution tend to decrease. The problem was that as the database used the Crime Open Database [36], which only contains dates and times that crimes were reported, rather than when they occurred, it was not possible to determine with certainty whether the crime took place in light or dark. This is because many crimes are only discovered sometime after the crime took place. Thus, it is not possible to determine if the crime took place in light or dark. In addition, all crimes cannot be limited to one specific time. For example, prostitution does not take place at a single set time. Therefore, the database might cause inaccuracy in the findings.
In summary, there are limited studies about the impact of ambient lighting conditions on crime counts, and the studies which do exist fail to measure daylight availability accurately and are unclear about the exact time window in which crime took place. In order to answer the main question, “Do ambient lighting conditions (daylight or darkness) affect crime occurrence?” this paper uses a precise calculation of the solar altitude at the time the crime took place and only uses crimes where the time was known to have taken place within a window of 5 mins or less.
The aim of the study is to examine whether there is a relationship between ambient lighting outdoors and crimes where the time is known to within 5 min. As our paper discusses, most of the approaches used before have limitations. Our research aims to find different approaches to the lighting design of external urban environments that could matter, could reduce crime, and would be worth exploring further.
To address this aim, we define four hypotheses:
- There are seasonal differences in the effects of light and dark on crime. In autumn, we would expect a bigger difference compared to spring due to the onset of darkness.
- Crime rates vary within the day (24 h period).
- If light has an impact on crime, then crime at night/dark should be different from crime during the day/light.
- Light and dark impact crime types differently. For example, outdoor crimes such as robbery and theft increase after dark, whereas other crime types do not.
This paper uses data from Metropolitan Police Services (MPS), which provides a time window in which each crime took place. By using this data, the study applied the precise clock change calculation method to assess changes in crime between light and dark.
3. Methodology
The study uses a quantitative method by using the Metropolitan Police Service (MPS) dataset of 4,790,048 crime reports that have taken place in London between 1 January 2013 and 31 August 2019. All analyses were done securely in the Jill Dando Institute Research Lab (JDIRL), which cooperates with MPS. The MPS dataset in the JDIRL [37] includes the following details (Table 1).

Table 1.
Dictionary of MPS data.
The study includes 55 crime types. The major crime types in the MPS dataset are described in Table 2, according to the Metropolitan Police Office [38].
Table 2.
Definition of crimes according to MPS.
Due to the massive amount of data and complexity of the data, this research used automated data analysis, using Python and Excel tools, and then presented the results. To reach the most reliable results in the analysis, the time accuracy of data plays a key role. Therefore, before beginning the analysis, the study cleaned up the potential errors with regard to time. 61,757 of 4,790,048 crime records were removed from the analysis where the date information contained anomalies or was void. Examples of anomalies are the crime being reported before it occurred, mistakes in data entry such as the boundaries of the time window being the wrong way around, and some crimes not being recorded fully. For example, if there was no “time committed from” data, the record was deleted from the analysis. To summarize, the below instructions were used:
Time Crime Recorded ≥ Time Crime Reported
- If Time Committed To not void, then
Time Committed To ≥ Time Committed From
- Else
Time Crime Reported ≥ Time Committed From
Also, Time Committed From + 365 days ≥ Time Crime Recorded.
The method of the study is described in the flow chart below, which shows the process step by step (Figure 1).
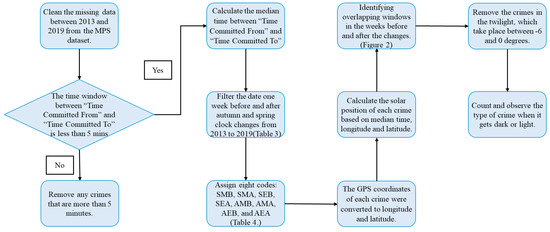
Figure 1.
Flow chart of the study. Missing data refers to the lack of or incorrect information in the dataset. For example, the time committed column was empty or the type of crime was written in the time column. GPS coordinates refer to the British National Grid reference numbers.
Knowing the precise time that the crime happened is essential for accurate filtering of the data. Crimes which could have taken place in longer time periods are not useful for analysis. For example, a victim can be aware of a burglary after waking up or coming home from work, which does not provide accurate information about the time the crime occurred. For most crimes, the exact time is not known; the MPS dataset provides a window between “Time committed from” and “Time committed to” during which the crime is likely to have occurred. As this study depends on knowing if it was light or dark at the time the crime took place, only crimes where the time is known within 5 min were included. A total of 4,728,291 crimes were analyzed. To calculate solar altitude, a precise time is required. Therefore, following filtering the data by the 5 min window criteria, 2,145,398 of 4,728,921 crimes were used, which corresponds to 45.4% of the dataset. The median time of “Time Committed From” and “Time Committed To” was taken into consideration while calculating the solar position. The observing clock change time method was adopted as Unwin et al. [24] did. Therefore, the first step of the study is to define the interest of periods, which are four time periods, the week before and after spring and autumn clock changes (Table 3).
Table 3.
Spring and autumn clock changes within the weeks and years of interest.
The second step was to assign eight periods to these weeks when there was a change between light and dark for the same time (Table 4). The process enabled us to compare the crime rates based on seasons, days and time slots in a day, and the solar position of crime based on time and location.
Table 4.
Assign codes for interested weeks.
After filtering the data according to the time accuracy of the record (crime time known to within 5 min), the study compared crime rates in daylight and darkness. Raynham et al. [31] stated that solar altitude would provide an accurate and innovative method for understanding daylight availability. The solar altitude of crimes in the MPS dataset was calculated using the National Atmospheric Administration (NOAA) [39] method and Astral Anaconda and Geopanda Python Library [40]. The MPS dataset provides the location of each crime with an Easting and Northing coordinate used by the U.K. Ordinance Survey Mapping (British National Grid Reference). This was then converted into latitude and longitude for the calculation of solar altitude.
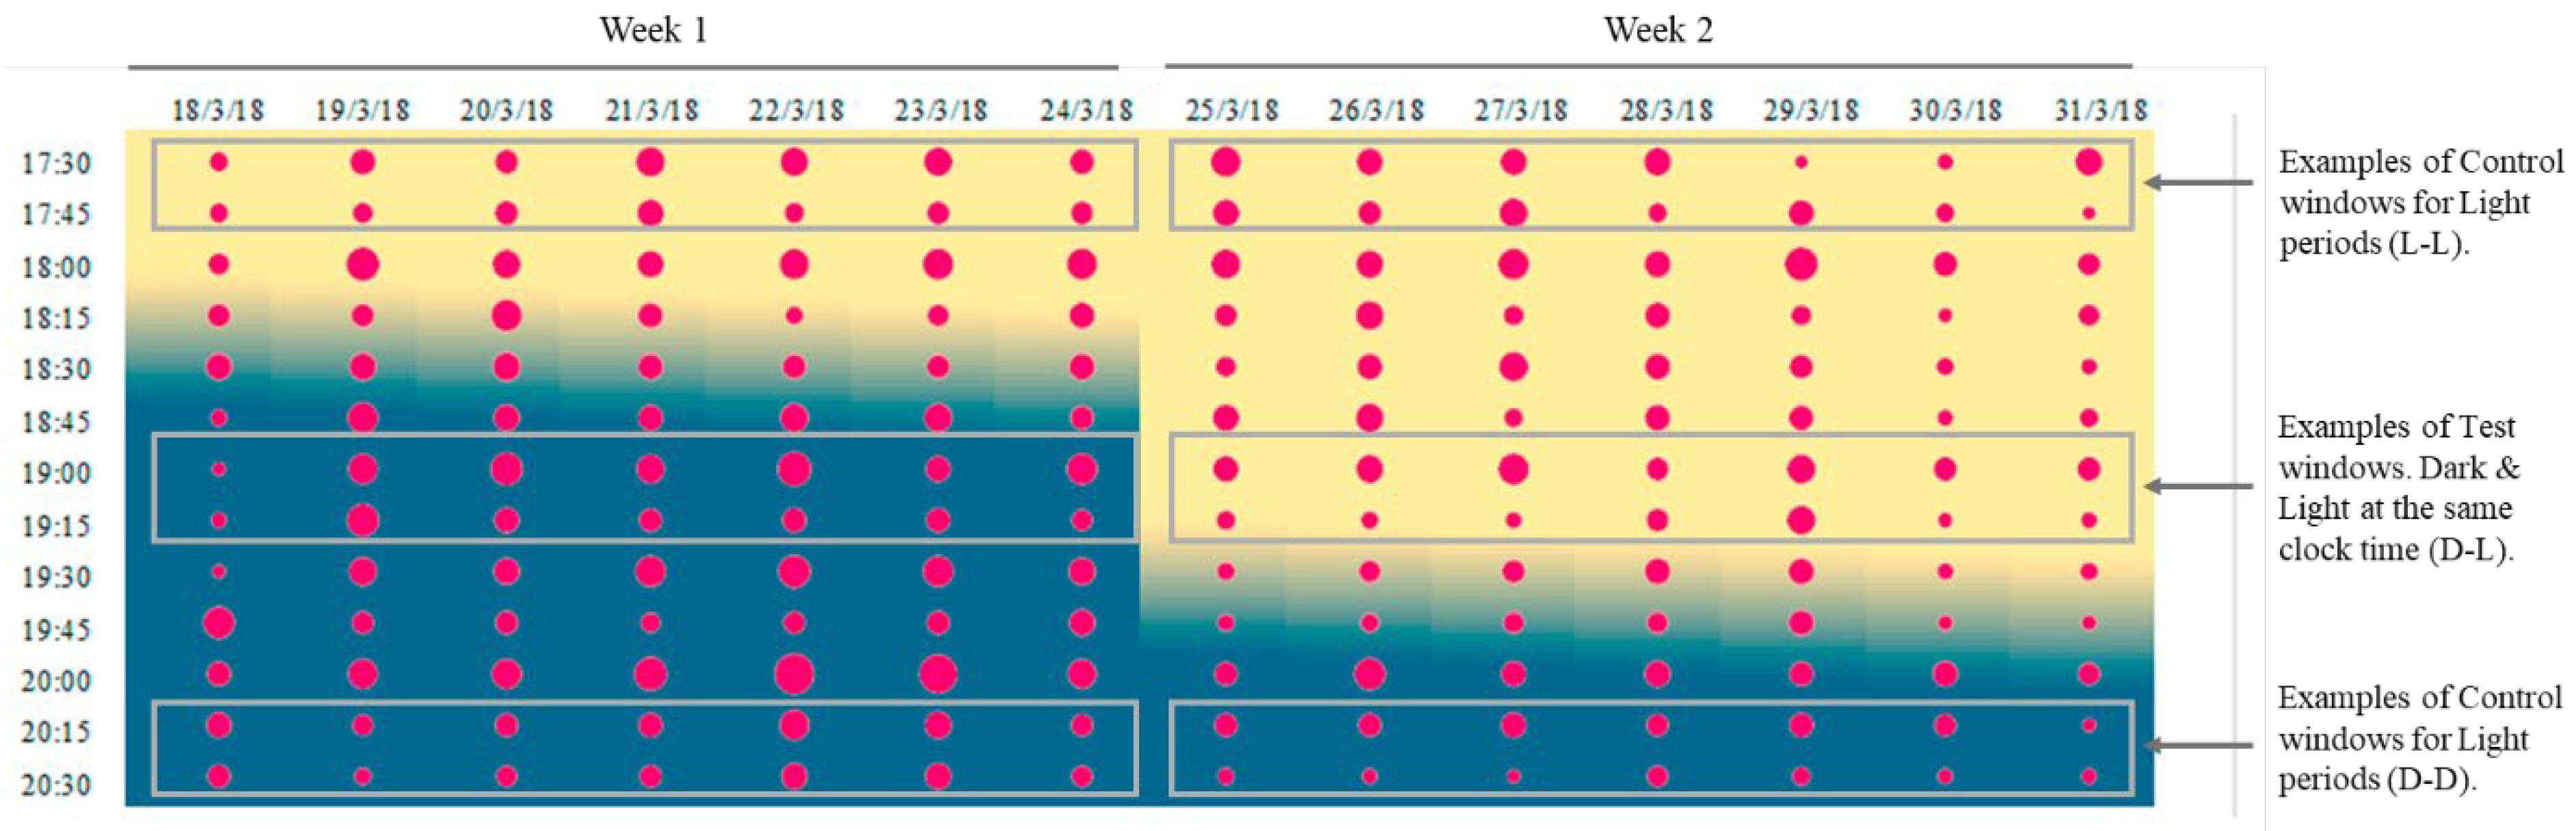
The twilight period can cause ambiguity in classifying dark and light conditions because the twilight period is variable, and it can still be daylight during this period. Illuminance over the twilight period was explored using a dataset consisting of over 1,600,000 records of illuminance made at 5 min intervals over 2 years in eight locations across the UK in previous research. All illuminance records were binned according to solar altitude. Analysis of illuminance percentiles revealed an illuminance of 10 lux at the 99th percentile at a solar altitude of −6 degrees and an illuminance of 50 lux at the first percentile at 0 degrees. This means that we can say with some certainty that it is dark at −6 degrees and light at 0 degrees. Local authorities tend to pick 30 lux as the threshold at which to turn street lighting on, so 50 lux is a safe estimate for conditions deemed daylit enough for street lighting not to be required. At −5 degrees, the 99th percentile value was 40 lux, and at 1 degree the first percentile value was 80 lux; these illuminance values do not provide enough certainty of darkness and daylight, which is why solar altitudes of −6 degrees and 0 degrees were used to define darkness and daylight [31]. Therefore, this study removed crimes which took place between −6 degrees and 0 degrees, which amounted to 7592 crimes in the weeks of interest. Crimes in the twilight period were added back into the dataset when the study reported crimes by the hour. Figure 2 gives an example (spring 2018) of the effect of the clock change, in this case from GMT (Greenwich Mean Time) to BST (British Summer Time), on daylight availability.

Figure 2.
Chart illustrating the change in light and dark times on either side of the spring clock change in 2018. Blue indicates dark, and yellow indicates light. In between dark and light is twilight.
The test period refers to the time window that is dark before the clock change and light after the clock change or vice versa the following week. It is possible that the change in the number of crimes during the week of daylight saving time was not solely due to the change in daylight. Therefore, “control” periods were used so that differences between them could also be compared, as there are other factors which could affect behavior, such as changes in weather, school holidays, and events (such as Easter). The number of crimes was tallied for each control period to ensure that other major factors were not influencing the results during the clock change periods.
Lastly, to assess findings in terms of the risk of crimes in darkness, the dark/light ratio of crime in the test period and control period were compared. The odds ratio calculation that Johansson et al. [41] used in their traffic casualties paper was used, and the following formula (Equation (1)) was applied to overall crime and the breakdown of crime types:
When an odds ratio is greater than 1, it demonstrates higher odds of more crimes occurring in the dark; an odds ratio of less than 1 indicates lower odds of crime in the dark. The p value of each finding was calculated using the Chi-Square test. 95% confidence intervals (CI) related to the odds ratio of the findings were calculated using the following steps of Fleiss et al. [42] and Shadish et al. [43]. A, B, C, and D are the estimates of risk that are given inversely proportional to their variance in the calculation of the estimates of risk based on the odds ratio. Equation (2) provides the logarithm of the odds ratio.
wi represents the statistical weight of each estimate, incorporating both the fixed-effects and random effects models. Equation (3).
To find the statistically weighted mean (ȳ), the potential outcomes of different scenarios in generalized estimating (g) were calculated with Equation (4).
95% CI of the weighted mean was calculated, according to Equation (5).
4. Results
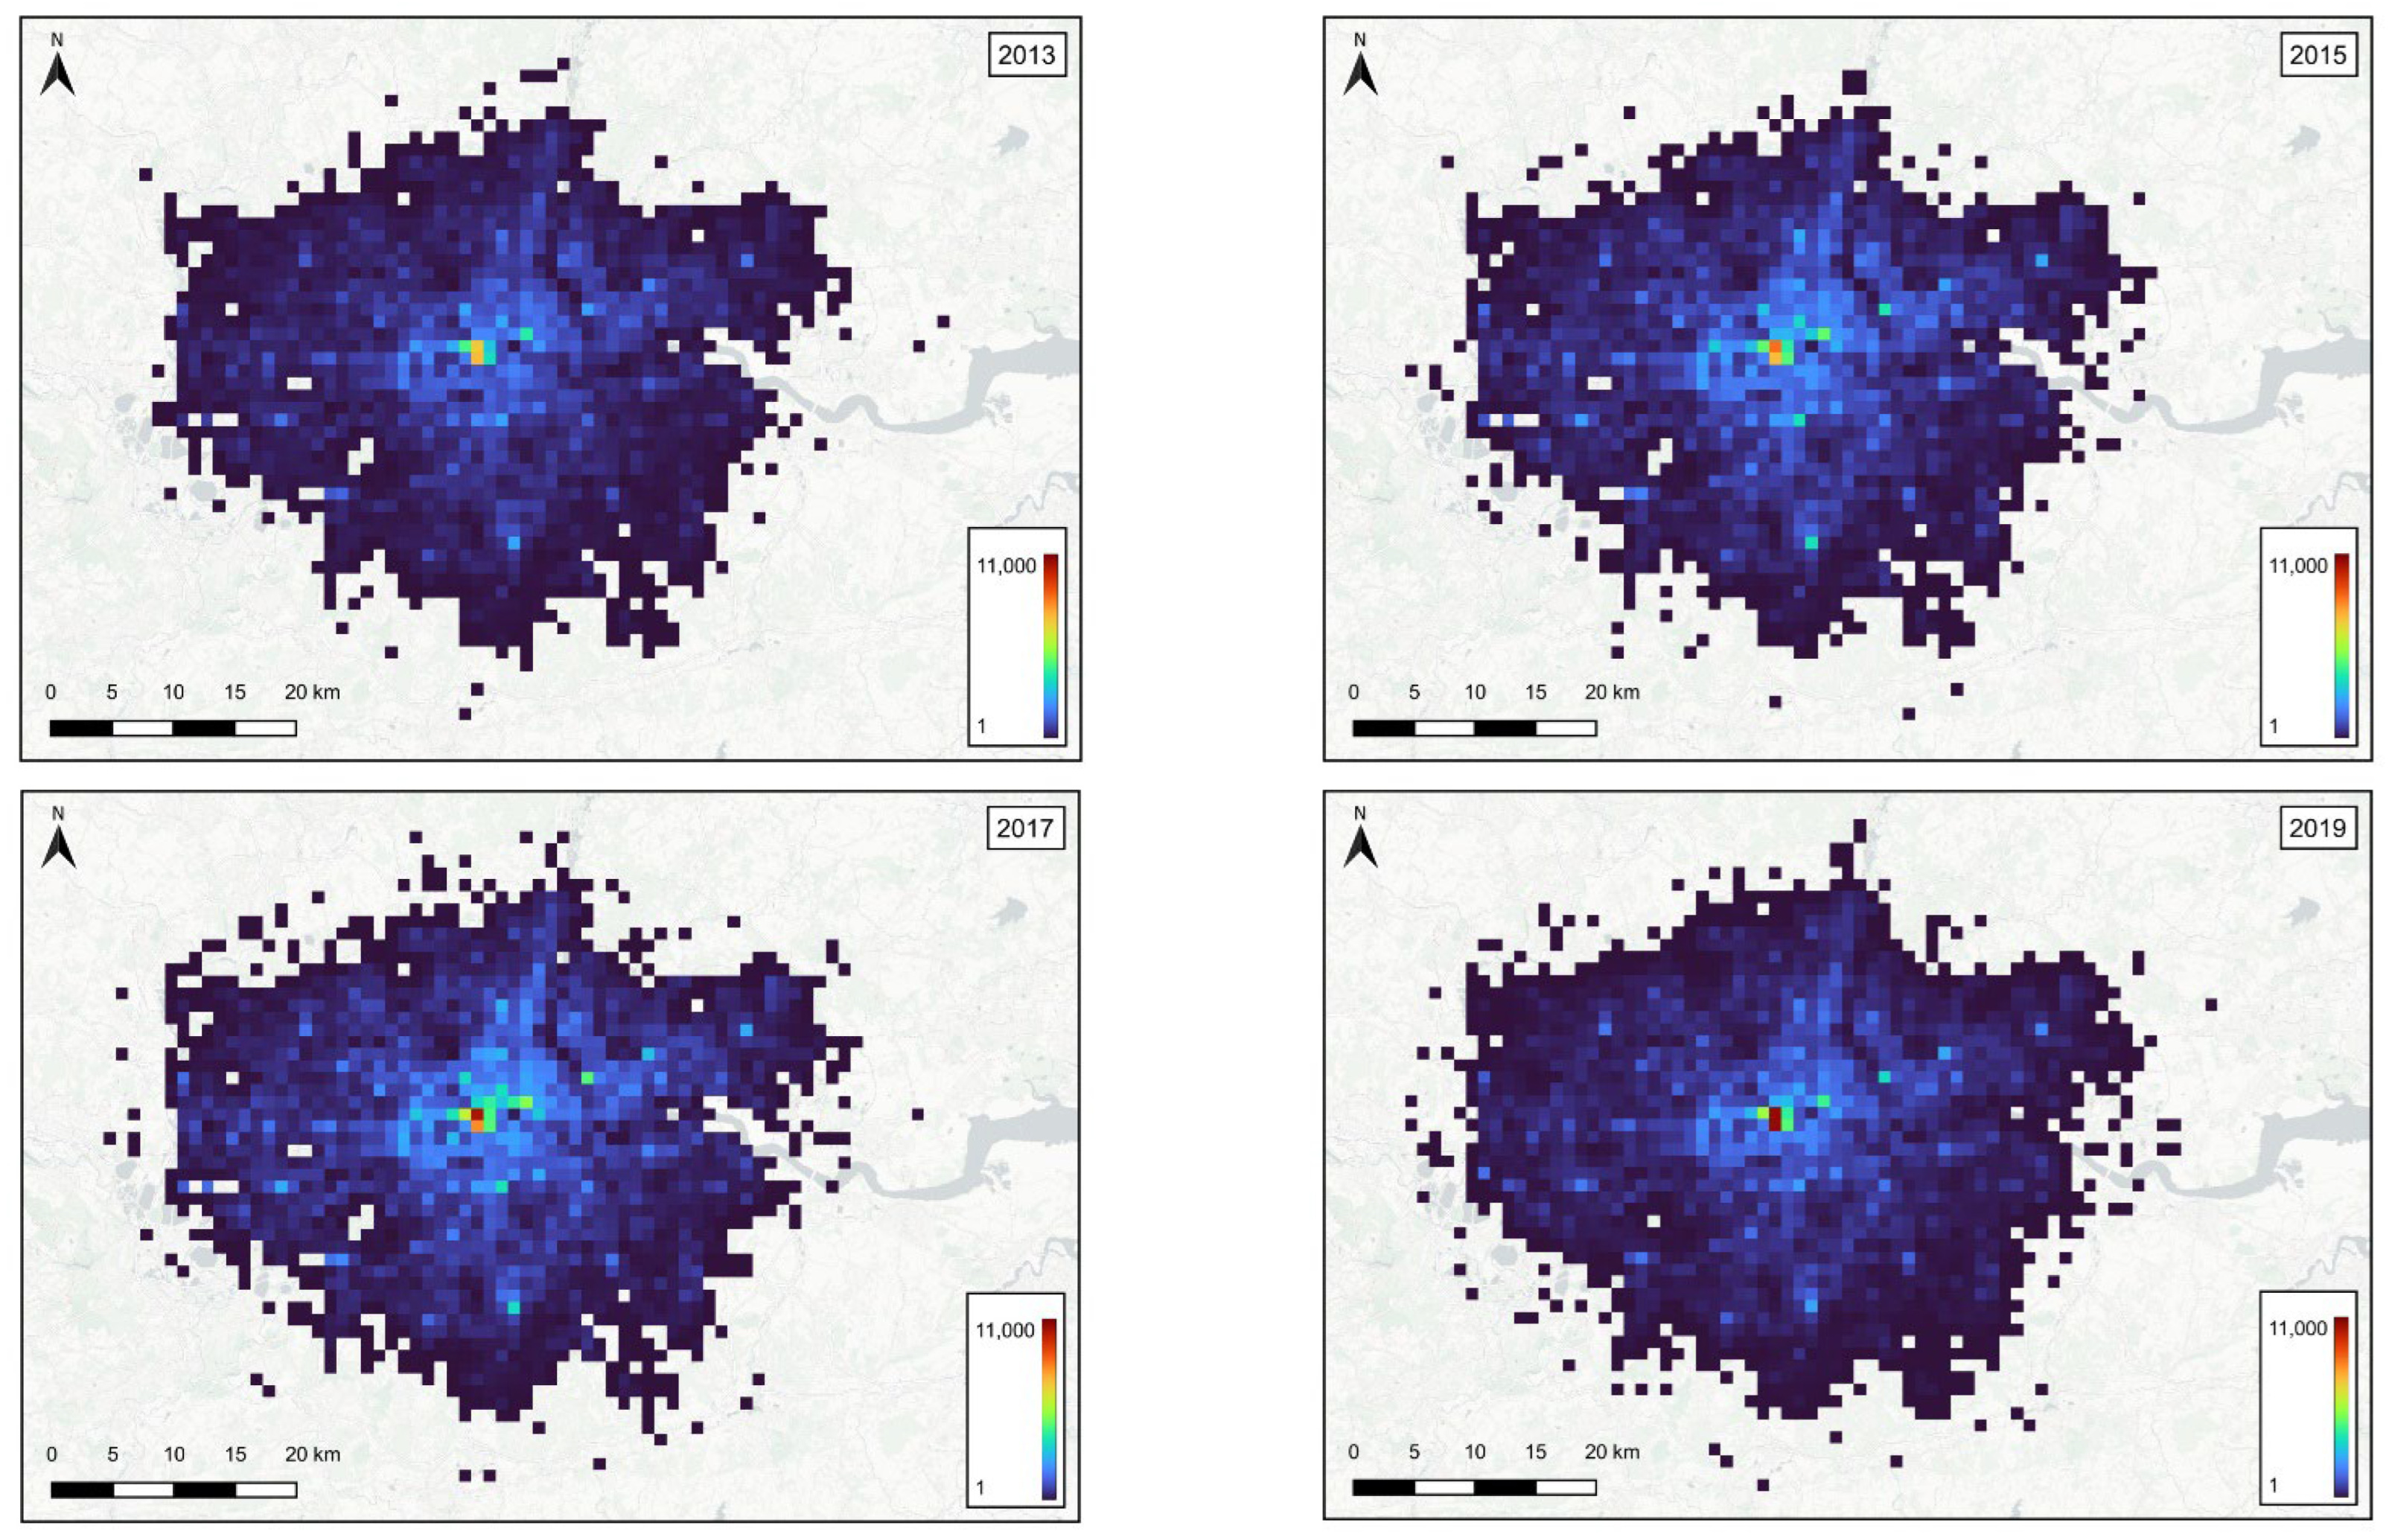
Each crime location was recorded using GPS coordinates from the Ordnance Survey National Grid, also known as the British National Grid reference system. Figure 3 demonstrates the overall distribution and density of all reported crimes, bi-yearly, in London between 2013 and 2019.
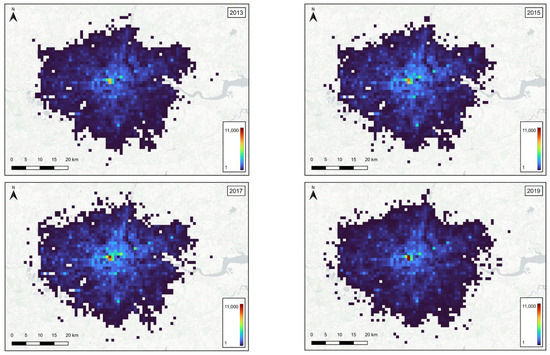
Figure 3.
Map of Greater London showing total reported crime distribution and density over time, using 2013, 2015, 2017, and 2019 as example years.
After calculating the solar position, some crimes were removed because there were not enough of them for ambient lighting conditions to be shown convincingly to have an effect. Therefore, crimes with less than 20,000 records were excluded, and 20 crime types were reported. Table 5 shows the number of crimes with their definitions and the percentages of the total dataset reported to within the 5 min crime window that occurred in the controlled time periods in which the crimes occurred in the dark one week before the clock change and in the light one week after the clock change or vice versa. The results demonstrated a 4.82% (OR 1.07) rise in overall crime rates in the dark.
Table 5.
The most common crimes listed with all others lumped together and the number of cases that occurred each week of interest from 2013 to 2019.
The findings show that there is an overall increase in total of 4.8% (OR 1.07). Table 6 demonstrates the crime types for which the change from light to dark (or vice versa) had the most effect. Vehicle offenses (theft or taking of a motor vehicle) and burglary-residential increased dramatically by 64% (OR 1.38) and 59% (1.59), while theft from a person, robbery, and arson, and criminal damage increased by 27% (OR 1.27), 18% (OR 1.29), and 14%(1.07), respectively. In contrast, possession of drugs decreased by 17% (0R 0.80).
Table 6.
Breakdown of highlighted crime types listed in Table 6 with the number of cases, odds ratio, 95% CI and p-values that occurred in each week of interest from 2013 to 2019.
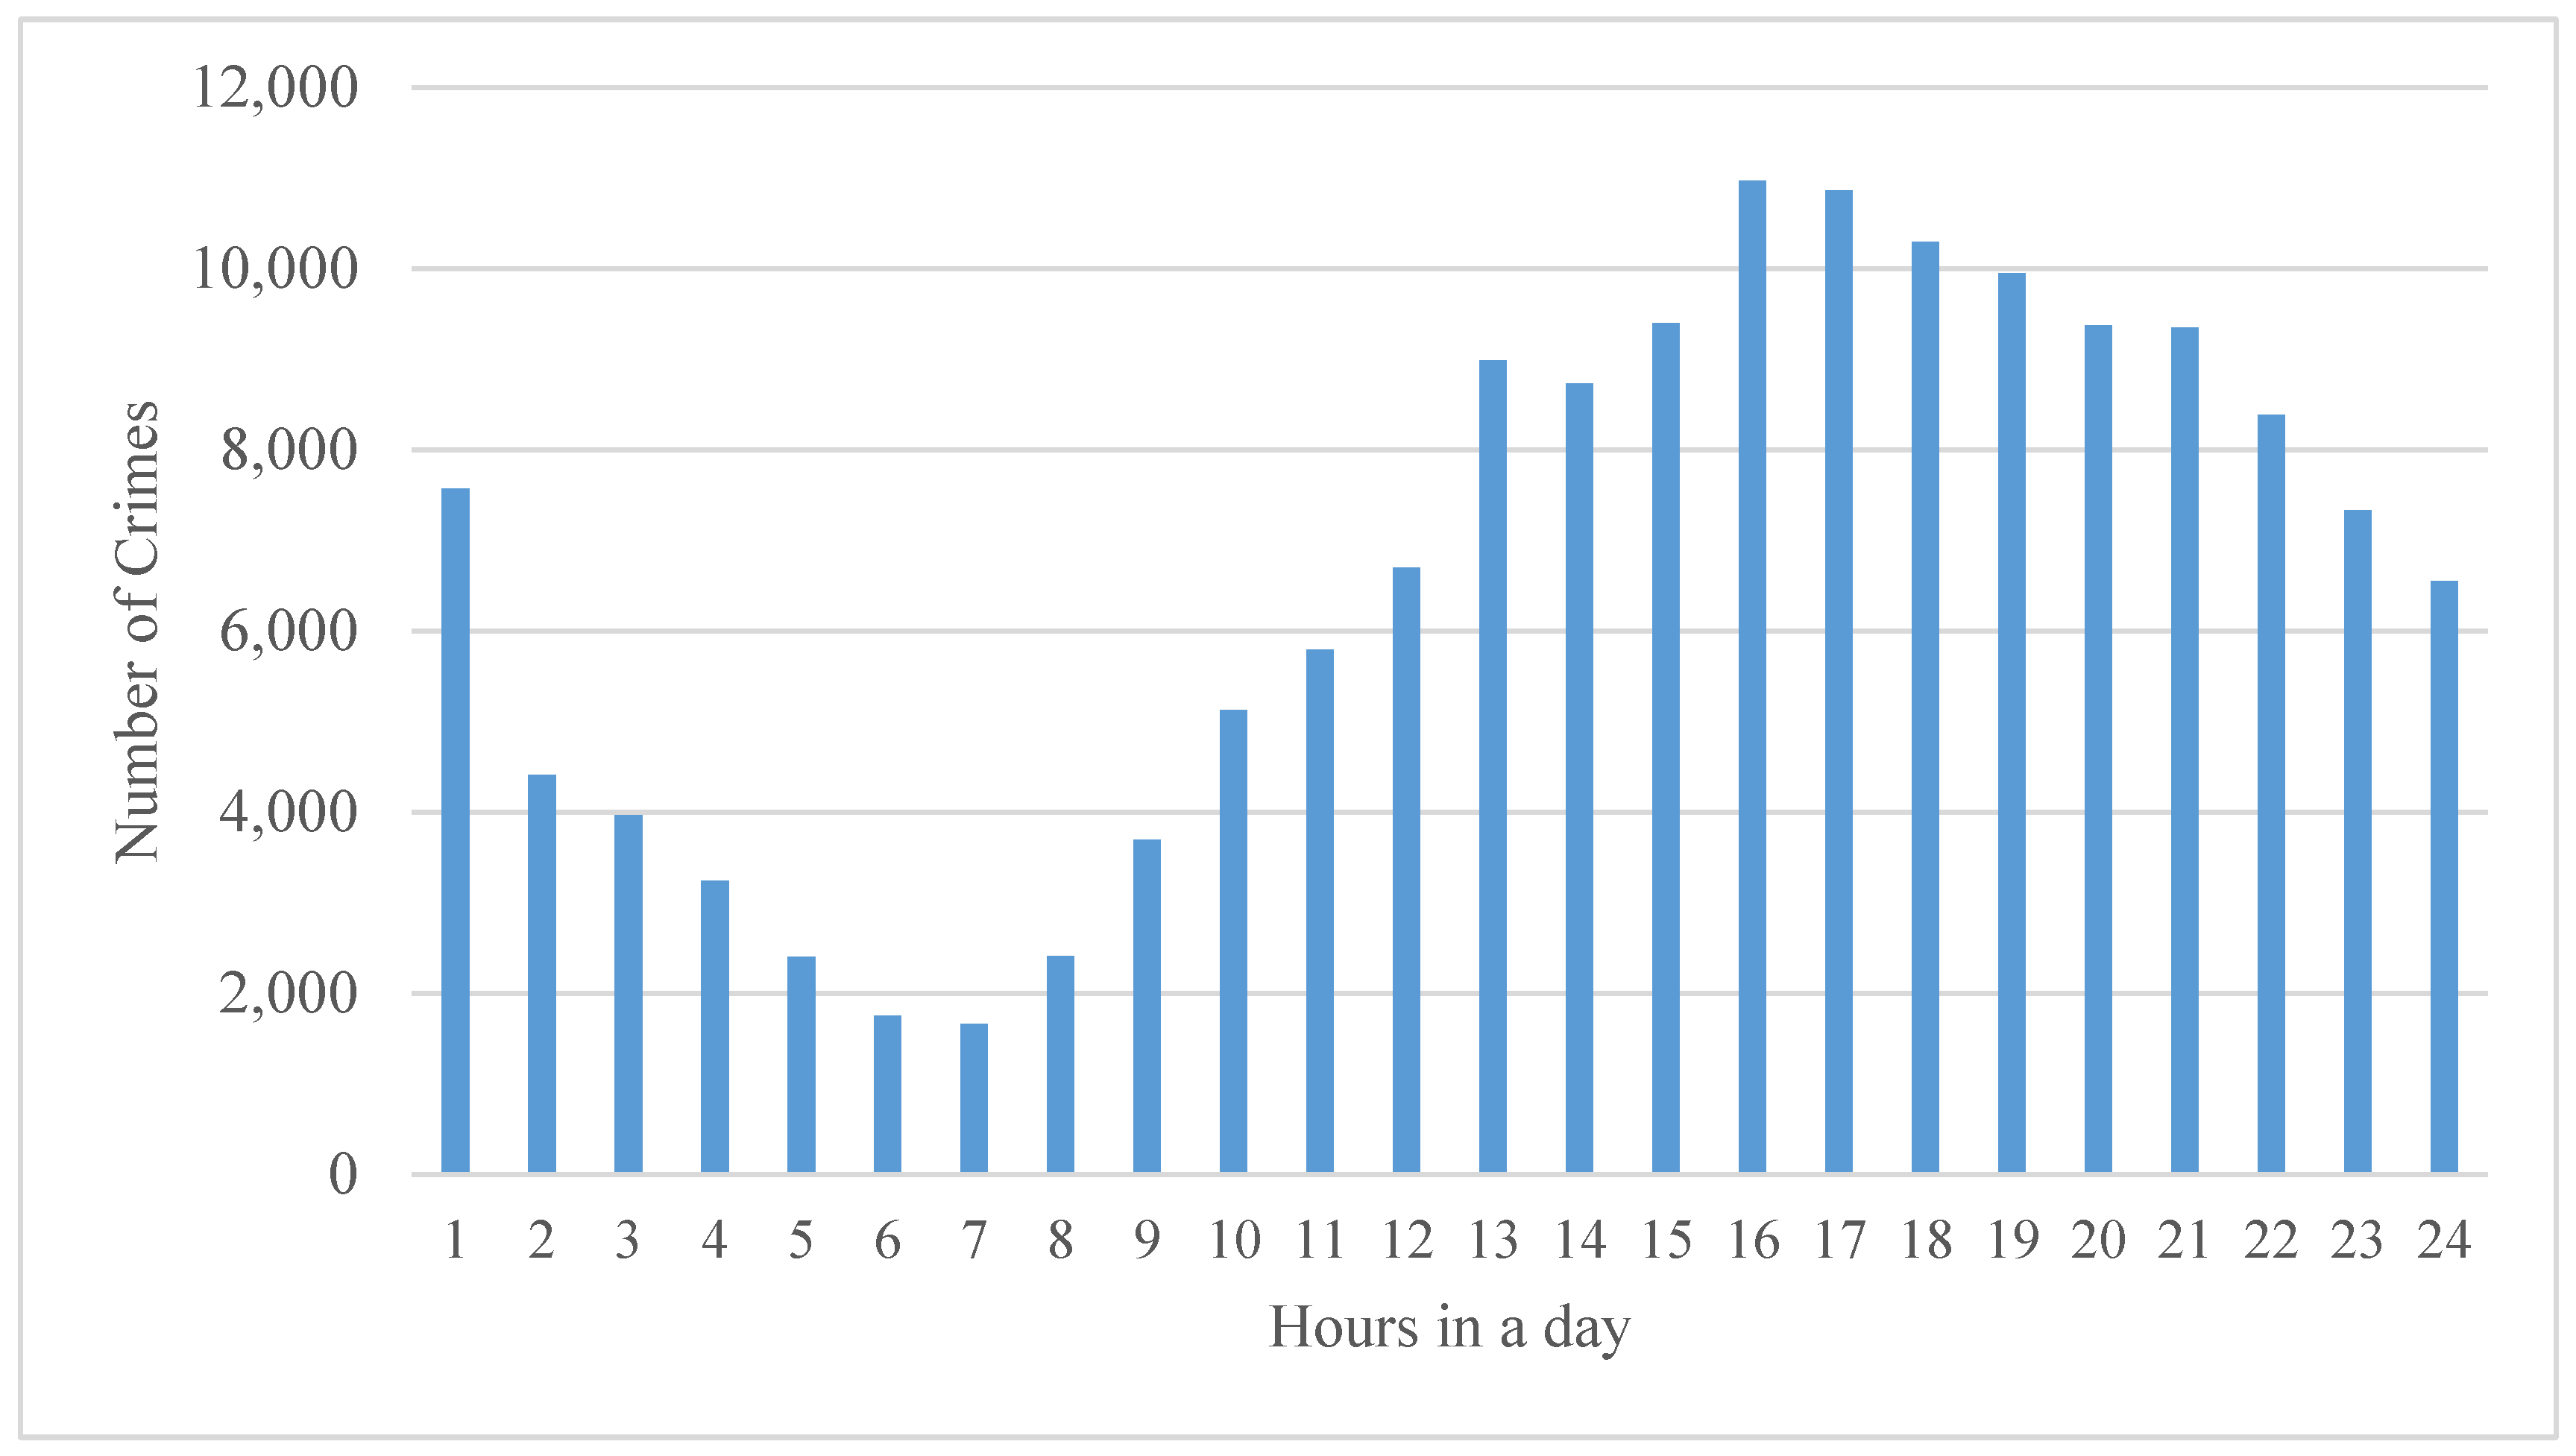
Table 7 shows the time of controlled periods for the evening with the results. The morning period was not analyzed because crime in the morning was much less common than crime in the afternoon; see Figure 4.
Table 7.
Times of the control periods for the evening lighting conditions in spring and autumn.
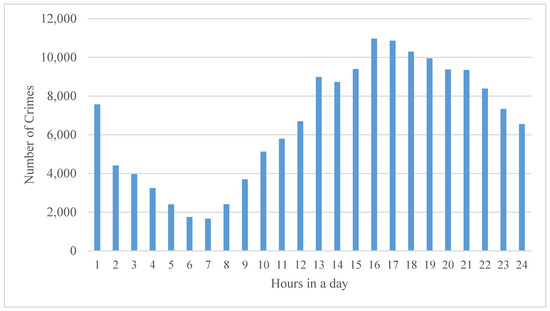
Figure 4.
Total crime rates by each hour during the day.
The study also reports the distribution of crime rates in London by each hour throughout the day. Figure 4 presents 158,933 recorded crimes where the time of the crime was known to 5 min or less, within 1 week before and after autumn and spring clock changes for all years. Figure 4, therefore, only represents 45.4% of crimes reported in the week of interest. All types of crimes mentioned above are included in Figure 4. Number 1 shows the crime counts between midnight and 1 am. The results demonstrate that crime is lowest around 6 am, whereas crime rates increase significantly in the afternoon, and incidents of crime peak between 3 pm and 5 pm. A total of 30.65% of crime occurs in the morning, and 69.35% of crime occurs in the afternoon.
5. Discussion
GPS coordinates enable us to assess the crime distribution over the years. Figure 3 demonstrates crime rates were more widespread in central London than in outer London in the time period analyzed for this research. The study explored crime rates during periods in the weeks on either side of the spring and autumn clock changes where in one week at a given time, it was dark, and in the other week, it was light. The aim was to understand the impact of lighting on crime. However, this is a complex topic. There are limited past studies to which to compare the results, and it is difficult to provide predictions. For example, Tompson et al. [44] found that vehicle crimes after dark occur more where street lighting exists compared to non-lit environments; however, there is the potential for displacement of crime to adjacent streets.
In the study of Fotios et al. [33], the precise time the crime occurred is not clear. Other studies focus on crime patterns within a year instead of over the longer term [19,20]. Crime rates also might depend on other features of the built environment, such as surveillance and street morphology and criminals’ purposes [6].
Nevertheless, ambient lighting conditions play a role in some crimes. The studies described previously by Doleac et al. [45], Tealde, E. [35], and Fotios et al. [33] investigated the relationship between Daylight Saving Time and crime and found that outdoor crimes such as robbery and violent attacks tend to increase due to darkness. Additionally, Doleac et al. [45] found an impact of DST on the economy, estimating that the extension of Daylight Saving in the United States in 2007 resulted in an annual cost savings to society of $59 million due to the prevention of robberies.
This study also supports these studies because we found that the fall of darkness (as opposed to daylight conditions) affects some crime types by using the DST approach. Overall, the increase in the risk of crime associated with darkness is fairly significant (5% OR 1.07). When broken down by crime type, there was a rise in theft from the person, robbery, arson and criminal damage, burglary, and vehicle offenses in the dark. Theft from a person (OR 1.27), robbery of personal property (OR 1.29), arson and criminal damage (OR 1.07), burglary (OR 1.59), and theft or taking of a motor vehicle (OR 1.38), increased after dark, while drug offenses decreased after dark. This supports the third and fourth hypotheses that “If light has an impact on crime, then crime at night/dark should be different from crime during the day/light” and “Light and dark impact crime types differently. For example, outdoor crimes such as robbery and theft increase after dark, whereas other crime types do not”. When looking at drug-related (OR 0.80) crimes, there is a question about the way this type of crime is reported because the victim and the perpetrator of the crime are usually the same person. If someone has possession of drugs, they do not want to report to the police that a crime has taken place. Thus, it is suspected that the crime is normally reported when the police find the person with drugs. A total of 82% of possession of drugs crimes are known to be reported within 5 min of taking place (Table 5). This may explain the fall in the reported drug crimes after dark, as poor lighting may make it harder to find offenders.
Burglary (p-value = 0.001) and theft from the person (p-value = 0.025) show statistically significant findings (p < 0.05). Although the p-values of the rest of the crime types are greater than 0.05, theft or taking of a motor vehicle (p-value = 0.051), robbery of personal property (p-value = 0.066), and overall crime (p-value = 0.059) are close to 0.05, which could be described as approaching significance. Additionally, the odds ratio enables a more accurate calculation of the potential risk by considering the broader perspective by including confounding variables and creating a control period [41].
Additionally, only 22% of burglary and 17% of vehicle offenses have times known within a 5 min window, which is too low to make a convincing statement. This is because a small change in victim behavior, such as coming home soon after dark, could have a large influence on the number of crimes reported. The number of incidents (Table 5) of other crimes is too low to make any reliable claims. For example, the numbers for burglary—business and community are 27 and 52 (light, dark test period), other sexual offenses are 25 and 31, and rape are 7 and 4.
The study can convincingly report that the crimes of robbery of personal property and theft from the person seem to be typically street crimes, and the increase after dark shows a possible link with darkness, which requires further investigation. Although overall crime rates in Figure 4 in daylight are higher than after dark, crime is much more widespread in the afternoon than in the morning. It could be related to the population of the people; for example, students and adults go out to study or work. In addition, there is an increase in crime in the afternoon (PM) compared with the morning in daylight (am). Figure 4 supports the second hypothesis that “Crime rates vary within the day (24 h period).” The study helps understand whether there is a link between the occurrence of crime and external lighting conditions. The counts of all crimes increased by around 5% (OR 1.07) in the relevant daily windows using the comparison between the adjacent weeks’ equivalent light-dark pairing. Table 7 shows that even though there is no significant difference between spring and autumn crime counts in the dark before and after the clock change (SED and AED), in the light periods (SEL and AEL), there is a difference. This finding affirms the hypothesis 1 that “There are seasonal differences in the effects of light and dark on crime. In autumn, we would expect a bigger difference compared to spring due to the onset of darkness.” Exploration of the breakdown of each crime type, such as robbery, theft, and burglary, in spring and autumn, requires further investigation.
There were two main limitations of the study. Firstly, the Crime Lab from which the data were extracted has stringent rules. Research in crime requires vetting processes for individuals, and the crime data are preserved in a high-security room. For example, accessing data and the Lab took around 3 months due to our security vetting process. There was no internet access, and no technological devices such as laptops, mobile phones, and smartwatches were allowed in the Lab to protect the data. There were limited tools and libraries that we could use. Uploading some libraries in Python had to be done by the administrative team. Secondly, some crime data were incomplete or duplicated. For example, there were two different files for the same crime incident in 2013. While one had 600,000 records, the other had 580,000 records. We had to clean the data by comparing, matching, and interpreting each file before we began the analysis.
6. Conclusions
Analysis of total crime, using GPS coordinates to show crime distribution across greater London, demonstrated that crime did not considerably change within the year or over the years available in this dataset. However, using a reliable method, this study demonstrated that ambient light conditions impacted some crimes, in particular outdoor crimes. Robbery and theft from a person were affected by lighting conditions and increased if it was dark. This finding shows that lighting affects the behavior of criminals in the built environment, which could also contribute to the fear of becoming victimized after dark for citizens. This has wider implications for lighting design which could be used as a tool in combating crime because a better-designed lit environment could also lead to less crime. There is now a valid reason to investigate the impact of location-specific geographic features further.
The driving problem is that lighting designers need to know how to use lighting design to contribute to the safety of the environment. However, until now, there has been very little convincing evidence that lighting affects crime. Our research provides important evidence that lighting conditions impact some outdoor crimes. This finding means that different approaches to the lighting design of external urban environments matter, could reduce crime, and that the effect of local lighting conditions should be explored further.
Author Contributions
Conceptualization: Ezgi Erturk, Jemima Unwin Teji and Peter Raynham. Data Curation: Ezgi Erturk. Formal analysis: Ezgi Erturk. Funding acquisition: Ezgi Erturk, Jemima Unwin Teji and Peter Raynham. Methodology: Ezgi Erturk, Jemima Unwin Teji and Peter Raynham. Software: Ezgi Erturk and Peter Raynham. Validation: Ezgi Erturk, Peter Raynham and Jemima Unwin Teji. Supervision: Jemima Unwin Teji and Peter Raynham. Visualization: Ezgi Erturk and Peter Raynham. Writing-original draft: Ezgi Erturk, Writing-review and editing: Jemima Unwin Teji and Peter Raynham. All authors have read and agreed to the published version of the manuscript.
Funding
Access to the secure crime database of the Jill Dando Institute Research Laboratory was provided by Bartlett School of Environment Energy and Resources (BSEER-UCL). The study presented in this article is part of the PhD study of the first author, who is sponsored by the Turkish Ministry of National Education at University College London (UCL).
Data Availability Statement
The 3rd Party Data was used in this study. Restrictions apply to the availability of these data. Data were obtained from the Jill Dando Institute Research Laboratory (JDIRL Lab) at UCL and are available from https://www.ucl.ac.uk/jill-dando-institute/about-us/jdi-rl (accessed on 12 March 2024). with the permission of the JDIRL Lab at UCL. The data for the study was provided by the Jill Dando Institute Research Laboratory (JDIRL Lab) at UCL after the authors passed the vetting process, which permitted access. This is a completely secure, confidential database that is not publicly available due to the sensitivity of the data, which contains locations and times of crimes. The data were analyzed in the JDIRL Lab because data cannot be removed from the laboratory. Supplementary details are described in the methodology section. The study was also approved as a low-risk study by the Research Ethics Committee at the UCL. The study did not collect any personal data16.
Conflicts of Interest
The authors declared no potential conflicts of interest with respect to the research, authorship, and/or publication of this article.
References
- Nasar, J.L.; Fisher, B. ‘Hot spots’ of fear and crime: A multi-method investigation. J. Environ. Psychol. 1993, 13, 187–206. [Google Scholar] [CrossRef]
- United Nations. Sustainable Development Goals; United Nations: San Francisco, CA, USA, 2014; pp. 34–37. Available online: https://sdgs.un.org/goals/goal16 (accessed on 12 March 2024).
- Jacobs, J. The Death and Life of Great American Cities; The Failure of Town Planning: New York, NY, USA, 1961. [Google Scholar]
- Welsh, B.C.; Mudge, M.E.; Farrington, D.P. Reconceptualizing public area surveillance and crime prevention: Security guards, place managers and defensible space. Secur. J. 2010, 23, 299–319. [Google Scholar] [CrossRef]
- Clarke, R.V. Introduction. In Situational Crime Prevention Successful Case Studies, 2nd ed.; Clarke, R.V., Ed.; Harrow and Heston: Guilderland, NY, USA, 1997; pp. 1–47. [Google Scholar]
- Newman, O. Defensible Space: Crime Prevention through Urban Design; Collier Books: New York, NY, USA, 1973. [Google Scholar]
- Duggan, M. Killing of Mark Duggan. 2024, pp. 1–23. Available online: https://en.wikipedia.org/wiki/Killing_of_Mark_Duggan (accessed on 13 December 2023).
- Andresen, M.A.; Malleson, N. Crime seasonality and its variations across space. Appl. Geogr. 2013, 43, 25–35. [Google Scholar] [CrossRef]
- Shiode, N.; Shiode, S.; Nishi, H.; Hino, K. Seasonal characteristics of crime: An empirical investigation of the temporal fluctuation of the different types of crime in London. Comput. Urban. Sci. 2023, 3, 19. [Google Scholar] [CrossRef]
- Appleton, J. The Experience of Landscape; Wiley: London, UK, 1975. [Google Scholar]
- Fisher, B.S.; Nasar, J.L. Fear of crime in relation to three exterior site features: Prospect, Refuge, and Escape. Environ. Behav. 1992, 24, 31. [Google Scholar] [CrossRef]
- Boyce, P.; Gutkowski, J. The if, why and what of street lighting and street crime: A review. Light. Res. Technol. 1995, 27, 10. [Google Scholar] [CrossRef]
- Mayhew, P.; Aye Maung, N.; Mirrlees-Black, C. The 1992 British Crime Survey/by Pat Mayhew, Natalie Aye Maung and Catriona Mirrlees-Black; HMSO: London, UK, 1993. [Google Scholar]
- BS 5489-1: 2020; Design of Road Lighting—Lighting of Roads and Public Amenity Areas. Code of Practice: London, UK, 2020.
- Schivelbusch, W. Disenchanted Night: The Industrialisation of Light in the Nineteenth Century/Wolfgang Schivelbusch/Translated from the German by Angela Davies Schivelbusch; University of California Press: Berkeley, CA, USA, 1988. [Google Scholar]
- Haans, A.; de Kort, Y.A.W. Light distribution in dynamic street lighting: Two experimental studies on its effects on perceived safety, prospect, concealment, and escape. J. Environ. Psychol. 2012, 32, 342–352. [Google Scholar] [CrossRef]
- Welsh, B.C.; Farrington, D.P. Effects of Improved Street Lighting on Crime. Campbell Syst. Rev. 2008, 4, 1–51. [Google Scholar] [CrossRef]
- Wright, R.; Heilweil, M.; Pelletier, P.; Dickinson, K. The Impact of Street Lighting on Street Crime; The University of Michigan: Ann Arbor, MI, USA, 1974. [Google Scholar]
- Painter, K.; Gunnell, P.; Fleming, R. Middlesex Polytechnic Lighting and Crime Prevention: The Edmonton Project; Middlesex polytechnic: London, UK, 1988. [Google Scholar]
- Nair, G.; Ditton, J. “In the Dark, a Taper Is Better than Nothing”. A One Year Follow-Up of a Successful Street Lighting and Crime Prevention Experiment. Light. J. 1994, 59, 25–27. [Google Scholar]
- Painter, K. An Evaluation of Public Lighting. Light. J. 1991, 56, 228–232. [Google Scholar]
- Steinbach, R.; Perkins, C.; Tompson, L. The effect of reduced street lighting on road casualties and crime in England and Wales: Controlled interrupted time series analysis. J. Epidemiol. Community Health 2015, 69, 1118–1124. [Google Scholar] [CrossRef]
- Peng, C.; Sun, W.; Zhang, X. Crime under the Light? Examining the Effects of Nighttime Lighting on Crime in China. Land 2022, 11, 2305. [Google Scholar] [CrossRef]
- Unwin, J.; Symonds, P.; Laike, T. Does lighting affect pedestrian flows? A pilot study in Lund, Market Harborough and Dublin. In Proceedings of the Lux Europa 2017 European Lighting Conference-Lighting for Modern Society, Ljubljana, Slovenia, 18–20 September 2017; pp. 1–5. [Google Scholar]
- Kids Make Town a “Living Hell”. South Yorksh Times, 16 February 2001; p. 1.
- Mansfield, K.; Raynham, P. Urban Lights—Sustainable Urban Lighting for Town Centre Regeneration. In Proceedings of the Lux Europa, Berlin, Germany, 19 September 2005; pp. 491–493. [Google Scholar]
- Sullivan, J.M.; Flannagan, M.J. The role of ambient light level in fatal crashes: Inferences from daylight saving time transitions. Accid. Anal. Prev. 2002, 34, 487–498. [Google Scholar] [CrossRef]
- Uttley, J.; Fotios, S. The effect of ambient light condition on road traffic collisions involving pedestrians on pedestrian crossings. Accid. Anal. Prev. 2017, 108, 189–200. [Google Scholar] [CrossRef]
- Ferguson, S.A.; Preusser, D.F.; Lund, A.K.; Zador, P.L.; Ulmer, R.G. Daylight saving time and motor vehicle crashes: The reduction in pedestrian and vehicle occupant fatalities. Am. J. Public Health 1995, 85, 92–96. [Google Scholar] [CrossRef]
- Muneer, T.; Kambezidis, H. Solar Radiation and Daylight Models for the Energy Efficient Design of Buildings/T. Muneer/with a Chapter on Solar Spectral Radiation by H. Kambezidis, 1st ed.; Architectural Press: Oxford, UK; Boston, MA, USA, 1997. [Google Scholar]
- Raynham, P.; Unwin, J.; Khazova, M.; Tolia, S. The role of lighting in road traffic collisions. Light. Res. Technol. 2020, 52, 485–494. [Google Scholar] [CrossRef]
- Fotios, S.; Robbins, C.J. Incorrect categorisation of ambient light level at the time of a road traffic collision. Light. Res. Technol. 2022, 56, 87–101. [Google Scholar] [CrossRef]
- Fotios, S.A.; Robbins, C.J.; Farrall, S. The effect of lighting on crime counts. Energies 2021, 14, 4099. [Google Scholar] [CrossRef]
- Umbach, R.; Raine, A.; Ridgeway, G. Aggression and sleep: A daylight saving time natural experiment on the effect of mild sleep loss and gain on assaults. J. Exp. Criminol. 2017, 13, 439–453. [Google Scholar] [CrossRef]
- Tealde, E. The unequal impact of natural light on crime. J. Popul. Econ. 2021, 35, 893–934. [Google Scholar] [CrossRef]
- Open Science Framework. Crime Open Database (CODE). 2021. Available online: https://osf.io/zyaqn/ (accessed on 15 June 2022).
- Metropolitan Police. All Crimes in London; Metropolitan Police: London, UK, 2019. [Google Scholar]
- Metropolitan Police. Crime Type Definitions. Metropolitan Police. 2022. Available online: https://www.met.police.uk/sd/stats-and-data/met/crime-type-definitions/ (accessed on 14 March 2022).
- National Oceanic and Atmospheric Administration. Solar Calculation Details. 2005. Available online: https://gml.noaa.gov/grad/solcalc/calcdetails.html (accessed on 28 February 2022).
- astral 3.2. AnacondaOrg. 2022. Available online: https://anaconda.org/conda-forge/astral (accessed on 12 May 2022).
- Johansson, Ö.; Wanvik, P.O.; Elvik, R. A new method for assessing the risk of accident associated with darkness. Accid. Anal. Prev. 2009, 41, 809–815. [Google Scholar] [CrossRef]
- Fleiss, J.L.; Levin, B.; Paik, M.C. Statistical Methods for Rates and Proportions, 3rd ed.; John Wiley and Sons: Hoboken, NJ, USA, 2003. [Google Scholar]
- Shadish, W.R.; Haddock, C.K. Combining Estimates of Effect Size. In The Handbook of Research Synthesis; Harris, C., Hedges, L.V., Eds.; Russell Sage Foundation: New York, NY, USA, 1994; pp. 261–280. [Google Scholar]
- Tompson, L.; Steinbach, R.; Johnson, S.D.; Teh, C.S.; Perkins, C.; Edwards, P.; Armstrong, B. Absence of Street Lighting May Prevent Vehicle Crime, but Spatial and Temporal Displacement Remains a Concern. J. Quant. Criminol. 2022, 39, 603–623. [Google Scholar] [CrossRef]
- Doleac, J.L.; Sanders, N.J. Under the cover of darkness: How ambient light influences criminal activity. Rev. Econ. Stat. 2015, 97, 1093–1103. [Google Scholar] [CrossRef]

Disclaimer/Publisher’s Note: The statements, opinions and data contained in all publications are solely those of the individual author(s) and contributor(s) and not of MDPI and/or the editor(s). MDPI and/or the editor(s) disclaim responsibility for any injury to people or property resulting from any ideas, methods, instructions or products referred to in the content. |
© 2024 by the authors. Licensee MDPI, Basel, Switzerland. This article is an open access article distributed under the terms and conditions of the Creative Commons Attribution (CC BY) license (https://creativecommons.org/licenses/by/4.0/).