Article

Land Cover Disaggregated Fire Occurrence and Particulate Matter2.5 Relationship in the Mekong Region: A Comprehensive Study

by
Nektaria Adaktylou
1,
Dimitris Stratoulias
2,
Julia Borgman
2,3,
Sangwoo Cha
2,
Devara P. Adiningrat
3 and
Narissara Nuthammachot
4,*
1
Department of Geology & Geography, Eberly College of Arts and Sciences, West Virginia University, Brooks Hall, Morgantown, WV 26506-6300, USA
2
Asian Disaster Preparedness Center (ADPC), Bangkok 10400, Thailand
3
Faculty of Geo-Information and Earth Observation (ITC), University of Twente, 7522 Enschede, The Netherlands
4
Faculty of Environmental Management, Prince of Songkla University, Hat Yai, Songkhla 90110, Thailand
*
Author to whom correspondence should be addressed.
ISPRS Int. J. Geo-Inf. 2024, 13(6), 206; https://doi.org/10.3390/ijgi13060206
Submission received: 28 March 2024 / Revised: 7 June 2024 / Accepted: 12 June 2024 / Published: 17 June 2024

Abstract

:
Air pollution has become an increasing concern in the Mekong region due to seasonal vegetative burning triggered by related anthropogenic activities and climate change. While the assumption of a correlation between agriculture burning and air pollution is a common postulation, little evidence exists on the association between fire incidents and air pollution concentrations. The current study explores the relationship between satellite-derived fire occurrence, land surface characteristics, and particulate matter 2.5 (PM2.5) concentrations for the five Lower Mekong countries, namely Cambodia, Laos, Myanmar, Thailand, and Vietnam, in an effort to gain new insights into fire distributions related to air quality. Publicly available daily active fire hotspots from the VIIRS satellite instrument, annual land cover products from the MODIS satellite, and mean monthly ground-level PM2.5 estimates from the V5.GL.04 database were analyzed in two relational assessments; first, the distribution of VIIRS active fire counts and fire radiative power (FRP) temporally and spatially and secondly, the correlations between the monthly VIIRS active fire counts, cumulative monthly FRP and mean monthly PM2.5 estimates per country and land cover type. The results suggest a statistically significant positive correlation between monthly fire counts, cumulative FRP, and PM2.5 estimates for each country, which differ based on land cover. The strongest correlation between monthly fire incidences and PM2.5 estimates was found in the case of Myanmar. For all countries combined, fires detected in forests displayed the highest correlation with monthly PM2.5 estimates. This study demonstrates the use of the VIIRS active fire product and provides important insights into temporal and spatial fire distributions as baseline information for fire prevention and mitigation strategies in the Mekong region.

1. Introduction

In recent years, Southeast Asian countries have been experiencing more frequent and intense haze events [1] triggered by anthropogenic and naturally occurring fires that have a significant influence on the extent of air pollutant concentrations. In particular, PM2.5, defined as fine particles with a size smaller than or equal to 2.5 µm, account for approximately 90% of the total particle mass [2,3] and are known to be harmful to human health due to their capability of penetrating deeply into the lungs [4]. PM is primarily derived from combustion activities [4,5], and biomass burning forms a major source of particulate matter emissions in many parts of the world, particularly in low-income countries. Additionally, toxicological studies indicate that PM2.5 emitted by wildfires may be more toxic than ambient PM2.5 [6].
In the Mekong region, consisting of Cambodia, Laos, Myanmar, Thailand, and Vietnam, increased haze problems have been frequently linked to burning activities [2,6]. Biomass burning, as an agricultural land management practice, forms a convenient way of preparing land for agricultural cultivation and is a popular method for crop residue disposal and fortification of nutrients in the soil [7,8,9,10,11]. Furthermore, the common traditional and productive shifting cultivation technique in the region implements vegetation burning as a means of clearing forested areas and enhancing the soil for regeneration [12]. As such, the use of fires for agricultural management is an important practice in the region. However, left unmanaged, an increasing number and frequency of agricultural fires in combination with rising temperatures and altered precipitation patterns may form a significant risk of severe fire events endangering the air quality at both a local and regional scale [8].
While biomass burning is not the only source of pollution in the region, its contribution is very significant. Related research indicates that smoke haze resulting from large-scale biomass burning has frequently led to elevated PM levels in the Southeast Asia region. Hongthong et al. [13], in a study conducted in northern Thailand, found that there was a consistent trend between estimated emission and measured PM. Thepnuan et al. [14] claim that during dry season haze episodes in upper Southeast Asia, forest and agri-waste burning are major contributors to the aerosols. Fan et al. [15] found, in a study looking at biomass burning during pollution events in Southeast Asia and how they impact aerosol distribution over the low-latitude plateau in China, that 59.5% of PM2.5 mass produced by biomass burning was sourced from the Myanmar–Thailand border. Yin et al. [16] found in a study investigating air pollution in mainland Southeast Asia from 2001 to 2016 that the variation of air quality is closely related to local biomass burning, and the latter contributed more than human activities to PM2.5 emissions.
Monitoring fire occurrence is important in order to understand where and when fires are present and how the resulting emissions affect the air quality of the areas studied. Besides fire count, studies have associated fire radiative power (FRP) with combustion and aerosol emission rates [17,18,19,20,21,22]. FRP refers to the rate of radiative energy emitted by a fire at the time of observation and can serve as an approach to estimate biomass burning emissions [12]. As a result, fire count and FRP are associated with PM2.5 emission rates in the specific region.
Typically, PM2.5 surface concentrations are obtained from ground-based air quality monitoring stations; nevertheless, these point measurements in space come with a limited capacity to observe a dynamic phenomenon as air pollution changes in space and time. The emergence of improved remote sensing techniques enables new air quality monitoring methods at larger scales that can be used more efficiently along with field-based techniques [23]. Satellite-based data offer global coverage at sub-daily frequency acquisitions of environmental data that can be used to retrieve various fire indicators, such as burned areas, smoke density, and the location and intensity of fire hotspots [24,25]. In order to obtain a broader understanding of the spatial and temporal distribution of PM2.5, remotely sensed aerosol optical depth (AOD) products can be used to approximate PM2.5 concentrations [22,26,27]. Nevertheless, AOD approaches based on satellite data modeling have some limitations related to the input not being directly related to the ground PM2.5 values, although some studies, such as the one from Ding et al. [28], have used novel approaches to improve the spatial resolution and accuracy of AOD. Moreover, generally, satellite data inherit certain limitations such as spatiotemporal limitations, vertical resolution issues, and limitations in AOD estimations, among others. To mitigate these limitations, combinations of satellite data, ground-based sensors, and modeling solutions are used. This enhances the accuracy and also the comprehensiveness of air quality assessments [29].
Previous studies have applied remote sensing to study fire distributions and emissions in the region. For example, Vadrevu et al. [11] investigated fire trends within Southeast Asia using active fire hotspots from 2012 to 2016 in relation to land cover data, while Yin et al. [16] studied the relation between fire hotspots and PM2.5 concentrations in the whole Mekong region. More recently, Vadrevu and Eaturu [30] analyzed nighttime vegetation fires using VIIRS data in the context of studying the trends in nighttime fires in South/Southeast Asian Countries.
In the current study, the active fire hotspot product from the Visible Infrared Imaging Radiometer Suite (VIIRS) at 375 m is examined over the period of 2012–2020, in relation to different land cover classes in the five Mekong countries [24]. The VIIRS sensor is a publicly available, near-real-time fire hotspot detector with a higher spatial resolution compared to its predecessor, the MODIS fire hotspot product [24]. As a result, VIIRS can detect smaller and less intense fire pixels. The distribution of VIIRS fire hotspots is studied in relation to the MODIS annual Land Cover Type Product (MCD12Q1) in accordance with the International Geosphere–Biosphere Programme (IGBP) class descriptions. To study the relation between mean monthly PM2.5 estimates and monthly fire count, cumulative monthly FRP per country, and land cover, we analyzed the inter-correlation between these variables. The current study aims to provide insights into fire patterns in the Mekong region and the implications for fine particulate matter (PM2.5) concentrations at a country level and at a monthly scale. The results supplement previous studies by analyzing more recent years, studying fire patterns over land covers at a larger spatial scale, and examining the degree of association between monthly PM2.5 estimates, FRP and fire count per country, and land cover type.
Our main hypotheses examined in the current paper are the following: (1) the distribution of VIIRS-detected fires indicates biomass burning patterns within the Mekong region, (2) a positive correlation exists between monthly PM2.5 concentrations and monthly VIIRS fire counts, as well as the cumulative monthly FRP.

2. Materials and Methods
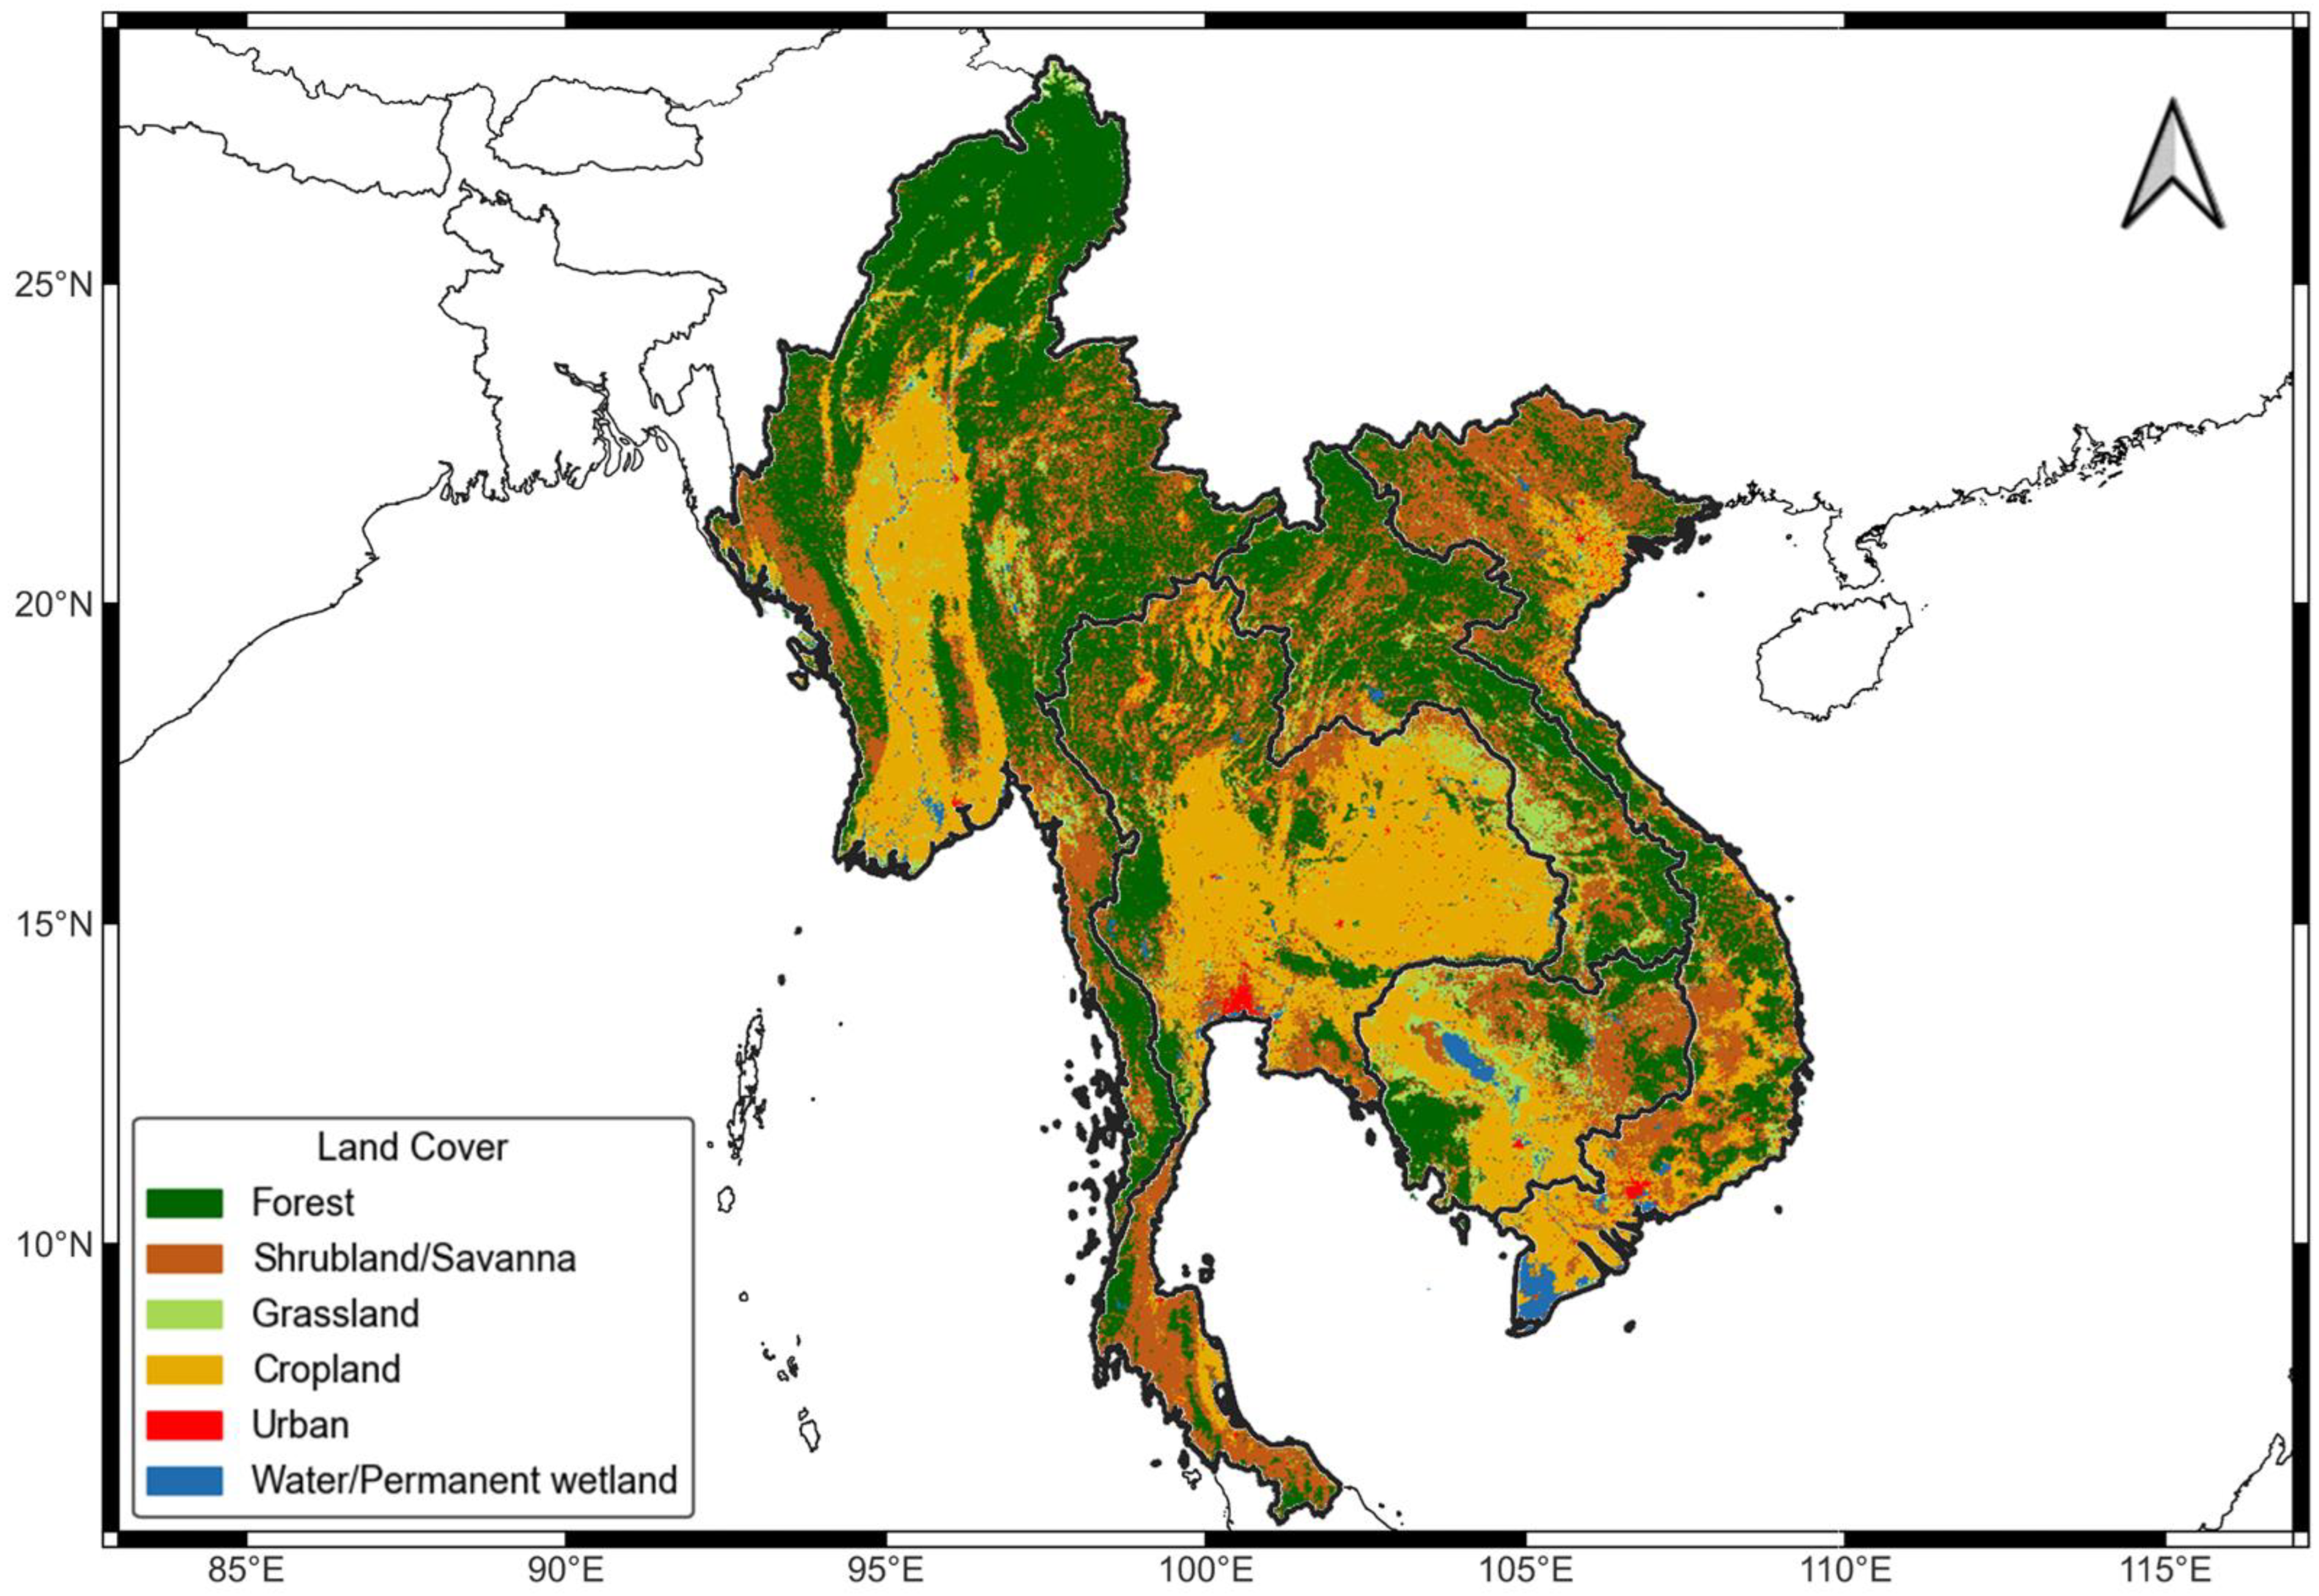
2.1. Study Area

The Mekong region, which is part of Southeast Asia, is located between 5.00 N–30.00 N and 90.00 E–110.00 E and consists of Cambodia, Laos, Myanmar, Thailand, and Vietnam. Figure 1 depicts the regional land cover spatial distribution, as compiled based on the main land cover classes from the MCD12Q1.061 MODIS Land Cover Type Yearly Global 500 m LC Type1 product, and by considering the first available image of each pixel for the year 2020. Its river basin is home to approximately 65 million inhabitants and is known for its high biological and cultural diversity [10,12]. The climate within the region can be broadly characterized by the dry season, spanning from November to March, and the monsoon season, encompassing the months of April to October [31]. The latter is related to months with intense precipitation and, consequently, humid conditions [31]. Agriculture is the most important economic activity within the region and shifting cultivation is a common practice [10]. Agricultural burning is used to clear the land for new cultivation and slash-and-burn techniques are frequently applied as a cost- and time-efficient method [10], improve soil fertility, and ease harvesting and clearing. Consequently, vegetation fires are a considerable problem in mainland SE Asia [11,32], especially during the dry season between February and April [33], and generate significant amounts of regional air pollution [34].

2.2. Datasets

Various satellite-based data sources were used in this study to spatially relate fire incidence with land use, vegetation characteristics, and PM2.5 estimates between the years 2012 and 2020. We used the VIIRS active fire hotspots, the MODIS annual land cover, and global monthly PM2.5 estimate products, which are further described in the sections below.

2.2.1. VIIRS Active Fire Hotspots 375 m

The VIIRS instrument, onboard the Suomi-National Polar-orbiting Partnership (S-NPP) satellite launched in 2011, collects near-real-time environmental data [24]. The temporal resolution can be less than 12 h depending on the latitude, which makes the data applicable for fire monitoring and fire mitigation strategies [11]. The datasets have been used in the context of generating fire-monitoring products, such as active fire hotspots, burned area maps, and smoke plume detection [24,35].
The VIIRS active fire hotspot product builds upon the previous 1 km MODIS fire product and algorithm. The improved spatial resolution of 375 m of the VIIRS sensor enables the detection of smaller and less intense fires. In addition, various adjustments have been made, such as the reduction in duplicate fire hotspots and smaller growth rates of pixel sizes dependent on the view angle compared to MODIS [36]. The current study focuses on the VIIRS 375 m active fire hotspots collected during the S-NPP mission, which are available from 2012 to the present. Similar to the MODIS fire product, the VIIRS product provides the location of the central point of a fire pixel and scan and track values to determine the actual fire pixel size in addition to various information attributes, such as FRP and a confidence value. The latter forms an indicator of the level of certainty at which a fire occurred at the given location. The VIIRS data are freely accessible and can be downloaded from NASA’s FIRMS website (https://firms.modaps.eosdis.nasa.gov/download/ (accessed on 14 June 2024)).

2.2.2. MODIS Land Cover Type Product

The global MODIS Land Cover Type Product (MCD12Q1) provides land cover maps at a 500 m spatial resolution and annual time interval [37]. Distinctions can be made between 13 different layers, including 5 different classification schemes, a quality assurance layer, and land/water masks [38]. The land cover products were generated through a supervised classification of MODIS Terra and Aqua reflectance data using a decision tree classifier and their accuracy was assessed through cross-validation with initial training data [38]. For this study, the International Geosphere–Biosphere Programme (IGBP) legend was used, given the availability of more classes suitable for the study area compared to other existing classification schemes. MODIS land cover products are freely accessible through various repositories, such as the Google Earth Engine (GEE) and the USGS EarthExplorer (https://earthexplorer.usgs.gov/ (accessed on 14 June 2024)).

2.2.3. Global PM2.5 Estimates

A study by Van Donkelaar et al. [27] estimated global annual and monthly surface PM2.5 concentrations by combining Aerosol Optical Depth (AOD), global surface PM2.5 observations, and the GEOS-Chem chemical transport model. The data are available for the years 1998–2020 [27]. Daily AOD was retrieved from NASA’s MODIS, MISR, and SeaWIFS instruments and transformed into a best-estimate monthly AOD based on a weighted average [27]. The AOD was related to the PM2.5 concentrations using the GEOS-Chem chemical transport model equation and the estimates were eventually improved by integrating ground-based PM2.5 observations retrieved from various ground stations around the globe [27]. We used the monthly PM2.5  µ g m 2 estimates at a 0.1° × 0.1° resolution for the years 2012–2020 from the V5.GL.04 database. The data can be freely downloaded from the website of the Washington University in St. Louis (https://sites.wustl.edu/acag/datasets/surface-pm2-5/ (accessed on 14 June 2024)).

2.3. Methods

Figure 2 shows the workflow of the study. The distribution of VIIRS active fire counts and FRP were investigated, both temporally and spatially. Furthermore, the correlations between the VIIRS monthly active fire counts, cumulative monthly FRP, and mean monthly PM2.5 estimates were studied per country and land cover type to detect potential patterns. We used publicly available geospatial datasets to enable the repetition of the methodology in future studies [39]. Due to the large spatial scale of the datasets required, Google Earth Engine (GEE) [40] was used for the preprocessing and analysis of the data. GEE is a cloud-based visualization and analysis platform that provides access to a variety of satellite imagery and geospatial datasets at a global scale. The VIIRS active fire data were loaded in GEE and clipped to the boundaries of the Lower Mekong countries. The Large Scale International Boundaries (LSIB) dataset created by the U.S. Department of State in 2017 (https://developers.google.com/earth-engine/datasets/catalog/USDOS_LSIB_SIMPLE_2017 (accessed on 14 June 2024)) was used for that purpose. The VIIRS fires were filtered to a “high” confidence level to only include fires with high confidence values. For each fire hotspot center detected, the actual fire pixel size was computed using the scan and track values associated with each hotspot [24]. More specifically, geometric calculations are used, based on the resolution of the satellite images and the dimensions represented by the scan and track values, which are converted into actual distances on the ground. The MODIS dataset was used to extract land cover for each VIIRS fire pixel. The MODIS land cover classes were merged to have a simplified set of classes including cropland (classes 12 and 14), forest (1, 2, 3, 4, and 5), barren (16), grassland (10), shrubland/savanna (6, 7, 8, and 9), and water/permanent wetlands (11 and 17). The majority (mode) pixel value within the fire pixel was selected as the raster value for the specific VIIRS fire in order to incorporate the contextual information within each fire pixel. This was conducted using the GEE reduce region function. This process was repeated for the 2012–2020 time period. The resulting feature collections were then exported into R, the programming language that was used to create graphs (line charts and bar) using automated scripts and the ggplot2 library. The fires detected using the MODIS land cover classes mentioned above were then used to study the existing correlation with PM2.5 estimates. The monthly PM2.5 data were converted to the GeoTIFF file format and clipped to the boundary of the study area. The mean monthly PM2.5 value was calculated for each Lower Mekong country. Mean values were compared with the monthly values of detected fire counts and with the cumulative values of monthly FRP. This was conducted per country and per land cover, spanning the years 2012–2020 through scatterplots. To develop a better understanding of the relationship between monthly fire counts, FRP, and PM2.5 concentrations, the Pearson correlation [41] and the coefficient of determination (R2) were computed. Finally, we calculated the Maximal Information Coefficient (MIC) as a non-linear correlation matrix to test the degree of non-linearity of our results.

3. Results

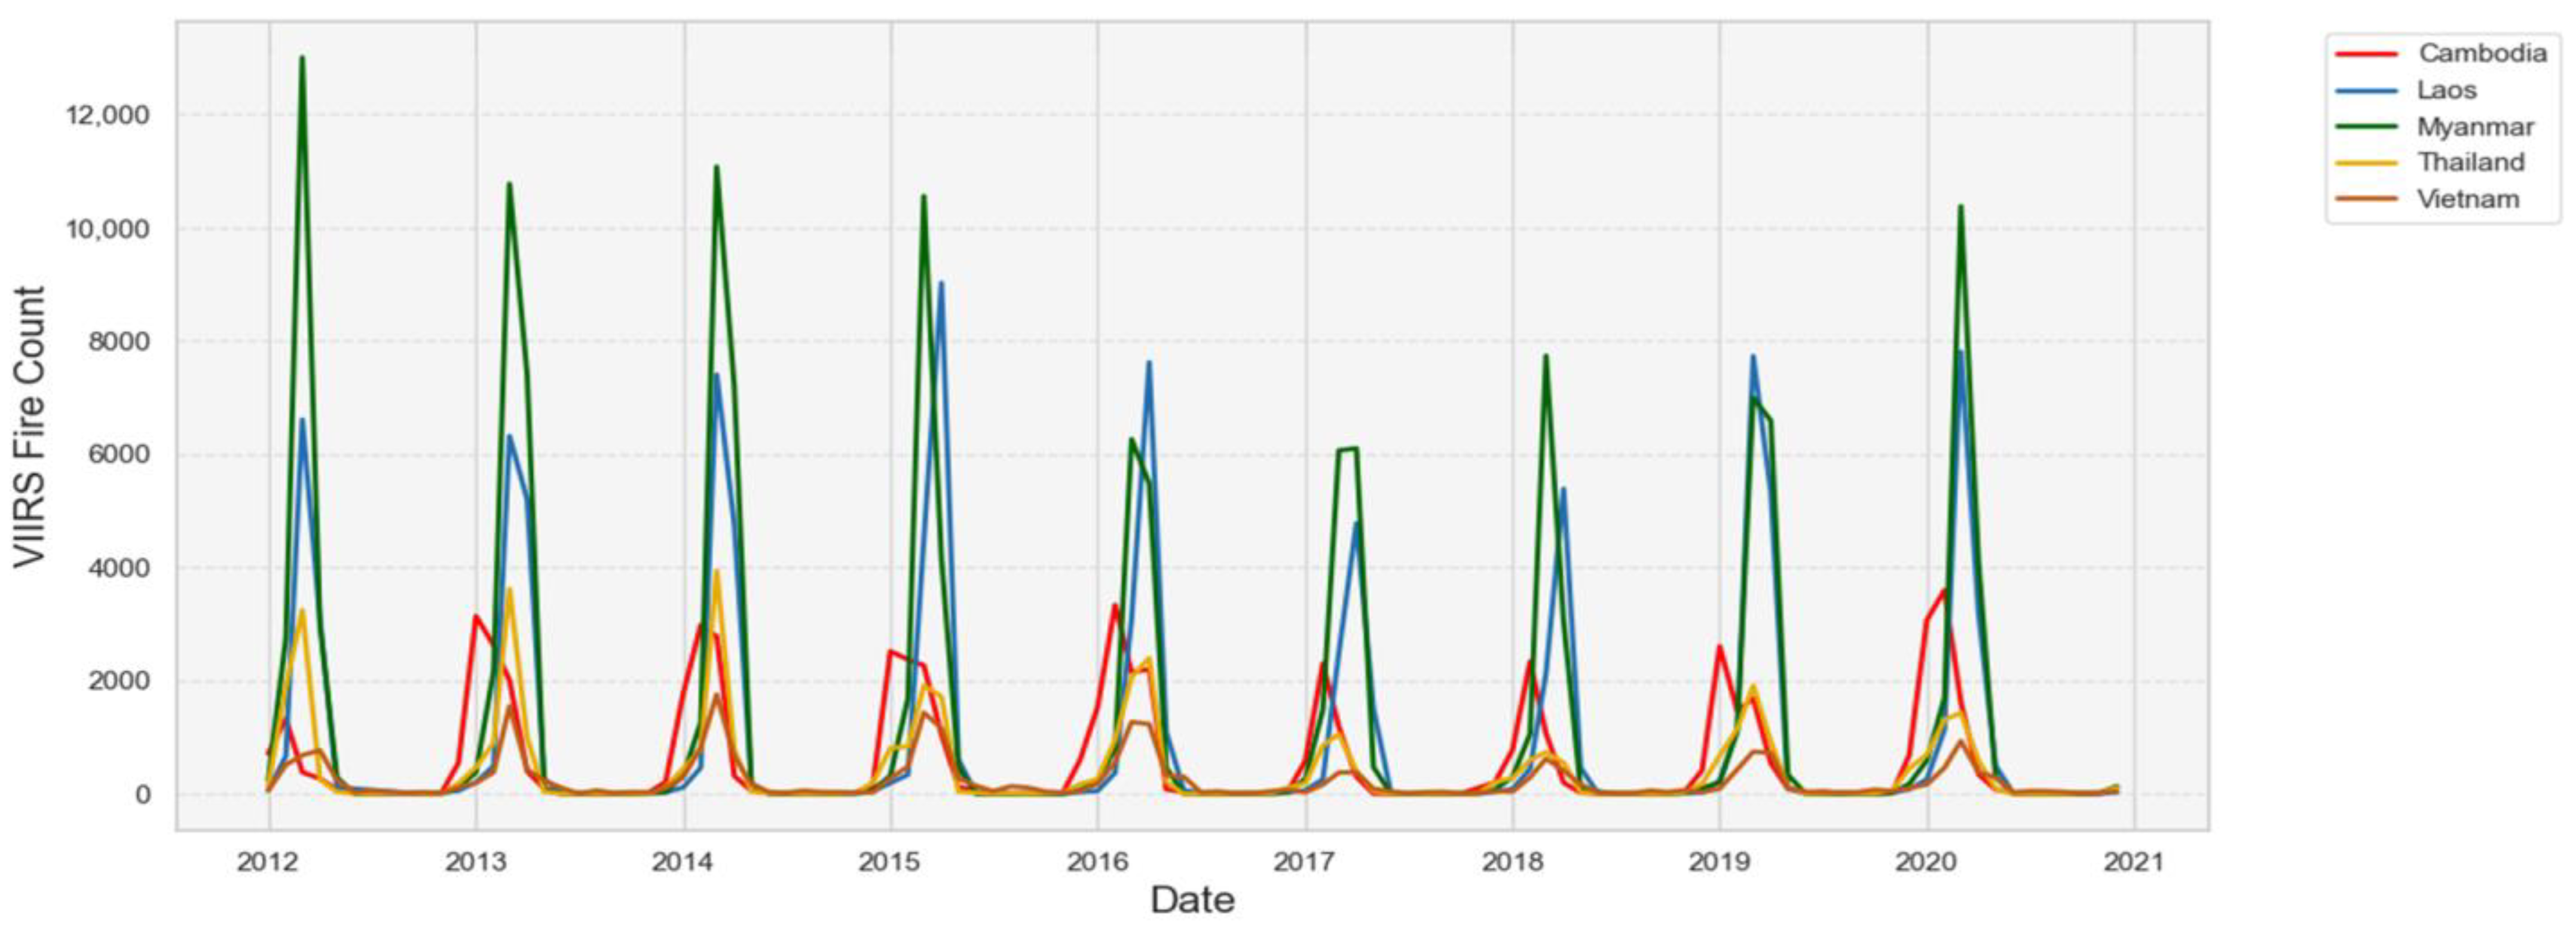
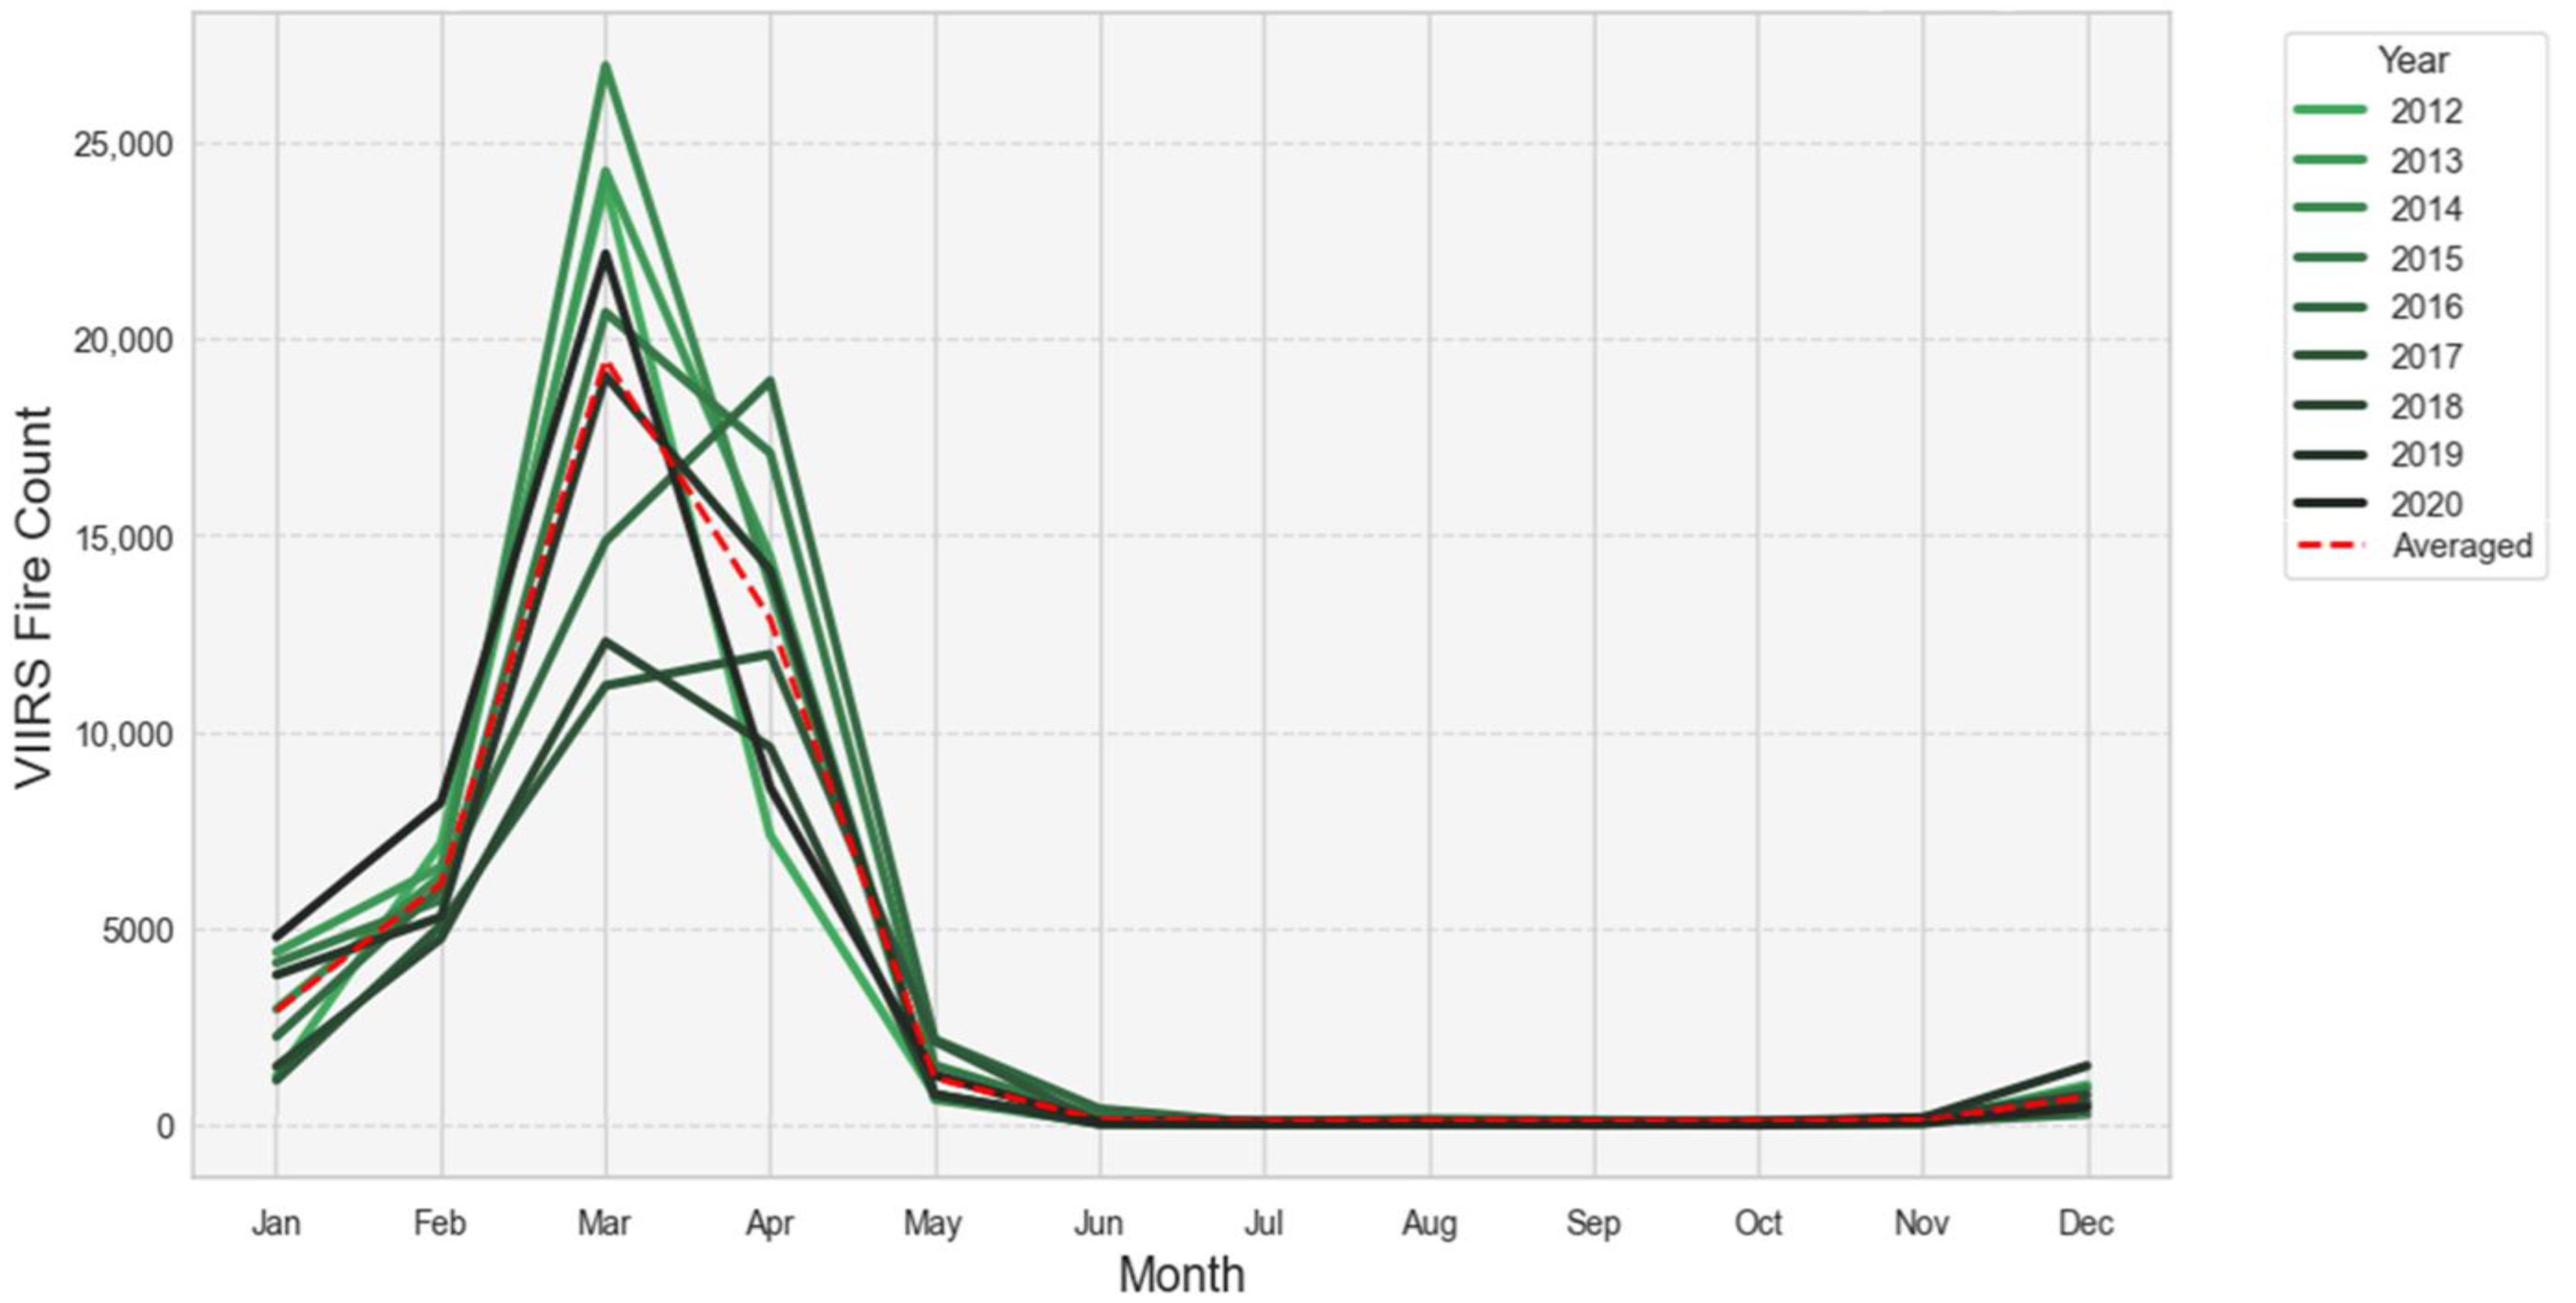
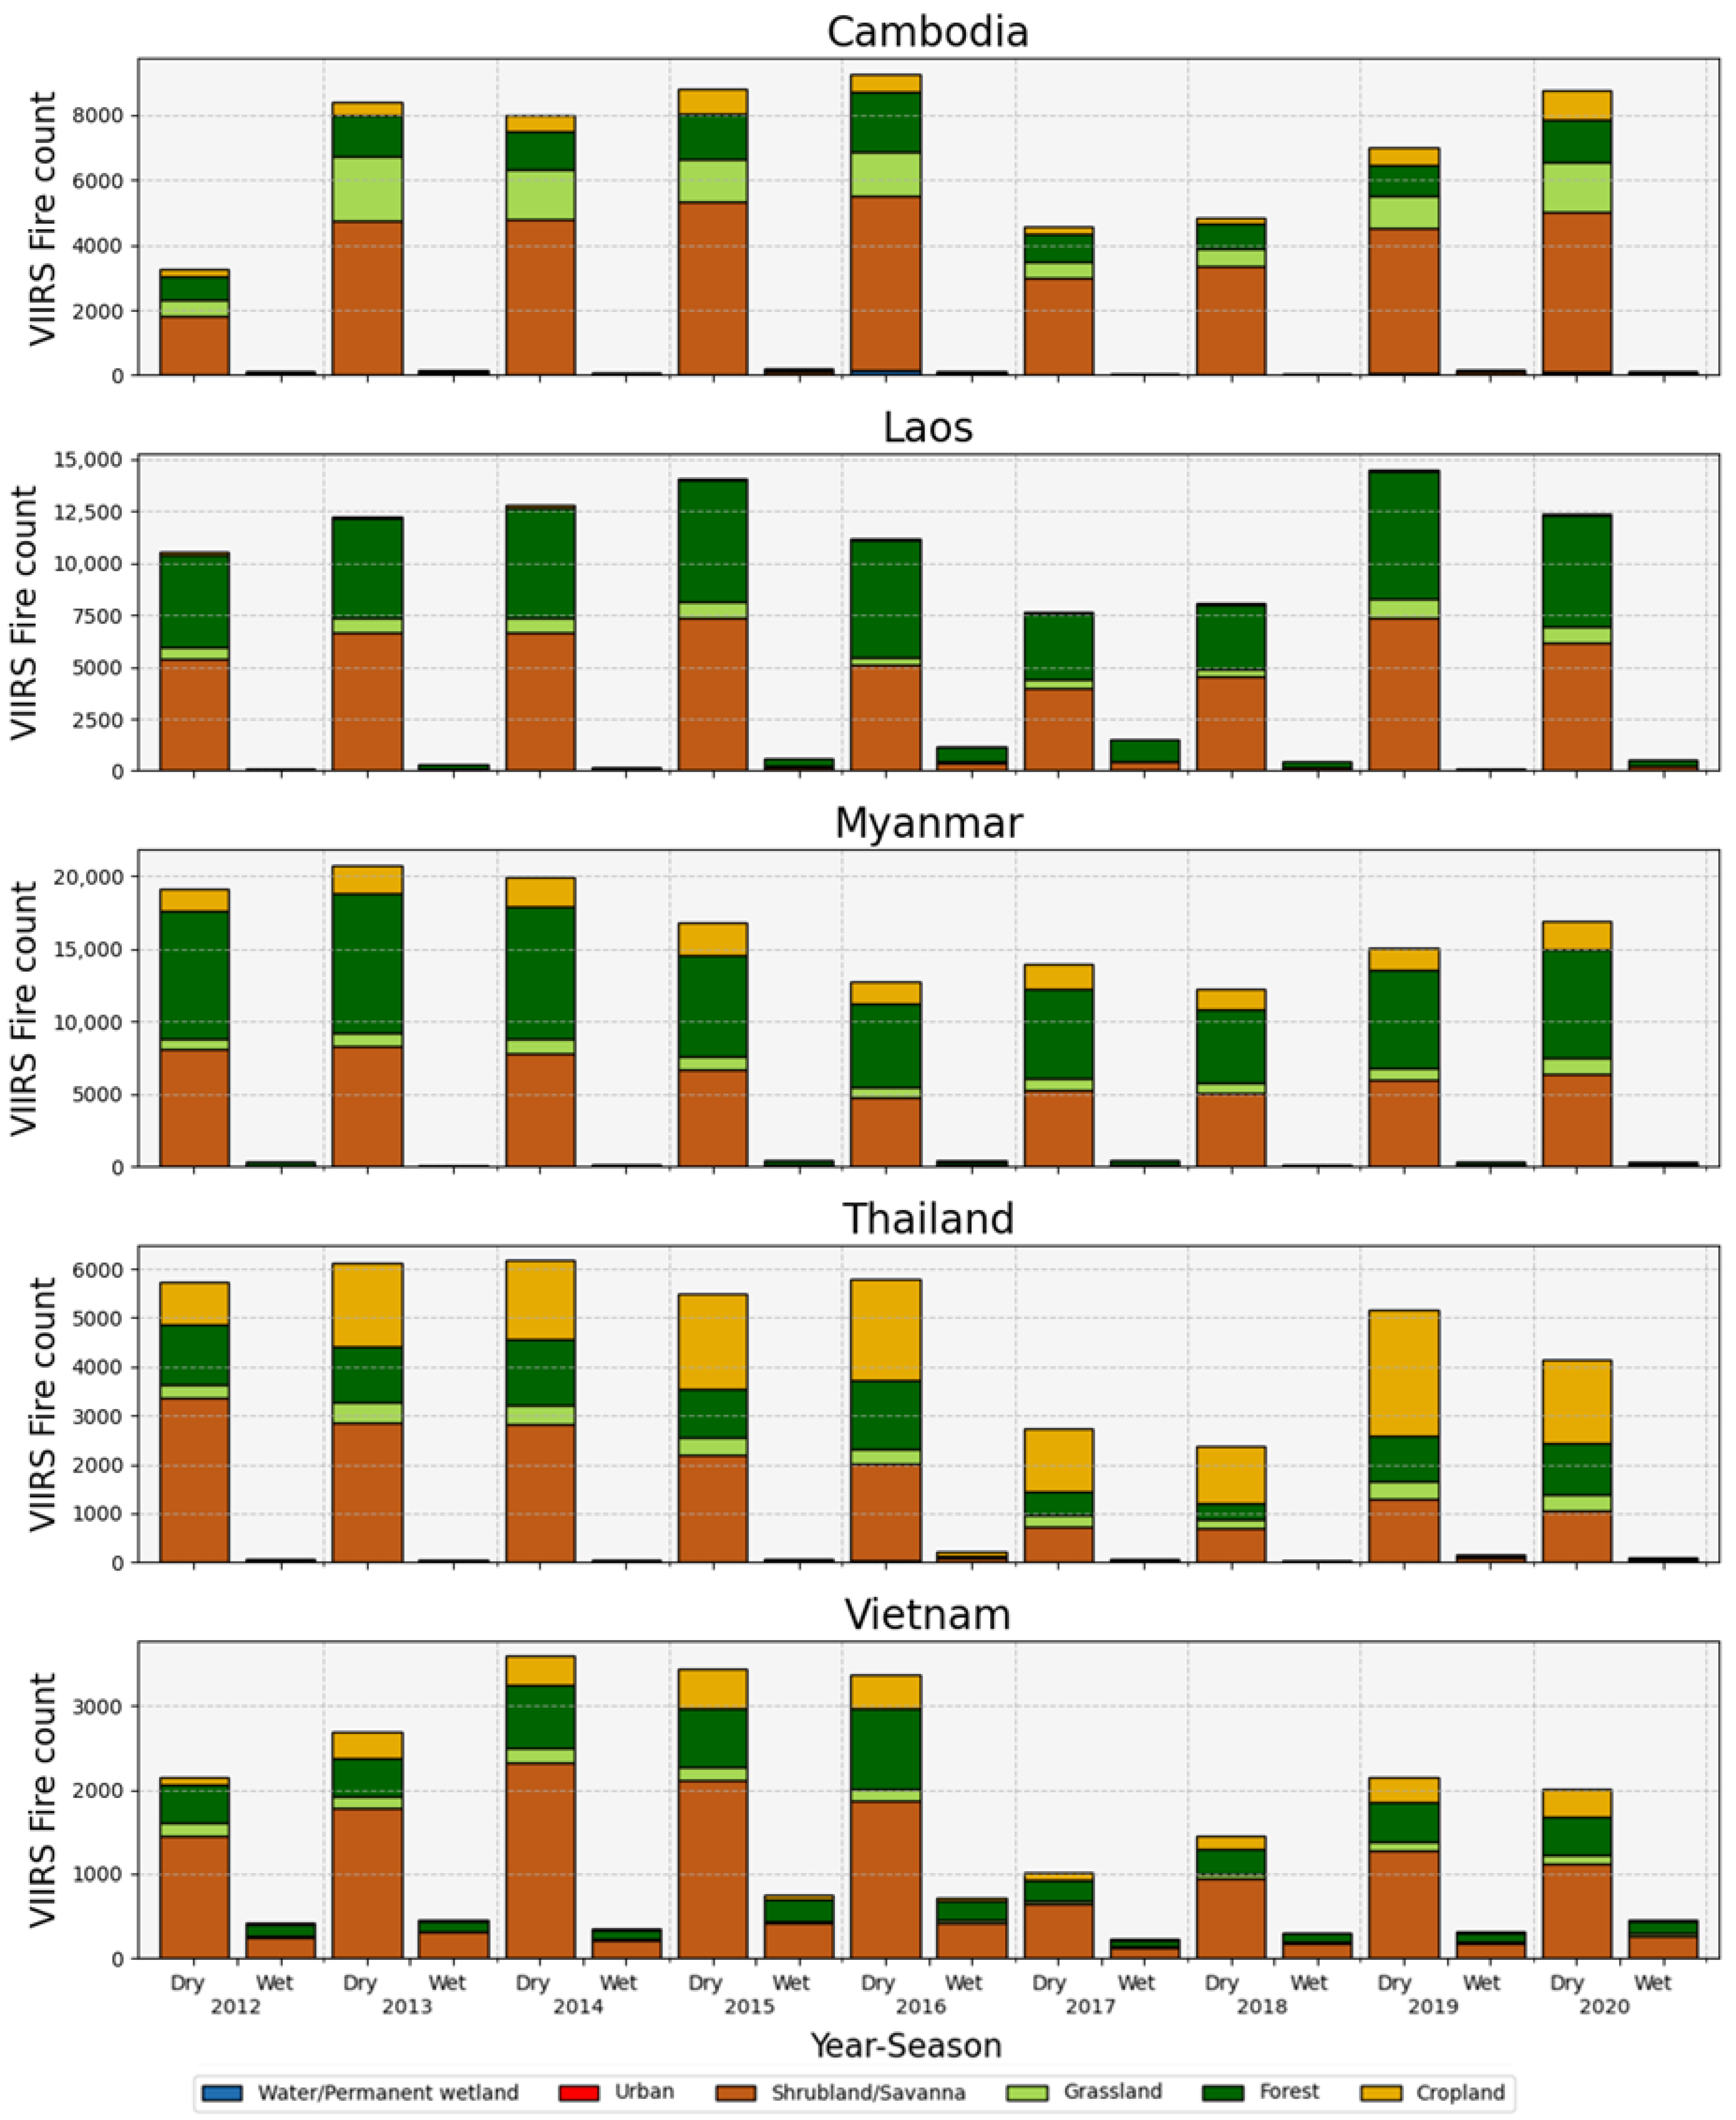
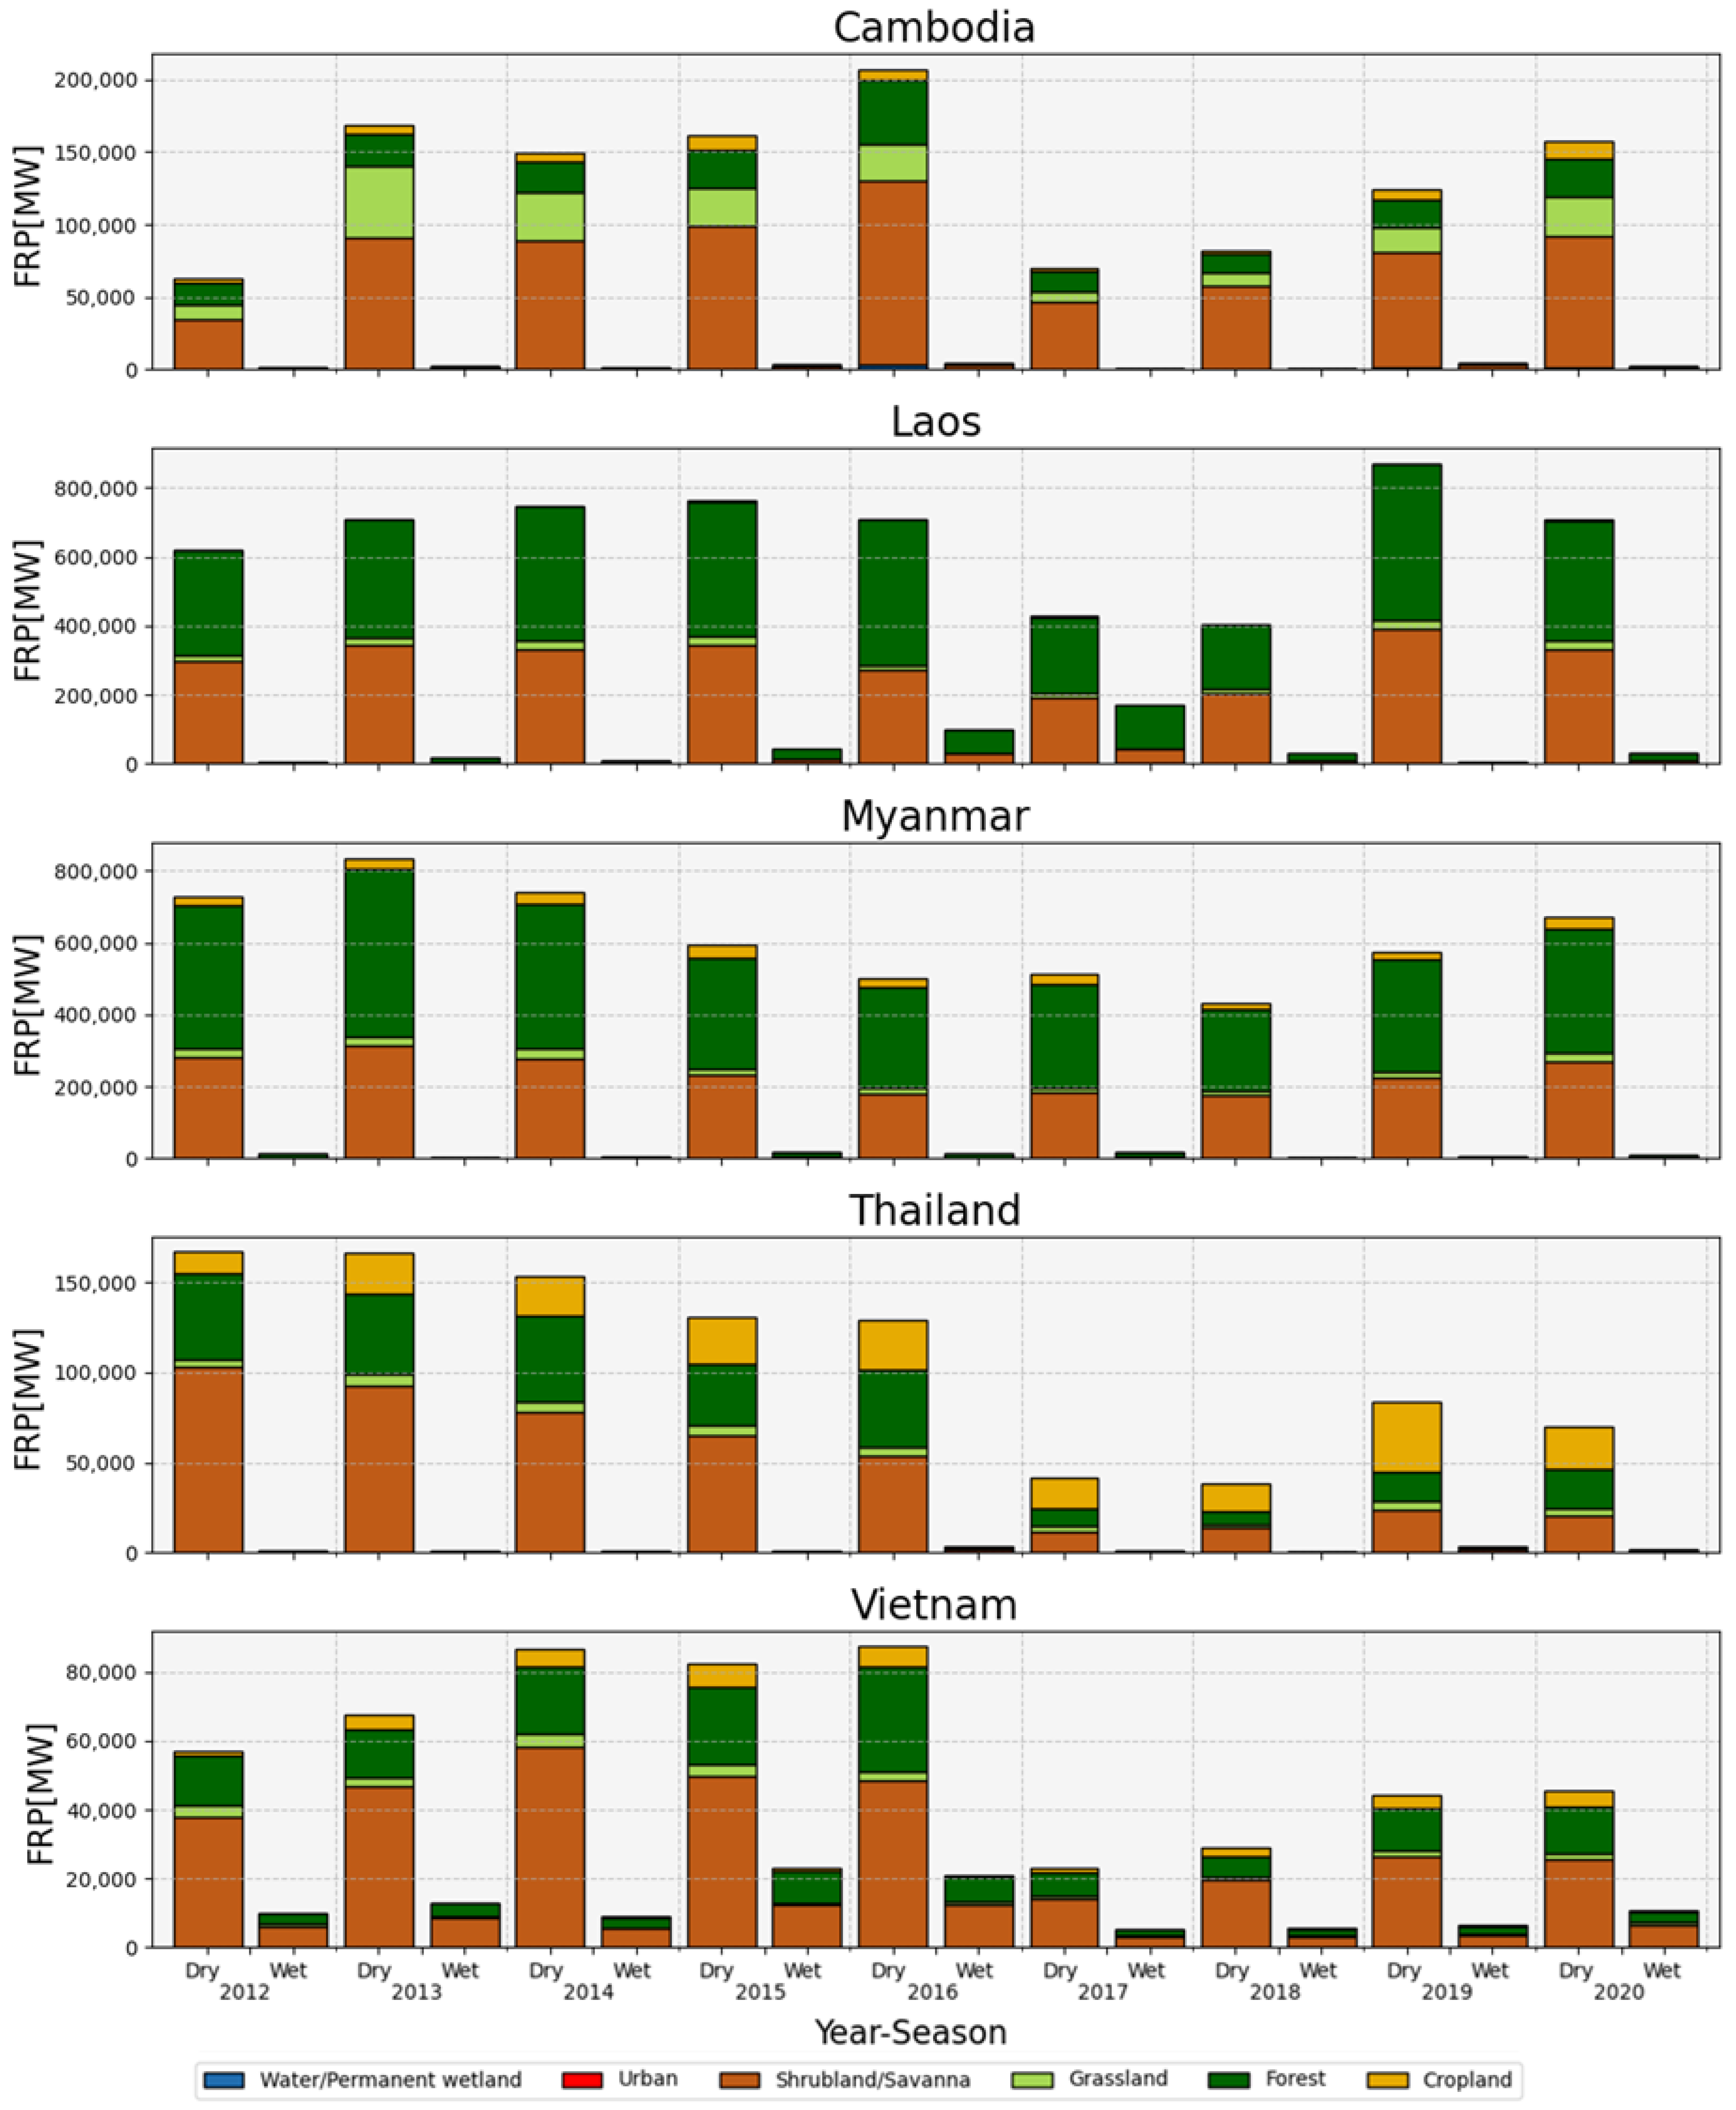
3.1. Seasonal Fire Pattern in the Mekong Countries 2012–2020

The amount of VIIRS-detected fires differs per country (Figure 3). Myanmar displays the highest fire count over the years studied (150,470 fires), followed by Laos (108,478) and Cambodia (63,956). In contrast, Vietnam (25,881) and Thailand (44,525) display significantly lesser fire counts over the years studied. In regard to the temporal distribution, a slightly earlier peak of the fire count is observed for Cambodia while for the rest of the countries, the distribution seems to follow a close pattern.
The hottest and driest period in the region is from November to March [31], a period during which conditions are favorable for wildfires due to lower moisture levels and higher temperatures. When considering all countries cumulatively in our study, a seasonal narrow Gaussian-like distribution can be observed (Figure 4), which starts around December, peaks around March, ends around May, and roughly agrees with the seasonal climate characteristics of the region. In contrast, the rainy and monsoon period (April–October) displays a steep decline in fire activity due to higher rainfall, which moistens the vegetation and reduces the likelihood of fires spreading. Therefore, and taking advantage of this clear temporal pattern observed in Figure 3 and Figure 4, the analysis of subsequent results is presented by binding the monthly data into the two seasons, dry and wet, in order to aggregate seasonal statistics. This distribution per month and year can be useful to stakeholders in terms of the identification of trends and patterns over time. It could also support comparison and benchmarking against historical events.
The spatial distribution of the total fire counts and the fire counts with the 5% highest FRP magnitude was also investigated (Figure 5). In this figure, it is apparent that, for both cases, Myanmar and Laos present the dominant coverage of fire occurrence spatially. In Laos, the fires concentrate mostly in the northern part of the country and secondarily on the easternmost part of the southern part of the country. In Cambodia, fires also tend to occur in the northern part of the country and in Thailand at the northern part and especially at the borders with Myanmar. For Myanmar, there are larger regions and for Vietnam, there are isolated clusters of fire occurrences.

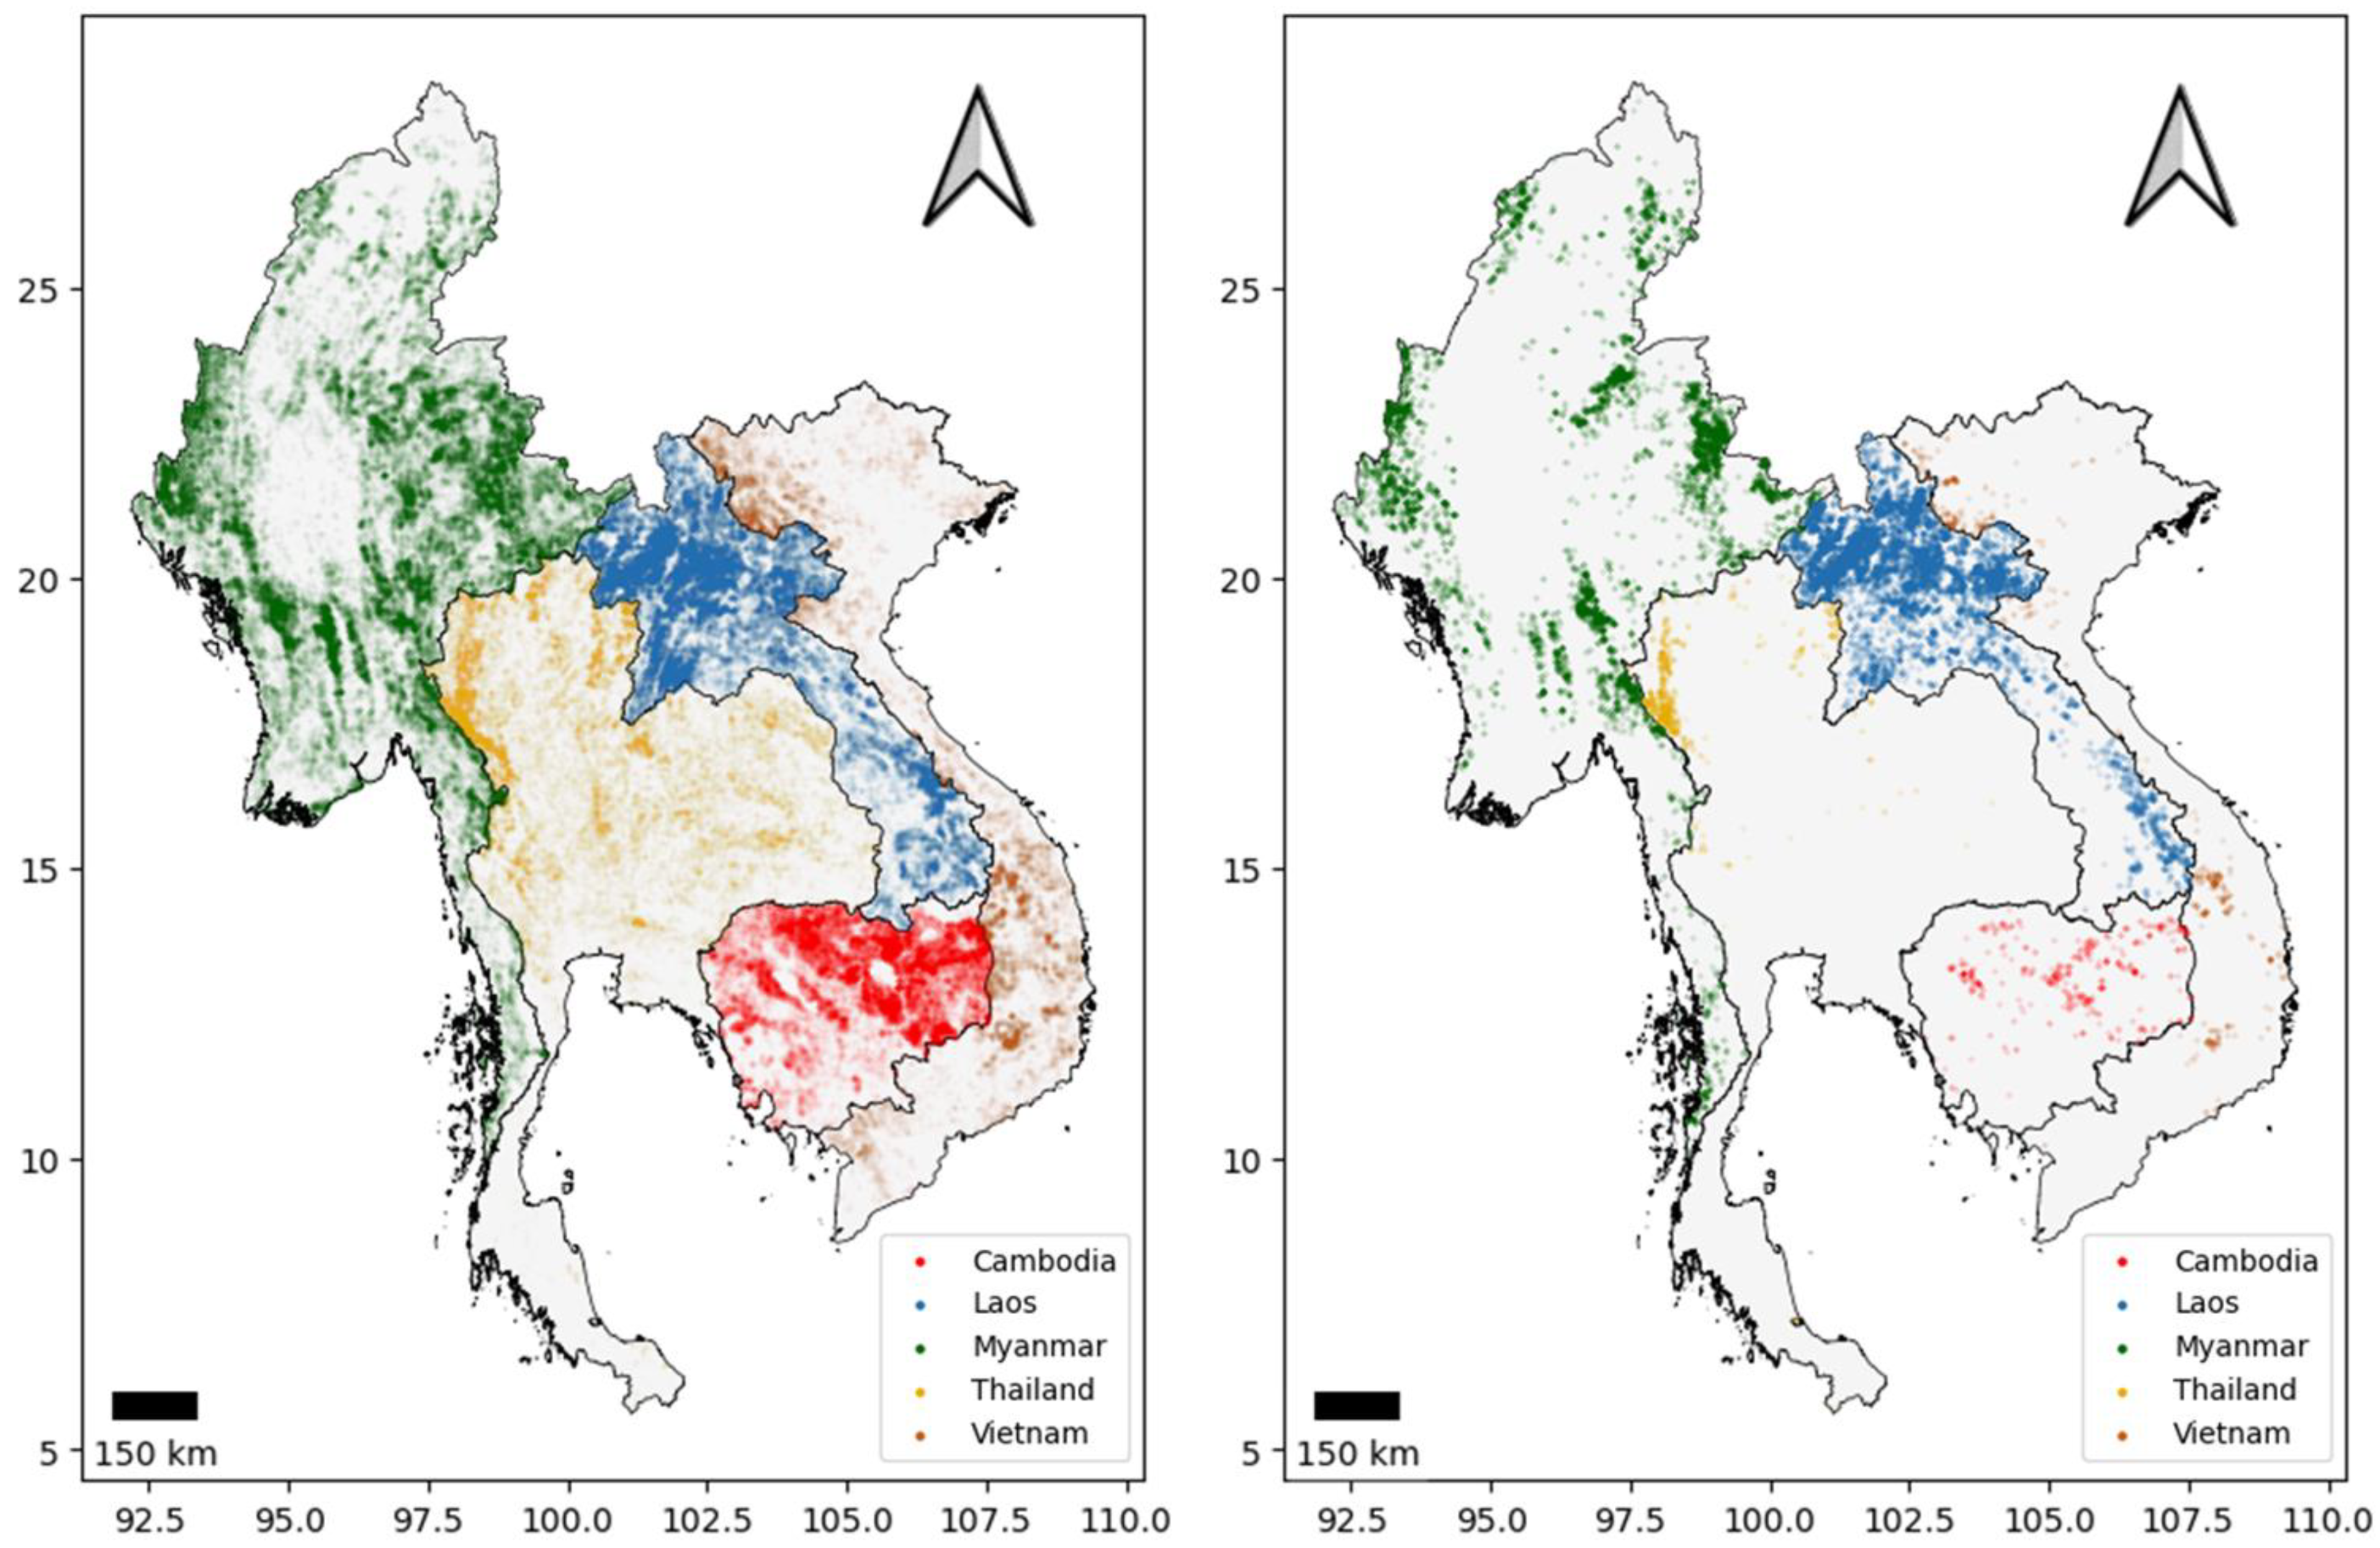
3.2. Fire Patterns per Land Cover

The resulting annual trend suggests that the fire occurrence in land covers differs both spatially and temporally (see Figure 6 and Table 1 and Table 2). In Vietnam and Cambodia, most fires were detected in the shrubland/savanna classes during the years studied (2012–2020). The difference in fire occurrence between the shrubland/savanna classes and the forest classes appears to be smaller in Laos (7.29%) and Myanmar (−5.36%), whereas in Myanmar, most fires were detected in forest classes (44.65%). In Laos, a high percentage of fires (43.40%) were detected in forest classes. Especially in Thailand, high numbers of fires (34.07%) were detected in croplands. For the years 2016–2020, these fires accounted for the largest percentage in Thailand. Overall, only a small number of fires were detected in grasslands, except in Cambodia (16.54%). The classes barren, water/permanent wetlands, and urban display significantly fewer fires for each country.
The cumulative annual FRP per land cover (as indicated in Figure 7 and Table 3 and Table 4) follows a similar trend as the fire count. Especially the fires detected in the shrubland/savanna and forest classes contribute majorly to the annual total FRP. Fires detected in the cropland class contribute less to the annual FRP, indicating that the FRP of cropland fires appears to be smaller than the FRP of forest or shrubland/savanna fires. The distribution of FRP by land cover in each country shows a pattern similar to that of the fire counts. For forests, Myanmar exhibits the highest percentage, while Vietnam shows the greatest portion in shrubland/savanna, Cambodia in grassland, and Thailand in cropland. However, the share of FRP by land cover changes slightly in each country. In most nations, the percentages for grassland and cropland decrease, with an increase observed in the share of forest. This trend is most pronounced in Myanmar and Laos, with increases of 9.61% and 9.00%, respectively. In Thailand, the proportion of cropland significantly drops by 13.09%, while the share of shrubland/savanna markedly increases by 8.46%.

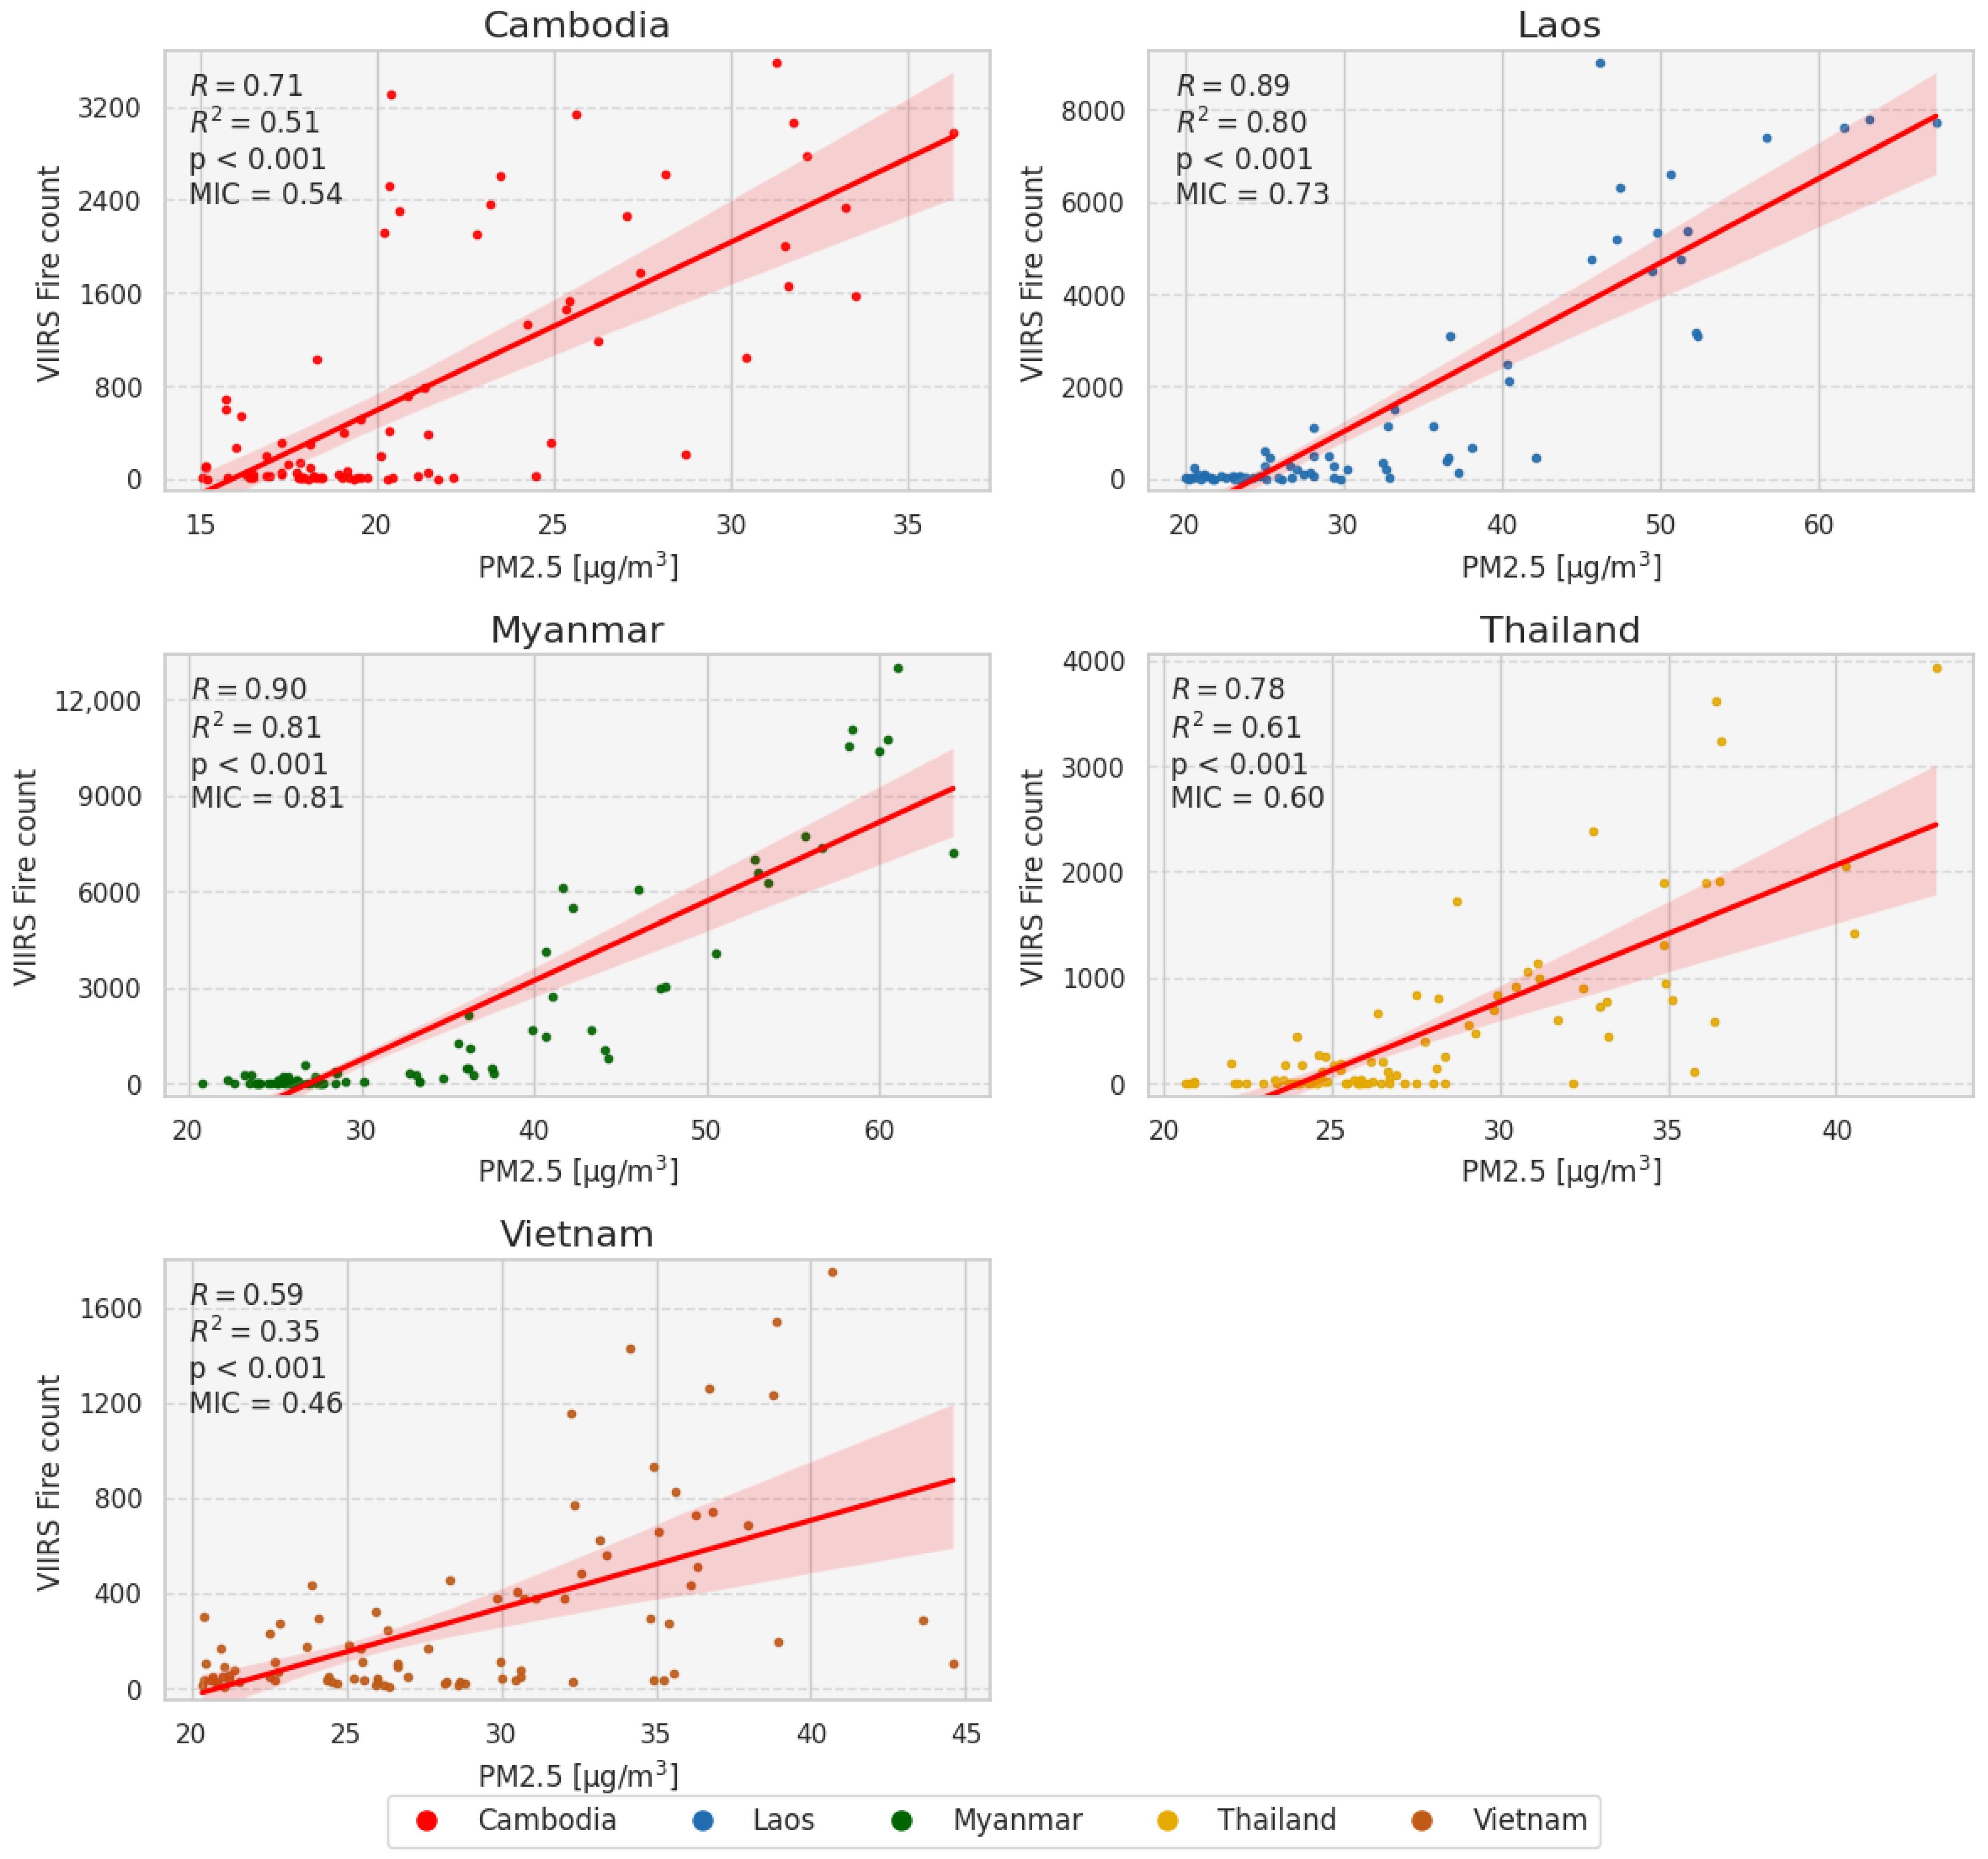
3.3. Monthly Correlation between Fire Counts and PM2.5 Concentrations

The correlations between mean monthly PM2.5 concentrations at the country level and VIIRS fire counts are visualized in Figure 8. The monthly data suggest a statistically significant linear correlation between VIIRS fire counts and mean PM2.5 concentrations for all countries ( p < 0.05 ). Myanmar displays the highest positive correlation ( R = 0.9 ) and coefficient of determination ( R 2 = 0.81 ), followed by Laos and Thailand.
Due to the small number of fires detected in the urban, barren, and water/permanent wetland classes (see Figure 6 and Figure 7), the correlation between FRP, fire count, and PM2.5 was only computed per land cover for fires detected in the forest, cropland, grassland, and shrubland/savanna classes.
Figure 9 presents the monthly correlation between PM2.5 concentrations and VIIRS fire counts per land cover type for all countries combined. The monthly correlation indicates a statistically significant positive correlation for all land covers, except for water/permanent wetlands ( p < 0.05 ). The number of fires detected in forests displays the highest positive correlation, followed by shrubland/savanna, grassland, and cropland. Clusters are visible based on the country, of which the clusters of detected fires in Cambodia and Vietnam show less correlation to monthly PM2.5 estimates compared to other countries, in line with observations from Figure 8. The cumulative results in Figure 8 and Figure 9 have an MIC range between 0.31 and 0.81, which, in combination with the R and p values reported in the results, indicate a linear relationship between the dependent and the independent variables.

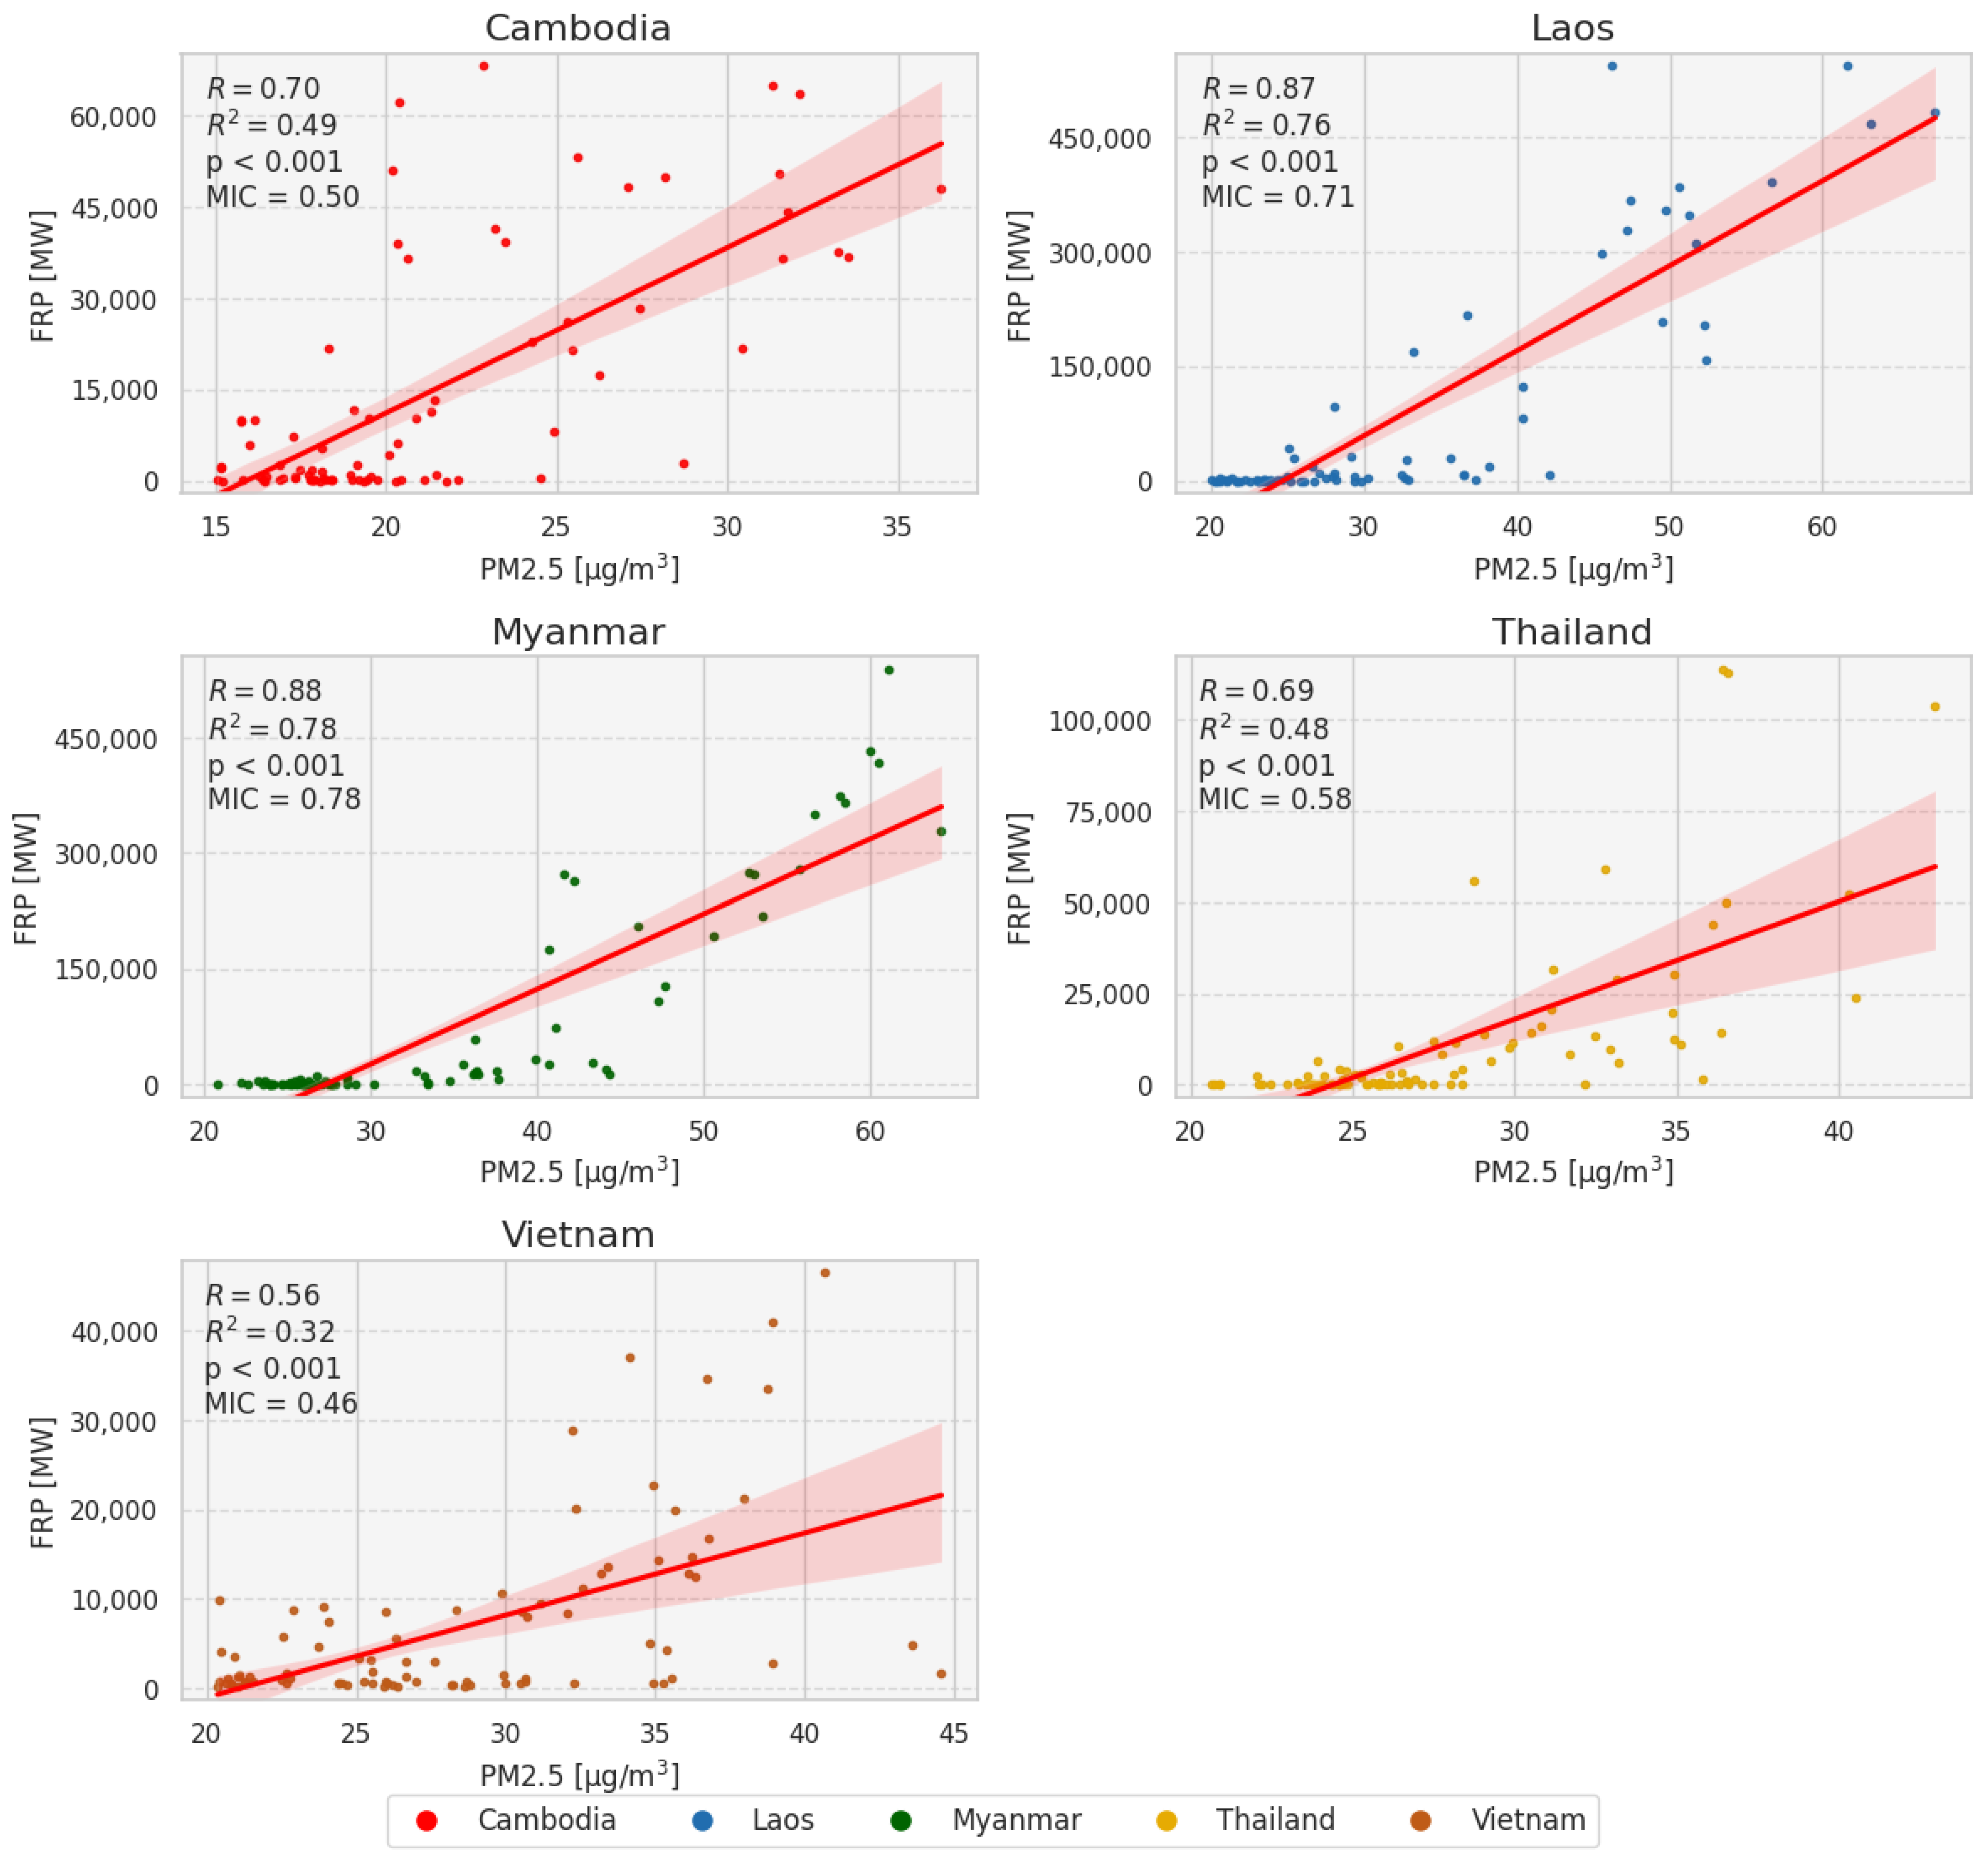
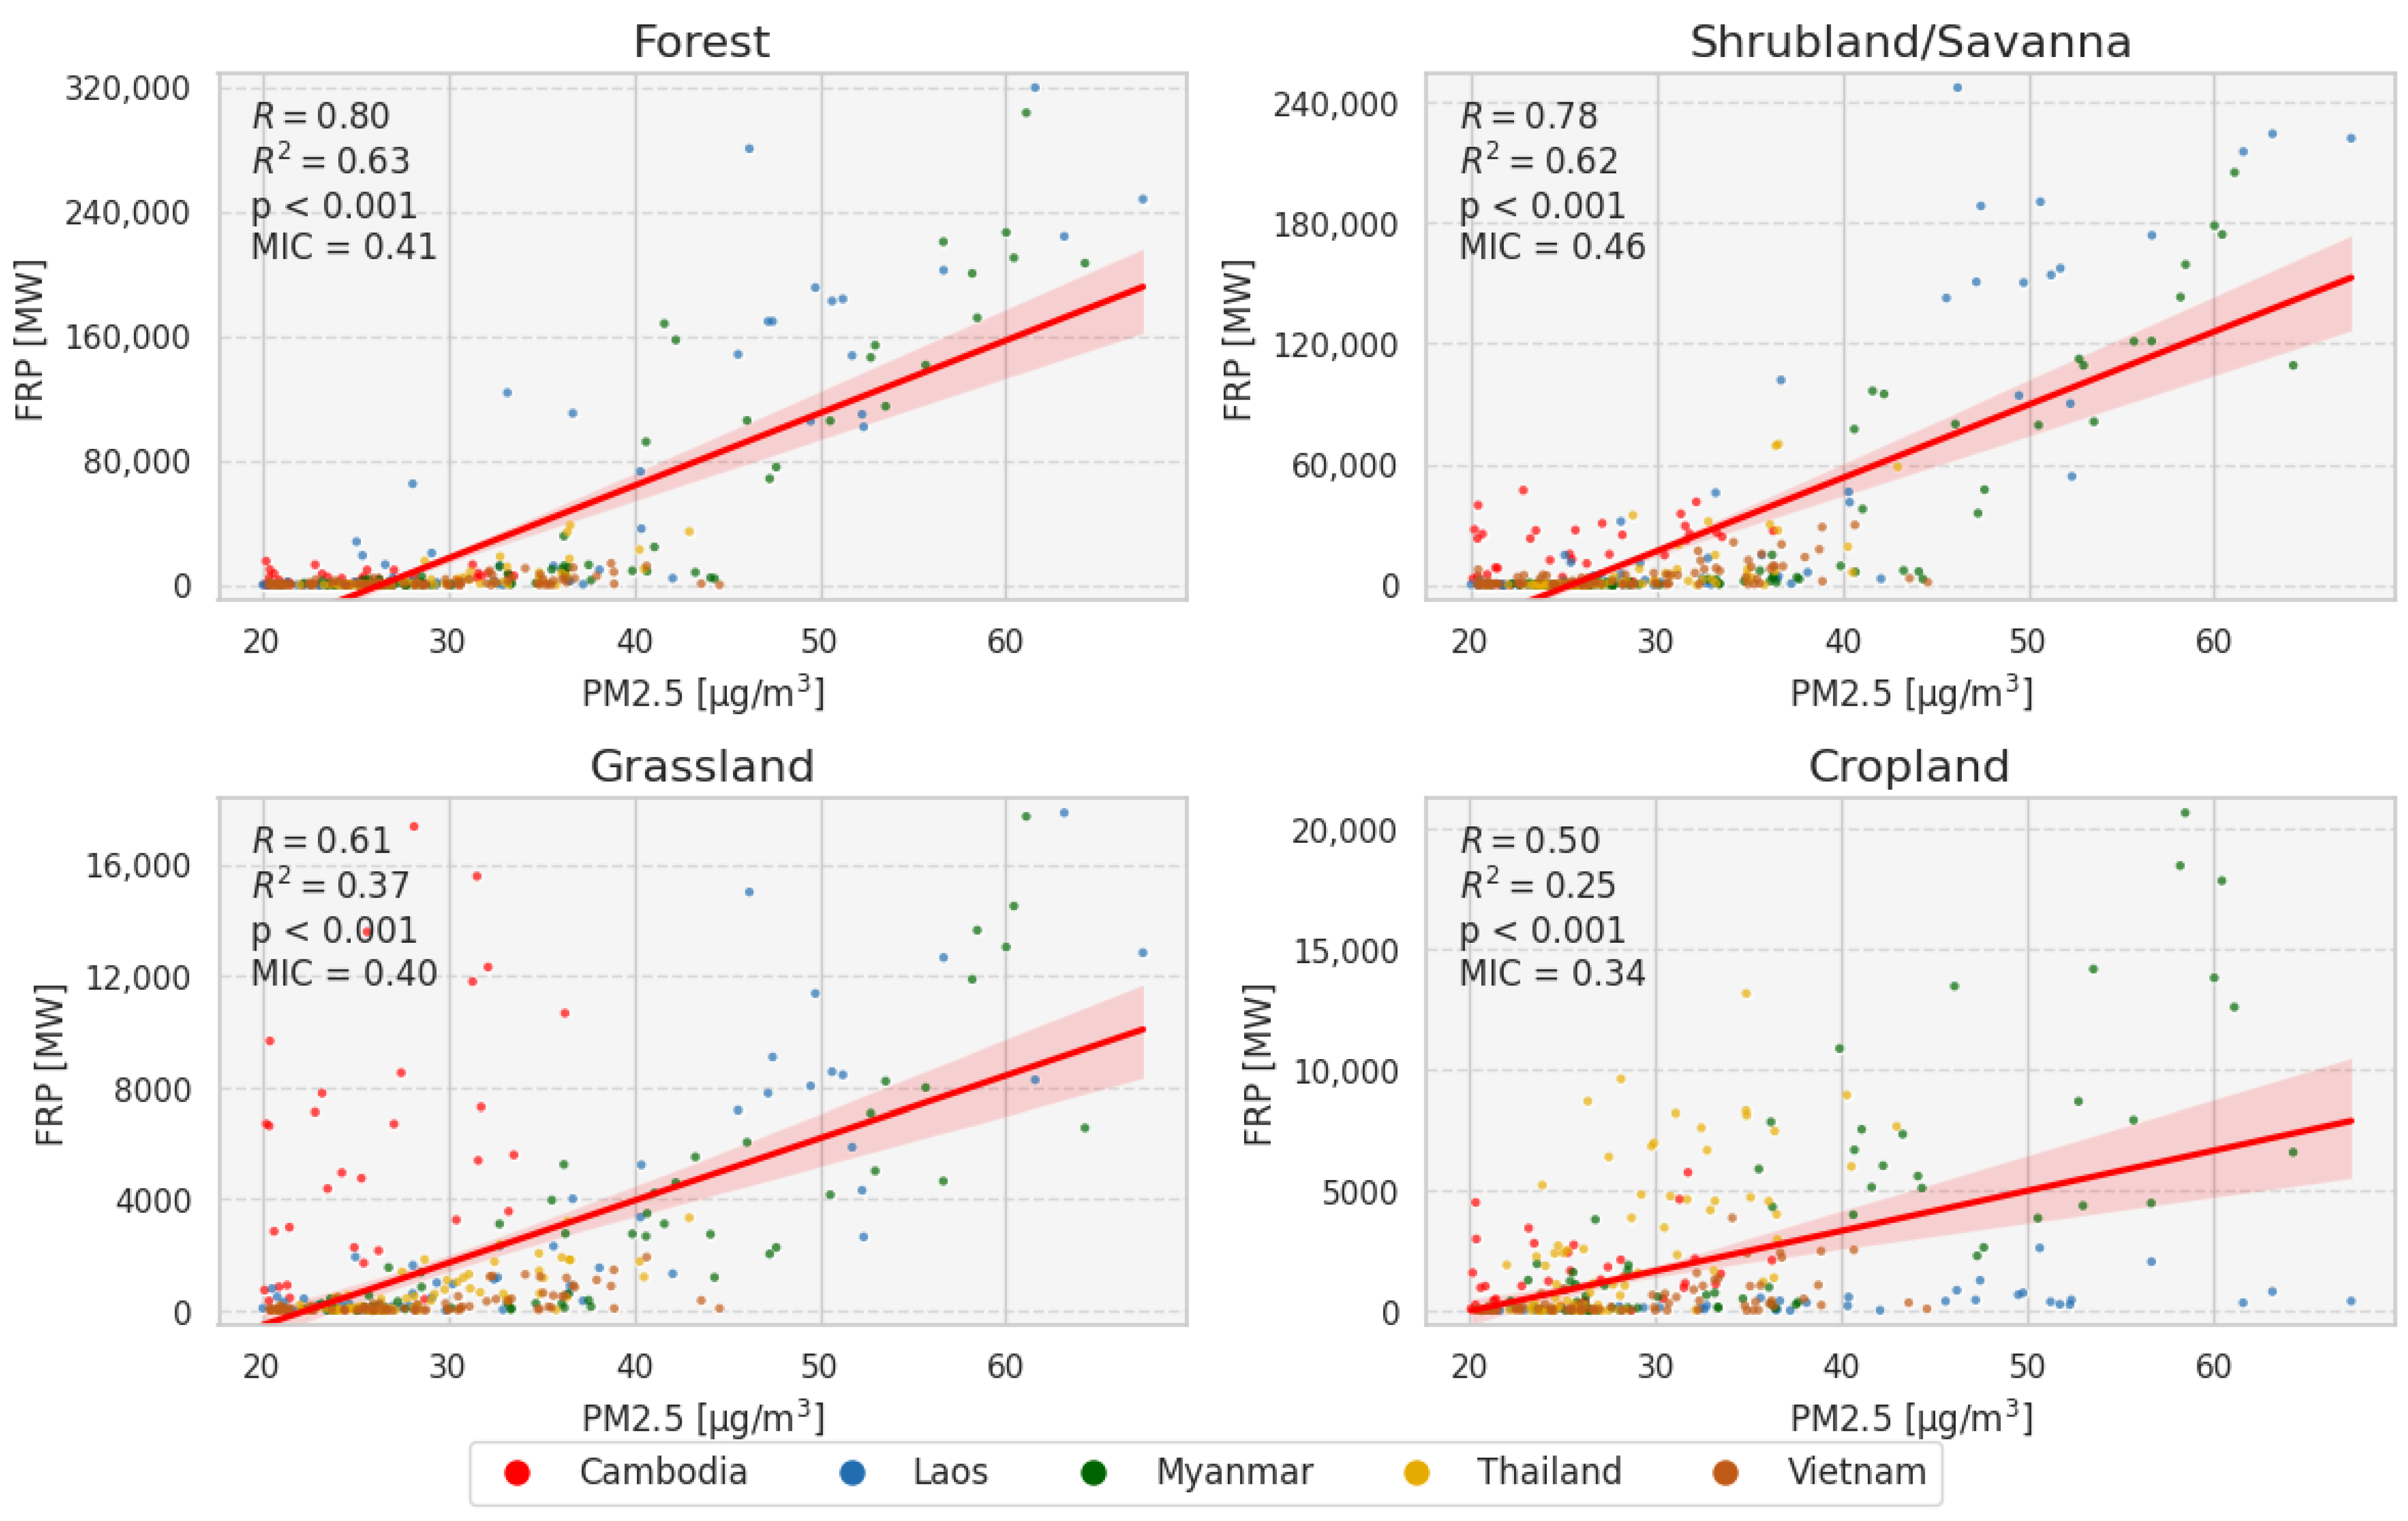
3.4. Monthly Correlation between FRP and PM2.5 Concentration

Figure 10 displays the correlation between monthly cumulative FRP and mean PM2.5 estimates per country. Similar to the fire count, the FRP indicates a significant positive correlation for all countries, where Myanmar and Laos display the strongest correlation ( p < 0.05 ). The total cumulative monthly FRP is much higher in these two countries compared to Thailand, Vietnam, and Cambodia. Between 2012 and 2020, Myanmar had a higher total number of fires (i.e., 150,470) than Laos (i.e., 108,477) (Figure 3); the maximum monthly cumulative FRP appears to be equivalently high, which indicates that the FRP of fires detected in Laos appears to be higher than in Myanmar.
Figure 11 displays the correlation between monthly cumulative FRP and mean PM2.5 estimates per land cover. Similar correlations were observed compared to the monthly fire count (Figure 9), where the FRP of fires detected in forest, shrubland/savanna, cropland, and grassland classes display a significant positive correlation (p < 0.05). Overall, for all land covers, Cambodia displays the lowest cumulative monthly FRP. The cumulative results in Figure 10 and Figure 11 have an MIC range between 0.34 and 0.78, which, in combination with the R and p values reported in the same results, indicate a linear relationship between the dependent and the independent variables.

4. Discussion

In this study, Myanmar has the highest fire count for the years studied, mainly corresponding to the forest class. Myanmar is the country highlighted with the most fire occurrences in a similar highlighted study performed by Vadrevu et al. [11], assessing fire trends in South and Southeast Asia at a country level and vegetation types. The likely cause is the slash-and-burn technique as part of the shifting cultivation of primary or secondary forests, which is a common traditional practice in Myanmar and Cambodia [11,42,43]. For Cambodia, the current study shows a significantly lower percentage of detected fires in forests compared to previous studies [11,42], with higher percentages of fires detected in scrubland/savannas. The simplified global-oriented IGBP land cover definitions used in this study may have affected these observations. For instance, the shrubland/savanna classes may include open forests and orchard plantations that have similar spectral characteristics.
Another potential cause for the higher percentage of fires detected in scrubland/savannas as opposed to forests could be the long-term conversion of deciduous forests to woody savannas due to the repeated burning from anthropogenic impact, which is a known occurrence in parts of northern Cambodia and in a region of Thailand [44,45]. Thailand displays the highest fire count on croplands in recent years, which can be linked to seasonal agricultural residue burning, in line with the initial hypothesis (the distribution of detected VIIRS fires indicates biomass burning patterns within the Lower Mekong region) of this study [46]. After 2016, the fires in croplands increased compared to non-croplands, which could be caused by the conversion of shrubland to agricultural land or an increase in agricultural residue burning and a decline in fire occurrence on other land covers. Statistics from the Food and Agriculture Organization of the United Nations (FAOSTAT) indicate increasing agriculture land area extents (2012–2020) for Thailand and Cambodia but stable or declining curves for the rest of the Mekong countries, which shows that agricultural expansion could be a contributor for the specific area [47].
The study by Vadrevu et al. [11] identifies precipitation patterns as a potential determinant driver for fire occurrence, due to the significantly lower fire count during the annual monsoon season. On the same line, Vadrevu et al. [11] claim that in Southeast Asia, the climate driver which explains variations in fire occurrences is precipitation rather than temperature. Exploring and observing the data year by year (Figure 3) helps to identify any increasing or decreasing trends in fire incidents. For example, there seems to be a decrease in fire counts in Myanmar in 2016 and 2017 and then an increase from 2018 to 2020. Meanwhile, there seems to be a peak in fire counts in 2015 and then a decrease especially in 2017 for Laos, followed by a progressive increase until 2020. Some years may show spikes and lows in fire activity due to various factors such as prolonged droughts, changes in land use practices, or variations in the enforcement of fire management policies. In our study, most fires occur in the much shorter time span of the dry season with the highest fire count around March. This seasonal variation is important to incorporate in fire mitigation strategies and policies because there appears to be a strong link with annual peak emissions occurring between January and March [48].
Figure 6 and Figure 7 show the time series of fire counts and FRP, by country and by land cover type. A notable observation relates to fires detected on cropland classes, which appear to display a lower mean FRP compared to fires detected on shrubland/savanna and forest classes. This fact has been demonstrated to occur in North America, Europe, Southeast Asia, and African savannas in a study examining the association between fire size and fire radiative power across biomes globally [49]. In the same study, they claim that a linear relationship describes the fire radiative power and fire patch size; however, for intermediate-intensity fires this relationship saturates. The value of this threshold differs from one region to another and depends on vegetation type. In line with the second hypothesis (a positive correlation exists between monthly PM2.5 concentrations and 78 monthly VIIRS fire counts, as well as the cumulative monthly FRP), our study suggests statistically significant positive correlations between monthly PM2.5 concentrations and fire counts at country level, a fact that has also been quantified (r = 0.88, p < 0.001) by Yin et al., 16] during the fire season in Southeast Asia. Especially, PM2.5 concentrations of 20 µg/m3 and higher display a strong linear correlation with fire counts, except for Cambodia, where concentrations of 15 µg/m3 and higher display a strong correlation.
This indicates that fire occurrence could be linked to high monthly concentrations of PM2.5 at the country level. Due to the expected positive correlation between fire occurrence and air pollutant concentrations, more specifically PM2.5, spatial and temporal fire patterns can indicate where and when air quality indices may be worse as a consequence of increased fire occurrence [9,50,51]. The positive significant correlation between monthly cumulative FRP and mean PM2.5 concentrations per country (see Figure 9) suggests similar correlations as the fire count; however, this provides a better indicator of fire extent. FRP describes the intensity of a fire and is often used as a proxy for fire extent in remote sensing and wildfire monitoring applications. Higher FRP values indicate larger and more intense fires, while lower values correspond to smaller or less intense fires. Thus, the FRP can potentially form an important indicator of PM2.5 levels at higher air pollution levels compared to fire count alone. Moreover, statistically significant correlations were observed between monthly fire counts and FRP related to different land cover types and monthly PM2.5 concentrations. The high positive correlation between PM2.5 concentrations and detected fires in the forest and shrubland/savanna classes substantiates previous findings that fire emissions in mainland Southeast Asia primarily originate from deforestation and savanna fires [9]. As a result, this study suggests that monitoring forest and shrubland/savanna fires is especially important in Myanmar, given the high fire count detected for these classes and the high cumulative FRP values.
It should, however, be noted that the assessment of the correlation between PM2.5, fire count, and FRP is at a coarse spatial level (due to the monthly temporal interval and the country-level mean PM2.5 estimates). This correlation can be influenced by various emission sources other than fire occurrence.
Another uncertainty involved in this study that should be taken into consideration is the absence of ground reference fire data at a large scale, due to which the accuracy of the VIIRS active fire product and land cover datasets could not be validated. The influence of duplicated fire detections and missing data caused by cloud obstruction was, therefore, not quantified, and this could be the focus of a future study. Similarly, the PM2.5 concentrations used in this study are estimates of the real PM2.5 concentrations, which include uncertainties and deviations from reality [27]. To decrease the uncertainty related to the spatial and temporal resolution, it is planned to further analyze the correlation between PM2.5 estimates and fire characteristics at smaller spatial and temporal scales with the additional aim of quantifying the influence of external factors. For example, Pleiades satellites provide high-resolution imagery suitable for detecting and analyzing fire characteristics with good detail. Similarly, it is recommended to further investigate this relation by expanding the statistical analysis beyond the correlation coefficient used in this study. Lastly, future studies could incorporate VIIRS fire hotspots with all confidence levels, which was out of the scope of this initial work.

5. Conclusions

Climate change as well as land use and land management changes affect fire regimes over different time periods and regions [52,53]. The frequency and intensity of fires have an impact on air quality and consequently on human and ecosystem health. To that end, identifying fire patterns can provide valuable information for the integration of wildfire-related considerations into different scale policies and development planning and the improved management of the occurrence of excessive application of fire in land use. The results of this study indicate that remotely sensed VIIRS fire hotspot data in combination with descriptive environmental datasets can aid the understanding of fire distributions, cumulative monthly FRP, and mean country-level PM2.5 emissions at different spatial and temporal scales. Our results highlight the importance of monitoring forest and shrubland/savanna fires in the Mekong region given the high statistically significant positive correlation with mean monthly PM2.5 concentrations and associated negative effects of PM2.5 exposure. The main occurrence of fires and previously identified high PM2.5 concentrations were detected during the dry season (November–March). The fire patterns observed are in some cases associated with crop residue burning activity in Thailand and shifting cultivation in Myanmar during recent years. This study can provide useful information to drive and facilitate policy-making and land practice discussions and decisions regarding the fire season identified. These discussions, when data-driven, could support the inclusion of different perspectives and the identification of capacity-building mechanisms to address the problem. The decisions might include more robust regulations on land use, incentives and training for sustainable agricultural practices, and the identification and adoption of conservation measures. Methodologies like ours would also allow for ongoing monitoring and evaluation that are critical to assessing the effectiveness of established policies and interventions.

Author Contributions

Conceptualization, Dimitris Stratoulias, Nektaria Adaktylou and Julia Borgman; methodology, Dimitris Stratoulias, Nektaria Adaktylou and Julia Borgman; data curation, Julia Borgman and Sangwoo Cha; writing—original draft preparation, Julia Borgman, Dimitris Stratoulias and Nektaria Adaktylou; writing—review and editing, Dimitris Stratoulias, Nektaria Adaktylou, Julia Borgman, Sangwoo Cha, Devara P. Adiningrat and Narissara Nuthammachot. All authors have read and agreed to the published version of the manuscript.

Funding

This research received no external funding.

Data Availability Statement

The data used in the current study are freely available in the public domain.

Conflicts of Interest

The authors declare no conflict of interest.

References

  1. Lee, H.-H.; Iraqui, O.; Gu, Y.; Yim, S.H.-L.; Chulakadabba, A.; Tonks, A.Y.-M.; Yang, Z.; Wang, C. Impacts of air pollutants from fire and non-fire emissions on the regional air quality in Southeast Asia. Atmos. Chem. Phys. 2018, 18, 6141–6156. [Google Scholar] [CrossRef]
  2. Groß, S.; Esselborn, M.; Weinzierl, B.; Wirth, M.; Fix, A.; Petzold, A. Aerosol classification by airborne high spectral resolution lidar observations. Atmos. Chem. Phys. 2013, 13, 2487–2505. [Google Scholar] [CrossRef]
  3. Vicente, A.; Alves, C.; Calvo, A.I.; Fernandes, A.P.; Nunes, T.; Monteiro, C.; Almeida, S.M.; Pio, C. Emission factors and detailed chemical composition of smoke particles from the 2010 wildfire season. Atmos. Environ. 2013, 71, 295–303. [Google Scholar] [CrossRef]
  4. Curtis, L.; Rea, W.; Smith-Willis, P.; Fenyves, E.; Pan, Y. Adverse health effects of outdoor air pollutants. Environ. Int. 2006, 32, 815–830. [Google Scholar] [CrossRef] [PubMed]
  5. Mannucci, P.; Franchini, M. Health Effects of Ambient Air Pollution in Developing Countries. Int. J. Environ. Res. Public Health 2017, 14, 1048. [Google Scholar] [CrossRef]
  6. Aguilera, R.; Corringham, T.; Gershunov, A.; Benmarhnia, T. Wildfire smoke impacts respiratory health more than fine particles from other sources: Observational evidence from Southern California. Nat. Commun. 2021, 12, 1493. [Google Scholar] [CrossRef] [PubMed]
  7. Junpen, A.; Roemmontri, J.; Boonman, A.; Cheewaphongphan, P.; Thao, P.T.B.; Garivait, S. Spatial and Temporal Distribution of Biomass Open Burning Emissions in the Greater Mekong Subregion. Climate 2020, 8, 90. [Google Scholar] [CrossRef]
  8. Quah, E.; Johnston, D. Forest fires and environmental haze in Southeast Asia: Using the ‘stakeholder’ approach to assign costs and responsibilities. J. Environ. Manag. 2001, 63, 181–191. [Google Scholar] [CrossRef]
  9. Reddington, C.L.; Conibear, L.; Robinson, S.; Knote, C.; Arnold, S.R.; Spracklen, D.V. Air Pollution from Forest and Vegetation Fires in Southeast Asia Disproportionately Impacts the Poor. GeoHealth 2021, 5, e2021GH000418. [Google Scholar] [CrossRef]
  10. Spruce, J.; Bolten, J.; Mohammed, I.N.; Srinivasan, R.; Lakshmi, V. Mapping Land Use Land Cover Change in the Lower Mekong Basin From 1997 to 2010. Front. Environ. Sci. 2020, 8, 21. Available online: https://www.frontiersin.org/articles/10.3389/fenvs.2020.00021 (accessed on 1 June 2024). [CrossRef]
  11. Vadrevu, K.P.; Lasko, K.; Giglio, L.; Schroeder, W.; Biswas, S.; Justice, C. Trends in Vegetation fires in South and Southeast Asian Countries. Sci. Rep. 2019, 9, 7422. [Google Scholar] [CrossRef] [PubMed]
  12. Mittelman, A. Secondary Forests in the Lower Mekong Subregion: An Overview of their Extent, Roles and Importance. J. Trop. For. Sci. 2001, 13, 20. Available online: http://www.jstor.org/stable/43582366 (accessed on 1 June 2024).
  13. Hongthong, A.; Nanthapong, K.; Kanabkaew, T. Biomass burning emission inventory of multi-year PM 10 and PM 2.5 with high temporal and spatial resolution for Northern Thailand. Sci. Asia 2022, 48, 302–309. [Google Scholar] [CrossRef]
  14. Thepnuan, D.; Chantara, S.; Lee, C.T.; Lin, N.H.; Tsai, Y.I. Molecular markers for biomass burning associated with the characterization of PM2.5 and component sources during dry season haze episodes in Upper South East Asia. Sci. Total Environ. 2019, 658, 708–722. [Google Scholar] [CrossRef] [PubMed]
  15. Fan, W.; Li, J.; Han, Z.; Wu, J.; Zhang, S.; Zhang, C.; Li, J. Impacts of biomass burning in Southeast Asia on aerosols over the low-latitude plateau in China: An analysis of a typical pollution event. Front. Environ. Sci. 2023, 11, 1101745. [Google Scholar] [CrossRef]
  16. Yin, S.; Wang, X.; Zhang, X.; Guo, M.; Miura, M.; Xiao, Y. Influence of biomass burning on local air pollution in mainland Southeast Asia from 2001 to 2016. Environ. Pollut. 2019, 254, 112949. [Google Scholar] [CrossRef] [PubMed]
  17. Fu, Y.; Li, R.; Wang, X.; Bergeron, Y.; Valeria, O.; Chavardès, R.D.; Wang, Y.; Hu, J. Fire Detection and Fire Radiative Power in Forests and Low-Biomass Lands in Northeast Asia: MODIS versus VIIRS Fire Products. Remote Sens. 2020, 12, 2870. [Google Scholar] [CrossRef]
  18. Ichoku, C.; Ellison, L. Global top-down smoke-aerosol emissions estimation using satellite fire radiative power measurements. Atmos. Chem. Phys. 2014, 14, 6643–6667. [Google Scholar] [CrossRef]
  19. Kaiser, J.W.; Heil, A.; Andreae, M.O.; Benedetti, A.; Chubarova, N.; Jones, L.; Morcrette, J.-J.; Razinger, M.; Schultz, M.G.; Suttie, M.; et al. Biomass burning emissions estimated with a global fire assimilation system based on observed fire radiative power. Biogeosciences 2012, 9, 527–554. [Google Scholar] [CrossRef]
  20. Nguyen, H.M.; Wooster, M.J. Advances in the estimation of high Spatio-temporal resolution pan-African top-down biomass burning emissions made using geostationary fire radiative power (FRP) and MAIAC aerosol optical depth (AOD) data. Remote Sens. Environ. 2020, 248, 111971. [Google Scholar] [CrossRef]
  21. Wooster, M.J.; Roberts, G.; Perry GL, W.; Kaufman, Y.J. Retrieval of biomass combustion rates and totals from fire radiative power observations: FRP derivation and calibration relationships between biomass consumption and fire radiative energy release. J. Geophys. Res. 2005, 110, D24311. [Google Scholar] [CrossRef]
  22. Zhang, X.; Kondragunta, S.; Ram, J.; Schmidt, C.; Huang, H.-C. Near-real-time global biomass burning emissions product from geostationary satellite constellation: GLOBAL BIOMASS BURNING EMISSIONS. J. Geophys. Res. Atmos. 2012, 117, D14201. [Google Scholar] [CrossRef]
  23. Nuthammachot, N.; Askar, A.; Stratoulias, D.; Wicaksono, P. Combined use of Sentinel-1 and Sentinel-2 data for improving above-ground biomass estimation. Geocarto Int. 2022, 37, 366–376. [Google Scholar] [CrossRef]
  24. Schroeder, W.; Oliva, P.; Giglio, L.; Csiszar, I.A. The New VIIRS 375 m active fire detection data product: Algorithm description and initial assessment. Remote Sens. Environ. 2014, 143, 85–96. [Google Scholar] [CrossRef]
  25. Hantson, S.; Arneth, A.; Harrison, S.P.; Kelley, D.I.; Prentice, I.C.; Rabin, S.S.; Archibald, S.; Mouillot, F.; Arnold, S.R.; Artaxo, P.; et al. The status and challenge of global fire modelling. Biogeosciences 2016, 13, 3359–3375. [Google Scholar] [CrossRef]
  26. Handschuh, J.; Erbertseder, T.; Schaap, M.; Baier, F. Estimating PM2.5 surface concentrations from AOD: A combination of SLSTR and MODIS. Remote Sens. Appl. Soc. Environ. 2022, 26, 100716. [Google Scholar] [CrossRef]
  27. van Donkelaar, A.; Hammer, M.S.; Bindle, L.; Brauer, M.; Brook, J.R.; Garay, M.J.; Hsu, N.C.; Kalashnikova, O.V.; Kahn, R.A.; Lee, C.; et al. Monthly Global Estimates of Fine Particulate Matter and Their Uncertainty. Environ. Sci. Technol. 2021, 55, 15287–15300. [Google Scholar] [CrossRef]
  28. Ding, Y.; Li, S.; Xing, J.; Li, X.; Ma, X.; Song, G.; Teng, M.; Yang, J.; Dong, J.; Meng, S. Retrieving hourly seamless PM2.5 concentration across China with physically informed spatiotemporal connection. Remote Sens. Environ. 2024, 301, 113901. [Google Scholar] [CrossRef]
  29. He, Q.; Wang, M.; Yim, S.H.L. The spatiotemporal relationship between PM 2.5 and aerosol optical depth in China: Influencing factors and implications for satellite PM 2.5 estimations using MAIAC aerosol optical depth. Atmos. Chem. Phys. 2021, 21, 18375–18391. [Google Scholar] [CrossRef]
  30. Vadrevu, K.; Eaturu, A. Trends in Nighttime Fires in South/Southeast Asian Countries. Atmosphere 2024, 15, 85. [Google Scholar] [CrossRef]
  31. Chuan, G.K. The Climate of Southeast Asia. Phys. Geogr. Southeast Asia 2005, 4, 80. [Google Scholar] [CrossRef]
  32. Vadrevu, K.P.; Ohara, T.; Justice, C. (Eds.) Biomass Burning in South and Southeast Asia: Impacts on the Biosphere; CRC Press: Boca Raton, FL, USA, 2021; Volume 2. [Google Scholar]
  33. Li, P.; Xiao, C.; Feng, Z.; Li, W.; Zhang, X. Occurrence frequencies and regional variations in Visible Infrared Imaging Radiometer Suite (VIIRS) global active fires. Glob. Change Biol. 2020, 26, 2970–2987. [Google Scholar] [CrossRef] [PubMed]
  34. Vadrevu, K.; Lasko, K. Intercomparison of MODIS AQUA and VIIRS I-Band fires and emissions in an agricultural landscape-Implications for air pollution research. Remote Sens. 2018, 10, 978. [Google Scholar] [CrossRef] [PubMed]
  35. Lu, X.; Zhang, X.; Li, F.; Cochrane, M.A.; Ciren, P. Detection of Fire Smoke Plumes Based on Aerosol Scattering Using VIIRS Data over Global Fire-Prone Regions. Remote Sens. 2021, 13, 196. [Google Scholar] [CrossRef]
  36. Li, F.; Zhang, X.; Kondragunta, S.; Csiszar, I. Comparison of Fire Radiative Power Estimates from VIIRS and MODIS Observations. J. Geophys. Res. Atmos. 2018, 123, 4545–4563. [Google Scholar] [CrossRef]
  37. Friedl, M.A.; Sulla-Menashe, D.; Tan, B.; Schneider, A.; Ramankutty, N.; Sibley, A.; Huang, X. MODIS Collection 5 global land cover: Algorithm refinements and characterization of new datasets. Remote Sens. Environ. 2010, 114, 168–182. [Google Scholar] [CrossRef]
  38. Sulla-Menashe, D.; Friedl, M.A. User Guide to Collection 6 MODIS Land Cover (MCD12Q1 and MCD12C1) Product. 2018; pp. 1–18. Available online: https://lpdaac.usgs.gov/documents/101/MCD12_User_Guide_V6.pdf (accessed on 14 June 2024).
  39. Adaktylou, N.; Stratoulias, D.; Landenberger, R. Wildfire Risk Assessment Based on Geospatial Open Data: Application on Chios, Greece. ISPRS Int. J. Geo-Inf. 2020, 9, 516. [Google Scholar] [CrossRef]
  40. Gorelick, N.; Hancher, M.; Dixon, M.; Ilyushchenko, S.; Thau, D.; Moore, R. Google Earth Engine: Planetary-scale geospatial analysis for everyone. Remote Sens. Environ. 2017, 202, 18–27. [Google Scholar] [CrossRef]
  41. Freedman, D.; Pisani, R.; Purves, R. Statistics, 4th ed.; W.W. Norton & Co.: New York, NY, USA, 2007. [Google Scholar]
  42. Jones, S.H. Vegetation fire and land use in Southeast Asia: The interpretation of remotely sensed data for Cambodia. Geocarto Int. 1998, 13, 63–73. [Google Scholar] [CrossRef]
  43. Thet, A.P.P.; Tokuchi, N. Traditional knowledge on shifting cultivation of local communities in Bago Mountains, Myanmar. J. For. Res. 2020, 25, 347–353. [Google Scholar] [CrossRef]
  44. Rundel, P.W. Forest Habitats and Flora in Lao PDR, Cambodia, and Vietnam. Hanoi: WWF Indochina Programme. 1999. Available online: https://www.researchgate.net/publication/259623025_Forest_Habitats_and_Flora_in_Laos_PDR_Cambodia_and_Vietnam (accessed on 14 June 2024).
  45. Ratnam, J.; Tomlinson, K.W.; Rasquinha, D.N.; Sankaran, M. Savannahs of Asia: Antiquity, biogeography, and an uncertain future. Philos. Trans. R. Soc. B Biol. Sci. 2016, 371, 20150305. [Google Scholar] [CrossRef]
  46. Kumar, I.; Bandaru, V.; Yampracha, S.; Sun, L.; Fungtammasan, B. Limiting rice and sugarcane residue burning in Thailand: Current status, challenges and strategies. J. Environ. Manag. 2020, 276, 111228. [Google Scholar] [CrossRef]
  47. FAO. FAOSTAT Land, Inputs and Sustainability, Land Use. 2022. Available online: https://www.fao.org/faostat/en/#data/RL/visualize (accessed on 14 June 2024).
  48. Shi, Y.; Tian, Y.; Zang, S.; Yamaguchi, Y.; Matsunaga, T.; Li, Z.; Gu, X. Estimating Biomass Burning Emissions in South Southeast Asia from 2001 to 2017 Based on Satellite Observations In Biomass Burning in South and Southeast Asia, 1st ed.; Vadrevu, K.P., Ohara, T., Justice, C., Eds.; CRC Press: Boca Raton, FL, USA, 2021; pp. 79–93. [Google Scholar] [CrossRef]
  49. Laurent, P.; Mouillot, F.; Moreno, M.V.; Yue, C.; Ciais, P. Varying relationships between fire radiative power and fire size at a global scale. Biogeosciences 2019, 16, 275–288. [Google Scholar] [CrossRef]
  50. Arunrat, N.; Pumijumnong, N.; Sereenonchai, S. Air-Pollutant Emissions from Agricultural Burning in Mae Chaem Basin, Chiang Mai Province, Thailand. Atmosphere 2018, 9, 145. [Google Scholar] [CrossRef]
  51. Sirimongkonlertkun, N. Effect From Open Burning at Greater Mekong Sub-Region Nations to The PM10 Concentration in Northern Thailand: A Case Study of Backword Trajectories in March 2012 at Chiang Rai Province. In Proceedings of the 1st Mae Fah Luang University International Conference, 29–30 November–1 December 2012; pp. 29–30. Available online: https://mfuic2012.mfu.ac.th/electronic_proceeding/Documents/00_PDF/O-SC-D/O-SC-D-008.pdf (accessed on 14 June 2024).
  52. Brotons, L.; Aquilué, N.; De Cáceres, M.; Fortin, M.J.; Fall, A. How fire history, fire suppression practices and climate change affect wildfire regimes in Mediterranean landscapes. PLoS ONE 2013, 8, e62392. [Google Scholar] [CrossRef]
  53. Sayedi, S.S.; Abbott, B.W.; Vannière, B.; Leys, B.; Colombaroli, D.; Gil Romera, G.; Słowiński, M.; Aleman, J.C.; Blarquez, O.; Feurdean, A.; et al. Assessing changes in global fire regimes. Fire Ecol. 2024, 20, 1–22. [Google Scholar] [CrossRef]
Figure 1. Main land cover classes encountered in the study area encompassing the five Mekong countries.
Ijgi 13 00206 g001
Figure 2. Workflow depicting the analytical methodology.
Ijgi 13 00206 g002
Figure 3. The temporal distribution of the VIIRS active fire counts per country for the years 2012–2020.
Ijgi 13 00206 g003
Figure 4. Cumulative monthly VIIRS active fire count in the Mekong region per year for 2012–2020 and the average distribution (dashed curve).
Ijgi 13 00206 g004
Figure 5. Spatial distribution of the 393,308 fire occurrences between 2012 and 2020 in the Mekong region (left) and the spatial distribution of the 19,665 fire counts with the 5% highest FRP magnitude (right). In the right subfigure, the size of each dot (representing a single fire occurrence) is proportional to the magnitude of the FRP value for each fire count.
Ijgi 13 00206 g005
Figure 6. Annual VIIRS active fire counts per simplified MODIS land cover class and country for 2012–2020.
Ijgi 13 00206 g006
Figure 7. Annual cumulative FRP per simplified MODIS land cover class and country for 2012–2020.
Ijgi 13 00206 g007
Figure 8. Correlation between monthly fire counts and mean PM2.5 estimates per country for the years 2012–2020. Red line indicates the linear regression and shaded buffer area is the 95% confidence interval.
Ijgi 13 00206 g008
Figure 9. Correlation between monthly fire counts and mean PM2.5 estimates per land cover type for 2012–2020 in the Mekong region. Red line indicates the linear regression and shaded buffer area is the 95% confidence interval.
Ijgi 13 00206 g009
Figure 10. Correlation between monthly cumulative FRP and mean PM2.5 estimates per country for 2012–2020. Red line indicates the linear regression and shaded buffer area is the 95% confidence interval.
Ijgi 13 00206 g010
Figure 11. Correlation between monthly cumulative FRP and mean PM2.5 estimates per land cover type for the years 2012–2020 in the Mekong region. Red line indicates the linear regression and shaded buffer area is the 95% confidence interval.
Ijgi 13 00206 g011
Table 1. Proportions of annual VIIRS active fire counts per simplified MODIS land cover class and country for 2012–2020.
Land CoverCambodiaLaosMyanmarThailandVietnam
Forest16.2343.4044.6520.2223.19
Shrubland/Savanna59.6750.6939.2938.7261.09
Grassland16.545.265.166.635.00
Cropland6.770.6310.7234.0710.37
Urban0.0170.0060.0290.2560.193
Barren--0.003--
Water/Permanent Wetland0.7720.0200.1470.0900.158
Total Fire Counts63,955108,477150,47044,52525,881
Table 2. Proportions of seasonal VIIRS active fire counts per simplified MODIS land cover class and country for 2012–2020.
CambodiaLaosMyanmarThailandVietnam
Land CoverDryWetDryWetDryWetDryWetDryWet
Forest16.090.1440.522.8843.670.9820.010.2218.404.80
Shrubland/Savanna58.930.7449.061.6238.760.5337.880.8451.989.11
Grassland16.040.505.170.095.080.086.470.164.290.70
Cropland6.720.060.620.0110.520.2033.500.589.590.78
Urban0.0160.0020.006-0.0280.0010.2380.0180.1280.066
Barren----0.003-----
Water/Permanent Wetland0.6360.1360.020-0.1300.0170.0650.0250.1240.035
Season Proportion98.431.5795.414.5998.201.8098.161.8484.5115.49
Total Fire Counts62,9541001103,4974980147,755271543,70482121,8734008
Table 3. Proportions of annual cumulative FRP per simplified MODIS land cover class and country for 2012–2020.
Land CoverCambodiaLaosMyanmarThailandVietnam
Forest16.6752.4054.2627.3928.11
Shrubland/Savanna60.1244.5838.0747.1861.90
Grassland17.472.763.154.223.83
Cropland4.850.244.4320.985.97
Urban0.0090.0020.0100.1610.110
Barren--0.002--
Water/Permanent Wetland0.8750.0200.0680.0720.084
Cumulative FRP [MW]1,204,953.296,377,671.845,676,410.27994,047.58625,649.22
Table 4. Proportions of seasonal cumulative FRP per simplified MODIS land cover class and country for 2012–2020.
CambodiaLaosMyanmarThailandVietnam
Land CoverDryWetDryWetDryWetDryWetDryWet
Forest16.530.1448.004.4053.201.0727.240.1522.415.70
Shrubland/Savanna59.240.8842.532.0437.720.3546.420.7552.119.78
Grassland17.020.462.720.033.110.044.130.093.270.57
Cropland4.820.030.240.0034.370.0620.670.315.540.43
Urban0.0070.0010.002-0.0090.0010.1520.0090.0670.043
Barren----0.002-----
Water/Permanent Wetland0.6920.1840.020-0.0620.0060.0450.0270.0610.023
Cumulative FRP [MW]1,184,535.2120,418.085,964,108.15413,563.695,589,597.3286,812.95980,705.0413,342.54522,150.54103,498.68
Disclaimer/Publisher’s Note: The statements, opinions and data contained in all publications are solely those of the individual author(s) and contributor(s) and not of MDPI and/or the editor(s). MDPI and/or the editor(s) disclaim responsibility for any injury to people or property resulting from any ideas, methods, instructions or products referred to in the content.

