Article

Characterizing Spatio-Temporal Patterns of Child Sexual Abuse in Mexico City Before, During, and After the COVID-19 Pandemic

by
Francisco Carrillo-Brenes
1 and
Luis M. Vilches-Blázquez
2,*
1
Centro de Investigación en Computación, Instituto Politécnico Nacional, Mexico City 07700, Mexico
2
Ontology Engineering Group, Universidad Politécnica de Madrid, 28031 Madrid, Spain
*
Author to whom correspondence should be addressed.
ISPRS Int. J. Geo-Inf. 2024, 13(7), 223; https://doi.org/10.3390/ijgi13070223
Submission received: 20 May 2024 / Revised: 22 June 2024 / Accepted: 25 June 2024 / Published: 27 June 2024

Abstract

:
This study conducts a spatio-temporal analysis to identify trends and clusters of child sexual abuse in Mexico City before, during, and after the COVID-19 pandemic. Sexual abuses of children were analyzed considering various crime theories. Trends and patterns were identified using time series decomposition and spatial autocorrelation techniques. Time series considered three relevant periods. Anselin’s Local Moran’s I identified the spatial distribution of significant clusters. The child sexual abuse rate presented similar values following school closures. The resumption of classes entailed a decrease of −1.5% (children under 15) and an increase of 29% (children over 15). Particular locations in Mexico City experienced significant clusters among those over 15. There were eight noteworthy clusters displaying recidivism patterns with lower poverty rates and a high level of education. Efforts to combat child sexual abuse should prioritize specific areas in Mexico City where female children over 15 are at high risk of becoming victims of sexual abuse.

1. Introduction

In response to the COVID-19 pandemic, many countries have implemented measures to prevent and control the spread of SARS-CoV-2. These measures have included closing educational institutions, restricting mobility, and implementing special regulations for certain institutions where extracurricular activities were no longer allowed. However, the effectiveness of these measures has varied [1].
The COVID-19 pandemic resulted in the closure of childcare centers and schools, causing over 80% of children worldwide to spend more time at home [2,3], including those in Mexico City, where our study was conducted. This disruption in daily life caused significant changes in lifestyle and routine activities, with many individuals staying at home [4].
Given this scenario, it is important to note that it is widely recognized that child sexual abuse is predominantly committed by individuals known to the victim within their own home environment [5]. The pandemic has brought together the convergence in space and time of offenders and suitable targets, along with the elements associated with Lifestyle-Exposure Theory [6] and Routine Activity Theory [7]. Cohen et al. [8] integrated both theories into a single framework called Lifestyle-Routine Activity Theory (L-RAT). The framework identifies five principles that affect victimization: exposure, proximity, attractiveness of targets, guardianship against crime, and contextual properties of criminal events [8,9].
Previous research studies have shown that the combination of social isolation and change in routine activities is a known risk factor [2,10,11], as seen when child abuse escalates during school breaks, summer vacations, and natural disasters [10], as well as pandemics such as COVID-19 [2,12,13,14,15,16]. In these circumstances, women and children in abusive relationships face a heightened risk of domestic violence and abuse. The COVID-19 pandemic exacerbated this issue, as family members spent more time in close proximity and experienced additional stress, financial difficulties, and unemployment [17,18].
Several studies conducted worldwide indicate a significant rise in family violence and child abuse during the COVID-19 lockdown [19]. All of the studies indicated that the lockdown resulted in a combination of various risk factors, which could potentially contribute to the rise of domestic violence [20] and child abuse [3]. For instance, self-isolation and its associated effects, such as heightened levels of psychological distress, greater alcohol consumption, or financial difficulties, could encourage the incidence of violence and maltreatment. Limited access to external support, such as medical or social services, schools, or nurseries, has been linked to issues related to the diagnosis of child abuse, particularly physical abuse.
The combination of social isolation reduced the “action space” [21] of motivated offenders. It joined together with inadequate social care and monitoring during lockdowns to create a risk of unreported cases of child abuse [2]. The COVID-19 measures impacted crime reporting, resulting in a decrease in reported crimes during the early months of the lockdown in Mexico City [22]. Domestic violence, robbery, rape, and other crimes recorded a decline in reported incidents since March 2020. This fact does not conceal the significant rise in child abuse, although few studies have addressed quantifying this phenomenon [19] and identifying its spatio-temporal patterns in order to explain the spatial distribution of sexual crime at the micro-level following the Crime Pattern Theory [23]. Therefore, it is important for social policies aimed at eradicating sexual abuse of children to have a comprehensive understanding of spatio-temporal behavior in relation to the socioeconomic and demographic context before, during, and after the COVID-19 pandemic. This will enable the identification of specific intervention locations and also aid in improving the design of social policies for targeted, place-based strategies [24]. The Social Disorganization Theory [25] may be applicable to gain further insights into child sexual abuse. This theory suggests that neighborhood characteristics, such as poverty, residential mobility, population density, overcrowding, or urban blight, hinder or prevent community cohesion, leading to increased levels of disadvantage and disorder associated with high rates of child abuse [26].
Spatio-temporal methods for analyzing the distribution and variation of sexual abuse in children offer tools for comprehending this problem in the micro-communities of Mexico City with a range of socioeconomic and demographic characteristics. Several studies have conducted spatial analyses during the COVID-19 pandemic, examining various forms of crime [22,27,28,29,30,31,32]. Moreover, some research has explicitly focused on incidents of violence against household members, including intimate partners and children, violence against women, and the identification of hotspots of these crimes during the pandemic [33,34,35,36,37,38]. Nevertheless, there has been a paucity of research on the subject of sexual abuse of children. To the best of our knowledge, no study has yet examined the spatio-temporal correlations of sexual abuse among children in Mexico City before, during, and after the COVID-19 pandemic to identify trends in this issue using socioeconomic and demographic information.
Scholars have combined various crime theories to analyze sexual abuse. Jiang et al. [39] recently compiled these works and identified a lack of studies that combine Routine Activity Theory, Crime Pattern Theory, and sexual crimes. This paper aims to integrate L-RAT, Crime Pattern Theory, and Social Disorganization Theory to provide a comprehensive understanding of how the COVID-19 pandemic’s unique context influenced spatio-temporal patterns related to sexual abuse in children in Mexico City before, during, and after the pandemic.
The initial aim utilizes time series decomposition to detect changes in trends of this occurrence, highlighting three significant milestones that coincide with the time of suspension, gradual resumption, and return to indoor classes. The second objective employs spatial autocorrelation analysis to identify crime concentration in specific locations and shared factors that lead to high levels of the incidence of child sexual abuse in micro-statistical areas of Mexico City, utilizing population data as background information. Additionally, this study examines the distribution of victim gender and age by year and characterizes patterns of recidivism using socioeconomic information. The findings have significant implications for crafting targeted social policies to combat child sexual abuse in specific micro-communities within one of the largest cities in Latin America.

2. Materials and Methods

2.1. Data Sources

2.1.1. Crime Data

We obtained sexual abuse reports and victim data collected by the Attorney General’s Office (Fiscalía General de Justicia, in Spanish) from 2019 to 2022. A total of 3463 sexual abuse cases involving children were collected from this data source. Each reported case includes variables of interest, such as municipality, address, latitude and longitude coordinates, date and time of the incident, and time of reporting to the authorities.
With regard to the characteristics of victims, the dataset includes variables such as gender, age, and the legal classification of the incident. The legal classification refers to the victim’s role in the case, namely whether they were the victim, complainant, deceased, injured, or offended. It is worth noting that within this dataset, the victim may be an adult but is categorized as a victim of sexual abuse of children due to a victim’s limitations or disabilities that leave the victim unaware of the abuse. The dataset does not include information about the victim’s limitations. However, these cases (victims over 15 years old) were considered and distinguished in our study.

2.1.2. Socioeconomic and Demographic Data

Because one objective of this study was to assess socioeconomic and demographic characteristics related to sexual assaults, poverty and census variables were used in this work. Specifically, poverty data were collected from the National Council for the Evaluation of Social Development Policy (Consejo Nacional de Evaluación de la Política de Desarrollo Social—CONEVAL, in Spanish). The data are grouped into percentage ranges based on poverty levels and are associated with micro-geostatistical divisions. The poverty percentages are calculated by the CONEVAL methodology [40], which employs a multitude of variables and indicators. These include per capita income, the education gap in housing, access to health services, housing quality, essential services (such as water and electricity), access to food, access to paved roads, and social cohesion.
In addition, we used variables from the national census published by the National Institute of Geography and Statistics, such as total population, population between 3 and 14 years of age, population with a job, and average level of education.

2.2. Study Design

To analyze the spatiotemporal behavior of reported cases of sexual assault in children before, during, and after the COVID-19 pandemic, we applied time series decomposition and spatial autocorrelation to these three different periods of the pandemic (2019—pre-COVID-19), 2020–2021—COVID-19 pandemic), and 2022—post-pandemic period). Given the disparity of data from previous years (2017 and 2018) and the evidence that sexual assault is a crime with significant underreporting issues, 2019 was considered as a baseline to provide context and conduct the assessment of these sexual crimes.
In terms of temporal patterns, we examined the reported cases to identify variations across the years indicated. By treating the victim reports as time series, we used time series decomposition [41] to identify trends and quantify their differences across three different periods. Equation (1) shows the representation of a time series:
y t = μ t + x t + ν t
where μ t represents the trend component of the time series, while x t signifies the seasonal component and ν t the error component. In particular, we compare the trend component to ascertain the variations in the three periods studied in this work.
With regard to spatial autocorrelation, we employed Global Moran’s I [42] and Anselin Local Moran’s I [43]. The Global Moran Index is an extension of the Pearson coefficient with spatial weights that measure the spatial correlation between spatial units. This index is represented in Equation (2) [42]:
I = n i = 1 n j = 1 n w i j i = 1 n j = 1 n w i j y i y ¯ y j y ¯ i = 1 n j = 1 n w i j
where y i denotes n observations with mean y ¯ that are spatially connected via weights w i j .
The Local Moran’s index quantifies the spatial autocorrelation between locations and enables the identification of clusters between local areas, as represented in a formal manner by Equation (3):
I i = ( ( x i X ¯ s 2 ) j 1 n w i j ( x j X ¯ )
where I i is the Local Moran index for the location i, x i is the value of an attribute at location i, X ¯ is the mean of the corresponding attribute,   s 2 is the variance of the attribute, w i j are the spatial weights between locations i and j, and n is the total number of locations in the dataset. The aforementioned equation was employed to ascertain the spatial autocorrelation between geographic areas, thereby enabling the identification of clusters for each period under consideration.
Those clusters obtained were for age groups using the classifications offered by our data: sexual assaults committed against children (0–15 years) and those committed against adults but seemingly classified as sexual assaults against children. Therefore, these cases (over 15 years old) can be associated with populations with some disabilities. It is worth noting that this statistical analysis considered p-values, i.e., the level of confidence associated with the results and a 95% confidence level.
Furthermore, the Queen contiguity weight was employed in both Moran’s Indices. In this contiguity, any region that touches the boundary of a region, whether on a side or a corner, is considered to be a neighbor [44]. Consequently, the weight w i j was set to 1, whereas in other cases, the value of the weight w i j was set to 0.
Additionally, in order to analyze the relationship between the various hotspots identified and the variables under consideration, the bivariate Moran’s I [45] was calculated. This measure is an extension of Moran’s Index and calculates the spatial autocorrelation between two variables, being useful to explore spatial relations in an specific region. This index is calculated using Equation (4) [45], which is as follows:
I = n i = 1 n j = 1 n w i j x i x ¯ y j y ¯ ( i = 1 n j = 1 n w i j ) i = 1 n x i x ¯
where n is the number of observations, x i and y i are the values of the variables X and Y, x ¯ and y ¯ are the means of the variables, and w i j is the spatial weights between the locations.

3. Results

Sexual assaults in children showed a progressive increase in the different years of this study. Considering victims under the age of 15 and 2019 as the baseline, the increase was 25.28% (2019–2020), 8.25% (2020–2021), and 18.43% (2021–2022). However, these crimes were more pronounced in cases involving victims over the age of 15, with growth rates of 34.31%, 41.24%, and 75.96%, respectively, for the same periods. These trends are illustrated in the time series for both victim groups (see Figure 1). The figure includes data relevant to children during the pandemic period. For example, Figure 1a includes the day of school cancellation (March 20) in 2020, the gradual return to school (June 7) in 2021, and the total return to school (August 22) in 2022. After each of these dates, we observed a trend of a temporary decrease in the number of reported cases. After that, time series fluctuations and progressive increases appear along the period.
Figure 1b illustrates the overarching trend across both age groups. The graph displays a conspicuous rise, yet upon closer inspection, a trend divergence emerges towards the end of the observation period. This divergence is evident in the decrease in victims under 15 years old and the concomitant increase in victims over 15 years old. During a four-month interval near the end of the isolation period, a trend was observed pertaining to the return of individuals to either school (ages 0–15) or a specialized education center (ages > 15). Looking at the average of each yearly trend, the yearly shifts for victims under the age of 15 were 5.09 (2019–2020), 4.34 (2020–2021), and 9.98 (2021–2022). In contrast, the changes in the average were more significant for victims over 15, with the values being 4.95 (2019–2020), 11.17 (2020–2021), and 23.20 (2021–2022).
The same behavior is presented to consider the specific time associated with isolation periods of children in homes during the COVID-19 pandemic. In this line, the rates of child sexual assaults showed trends of 4.31 (school cancellations), 10.64 (gradual reopening), and −1.5 (fully resumed classes) for children under 15 years old. Conversely, the rates for victims over 15 years old increased notably with differences of 5.22, 20.56, and 29, which seemed unaffected by the resumption of indoor classes.
The Global Moran’s I was applied to three classifications of data related to child sexual abuse (see Table 1). Upon examination of all data related to victims of sexual abuse over the specified period (2019–2022), it was found that the data exhibited weak spatial autocorrelation, with values around 0.15. This suggests that there is a slight tendency for similar values (either high or low rates of sexual abuse) to cluster together geographically. Nevertheless, despite the relatively low Moran’s I values, the p-values of 0.001 indicate that the observed spatial patterns are statistically significant and unlikely to be due to random chance. Furthermore, the z-scores, which are around 12 in all three cases, strongly support the significance of the spatial autocorrelation. High z-scores indicate that the observed clustering of similar values is much greater than what would be expected under a random distribution of the data.
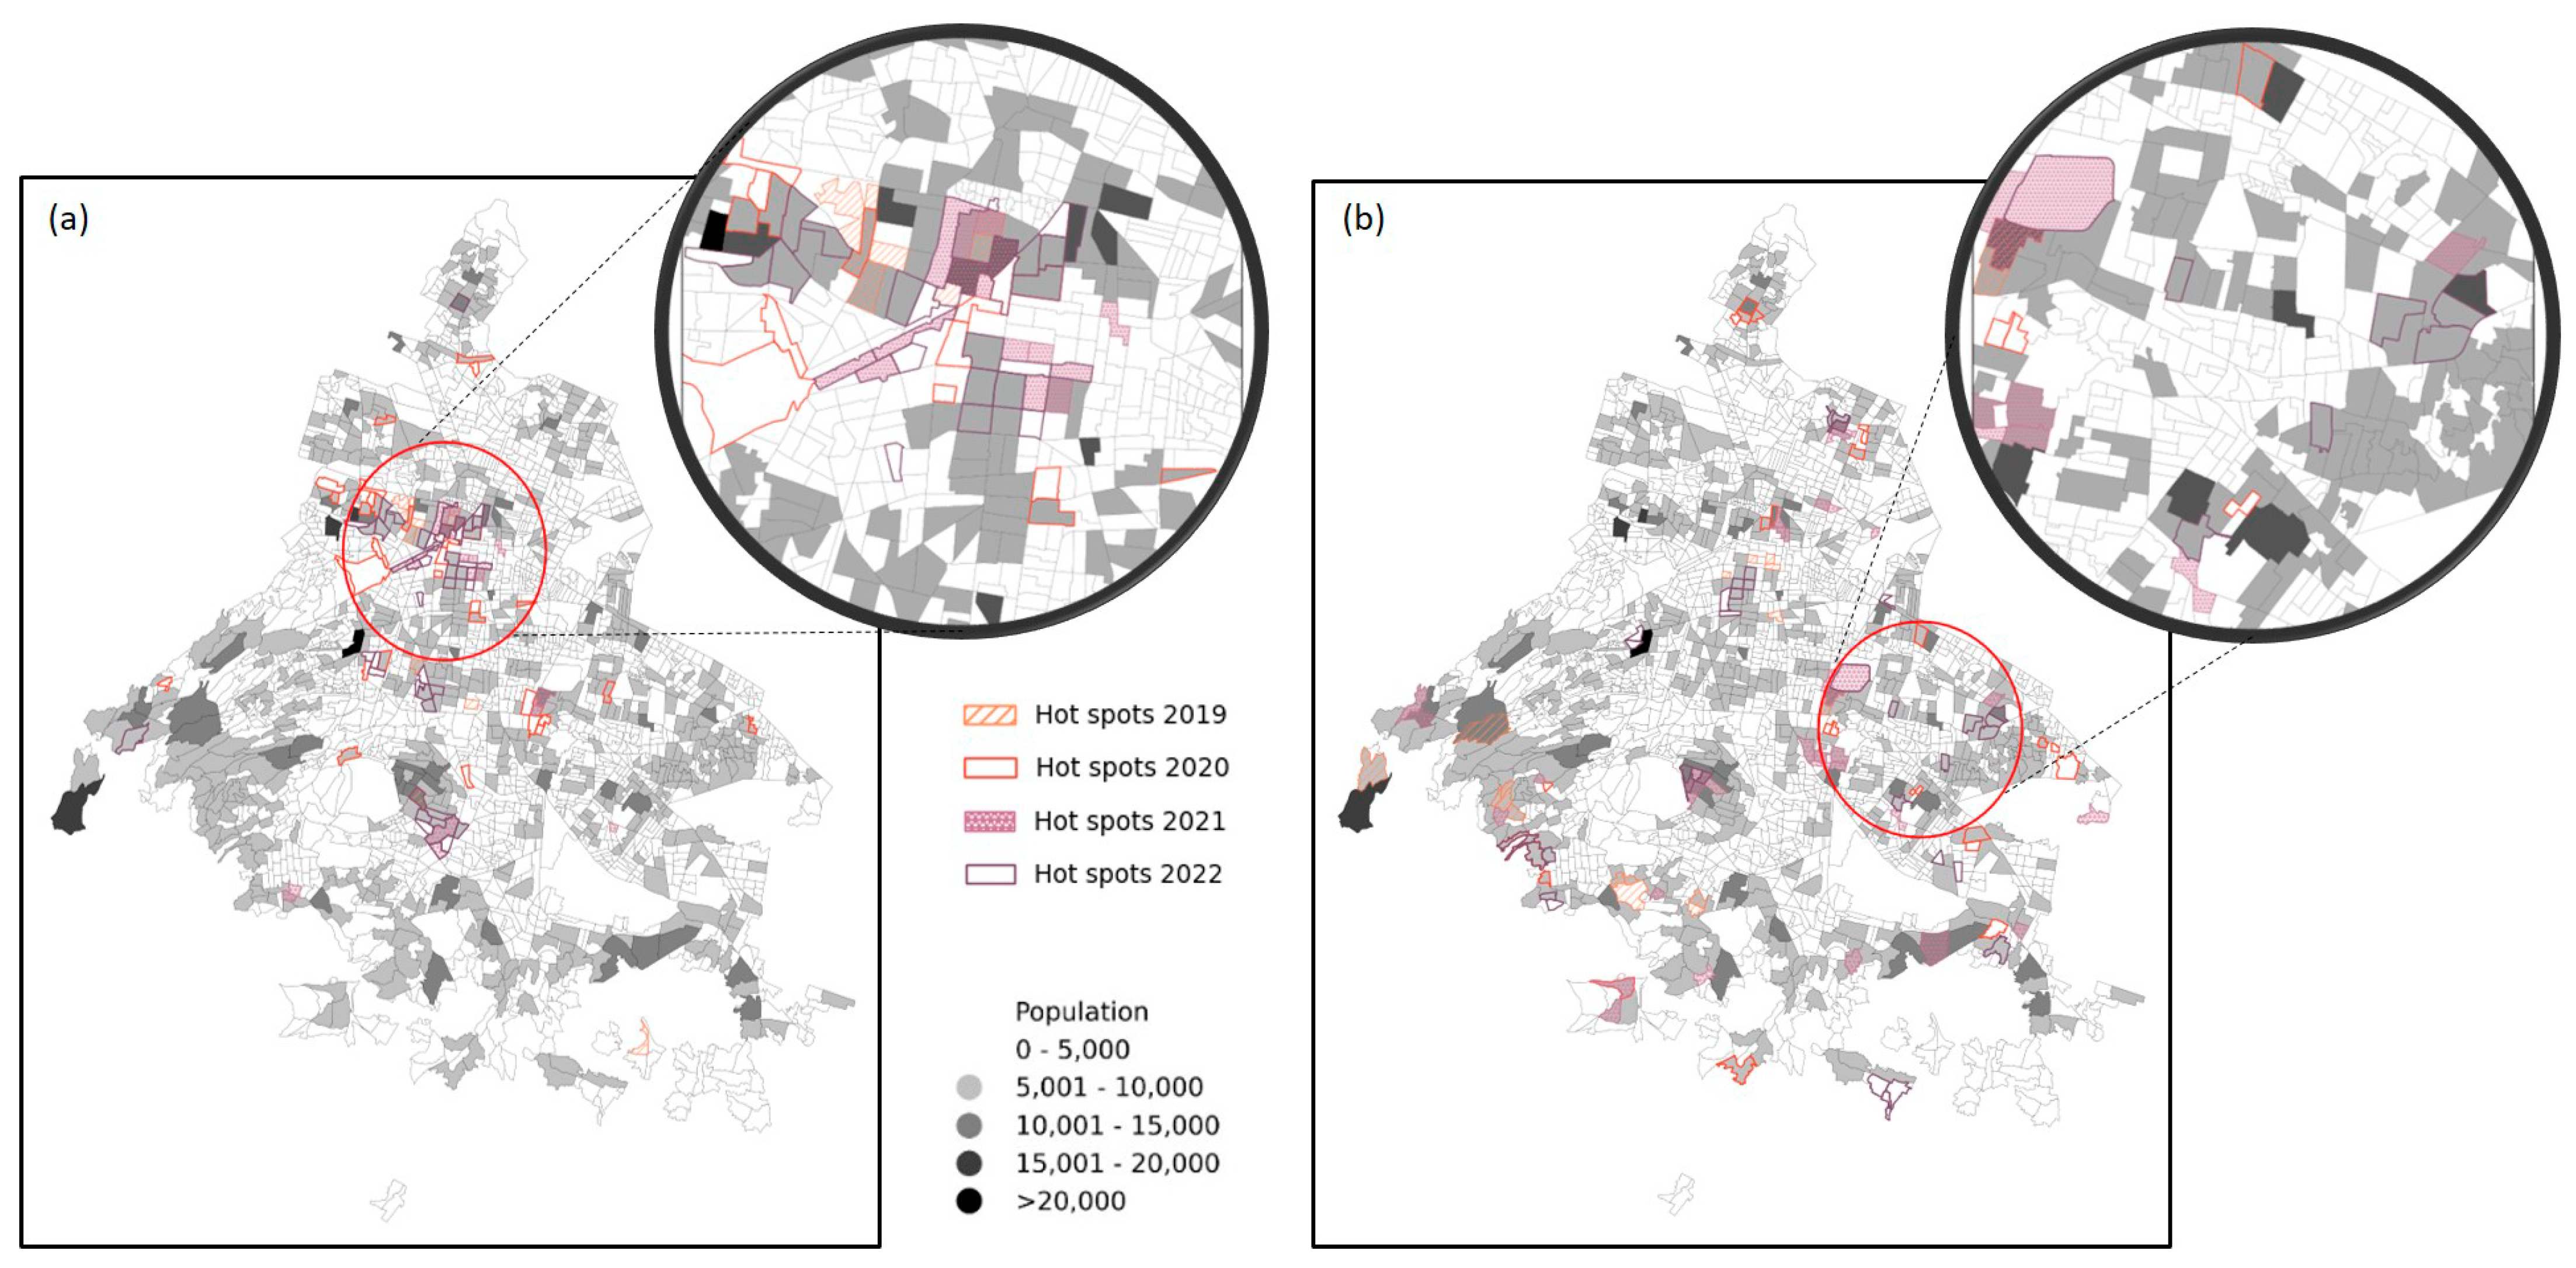
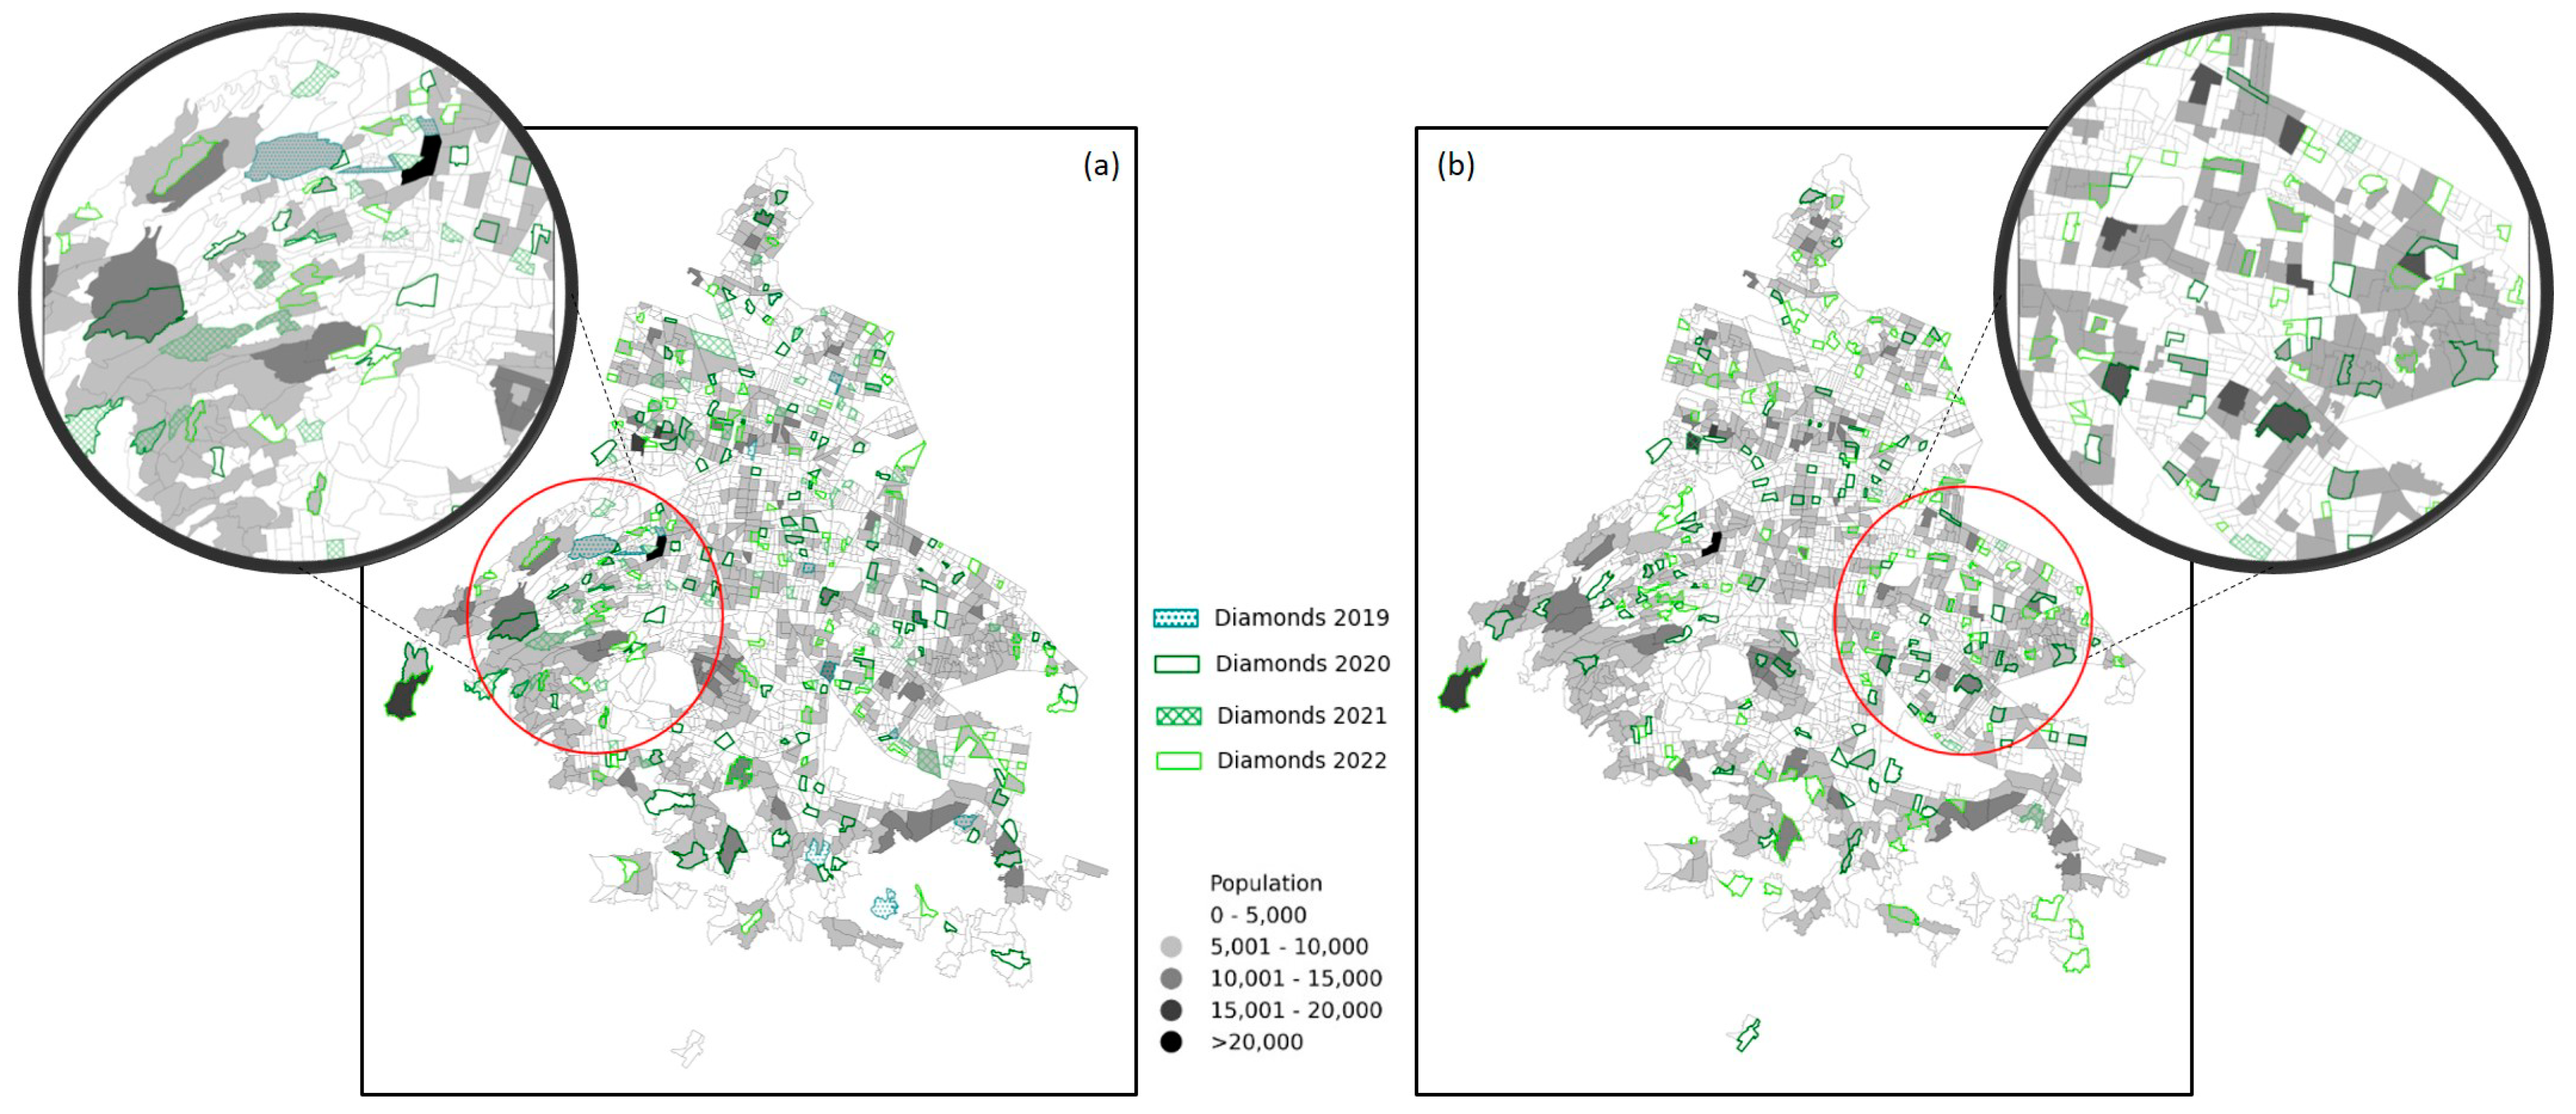
The clusters obtained using Local Moran’s Index are distributed throughout Mexico City for both age groups. Hotspots, which are areas that consistently reflect a high incidence of sexual assault above the mean, tend to be concentrated around the city center for children over the age of 15 (see Figure 2a). However, for children under 15, the clusters are more dispersed throughout the city, but with some areas exhibiting a higher concentration of hotspots (see Figure 2b). Diamond clusters, which represent high levels of sexual abuse cases surrounded by areas of low values, do not exhibit any discernible pattern in either age group (see Figure 3). However, we highlight the areas where a major concentration of these clusters is collected (see Figure 3a,b).
Both clusters were located in micro-statistical areas with populations ranging mainly from 5000 to 10,000, considering population density. Additionally, clusters were found in regions with lower population density, characterized by an erratic presence. However, there are a few clusters with higher population density for both victim groups in the western part of the city.
The bivariate Moran’s I method was employed to investigate the relationship between the number of victims in the hotspots and a range of socio-economic variables, including the poverty percentage, population, and schooling years. It is noteworthy that bivariate Moran’s I was not applied to diamonds, as they represent outliers and the behavior of these clusters was not affected by the considered variables. Table 2 presents the results of the bivariate Moran’s I calculations, which include the index values for each pair of variables, along with their corresponding p-values and z-scores. These values indicate the statistical significance of the observed spatial relationships.
The results indicated that only some of the considered variables exhibited a significant correlation according to the p-values in some years in the detected hotspots from the Local Moran’s I on the two groups of victims. With regard to the population, a negative correlation was observed in 2022 in the hotspots of victims over 15 years old, indicating that in areas with a lower population, sexual abuse was more prevalent. In particular, the variable of schooling years demonstrated the greatest correlation with hotspots of victims under 15 years old in 2019 and 2022, exhibiting a negative correlation. Conversely, in 2021, the correlation was positive. Regarding poverty, only this variable demonstrated a correlation with victims over the age of 15, exhibiting a positive correlation. This implies that in areas with a higher poverty percentage, the number of victims was higher.
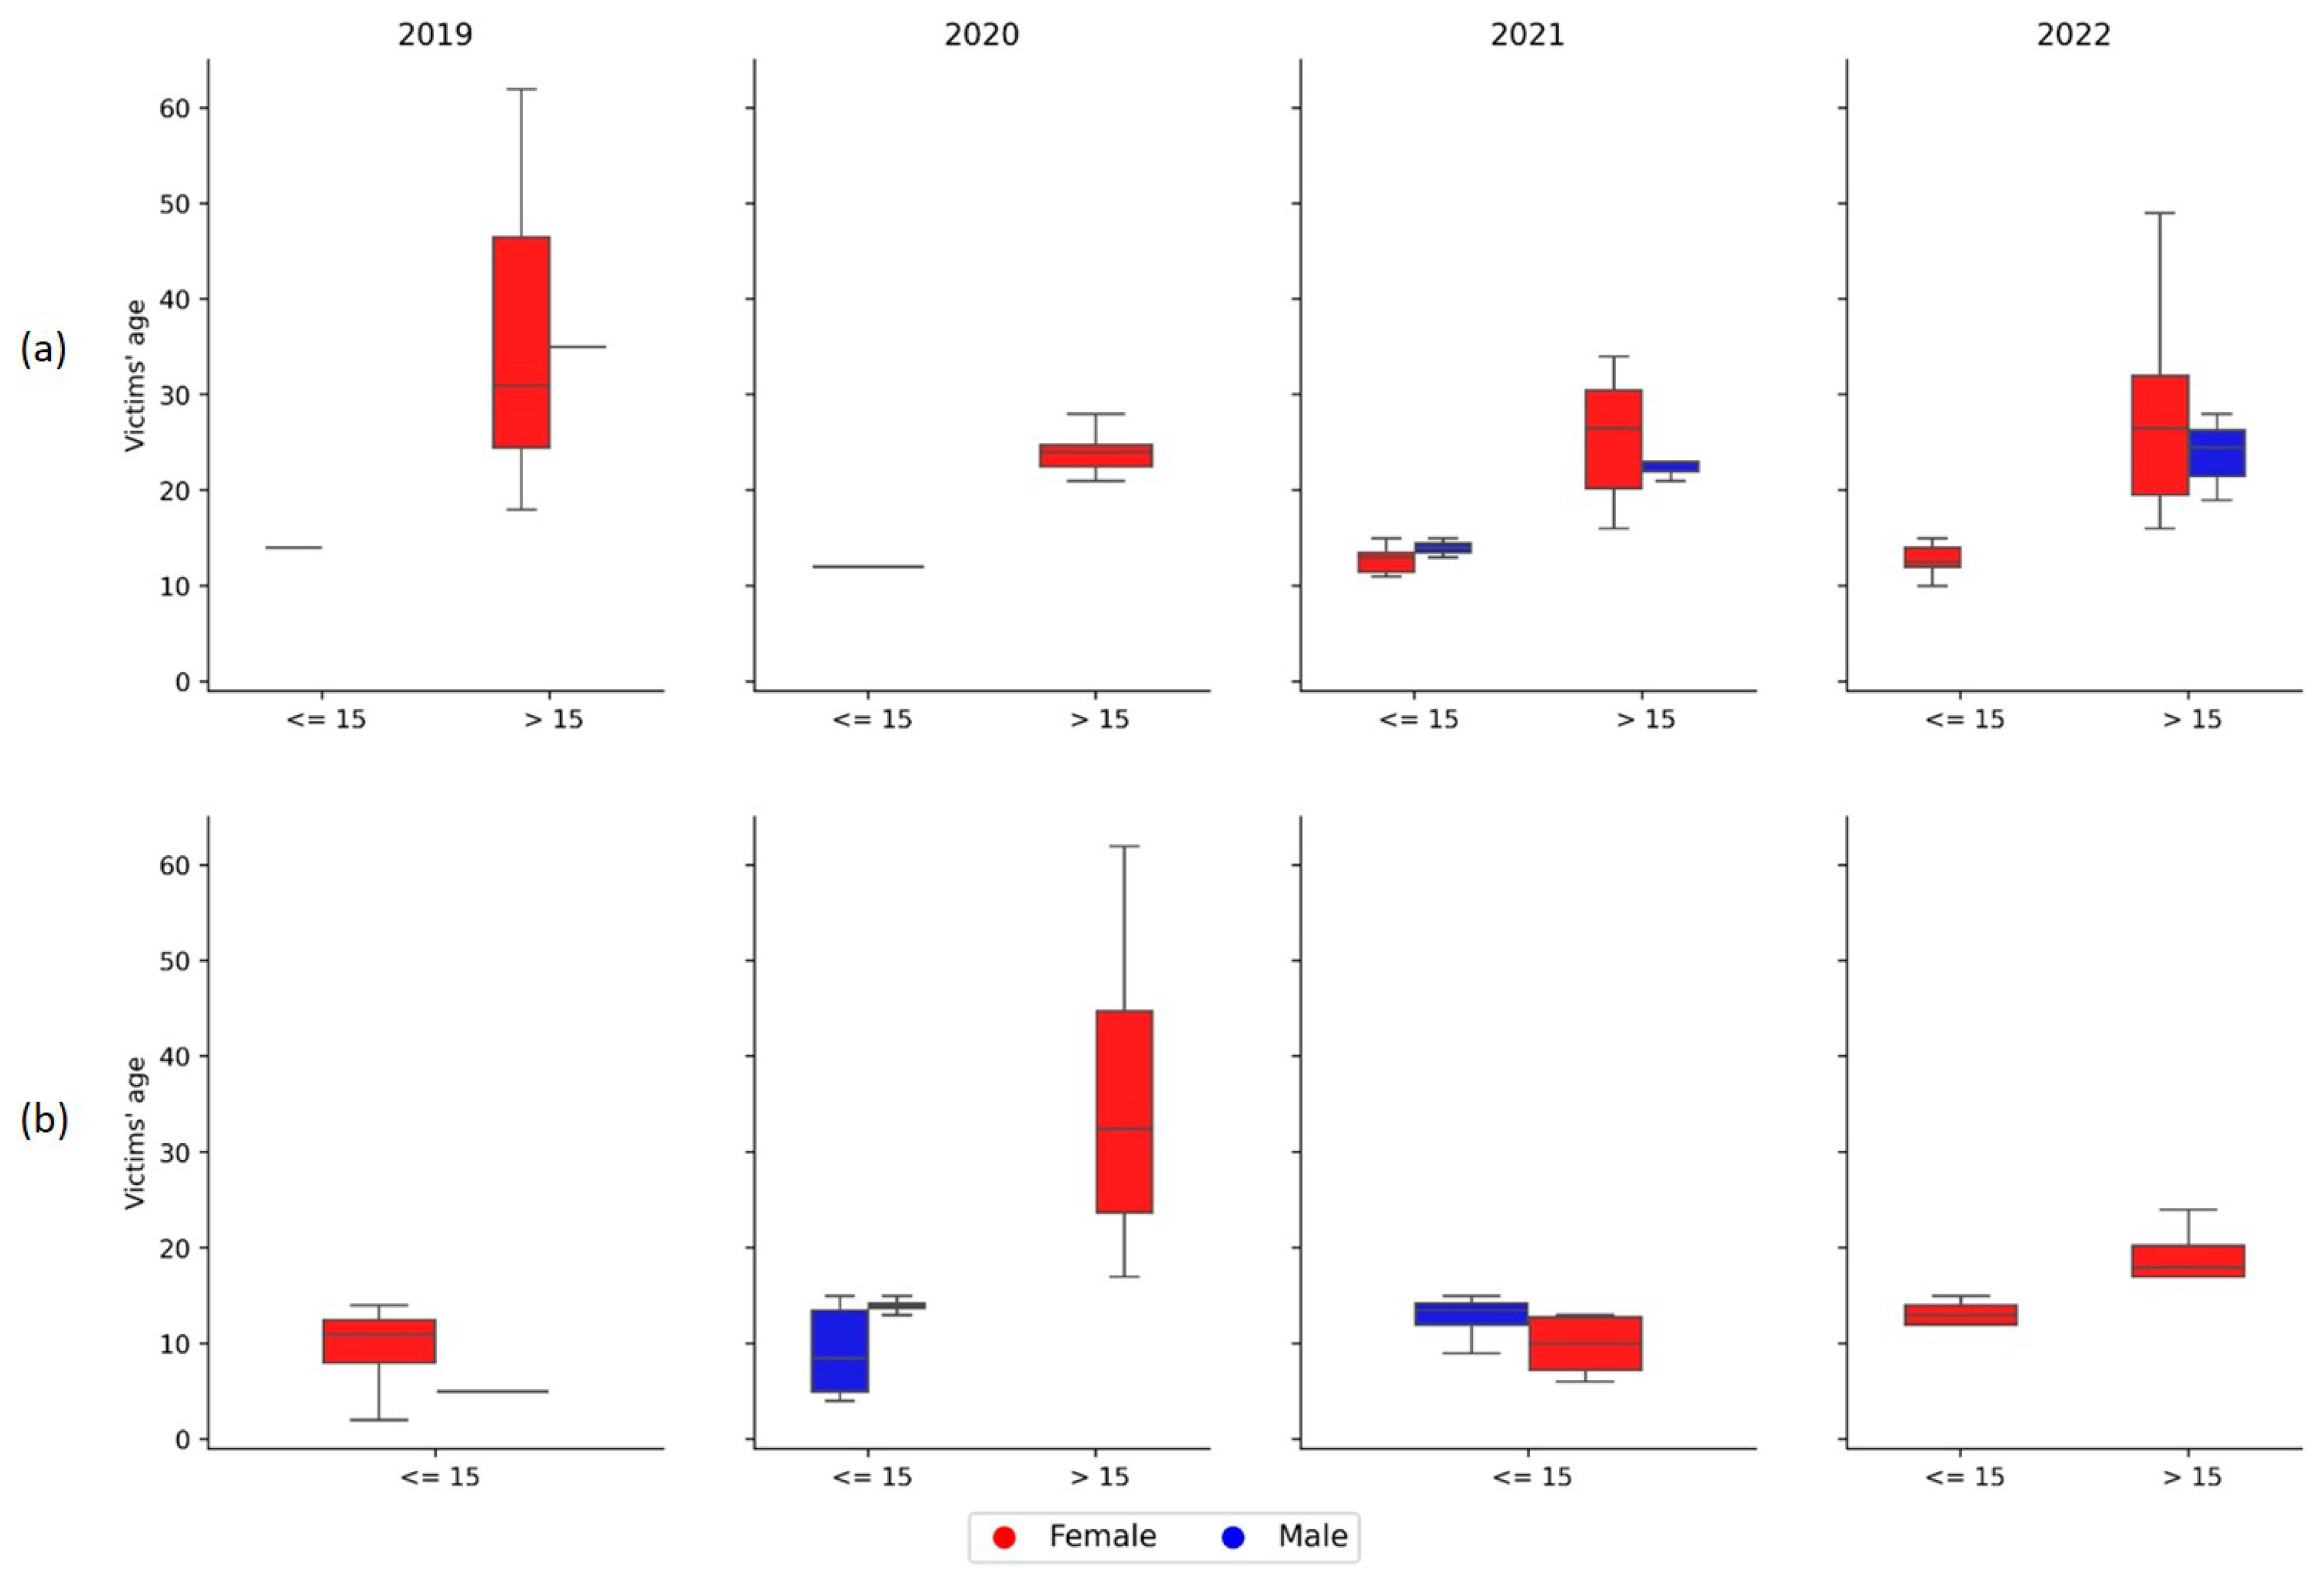
Boxplots were utilized to determine the age and gender of victims in the highlighted clusters (see Figure 4). The boxplots of hotspot clusters (Figure 4a) indicate that female victims over the age of 15 are predominant. In 2019, prior to the COVID-19 pandemic, female victims comprised a wide age range. Nevertheless, the ages of the victims were concentrated during the pandemic period, and the age range extended again in the post-pandemic period, likely due to the recovery of routines before the pandemic. In 2022, the trends of the previous years were consolidated and increased in Mexico due to the persistent effects of the COVID-19 pandemic and the progressive recovery of routines. It is worth noting that both genders over the age of 15 were affected by this phenomenon.
The boxplots of diamond clusters (Figure 4b) indicate the continuous presence of female victims under 15 years of age in areas with high rates of child sexual abuse surrounded by areas with low rates. However, the boxplots in 2020 show remarkable characteristics, with female victims over 15 years of age appearing with a wide age range, similar to the hotspot’s boxplot in 2019. These boxplots also display the occurrence of male victims during the COVID pandemic, with the widest age range observed among victims under 15 years old during the analyzed periods.
Significant clusters were identified by analyzing the repetition of sexual abuse cases across different years of this study. Table 3 presents hotspot and diamond clusters associated with recidivism patterns, specifically, cases of child sexual abuse that occur repeatedly in micro-statistical areas. The table presented here utilizes socioeconomic and demographic factors to describe the behavior patterns of these clusters, in line with the Social Disorganization Theory [25].

4. Discussion and Conclusions

The combination of trend decomposition with Global and Local Moran’s I proved an effective approach for gaining insights into specific aspects of sexual abuse cases involving children in Mexico City. The trend decomposition analysis revealed that victims under the age of 15 exhibited a heightened risk following the declaration of the lockdown and the suspension of indoor classes. This was evidenced by the observed increase in the number of reported cases subsequent to these events. Additionally, a notable rise was observed during the gradual return to normalcy (post-pandemic period). However, it is important to note that this upward trend underwent a significant reversal, resulting in a significant negative divergence in trends upon the full resumption of indoor classes.
In contrast, the circumstances for victims aged 15 and older displayed a distinct narrative. The trend was comparable between 2019 and the initial period of the COVID-19 pandemic, with no corresponding decrease upon resumption of indoor classes, whereas the trend continued to increase. The prevalence of sexual abuse among this age group, despite data limitations and uncertainties, remained consistently high even during the most challenging periods of the pandemic.
The Global Moran’s I index indicated a spatial correlation between the data, particularly in relation to both victims and each age group. Although the value was relatively low (approximately 0.15), the z-score confirmed that the correlation was not random. Considering these results, the Local Moran’s I analysis identified four distinct clusters, with a focus on hotspots and diamonds where victims were found. Cold spots or doughnut clusters did not have any data on victims. The locations of hotspots for victims under 15 years old exhibited a scattered distribution throughout Mexico City over the four-year period of the study. Moreover, the locations of these hotspots underwent dynamic changes from year to year. Fluctuations in trend patterns in areas with high prevalence closely mirrored these changes, indicating a gradual increase in concentrated areas until 2021, followed by a decline in 2022. The results of the bivariate Moran analysis indicated that there was a spatial correlation between the percentage of the population living in poverty and the number of victims in the hotspots during 2021. Similarly, there was a spatial correlation between the average number of schooling years and the number of victims in 2019, 2021, and 2022. In 2021, the correlation indicated that in areas with a high average number of schooling years, there were more victims reporting. In contrast, in 2019 and 2022, the correlation was the opposite.
On the other hand, localized areas with a higher concentration of victims over the age of 15 were predominantly situated in the central regions of Mexico City. It is notable that the clusters and the number of victims within them increased annually. Additionally, these areas had a smaller proportion of individuals living below the poverty line within their population. However, it is essential to note that this outcome does not indicate a direct correlation between instances of sexual abuse involving victims over the age of 15 and either the poverty rate or level of education. This was corroborated by the bivariate Moran’s Index, which revealed in 2020 that hotspots exhibited a correlation of 0.2 and a p-value of 0.5. However, in the other years of this study, although the index is similar, the p-value is sufficiently large to be considered. The results of the bivariate Moran Index indicated a potential correlation between the variables in question. This suggests that regions exhibiting these traits may experience a greater number of reported cases of this offense, while regions exhibiting the opposite traits may experience a lesser number of reported cases.
The outliers in the diamond clusters share similar features in both age categories. These regions display an average high school education, an approximate population of 4000, and varying levels of poverty, frequently ranging from 0% to 18% and from 34% to 50%. The variability is a consequence of modifications over time in the number of regions, presenting a pattern of progression, regression, and later progression. This trend is consistent with the observed changes in the number of victims stemming from these regions.
Considering these significant clusters, eight areas with recidivism patterns were identified. These areas provided valuable insights from a socioeconomic point of view, as low poverty levels, especially in cases of sexual assaults on children over 15 years of age, and more than ten years of schooling on average are common characteristics of these areas.
This study aims to quantify the issue of child sexual abuse [19] and enhance our understanding of its spatiotemporal dynamics in specific areas. The findings underscore the importance of targeted interventions for different demographic groups within the broader context of combating child sexual abuse. However, it is important to note that sexual abuse is a significantly underreported crime, a problem that has been further exacerbated during the COVID-19 pandemic [46,47,48,49]. Nevertheless, the only official data available for analysis is that published by the relevant authorities. Notwithstanding the underreporting, it is notable that child sexual abuse exhibited a distinct pattern during the pandemic, diverging from the trends observed in other crimes. In light of these findings and their significant implications, it is imperative to consider the development of targeted social policies aimed at combating child sexual abuse in specific micro-communities within Mexico City, one of the largest cities in Latin America. Furthermore, given the issue of underreporting, it is essential to implement strategies to verify the validity and reliability of the crime data provided by official governmental bodies, as well as measures to account for underreporting, in order to accurately assess the completeness and accuracy of the data.
The results indicate that the COVID-19 pandemic has impacted the dynamics of child sexual abuse in Mexico City. The pandemic has created limited spaces, such as homes, which have concentrated the elements of L-RAT Theory [8,9]. This has led to increased cases of victims and offenders crossing paths. The patterns of child sexual abuse have undergone spatio-temporal changes. However, certain common elements persist, such as the progressive rise of victims and higher reports of female victims, which reinforce a prominent gender-based vulnerability [50]. During the pandemic period, new patterns have emerged regarding the age of victims. There is a concentration of ages and an extended age range in the post-pandemic period, suggesting a relative return to pre-pandemic routines and lifestyles. However, further analysis is needed to confirm this. Furthermore, male victims have been reported to be more prevalent in areas with high rates of child sexual abuse, which are often surrounded by areas with lower rates.
Based on our research, child sexual abuse is more common in areas with lower poverty levels, especially among victims over 15 years old. This finding contradicts the Social Disorganization Theory, which assumes that higher crime rates occur in areas with greater social disorganization. However, our research suggests that other factors, such as population density and routine activities, may also significantly influence crime patterns. It is important to consider that reporting mechanisms or law enforcement practices could affect the data related to sexual abuse crimes, particularly those unique to our study area, Mexico City. This paper did not consider potential biases stemming from reporting mechanisms, legal practices, or types of resistance from victims of abuse [51]. Therefore, a potential extension of this work could be to analyze biases that may arise due to societal, behavioral, and systemic factors that often influence the reporting and recording of sexual crimes.
The findings of this study serve a significant purpose in recognizing patterns and trends in sexual abuse behavior towards children. The results indicate a multifaceted connection between pandemic-related measures, socioeconomic factors, and the frequency of sexual abuse cases, thus offering a comprehensive view of these offenses prior to, during, and after the COVID-19 pandemic. Additional research could be conducted to provide a complete understanding of the issue, including additional socioeconomic factors. Nonetheless, this study can make a valuable contribution to social policies seeking to eliminate child sexual abuse by facilitating the identification of specific intervention sites and improving policy design using targeted, location-based strategies [24].
Due to the reliance on official victim data released by local authorities in Mexico City, this study is subject to certain limitations. As such, we are only able to describe the characteristics of victims, particularly those over 15 years old, and infer potential limitations within the dataset. The lack of official data on income constraints impedes our ability to include this parameter in the cluster characteristics, thus restricting the range of potential indicators.
Moreover, the absence of updated poverty percentages poses a challenge. The integration of this data would offer valuable insights into the changing conditions of regions, contributing to a more comprehensive analysis. Unfortunately, this information is unavailable as the responsible organization has not published this crucial dataset. These constraints present challenges for achieving a comprehensive and nuanced understanding of the dynamics at play. Nevertheless, our research endeavors to provide valuable insights within the confines of the available data while recognizing the significance of comprehensive and evolving datasets to advance future analyses.
In conclusion, this study emphasizes the significance of a comprehensive strategy for comprehending the intricate interplay among socioeconomic factors, pandemic-related actions, and criminal occurrence. The results indicate that customized interventions must target specific demographics and locations. Moreover, we must continue researching and investigating to deepen our comprehension of the complex dynamics.

Author Contributions

Conceptualization, Francisco Carrillo-Brenes and Luis M. Vilches-Blázquez; methodology, Francisco Carrillo-Brenes and Luis M. Vilches-Blázquez; validation, Francisco Carrillo-Brenes and Luis M. Vilches-Blázquez; formal analysis, Francisco Carrillo-Brenes and Luis M. Vilches-Blázquez; investigation, Francisco Carrillo-Brenes and Luis M. Vilches-Blázquez; data curation, Francisco Carrillo-Brenes; writing—original draft preparation, Francisco Carrillo-Brenes; writing—review and editing, Luis M. Vilches-Blázquez; visualization, Francisco Carrillo-Brenes and Luis M. Vilches-Blázquez; supervision, Luis M. Vilches-Blázquez; funding acquisition, Francisco Carrillo-Brenes and Luis M. Vilches-Blázquez. All authors have read and agreed to the published version of the manuscript.

Funding

Francisco Carrillo-Brenes is supported by a predoctoral fellowship from the Consejo Nacional de Humanidades, Ciencias y Tecnologías (CONAHCYT), and Luis M. Vilches-Blázquez was supported by a postdoctoral research grant (María Zambrano) from the Next Generation EU (NGEU) Programme and the Spanish Ministry of Universities.

Data Availability Statement

The datasets analyzed during the current study are available in the following repositories: Crime reports and victims data published by the Attorney General’s Office (Fiscalía General de Justicia, in Spanish). Available at https://datos.cdmx.gob.mx/dataset/victimas-en-carpetas-de-investigacion-fgj (accessed on 26 June 2024). National census data (2020) published by the National Institute of Geography and Statistics (Instituto Nacional de Estadística y Geografía—INEGI, in Spanish). Available at https://www.inegi.org.mx/programas/ccpv/2020/?ps=microdatos#Datos_abiertos (accessed on 26 June 2024). Socioeconomic data from the National Council for the Evaluation of Social Development Policy (Consejo Nacional de Evaluación de la Política de Desarrollo Social—CONEVAL, in Spanish). Available at https://www.coneval.org.mx/Medicion/Paginas/POBREZA-URBANA-EN-MEXICO-2015.aspx (accessed on 26 June 2024).

Conflicts of Interest

The author(s) declared no potential conflicts of interest with respect to the research, authorship, and/or publication of this article.

References

  1. Haug, N.; Geyrhofer, L.; Londei, A.; Dervic, E.; Desvars-Larrive, A.; Loreto, V.; Pinior, B.; Thurner, S.; Klimek, P. Ranking the effectiveness of worldwide COVID-19 government interventions. Nat. Hum. Behav. 2020, 4, 1303–1312. [Google Scholar] [CrossRef] [PubMed]
  2. Caron, F.; Plancq, M.-C.; Tourneux, P.; Gouron, R.; Klein, C. Was child abuse underdetected during the COVID-19 lockdown? Arch. Pediatr. 2020, 27, 399–400. [Google Scholar] [CrossRef] [PubMed]
  3. Rapp, A.; Fall, G.; Radomsky, A.C.; Santarossa, S. Child maltreatment during the COVID-19 pandemic: A systematic rapid review. Clin. N. Am. 2021, 68, 991–1009. [Google Scholar] [CrossRef] [PubMed]
  4. Felson, M.; Jiang, S.; Xu, Y. Routine activity effects of the Covid-19 pandemic on burglary in Detroit, March, 2020. Crime Sci. 2020, 9, 10. [Google Scholar] [CrossRef] [PubMed]
  5. Greenfeld, L. Child Victimizers: Violent Offenders and Their Victims; Bureau of Justice Statistics: Washington, DC, USA, 1996.
  6. Biderman, A.D.; Hindelang, M.J.; Gottfredson, M.R.; Garofalo, J. Victims of Personal Crime: An Empirical Foundation for a Theory of Personal Victimization; Ballinger: Cambridge, MA, USA, 1978. [Google Scholar]
  7. Cohen, L.E.; Felson, M. Social change and crime rate trends: A routine activity approach. Am. Sociol. Rev. 1979, 44, 588. [Google Scholar] [CrossRef]
  8. Cohen, L.E.; Kluegel, J.R.; Land, K.C. Social inequality and predatory criminal victimization: An exposition and test of a formal theory. Am. Sociol. Rev. 1981, 46, 505–524. [Google Scholar] [CrossRef]
  9. McNeeley, S. Lifestyle-routine activities and crime events. J. Contemp. Crim. Justice 2015, 31, 30–52. [Google Scholar] [CrossRef]
  10. Rosenthal, C.M.; Thompson, L.A. Child abuse awareness month during the coronavirus disease 2019 pandemic. JAMA Pediatr. 2020, 174, 812. [Google Scholar] [CrossRef]
  11. Seddighi, H.; Salmani, I.; Javadi, M.H.; Seddighi, S. Child abuse in natural disasters and conflicts: A systematic review. Trauma Violence Abus. 2021, 22, 176–185. [Google Scholar] [CrossRef]
  12. Bérubé, A.; Clément, M.; Lafantaisie, V.; LeBlanc, A.; Baron, M.; Picher, G.; Turgeon, J.; Ruiz-Casares, M.; Lacharité, C. How societal responses to COVID-19 could contribute to child neglect. Child Abus. Negl. 2021, 116, 104761. [Google Scholar] [CrossRef]
  13. Campbell, A.M. An increasing risk of family violence during the Covid-19 pandemic: Strengthening community collaborations to save lives. Forensic Sci. Int. Rep. 2020, 2, 100089. [Google Scholar] [CrossRef] [PubMed]
  14. Lee, S.J.; Ward, K.P.; Lee, J.Y.; Rodriguez, C.M. Parental social isolation and child maltreatment risk during the COVID-19 pandemic. J. Fam. Violence 2021, 37, 813–824. [Google Scholar] [CrossRef] [PubMed]
  15. Salt, E.; Wiggins, A.T.; Cooper, G.L.; Benner, K.; Adkins, B.W.; Hazelbaker, K.; Rayens, M.K. A comparison of child abuse and neglect encounters before and after school closings due to SARS-Cov-2. Child Abus. Negl. 2021, 118, 105132. [Google Scholar] [CrossRef] [PubMed]
  16. Amick, M.; Bentivegna, K.; Hunter, A.A.; Leventhal, J.M.; Livingston, N.; Bechtel, K.; Holland, M.L. Child maltreatment-related children’s emergency department visits before and during the COVID-19 pandemic in Connecticut. Child Abus. Negl. 2022, 128, 105619. [Google Scholar] [CrossRef] [PubMed]
  17. Raman, S.; Harries, M.; Nathawad, R.; Kyeremateng, R.; Seth, R.; Lonne, B. Where do we go from here? A child rights-based response to COVID-19. BMJ Paediatr. Open 2020, 4, e000714. [Google Scholar] [CrossRef] [PubMed]
  18. Usher, K.; Bhullar, N.; Durkin, J.; Gyamfi, N.; Jackson, D. Family violence and COVID-19: Increased vulnerability and reduced options for support. Int. J. Ment. Health Nurs. 2020, 29, 549–552. [Google Scholar] [CrossRef] [PubMed]
  19. Loiseau, M.; Cottenet, J.; Bechraoui-Quantin, S.; Gilard-Pioc, S.; Mikaeloff, Y.; Jollant, F.; François-Purssell, I.; Jud, A.; Quantin, C. Physical abuse of young children during the COVID-19 pandemic: Alarming increase in the relative frequency of hospitalizations during the lockdown period. Child Abus. Negl. 2021, 122, 105299. [Google Scholar] [CrossRef] [PubMed]
  20. Piquero, A.R.; Kurland, J. More stringent measures against COVID-19 are associated with less cases and deaths in Florida and Miami-Dade. Am. J. Emerg. Med. 2021, 53, 262–263. [Google Scholar] [CrossRef] [PubMed]
  21. Brantingham, P.J.; Brantingham, P.L. Environmental Criminology; Sage Publications: Beverly Hills, CA, USA, 1981. [Google Scholar]
  22. Vilalta, C.; Fondevila, G.; Massa, R. The impact of anti-COVID-19 measures on Mexico City criminal reports. Deviant Behav. 2022, 44, 723–737. [Google Scholar] [CrossRef]
  23. Brantingham, P.; Brantingham, P. Crime pattern theory. Environ. Criminol. Crime Anal. 2013, 100–116. [Google Scholar] [CrossRef]
  24. Braga, A.A.; Schnell, C. Evaluating police-based policing strategies: Lessons learned from the smart policing Initiative in Boston. Police Q. 2013, 16, 339–357. [Google Scholar] [CrossRef]
  25. Sampson, R.J.; Groves, W.B. Community structure and crime: Testing social-disorganization theory. Am. J. Sociol. 1989, 94, 774–802. [Google Scholar] [CrossRef]
  26. Coulton, C.J.; Crampton, D.S.; Irwin, M.; Spilsbury, J.C.; Korbin, J.E. How neighborhoods influence child maltreatment: A review of the literature and alternative pathways. Child Abus. Negl. 2007, 31, 1117–1142. [Google Scholar] [CrossRef] [PubMed]
  27. Tavares, J.P.; Costa, A.C. Spatial Modeling and Analysis of the Determinants of Property Crime in Portugal. ISPRS Int. J. Geo-Information 2021, 10, 731. [Google Scholar] [CrossRef]
  28. Sun, Y.; Huang, Y.; Yuan, K.; Chan, T.O.; Wang, Y. Spatial Patterns of COVID-19 Incidence in Relation to Crime Rate Across London. ISPRS Int. J. Geo-Information 2021, 10, 53. [Google Scholar] [CrossRef]
  29. Yang, M.; Chen, Z.; Zhou, M.; Liang, X.; Bai, Z. The Impact of COVID-19 on Crime: A Spatial Temporal Analysis in Chicago. ISPRS Int. J. Geo-Information 2021, 10, 152. [Google Scholar] [CrossRef]
  30. Brantingham, P.J.; Tita, G.E.; Mohler, G. Gang-related crime in Los Angeles remained stable following COVID-19 social distancing orders. Criminol. Public Policy 2021, 20, 423–436. [Google Scholar] [CrossRef]
  31. Leśniak, A.; Polończyk, A.; Waśniowski, P. Variations in the spatial distribution of crime events in an urban environment during the COVID-19 lockdown. Cartogr. Geogr. Inf. Sci. 2022, 49, 171–188. [Google Scholar] [CrossRef]
  32. Moise, I.K.; Piquero, A.R. Geographic disparities in violent crime during the COVID-19 lockdown in Miami-Dade County, Florida, 2018–2020. J. Exp. Criminol. 2023, 19, 97–106. [Google Scholar] [CrossRef]
  33. Barboza, G.E.; Schiamberg, L.B.; Pachl, L. A spatiotemporal analysis of the impact of COVID-19 on child abuse and neglect in the city of Los Angeles, California. Child Abus. Negl. 2021, 116, 104740. [Google Scholar] [CrossRef]
  34. Estévez-Soto, P.R. Crime and COVID-19: Effect of changes in routine activities in Mexico City. Crime Sci. 2021, 10, 15. [Google Scholar] [CrossRef] [PubMed]
  35. Andresen, M.A.; Hodgkinson, T. In a world called catastrophe: The impact of COVID-19 on neighbourhood level crime in Vancouver, Canada. J. Exp. Criminol. 2022, 19, 487–511. [Google Scholar] [CrossRef] [PubMed]
  36. Lersch, K.M. An exploratory spatiotemporal analysis of domestic disturbance calls for service in 2020: The case of Tampa, Florida, USA. Int. J. Comp. Appl. Crim. Justice 2022, 1–16. [Google Scholar] [CrossRef]
  37. Lersch, K.M.; Hart, T.C. Does routine activity theory still matter during COVID-19 restrictions? The geography of sexual assaults before, during, and after COVID-19 restrictions. J. Crim. Justice 2023, 86, 102050. [Google Scholar] [CrossRef] [PubMed]
  38. Poonam, K.S.; Rushi, K.B. An Application of Scan Statistics in Identification and Analysis of Hotspot of Crime against Women in Rajasthan, India. Appl. Spat. Anal. 2024. [Google Scholar] [CrossRef]
  39. Jiang, X.; Mao, Z.; Zheng, Z.; Lin, Z.; Wang, Y.; Sheng, S. Spatio-temporal characteristics of sexual crime and influencing factors of commercial service facilities: A case study of Haining City, China. Int. J. Law Crime Justice 2024, 76, 100647. [Google Scholar] [CrossRef]
  40. CONEVAL. La Pobreza Urbana en México: Un Enfoque Geoespacial. 2019. Available online: https://www.coneval.org.mx/Medicion/Documents/Pobreza_urbana/Documentos_metodologicos/Nota_tecnica.pdf (accessed on 21 June 2024).
  41. West, M. Time series decomposition. Biometrika 1997, 84, 489–494. [Google Scholar] [CrossRef]
  42. Getis, A. Spatial Autocorrelation. In Handbook of Applied Spatial Analysis; Fischer, M., Getis, A., Eds.; Springer: Berlin/Heidelberg, Germany, 2010; pp. 255–278. [Google Scholar] [CrossRef]
  43. Anselin, L. Local indicators of spatial association—LISA. Geogr. Anal. 1995, 27, 93–115. [Google Scholar] [CrossRef]
  44. Dubin, R. Spatial Weights. In The SAGE Handbook of Spatial Analysis; Fotheringham, A.S., Rogerson, P.A., Eds.; Sage: London, UK, 2009; pp. 125–158. [Google Scholar]
  45. Lee, S.I. Developing a bivariate spatial association measure: An integration of Pearson’s r and Moran’s I. J. Geogr. Syst. 2001, 3, 369–385. [Google Scholar] [CrossRef]
  46. Prettyman, A. Underreporting child maltreatment during the pandemic: Evidence from Colorado. Child. Youth Serv. Rev. 2024, 156, 107342. [Google Scholar] [CrossRef]
  47. Marmor, A.; Cohen, N.; Katz, C. Child maltreatment during COVID-19: Key conclusions and future directions based on a systematic literature review. Trauma Violence Abus. 2023, 24, 760–775. [Google Scholar] [CrossRef] [PubMed]
  48. Baron, E.J.; Goldstein, E.G.; Wallace, C.T. Suffering in silence: How COVID-19 school closures inhibit the reporting of child maltreatment. J. Public Econ. 2020, 190, 104258. [Google Scholar] [CrossRef] [PubMed]
  49. Hayden, T.B. Criminalization through complicity: (Not) reporting crime in Mexico City. PoLAR Politi Leg. Anthr. Rev. 2020, 43, 211–227. [Google Scholar] [CrossRef]
  50. Nelson, E.L.; Saade, D.R.; Greenough, P.G. Gender-based vulnerability: Combining Pareto ranking and spatial statistics to model gender-based vulnerability in Rohingya refugee settlements in Bangladesh. Int. J. Health Geogr. 2020, 19, 20. [Google Scholar] [CrossRef]
  51. Pinciotti, C.M.; Seligowski, A.V. The influence of sexual assault resistance on reporting tendencies and law enforcement response: Findings from the National Crime Victimization Survey. J. Interpers. Violence 2021, 36, NP11176–NP11197. [Google Scholar] [CrossRef]
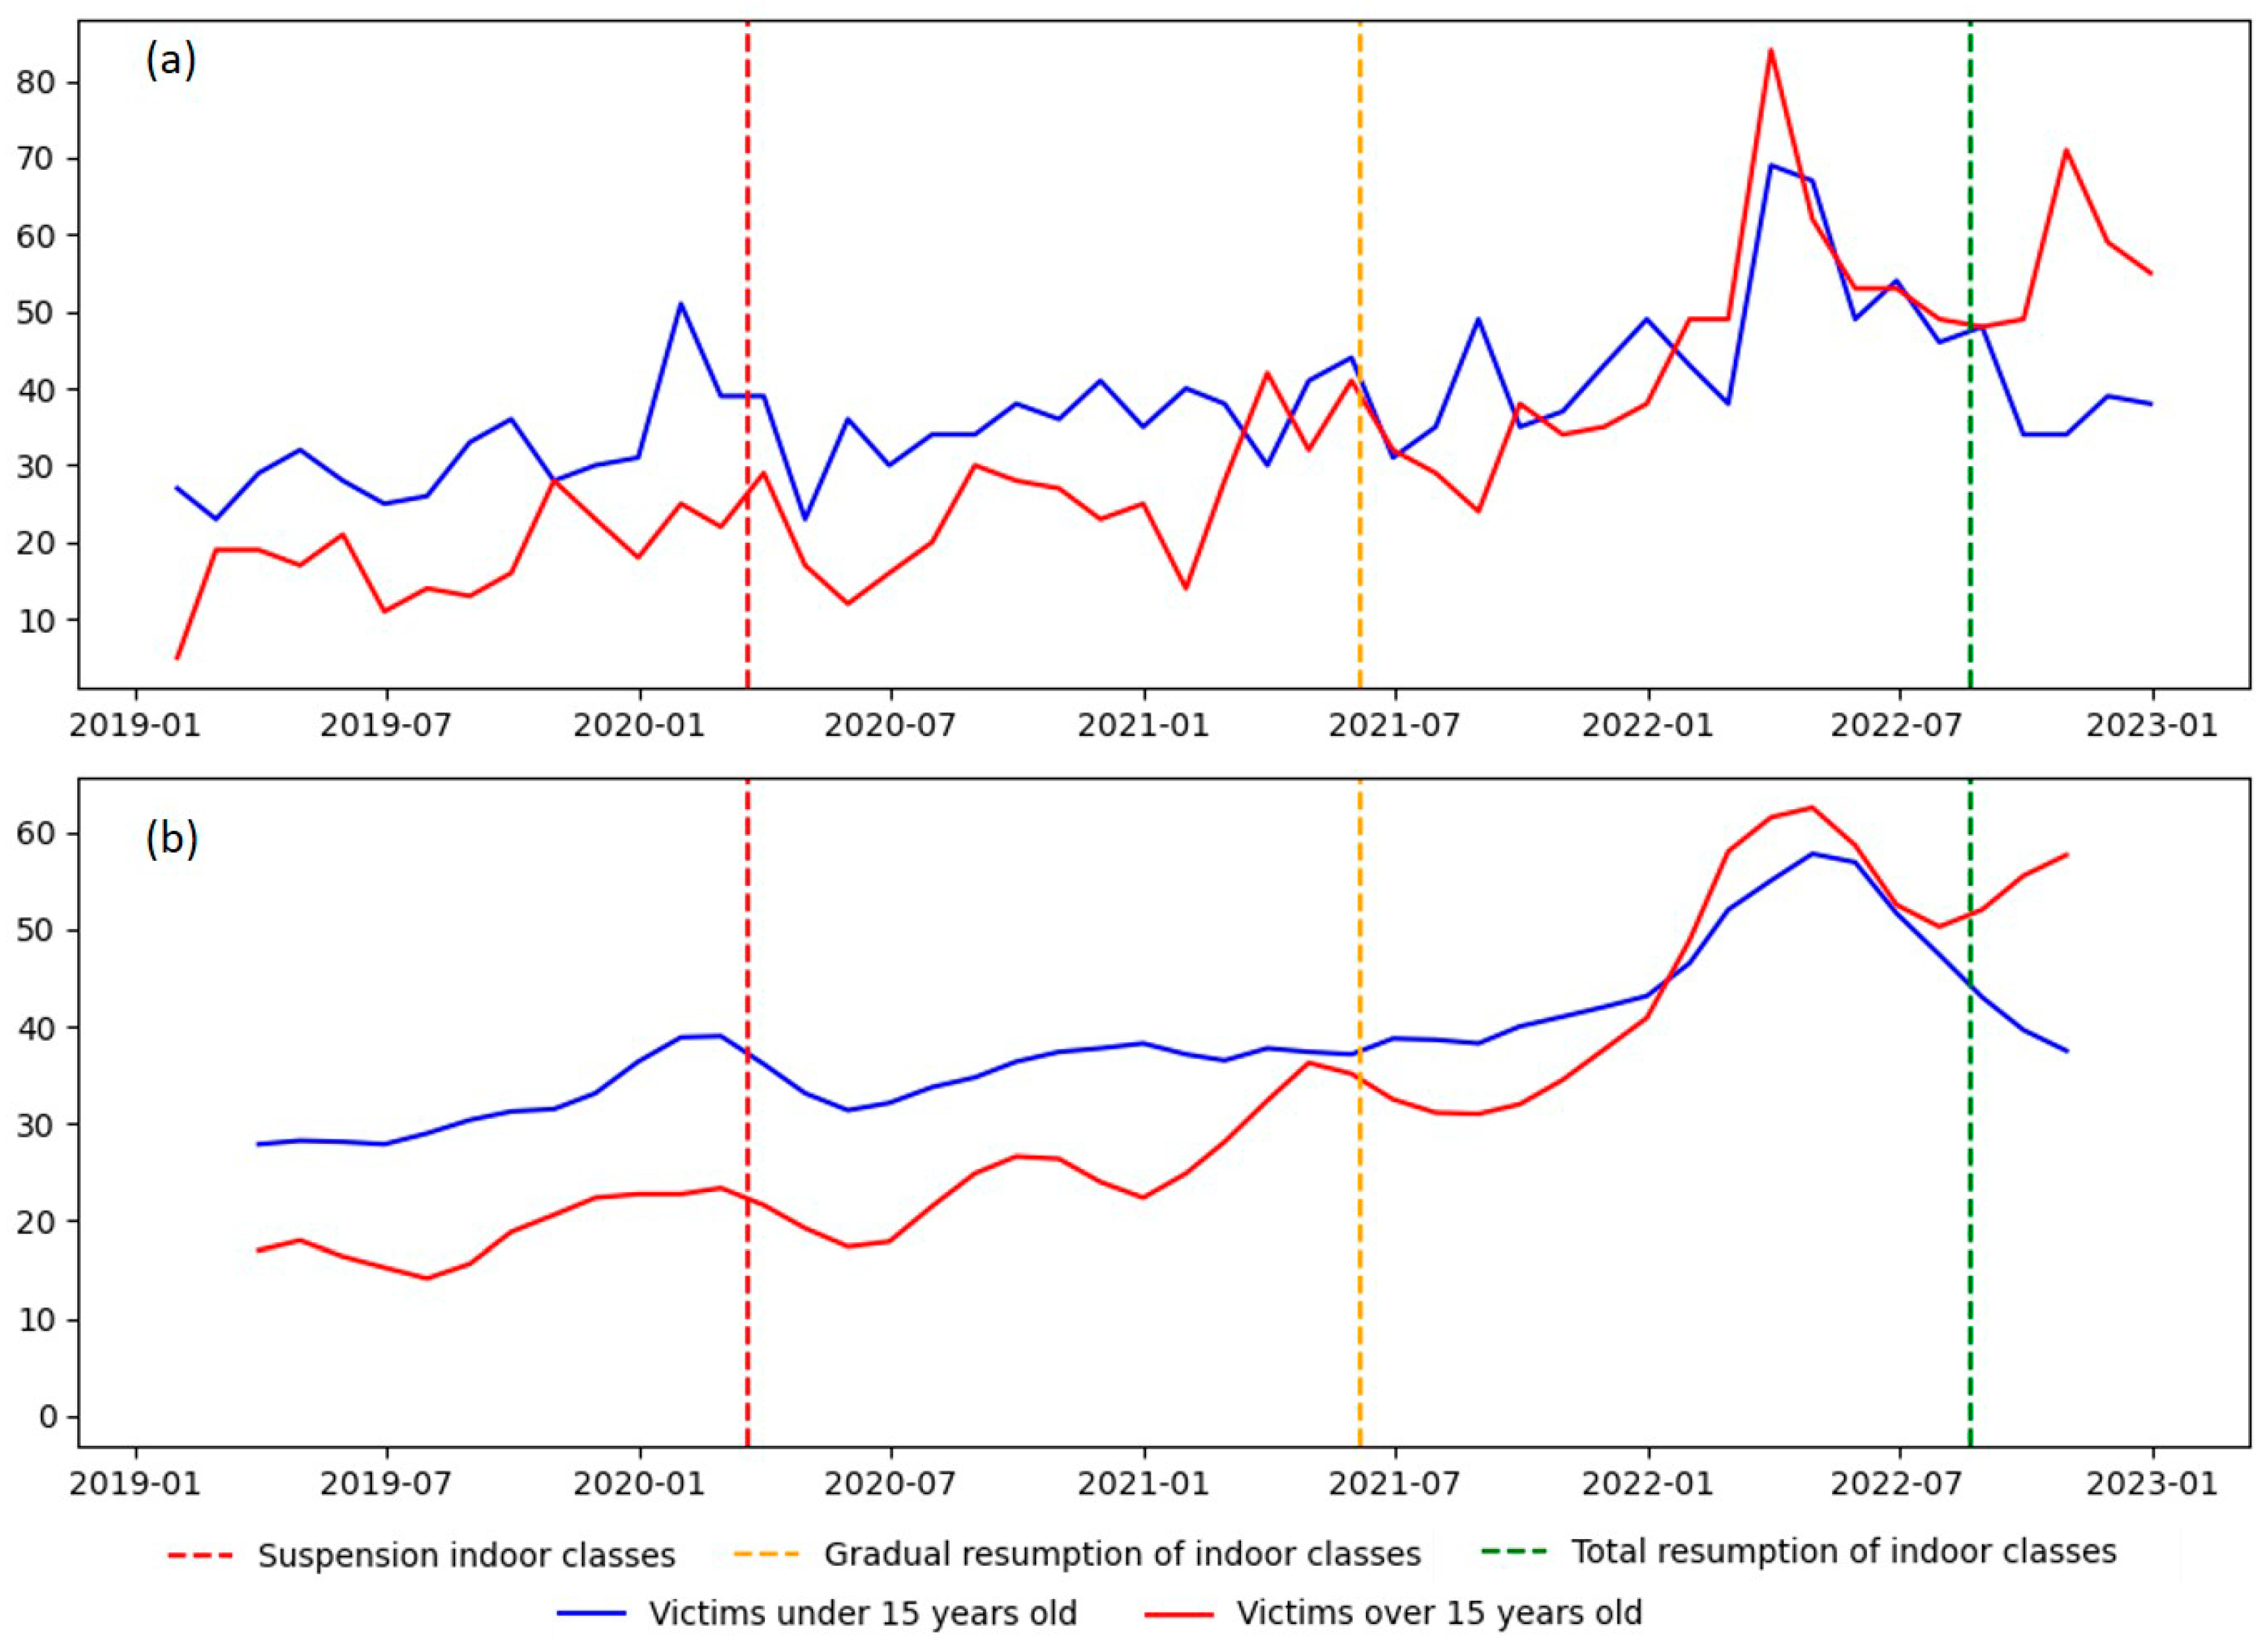
Figure 1. (a) Time series with distribution of sexual abuse cases in children under and over 15 years of age. (b) Time series decomposition to identify the overall trend in both age groups.
Ijgi 13 00223 g001
Figure 2. Distribution of child sexual abuses in hotspot clusters in Mexico City. (a) Hotspots of victims over 15 years old. (b) Hotspots of victims under 15 years old.
Ijgi 13 00223 g002
Figure 3. Distribution of child sexual abuses in diamond clusters in Mexico City. (a) Diamonds of victims under 15 years old. (b) Diamonds of victims over 15 years old.
Ijgi 13 00223 g003
Figure 4. Boxplots with the distribution of victims’ age and gender. The upper section of the figure is occupied by hotspot clusters (a), whereas diamond clusters (b) are located in the lower half.
Ijgi 13 00223 g004
Table 1. Global Moran’s Index.
Child Sexual AbuseMoran’s Indexp-ValueZ-Score
All victims0.15350.00112.7086
Victims < 15 years old0.14760.00111.9604
Victims > 15 years old0.15010.00112.6934
Table 2. Results of the bivariate Moran’s on the discovered hotspots.
Victims < 15 Years OldVictims > 15 Years Old
PovertyPopulationSchooling YearsPovertyPopulationSchooling Years
2019Moran’s I−0.0690.084−0.360.079−0.0170.05
p-values0.3830.3030.010.3640.490.311
Z-score0.53850.636−2.421.07−0.130.109
2020Moran’s I0.0670.18−0.0410.2000.120.072
p-values0.2990.110.3630.050.1440.236
Z-score0.4701.20−0.331.481.090.50
2021Moran’s I0.28−0.1730.290.178−0.230.310
p-values0.050.0790.0080.1720.0710.08
Z-score1.99−1.402.201.009−1.421.54
2022Moran’s I−0.1180.04−0.220.039−0.1770.006
p-values0.1820.3240.0270.3960.0540.482
Z-score−0.940.370−1.540.317−1.700.0144
Table 3. Description of hotspot and diamond clusters using Local Moran’s I, Mexico City.
ClusterAge GroupClusterYearsp-Value# VictimsSchooling YearsPoverty
1<15 yearsHotspot21/220.02/0.0362/210.1418–34
221/220.001/0.0442/211.2218–34
1Diamond20/220.001/0.0012/210.3534–50
1>15 yearsHotspot20/220.034/0.0012/510.0718–34
221/220.016/0.0033/413.310–18
321/220.01/0.0012/311.810–18
421/220.002/0.0212/211.860–18
1Diamond20/220.001/0.0012/210.510–18
Note: The table is arranged in ascending order according to the number of years of schooling (from lowest to highest), p-value (from highest to lowest), number of victims (from highest to lowest), and poverty level (from lowest to highest). The National Institute of Geographic and Statistics provides the average years of schooling in each micro-statistical area. The National Council for the Evaluation of Social Development Policy assigns the poverty level for each region.
Disclaimer/Publisher’s Note: The statements, opinions and data contained in all publications are solely those of the individual author(s) and contributor(s) and not of MDPI and/or the editor(s). MDPI and/or the editor(s) disclaim responsibility for any injury to people or property resulting from any ideas, methods, instructions or products referred to in the content.