Article

Renovation and Reconstruction of Urban Land Use by a Cost-Heuristic Genetic Algorithm: A Case in Shenzhen

1
School of Geosciences and Info-Physics, Central South University, Changsha 410083, China
2
The Third Surveying and Mapping Institute of Hunan Province, Changsha 410083, China
3
Hunan Geospatial Information Engineering and Technology Research Center, Changsha 410083, China
*
Author to whom correspondence should be addressed.
ISPRS Int. J. Geo-Inf. 2024, 13(7), 250; https://doi.org/10.3390/ijgi13070250
Submission received: 2 April 2024 / Revised: 24 May 2024 / Accepted: 6 July 2024 / Published: 12 July 2024

Abstract

:
Urban land use multi-objective optimization aims to achieve greater economic, social, and environmental benefits by the rational allocation and planning of urban land resources in space. However, not only land use reconstruction, but renovation, which has been neglected in most studies, is the main optimization direction of urban land use. Meanwhile, urban land use optimization is subject to cost constraints, so as to obtain a more practical optimization scheme. Thus, this paper evaluated the renovation and reconstruction costs of urban land use and proposed a cost-heuristic genetic algorithm (CHGA). The algorithm determined the selection probability of candidate optimization cells by considering the renovation and reconstruction costs of urban land and integrated the renovation and reconstruction costs to determine the direction of optimization so that the optimization model can more practically simulate the actual situation of urban planning. The reliability of this model was validated through its application in Shenzhen, China, demonstrating that it can reduce the cost consumption of the optimization process by 35.86% at the expense of sacrificing a small amount of economic benefits (1.18%). The balance of benefits and costs enhances the applicability of the proposed land use optimization method in mature, developed areas where it is difficult to demolish buildings that are constrained by costs.

1. Introduction

Urban land serves as the foundation for the economic and social advancement of cities. However, the limited availability of land resources presents a challenge in achieving urban development objectives related to economic growth and service enhancement [1,2]. More importantly, within well-developed urban areas, altering existing land types entails significant costs, while issues such as aging infrastructure and increasing population demands have resulted in the inefficient utilization and diminished efficacy of urban land resources [3,4]. Therefore, the rational redevelopment and optimization of urban land are critical for the future high-quality development of cities [5,6]. Land resources can be utilized more efficiently through scientific land use optimization, thus promoting urban economic development [7,8].
Land use optimization entails the quantitative design and spatial allocation of different land types based on specific objectives and constraints [9]. Existing optimization models can be categorized into three types: bottom-up, top-down [10], and hybrid algorithms. Bottom-up models achieve global optimization through micro-scale land use changes [11]. Specifically, the individual behaviors and decision-making processes of each small area are simulated to achieve global optimality. Models including cellular automata [12], multi-agent systems [13], and game theory [14], are used to construct individual simulation processes. The advantage of such methods lies in their ability to consider the diversity and complexity among individuals, thus closely resembling real-world land use situations. For instance, Gao et al. employed cellular automata to predict the urban land expansion in Wenzhou city for the years 2025 and 2030 [15]. Wu et al. combined linear optimization models with the CLUE-S (Conversion of Land Use and its Effects at Small Regional Extent) model to simulate land use changes in Jiangsu Province for the year 2025 [16].
In contrast, top-down models prioritize global optimization objectives, allocating different land use types to various land grids through mathematical methods to obtain a series of optimal solutions [10]. The linear programming model [17], particle swarm algorithm [18], ant colony algorithm [19], and genetic algorithm [20] are the commonly used top-down models. These models focus more on overall situations and global optimization objectives, making them better suited to adapt to various land planning policies and are therefore more widely used in land use optimization [11]. For instance, Li et al. implemented land use optimization in Changzhou City based on the particle swarm algorithm [21]. Wang et al. established a multi-objective type based on genetic algorithms targeting ecological and economic benefits, successfully simulating the optimized land use quantity structure in 2020 [22]. Due to the large volume of data and high computational complexity involved in land use optimization, some researchers have proposed parallel algorithms to improve the computational efficiency of the optimization process [23]. For instance, Porta et al. introduced a parallel genetic algorithm for land use zoning, which was successfully applied to land use planning in Galicia [24].
Hybrid algorithms are models that integrate both top-down and bottom-up approaches. Through effective interaction, hybrid algorithms facilitate comprehensive consideration and coordination in the land use optimization process [25]. For instance, Huang et al. coupled the Multi-Agent Systems with Fuzzy Logic Algorithm (MASFLA) model with the Hybrid Frog-Leaping Algorithm (HFLA), achieving an optimal spatial configuration of regional land use in terms of both structure and quantity [13]. Similarly, Liu et al. employed a Genetic Optimization loosely coupled with the Game Theory Spatial Optimization Model, using competitive land grids as basic units. This model utilizes multi-stakeholder game theory and land use planning knowledge to harmonize local land use competitions [26].
In past land use optimization studies, the genetic algorithm has been widely employed [9], as it can effectively handle large-scale and multi-objective optimization problems while considering the interaction between different lands, making them suitable for complex optimization problems [27]. Compared to conventional single-objective genetic algorithms, the non-dominated sorting genetic algorithm II (NSGA-II) can generate a set of balanced and diverse solutions, forming the so-called Pareto front [28]. This means that it can not only find a single optimal solution but also provide multiple optimal solutions in the solution space, thus better meeting the diverse target requirements in complex problems and demonstrating superior performance in land use optimization [29].
In optimization algorithms, optimization objectives can guide the generation of optimal urban land use allocation schemes. Among them, economic benefits reflect various requirements such as urban economic development and land use efficiency, making them pivotal in achieving rational urban land use allocation. Hence, many land use optimization studies adopt the objective of maximizing economic benefits, measuring economic benefits using GDP [21] or land rent theory [30]. However, these studies often overlook the implementation costs generated during the urban land use optimization process. In practical urban planning, it is necessary to consider the implementation costs arising from factors such as land prices, population density, building structures, and geographical conditions. Thus, the pursuit of economic benefits without regard to the implementation costs may hinder the application of optimization schemes in realistic urban planning. Balancing the relationship between implementation costs and economic benefits is crucial for achieving rational resource allocation and high-quality development in cities. In 2021, the Ministry of Housing and Urban-Rural Development of China issued an official notice, emphasizing the avoidance of the negative impacts of “demolition and reconstruction” in urban renewal [31]. Therefore, urban planners are more focused on achieving optimization without changing the existing land use types. For instance, by renovating old buildings to increase the economic benefits of land utilization [32].
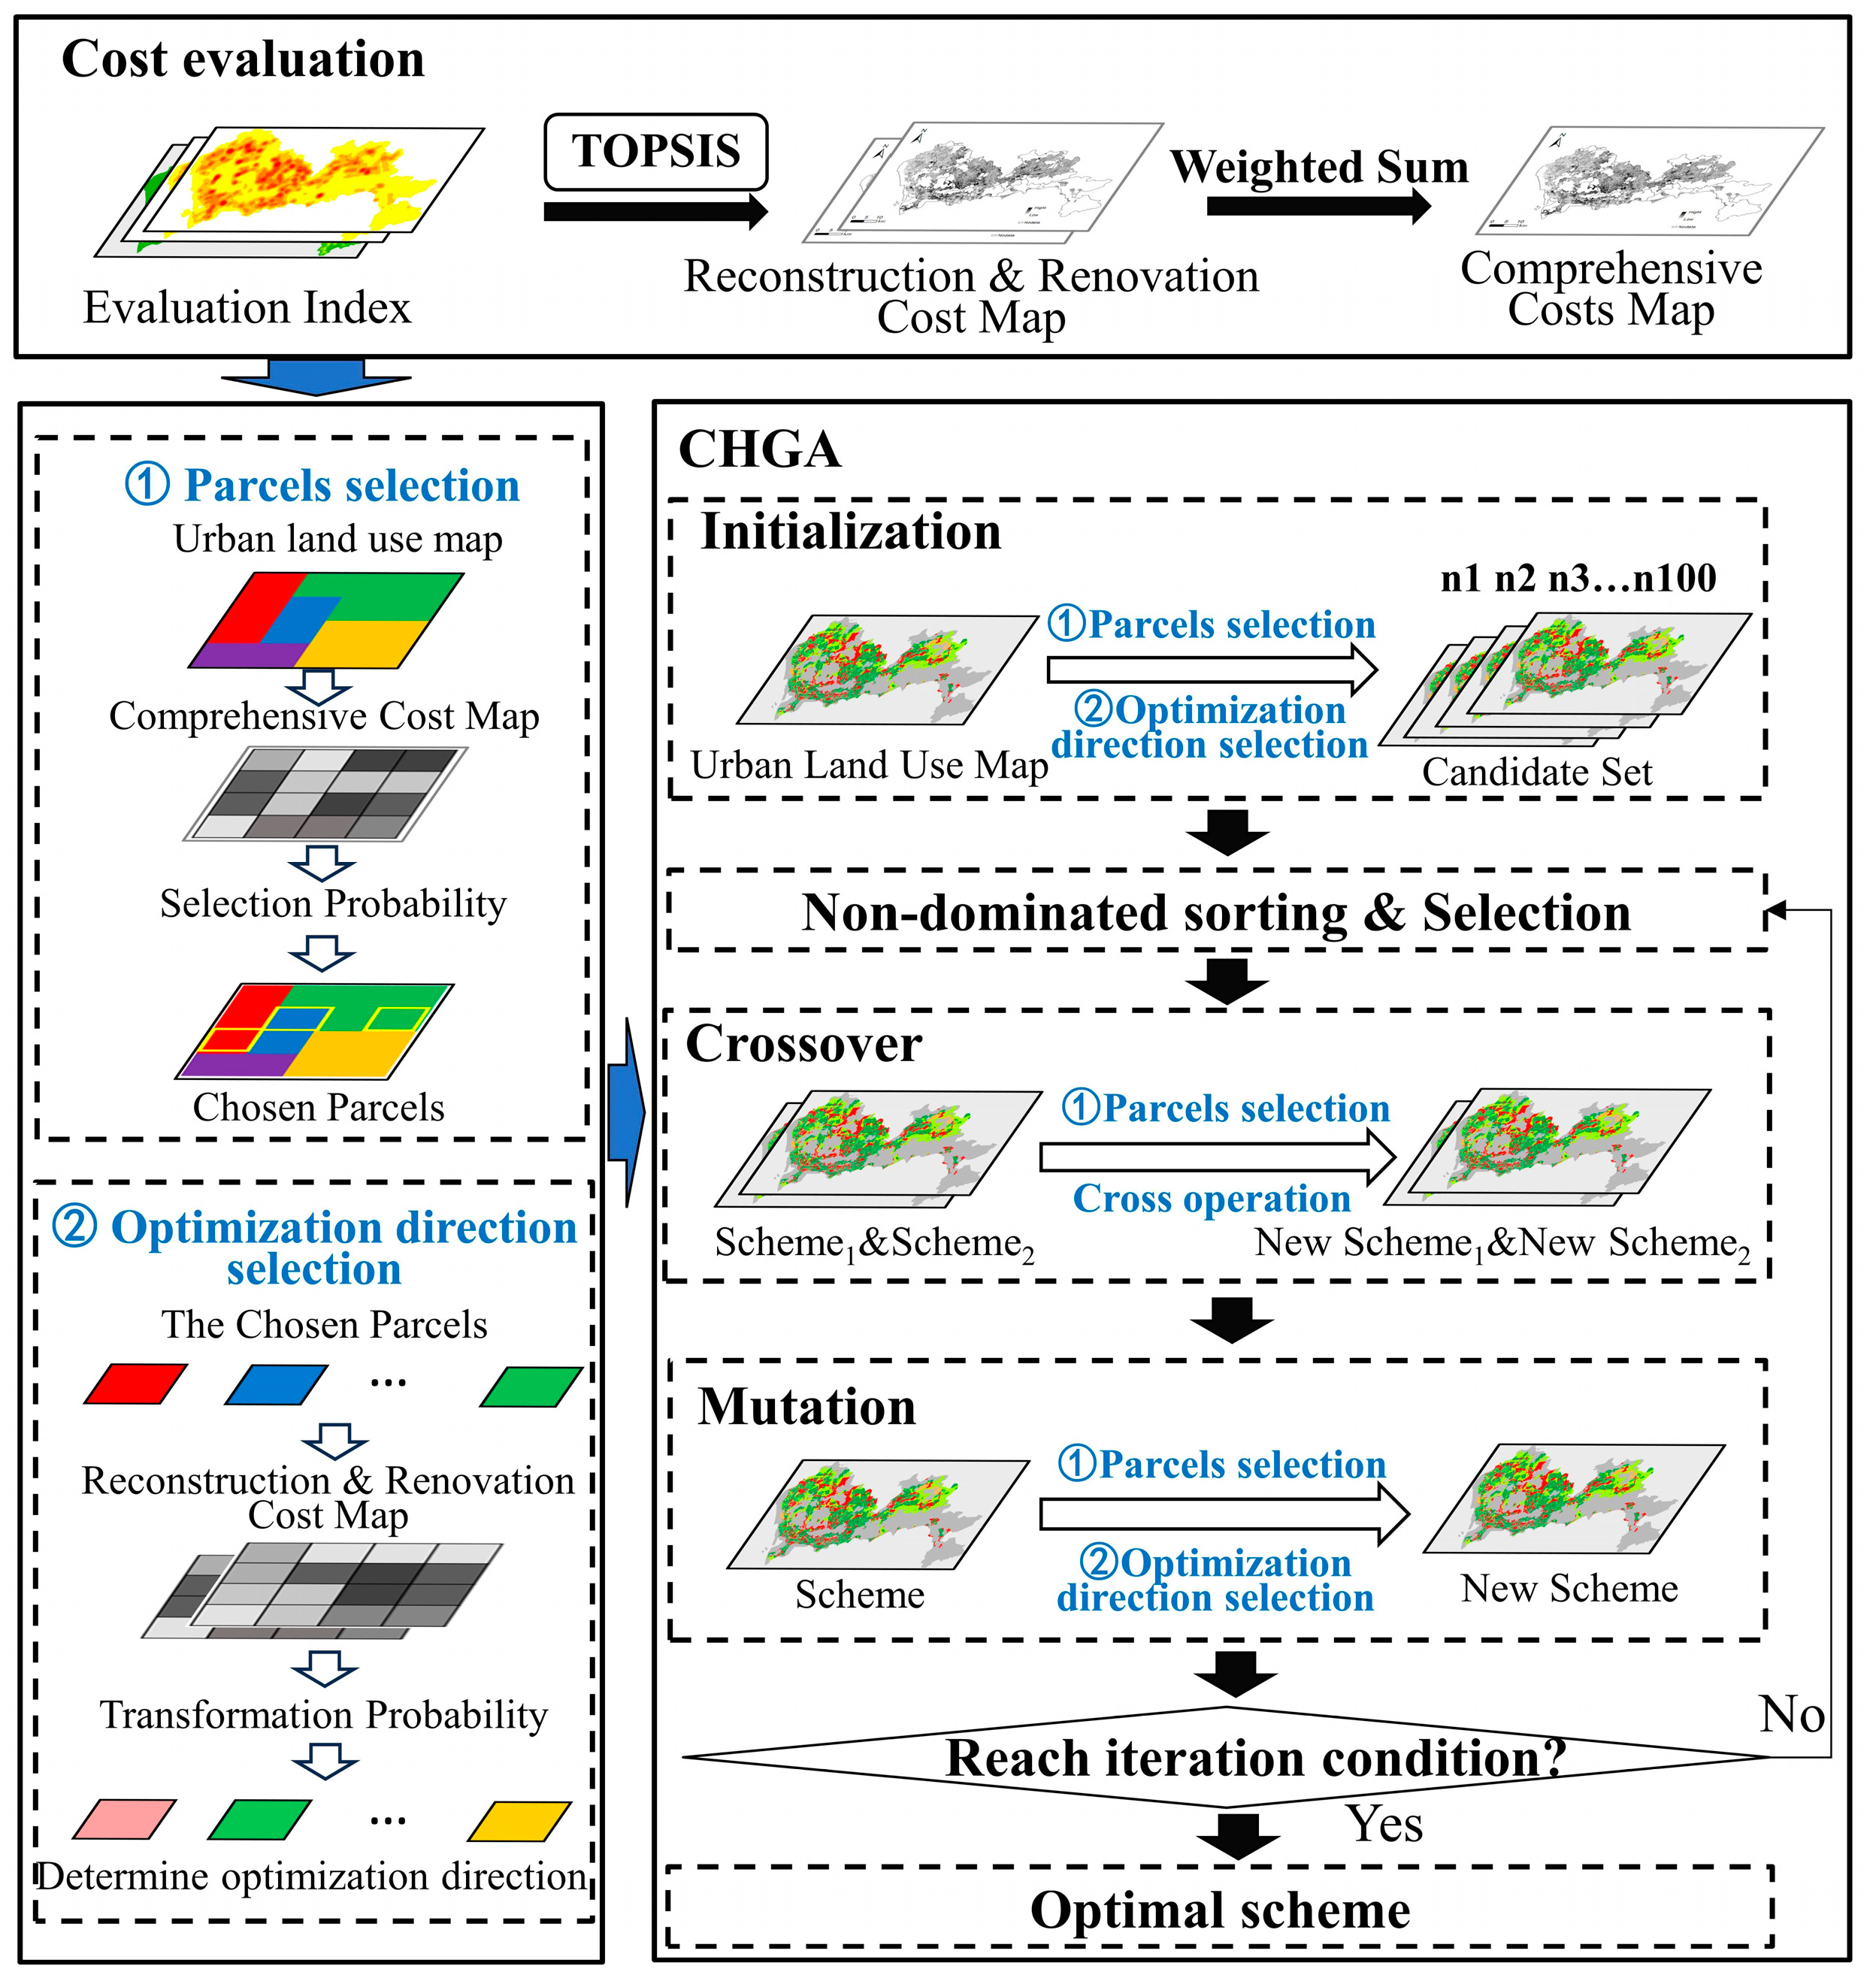
Therefore, we propose two directions for optimization: land renovation and land reconstruction. Land renovation does not involve changes in land types but still incurs the consumption of costs and the improvement in economic income, while land reconstruction signifies the transformation in urban land type, with relatively higher costs and benefits. Then, this paper proposes a cost-heuristic genetic algorithm (CHGA). By considering the renovation and reconstruction costs of urban land cells and two optimization directions, the probability of land cell transformation is determined, thereby enabling the optimization model to more comprehensively simulate the actual situation of urban planning. The application of the model in the demonstration city Shenzhen in China validated its reliability and provides a more comprehensive and practical approach for urban land use optimization.
In general, the main contributions of this study are as follows:
  • We introduced land renovation to the optimization process to accommodate the demand for upgrading the service capacity through refurbishment in mature areas of development so that the optimization schemes are more aligned with the actual requirements of urban redevelopment.
  • We balanced economic benefits and implementation costs in urban land transformation, emphasizing the importance of considering actual costs over solely maximizing economic objectives, resulting in more feasible and economical optimization schemes.
  • We proposed a cost-heuristic genetic algorithm, which aims to integrate both implementation costs and economic benefits into the optimization process of urban land use types. It selects optimized land cells and determines optimization directions according to renovation and reconstruction costs, which enhances optimization rationality.
The remainder of this paper is organized as follows. Section 2 presents the study area, data sources, research framework, and research methodology used in this study. Section 3 showcases a case study of Shenzhen City, including specific settings of objectives and constraints, as well as the presentation and analysis of case study results. Finally, Section 4 and Section 5 discuss the significance, conclusions, and implications of this research.

2. Materials and Methods

2.1. Study Area and Data Sources

Shenzhen is a coastal city located in Guangdong Province (Figure 1), China, with a total area of 1997.47 square kilometers. By the year 2022, its permanent population reached 17.6618 million [33]. The rapid economic development of Shenzhen has led to significant demand for land resources [34]. Shenzhen is a well-developed city with established infrastructure in many areas. Land regeneration in Shenzhen is constrained by costs and its impact on urban residents [35]. High implementation costs have led to land planning in Shenzhen, often involving many updates that do not change the land type [36]. Considering both renovation and reconstruction as optimization directions in the optimization process in Shenzhen can produce more reasonable optimization schemes. Moreover, existing land resources will be maximally utilized, thereby enhancing land use efficiency.
The urban land use data used in this study are sourced from the Mapping Essential Urban Land Use Categories in China (EULUC-China) dataset developed by Tsinghua University [37]. It covers five categories of urban land use: residential, service, transportation, industrial, and commercial. Considering Shenzhen’s urban development policies, data availability, and the previous literature on urban land use optimization [38,39], these five categories of land use data support our research on urban land use optimization. In order to optimize urban land use spatially with greater precision while also considering efficiency and data availability [40], this study processed the data into grid data with a resolution of 50 m × 50 m, which consists of 1784 × 922 cells. Compared to past studies, the data we utilized are more refined, indicating the greater authenticity of our model [41].
The other data used in this paper include:
(1)
Population density (https://www.worldpop.org/, accessed on 23 February 2023).
(2)
Digital Elevation Model (https://search.asf.alaska.edu/, accessed on 24 February 2023).
(3)
Urban land price (https://pnr.sz.gov.cn/d-djtcx/djtcx/index.html, accessed on 20 February 2023).
(4)
Urban road network (https://www.openstreetmap.org/, accessed on 12 June 2022).
(5)
Building census (https://zjj.sz.gov.cn/xxgk/ztzl/pubdata/sjcx/index.html, accessed on 20 February 2023).
(6)
GDP grid data (http://nnu.geodata.cn/data/datadetails.html, accessed on 20 February 2023).
During data preprocessing, to obtain data that satisfy the spatial resolution requirements of this study, we processed the benchmark land price, GDP, and population density data through kriging interpolation and clipping. To meet the subsequent research needs for road network and building density, we used density analysis to process building points and road network data obtained from the OpenStreetMap website. The above preprocessing was carried out in ArcGIS 10.2.

2.2. Model for Urban Land Use Optimization: CHGA

Figure 2 illustrates the urban land use optimization method developed in this study. Initially, we utilized the Technique for Order Preference by Similarity to Ideal Solution (TOPSIS) evaluation method to obtain the evaluation maps of renovation and reconstruction costs based on seven evaluation indicators, including elevation, slope, land price, building density, floor area ratio, building structure, and population density. Then, we obtained the comprehensive cost map through a weighted summation of the two cost maps. Subsequently, based on the comprehensive, renovation, and reconstruction costs, we calculated the probabilities of land cell selection and transformation to guide the selection and optimization directions during the optimization process. Additionally, we introduced a renovation optimization approach that preserves the land use type, which aligns our optimization scheme more closely with the comprehensive requirements of urban planning. Specifically, during the initialization, crossover, and mutation processes of the CHGA algorithm, we determined the cells requiring optimization based on selection probabilities. Following the identification of land cells needing optimization, we determined the optimization direction (i.e., renovation or reconstruction) using transformation probabilities. By guiding the selection and optimization directions of the cells based on cost considerations, a more rational urban land use optimization scheme can be obtained.

2.2.1. Cost Evaluation of Urban Land Use Optimization

Urban land use optimization is a multifaceted process, extending beyond mere land use type transformations. It involves the renovation of land and existing structures or reconstruction after demolition. Renovation offers a relatively quick optimization method with less pressure on resettling residents and lower investment costs. Reconstruction, on the other hand, entails demolishing aging or inadequate buildings and replacing them with modern structures to enhance land utilization efficiency, which entails longer time frames and higher investment costs, potentially resulting in greater social impact. Nevertheless, through thoughtful planning and management, reconstruction can better drive urban economic development and enhance urban quality.
We introduced the implementation cost evaluation indicators to assess the feasibility of renovation and reconstruction on urban land cells. Due to the multifaceted nature of factors affecting implementation costs, we followed the principles of feasibility, combining quantitative and qualitative aspects and representativeness. Through expert consultations and referencing existing literature [42,43,44], we selected evaluation indicators, ensuring the reliability and comprehensiveness of the selection. Eventually, we identified seven indicators for urban renovation and reconstruction cost evaluation, which can be classified into three categories: topographical indicators (elevation, slope), building environment indicators (building density, floor area ratio, building structure), and socio-economic indicators (land price, population density). Indicators are explained in Table 1.
To evaluate the costs of urban renovation and reconstruction, we first perform indicator weighting. Weighting methods can be classified into subjective weighting and objective weighting. A single subjective weighting method can easily be influenced by personal biases and experience, while a purely objective weighting method might overlook important expert knowledge and subjective judgment, leading to less accurate weights. Based on this, to determine the relative importance of each indicator in the cost of urban land optimization, we used the Analytic Hierarchy Process (AHP) and the Entropy Weight Method (EWM) to conduct cost evaluation from both subjective and objective perspectives.
In the AHP method, we assessed the significance of renovation and reconstruction costs by reviewing extensive literature and urban policy documents [45,46]. We quantified these assessments to derive subjective weights for renovation costs and reconstruction costs, ω 1 and ω 2 . Furthermore, to gauge the objective differences between indicators, we employed the EWM to quantify the importance of each indicator, obtaining objective weights, ω 3 [47]. Finally, we adopted the CRITIC method to integrate the subjective and objective weights, which is a method for evaluation indicators that can comprehensively assess the weights of indicators based on their contrast intensity and the conflicts between them [48]:
ω j r n v = I ω 1 ,   ω 3 j j = 1 k I ω 1 ,   ω 3 j
ω j r c s = I ω 2 ,   ω 3 j j = 1 k I ω 2 ,   ω 3 j
where ω j r n v and ω j r c s are the composite weights for renovation and reconstruction, and k denotes the number of indicators. I . , . j denotes the information-carrying capacity of the j -th indicator, which is obtained from the CRITIC method, when subjective weights ( ω 1 or ω 2 ) and objective weights ( ω 3 ) are given. The larger information-carrying capacity means that the j -th indicator plays a greater role in the whole indicator system. Finally, integrating these composite weights with all indicators, we utilized the Technique for Order Preference by Similarity to Ideal Solution (TOPSIS) for a comprehensive assessment [48]. The TOPSIS method is a comprehensive evaluation method that makes full use of the original data information, offering the advantages of being realistic, intuitive, and reliable. Therefore, we chose the TOPSIS method for evaluating the costs of urban reconstruction and renovation, considering the performance of each land cell across all indicators, and then obtaining the renovation costs C r n v and reconstruction costs C r c s for all land cells.

2.2.2. Optimization Objective

The optimization objective refers to the ultimate goal or ideal state pursued in land use decision-making, which plays a crucial role in urban land use optimization. Urban land use planning and decision-making can be guided by setting appropriate optimization objectives. In pursuit of the overarching objective of urban sustainable development, we selected a set of optimization objectives, including economic benefit, comprehensive costs, land compatibility, and transport accessibility, which were categorized into non-spatial objectives and spatial objectives.
(1)
Non-spatial objectives
The non-spatial objectives aim to harmonize the relationship between maximizing economic benefit and minimizing comprehensive costs during the optimization process. Parts of the research employed the Theory of Land Rent to calculate economic benefits [30], while others measured the economic benefits of different land types using GDP [21]. For different types of urban land use, to gauge the economic increment under both renovation and reconstruction directions, we utilized the GDP growth rates G l i r n v (i.e., renovation direction) and G l j l j r c s (i.e., reconstruction direction) as the metrics for economic increment during land use type transformation. Specifically, we utilized the following formula to calculate the economic benefit objective E c o n o m i c s O B J :
M a x   E c o n o m i c s O B J = i = 1 n 1 G D P i ( 1 + G l i r n v ) + j = 1 n 2 G D P j ( 1 + G l j l j r c s )
where G D P i , G D P j denote the GDP value corresponding to the i -th land cell and j -th cell undergoing land use transformation. G l i r n v denotes the GDP growth rate after renovation for land use type l i of the i -th land cell. G l j l j r c s denotes the GDP growth rate of the j -th cell when transitioning from land use type l j to land use type l j through reconstruction. n 1 and n 2 denote the total number of land cells being renovated and reconstructed in the optimization solution, respectively.
Furthermore, cost is an indispensable factor and directly links to the sustainability and practical feasibility of optimization schemes. Therefore, by minimizing the cost objective, we can consider the challenges associated with renovation or demolition on urban land. Moreover, it allows us to seek a balance between economic benefits and comprehensive costs during the optimization process, ensuring the maximization of economic benefits while minimizing the burden of implementation costs. Specifically, we utilized the following formula to calculate the cost objective C o s t O B J :
M i n   C o s t O B J = i = 1 n 1 C i r n v + j = 1 n 2 C j r c s ( 1 + c g )
where C i r n v represents the cost of renovating the i -th land cell, and C j r c s represents the cost of reconstructing the j -th land cell. c g is the cost coefficient for the reconstruction of land into land use type g (Table 2), and this coefficient is referenced from the study by Cao et al. [49].
(2)
Spatial objective
The spatial objectives aim to optimize urban land spatial layout by maximizing land compatibility and transport accessibility. The compatibility between different land use types reflects the degree of mutual adaptation of various types of land in the urban structure. For instance, the compatibility between commercial and residential land manifests in the adjacency of commercial and residential areas, facilitating the convenience of commercial services and enhancing the quality of life. Understanding land compatibility is crucial for the rational layout planning of different functional zones within the city, improving urban sustainability, reducing environmental pressure, and enhancing habitability. Based on the existing literature, we established the compatibility between different land use types in cities, as shown in Table 3 [50,51,52].
Further, the land compatibility objective of the optimization solution is calculated by the following equation:
M a x   C o m O B J = i = 1 N j = 1 m C o m p l i , l j
where N denotes the total number of land cells in the study area. l i denotes the land use type of the i -th land cell and the land use type of its j -th adjacent cell is l j . m is the number of adjacent cells for each land cell. Based on Table 2, C o m p l i , l j denotes the land compatibility between the i -th land cell i and the j -th land cell.
As urbanization accelerates, urban residents’ transportation issues hold a pivotal position in urban planning. Transport accessibility not only serves as a pivotal indicator for assessing urban structure but also plays a significant role in determining the overall functionality and livability of a city. Hence, we have chosen it as one of our optimization objectives. We calculated the transport accessibility objective based on the road network density. The formula is as follows:
M a x   A c c O B J = i N 1 d e n s i N 1
where N 1 denotes the number of parcels with commercial and residential land uses, and d e n s i denotes the road network density of the i -th land use grid, where the road network density is calculated by the road network passing line density [53].

2.2.3. Constraints

The constraints reflect the environmental, social, and political limitations in urban land use planning and are an integral part of mathematical optimization in land use allocation. We have established the following constraints:
(1)
Optimization area constraint: The minimum optimization area for each urban land use function is subject to restrictions, in accordance with urban planning standards and government policies;
(2)
Topographical constraint: Terrain with a slope greater than 10 degrees cannot be used for urban construction, thus ensuring the safety of urban construction and the effectiveness of resource management;
(3)
Functional protection constraint: Restricting changes to urban landmark buildings, historical cultural heritage, and urban road land, to maintain sustainable urban development.

2.2.4. Procedures of the Cost-Heuristic Genetic Algorithm

We proposed a CHGA algorithm to incorporate implementation costs and urban renovation into the optimization process of urban land use, enhancing the rationality of the urban land use optimization process. Specifically, the probabilities of selection and optimization direction based on the renovation, reconstruction, and comprehensive costs were designed. In the initialization, crossover, and mutation processes, we first determined the cells to be optimized based on selection probabilities. Subsequently, we used optimization direction probabilities to determine the optimization direction (renovation or reconstruction). Guiding the optimization algorithm with costs allows us to obtain more reasonable urban land use optimization schemes.
(1)
Selection probability based on comprehensive costs
In practical urban planning, comprehensive costs often influence the implementation process. Specifically, excessively high comprehensive costs tend to impede the implementation of optimization schemes, while schemes with lower comprehensive costs are relatively easier to promote. It represents the probability of land grid selection during initialization and the optimization process. Therefore, we computed the selection probability P s i for each urban land grid based on the evaluation results of renovation and reconstruction costs.
P s i = 2 C i r n v C i r c s j = 1 N ( 2 C j r n v C j r c s )
where P s i denotes the selection probability of the i -th land cell, and N denotes the total number of land cells. A higher selection probability indicates lower comprehensive costs for the land cell, thus increasing the likelihood of implementing the optimization plan. Conversely, a lower selection probability suggests a reduced likelihood of implementing the optimization plan. Based on these probabilities, we utilized the roulette wheel algorithm to select the grids requiring optimization [54].
(2)
Optimization direction probability between renovation and reconstruction
To model the urban land use optimization process more realistically, we incorporated two distinct optimization directions into our optimization model: renovation and reconstruction. Renovation involves the systematic improvement and enhancement of land functional areas through upgrades in infrastructure. During the optimization process, renovation does not entail changes in land use types. Reconstruction, on the other hand, delves deeper into urban transformation by involving the demolition of existing structures or facilities, followed by the construction of new urban land types on the land grids. Consequently, reconstruction entails a change in urban land use types during the optimization process. Additionally, both renovation and reconstruction costs not only affect the selection probability of the land grid but also influence the determination of optimization directions in urban planning. On the premise of achieving expectations, decision-makers often tend to choose optimization directions with lower costs. Hence, we calculated the optimization direction probability P d i for each land cell based on cost considerations.
P d i = 1 C i r n v 1 C i r n v + 1 C i r c s
where C i r n v and C i r c s represent the renovation cost and the reconstruction cost of the i -th land cell, respectively. By randomly selecting a number ρ 0,1 , ρ < P d i indicates that the i -th land cell requires renovation. Otherwise, it indicates that reconstruction is required.
(3)
Cost-heuristic genetic algorithm considering selection and direction probabilities
In the cost-heuristic genetic algorithm, considering selection and transformation probabilities, each chromosome represents a distinct solution for urban land use. The genes within the chromosome correspond to land use grids within the city, where each grid contains information such as renovation and reconstruction costs, as well as land use types. In the general process of CHGA, firstly, the number of optimization areas for different urban land use types is set as the threshold, and multiple candidate solutions are generated through initialization guided by selection and transformation probabilities. Subsequently, non-dominated sorting categorizes individuals into different non-dominated levels, sorting them based on their superiority across multiple objectives. Then, individuals are selected according to selection probabilities and undergo crossover and mutation operations based on crossover and mutation probabilities. Finally, through iterative processes until convergence, the algorithm outputs the optimal land use scheme.
Step 1: Initialization
Initialization stands as a crucial component in land use optimization, determining the quality of individuals within the population and the convergence rate of the algorithm. In this paper, selection probability and transformation probability are introduced into the initialization process. Specifically, land cells are selected using a roulette wheel algorithm based on selection probabilities, and then the direction of optimization (renovation or reconstruction) for each cell is determined according to transformation probabilities. The advantage of this initialization method lies in the cost guidance, which accelerates the convergence speed of optimization and enhances its rationality.
Step 2: Non-dominated sorting and selection
Non-dominated sorting is an effective tool for addressing multi-objective optimization problems [55]. We computed the objectives of solutions in the candidate set and utilized non-dominated sorting to rank the candidate optimization solutions.
During the selection process, to retain excellent solutions and ensure diversity within the population, this study employs a roulette wheel selection method after calculating the fitness of each solution [10].
Step 3: Crossover
The crossover operation is typically aimed at reducing land fragmentation. Building on Pan et al.’s design of crossover operators considering spatial neighborhood effects, our study integrated selection probabilities to choose the cells for crossover [20]. Specifically, first, the core locations requiring crossover operations are determined based on selection probabilities, and then the crossover operations are executed.
Step 4: Mutation
In order to mitigate land fragmentation and enhance land compactness, we employed a mutation operator based on neighborhood land types [21], considering selection probabilities and transformation probabilities. Specifically, the core cell for mutation is determined based on selection probabilities, following which the mutation operator is applied to ascertain the mutation attributes of the core cell. If the mutation attributes align with the original attributes of the core cell, determine whether the cell should undergo renovation or reconstruction based on transformation probabilities. If they are different, the cell undergoes reconstruction. During crossover and mutation operations, if an optimized solution violates optimization constraints, it will be returned to the candidate set for subsequent reselection.

3. Results

3.1. Cost Evaluation of Urban Land Use Optimization

We obtained seven indicators to evaluate the renovation and reconstruction costs of Shenzhen. The visualization of these indicators is shown in Figure 3. It can be observed that there are significant differences in the spatial distribution of various evaluation indicators. In the southwestern region of Shenzhen, the terrain is flat, with a large population and high plot ratio, resulting in high land prices. Conversely, in the southwestern region, the terrain is undulating and the land price is relatively low. In the northwest region, there is high building density, with some areas having a high plot ratio, and the terrain is relatively flat.
To ensure the objectivity and rationality of the indicator weights, this study extensively reviewed the literature [42,43,44,45,46] and relevant policies to establish a set of weights. These weights, combined with those obtained using the Entropy Weight Method (EWM), were used to derive the indicator weights (Table 4) for evaluating the renovation and reconstruction costs according to Equations (1) and (2).
From the cost maps (Figure 4), it can be observed that there are spatial variations in the cost indices of reconstruction and renovation. Reconstruction costs are relatively higher in the southern and southwestern regions of Shenzhen, while they are generally lower in the northeastern region. Conversely, renovation costs are higher in the central region of Shenzhen, while they exhibit an opposite trend compared to reconstruction costs in the southern and southwestern regions.
One reason for this outcome could be attributed to the fact that the southern region of Shenzhen encompasses the Futian and Luohu districts, both of which are core commercial areas with abundant commercial buildings and residential complexes, often commanding higher land prices due to dense construction and population. Consequently, reconstruction projects in these areas require significant manpower and financial resources for demolishing old structures and resettling residents, resulting in higher costs. In contrast, the northeastern region has more industrial land, typically smaller in scale, with some old industrial areas possibly featuring vacant or aging buildings and simpler structures, leading to lower reconstruction costs. Furthermore, the lower population density in the northeastern region compared to the central commercial area is also one of the reasons for the relatively lower reconstruction costs. The relatively lower renovation costs in the southern and southwestern regions may be attributed to the fact that renovation does not entail considerations for personnel resettlement and land price levels, thus saving costs. However, land renovation entails additional costs from building refurbishments, which typically require significant manpower and material inputs. Therefore, renovation costs are relatively higher in the central areas of Shenzhen with higher building densities.

3.2. Objective and Constraints

When calculating the economic objectives, this study determined the economic value of land based on the cost evaluation of different types and states of urban land, resulting in different economic values for land with different types and statuses. Then, we calculated the growth rate of the economic value of land under different cost tiers [10], as shown in Table 5 and Table 6.
We have established three types of constraints: minimum optimization area constraints, topographical constraints, and functional protection constraints. The specific settings are shown in Table 7. A r e a f represents the quantity of land optimized for type f; M i n A r e a f refers to the minimum redevelopment area required for different types of urban land, as specified in the 14th Five-Year Plan for Urban Renewal and Land Preparation in Shenzhen, where X i is a binary variable indicating whether the land cell i is involved in the optimization process. Referring to the “Urban Vertical Planning Specification (CJJ 83-99) [56]”, the setting of topographical constraint specifies that urban cells with slopes greater than 10° cannot be converted into urban construction land [50]. Based on government public documents such as the “Guidelines for Planning and Land Policies Supporting Urban Renewal” and relevant references, we set functional protection constraints to ensure that urban conservation areas and transportation land are not included in the optimization process. In Table 7, l i m i t _ l a n d denotes the constraints related to transportation and historical reserve.

3.3. Cost-Heuristic Urban Land Use Optimization

The parameters used in the CHGA are as follows: the number of iterations is set to 500, the crossover probability is 0.6, the mutation probability is 0.1, and the population size is 100. We selected these parameters based on considerations of the iteration status of the optimization algorithm and the level of detail in the land use data. The resolution of the land use data is 50 m, with a grid quantity of 1784 × 922. Therefore, processing the data requires high computational performance. The runtime is approximately 7 h, which demonstrates higher operational efficiency compared to other algorithms.
Figure 5 illustrates the convergence of the normalized average objective (fitness) change. It is observed that the fitness value of the objectives changes rapidly in the initial iterations but stabilizes by the 500th iteration. This phenomenon indicates that our model exhibits high search efficiency and convergence performance, enabling it to converge rapidly to the optimal solution within a limited number of iterations.

3.3.1. Ablation Experiment

To accurately assess the reliability and effectiveness of the proposed method, we conducted an ablation experiment, contrasting our proposed CHGA with other genetic algorithms. The experimental results encompass three algorithms: First, the traditional NSGA-II algorithm is employed, without considering two optimization directions and implementation cost [21]. Second, urban land use multi-objective optimization is conducted without cost guidance, i.e., randomly selecting cells for renovating and reconstructing (NSGA-II_R). Third, the CHGA algorithm proposed in this paper is utilized. By comparing the optimal solutions obtained by these three algorithms, we can more clearly evaluate the performance of the CHGA algorithm in urban land use optimization. Figure 6 illustrates the Pareto front for the three algorithms.
In Figure 6, the numbers of non-dominated solutions obtained by CHGA, NSGA-II_R, and NSGA-II are 44, 43, and 30, respectively. This indicates that the proposed algorithm in this paper can provide more options, thereby increasing decision-making flexibility. It can be observed that the solutions obtained by our method have the lowest cost, while the solutions obtained by the NSGA-II method have the highest cost objective. This demonstrates that the renovation operations and cost guidance significantly contribute to cost reduction. Furthermore, the results show that the optimal achievement of cost and economic objectives is not mutually exclusive, meaning that it is possible to achieve both cost minimization and maximum economic benefit simultaneously, thus confirming the effectiveness of our algorithm.
Table 8 lists the objective values of the optimal solutions obtained by the comparative algorithms. Comparing the NSGA-II and NSGA-II_R algorithms, NSGA-II_R exhibits slightly lower economic benefits than NSGA-II, but in terms of cost, NSGA-II_R saves approximately 24.52% compared to NSGA-II. This suggests that considering land renovation has a significant impact on urban land use optimization costs. Contrasting CHGA with NSGA-II_R, although CHGA with cost guidance did not effectively enhance economic objectives, it further saved costs by 9.11%. The results indicate that incorporating cost guidance in optimization can significantly reduce consumption costs while sacrificing a small amount of economic benefits.
In summary, although CHGA’s economic objectives lag slightly behind NSGA-II by 1.18%, the model demonstrates a significant advantage in cost objectives, resulting in a considerable reduction in consumption costs. Thus, the method proposed in this paper fully leverages the benefits of cost guidance, implementing different optimization directions for land use in a comprehensive consideration of economic and cost objectives, thereby achieving a more reasonable and effective land use optimization.
In Figure 7, it is evident that the spatial distribution of reconstructed and renovated cells in CHGA aligns with areas of comparatively lower cost evaluation, as indicated in the corresponding cost assessment graph. However, in NSGA-II and NSGA-II_R, some higher-cost locations are also seen to undergo renovation or reconstruction. This indicates that the CHGA can reduce overall costs by properly allocating reconstruction and renovation cells. In contrast, NSGA-II_R and NSGA-II fail to fully consider the cost disparities among cells, resulting in a uniform distribution of optimized patches in urban space. Therefore, the optimization results obtained by the CHGA exhibit more economic and rational spatial distribution.

3.3.2. Optimized Land Quantity and Spatial Distribution

Combining the proportion of renovation and reconstruction for different land types (Figure 8) with the distribution map of urban land transformation (Figure 9), we can clearly observe that in residential, commercial, and service land categories, the proportion of renovated land exceeds that of reconstructed land. However, in the industrial land category, the area designated for reconstruction accounts for approximately 60% of all industrial land area designated for optimization, significantly larger than the area designated for renovation. The result indicates that industrial land primarily consists of areas where reconstruction costs are relatively lower. This is because industrial areas typically have lower population densities and relatively weaker building structures, resulting in lower reconstruction costs compared to renovation costs for the same cell of land. Therefore, in urban planning processes aimed at achieving a relative balance between cost and economic objectives, optimization measures for industrial land should focus more on reconstruction rather than renovation.

3.3.3. The Relationship between Cost and Economics during the Optimization Process

To analyze the spatial distribution of land use, renovation, and reconstruction under different scenarios, and to uncover information that cannot be obtained by non-cost heuristic algorithms, thereby confirming the importance and necessity of considering both cost and economic factors in the urban land use optimization process, we selected three scenarios from the Pareto front, including MaxEco (maximization of economic objectives), MinCost (minimization of costs), and Eco_Cost (sustainable development scenario: maximization of economic objectives while minimizing costs), for further analysis. The economic and cost objectives under different scenarios indicate the non-linear relationship between cost and benefits (see Figure 10).
To explain the non-linear relationship, we visualized the land use optimization maps under different scenarios (Figure 11), which makes it evident that there are significant differences in the quantities of renovations and reconstructions under different scenarios compared to the CHGA. In the land use map of the MaxEco scenario (see Figure 11b), we found that land in the southern region of Shenzhen, where reconstruction costs are high, is being transformed into service land. This may contribute to the higher costs incurred in the MaxEco scenario. Interestingly, although significant costs are incurred in optimizing the construction in the high-cost western region, substantial economic benefits are obtained. This indicates the potential for land use optimization in the western region of Shenzhen, suggesting more development opportunities and economic growth space. Therefore, although land use optimization in certain areas may entail high costs, it is essential to consider their economic development potential. In the land use map of the MinCost scenario (see Figure 11c), large areas of land in the western region are used for industrial land reconstruction. This indicates that the reconstruction of industrial land can effectively save costs, which corroborates the conclusion in Section 3.3.2.
Through comparative analysis between the optimal solution and the land use optimization schemes obtained under different scenarios, as well as those from the traditional NSGA-II, we found that achieving a balance between cost and economic benefits is crucial for obtaining the optimal solution in the optimization process. This requires comprehensive consideration of factors such as costs, economic development potential, and the ratio of renovation to reconstruction for different land types. Our approach guides the transformation of land use types based on their costs and iteratively leads to the optimal solution for urban land use. We also delineated two optimization algorithms, renovation and reconstruction, providing rational and effective guidance for practical urban renewal and planning. Compared to the traditional NSGA-II, our model more reasonably allocates land use types and, through cost guidance, enables optimization solutions to achieve significant returns while reducing the overall optimization costs. This integrated approach considering both costs and economic benefits enhances the practicality and operability of our model, enabling it to better address various challenges and demands in urban development.

4. Discussion

As urban land use in China gradually enters the stage of stock optimization, urban planning decision-makers increasingly prioritize the upgrading and renovation of existing land use types over re-planning to change current land use types [31]. They strive to meet the demands of urban economic development with minimal implementation costs. However, the past land use optimization models often relied on random land cell selection and land type conversion, overlooking the implementation costs arising from differences in land conditions such as land prices and population density during the urban land use optimization process. To address the above-mentioned issues, this paper proposes a cost-heuristic genetic algorithm (CHGA)-based urban land use optimization model.
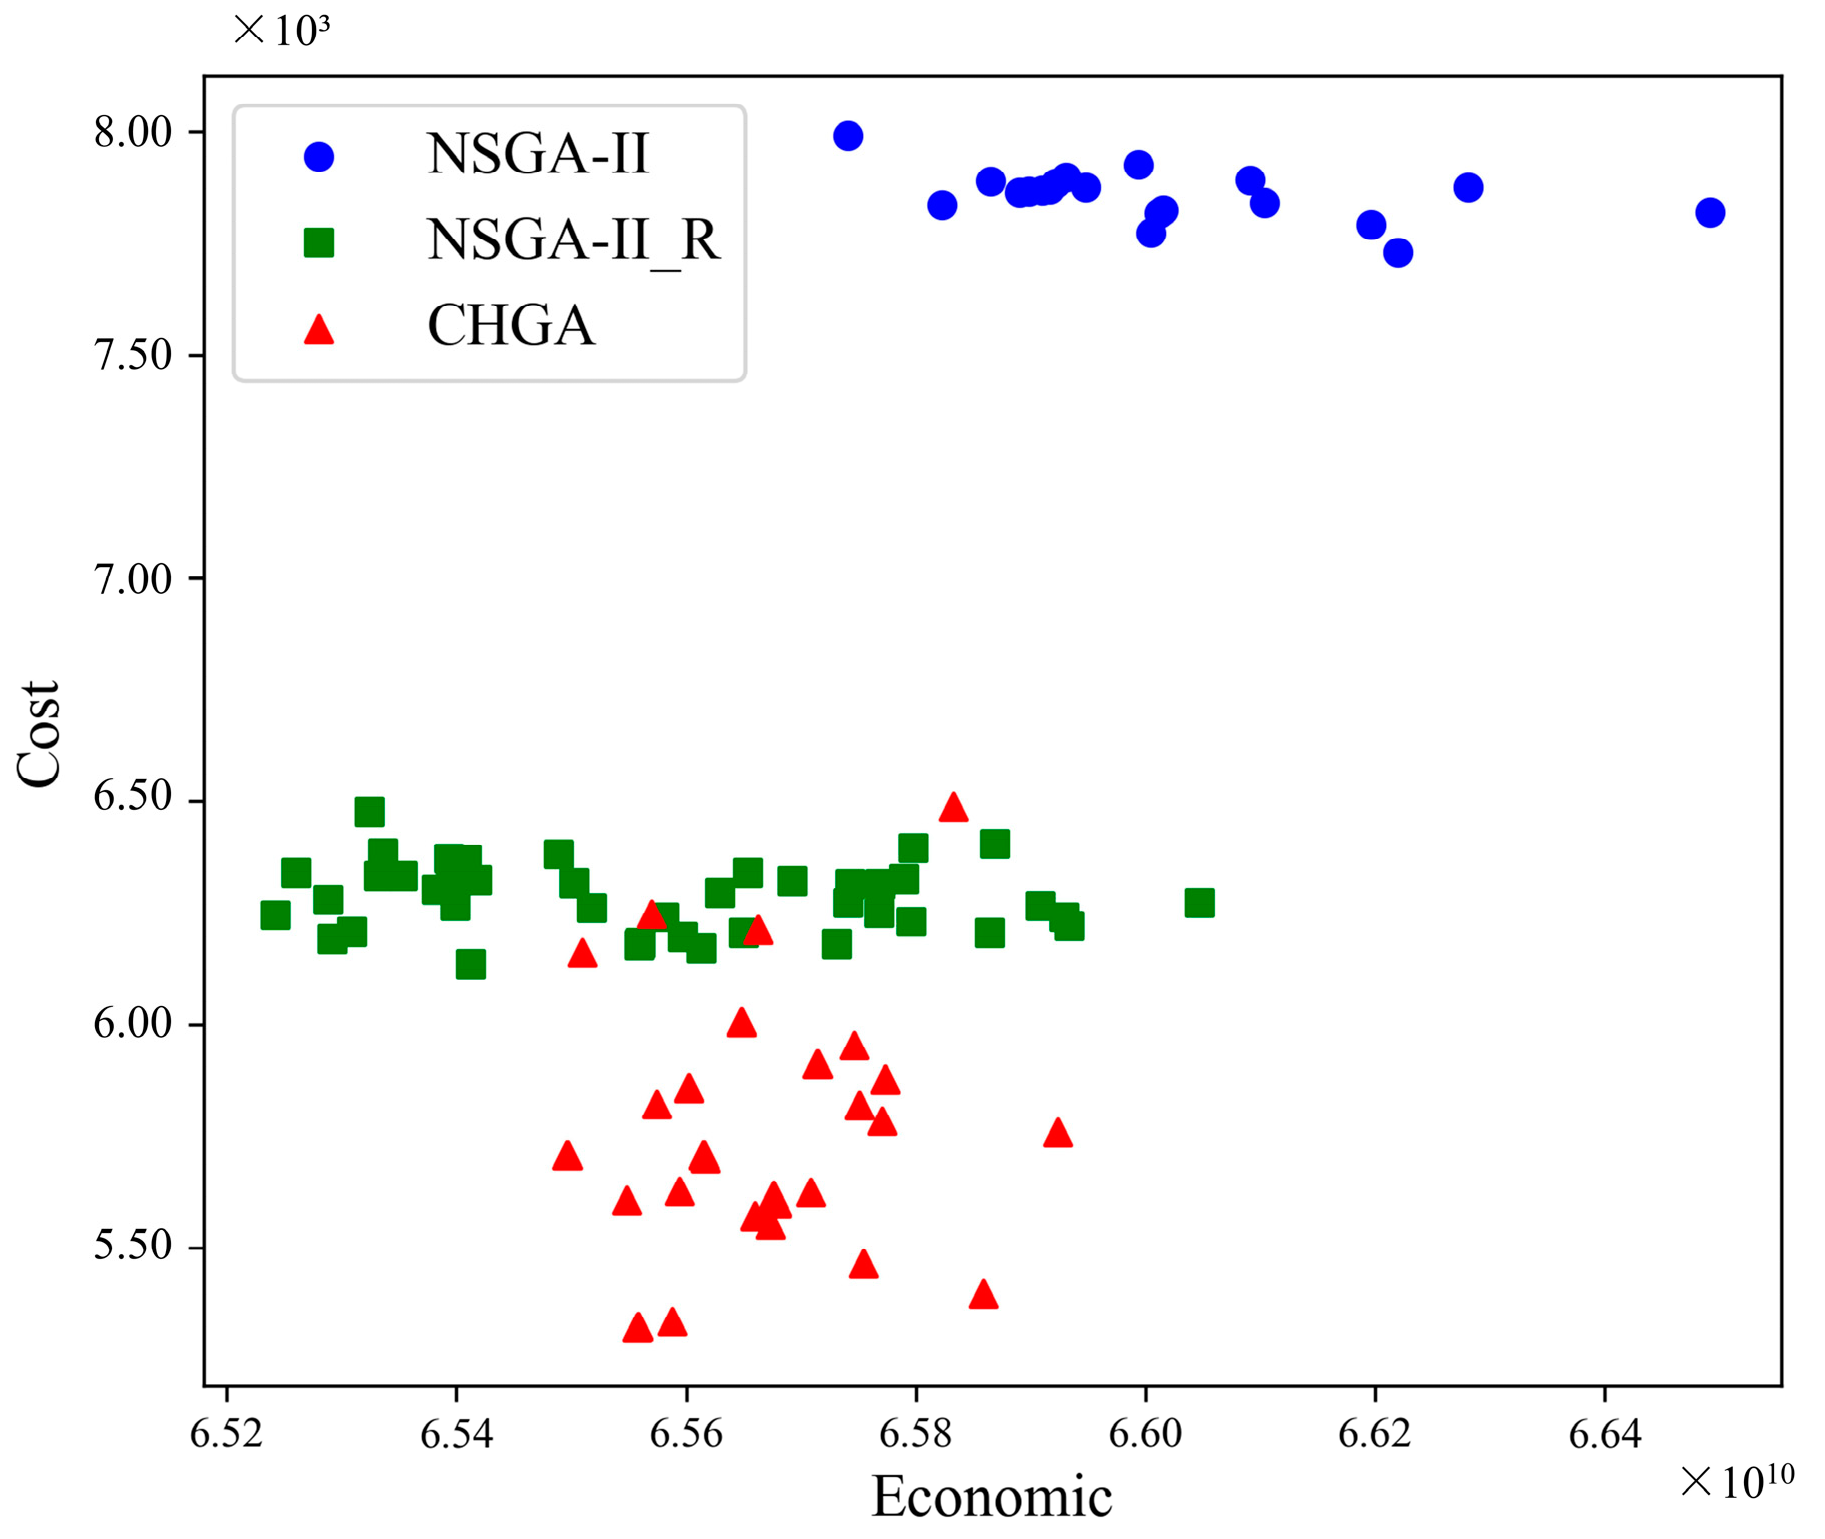
The CHGA algorithm calculates the selection probability of different urban land units based on reconstruction and renovation costs to optimize the selection of the best units. Additionally, guided by these costs, the algorithm determines the probabilities for renovation and reconstruction directions, allowing the urban land use optimization algorithm to fully consider the diversity and complexity of urban land use. This approach results in a more comprehensive and effective urban land use optimization plan. To validate the effectiveness of the algorithm, we conducted an ablation experiment with Shenzhen as the study area. The results show that compared to NSGA-II and NSGA-II_R, our algorithm reduces implementation costs by 35.86% and 9.11%, respectively. This confirms that our algorithm, guided by costs, determines the optimization directions for renovation and reconstruction, thereby effectively reducing the costs of the optimization process and achieving a more reasonable and sustainable optimization plan.
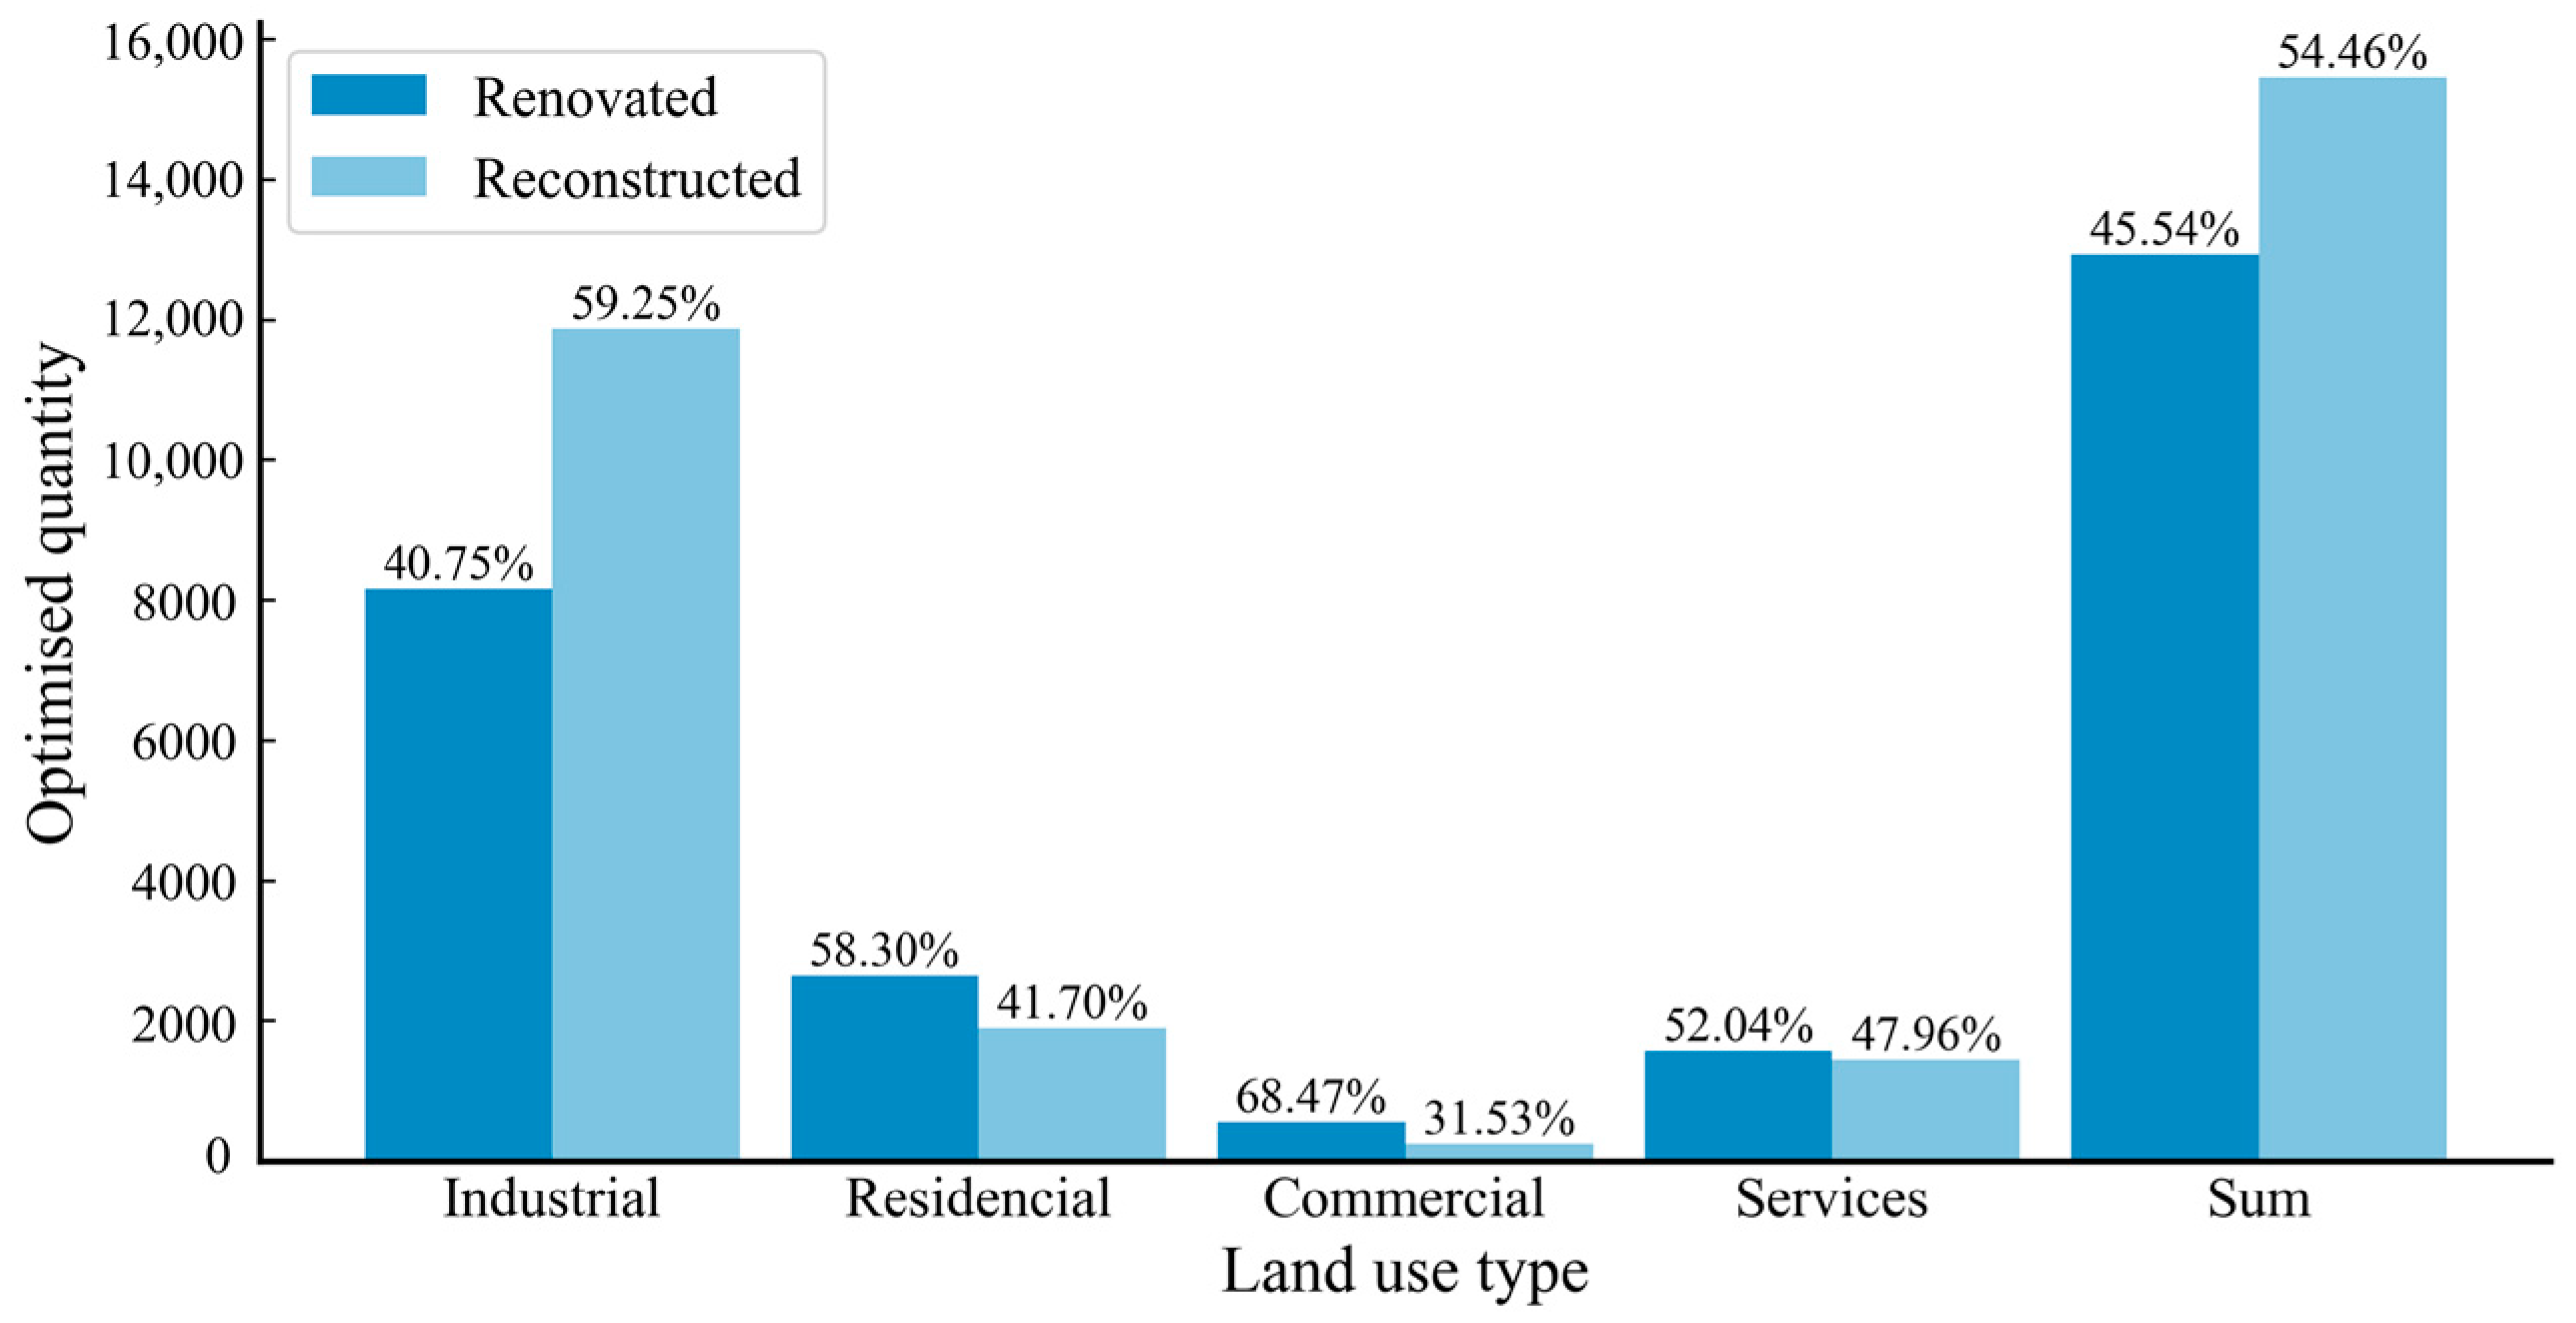
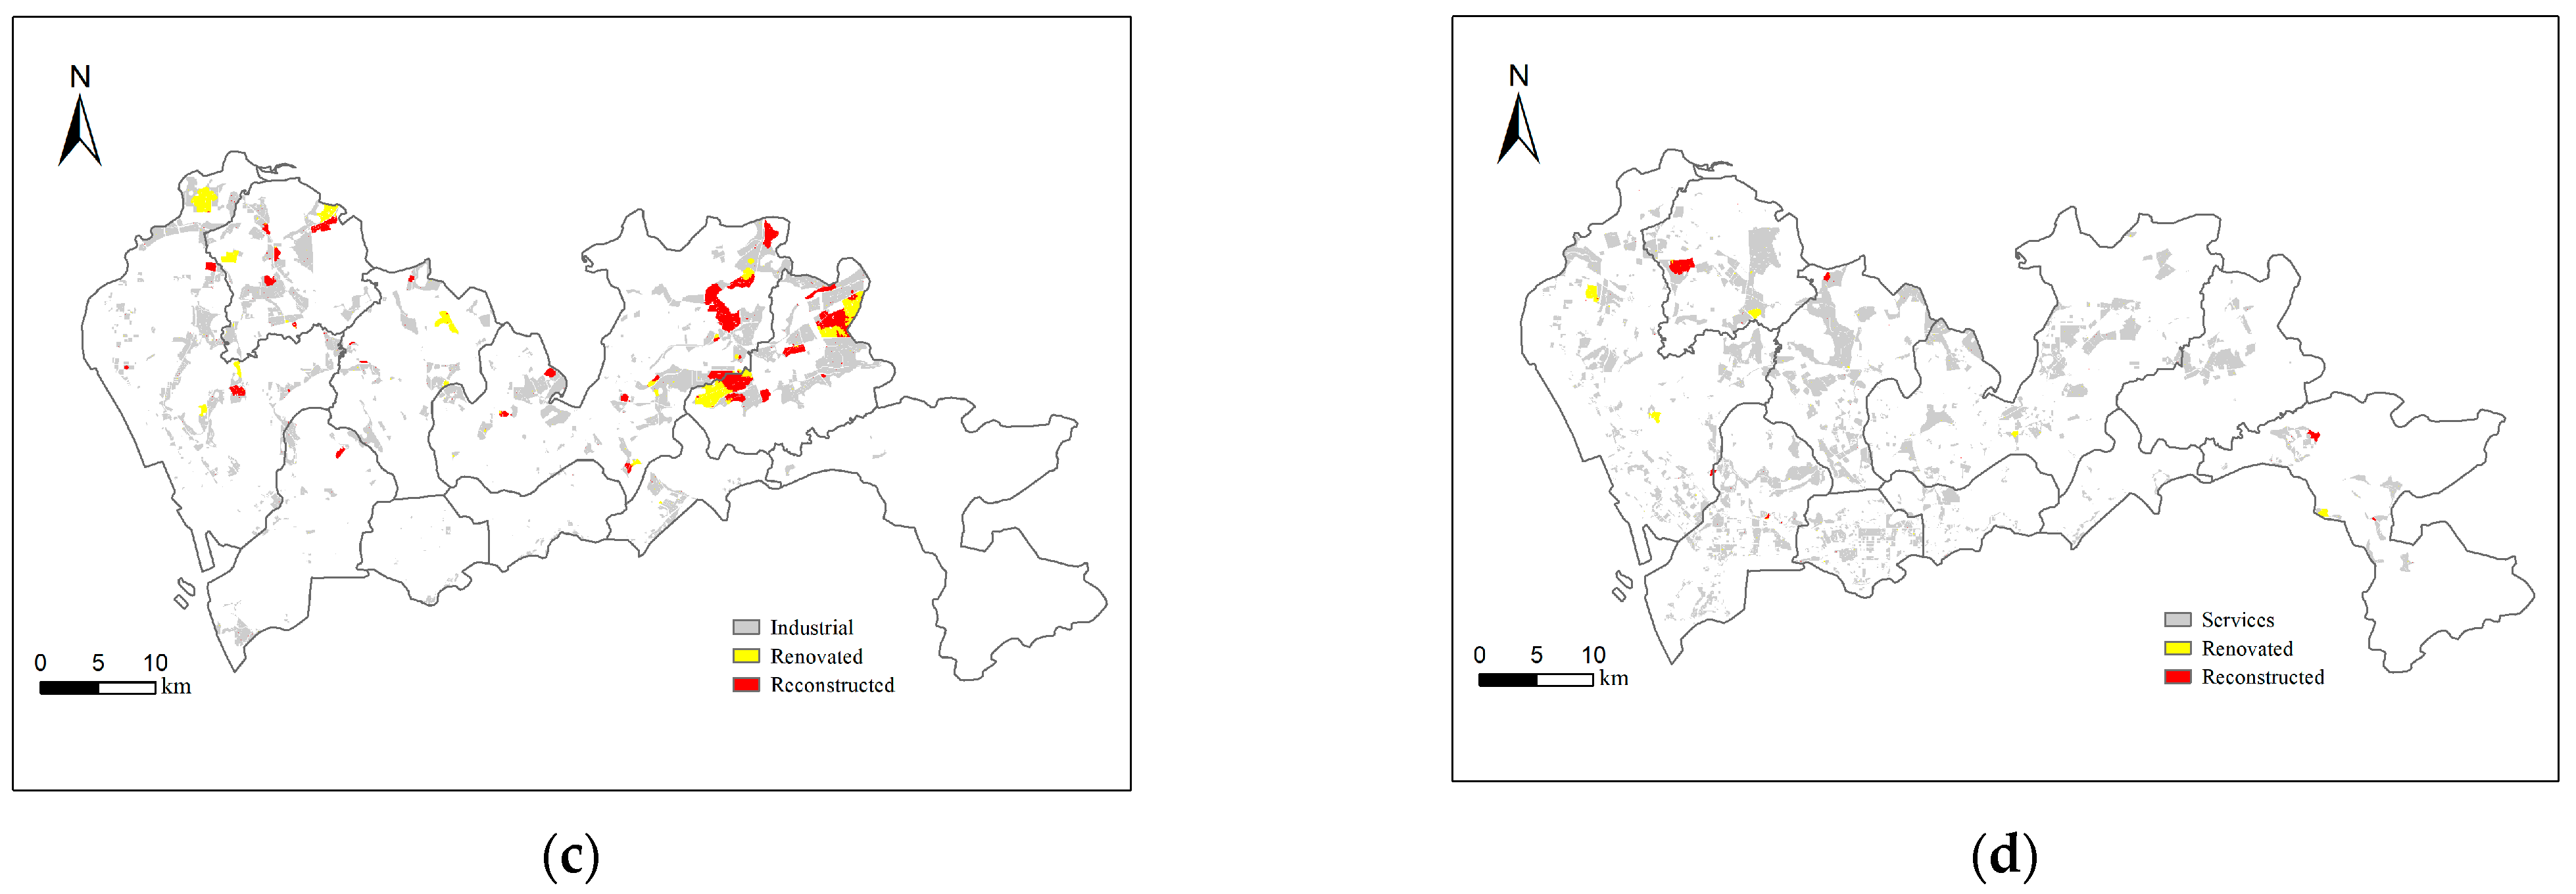
This study introduces renovation into the optimization process, offering a new perspective that allows the optimization to more comprehensively and realistically simulate urban renewal processes. By analyzing the optimal land use structure in Shenzhen, we found that the area allocated for renovation exceeded that for reconstruction. Additionally, for different urban land use types, we discovered that the area of industrial land reconstruction accounted for about 60% of the total optimized industrial land area, significantly more than the area for renovation. This result aligns with the requirements of Shenzhen’s urban renewal and land consolidation plan for industrial land. Therefore, incorporating renovation into the urban land optimization process is necessary for obtaining informative solutions that meet urban renewal needs.
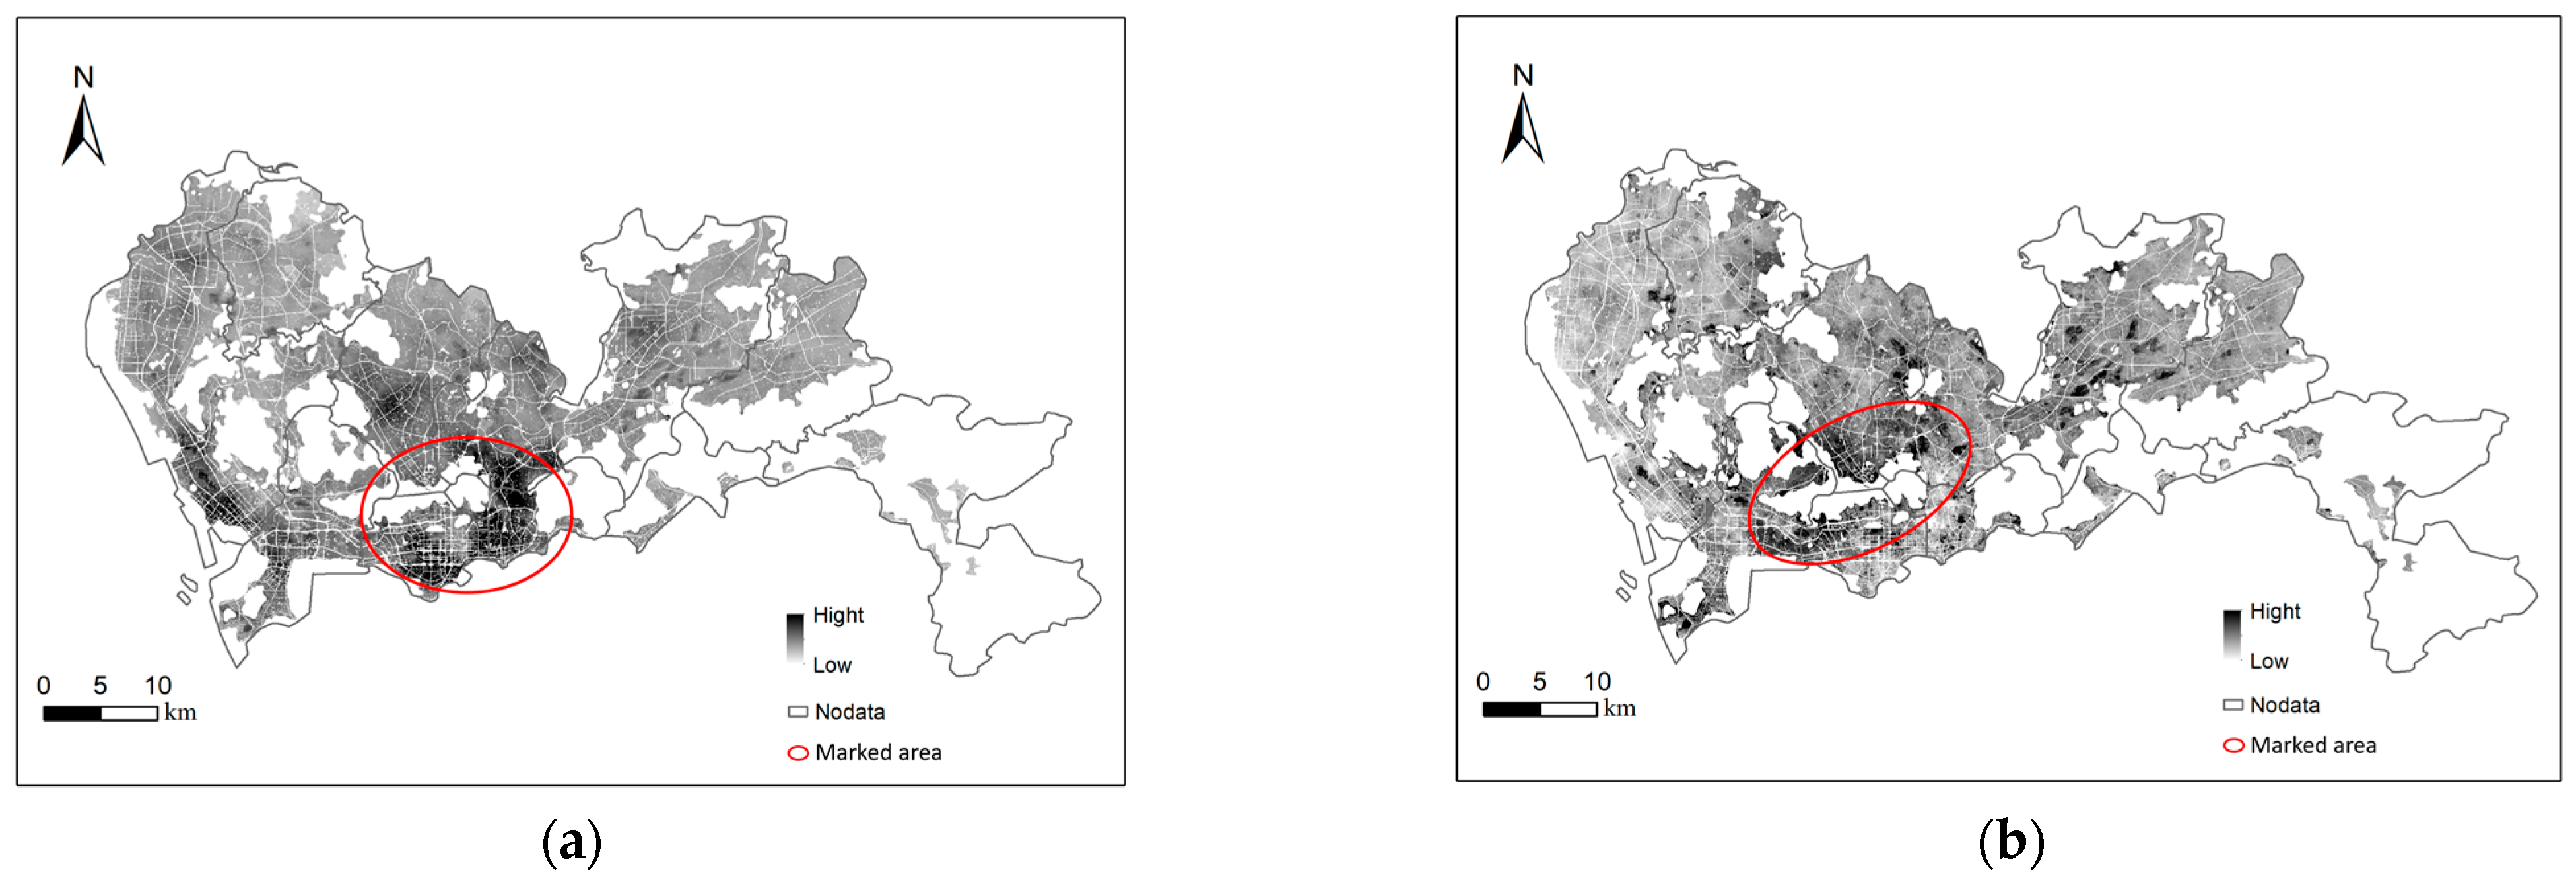
To further validate the importance of considering costs and renovation in urban land use optimization, we examined scenarios focused on maximizing economic benefits, minimizing costs, and promoting sustainable development. The results indicate that optimizing land use in high-cost areas, while leading to increased costs, can also yield substantial economic benefits. This demonstrates that despite the potentially high costs of land use optimization in certain areas, considering their economic development potential is crucial.

5. Conclusions

As an important means to address the shortage of construction land, urban land use optimization plays a significant role in alleviating land scarcity and improving land use efficiency. This paper proposes a cost-heuristic genetic algorithm (CHGA) that considers implementation costs and urban renovation, providing a more comprehensive and practical method for simulating urban planning scenarios. Empirical research on Shenzhen’s urban land use optimization shows that the proposed method can reduce optimization costs by 35.86% and display the spatial distribution of both reconstruction and renovation optimization strategies. This confirms that the algorithm can effectively reduce optimization costs and make the optimized plans more aligned with the actual development needs of the city. The CHGA algorithm designed in this study approaches the optimization of urban land use from a more comprehensive perspective. It not only focuses on changes in land function but also emphasizes land reuse and implementation costs, aiming to achieve the sustainable use and development of urban land. The renovation strategy proposed in this study provides a new perspective for future land use optimization research. This perspective helps researchers explore the diversity and complexity of urban land use, offering insights for addressing future urban land use challenges and meeting various urban development needs.
However, in practical applications, further improvements can be made in this study. Firstly, with the continuous advancement of ecological civilization construction, urban planners may shift their focus from pursuing short-term economic benefits to considering long-term ecosystem development in the future. Ecological construction will become a key focus of future urban planning. Therefore, we will consider incorporating the ecological environment into the optimization objectives in future research to achieve sustainable urban development. Secondly, considering the heterogeneity of urban development in different cities, this study will explore urban land use optimization for different types of cities in the future. Through comparative analysis across cities, a better understanding of the commonalities and differences in urban planning and land use can be achieved, providing more personalized optimization solutions for the development of different cities.

Author Contributions

Yufan Deng was responsible for methodology, implementation, testing, analysis, and writing; Zhongan Tang was responsible for writing—review and editing; Baoju Liu contributed to determining method details, reviewing, and editing; Min Deng contributed to reviewing; Yan Shi was responsible for editing; Enbo Liu was responsible for visualization and writing. All authors have read and agreed to the published version of the manuscript.

Funding

This research was funded by the National Key R&D Program of China (2023YFB3906804), the National Natural Science Foundation of China (42101471), the Scientific Research Fund of Hunan Provincial Education Department (23B0013), the Open Topic of Hunan Geospatial Information Engineering and Technology Research Center (HNGIET2023001), the Hunan Province Natural Resources Science and Technology Project (20230121XX), and the Central South University Innovation-Driven Research Programme under Grant (2023ZZTS0482).

Institutional Review Board Statement

Not applicable.

Informed Consent Statement

Not applicable.

Data Availability Statement

The main data used in this paper are the 2018 urban functional zoning, which can be downloaded from http://data.ess.tsinghua.edu.cn/, accessed on 16 January 2023.

Acknowledgments

This work was conducted in part using computing resources at the High-Performance Computing Platform of Central South University.

Conflicts of Interest

The authors declare no conflicts of interest.

References

  1. Bibri, S.E.; Krogstie, J.; Kärrholm, M. Compact City Planning and Development: Emerging Practices and Strategies for Achieving the Goals of Sustainability. Dev. Built Environ. 2020, 4, 100021. [Google Scholar] [CrossRef]
  2. Jin, R.; Huang, C.; Wang, P.; Ma, J.; Wan, Y. Identification of Inefficient Urban Land for Urban Regeneration Considering Land Use Differentiation. Land 2023, 12, 1957. [Google Scholar] [CrossRef]
  3. Siedentop, S.; Fina, S. Urban Sprawl beyond Growth: The Effect of Demographic Change on Infrastructure Costs. Flux 2010, 79–80, 90–100. [Google Scholar] [CrossRef]
  4. Su, Q.; Jiang, X. Evaluate the Economic and Environmental Efficiency of Land Use from the Perspective of Decision-Makers’ Subjective Preferences. Ecol. Indic. 2021, 129, 107984. [Google Scholar] [CrossRef]
  5. Song, R.; Hu, Y.; Li, M. Chinese Pattern of Urban Development Quality Assessment: A Perspective Based on National Territory Spatial Planning Initiatives. Land 2021, 10, 773. [Google Scholar] [CrossRef]
  6. Gao, J.; Chen, W.; Liu, Y. Spatial Restructuring and the Logic of Industrial Land Redevelopment in Urban China: II. A Case Study of the Redevelopment of a Local State-Owned Enterprise in Nanjing. Land Use Policy 2018, 72, 372–380. [Google Scholar] [CrossRef]
  7. Ma, S.; Wen, Z. Optimization of Land Use Structure to Balance Economic Benefits and Ecosystem Services under Uncertainties: A Case Study in Wuhan, China. J. Clean. Prod. 2021, 311, 127537. [Google Scholar] [CrossRef]
  8. Yu, X.; Shan, L.; Wu, Y. Land Use Optimization in a Resource-Exhausted City Based on Simulation of the FEW Nexus. Land 2021, 10, 1013. [Google Scholar] [CrossRef]
  9. Rahman, M.M.; Szabó, G. Multi-Objective Urban Land Use Optimization Using Spatial Data: A Systematic Review. Sustain. Cities Soc. 2021, 74, 103214. [Google Scholar] [CrossRef]
  10. Pan, T.; Su, F.; Yan, F.; Lyne, V.; Wang, Z.; Xu, L. Optimization of Multi-Objective Multi-Functional Landuse Zoning Using a Vector-Based Genetic Algorithm. Cities 2023, 137, 104256. [Google Scholar] [CrossRef]
  11. Castella, J.-C.; Kam, S.P.; Quang, D.D.; Verburg, P.H.; Hoanh, C.T. Combining Top-down and Bottom-up Modelling Approaches of Land Use/Cover Change to Support Public Policies: Application to Sustainable Management of Natural Resources in Northern Vietnam. Land Use Policy 2007, 24, 531–545. [Google Scholar] [CrossRef]
  12. Huang, Z.; Du, H.; Li, X.; Zhang, M.; Mao, F.; Zhu, D.; He, S.; Liu, H. Spatiotemporal LUCC Simulation under Different RCP Scenarios Based on the BPNN_CA_Markov Model: A Case Study of Bamboo Forest in Anji County. ISPRS Int. J. Geo-Inf. 2020, 9, 718. [Google Scholar] [CrossRef]
  13. Huang, Q.; Song, W. A Land-Use Spatial Optimum Allocation Model Coupling a Multi-Agent System with the Shuffled Frog Leaping Algorithm. Comput. Environ. Urban 2019, 77, 101360. [Google Scholar] [CrossRef]
  14. Hasti, F.; Salmanmahiny, A.; Rouhi, H.; Sakieh, Y.; Joolaei, R.; Pezhooli, N. Developing an Integrated Land Allocation Model Based on Linear Programming and Game Theory. Environ. Monit. Assess. 2023, 195, 493. [Google Scholar] [CrossRef] [PubMed]
  15. Gao, C.; Feng, Y.; Tong, X.; Jin, Y.; Liu, S.; Wu, P.; Ye, Z.; Gu, C. Modeling Urban Encroachment on Ecological Land Using Cellular Automata and Cross-Entropy Optimization Rules. Sci. Total Environ. 2020, 744, 140996. [Google Scholar] [CrossRef]
  16. Wu, C.; Chen, B.; Huang, X.; Wei, Y.D. Effect of Land-Use Change and Optimization on the Ecosystem Service Values of Jiangsu Province, China. Ecol. Indic. 2020, 117, 106507. [Google Scholar] [CrossRef]
  17. Aerts, J.C.J.H.; Eisinger, E.; Heuvelink, G.B.M.; Stewart, T.J. Using Linear Integer Programming for Multi-Site Land-Use Allocation. Geogr. Anal. 2003, 35, 148–169. [Google Scholar]
  18. Li, F.; Gong, Y.; Cai, L.; Sun, C.; Chen, Y.; Liu, Y.; Jiang, P. Sustainable Land-Use Allocation: A Multiobjective Particle Swarm Optimization Model and Application in Changzhou, China. J. Urban Plan Dev. 2018, 144, 04018010. [Google Scholar] [CrossRef]
  19. Liu, X.; Li, X.; Shi, X.; Huang, K.; Liu, Y. A Multi-Type Ant Colony Optimization (MACO) Method for Optimal Land Use Allocation in Large Areas. Int. J. Geogr. Inf. Sci. 2012, 26, 1325–1343. [Google Scholar] [CrossRef]
  20. Pan, T.; Zhang, Y.; Su, F.; Lyne, V.; Cheng, F.; Xiao, H. Practical Efficient Regional Land-Use Planning Using Constrained Multi-Objective Genetic Algorithm Optimization. ISPRS Int. J. Geo-Inf. 2021, 10, 100. [Google Scholar] [CrossRef]
  21. Li, X.; Parrott, L. An Improved Genetic Algorithm for Spatial Optimization of Multi-Objective and Multi-Site Land Use Allocation. Comput. Environ. Urban Syst. 2016, 59, 184–194. [Google Scholar] [CrossRef]
  22. Wang, Y.; Fan, Y.; Yang, Z. Challenges, Experience, and Prospects of Urban Renewal in High-Density Cities: A Review for Hong Kong. Land 2022, 11, 2248. [Google Scholar] [CrossRef]
  23. Sahebgharani, A. Multi-objective land use optimization through parallel particle swarm algorithm: Case study baboldasht district of Isfahan, Iran. J. Urban Environ. Eng. 2016, 10, 42–49. [Google Scholar] [CrossRef]
  24. Porta, J.; Parapar, J.; Doallo, R.; Rivera, F.F.; Santé, I.; Crecente, R. High performance genetic algorithm for land use planning. Comput. Environ. Urban Syst. 2013, 37, 45–58. [Google Scholar] [CrossRef]
  25. Mohammadi, M.; Nastaran, M.; Sahebgharani, A. Development, application, and comparison of hybrid meta-heuristics for urban land-use allocation optimization: Tabu search, genetic, GRASP, and simulated annealing algorithms. Comput. Environ. Urban Syst. 2016, 60, 23–36. [Google Scholar] [CrossRef]
  26. Liu, X.; Ou, J.; Li, X.; Ai, B. Combining system dynamics and hybrid particle swarm optimization for land use allocation. Ecol. Model. 2013, 257, 11–24. [Google Scholar] [CrossRef]
  27. Stewart, T.J.; Janssen, R.; Van Herwijnen, M. A Genetic Algorithm Approach to Multiobjective Land Use Planning. Comput. Oper. Res. 2004, 31, 2293–2313. [Google Scholar] [CrossRef]
  28. Gao, P.; Wang, H.; Cushman, S.A.; Cheng, C.; Song, C.; Ye, S. Sustainable Land-Use Optimization Using NSGA-II: Theoretical and Experimental Comparisons of Improved Algorithms. Landsc. Ecol. 2021, 36, 1877–1892. [Google Scholar] [CrossRef]
  29. Shaygan, M.; Alimohammadi, A.; Mansourian, A.; Govara, Z.S.; Kalami, S.M. Spatial Multi-Objective Optimization Approach for Land Use Allocation Using NSGA-II. IEEE J.-Stars 2013, 7, 906–916. [Google Scholar] [CrossRef]
  30. Ma, X.; Zhao, X. Land Use Allocation Based on a Multi-Objective Artificial Immune Optimization Model: An Application in Anlu County, China. Sustainability 2015, 7, 15632–15651. [Google Scholar] [CrossRef]
  31. Ministry of Housing and Urban-Rural Development. Notice on Preventing Large-Scale Demolition and Construction in Urban Renewal Actions; Ministry of Housing and Urban-Rural Development: Beijing, China, 2021.
  32. Chen, Y.; Liu, G.; Zhuang, T. Evaluating the Comprehensive Benefit of Urban Renewal Projects on the Area Scale: An Integrated Method. Int. J. Environ. Res. Public Health 2022, 20, 606. [Google Scholar] [CrossRef] [PubMed]
  33. Shenzhen Municipal Bureau of Statistics. Statistical Bulletin on National Economic and Social Development of Shenzhen in 2022. Available online: https://www.sz.gov.cn/cn/xxgk/zfxxgj/tjsj/tjgb/content/post_10578003.html (accessed on 8 February 2024).
  34. Meng, L.; Sun, Y.; Zhao, S. Comparing the spatial and temporal dynamics of urban expansion in Guangzhou and Shenzhen from 1975 to 2015: A case study of pioneer cities in China’s rapid urbanization. Land Use Policy 2020, 97, 104753. [Google Scholar] [CrossRef]
  35. Della Torre, S.; Cattaneo, S.; Lenzi, C.; Zanelli, A. Regeneration of the Built Environment from a Circular Economy Perspective; Springer Nature: Berlin/Heidelberg, Germany, 2020. [Google Scholar]
  36. Lai, Y.; Tang, B.; Chen, X.; Zheng, X. Spatial determinants of land redevelopment in the urban renewal processes in Shenzhen, China. Land Use Policy 2021, 103, 105330. [Google Scholar] [CrossRef]
  37. Gong, P.; Chen, B.; Li, X.; Liu, H.; Wang, J.; Bai, Y.; Chen, J.; Chen, X.; Fang, L.; Feng, S.; et al. Mapping essential urban land use categories in China (EULUC-China): Preliminary results for 2018. Sci. Bull. 2020, 65, 182–187. [Google Scholar] [CrossRef] [PubMed]
  38. Qian, J.; Peng, Y.; Luo, C.; Wu, C.; Du, Q. Urban land expansion and sustainable land use policy in Shenzhen: A case study of China’s rapid urbanization. Sustainability 2015, 8, 16. [Google Scholar] [CrossRef]
  39. Su, M.; Guo, R.; Chen, B.; Hong, W.; Wang, J.; Feng, Y.; Xu, B. Sampling strategy for detailed urban land use classification: A systematic analysis in Shenzhen. Remote Sens. 2020, 12, 1497. [Google Scholar] [CrossRef]
  40. Liu, Y.; Xia, C.; Ou, X.; Lv, Y.; Ai, X.; Pan, R.; Zhang, Y.; Shi, M.; Zheng, X. Quantitative structure and spatial pattern optimization of urban green space from the perspective of carbon balance: A case study in Beijing, China. Ecol. Indic. 2023, 148, 110034. [Google Scholar] [CrossRef]
  41. Cao, K.; Huang, B.; Wang, S.; Lin, H. Sustainable land use optimization using Boundary-based Fast Genetic Algorithm. Comput. Environ. Urban Syst. 2012, 36, 257–269. [Google Scholar] [CrossRef]
  42. Canesi, R.; Marella, G. Urban Density and Land Leverage: Market Value Breakdown for Energy-Efficient Assets. Buildings 2023, 14, 45. [Google Scholar] [CrossRef]
  43. Liu, W.; Yang, J.; Gong, Y.; Cheng, Q. An Evaluation of Urban Renewal Based on Inclusive Development Theory: The Case of Wuhan, China. ISPRS Int. J. Geo-Inf. 2022, 11, 563. [Google Scholar] [CrossRef]
  44. Liu, G.; Yi, Z.; Zhang, X.; Shrestha, A.; Martek, I.; Wei, L. An evaluation of urban renewal policies of Shenzhen, China. Sustainability 2017, 9, 1001. [Google Scholar] [CrossRef]
  45. Bae, W.; Kim, U.; Lee, J. Evaluation of the Criteria for Designating Maintenance Districts in Low-Rise Residential Areas: Urban Renewal Projects in Seoul. Sustainability 2019, 11, 5876. [Google Scholar] [CrossRef]
  46. Juan, Y.-K.; Roper, K.O.; Castro-Lacouture, D.; Ha Kim, J. Optimal Decision Making on Urban Renewal Projects. Manag. Decis. 2010, 48, 207–224. [Google Scholar] [CrossRef]
  47. Kumar, R.; Singh, S.; Bilga, P.S.; Jatin; Singh, J.; Singh, S.; Scutaru, M.-L.; Pruncu, C.I. Revealing the benefits of entropy weights method for multi-objective optimization in machining operations: A critical review. J. Mater. Res. Technol. 2021, 10, 1471–1492. [Google Scholar] [CrossRef]
  48. Diakoulaki, D.; Mavrotas, G.; Papayannakis, L. Determining Objective Weights in Multiple Criteria Problems: The Critic Method. Comput. Oper. Res. 1995, 22, 763–770. [Google Scholar] [CrossRef]
  49. Çelikbilek, Y.; Tüysüz, F. An In-Depth Review of Theory of the TOPSIS Method: An Experimental Analysis. J. Manag. Anal. 2020, 7, 281–300. [Google Scholar] [CrossRef]
  50. Cao, K.; Liu, M.; Wang, S.; Liu, M.; Zhang, W.; Meng, Q.; Huang, B. Spatial Multi-Objective Land Use Optimization toward Livability Based on Boundary-Based Genetic Algorithm: A Case Study in Singapore. ISPRS Int. J. Geo-Inf. 2020, 9, 40. [Google Scholar] [CrossRef]
  51. Handayanto, R.T.; Tripathi, N.K.; Kim, S.M.; Guha, S. Achieving a Sustainable Urban Form through Land Use Optimisation: Insights from Bekasi City’s Land-Use Plan (2010–2030). Sustainability 2017, 9, 221. [Google Scholar] [CrossRef]
  52. Pahlavani, P.; Sheikhian, H.; Bigdeli, B. Evaluation of Residential Land Use Compatibilities Using a Density-Based IOWA Operator and an ANFIS-Based Model: A Case Study of Tehran, Iran. Land Use Policy 2020, 90, 104364. [Google Scholar] [CrossRef]
  53. Silverman, B.W. Density Estimation for Statistics and Data Analysis; Routledge: London, UK, 2018. [Google Scholar]
  54. Liu, Y.; Tang, W.; He, J.; Liu, Y.; Ai, T.; Liu, D. A Land-Use Spatial Optimization Model Based on Genetic Optimization and Game Theory. Comput. Environ. Urban 2015, 49, 1–14. [Google Scholar] [CrossRef]
  55. Deb, K.; Pratap, A.; Agarwal, S.; Meyarivan, T.A.M.T. A fast and elitist multiobjective genetic algorithm: NSGA-II. IEEE Trans. Evol. Comput. 2002, 6, 182–197. [Google Scholar] [CrossRef]
  56. Xu, Y.; Zhao, S.; Fan, J. Urban planning construction land standard and its revision based on climate and topography in China. J. Geogr. Sci. 2021, 31, 603–620. [Google Scholar] [CrossRef]
Figure 1. Geographic distribution of land use categories in Shenzhen, Guangdong province, China.
Ijgi 13 00250 g001
Figure 2. Urban land use renovation and reconstruction workflow based on CHGA.
Ijgi 13 00250 g002
Figure 3. Urban optimization cost evaluation indicators. (a) Elevation, (b) slope, (c) benchmark land price, (d) building density, (e) floor area ratio, (f) population density, (g) building structure.
Ijgi 13 00250 g003
Figure 4. Evaluation maps of reconstruction costs and renovation cost map. (a) Reconstruction cost map, (b) renovation costs.
Ijgi 13 00250 g004
Figure 5. Average objective value change curve of the global land use scheme at each iteration.
Ijgi 13 00250 g005
Figure 6. Pareto frontiers for economic and cost objectives of different methods.
Ijgi 13 00250 g006
Figure 7. Distribution of renovation and reconstruction cells obtained by different algorithms. (a) Distribution of reconstructed land in the optimal solution of the CHGA, (b) distribution of renovated land in the optimal solution of the CHGA, (c) distribution of reconstructed land in the optimal solution of NSGA-II_R, (d) distribution of renovated land in the optimal solution of NSGA-II_R, (e) distribution of optimized land in the optimal solution of NSGA-II.
Ijgi 13 00250 g007
Figure 8. The proportion of renovation and reconstruction in different urban land types.
Ijgi 13 00250 g008
Figure 9. Distribution of renovation and reconstruction land for different urban land use types. (a) Optimization of residential land use, (b) optimization of commercial land use, (c) optimization of industrial land use, (d) optimization of service land use.
Ijgi 13 00250 g009aIjgi 13 00250 g009b
Figure 10. Economic and cost objectives under different scenarios.
Ijgi 13 00250 g010
Figure 11. Land use optimization solutions under different scenarios. (a) Sustainable development scenario, (b) scenario with maximized economic objectives, the red circle indicates areas concentrated with commercial and service land use, (c) scenario with minimized costs, the red circle indicates areas concentrated with industrial land use.
Ijgi 13 00250 g011
Table 1. Cost evaluation indicators.
IndicatorsDescription
ElevationElevation may increase construction difficulty, leading to higher renovation and reconstruction costs.
SlopeUneven land requires more cost for leveling and development. Additionally, building houses on slopes demands more technical and resource investment.
Land priceHigh land prices increase investment costs. Since renovation does not involve land purchase or transfer costs, it is less affected by land prices compared to reconstruction.
Building densityRenovation in densely built areas requires more manpower, resources, and management. High building density can also lead to traffic and crowd issues, increasing the difficulty of renovation and reconstruction.
Floor area ratioThe floor area ratio is the ratio of a building’s ground floor area to the plot area. A higher ratio means more buildings per unit of land, increasing demolition or maintenance costs.
Building structureBuilding structure refers to the construction of a building. For reconstruction, poor building structure can reduce demolition costs. For renovation, poor building structure can lead to increased costs.
Population densityIn densely populated areas, relocating residents poses challenges for reconstruction. However, in such areas, infrastructure can be shared among multiple communities, thereby reducing renovation costs.
Table 2. Reconstruction cost coefficient.
land Use TypesResidentialCommercialIndustrialService
Cost coefficient0.440.340.440.65
Table 3. Land compatibility among different urban land types, from 0 (least compatible) to 1 (most compatible).
Land Use TypeResidentialCommercialIndustrialService
Residential10.70.20.8
Commercial0.710.40.6
Industrial0.20.410.6
Service0.80.60.61
Table 4. Weight of evaluation indicators.
Evaluation Index ω r n v ω r c s
Elevation0.08020.1981
Slope0.06060.2584
Benchmark land price0.01420.2559
Building density0.31170.2498
Floor area ratio0.25170.0021
Building structure score0.16080.0276
Population density0.12080.0081
Table 5. The economic growth rate of reconstruction.
After Reconstruction
ResidentialCommercialIndustrialServices
Before ReconstructionResidential1.16881.039972.46781.3058
Commercial1.35851.21842.77111.5074
Industrial−0.35033−0.388930.0388−0.3093
Services1.20491.07382.52551.3441
Table 8. Comparison of optimal solutions.
EconomicCostTransport AccessibilityCompatibility
SZ Land use6.5624 × 1010-3.5165 × 1053.4756 × 105
NSGA-II6.6519 × 10107.7470 × 1033.5167 × 1053.4886 × 105
NSGA-II_R6.5933 × 10106.2216 × 1033.5172 × 1053.4886 × 105
CHGA6.5742 × 10105.7023 × 1033.5165 × 1053.4888 × 105
Table 6. The economic growth rate of renovation.
After Renovation
ResidentialCommercialIndustrialServices
Before Renovation0.42590.69660.34510.6186
Table 7. Optimization constraints.
TypeConstraintDescribe
Optimization area A r e a f M i n A r e a f A r e a R e s i d e n t i a l > 10 km2;
A r e a I n d u s t r i a l > 45 km2;
A r e a S e r v i c e > 2.03 km2
Topographical X i = 0 ,   i f   S l o p e > 10 ° Areas with slopes greater than 10 degrees are not allowed for urban construction land use.
Functional protection X i = 0 ,   i f   f u n = l i m i t _ l a n d Transportation land, historical heritage areas, and buildings will not be involved in the optimization process.
Disclaimer/Publisher’s Note: The statements, opinions and data contained in all publications are solely those of the individual author(s) and contributor(s) and not of MDPI and/or the editor(s). MDPI and/or the editor(s) disclaim responsibility for any injury to people or property resulting from any ideas, methods, instructions or products referred to in the content.

