Article

A Lightweight Multi-Label Classification Method for Urban Green Space in High-Resolution Remote Sensing Imagery

1
School of Geography and Information Engineering, China University of Geosciences, Wuhan 430078, China
2
School of Computer Science, China University of Geosciences, Wuhan 430078, China
*
Author to whom correspondence should be addressed.
ISPRS Int. J. Geo-Inf. 2024, 13(7), 252; https://doi.org/10.3390/ijgi13070252
Submission received: 16 April 2024 / Revised: 1 July 2024 / Accepted: 11 July 2024 / Published: 13 July 2024

Abstract

:
Urban green spaces are an indispensable part of the ecology of cities, serving as the city’s “purifier” and playing a crucial role in promoting sustainable urban development. Therefore, the refined classification of urban green spaces is an important task in urban planning and management. Traditional methods for the refined classification of urban green spaces heavily rely on expert knowledge, often requiring substantial time and cost. Hence, our study presents a multi-label image classification model based on MobileViT. This model integrates the Triplet Attention module, along with the LSTM module, to enhance its label prediction capabilities while maintaining its lightweight characteristic for standalone operation on mobile devices. Trial outcomes in our UGS dataset in this study demonstrate that the approach we used outperforms the baseline by 1.64%, 3.25%, 3.67%, and 2.71% in m A P , F 1 , p r e c i s i o n , and r e c a l l , respectively. This indicates that the model can uncover the latent dependencies among labels to enhance the multi-label image classification device’s performance. This study provides a practical solution for the intelligent and detailed classification of urban green spaces, which holds significant importance for the management and planning of urban green spaces.

1. Introduction

Urban green spaces are integral to the city’s ecology, serving as the city’s “purifier” and making a significant contribution to sustainable urban development [1]. Urban green spaces play a pivotal role in boosting the living quality of urban residents, preserving the natural ecological balance, and feature functions such as reducing air pollution [2,3,4], regulating temperature, reducing the impact of the city’s heat island [5,6,7,8], and also decreasing dust, as well as noise [9,10]. Moreover, urban green spaces offer an excellent leisure platform for citizens [11,12], diminishing their stress and anxiety [13] and thereby enhancing their sense of well-being [14]. Meanwhile, urban green spaces offer citizens areas for exercise and interactive public spaces [15], contributing to improved physical and mental health [15] and enhancing social cohesion [16]. Moreover, urban green spaces provide habitats for plants and animals, aiding in the conservation of biodiversity within cities [17]. Therefore, urban green spaces play a significant protective role for both humans and other living organisms [18]. Urban green spaces also improve water quality [19,20,21]. An analysis of the impacts of urban green spaces, both domestically and internationally, indicates the heightened importance of their internal structure and spatial distribution when the coverage rate is less than 40% to 60%. Therefore, understanding the classifications of different types of urban green spaces is crucial. Following the requirements outlined in the “Notice on the Issuance of the (2013 Engineering Construction Standards and Regulations Formulation and Revision Plan)” by China’s Ministry of Housing and Urban-Rural Development, the “Urban Green Space Classification Standards” document was issued. This document distinctly classifies urban green spaces into five types: ancillary green space, park green space, area green space, protective green space, and square green space. This initiative enables a precise understanding of the layout of different kinds of green spaces within cities, standardizes the protection, development, and management of these spaces, and aids in enhancing the natural landscapes of both rural and urban regions, fostering sustainable development across both areas.
In the context of national urban greening projects, the detailed classification of urban green spaces represents a significant task. There are two primary methods for the detailed classification of urban green spaces: one relies entirely on visual interpretation, while the other utilizes deep learning to extract urban green spaces from remote sensing images, integrating POI (Point of Interest) and OSM (OpenStreetMap) data for detailed classification [22]. Although many researchers have made significant advancements in extracting urban green spaces using deep learning, manual intervention is still required for detailed classification. Therefore, we aim to explore the feasibility of automating the detailed classification of urban green spaces.
At the present time, deep learning is one of the most widely utilized artificial intelligence techniques in the domain of artificial intelligence, with extensive applications in image recognition, object detection, image classification, semantic segmentation, and natural language processing, among others. Multi-label image classification [23,24,25,26] represents a significant direction within deep learning, where a single image can be classified into multiple labels or categories. Unlike traditional single-label classification, multi-label classification enables an image to be allocated multiple labels, each representing different objects, scenes, or concepts present in the image. In multi-label image classification tasks, models are required to identify all possible labels present in an input image, rather than recognizing it as a single most relevant category. This approach is better suited for handling the complex and diverse content found in real-world images. Presently, multi-label image classification has been widely applied in various fields, such as protein subcellular localization [27,28], Alzheimer’s disease automatic diagnosis [29], image processing of remote sensing [30], lung disease identification research [31], and all-sky aurora image processing [32]. These studies share the commonality of each image containing multiple targets to be identified, with specific connections among these targets. Given that urban green space data encompass various types of green spaces to be recognized, multi-label image classification can be effectively utilized in the research on urban green space classification. Therefore, the study introduces a deep learning framework for the refinement classification of urban green spaces, based on multi-label image classification.
To achieve an intelligent and detailed classification of urban green spaces, our study proposed a novel multi-label image classification model. This model is based on MobileViT [33] and integrates the advantages of the LSTM module [34] and the Triplet Attention module [35], enabling the high-precision detailed classification of urban green spaces while maintaining a lightweight structure. Based on the results of the experiments, the contributions made by this work can be concluded up as follows:
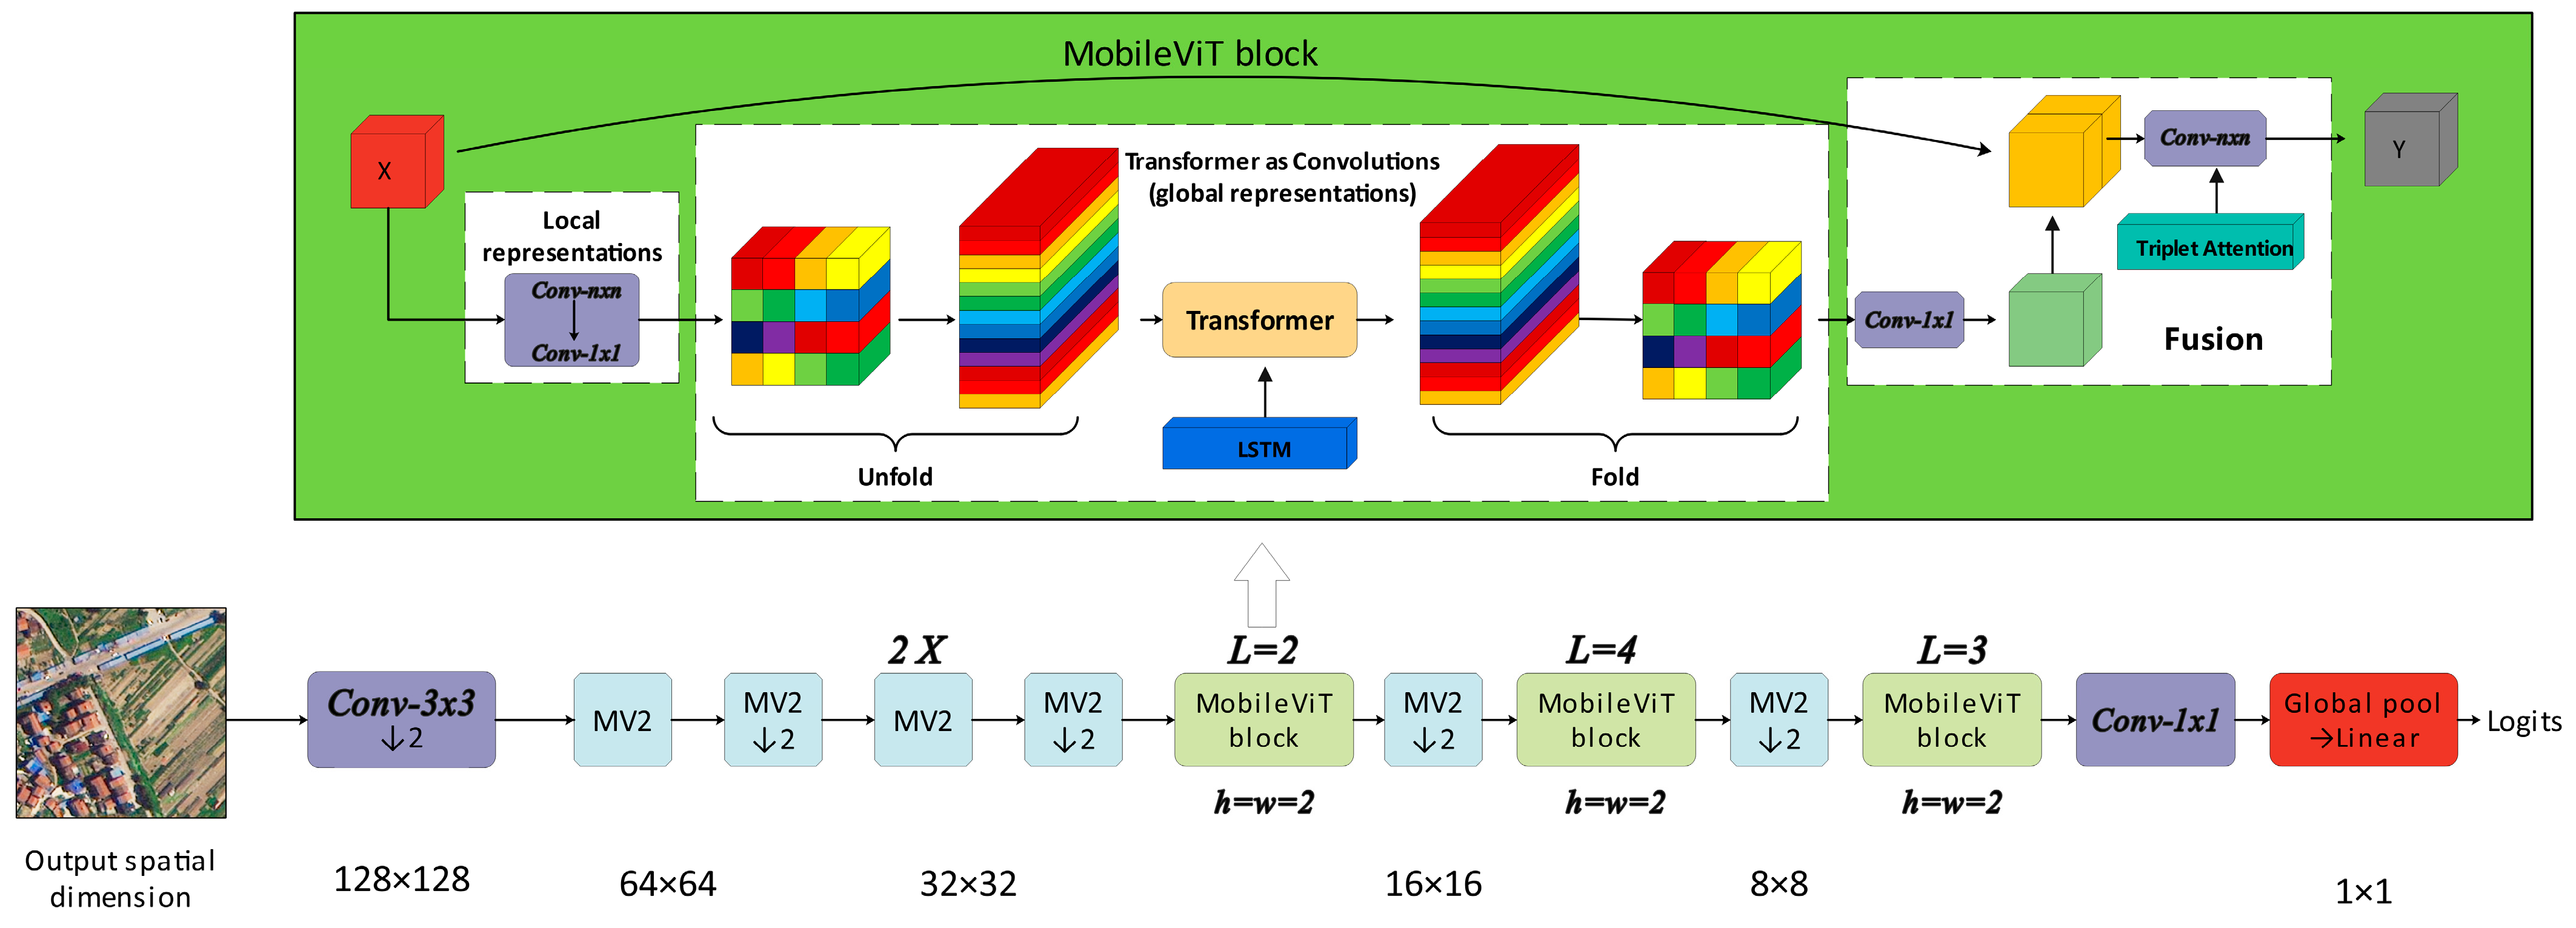
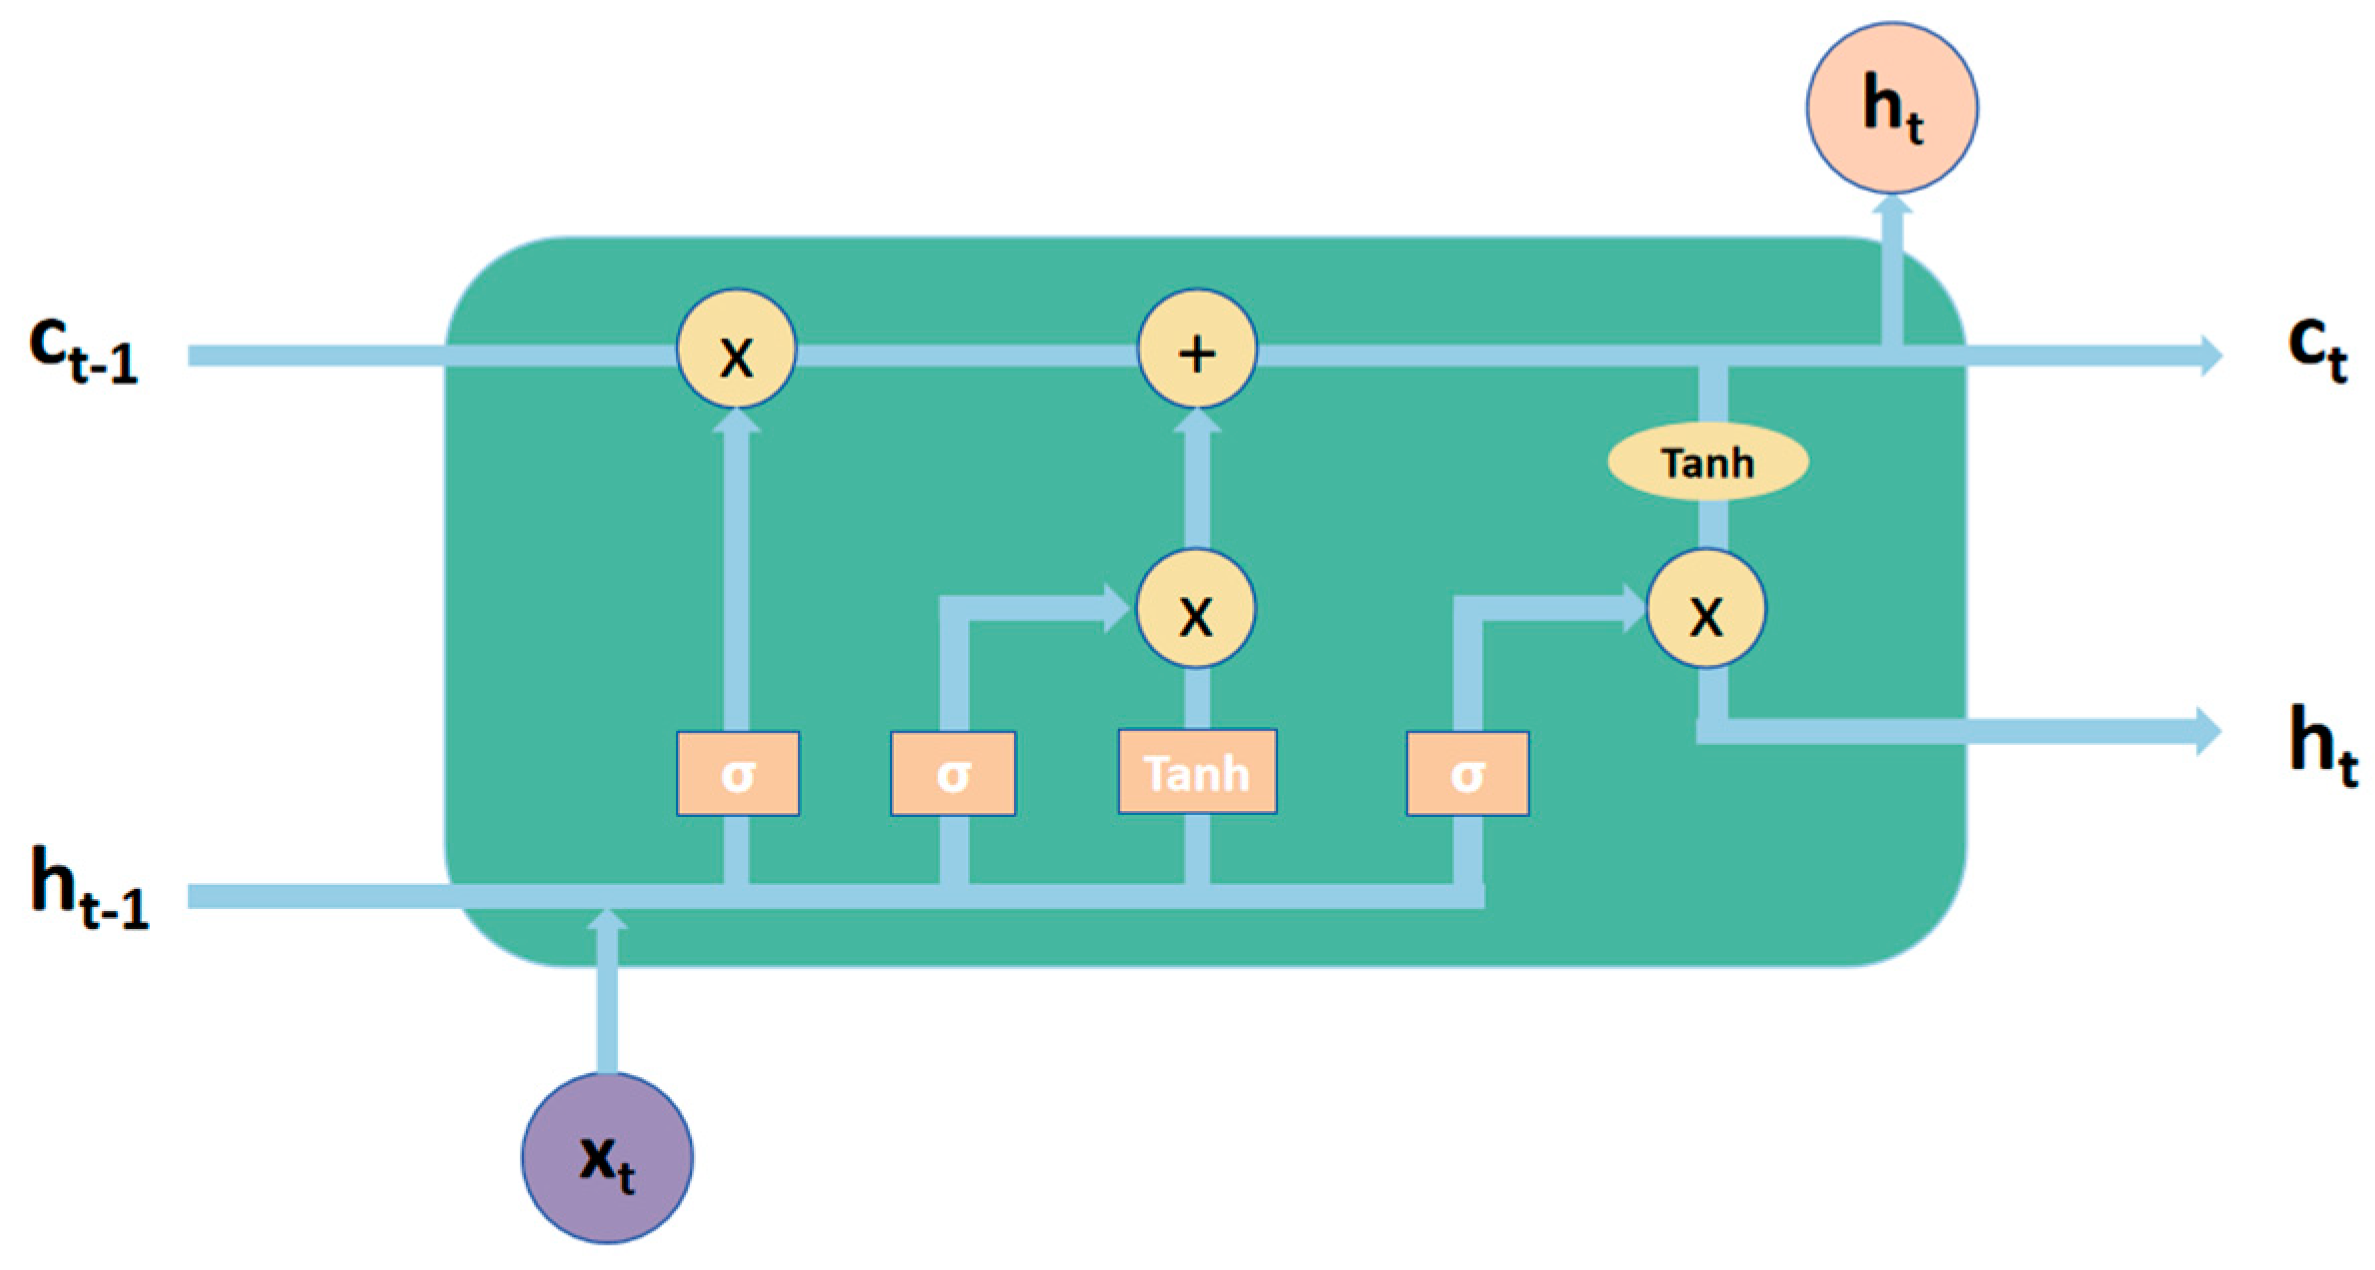
  • A newly formed multi-label classification model of urban green space, which incorporates the Triplet Attention module, is presented. This integration not only minimizes computational demands but also addresses the indirect correspondence between channels and weights. Furthermore, by employing an LSTM network, the model effectively minimizes interference from irrelevant information and amply utilizes effective information, capturing subtle objectives that may otherwise be overlooked. This allows for a more accurate exploration of the correlations between labels.
  • Experiments and evaluations conducted on our constructed UGS multi-label dataset prove that the presented model performs better than the existing multi-label classification methods among precision, recall, and mAP.
  • Through this study, more detailed attributes of urban green spaces can be extracted from images in an intelligent manner. This has significant implications for the planning and management of urban green spaces. The research findings can provide comprehensive decision support and multi-dimensional analysis for urban management and development, aiding in the formulation of more scientific management strategies. Consequently, the study contributes significantly to environmental protection, ecological research, and social development.
The remaining content of the paper has been arranged in the following order: Section 2 presents the sources of data, data pre-processing, and the distribution of the dataset and its true labels. Section 3 delineates the urban green space classification methodology details proposed in this document. Section 4 is dedicated to describing the evaluation criteria, associated experiments, and their outcomes. Lastly, Section 5 provides conclusions drawn from the comprehensive study conducted.

2. Related Work

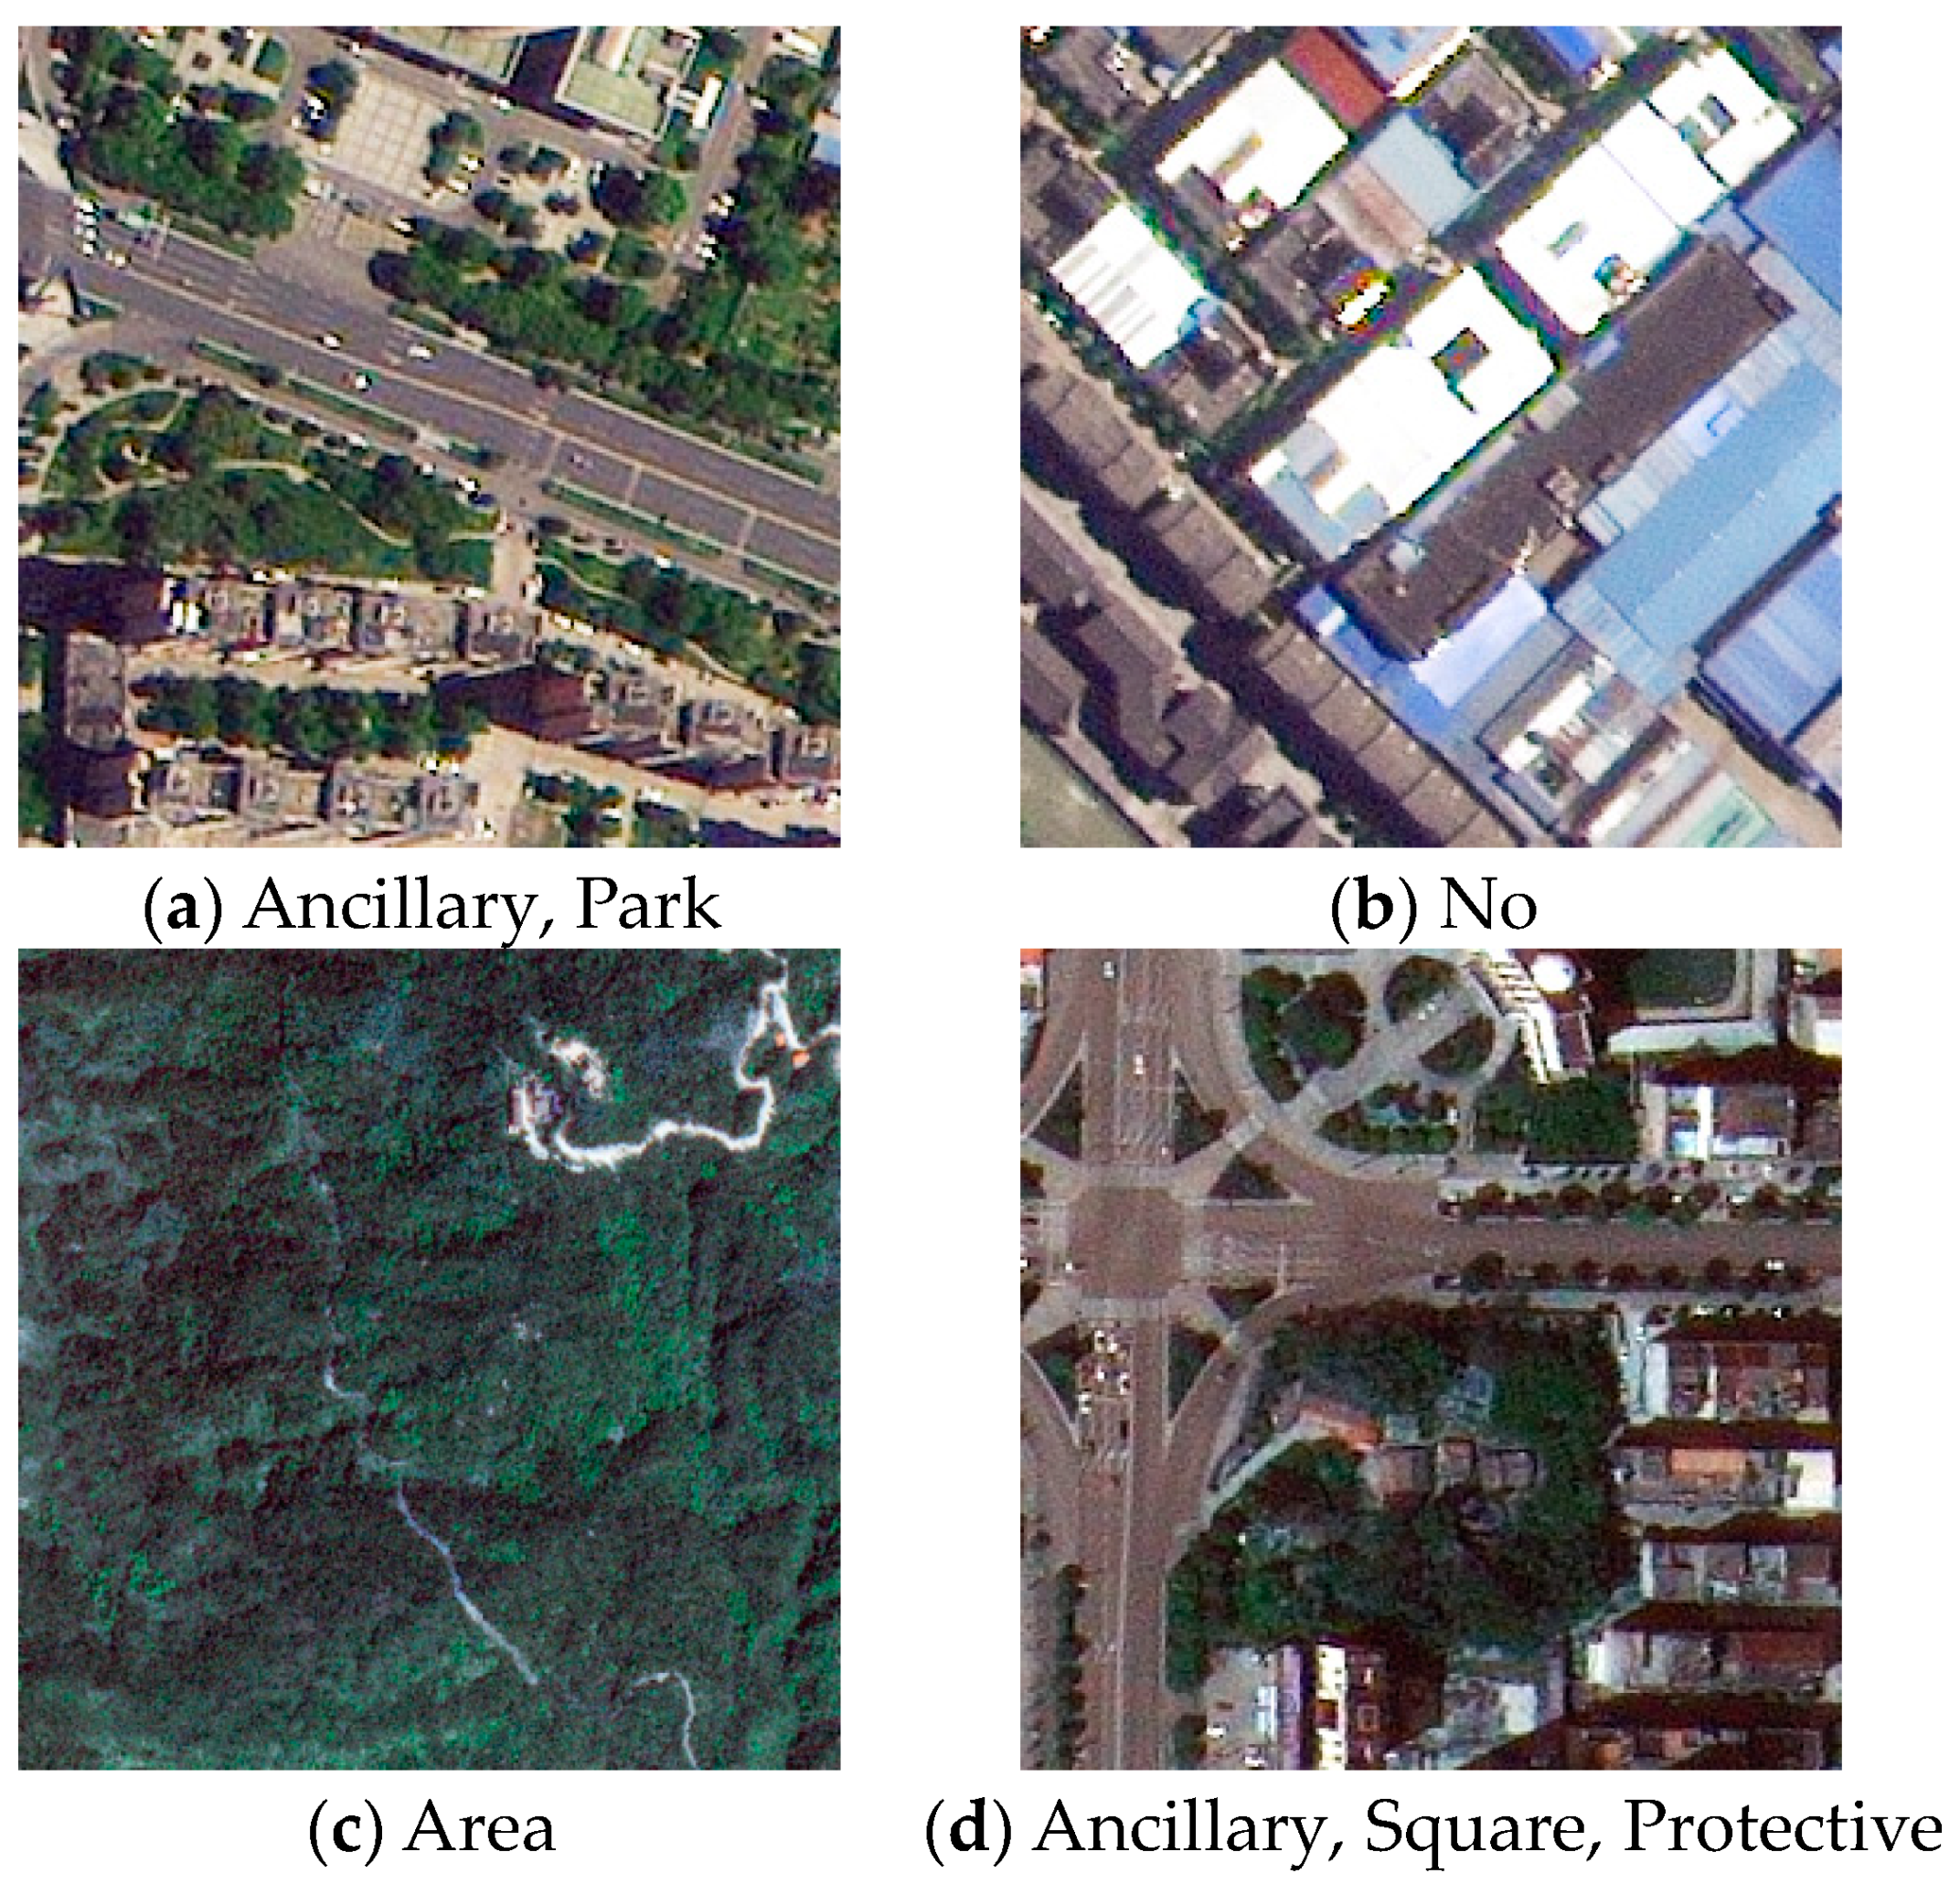
2.1. Pre-Processing and Dataset

The dataset utilized in our research originates from the GF-2 satellite, featuring 0.8 m spatial resolution high-resolution remote sensing imagery. Each set of data is used by the relevant cities to declare National Garden City; therefore, the quality and precision of the data, as well as the veracity of ground truth and the comprehensiveness of land cover, are ensured, which guarantees the rigor and validity of the dataset employed in this research. The dates of the remote sensing images for different regions are as follows: RuYuan on 9 April 2020 and 27 October 2020; TongCheng on 7 April 2022; JianLi on 11 April 2022 and 16 May 2022; and HanChuan on 8 August 2022 and 12 October 2022. Upon acquisition of the raw data, preliminary processing is a requisite, which includes the orthorectification of the imagery to eliminate deformations caused by terrain or camera orientation. Subsequently, multi-spectral and panchromatic satellite image data are merged to enhance the interpretability of ground features, followed by color balancing and mosaicking to ensure the clarity and easy recognition of terrain. Afterward, all remote sensing images are cropped into samples measuring 256 × 256. Finally, data annotation is carried out, making preparations for subsequent experiments.
The urban green space classification dataset after data augmentation used in the study are depicted in Table 1 and Table 2. Twenty percent of the data from each city, amounting to 1607 images, were randomly selected to be the test set, while the remaining 6427 images were allocated for model training. A selection of four images were chosen for illustration, as shown in Figure 1.

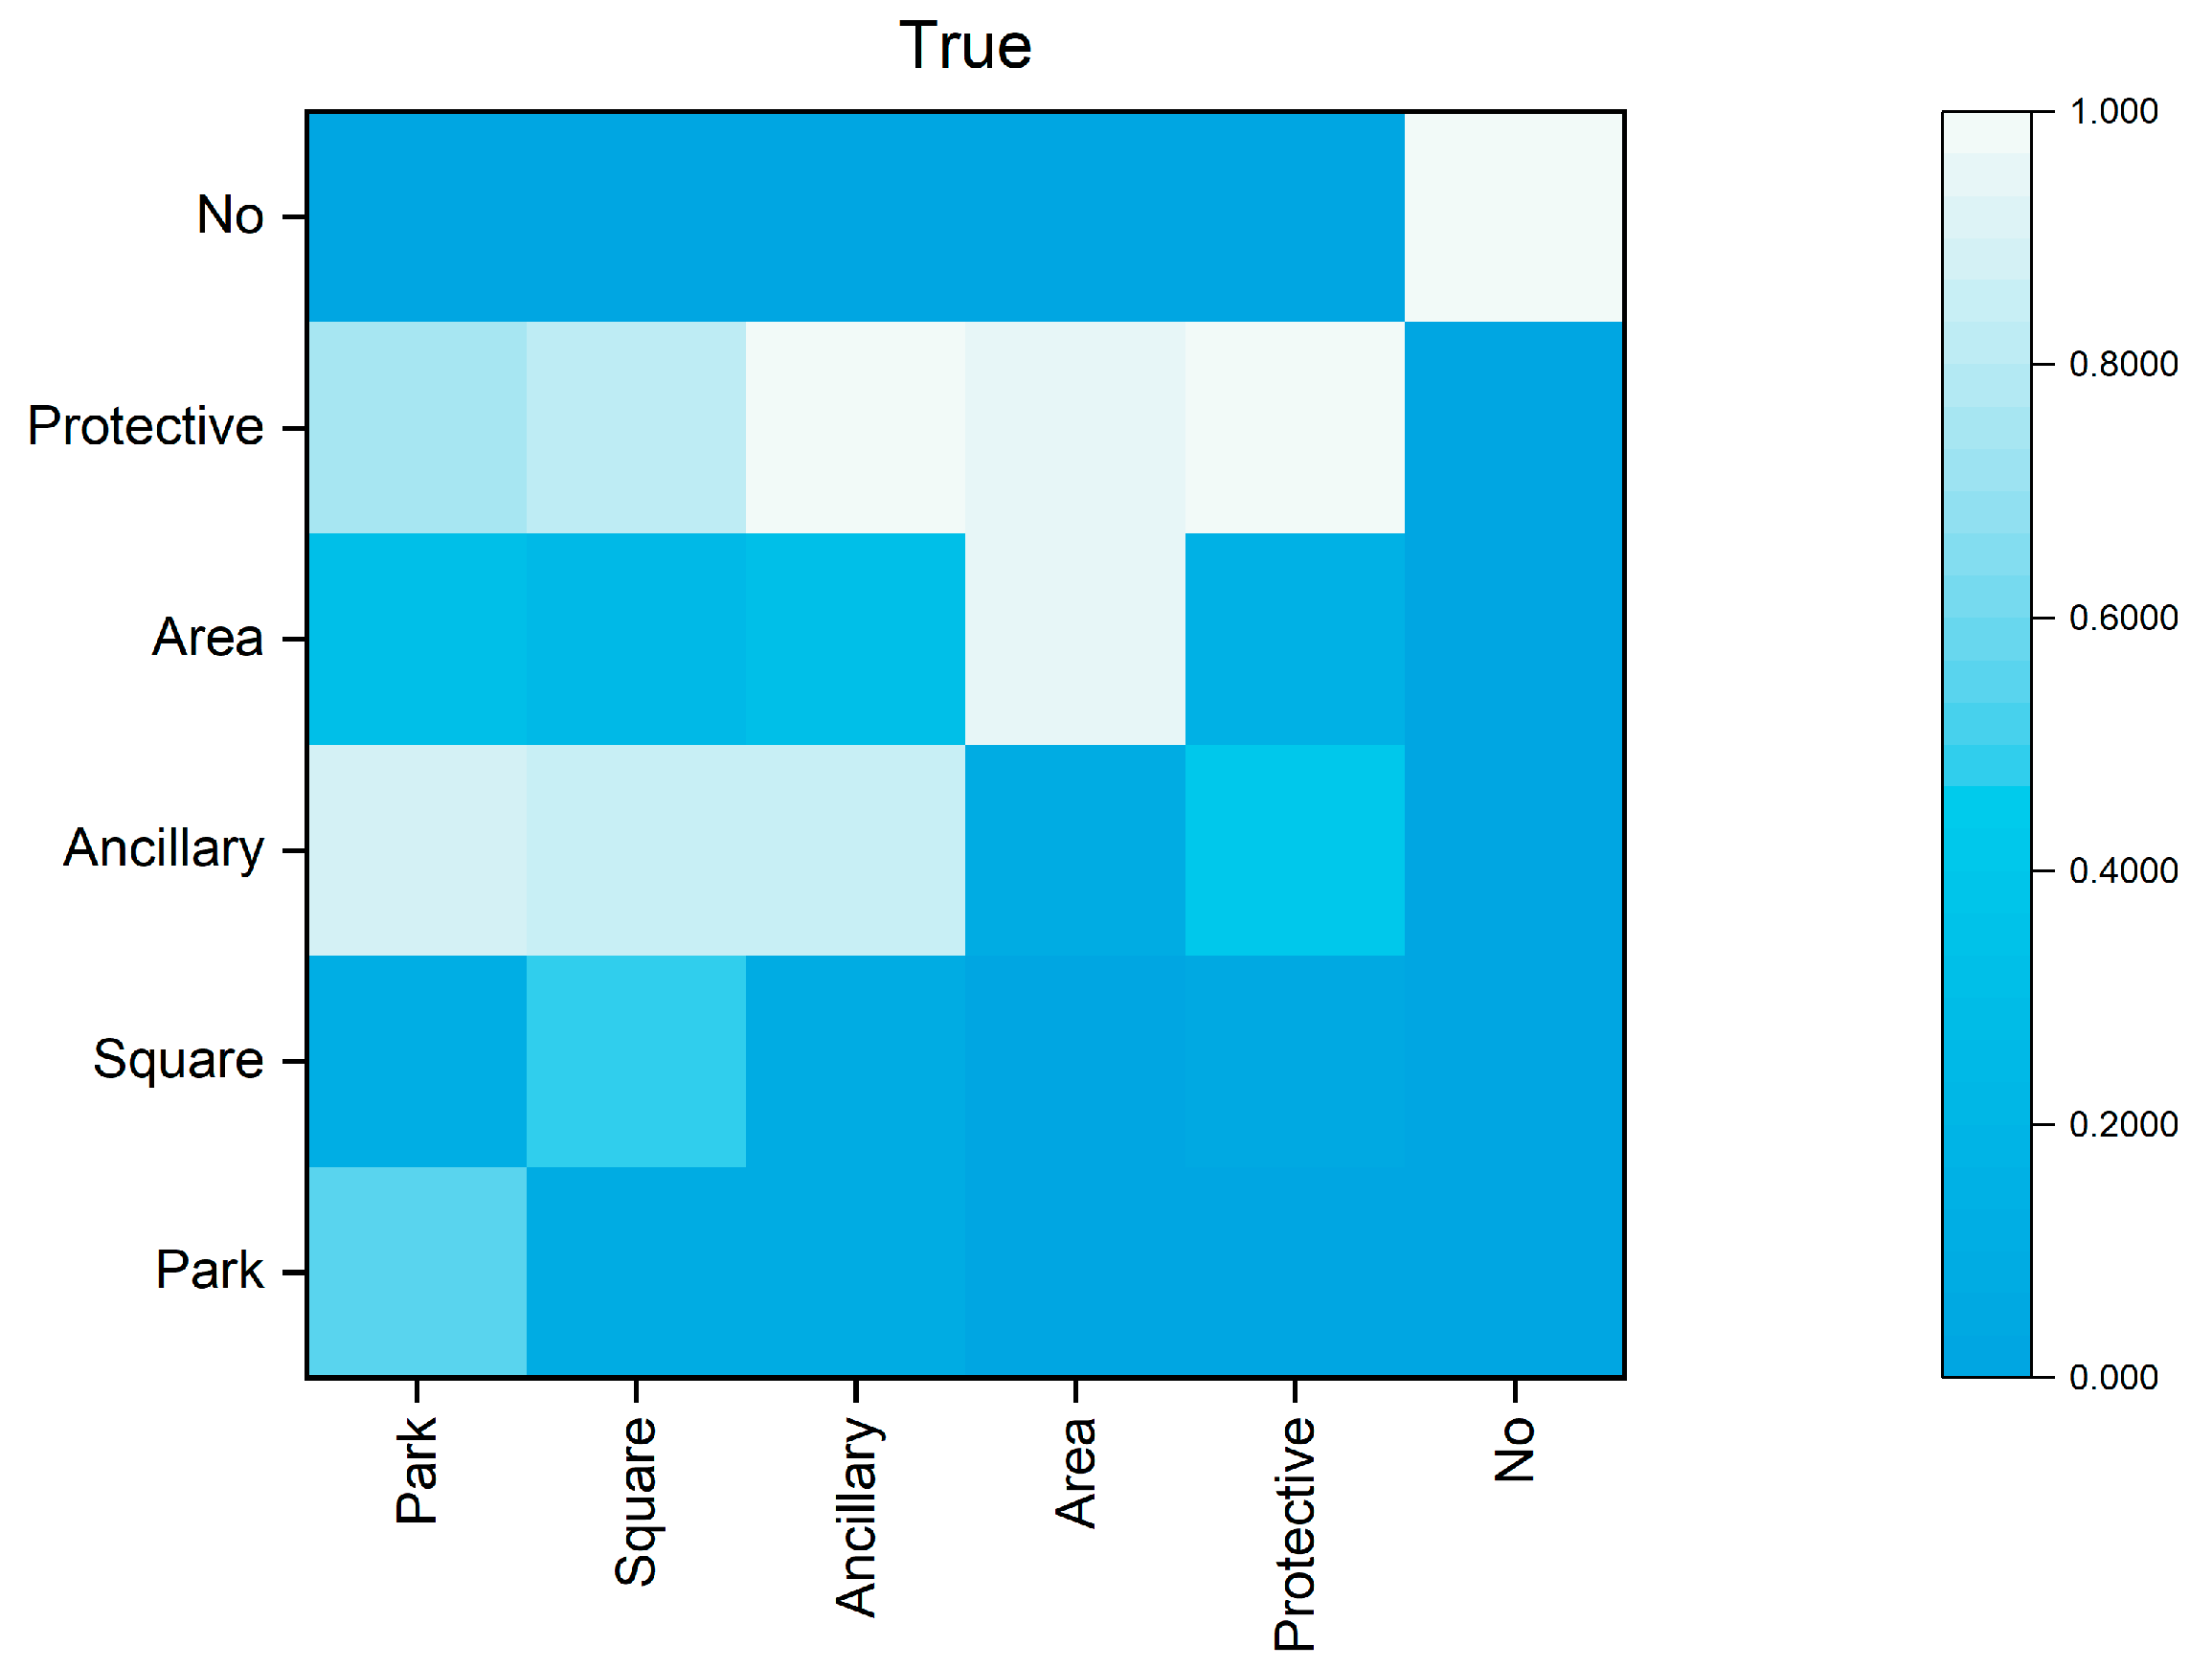
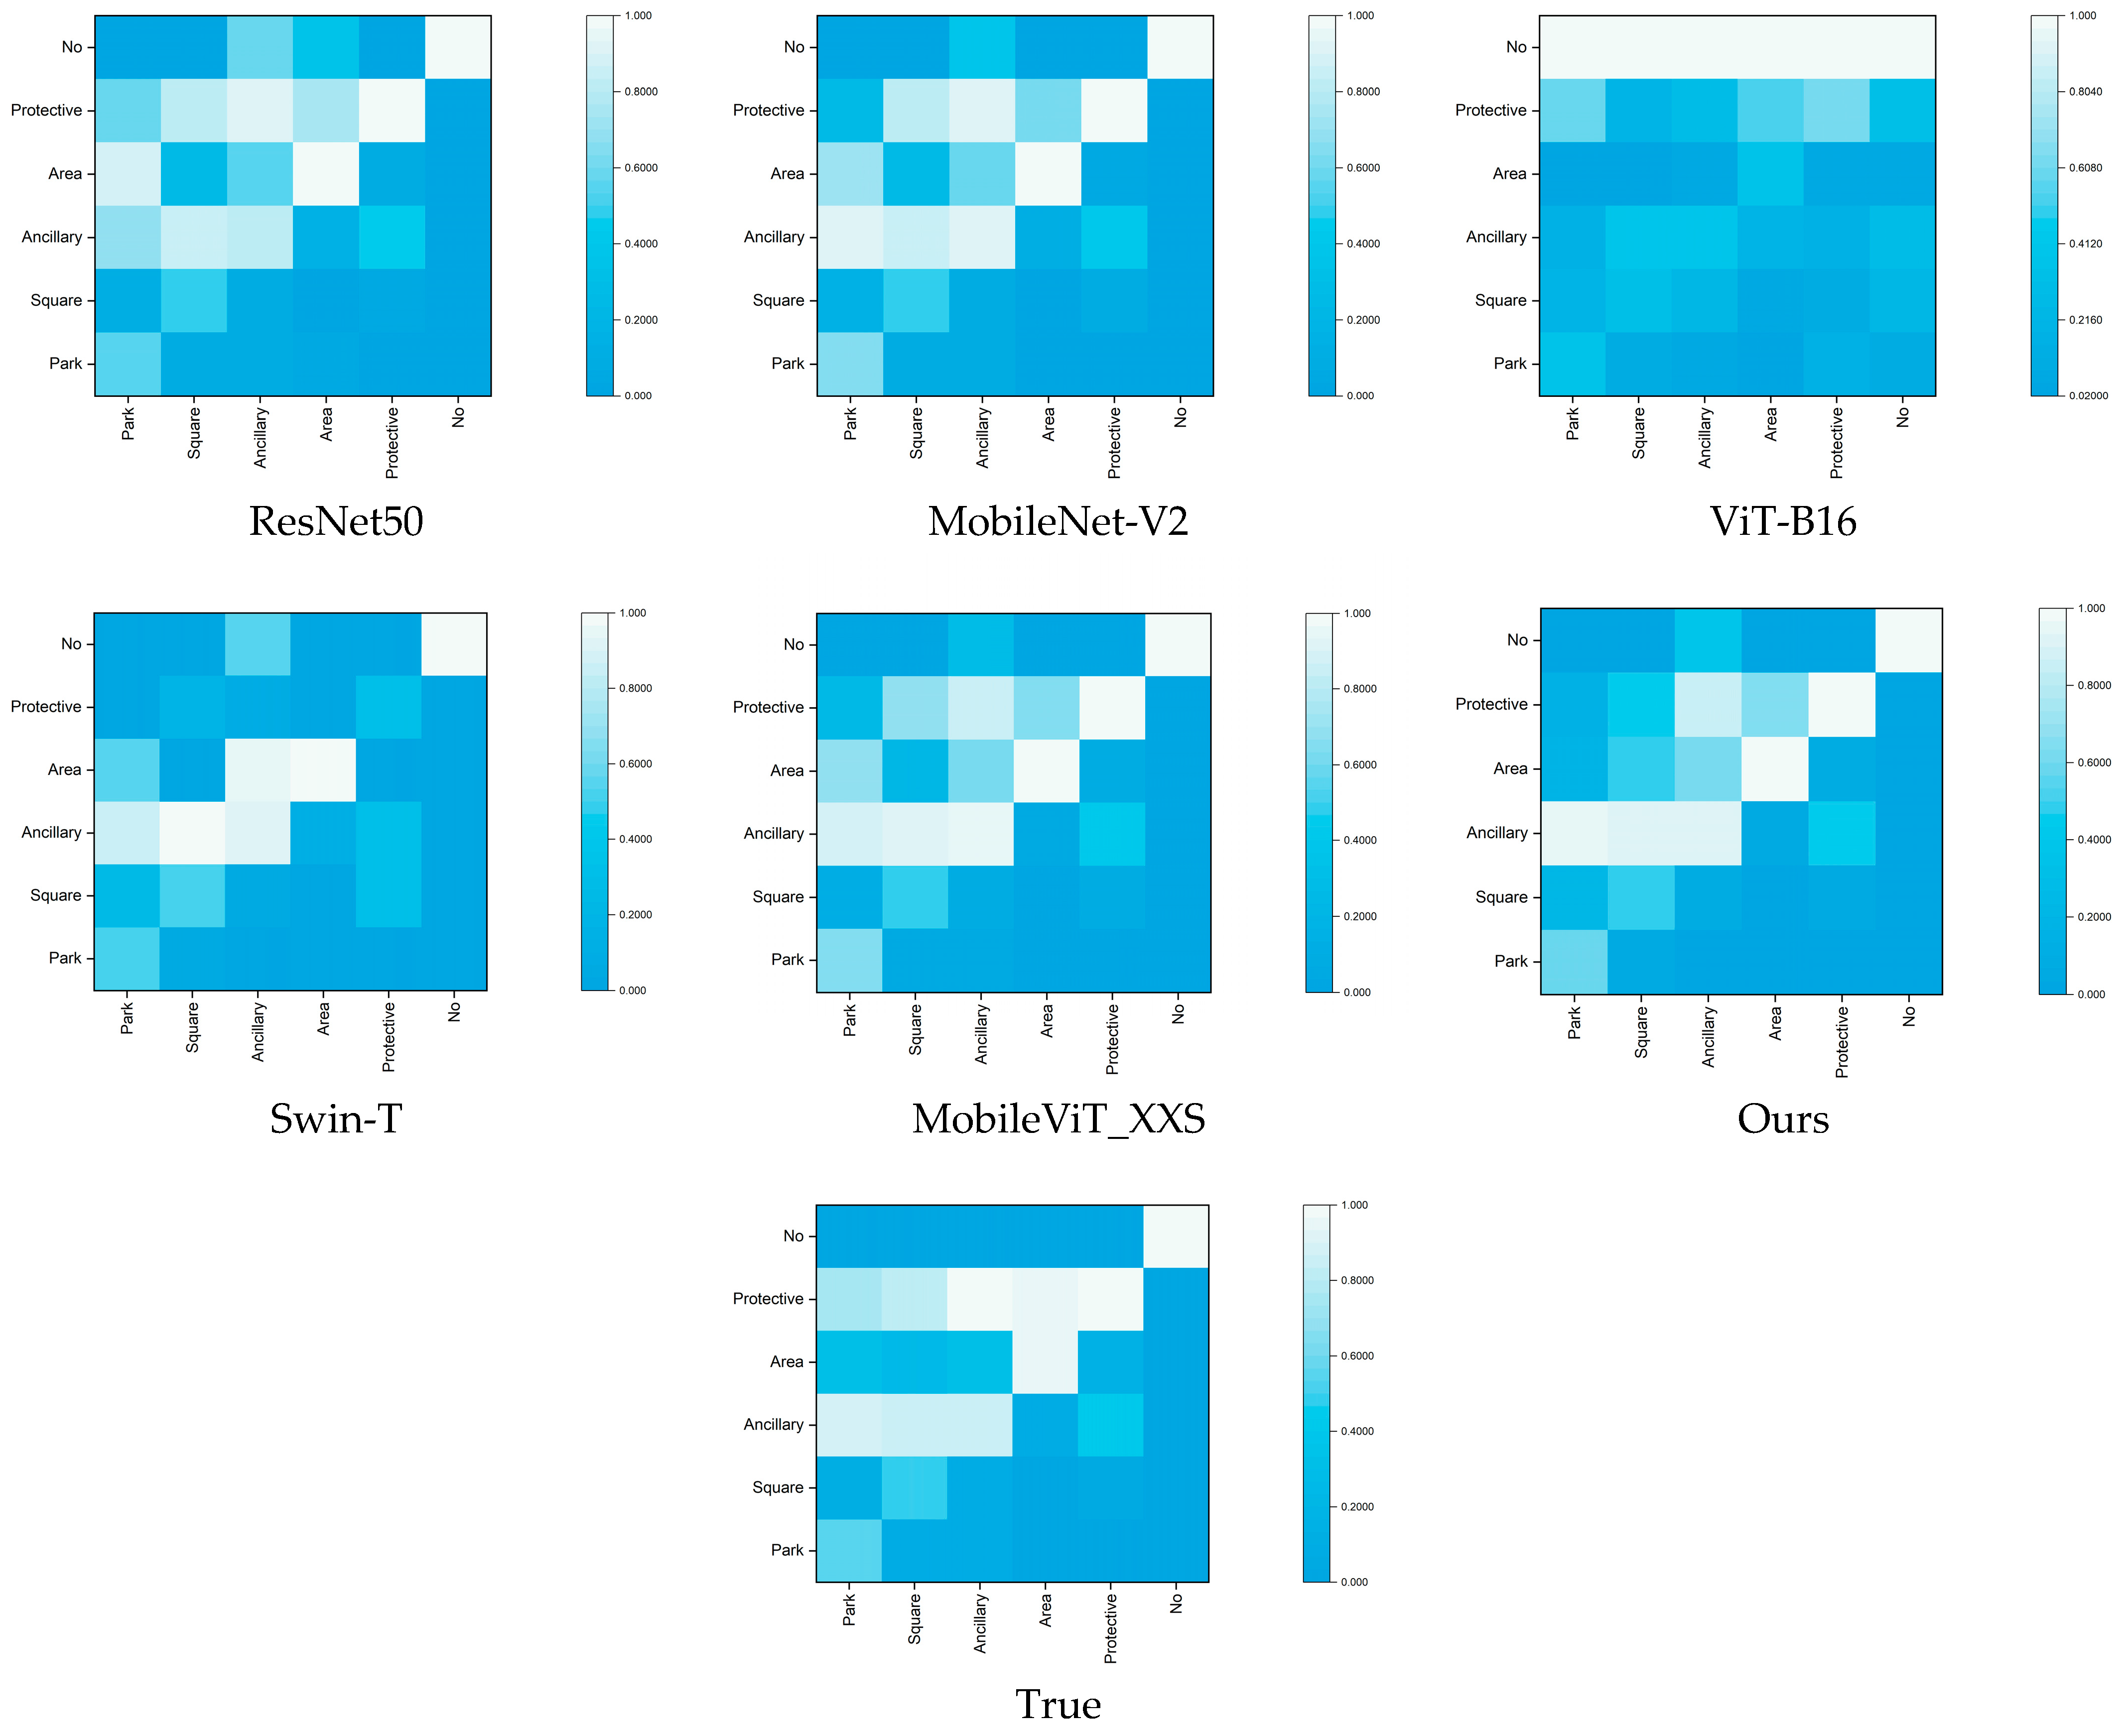
2.2. Confusion Matrix

The confusion matrix is an essential device in the field of machine learning for evaluating the performance of classification models, illustrating the correspondence between predicted outcomes and true labels within the task. In the context of multi-label classification tasks for urban green spaces, each sample may possess labels for multiple green space categories. Therefore, the confusion matrix could provide significant information for the study. The heat map of the confusion matrix, as depicted in Figure 2, clearly shows that the “non-green space” label does not overlap with other labels, whereas overlaps are possible among the other five categories of green spaces. For instance, area green spaces and protective green spaces, together with ancillary green spaces, might frequently overlap. Consequently, this study aims to explore the potential correlations between image labels by integrating the LSTM module, with the goal of enhancing the model’s classification accuracy.

3. Methodology

Multi-label image classification can be characterized as the scenario in which a single image sample may contain multiple labels concurrently. The given sample space is X = R, where x i X denotes the i t h sample within this space, and the label space is Y = { y 1 , y 2 , …, y q }, with y i Y indicating the i t h category label among the collection of labels and q representing the total count of the labels in the label space. For the i t h image x i in the given sample space, its corresponding labels are represented by y i = { y i 1 , y i 2 , …, y i q }, where y i j = 1 signifies the inclusion of label j in the image; otherwise, y i j = 0. An end-to-end model is constructed to learn the mapping function f : X Y , facilitating the transition from images to labels. During testing, with an image provided, its multiple associated labels are predicted through the mapping function f , showcasing the model’s ability to interpret the images’ intricate label associations.
The article’s presented model consists of three parts: MobileViT, the Triplet Attention module, and the LSTM module. The framework of the model is illustrated in Figure 3. By incorporating the Triplet Attention module, the model aims to reduce computational overhead and synthesize information across different dimensions, thereby capturing the intrinsic characteristics of the data more effectively. To minimize the interference of irrelevant information and leverage pertinent details while also detecting subtle targets that may be easily overlooked, the LSTM module is integrated. The model treats the multiple labels of an image as a sequence, initially extracting image features through MobileViT. Subsequently, it classifies features of different targets using the Triplet Attention module. Finally, the LSTM module decodes these feature maps across channels, enabling label prediction. The proposed framework performs more accurately than other models, according to experiment results.

3.1. Feature Extraction

With computer vision developing rapidly in the past few years, numerous feature extraction networks have emerged, including ResNet [36], MobileNet-V2 [37], Vision Transformer [38], Swin_Transformer [39], and MobileViT, among others. MobileViT combines the advantages of CNNs—like spatial inductive bias and lower sensitivity to data augmentation—with the strengths of transformers, such as input-adaptive weighting and global processing. Compared to existing lightweight CNNs, MobileViT offers superior performance, generalization ability, and robustness. Hence, this paper employs MobileViT as the feature extraction network. The structure of MobileViT block is shown in Figure 4.
For the input tensor X R H × W × C , it is initially processed through the convolution operations of (n × n) and (1 × 1) to obtain X L R H × W × d . Here, the (n × n) convolution is employed to capture local information, while the (1 × 1) convolution projects the input features into a higher-dimensional space. To enable MobileViT to learn global representations with a spatial inductive bias, the “Unfold, Transformer, Fold” process for global feature modeling is used. This involves unfolding X L into N non-overlapping segments X U R P × N × d , followed by modeling with a transformer to produce X G R P × N × d , as illustrated by the following equation:
X G ( p ) = T r a n s f o r m e r ( X U ( p ) ) , 1 p P
Subsequently, X G R P × N × d is folded to derive X F R H × W × d , which is then subjected to a (1 × 1) convolution, resulting in C-dimensional features. This is followed by the fusion of local and global features through an (n × n) convolution, culminating in the output.

3.2. Attention Module

A tri-branch structure is used in Triplet Attention, a lightweight and effective attention mechanism, to capture cross-dimensional interactions and compute attention weights. Moreover, through rotation operations and residual transformations, it establishes inter-dimensional dependencies for the input tensor, encoding channel-wise and spatial information with very little computing overhead. Figure 5 depicts the architecture of its network.
The Triplet Attention module is composed of three parallel branches, and each are designed to capture the dependencies among (C, H), (C, W), and (H, W), besides proposing cross-dimensional interactions. The structure effectively addresses the challenge of calculations being independent of each other and the isolation of channel attentions and spatial attentions in CBAM, which are computed independently. When given an input tensor X R C × H × W , the three branches of the Triplet Attention mechanism receive it immediately. Within these branches, interactions between the dimensions C , H , and W are established in pairs. Subsequently, the process incorporates batch normalization. The refined tensors C × H × W generated from the branches are then aggregated, resulting in the output y , as depicted in the equation illustrated. The structure effectively integrates information across various dimensions, thereby enhancing the ability to capture the intrinsic characteristics of the data more effectively:
y = 1 3 χ ^ 1 σ ( ψ 1 ( χ ^ 1 ) ) _ _ _ _ _ _ _ _ _ _ _ _ _ _ _ _ _ _ _ + χ ^ 2 σ ( ψ 2 ( χ ^ 2 ) ) _ _ _ _ _ _ _ _ _ _ _ _ _ _ _ _ _ _ _ + χ σ ( ψ 3 ( χ ^ 3 ) ) )
Beyond the Triplet Attention mechanism, prevalent attention mechanisms include SE [40], CBAM [41], and SA [42], among others. Triplet Attention distinguishes itself by its reduced computational demands. The emphasis on cross-dimension interaction without dimensionality reduction eliminates the indirect correspondence between channels and weights. This approach not only enhances computational efficiency but also ensures a deeper integration of spatial and channel-wise information, thereby addressing the issue of significant spatial information loss.

3.3. LSTM for Latent Semantic Dependencies

LSTM (long short-term memory) networks represent a specialized category of recurrent neural networks (RNNs) that address the issue of long-term dependencies, wherein the state of the system at any given time can be influenced by states from much earlier in the sequence. In scenarios where the temporal interval becomes significantly large, traditional RNNs are susceptible to gradients either exploding or vanishing. LSTM circumvents these issues through its distinctive architecture, fundamentally leveraging an internal gating mechanism to selectively retain or disregard information, as illustrated in Figure 6. This mechanism incorporates the “forget gate layer” to modulate the degree to which long-term information from the cell state c t 1 is maintained, the “input gate layer” to regulate the extent of new information being incorporated, and the “output gate layer” to control the magnitude of information emitted as the output. The method of updating for LSTM at time step t can be delineated as follows:
m t = t a n h ( W x c x t + W h c x t 1 + b c )
i t = σ ( W x i x t + W h i x t 1 + b i )
f t = σ ( W x f x t + W h f x t 1 + b f )
o t = σ ( W x o x t + W h o x t 1 + b o )
c t = f t c t 1 + i t m t
h t = o t × t a n h ( c t )
In these formulas, all instances of W and b denote parameters to be trained, while x t denotes the input at time t . The symbols i t , f t , and o t correspond to the input gate layer, forget gate layer, and output gate layer within the LSTM architecture, respectively. c t and h t indicate the stored and hidden states of LSTM, respectively. The function σ ( . ) is indicative of the sigmoid activation function.
LSTM, through its cell states and gating mechanisms, regulates the flow of information better, effectively mitigating the impact of irrelevant data and addressing the issues of gradient decay and explosion. LSTM can also effectively preserve and update historical information via these mechanisms, which enables LSTM to capture correlations between labels by utilizing the information encoded in the units at each time step. When making a prediction at moment c t , integrating correlations from all previous channels’ labels facilitates an enhanced ability to recognize the current predictive labels. This capability makes LSTM particularly adept at handling long-term dependency issues.
In the LSTM framework, the LSTM network can be concentrated on collecting semantic relationships between labels because every channel in the feature map links to a label. Specifically, channel v t undergoes encoding first, following which the resultant x t is sequentially fed into the LSTM, yielding the predicted probabilities for label p t :
x t = r e l u ( W v x v t + b x )
h t = L S T M ( x t , h t 1 , c t 1 )
p t = σ ( W h p h t + b h )
In the above equation, the convolution parameters are W v x and b x , and the classification layer parameters are W h p and b h .

3.4. Data Augmentation

Generally, the larger the volume of sample data available for experimentation, the better the training outcomes of the model and the stronger its ability to generalize. In cases where the dataset is limited in size or the quality of samples is suboptimal, data augmentation procedures are necessitated to enhance the model’s generalizability and robustness, thereby preventing overfitting. Experiments conducted without the implementation of data augmentation yield subpar results, particularly in predicting images with three or more labels and images with rare labels. Therefore, this study employs a variety of data augmentation techniques to enhance the model’s performance as a whole. Unlike conventional image data, remote sensing imagery retains semantic information, even after transformations such as rotation and flipping. Consequently, this paper utilizes horizontal flipping, vertical flipping, and rotations as methods to achieve the purpose of data augmentation.
By adopting this method, samples in the dataset with fewer label categories undergo data augmentation, resulting in six training samples for each specified label category. Such transformations enhance the robustness of our model and improve its performance on rare labels.

4. Experiment

The models used in the experiments were initialized with weights trained on the ImageNet dataset and underwent training with the feature extraction layers frozen. ImageNet is one of the deep learning datasets commonly used for object detection, object localization, and image classification, comprising over 15 million images across more than 21,000 categories. The same set of circumstances were used for every experiment in this study. The server’s CPU hosting the experimental environments was an Intel(R) Xeon(R) Gold 5218 CPU (2.30 GHz), and its GPU was an Nvidia Tesla T4. The multi-label soft margin loss was employed as the loss function, and the optimizer was stochastic gradient descent (SGD), with a 0. 001 starting learning rate. To determine the best epoch for each model, an initial training period of 300 epochs was conducted.

4.1. Evaluation

In this experiment, p r e c i s i o n , r e c a l l , F 1 and m A P were used as the evaluations. The calculation formulas are shown below:
P r e c i s i o n = T P T P + F P
R e c a l l = T P T P + F N
F 1 = 2 P r e c i s i o n R e c a l l P r e c i s i o n + R e c a l l
where F P denotes the quantity of false positives, and T P represents the quantity of real positives. The precision is defined as its ability not to identify a negative sample as positive, and the recall is its capacity to identify every positive sample. The F 1 score can be understood as a harmonic mean of the recall and precision, with the best value of all three assessments occurring at 1 and the lowest score occurring at 0. Both recall and precision have an equal proportional contribution to the F 1 score.
m A P (mean average precision) is defined as the mean of the A P (average precision) metrics computed across various categories. The calculation of A P is based on the interpolated average precision, which is measured by the area under the P r e c i s i o n R e c a l l curve. Within this formula, n 1 represents the counting of detection points, while p i n t e r p denotes the precision metric at a designated recall rate r . To calculate the m A P , the A P metrics are aggregatedfor every category, with K representing the entire number of classes in the analysis.
A P = i = 1 n 1 ( r i + 1 r i ) p i n t e r p ( r i + 1 )
m A P = i = 1 K A P i K

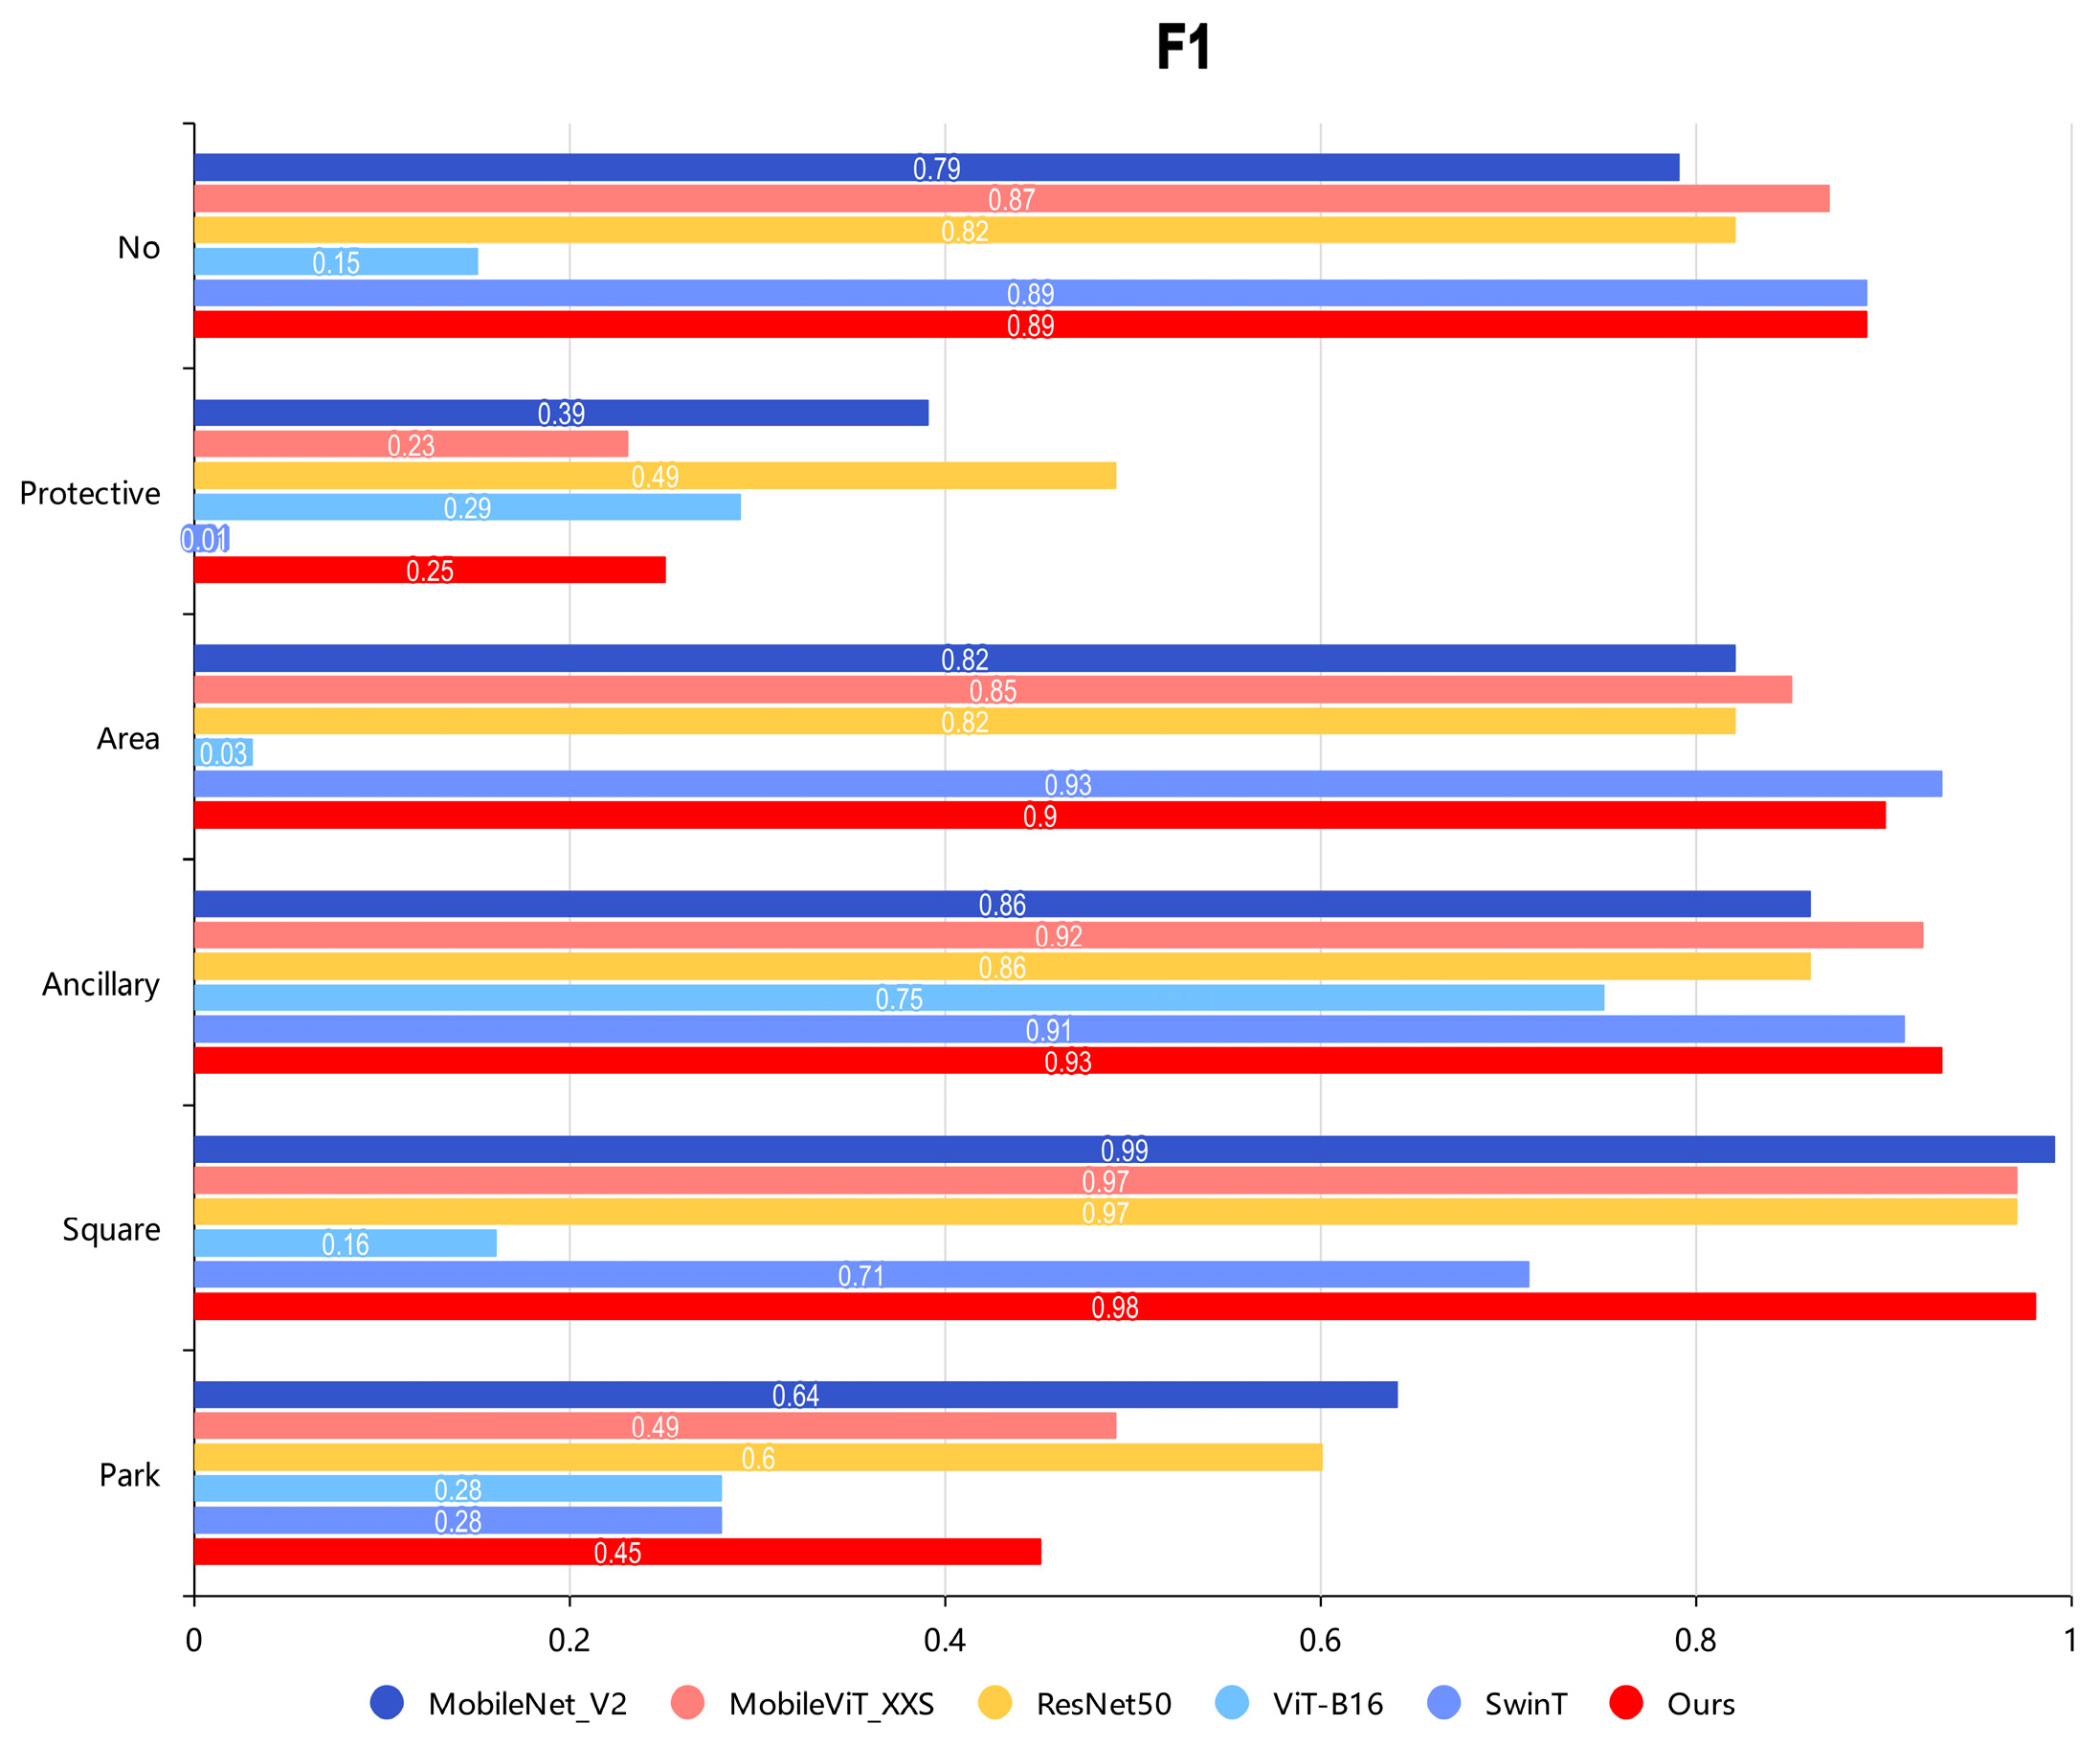
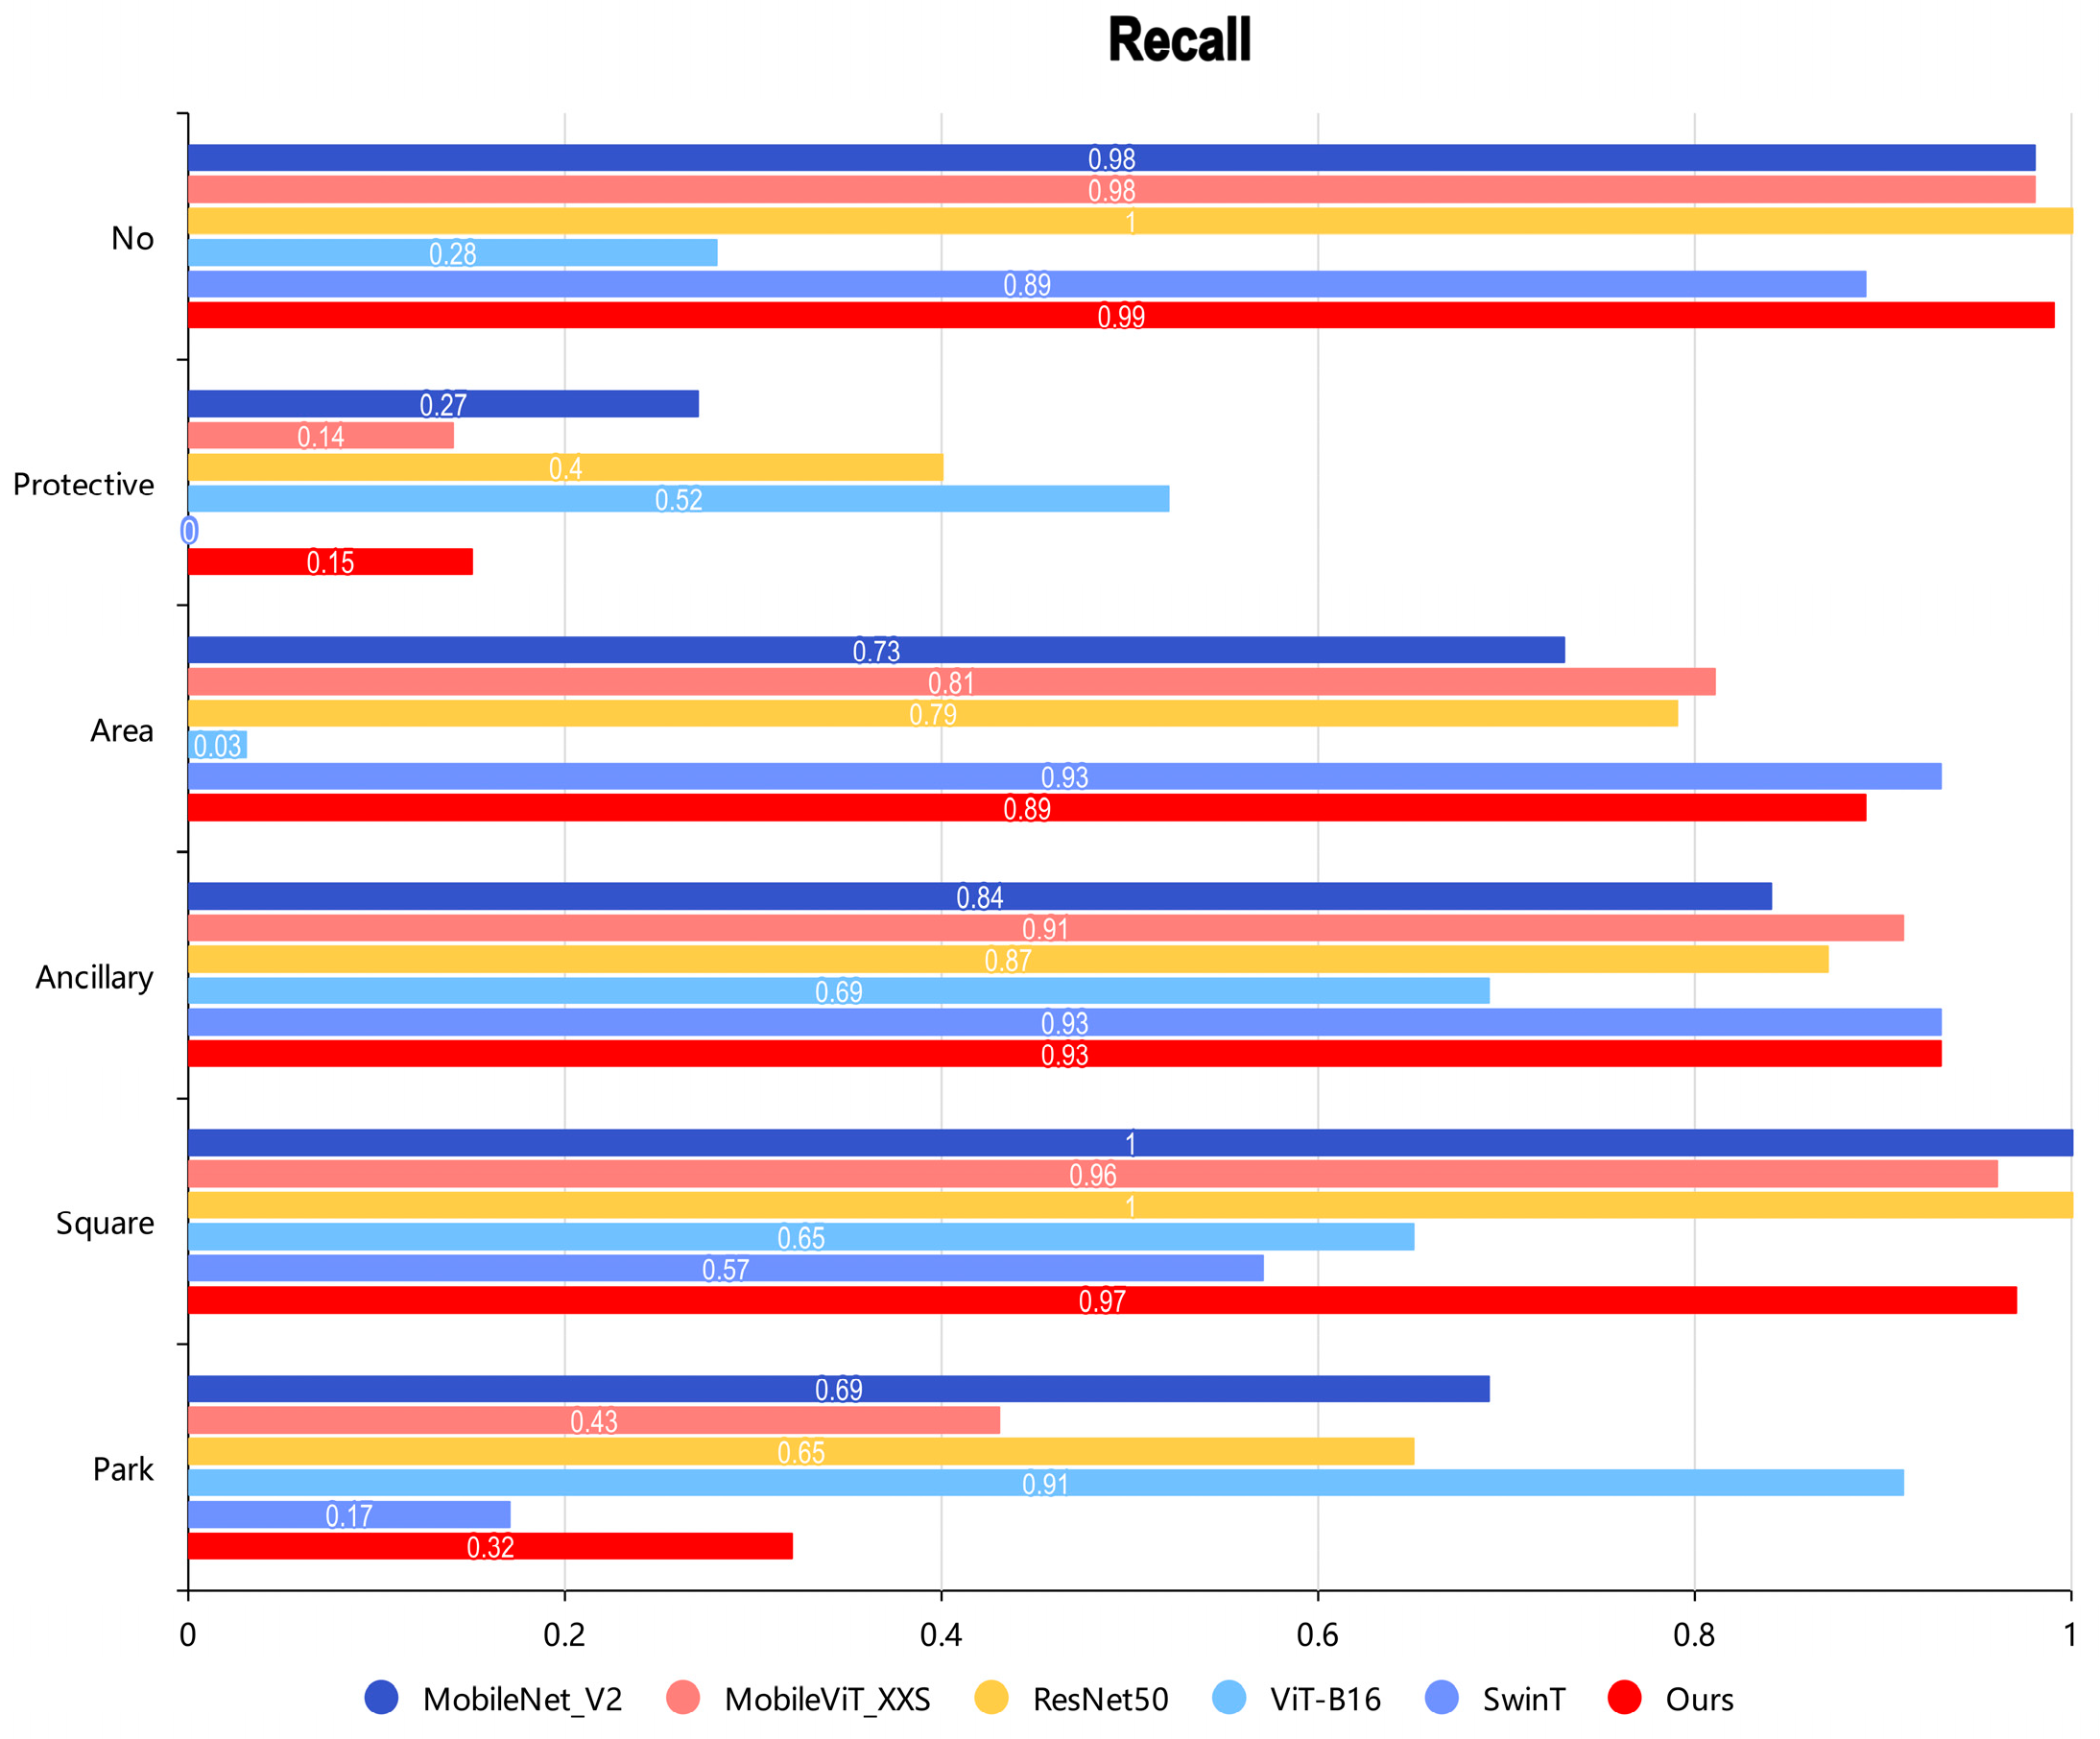
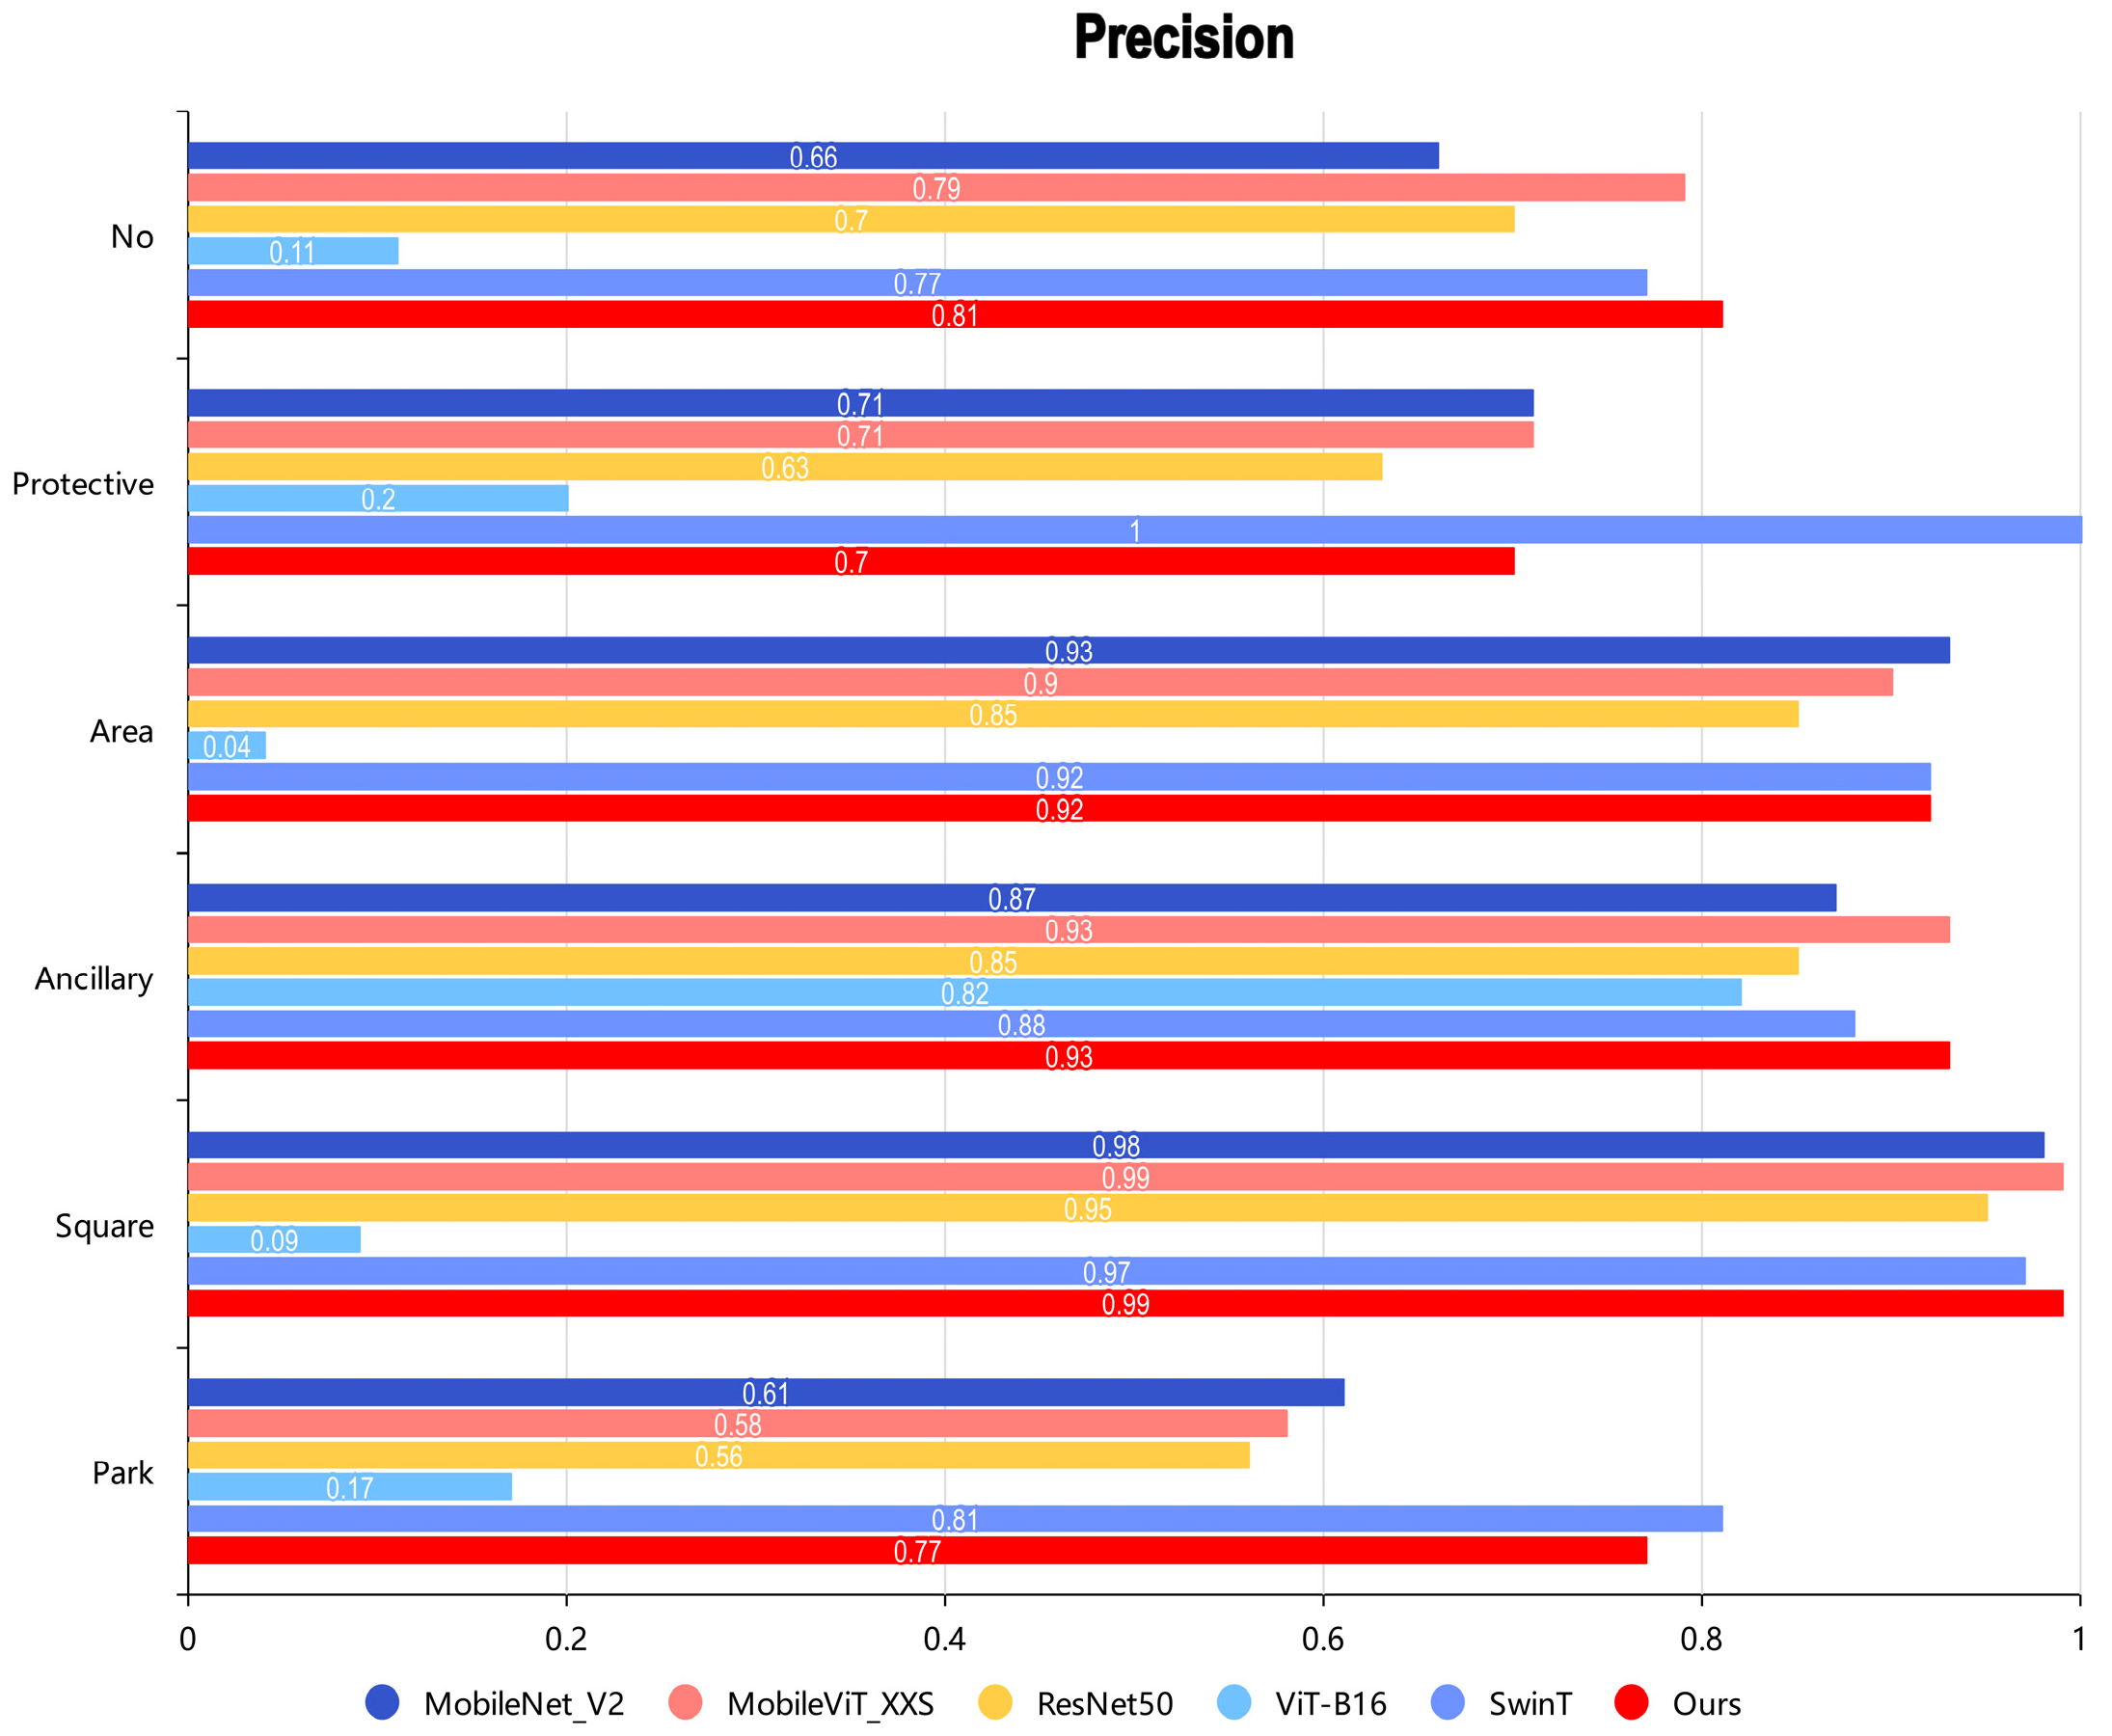
4.2. Classification Performance

As demonstrated in Section 3 above, this study utilized a network based on Vision Transformer (ViT) or convolutional neural networks (CNNs) as our feature extraction network. To ascertain which network is better suited for image recognition of five categories of urban green space, we tested various feature extraction networks, including ResNet, MobileNet, Vision Transformer, Swin Transformer, and MobileViT. Considering the practical requirements and device limitations in classifying urban green spaces, we also used FLOPs and parameters as the evaluation metrics; thus, this research aimed for the model to achieve optimal performance metrics while minimizing FLOPs and parameters, enabling autonomous operation on mobile devices. To this end, the study utilized the THOP library to compute the FLOPs and parameters of each model, with the comprehensive results displayed in Table 3.
As indicated in Table 3, aside from ViT-B16, other models demonstrated favorable performances across various metrics. Taken together, the performance of MobileViT_XXS in the three evaluation indicators was the best. Furthermore, as shown in Table 3, MobileViT_XXS exhibited the lowest FLOPs and parameters compared to other models, making it more suitable for practical application in this study. Consequently, this paper adopted MobileViT_XXS as the baseline for subsequent experiments.
In this study, multi-label confusion matrix heatmaps were generated from predicted labels of ResNet50, MobileNet-V2, ViT-B16, Swin-T, MobileViT_XXS, the proposed model in this paper, and the true labels on the test set. The confusion matrix heatmap for our proposed model showed a closer match to the multi-label confusion matrix heatmap of the true labels, in contrast to other models, as shown in Figure 7. This indicates that the presented framework effectively predicted the interrelationships among different labels, thus substantiating the beneficial impact of the LSTM module on this research.
The visualization heatmaps of the confusion matrix revealed that the introduction of the LSTM module captured semantic dependencies among labels, thereby enhancing label prediction capabilities. To prove that the incorporation of the Triplet Attention module can enhance the performance of different target classifications while maintaining the model’s lightweight characteristics and to prove that the concurrent integration of both the LSTM and Triplet Attention modules further enhances model performance, ablation experiments were carried out on the model. The results indicated significant enhancements in model performance with the individual and combined introductions of the LSTM and Triplet Attention modules, compared to the original model, as depicted in Table 4. Improvements of 1.64%, 3.25%, 3.67%, and 2.71% were observed in mAP, F1, precision, and recall. The shown results show that our methodology works in considerably enhancing multi-label classification performance in urban green spaces.
Our model was compared with other models (ResNet50, MobileNet-V2, and MobileViT_XXS) of F1, precision, and recall scores on the test dataset, as illustrated in Figure 8, Figure 9 and Figure 10. Considering the protective green space’s rarity in the dataset, as well as the high similarity to the ancillary green space, likewise, the park green space was often visually confused with other types of green space; all models demonstrated lower recall scores for these two categories, as shown in Figure 7, while our model achieved higher scores across the other four categories of green space. Additionally, as shown in Figure 8 and Figure 9, our model also performed well with regard to precision and F1 scores. Moreover, the distribution of scores across labels in our model fit the labels’ frequency distribution in the dataset. In the dataset, categories with a higher volume of data gave the model more features to learn so that it could generate better results. Therefore, the experimental results presented in this paper are reasonable and highlight the significant impacts of sample variability and label imbalance on multi-label classification.
Figure 11 presents the training loss and mAP curves of our model over 100 training epochs. As the training epochs increased, there was a corresponding decrease in loss values and an increase in mAP values. It was evident that, compared to other models, our model exhibited less fluctuation in its loss curve and converged more rapidly, suggesting superior model fitting. The mAP curves revealed a similar trend among all models, while we obtained the highest mAP score with our model upon convergence. The comparative analysis in the two graphs demonstrated that our model outperformed others in terms of classification performance.
The mAP curves for both the training and testing datasets of our model for 100 epochs are illustrated in Figure 12. With the progression of training time, there was a steady increase in the mAP values for both datasets until convergence was reached. Notably, the mAP scores for the testing set did not significantly decline relative to those of the training set, indicating that overfitting did not occur in our model.

5. Discussion

Compared to existing studies, this research refined the classification of urban green spaces into five categories based on the “Urban Green Space Classification Standards”. Liu et al. [43] classified urban green spaces into grasslands, forests, and agricultural land based on natural attributes, and Xu et al. [44]., utilizing HRNet with feature engineering, divided urban green spaces into deciduous trees, evergreen trees, and grasslands. Our study, however, classified urban green spaces according to their social attributes, categorizing them into five distinct types. In contrast to Huang et al.’s research, which used manual intervention for detailed classification after automated extraction, this study achieved automated and intelligent detailed classification of urban green spaces through straight deep learning. To address the need for improved classification accuracy, this study proposed a model based on MobileViT combined with the LSTM module and the Triple Attention module for the detailed classification of high-resolution remote sensing images of urban green spaces. The UGS dataset was constructed, and ablation experiments were conducted to validate the effectiveness of each module in the model. Additionally, comparative experiments with ResNet, MobileNet, Vision Transformer, Swin Transformer, and MobileViT were performed, demonstrating the robustness of our proposed model.
Beyond validating the efficacy of our proposed model, further predictive experiments were conducted to better demonstrate the model’s classification performance. To verify the model’s real performance, nine representative images from the UGS dataset were selected, including three images with single-class labels, three with two-class labels, and three with three or more class labels, to showcase the model’s classification capabilities. The results indicated that in Figure 13, with single- and two-class labels, the model correctly predicted all categories. However, in images with three or more class labels, some discrepancies occurred, such as failing to identify area green spaces in image (g). In the most challenging image (i) with four-class labels, the model only identified square green space and ancillary green space.
The results of all experiments demonstrate the feasibility of using a multi-label classification model for the urban green space refined classification, providing support to urban green space research and even contributing to national urban ecological research. Additionally, there are areas for optimization in the study: given the limited number of rare labels in the dataset, the recognition of rare labels was suboptimal across these experiments. Therefore, a combination of various data augmentation techniques could be employed to enhance data robustness, and further model improvements, such as refining the loss function, could enhance performance. Secondly, the follow-up research can consider the use of the multi-source data fusion strategy, combined with social perception data and the combination of different scales of remote sensing images, in order to enhance the classification of urban green space’s accuracy, as well as efficiency.

6. Conclusions

In this study, a multi-label classification method based on MobileViT is proposed to address the reliance on manual visual interpretation in the traditional detailed classification of urban green spaces. The model integrates the LSTM module and the Triple Attention module. Experimental results on the UGS dataset demonstrate the model’s excellent performance in the detailed classification of urban green spaces. Additionally, the LSTM module uncovers potential dependencies between labels, while the Triple Attention module enhances classification accuracy while maintaining a lightweight model structure.
The focus of future research includes: (1) trying to use a combination of multiple data enhancement operations for data enhancement and to enhance the model’s performance through further optimizing the model, such as improving the loss function and optimizing the model structure and (2) considering the use of multi-source data fusion, combining social perception data and combining different scales of remote sensing imagery of urban green spaces to carry out the study on the refinement of the classification of urban green spaces.

Author Contributions

Conceptualization, Yan Guo and Fujiang Liu; methodology, Dexiong Zhang and Weihua Lin; validation, Qiuyan Hou, Tianqi Wu, and Shuo Chen; formal analysis, Weihua Lin and Dexiong Zhang; investigation, Dexiong Zhang and Fujiang Liu; resources, Weihua Lin; data curation, Dexiong Zhang; writing—original draft preparation, Weihua Lin and Dexiong Zhang; writing—review and editing, Weihua Lin and Dexiong Zhang; visualization, Dexiong Zhang; supervision, Yan Guo and Fujiang Liu; project administration, Qiuyan Hou and Shuo Chen; funding acquisition, Weihua Lin and Fujiang Liu. All authors have read and agreed to the published version of the manuscript.

Funding

This research was funded by Metallogenic Patterns and Mineralization Predictions for the Daping gold deposit in Yuanyang County, Yunnan Province, grant number 2022026821; it was supported by the Open Fund of State Key Laboratory of Remote Sensing Science, grant number 6142A01210404 and the Hubei Key Laboratory of Intelligent Geo-Information Processing, grant number KLIGIP-2022-B03.

Data Availability Statement

Restrictions apply to the availability of the UGS data, and the data can be available from the authors.

Acknowledgments

We gratefully acknowledge the support of the School of Computer Science, China University of Geosciences, Wuhan, and the School of Geography and Information Engineering, China University of Geosciences, Wuhan.

Conflicts of Interest

The authors declare no conflict of interest.

References

  1. Wu, J. Landscape sustainability science: Ecosystem services and human well-being in changing landscapes. Landsc. Ecol. 2013, 28, 999–1023. [Google Scholar] [CrossRef]
  2. Lin, L.; Yan, J.; Ma, K.; Zhou, W.; Chen, G.; Tang, R.; Zhang, Y. Characterization of particulate matter deposited on urban tree foliage: A landscape analysis approach. Atmos. Environ. 2017, 171, 59–69. [Google Scholar] [CrossRef]
  3. Jenerette, G.D.; Harlan, S.L.; Buyantuev, A.; Stefanov, W.L.; Declet-Barreto, J.; Ruddell, B.L.; Myint, S.W.; Kaplan, S.; Li, X. Micro-scale urban surface temperatures are related to land-cover features and residential heat related health impacts in Phoenix, AZ USA. Landsc. Ecol. 2016, 31, 745–760. [Google Scholar] [CrossRef]
  4. Yan, J.; Lin, L.; Zhou, W.; Han, L.; Ma, K. Quantifying the characteristics of particulate matters captured by urban plants using an automatic approach. J. Environ. Sci. 2016, 39, 259–267. [Google Scholar] [CrossRef] [PubMed]
  5. Zhou, W.; Wang, J.; Cadenasso, M.L. Effects of the spatial configuration of trees on urban heat mitigation: A comparative study. Remote Sens. Environ. 2017, 195, 1–12. [Google Scholar] [CrossRef]
  6. Li, X.; Kamarianakis, Y.; Ouyang, Y.; Turner, B.L., II; Brazel, A. On the association between land system architecture and land surface temperatures: Evidence from a Desert Metropolis—Phoenix, Arizona, USA. Landsc. Urban Plan. 2017, 163, 107–120. [Google Scholar] [CrossRef]
  7. Adams, M.P.; Smith, P.L. A systematic approach to model the influence of the type and density of vegetation cover on urban heat using remote sensing. Landsc. Urban Plan. 2014, 132, 47–54. [Google Scholar] [CrossRef]
  8. Bowler, D.E.; Buyung-Ali, L.; Knight, T.M.; Pullin, A.S. Urban greening to cool towns and cities: A systematic review of the empirical evidence. Landsc. Urban Plan. 2010, 97, 147–155. [Google Scholar] [CrossRef]
  9. Pathak, V.; Tripathi, B.; Mishra, V. Evaluation of anticipated performance index of some tree species for green belt development to mitigate traffic generated noise. Urban For. Urban Green. 2011, 10, 61–66. [Google Scholar] [CrossRef]
  10. Van Renterghem, T.; Botteldooren, D. Reducing the acoustical façade load from road traffic with green roofs. Build. Environ. 2009, 44, 1081–1087. [Google Scholar] [CrossRef]
  11. Xiao, R.; Zhou, Z.; Wang, P.; Ye, Z.; Guo, E.; Ji, G.C. Application of 3S technologies in urban green space ecology. Chin. J. Ecol. 2004, 23, 71–76. [Google Scholar]
  12. Tu, X.; Huang, G.; Wu, J. Review of the relationship between urban greenspace accessibility and human well-being. Acta Ecol. Sin. 2019, 39, 421–431. [Google Scholar]
  13. Thompson, C.W.; Roe, J.; Aspinall, P.; Mitchell, R.; Clow, A.; Miller, D. More green space is linked to less stress in deprived communities: Evidence from salivary cortisol patterns. Landsc. Urban Plan. 2012, 105, 221–229. [Google Scholar] [CrossRef]
  14. Kaplan, R. The nature of the view from home: Psychological benefits. Environ. Behav. 2001, 33, 507–542. [Google Scholar] [CrossRef]
  15. Maas, J.; Verheij, R.A.; Groenewegen, P.P.; De Vries, S.; Spreeuwenberg, P. Green space, urbanity, and health: How strong is the relation? J. Epidemiol. Community Health 2006, 60, 587–592. [Google Scholar] [CrossRef] [PubMed]
  16. Kuo, F.E.; Sullivan, W.C. Environment and crime in the inner city: Does vegetation reduce crime? Environ. Behav. 2001, 33, 343–367. [Google Scholar] [CrossRef]
  17. Savard, J.-P.L.; Clergeau, P.; Mennechez, G. Biodiversity concepts and urban ecosystems. Landsc. Urban Plan. 2000, 48, 131–142. [Google Scholar] [CrossRef]
  18. Bolund, P.; Hunhammar, S. Ecosystem services in urban areas. Ecol. Econ. 1999, 29, 293–301. [Google Scholar] [CrossRef]
  19. Collins, K.A.; Lawrence, T.J.; Stander, E.K.; Jontos, R.J.; Kaushal, S.S.; Newcomer, T.A.; Grimm, N.B.; Ekberg, M.L.C. Opportunities and challenges for managing nitrogen in urban stormwater: A review and synthesis. Ecol. Eng. 2010, 36, 1507–1519. [Google Scholar] [CrossRef]
  20. Roy, A.H.; Wenger, S.J.; Fletcher, T.D.; Walsh, C.J.; Ladson, A.R.; Shuster, W.D.; Thurston, H.W.; Brown, R.R. Impediments and solutions to sustainable, watershed-scale urban stormwater management: Lessons from Australia and the United States. Environ. Manag. 2008, 42, 344–359. [Google Scholar] [CrossRef]
  21. Barbosa, O.; Tratalos, J.A.; Armsworth, P.R.; Davies, R.G.; Fuller, R.A.; Johnson, P.; Gaston, K.J. Who benefits from access to green space? A case study from Sheffield, UK. Landsc. Urban Plan. 2007, 83, 187–195. [Google Scholar] [CrossRef]
  22. Chen, W.; Huang, H.; Dong, J.; Zhang, Y.; Tian, Y.; Yang, Z. Social functional mapping of urban green space using remote sensing and social sensing data. ISPRS J. Photogramm. Remote Sens. 2018, 146, 436–452. [Google Scholar] [CrossRef]
  23. Zhang, M.-L.; Zhou, Z.-H. A review on multi-label learning algorithms. IEEE Trans. Knowl. Data Eng. 2013, 26, 1819–1837. [Google Scholar] [CrossRef]
  24. Wei, Y.; Xia, W.; Lin, M.; Huang, J.; Ni, B.; Dong, J.; Zhao, Y.; Yan, S. HCP: A flexible CNN framework for multi-label image classification. IEEE Trans. Pattern Anal. Mach. Intell. 2015, 38, 1901–1907. [Google Scholar] [CrossRef] [PubMed]
  25. Tsoumakas, G.; Katakis, I. Multi-label classification: An overview. Int. J. Data Warehous. Min. 2007, 3, 1–13. [Google Scholar] [CrossRef]
  26. Tarekegn, A.N.; Giacobini, M.; Michalak, K. A review of methods for imbalanced multi-label classification. Pattern Recognit. 2021, 118, 107965. [Google Scholar] [CrossRef]
  27. Xiao, X.; Wu, Z.-C.; Chou, K.-C. iLoc-Virus: A multi-label learning classifier for identifying the subcellular localization of virus proteins with both single and multiple sites. J. Theor. Biol. 2011, 284, 42–51. [Google Scholar] [CrossRef] [PubMed]
  28. Lin, W.-Z.; Fang, J.-A.; Xiao, X.; Chou, K.-C. iLoc-Animal: A multi-label learning classifier for predicting subcellular localization of animal proteins. Mol. BioSystems 2013, 9, 634–644. [Google Scholar] [CrossRef]
  29. Salvatore, C.; Castiglioni, I. A wrapped multi-label classifier for the automatic diagnosis and prognosis of Alzheimer’s disease. J. Neurosci. Methods 2018, 302, 58–65. [Google Scholar] [CrossRef]
  30. Shao, Z.; Zhou, W.; Deng, X.; Zhang, M.; Cheng, Q. Multilabel remote sensing image retrieval based on fully convolutional network. IEEE J. Sel. Top. Appl. Earth Obs. Remote Sens. 2020, 13, 318–328. [Google Scholar] [CrossRef]
  31. Wang, J. Deep Learning-Based Lightweighting and Fusion of Label Information for Lung Disease Recognition Study. Master’s Thesis, Dalian Ocean University, Dalian, China, 2024. [Google Scholar]
  32. Wang, Y. Deep Learning Based Small Sample Classification and Multi-Label Classification of All-Sky Auroral Images. Master’s Thesis, Shaanxi Normal University, Xi’an, China, 2022. [Google Scholar]
  33. Mehta, S.; Rastegari, M. Mobilevit: Light-weight, general-purpose, and mobile-friendly vision transformer. arXiv 2021, arXiv:2110.02178. [Google Scholar]
  34. Graves, A. Long short-term memory. In Supervised Sequence Labelling with Recurrent Neural Networks; Springer: Berlin/Heidelberg, Germany, 2012; pp. 37–45. [Google Scholar]
  35. Misra, D.; Nalamada, T.; Arasanipalai, A.U.; Hou, Q. Rotate to attend: Convolutional triplet attention module. In Proceedings of the IEEE/CVF Winter Conference on Applications of Computer Vision, Virtual, 5–9 January 2021; pp. 3139–3148. [Google Scholar]
  36. He, K.; Zhang, X.; Ren, S.; Sun, J. Deep residual learning for image recognition. In Proceedings of the IEEE Conference on Computer Vision and Pattern Recognition, Las Vegas, NV, USA, 27–30 June 2016; pp. 770–778. [Google Scholar]
  37. Sandler, M.; Howard, A.; Zhu, M.; Zhmoginov, A.; Chen, L.-C. Mobilenetv2: Inverted residuals and linear bottlenecks. In Proceedings of the IEEE Conference on Computer Vision and Pattern Recognition, Salt Lake City, UT, USA, 18–23 June 2018; pp. 4510–4520. [Google Scholar]
  38. Dosovitskiy, A.; Beyer, L.; Kolesnikov, A.; Weissenborn, D.; Zhai, X.; Unterthiner, T.; Dehghani, M.; Minderer, M.; Heigold, G.; Gelly, S.; et al. An image is worth 16 × 16 words: Transformers for image recognition at scale. arXiv 2020, arXiv:2010.11929. [Google Scholar]
  39. Liu, Z.; Lin, Y.; Cao, Y.; Hu, H.; Wei, Y.; Zhang, Z.; Lin, S.; Guo, B. Swin transformer: Hierarchical vision transformer using shifted windows. In Proceedings of the IEEE/CVF International Conference on Computer Vision, Montreal, BC, Canada, 11–17 October 2021; pp. 10012–10022. [Google Scholar]
  40. Hu, J.; Shen, L.; Sun, G. Squeeze-and-excitation networks. In Proceedings of the IEEE Conference on Computer Vision and Pattern Recognition, Salt Lake City, UT, USA, 18–23 June 2018; pp. 7132–7141. [Google Scholar]
  41. Woo, S.; Park, J.; Lee, J.-Y.; Kweon, I.S. Cbam: Convolutional block attention module. In Proceedings of the European Conference on Computer Vision (ECCV), Munich, Germany, 8–14 September 2018; pp. 3–19. [Google Scholar]
  42. Zhang, Q.-L.; Yang, Y.-B. Sa-net: Shuffle attention for deep convolutional neural networks. In Proceedings of the ICASSP 2021-2021 IEEE International Conference on Acoustics, Speech and Signal Processing (ICASSP), Toronto, ON, Canada, 6–11 June 2021; pp. 2235–2239. [Google Scholar]
  43. Liu, W.; Yue, A.; Shi, W.; Ji, J.; Deng, R. An automatic extraction architecture of urban green space based on DeepLabv3plus semantic segmentation model. In Proceedings of the 2019 IEEE 4th International Conference on Image, Vision and Computing (ICIVC), Xiamen, China, 5–7 July 2019; pp. 311–315. [Google Scholar]
  44. Xu, Z.; Zhou, Y.; Wang, S.; Wang, L.; Li, F.; Wang, S.; Wang, Z. A novel intelligent classification method for urban green space based on high-resolution remote sensing images. Remote Sens. 2020, 12, 3845. [Google Scholar] [CrossRef]
Figure 1. Some sample images from the dataset.
Ijgi 13 00252 g001
Figure 2. Heat map of the confusion matrix between different labels.
Ijgi 13 00252 g002
Figure 3. The structure of our model.
Ijgi 13 00252 g003
Figure 4. MoblieViT block.
Ijgi 13 00252 g004
Figure 5. The illustration of the Triplet Attention module.
Ijgi 13 00252 g005
Figure 6. The illustration of the LSTM module.
Ijgi 13 00252 g006
Figure 7. Heatmaps of the confusion matrix for different models in this paper.
Ijgi 13 00252 g007
Figure 8. F1 scores for each class of model in the test set.
Ijgi 13 00252 g008
Figure 9. Recall scores for each class of model in the test set.
Ijgi 13 00252 g009
Figure 10. Precision scores for each class of model in the test set.
Ijgi 13 00252 g010
Figure 11. (Left): The training loss curves for each model; (Right): the training mAP curves for each model.
Ijgi 13 00252 g011
Figure 12. mAP curves on the train set and test set.
Ijgi 13 00252 g012
Figure 13. Predictions for some images on the test set. Blue labels represent unidentified.
Ijgi 13 00252 g013
Table 1. Quantity of green spaces present in a picture and the quantity of images of this type.
Quantity of Green Spaces in an ImageQuantity of This Kind of Picture
15405
22143
3460
426
Total8034
Table 2. Names of green spaces and the quantity of labels for each green space.
Green SpaceQuantities
Ancillary 6349
Park 1025
Square 918
Protective 824
Area 1426
No 633
Total11,175
Table 3. Different models’ evaluations in the UGS dataset.
ModelmAP (%)F1 (%)Precision (%)Recall (%)FLOPs (M)Parameters (M)
ResNet5090.6279.7181.0682.245398.5525.56
MobileNet-V289.8778.0681.4677.85427.353.50
ViT-B1654.0628.6122.4145.7721,999.7186.42
Swin-T91.1280.1586.3878.937110.0328.27
MobileViT_XXS92.5182.5687.9180.85350.341.01
Table 4. The results of ablation experiments.
ModelmAP (%)F1 (%)Precision (%)Recall (%)
MobileViT92.5182.5687.9180.85
MobileViT + Triplet Attention92.7482.7688.2081.26
MobileViT + LSTM93.7785.3290.4583.49
MobileViT + LSTM + Triplet Attention94.1585.8191.5883.56
Disclaimer/Publisher’s Note: The statements, opinions and data contained in all publications are solely those of the individual author(s) and contributor(s) and not of MDPI and/or the editor(s). MDPI and/or the editor(s) disclaim responsibility for any injury to people or property resulting from any ideas, methods, instructions or products referred to in the content.

