Review

Bibliometric Analysis on the Research of Geoscience Knowledge Graph (GeoKG) from 2012 to 2023

1
Guangzhou Institute of Geography, Guangdong Academy of Sciences, Guangzhou 510070, China
2
Southern Marine Science and Engineering Guangdong Laboratory (Guangzhou), Guangzhou 511485, China
*
Author to whom correspondence should be addressed.
ISPRS Int. J. Geo-Inf. 2024, 13(7), 255; https://doi.org/10.3390/ijgi13070255
Submission received: 11 June 2024 / Revised: 13 July 2024 / Accepted: 15 July 2024 / Published: 16 July 2024

Abstract

:
The geoscience knowledge graph (GeoKG) has gained worldwide attention due to its ability in the formal representation of spatiotemporal features and relationships of geoscience knowledge. Currently, a quantitative review of the state and trends in GeoKG is still scarce. Thus, a bibliometric analysis was performed in this study to fill the gap. Specifically, based on 294 research articles published from 2012 to 2023, we conducted analyses in terms of the (1) trends in publications and citations; (2) identification of the major papers, sources, researchers, institutions, and countries; (3) scientific collaboration analysis; and (4) detection of major research topics and tendencies. The results revealed that the interest in GeoKG research has rapidly increased after 2019 and is continually expanding. China is the most productive country in this field. Co-authorship analysis shows that inter-national and inter-institutional collaboration should be reinforced. Keyword analysis indicated that geoscience knowledge representation, information extraction, GeoKG construction, and GeoKG-based multi-source data integration were current hotspots. In addition, several important but currently neglected issues, such as the integration of Large Language Models, are highlighted. The findings of this review provide a systematic overview of the development of GeoKG and provide a valuable reference for future research.

Graphical Abstract

1. Introduction

Geoscience knowledge graph (GeoKG), also known as geographic KG or spatial-temporal KG, has been receiving increasing attention from both academia and industry in recent years. Just like general KGs, GeoKG is a graph-structured representation of human knowledge, where nodes represent entities and the edges of the graph represent relationships between those entities [1]. It is effective in organizing knowledge into machine-understandable and computable semantic networks so that the knowledge can be processed efficiently and unambiguously by machines. Differing from general KGs, GeoKG is a geoscience domain-specific KG and has excellent capability in representing the unique spatiotemporal features and relationships of geoscience knowledge [2,3,4,5]. GeoKG is playing an increasingly important role in the discovery, mining, sharing, and service of geoscience knowledge and spatial data on the Web [5,6,7,8]. Moreover, GeoKGs are at the core of geospatial artificial intelligence (GeoAI), which is an interdisciplinary field combining geography, spatial data science, and AI, and seeks to solve major geospatial problems by developing intelligent geographic methods and applications [9,10,11]. It can be used to foster not only scientific research, such as the formal representation and sharing of geoscience knowledge and data-driven discoveries in deep-time Earth [6], but also many practical problems such as points-of-interest (POI) recommendation [12], geographical question answering [13], geospatial big data integration, intelligent environmental geo-services, and interactive analysis of epidemic situations [14]. Given its diverse application scenarios and immense potential, the number of GeoKG-related publications has been surging in the last decade, signifying the thriving growth and progress of this field. Therefore, a comprehensive review of GeoKG research is greatly needed so that researchers can understand the state-of-the-art and identify the gaps in the field. To date, several review articles concerning GeoKG have been published, focusing on either the historic development of the field [5,15] or specific aspects of GeoKG research, e.g., knowledge acquisition [16,17] and GeoKG construction [8,18]. While existing reviews are insightful and helpful in understanding GeoKG research, they do not provide a quantitative perspective of the whole field. They were typically based on qualitative analyses, limited not only by the small number of analyzed publications, but also by a heavy reliance on the personal knowledge and judgment of the reviewers.
Therefore, in this paper, a bibliometric analysis was performed to explore current research performance and future development trends in GeoKG from a quantitative perspective, over the period 2012–2023, based on the Web of Science Core Collection (WoSCC) database. Bibliometric analysis is a powerful method for exploring and analyzing large volumes of scientific literature in a certain field by using quantitative and statistical techniques [19,20]. It provides a quantitative and objective understanding of the current status and trends in the whole field [19]. Furthermore, it presents a comprehensive overview of the knowledge structures of the field, including the intellectual structure, conceptual structure, and social structure, in terms of impactful authors, publications, sources, institutions, and countries [21,22]. Bibliometric analysis methods have now been widely used in a variety of scientific fields, such as geographical information systems [23] and KG [24,25]. In the field of GeoKG, although some bibliometric reviews have already been conducted on specific sub-topics, e.g., geo-ontology [26], studies concerning the research status and trends in the whole field are still scarce.
The purpose of this study is to provide valuable and practical references for researchers and practitioners in the GeoKG field. The following questions are used to guide the research: (1) What is the publication growth trend in GeoKG research? What are the possible causes? (2) Which publications have had the most significant impact on GeoKG research? What topics have they discussed? (3) What were the most prominent research areas and sources where articles were published? (4) Who were the leading authors, and what were the most prolific institutions and countries? (5) What were the scientific collaborations between major authors, countries, and institutions? What should we do next to enhance the collaborations? (6) What were the primary research topics in the field, and which topics remain underexplored?

2. Materials and Methods

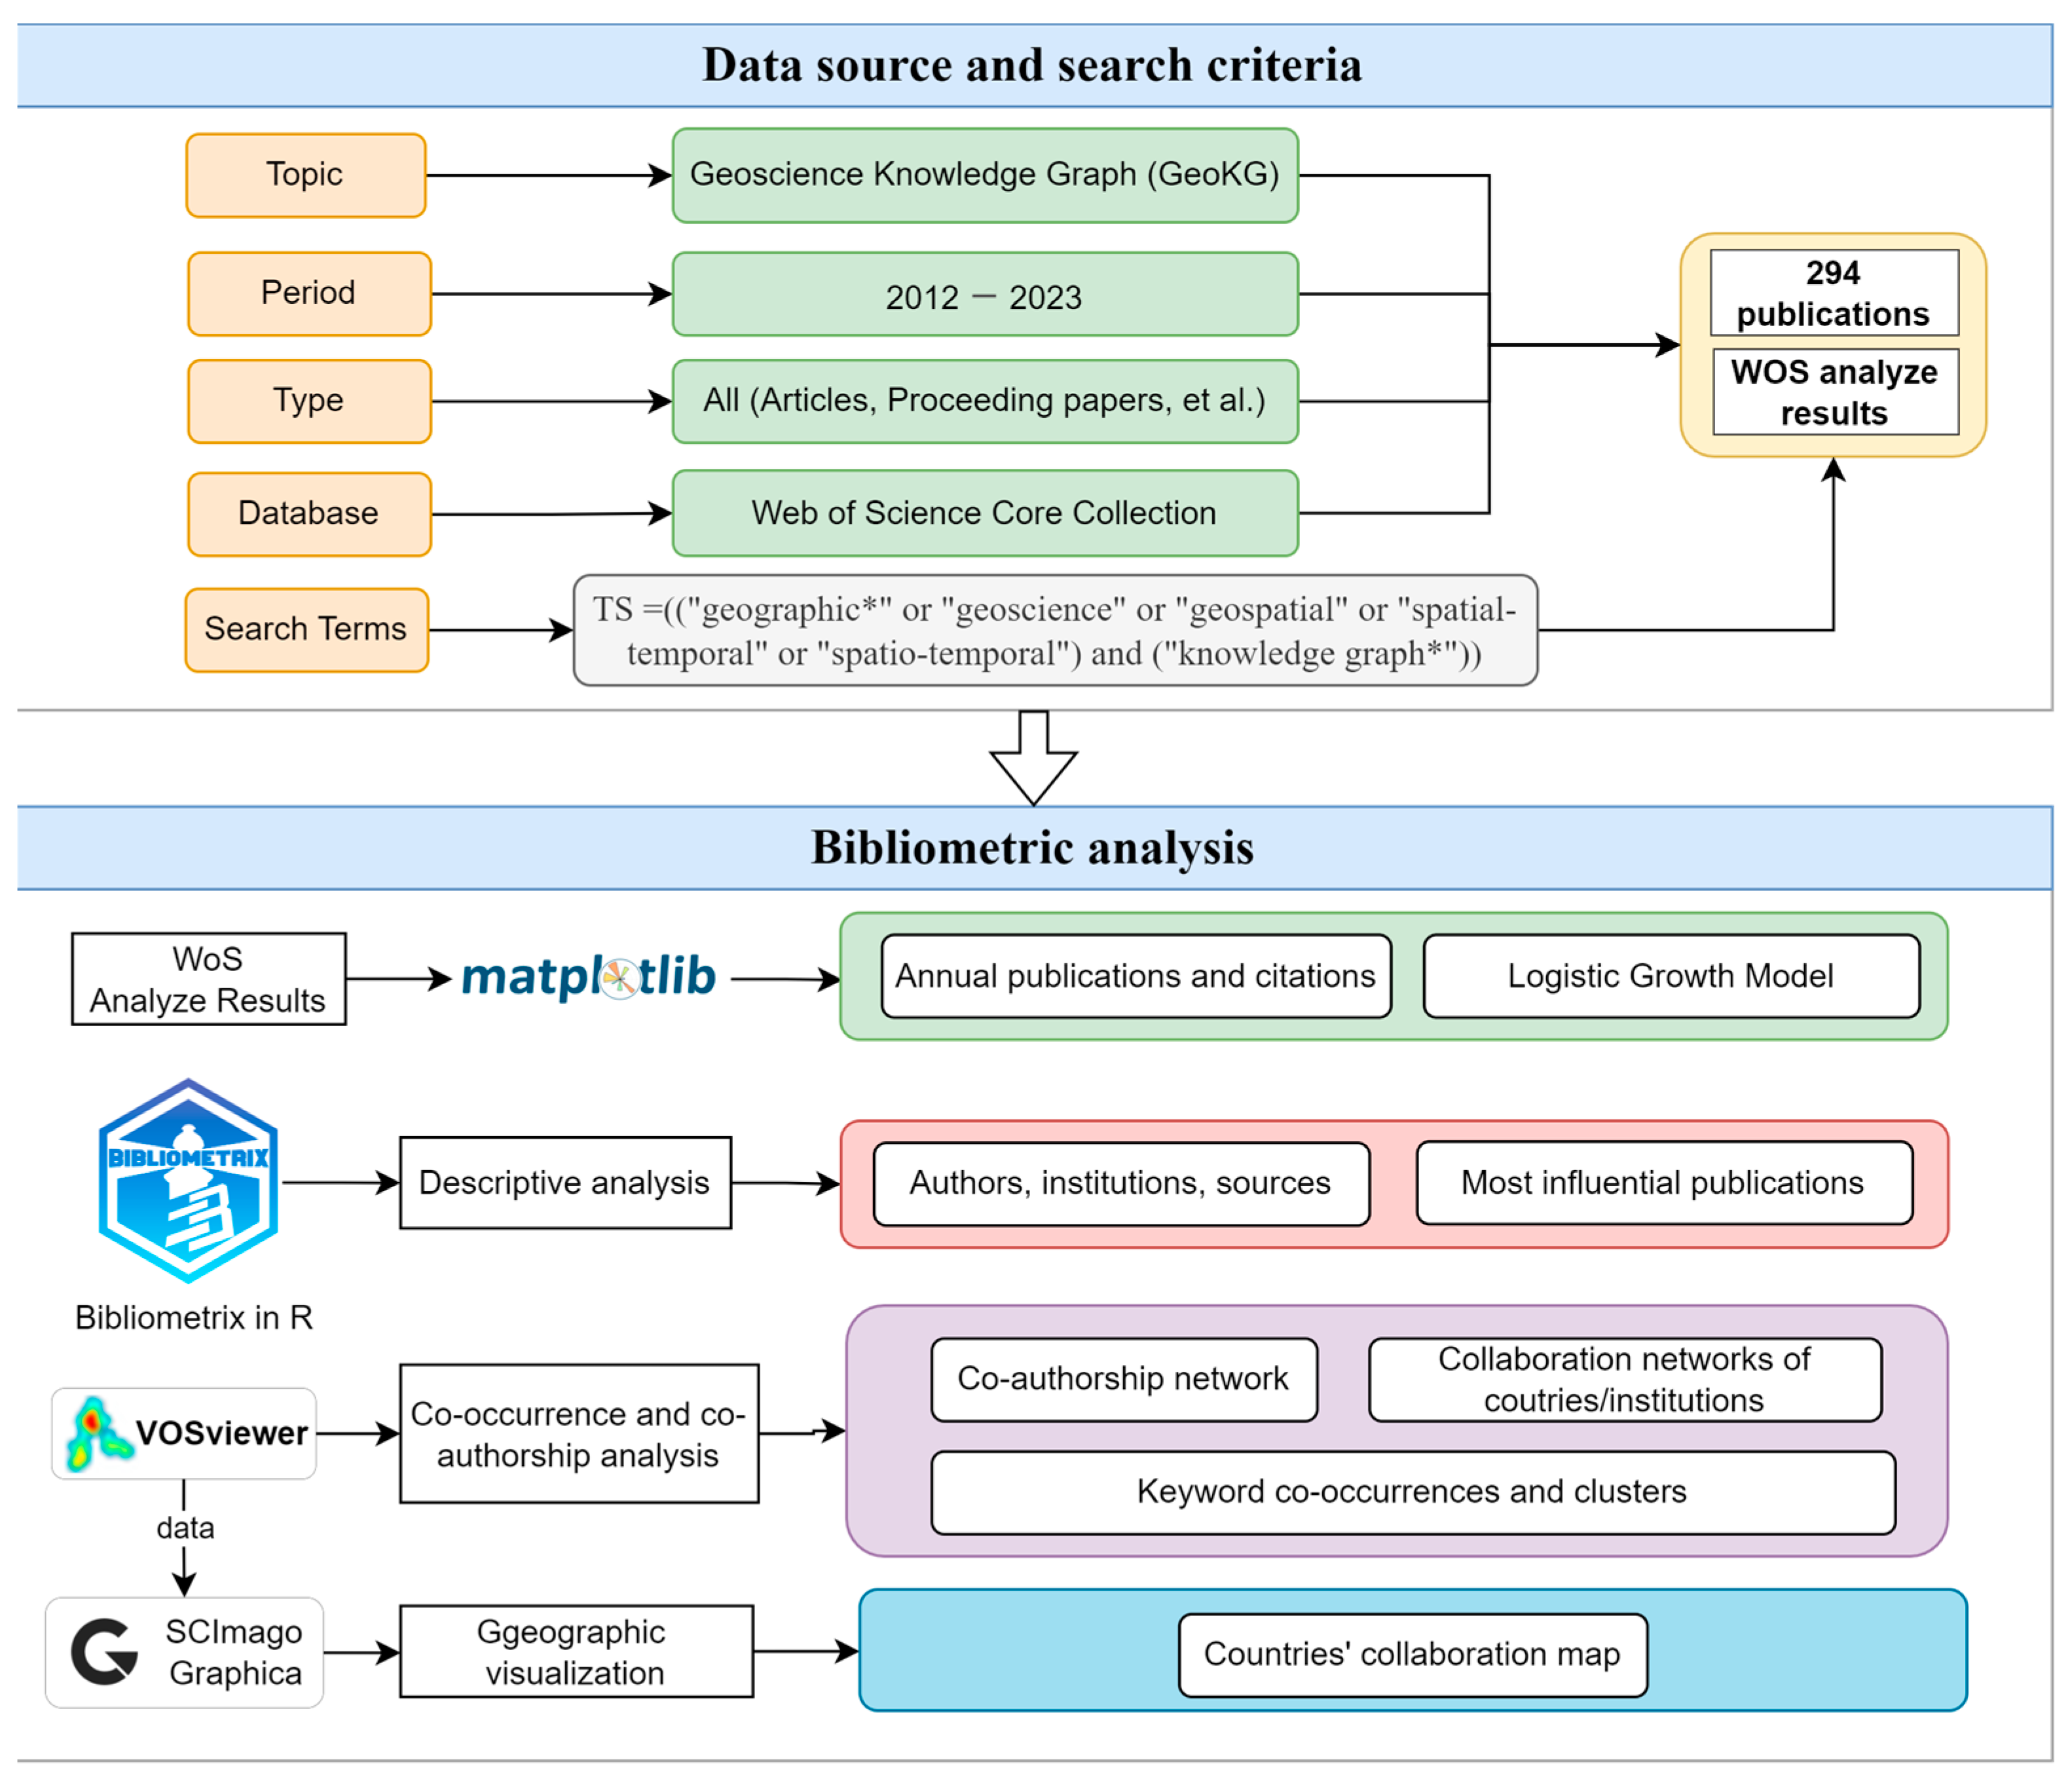
2.1. Research Framework and Data Source

The overall framework of this review that describes all of the analysis processes and contents, including the data sources and search terms, as well as bibliometric analysis methods, is shown in Figure 1. Detailed descriptions of each part are elaborated in the following sub-sections.
The scientific literature used for analysis was collected from the WoSCC database. WoSCC was chosen as the data source for the following two reasons. First, it is one of the world’s leading citation databases and is widely used in bibliometric studies [27]. Second, it includes detailed and high-quality bibliographic records about publications from thousands of high-impact journals worldwide, making it possible to trace the progress and identify the trend in the research on GeoKG.

2.2. Search Criteria and Justifications of Search Terms

In this review, we searched the academic literature information in WoSCC using the following terms on 8 March 2024: TS = ((“geographic*” OR “geoscience*” OR “geospatial*” OR “spatial–temporal*” OR “spatio-temporal*” OR “spatiotemporal*”) AND (“knowledge graph*”)). The asterisk (*) represents any group of characters, including no character. The term “knowledge graph” was first introduced by Google in 2012. Thus, the time was from 2012 to 2023 in this study. Moreover, the document type was selected as “all document types”, including articles, proceeding papers, and reviews, et al. A total of 294 publications were collected and processed for analysis based on the selection criteria. The analysis results of these collected publications generated using Web of Science (WoS) were downloaded for this review as well.
This study defines the keywords for search based on the investigation of search results and data analysis results, the synonyms, the comparison of results using different search terms, as well as by referring to already published articles and reviews, e.g., [5,24]. The keywords “geoscience *” and ‘‘knowledge graph*” were originally included, since they are the most relevant terms to the topic of this study, i.e., GeoKG. We then extended the keyword list by considering more terms such as “geographic*” and “geospatial”, which have been widely used in peer-reviewed articles, e.g., [28,29]. The keywords “spatial–temporal”, “spatio-temporal”, and “spatiotemporal” were added into the list for similar reasons.
It is worth noting that this study has excluded the term “ontolog*” (matches ontology and ontologies) from the data search. The reasons are twofold. First, the investigation conducted by Chen, et al. [24] showed that adopting only the term ‘‘knowledge graph*” is reasonable. Second, we conducted data searches using an extended list containing the term “ontolog*” and obtained a total of 1875 publications. Preliminary examinations of the publications indicated that the results were undesirable, as they involved too much noise. For example, many highly cited articles within the results, such as [30] (442 citations) and [31] (263 citations), have employed the philosophical definition of ontology instead of that in the field of computer science.

2.3. Methods of Analysis

Collected citation data were further analyzed using Python and two bibliometric mapping tools, i.e., the bibliometrix R-package 4.1.3 [32] and VOSviewer 1.6.20, as depicted in Figure 1. Several Python 3.9 libraries including Matplotlib 3.8.0 and SciPy 1.11.4 were used to fit and visualize the annual publications, citations, and the Logistic Growth Model. The bibliometrix R-package was used to perform (1) a descriptive analysis of the publications, authors, sources, institutions, and countries/regions; and (2) network analysis of keywords to generate the thematic map. Particularly, the local citation score (LCS) and global citation score (GCS) are used as primary indicators to assess the impact of publications. LCS represents the number of citations a document received from other documents included in the dataset collected for this study, while GCS refers to the total citations a document received in the whole bibliographic database [33], i.e., the WoSCC in this study. Thus, LCS and GCS could be used to reveal the important documents in the specific research field and the documents that attracted multidisciplinary attention.
VOSviewer is a frequently used science mapping tool for analyzing bibliometric networks. It was used in this study for constructing and visualizing the co-authorships between various contributors (authors, institutions, and countries), the co-occurrences of keywords, and the co-citation analysis of publications. Co-authorship analysis is a frequently used way to identify the scientific collaborations among scholars (including their affiliations and countries) in a specific research field at the intellectual or social level [19]. The information provided by the co-authorship network is helpful for individual researchers, policy-makers, and funding agencies. This is because scientific collaboration holds a pivotal guiding role in promoting the dissemination of knowledge and enhancing academic communication. It significantly contributes to the advancement of scientific discovery and the strengthening of the global academic community. The co-occurrences of keywords appearing in the literature can effectively reflect the heat of the topic corresponding to the keywords in a field. Therefore, scholars use co-occurrence analysis of keywords in the literature to analyze the change trajectory of research hotspots and reveal the emerging trends and frontiers in a specific field [19,34]. The keywords frequently used in bibliometric analysis include both author keywords (i.e., keywords given by authors), keywords plus that are generated from cited article titles by algorithms in the WoS platform, and terms extracted from the title and abstract of articles. The combination of multiple types of keywords can offer a more comprehensive understanding of the research hotspots and trends in a given field [35].
Specifically, the geographic visualization of countries’ collaboration was conducted using SCImago Graphica 1.0.39, a free and easy-to-use visualization tool, based on the data exported from bibliometrix R-package and VOSviewer.

3. Results and Discussion

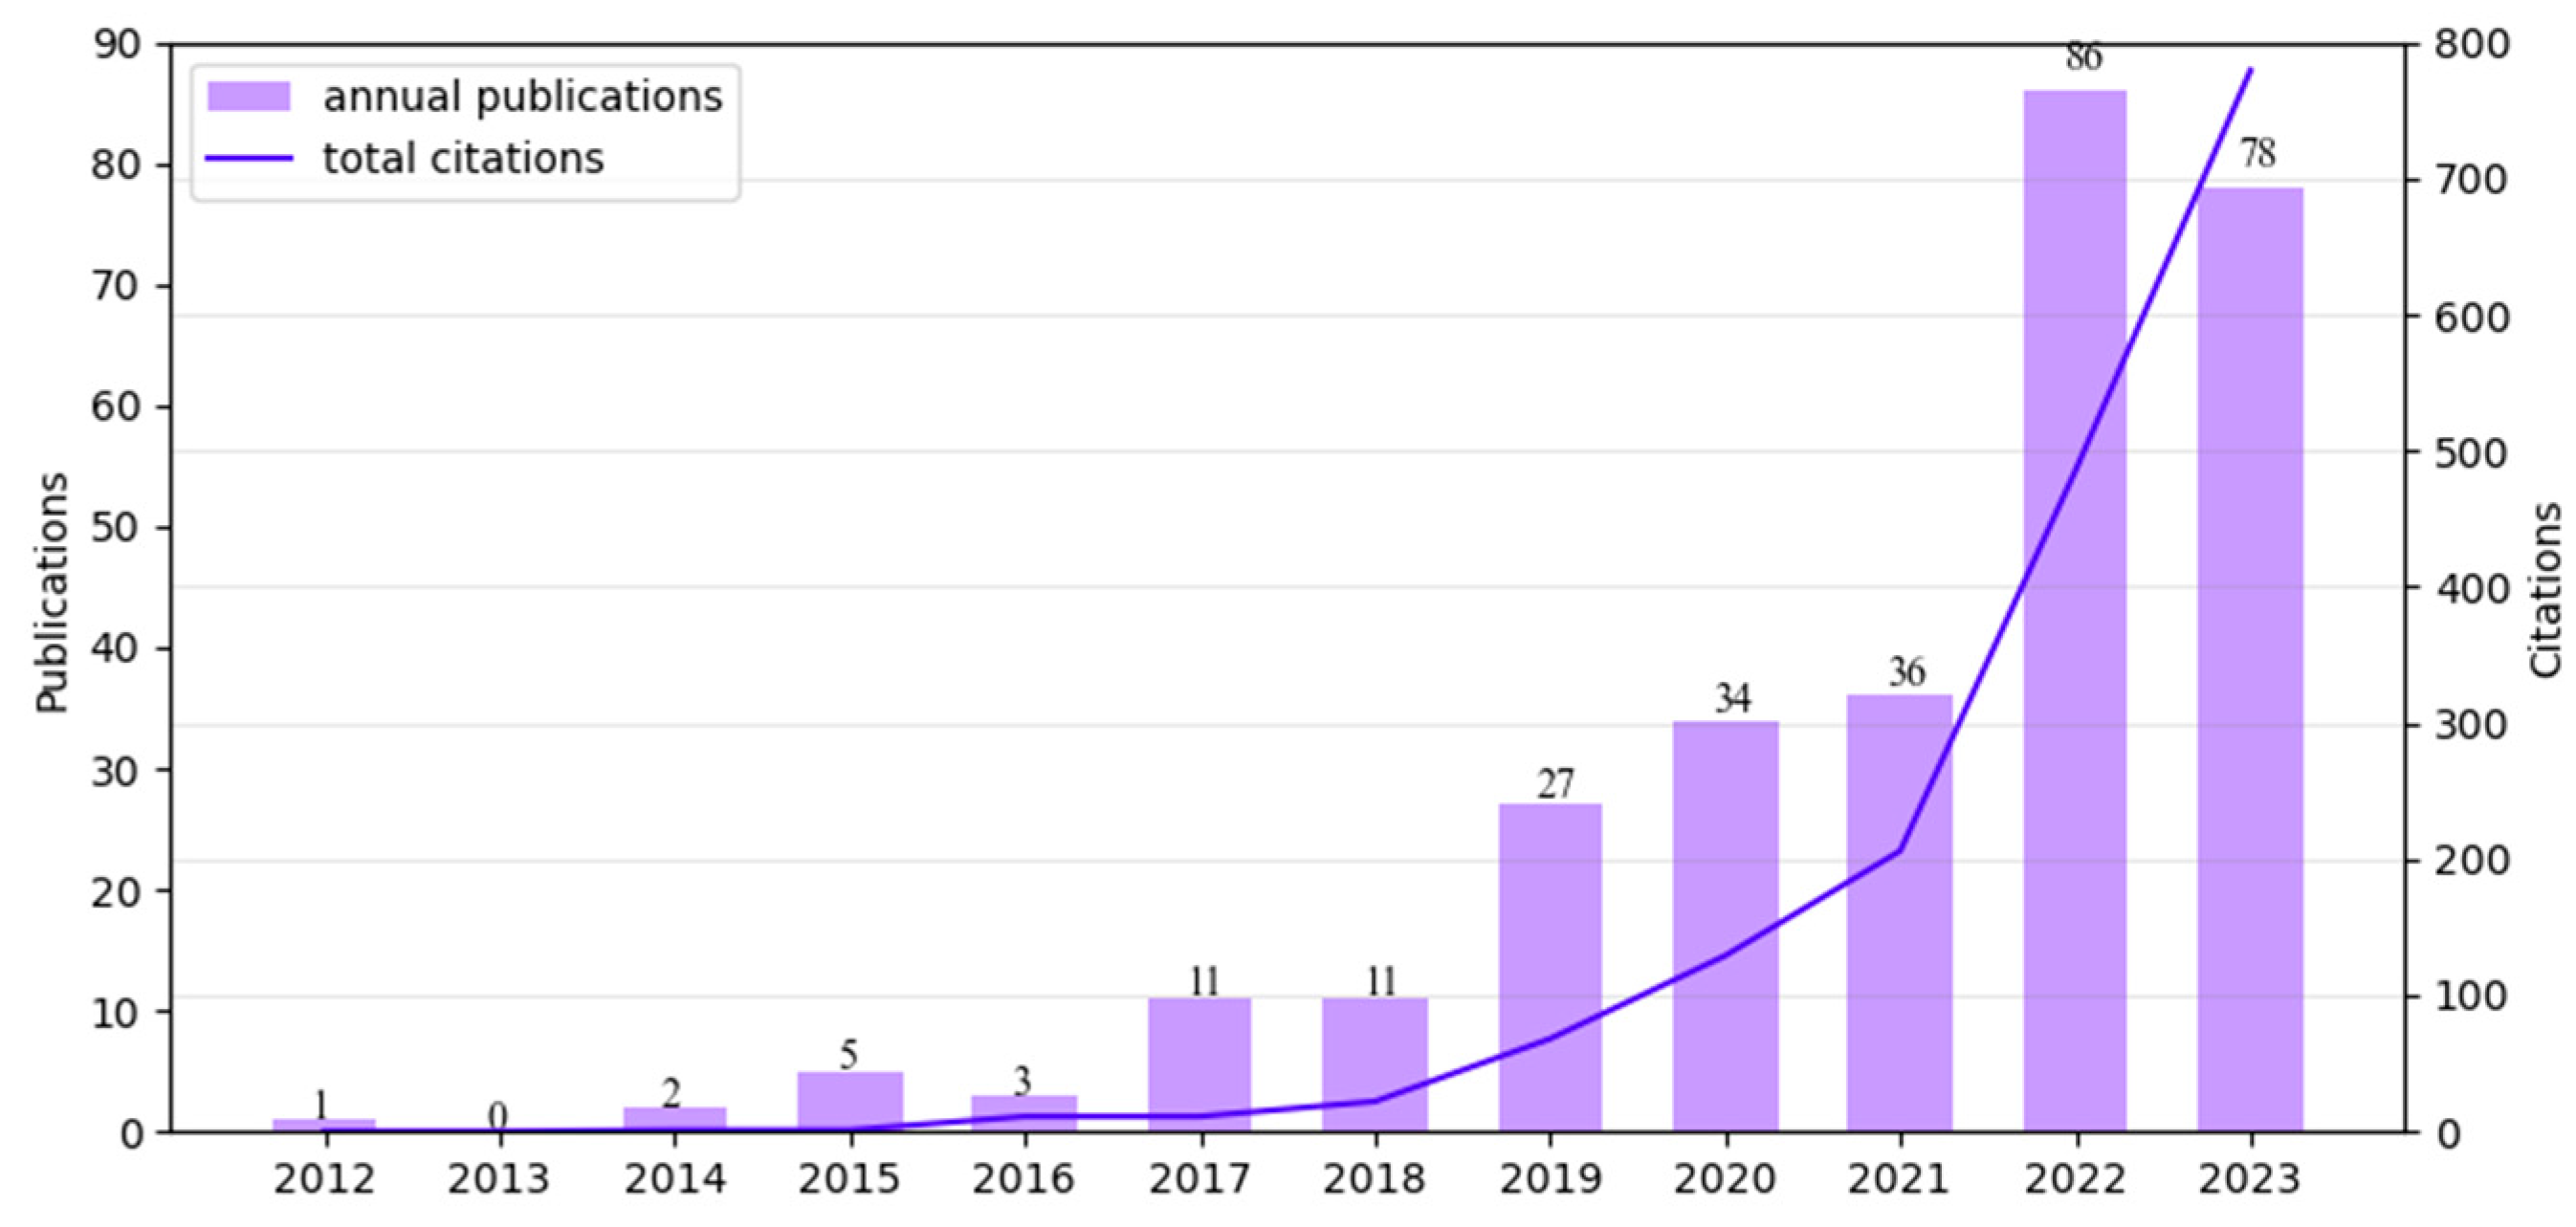
3.1. Trends in Publications and Citations

The annual trend in publications serves as a straightforward yet profound means of reflecting global activity and scientific interest towards GeoKG. As shown in Figure 2, the annual number of publications and citations on GeoKG increased significantly between 2012 and 2023. Moreover, a total of 261 papers (88.78%) were published in the last 5 years, indicating that the research interest in this topic has been growing continually, particularly since 2019, reaching 86 publications and 485 citations in 2022. It is interesting that the number of publications in 2023 decreases compared to 2022. This may be because some of the papers published in 2023 have not yet been indexed in WoSCC at the time we collected the data (8 March 2024). Normally, it can take from a couple of weeks to several months for an article to be indexed in the database after publication. Furthermore, it is common for the data to experience regular variations before stabilizing over several years.
According to the theory of technology maturity, the Logistic Growth Model could be employed to fit and forecast the cumulative number of publications [36]. The red dashed curve in Figure 3 illustrates the logistic growth function (or the S-curve function) for the global publication accumulation. It is described by Equation (1) as follows:
y = 738.03 1 + 790.9 e 0.52 ( x 2011 )
where x and y represent the year and the corresponding cumulative publications, respectively. The least squares method for curve fitting in Python library SciPy is adopted to obtain the parameters. Consequently, the cumulative publications on GeoKG over time follow a logistic growth pattern in the shape of an S-curve.
Similar to [36,37], the development of GeoKG could be divided into the following three stages based on Equation (l) and Figure 3: (a) infant stage (before 2020, up to 10% of publication output), (b) growth stage (2020–2028, 10–90% of publications), and (c) mature stage (after 2029). At the infant stage, GeoKG gained less attention and the annual publication numbers increased slowly, with no more than 30 articles per year. The importance of GeoKG was gradually recognized in the growth stage, and the number of publications and citations increased exponentially. One reason could be the success of general KGs in the computer science field and prominent industries. Another reason was likely because of the official launch of the Deep-time Digital Earth (DDE) project in February 2019. DDE is the first IUGS (International Union of Geological Sciences)-recognized big science program. Its research plan on building deep-time Earth knowledge systems may have aroused worldwide attention regarding the effectiveness of KG in sharing global geoscience knowledge and facilitating data-driven scientific discovery [6]. It is anticipated that this trend in GeoKG research will be sustained over a period until the year 2028. After reaching maturity, the growth in the number of publications will gradually slow down. Note that the predicted maturity year for GeoKG might be changed due to new theoretical or technological advances in geoscience or generic KGs.

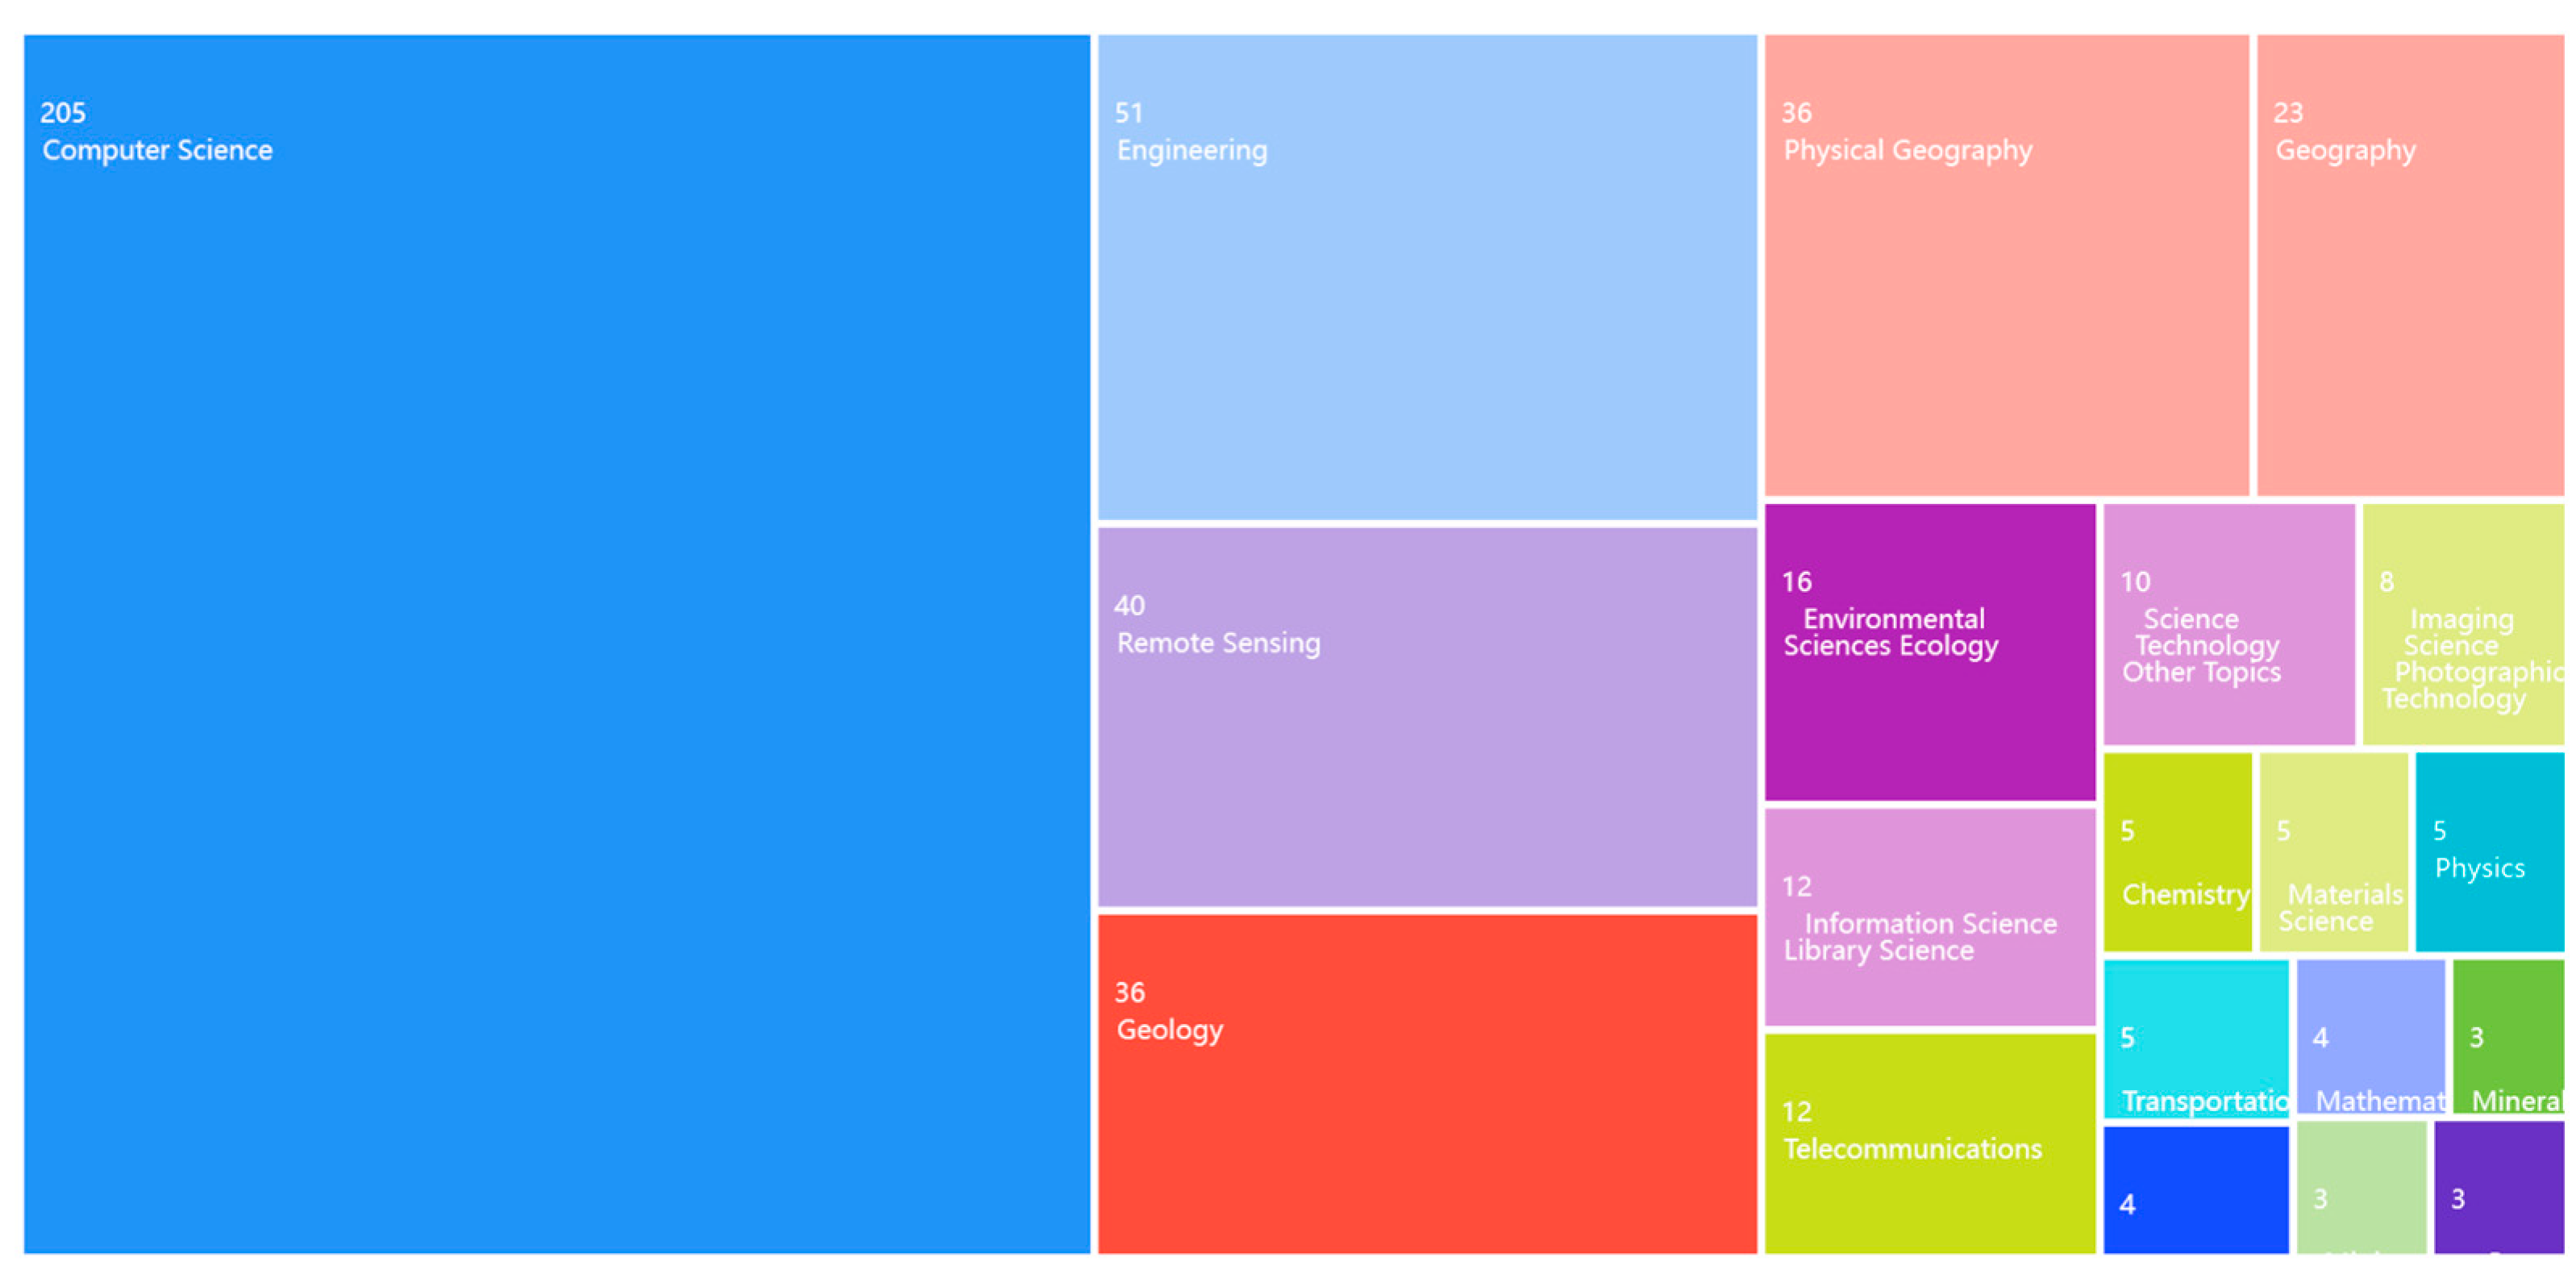
3.2. Top Publications, Research Areas, and Sources

The number of citations, including LCS and GCS, normally represents the academic influence of a paper to a certain extent. On the whole, the retrieved 294 documents were cited 323 times in the local database and 1843 times in the whole WoSCC database, with an average of 1.10 and 6.27 citations per item, respectively. Notably, there are 34 (11.56%) publications obtained only one citation, and a total of 206 (70%) publications have not received local citations yet. Table 1 lists the top 11 articles in GeoKG with a minimal LCS value of 8. Topics of these highly cited articles could be divided into the following five categories: (a) geoscience knowledge representation [29,38,39], (b) geoscience information extraction [40,41], (c) GeoKG construction and completion [3,8,42,43], (d) GeoKG application [44], and (e) review articles that introduced the current status and future developments of GeoKGs from a qualitative perspective [6,8].
Particularly, in the first category, the article entitled “Geographic Knowledge Graph (GeoKG): A Formalized Geographic Knowledge Representation” published by Wang et al. [29] was the most cited (23 citations) document in the local database as of March 2024. It designed a formalized knowledge representation model and supplemented the constructors of the ALC (attributive language with complements) description language to represent geographic states, evolutions, and mechanisms. Zheng, et al. [38] presented a hierarchical cubical model structure to represent geographic evolutionary knowledge, including the evolution mechanism of geographic elements and the reasons. Evolution not only happens to geographic elements, but also to domain concepts. Thus, a mechanism of version control and organization of concepts is needed to reduce the semantic ambiguity caused by the evolution. To this end, Ma et al. [39] proposed a new structure based on the identifiers of vocabulary schemes for version control and tracking of concepts and attributes in a GeoKG. What the three highly cited papers have in common is a special focus on the evolution of geoscience knowledge.
The second category focuses on geoscience information extraction from textual geoscience data based on natural language processing (NLP) techniques. It is a very important prerequisite task to the construction and application of GeoKGs. Specifically, the article entitled “Information extraction and knowledge graph construction from geoscience literature” authored by Wang et al. [40] received the largest GCS value (108) and the second largest LCS value (15) as of March 2024. It developed a workflow to extract information and construct KG from the unstructured Chinese geoscience literature.
The third category of highly cited papers centered on GeoKG construction and completion [3,8,42,43]. They are important prerequisites to the success of GeoKGs. They consist of several iterative steps, including data curation and integration, text classification and information extraction, knowledge representation and encoding, as well as entity disambiguation and linking. Currently, GeoKG construction and completion are still complex, time-consuming, and limited in scale, taking into consideration the heterogenous of multivariate geoscience big data and the dynamic nature of geoscience knowledge. There are still many important issues that need to be studied in the future [3,8,42,43].
GeoKGs can be used for many types of applications, although there was only one highly cited paper [44]. Typical applications of GeoKGs include, but are not limited to, geographical question answering, geospatial knowledge summarization, knowledge-driven integration and analysis of spatiotemporal big data, intelligent map editing and mapping, intelligent environmental geo-services, knowledge-driven remote sensing image analysis, smart city, digital humanities, virtual disaster environments, and so on [3,8,9,42,44]. Such applications show that GeoKGs could not only boost the performance of existing applications, but also open up the path toward new smart applications in the big data era.
The total of 294 articles covered 41 WoS research areas, and the top 20 areas with the most publications are shown in Figure 4. Note that each paper may belong to more than one research area in the WoS database. The top 10 most productive research areas were computer science (205 documents, 69.728% of the 294 outputs), engineering (51, 17.35%), remote sensing (40, 13.61%), geology (36, 12.25%), physical geography (36, 12.25%), geography (23, 7.82%), environmental sciences ecology (16, 5.44%), information science library science (12, 4.08%), telecommunications (12, 4.08%), and science technology other topics (10, 3.40%). The distribution of research areas suggested the high priority of technical issues in GeoKG research. It also reveals the close relationships between GeoKG, computer science, and earth science (including remote sensing, geology, physical geography, geography, and ecology). AI techniques in computer science provided essential approaches and standards for the implementation of GeoKG, including knowledge representation, extraction, embedding, completion, fusion, and reasoning; earth science data can yield unique spatial-temporal information, which is important for not only scientific discovery, but also practical applications such as policy-making, while GeoKG can facilitate the representation, retrieval, integration, and sharing of earth science data from highly heterogeneous sources, promoting knowledge assisted data intelligence and computational intelligence [5,42]. Thus, GeoKG researchers should keep a close eye on the development of computer science and earth science.
Furthermore, the 294 publications concerning GeoKG are contributed to by 180 sources. According to the law of Bradford implemented in the bibliometrix R-package, there are 15 core publication sources. Among them, the top nine sources with a minimal publication count of five are shown in Table 2. In terms of the publication number, ISPRS International Journal of Geo-Information was the most productive source in the field (published 22 articles), followed by Transactions in GIS (16) and Geoscience Frontiers (8). Specifically, the top nine (5%) sources published 79 (26.87%) of the 294 outputs. In contrast, 131 sources (72.78%) published only one paper on GeoKG. Moreover, regarding the citation count, the top three sources were Computers & Geosciences (194 citations), ACM Transactions on Information Systems (140), and ISPRS International Journal of Geo-Information (133). In addition, according to the average citations, the top three were Computers & Geosciences (38.8), International Journal of Geographic Information Science (11.83), and IEEE Access (11.8), suggesting their considerable impact in this field. In addition, the h-index is frequently used to measure both the productivity and citation impact of the publications of a source or a scientist. It means the h number of publications were cited at least h times. Thus, the top four sources with a minimal h-index value of 5 were ISPRS International Journal of Geo-Information (7), Computers & Geosciences (5), International Journal of Geographic Information Science (5), and Transactions in GIS (5). These findings indicated that the GeoKG outputs among journals or conference proceedings were very dispersed, but the primary concentration was on a limited number of sources. Researchers could follow these sources to keep updated with the latest research or select suitable journals to publish their works.

3.3. Leading Authors, Institutions, and Countries

Author analysis in a certain research field can help scholars know the leading experts, thereby timely tracking the latest research trends and achievements in the field. As a whole, the collected 294 publications concerning GeoKG were contributed to by 1084 authors. Table 3 presents the top ten most prolific authors who have published at least seven papers. The top three authors were Janowicz Krzysztof (twelve publications), Mai Gengchen (ten), and Qiu Qinjun (ten). In contrast, 894 (82.47%) authors had published only one paper. Furthermore, according to the Price formula, i.e., N = 0.749(Nmax)1/2 and Nmax = 12 (the number of the most prolific author’s publications), 72 authors who have published more than 2.59 papers were recognized as core authors in the field. In terms of the number of citations, the top three authors were Janowicz Krzysztof (246), Ma Xiaogang (221), and Mai Gengchen (206). They were also the only three scholars who had more than 200 citations. Notably, Janowicz Krzysztof is both the most prolific and influential researcher in the field of GeoKG. He also has the most continued trajectory in GeoKG research. His research areas include spatial and temporal principles of knowledge organization, geospatial semantics, and semantic web, KGs, GeoAI, and spatial studies.
The collected 294 publications concerning GeoKG were contributed by 449 institutions. Among them, as shown in Table 4, the Chinese Academy of Sciences (CAS) was the most productive institution with 31 publications, accounting for 10.54% of the 294 outputs, followed by the China University of Geosciences, Wuhan (23), and the University of Chinese Academy of Sciences (20). In contrast, 345 (76.84%) institutions have published only one paper. This shows that the production of these institutions was uneven. It is worth noting that ten of the top fifteen most prolific institutions were located in China, with 129 papers, accounting for 43.88% of the total publications, indicating the great interest of Chinese scientists in GeoKG research. However, regarding the total citations, the top three institutions were the China University of Geosciences Wuhan (342 citations), the University of California Santa Barbara (253), and the University of Idaho (221), revealing their high impact on GeoKG research.
Furthermore, the 294 publications concerning GeoKG were contributed to by 45 countries, among which the top nine with a minimal publication count of 4 are shown in Table 5. According to the results, China was the most productive country on GeoKG research with 158 publications, accounting for 53.74% of the total publications, followed by the USA (48) and Germany (18). Additionally, China, the USA, and Australia were ranked as the top three most cited countries, with 905, 464, and 130 citations, respectively. This reflects that these three countries paid relatively high attention to the research of GeoKG. In addition, total link strength (TLS) is widely used to indicate the influence of a node in a network. The greater the TLS value of a node, the greater its impact. Thus, China was the most influential country in the field of GeoKG, with a TLS value of 55, followed by the USA (49), India (20), Australia (20), and Germany (19). It is noteworthy that, although Australia, New Zealand, and Finland have fewer publications (4, 1, and 1, respectively), their articles have exhibited a significantly higher quality and influence, evident in their ACP values (32.5, 24, and 20). However, the ACP value of China stands relatively low at 5.73, ranking fifth, which suggests that Chinese scientists should strengthen their research and publish high-impact papers in the future.

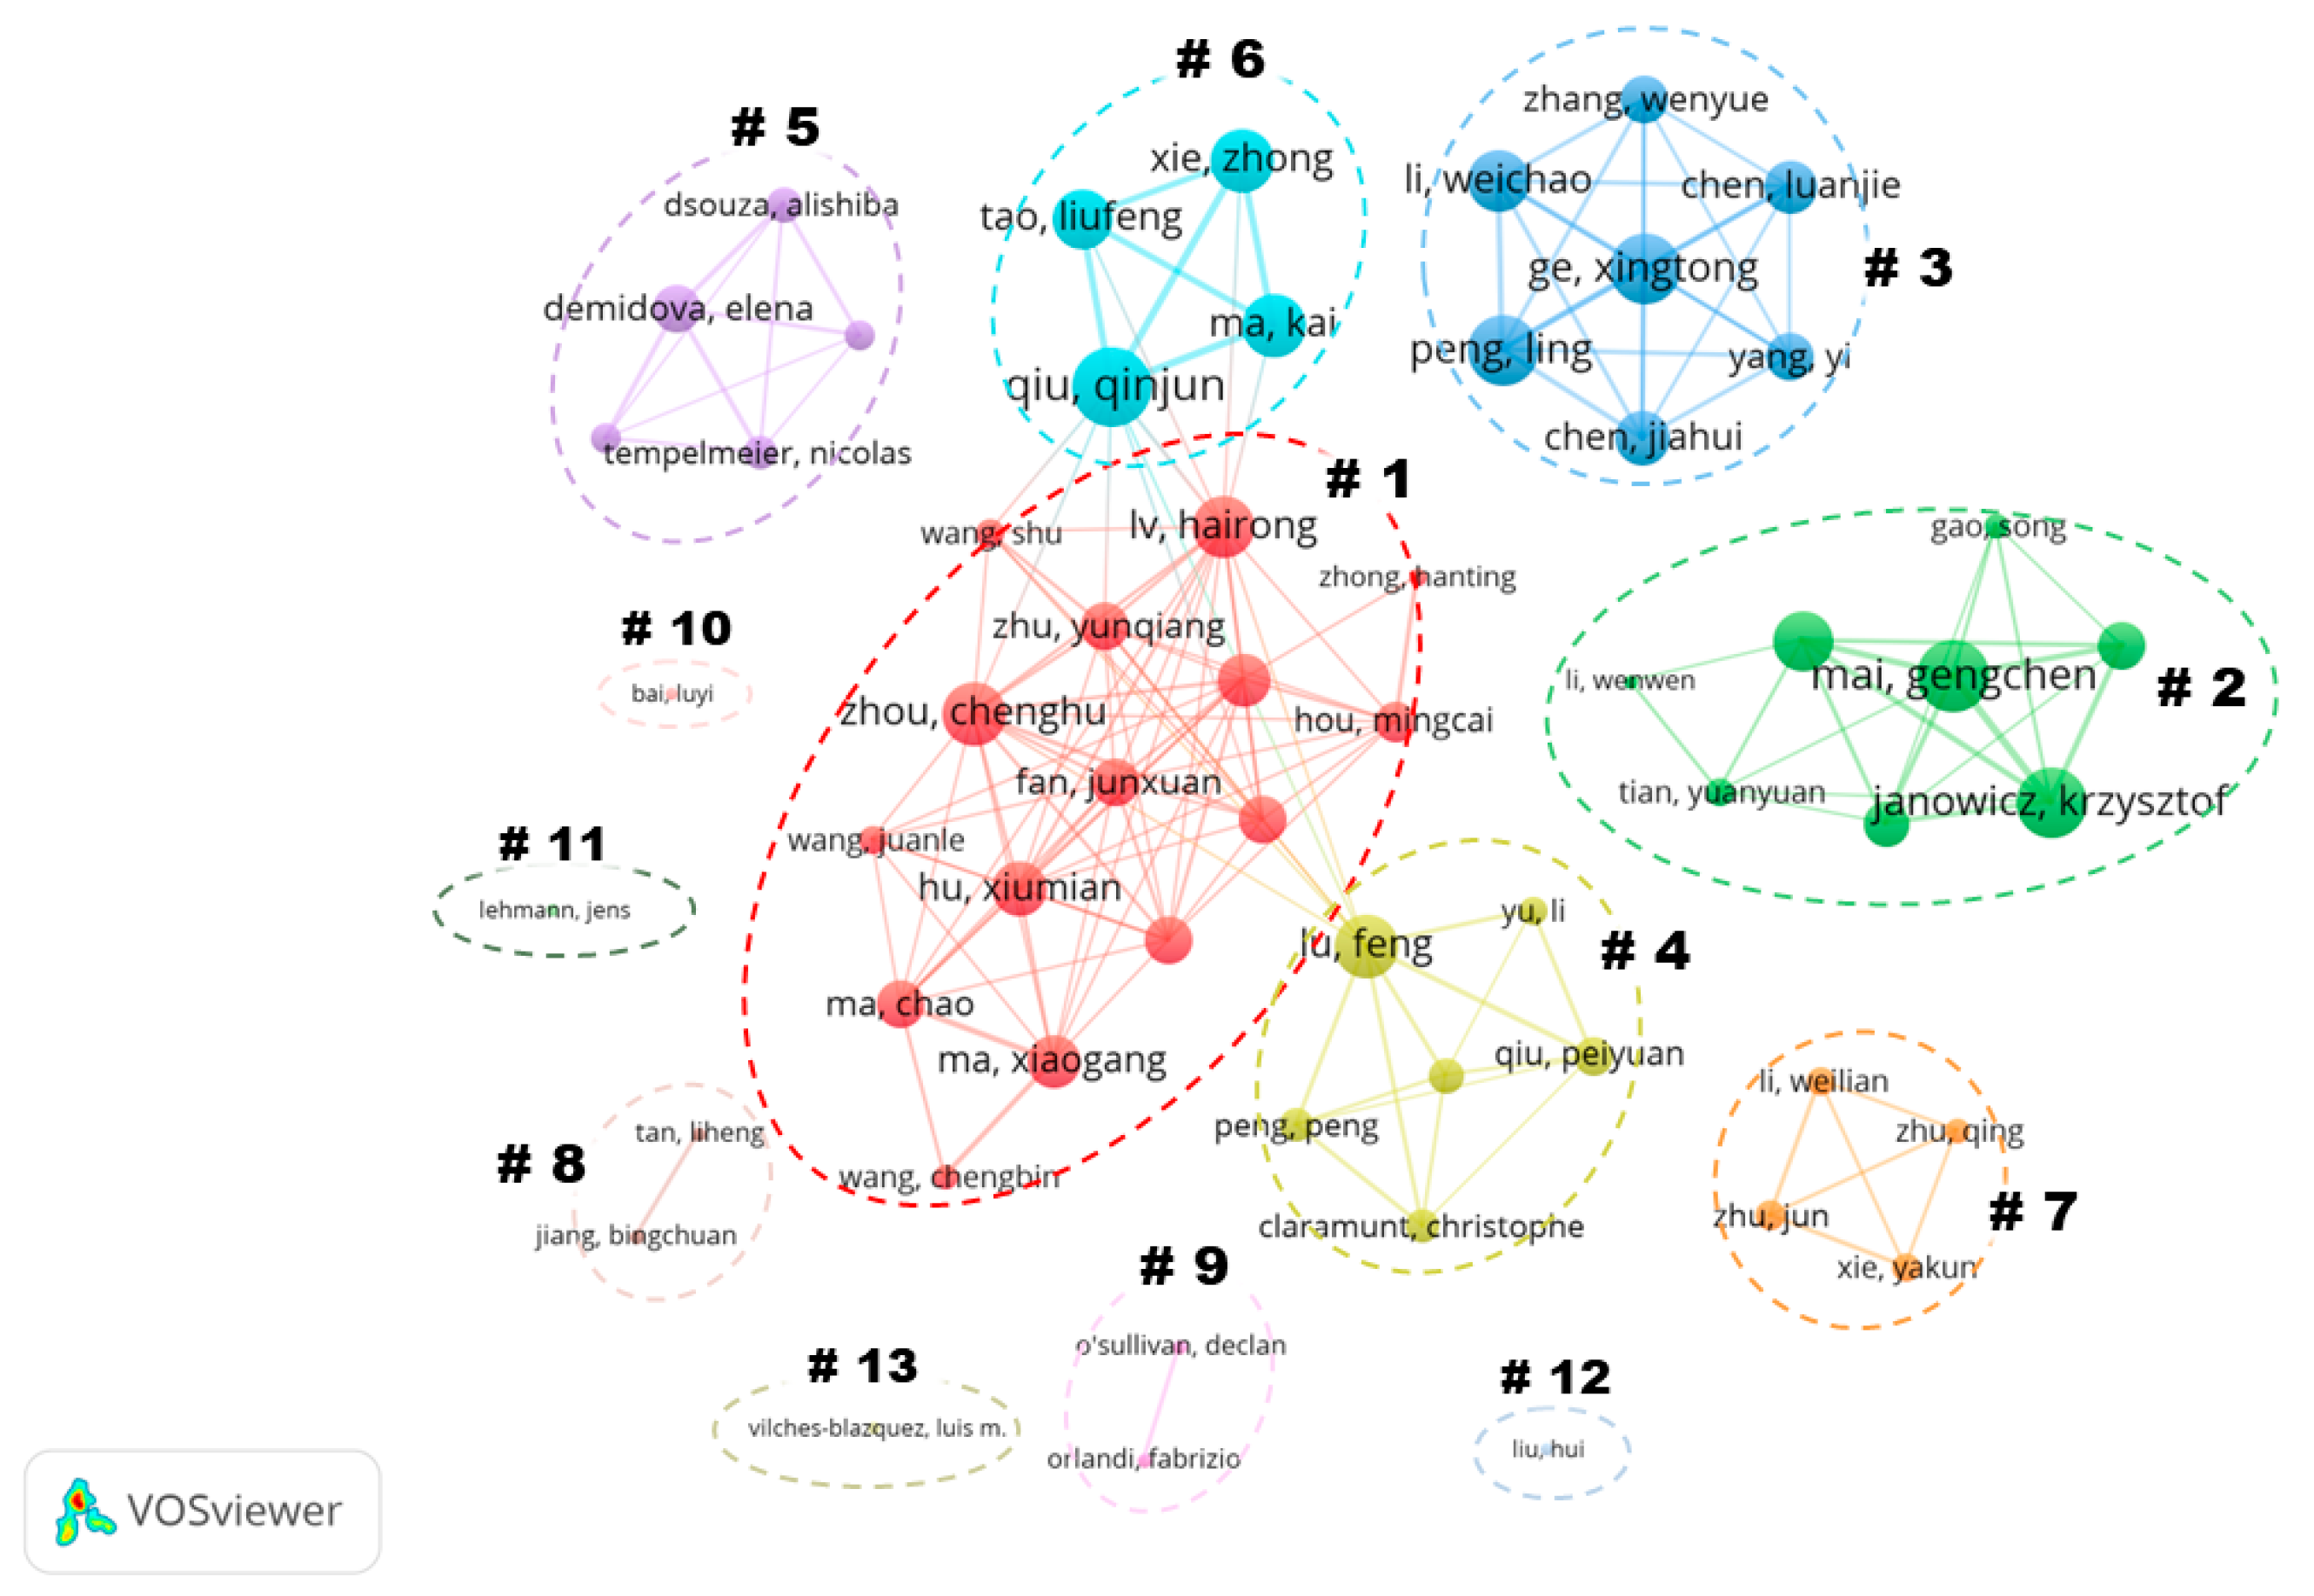
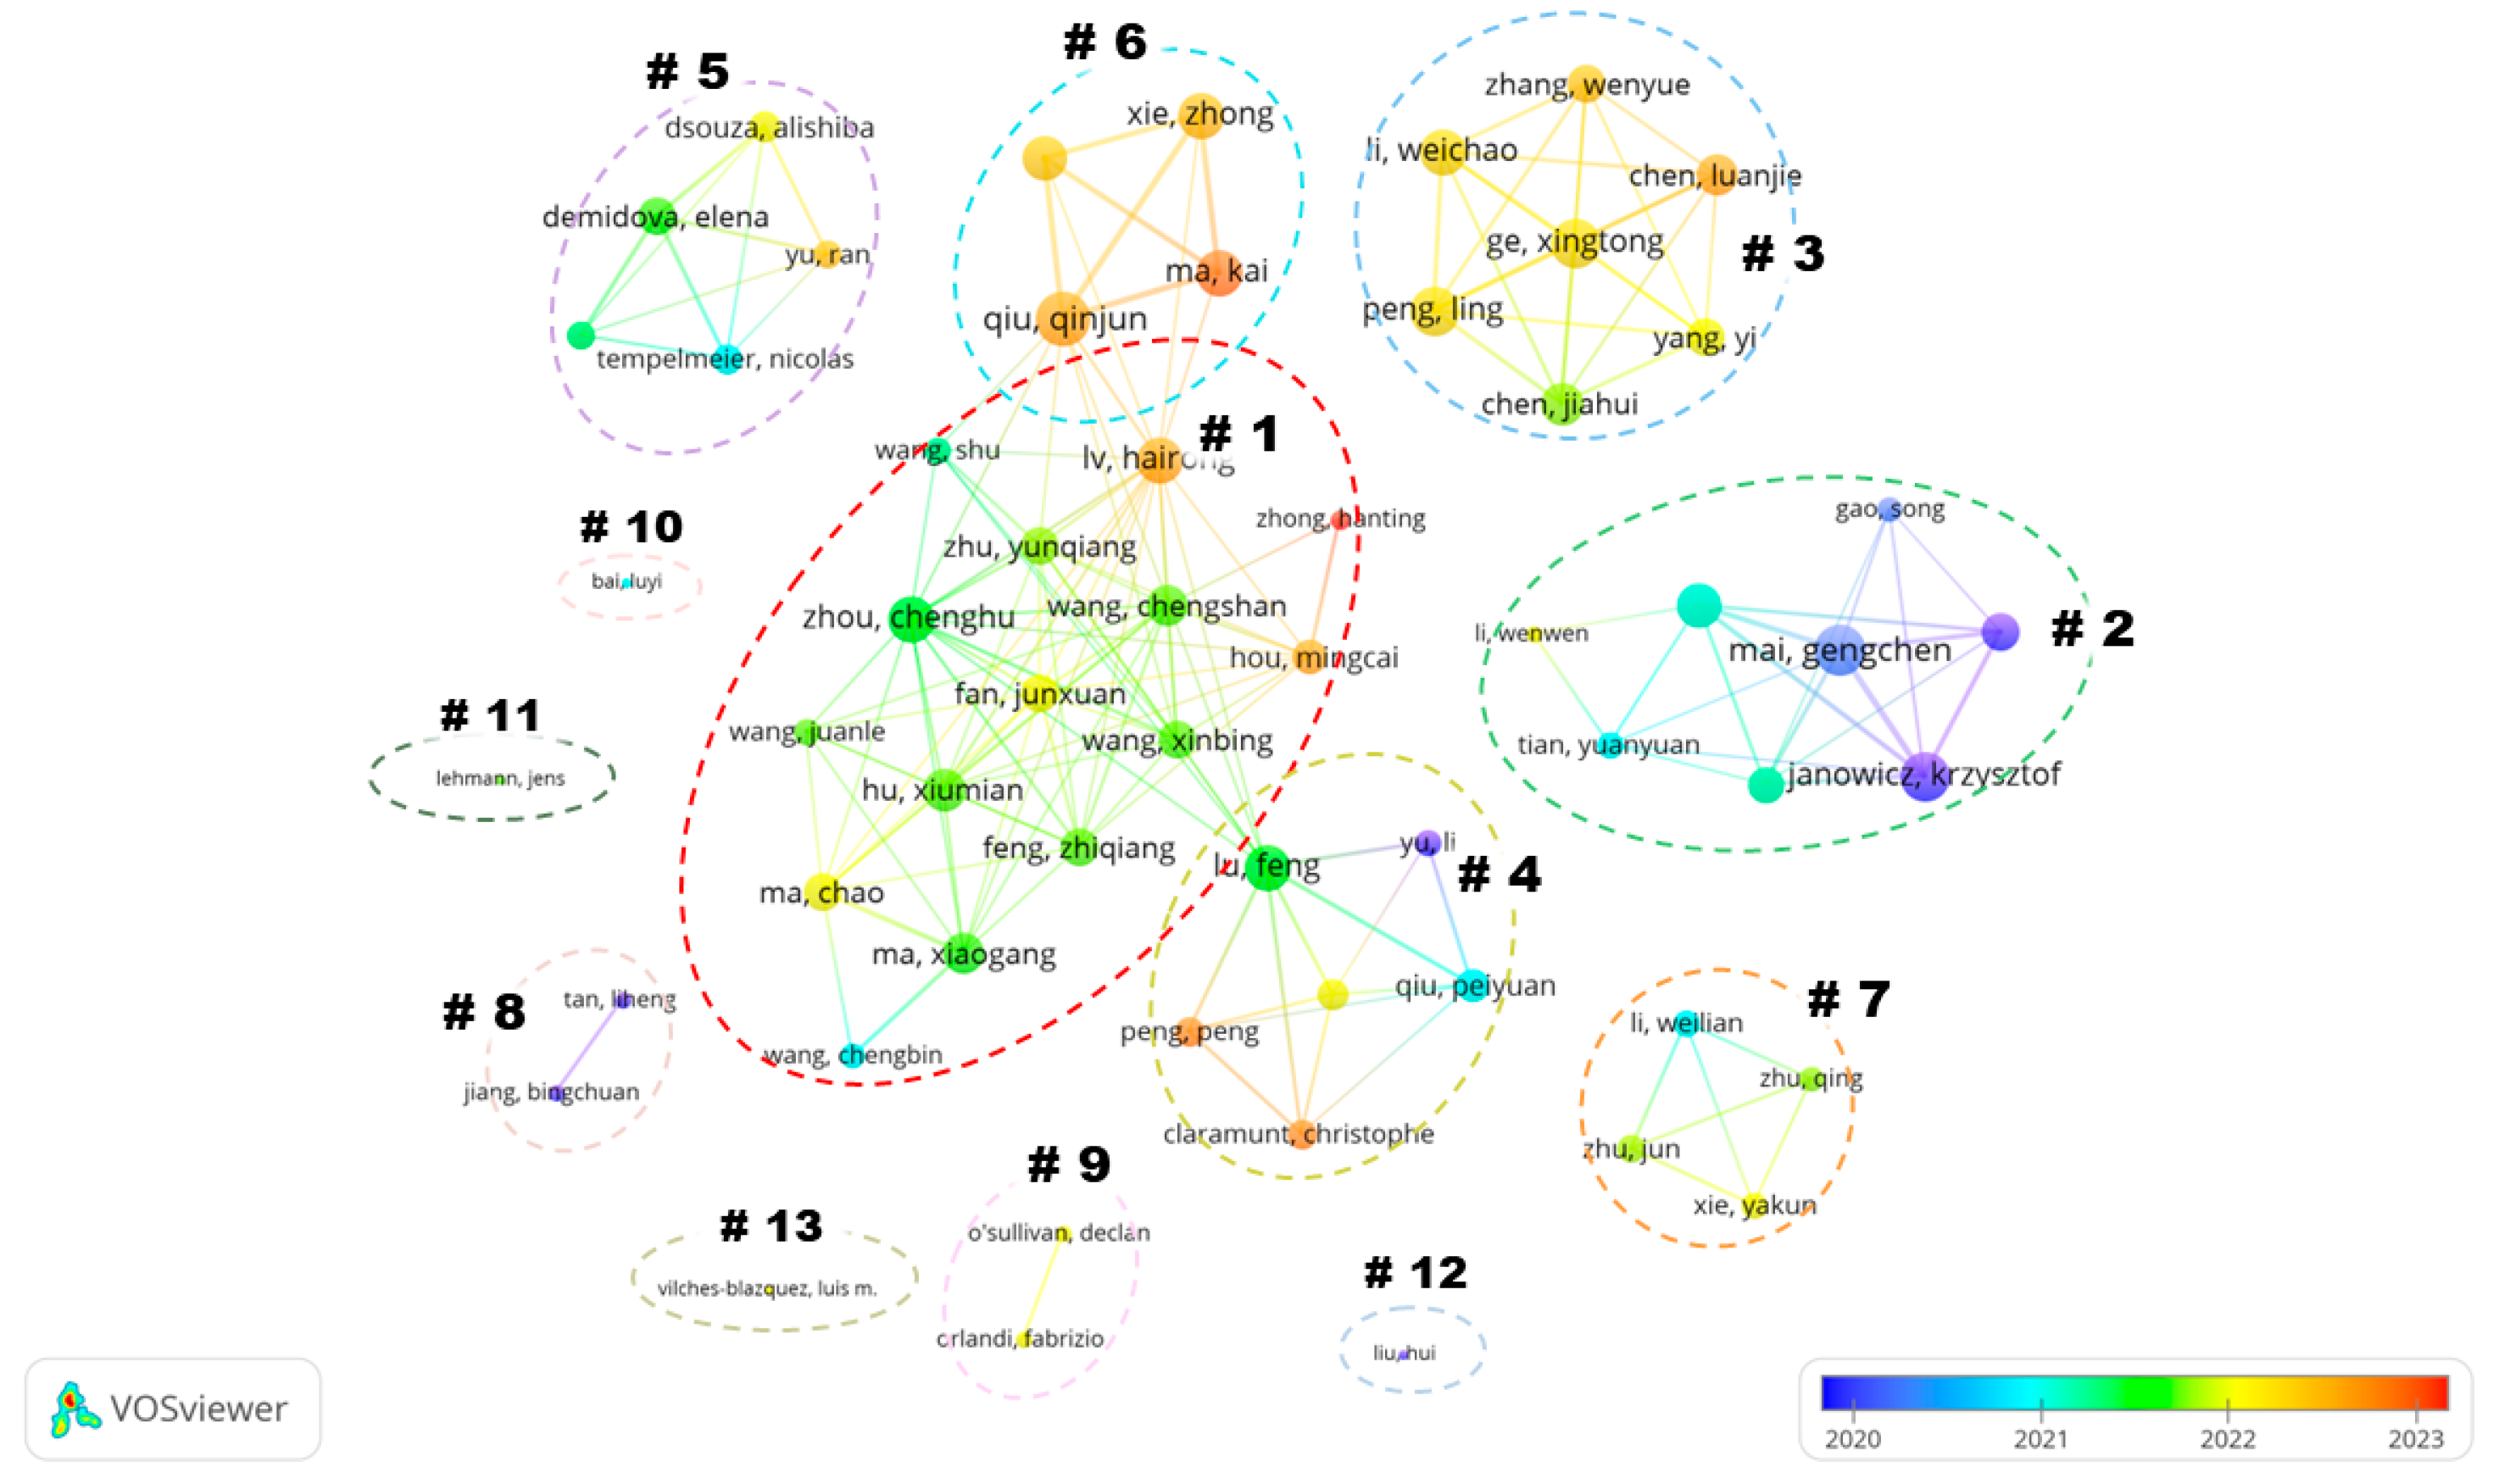
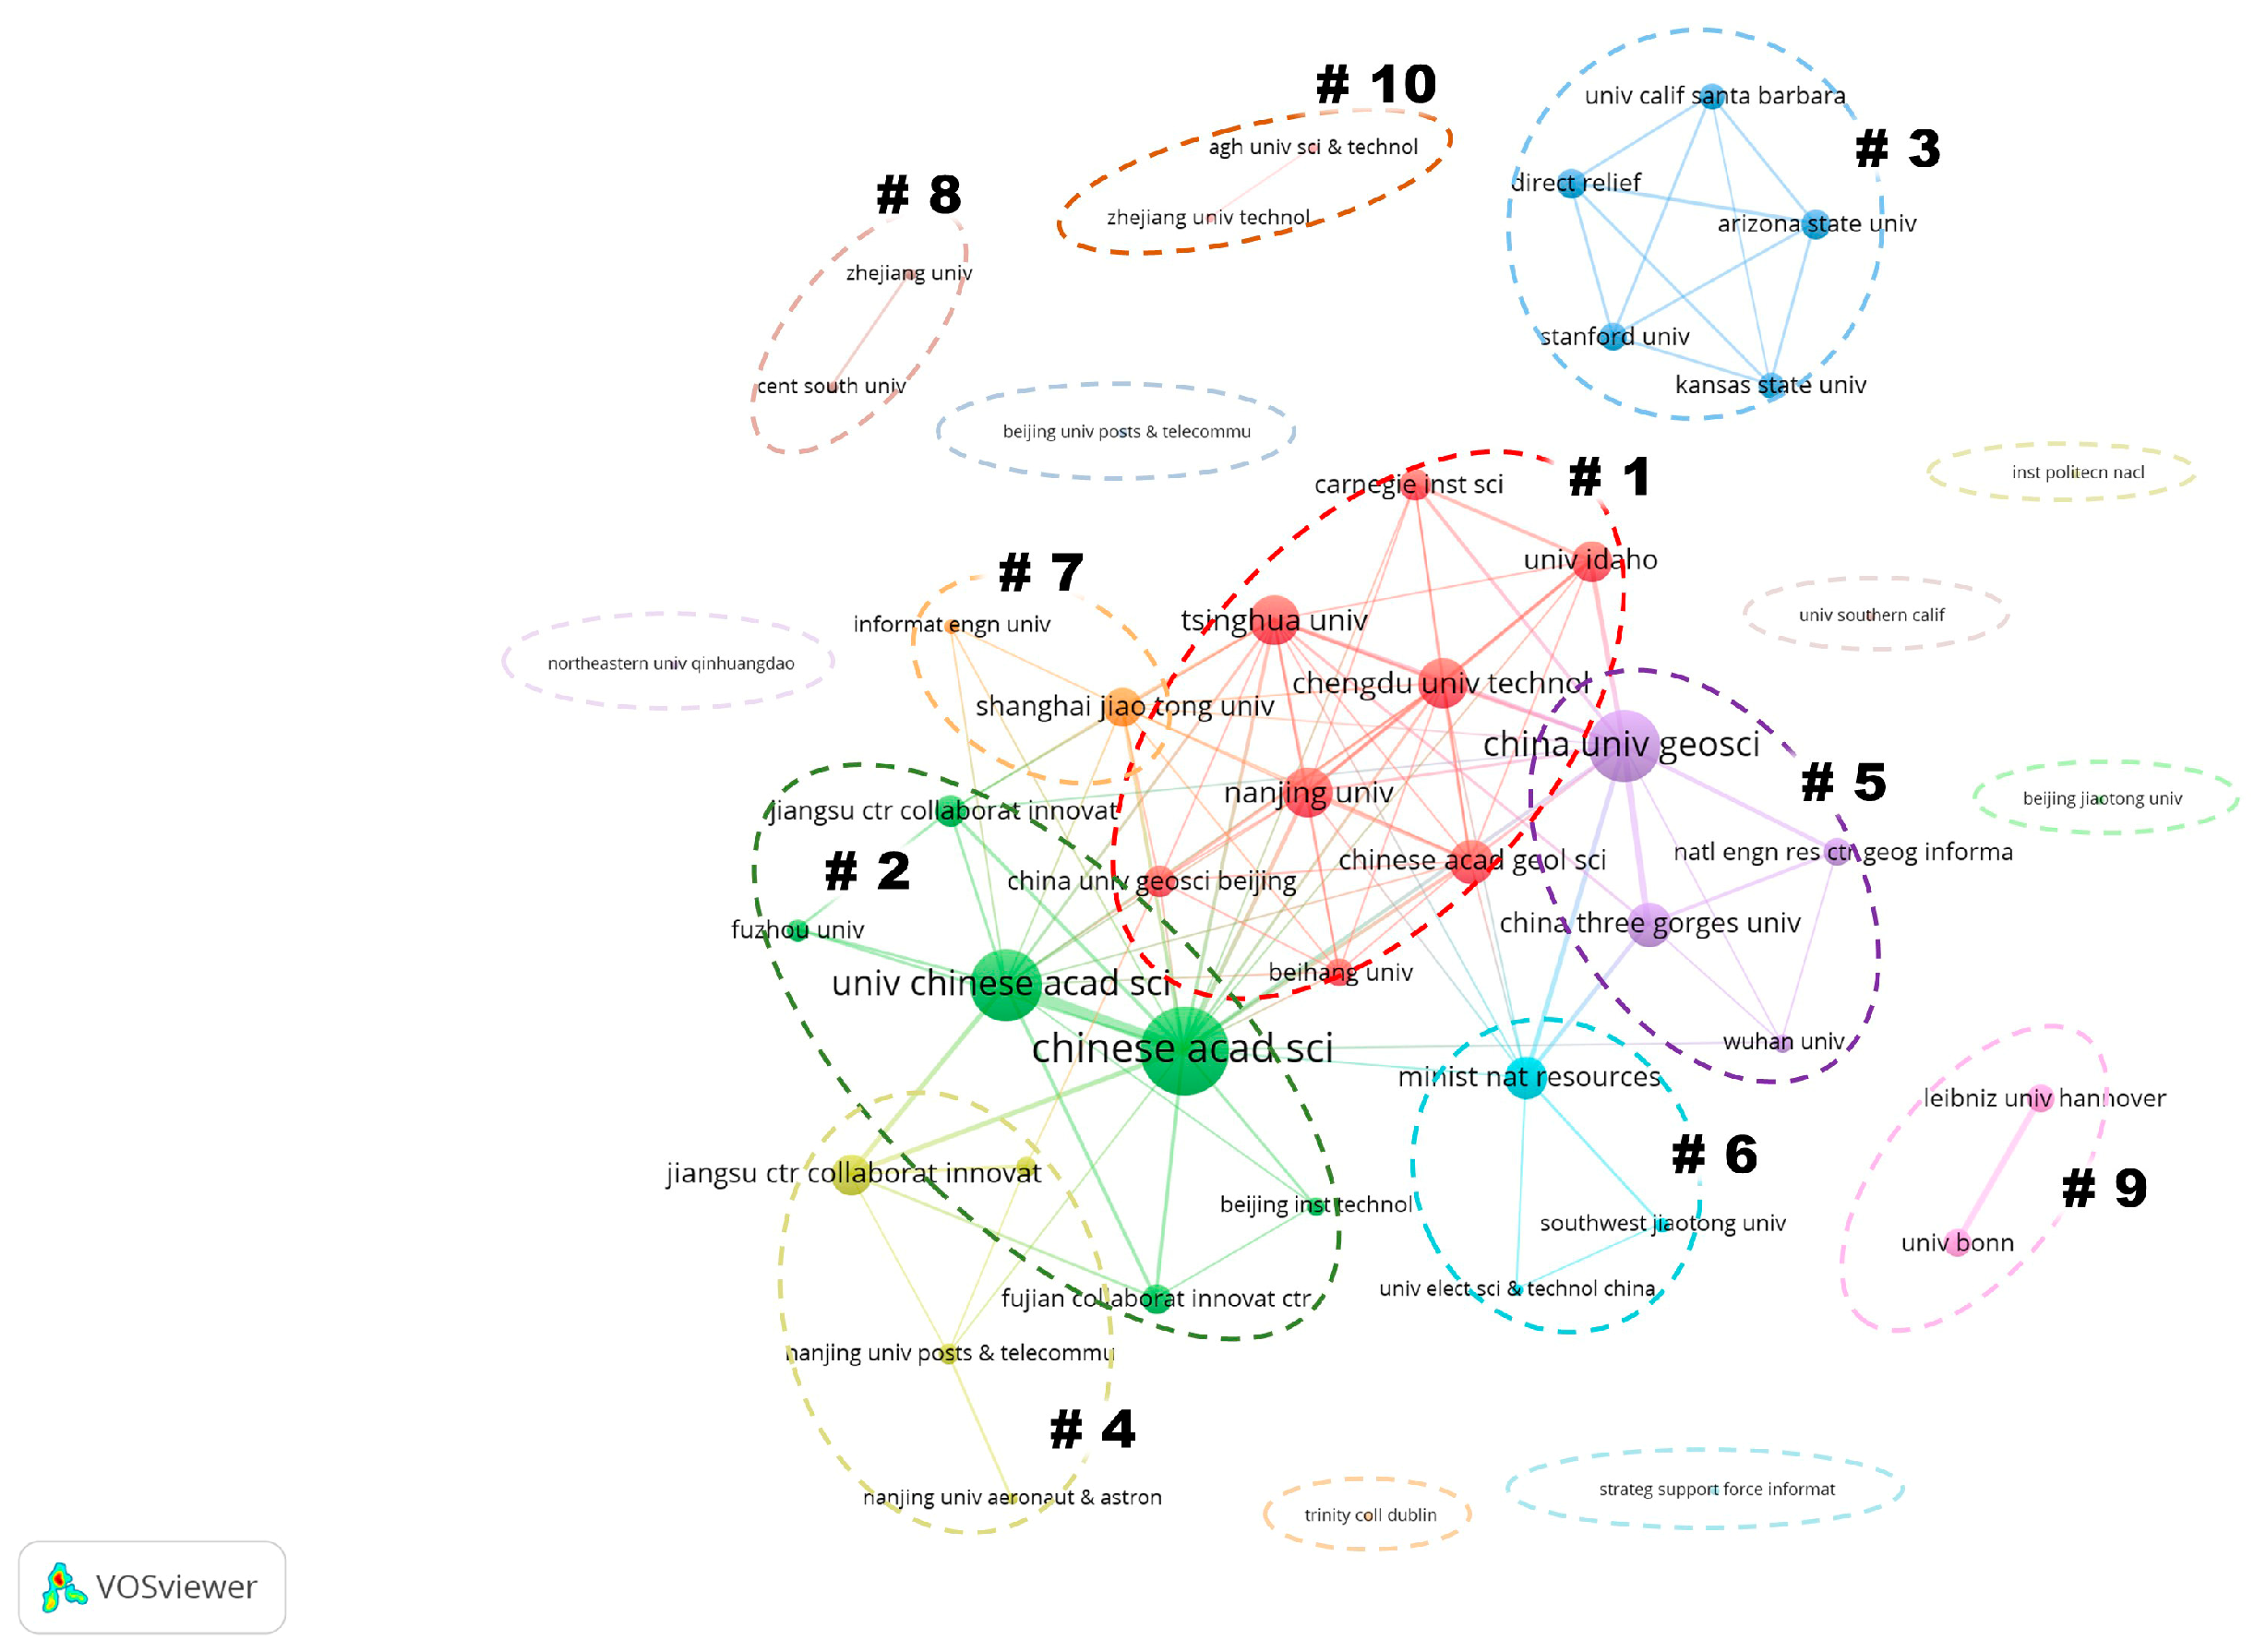
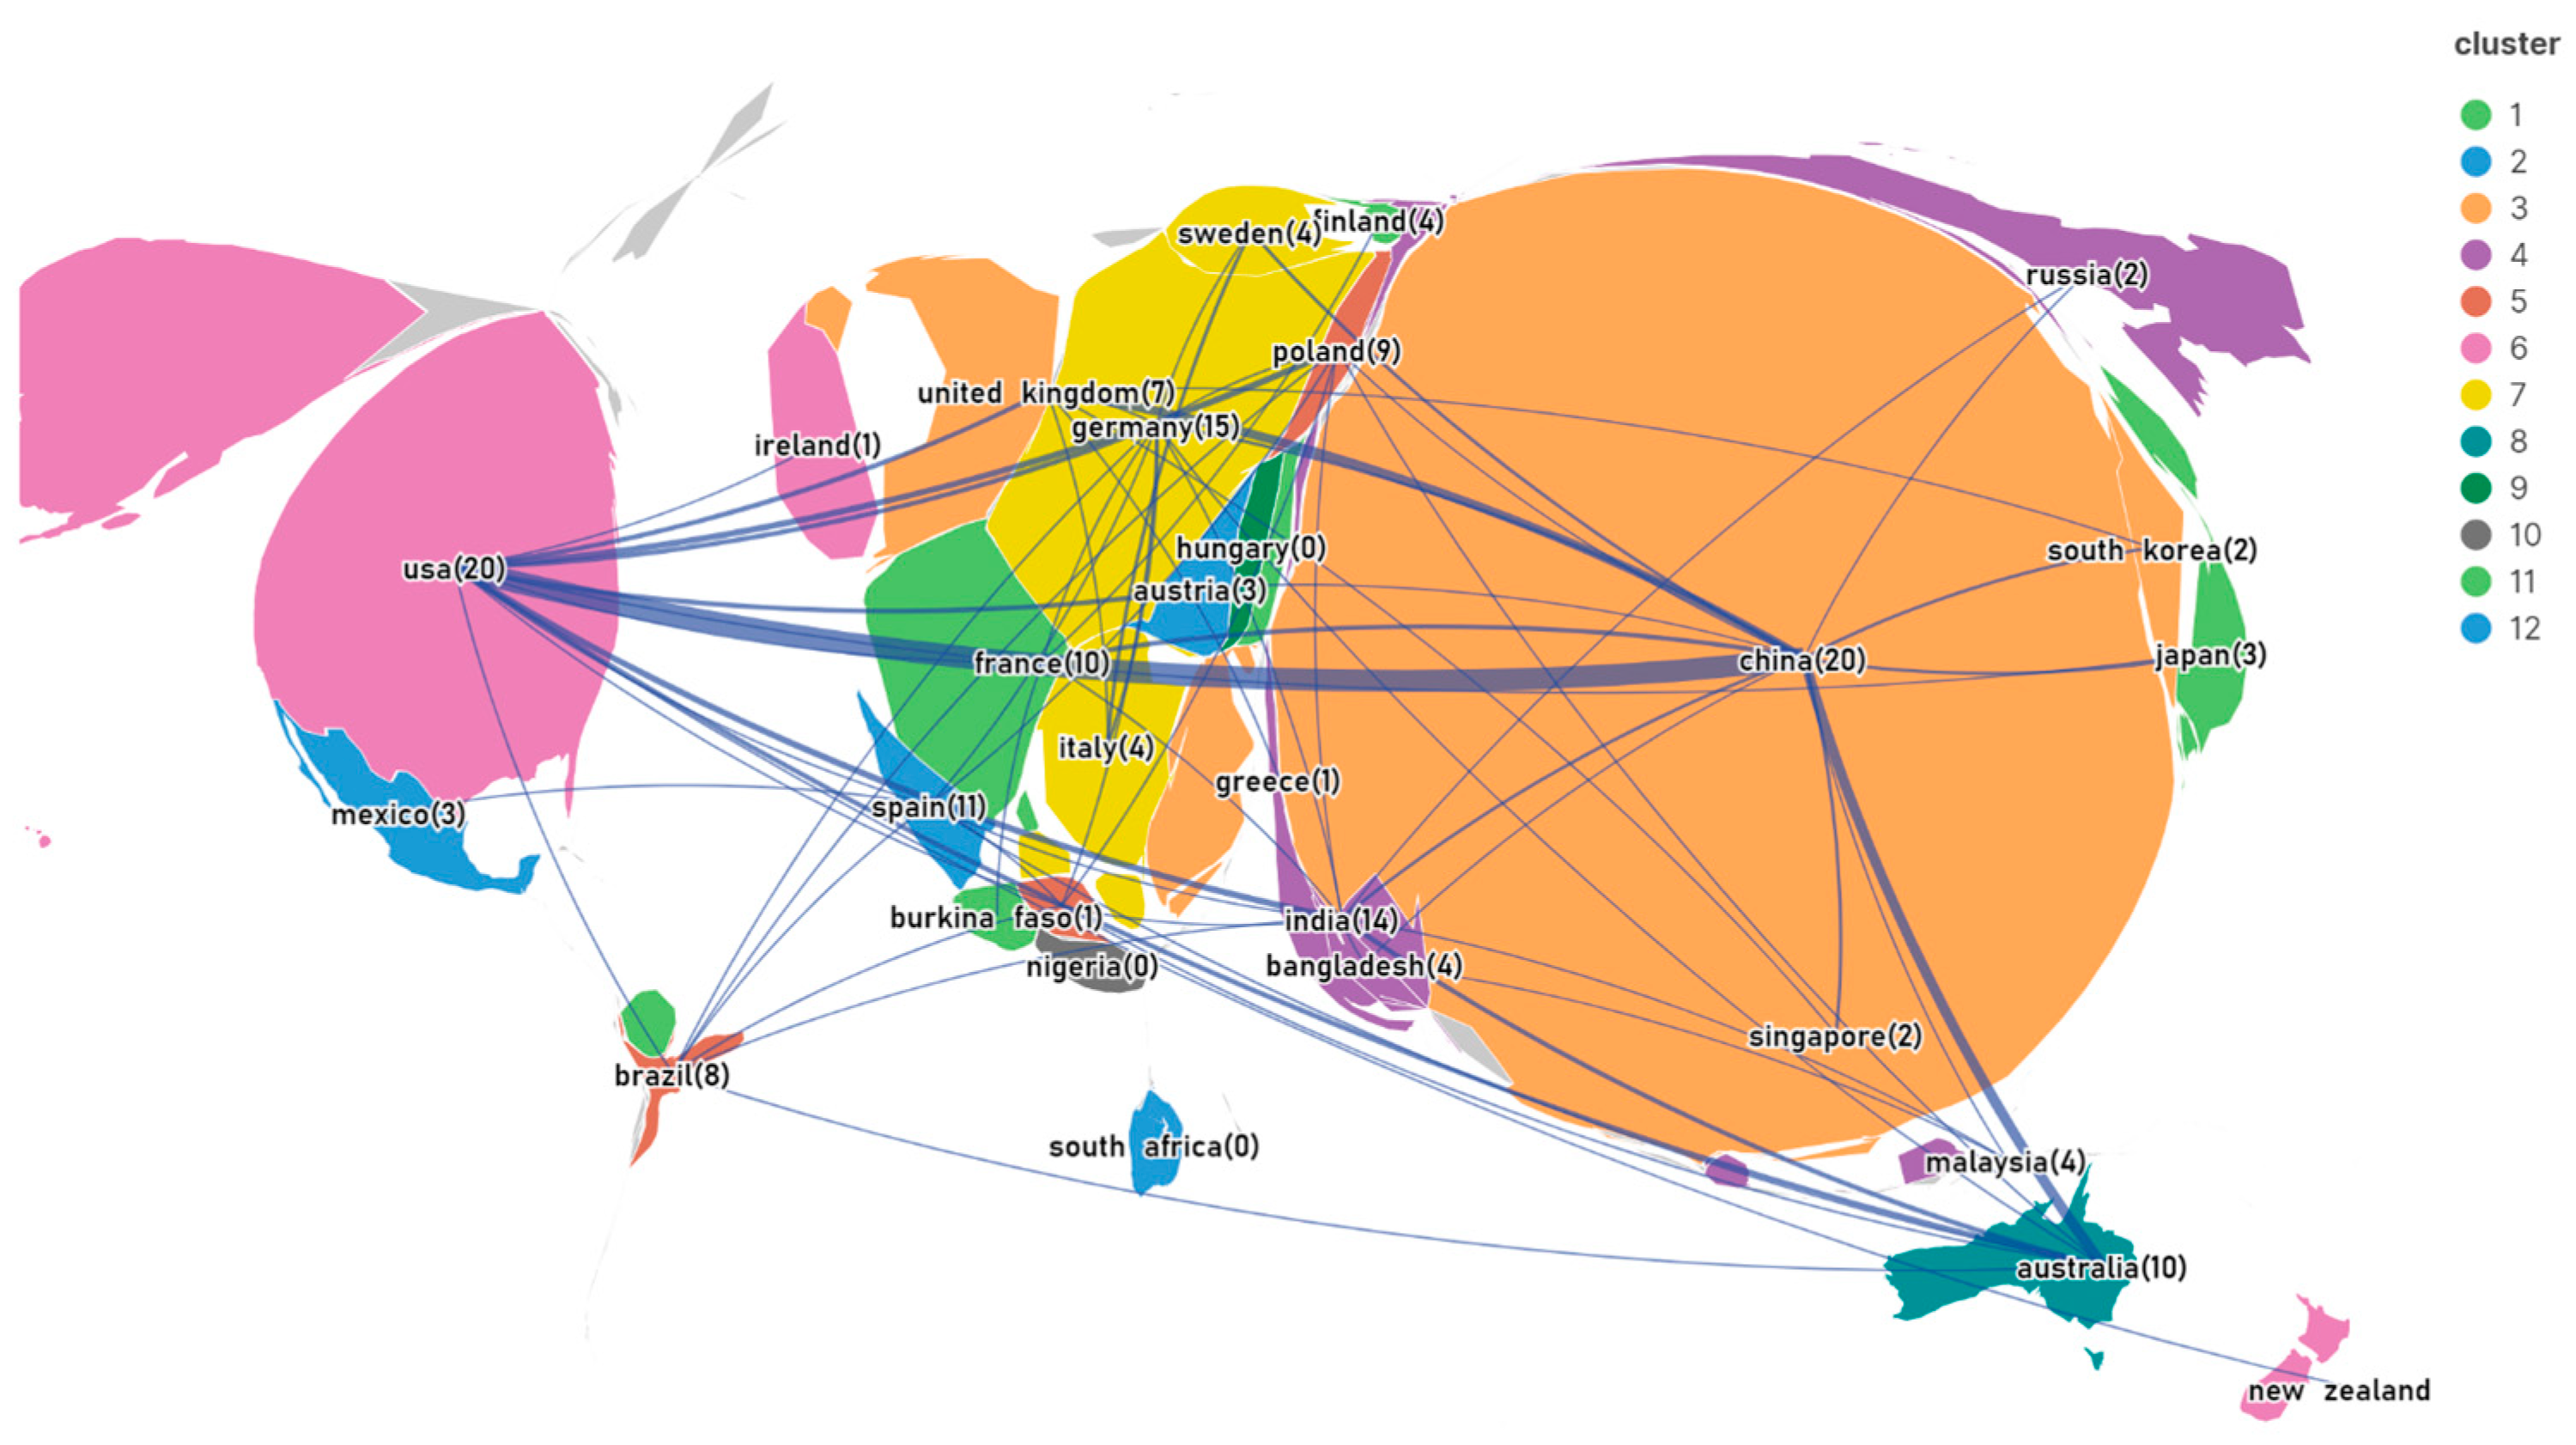
3.4. Scientific Collaboration Analysis

Scientific collaborations among scholars can generate new ideas and richer insights, thus improving the research. In this section, we use VOSviewer to analyze the scientific collaborations, i.e., co-authorship relationships of major contributors, including authors, institutions, and countries. The parameter “minimum number of documents of an author” was set to three according to the Price formula mentioned above. Figure 5 and Figure 6 show the resulting network map and the average year of each publication, respectively, with a set of 57 authors. The size of the nodes and edges denote the TLS of a node and the link strength between two nodes, respectively. Edges connecting nodes represent co-authorships. The color of a node signifies the cluster it belongs to, where clusters are tightly connected research communities of authors interlinked via co-authorship relations. The colors depicted in Figure 6 illustrate the average publication year (APY) of each author.
As illustrated in Figure 5, the network map primarily consists of 13 clusters. Detailed information of the top seven clusters which have grouped at least four authors is listed in Table 6. Regarding the number of involved influential authors (see Table 3), cluster 6 and cluster 2 were the most impactful research communities on GeoKG research. Furthermore, the TLS values show that authors in these clusters except cluster 7 have a very close cooperative relationship. However, cooperations between clusters are limited to clusters 1, 4, and 6, with no collaboration discernible between the remaining clusters. This indicates that the network is fragmented, and the cooperation among different research communities is very weak. Therefore, scholars in the field of GeoKG should explore opportunities to strengthen scientific collaborations across disciplines, institutions, and/or countries in the future. Additionally, institutions and funding agencies should provide more support for initiatives aimed at fostering scientific collaboration among different research communities.
Figure 7 shows the collaboration network map of the institutions with minimal number of publications of three. It consists of 45 institutions grouped into 17 clusters. Six clusters were established around three up to eight institutions, and the rest clusters included only one or two institutions. Similar to Figure 5, the size of the nodes represents the TLS of institutions, and lines connecting the nodes indicate the inter-institutional collaborations. Nodes sharing the same color signify institutions that exhibit greater collaboration compared to others. Details of the institutions with a minimal number of nine publications are listed in Table 4. As a result, the most collaborative institutions were the Chinese Academy of Sciences, University of Chinese Academy of Sciences, China University of Geosciences Wuhan, Tsinghua University, Chengdu University of Technology, and Nanjing University; each had collaborated with 20, 14, 13, 13, 12, and 12 other institutions. Notably, all six institutions are based in China, demonstrating the close cooperation within the country. However, the fragment of the network suggests the collaboration among institutions based in different countries should be strengthened.
Figure 8 shows the international collaboration among the 45 countries. The colors on the map represent the clusters to which this country belongs. The size of each country represents its total publications on GeoKG research. Lines connecting the countries indicate collaboration among them, and the width of the lines signifies the intensity level of the relationships (thin lines indicate weak relationships). As a result, China and the USA were the most collaborative countries, both collaborating with 20 other countries. The top four collaborative partners of China were the USA (fifteen links), Australia (seven), the United Kingdom (six), and France (three). The top six collaborative partners of the USA were Poland (four links), India (four), the United Kingdom (three), Germany (three), Austria (three), and Australia (three). It is worth noting that countries/regions from four continents, namely Asia, North America, Europe, and Australia, have contributed most of the publications and collaborations concerning GeoKG, as shown in Figure 8. Thus, international scientific collaborations between the abovementioned continents and Africa and South America should be strengthened in the future. Such collaboration can facilitate the sharing of data, knowledge, resources, and funding, thereby accelerating the development of global GeoKG research.

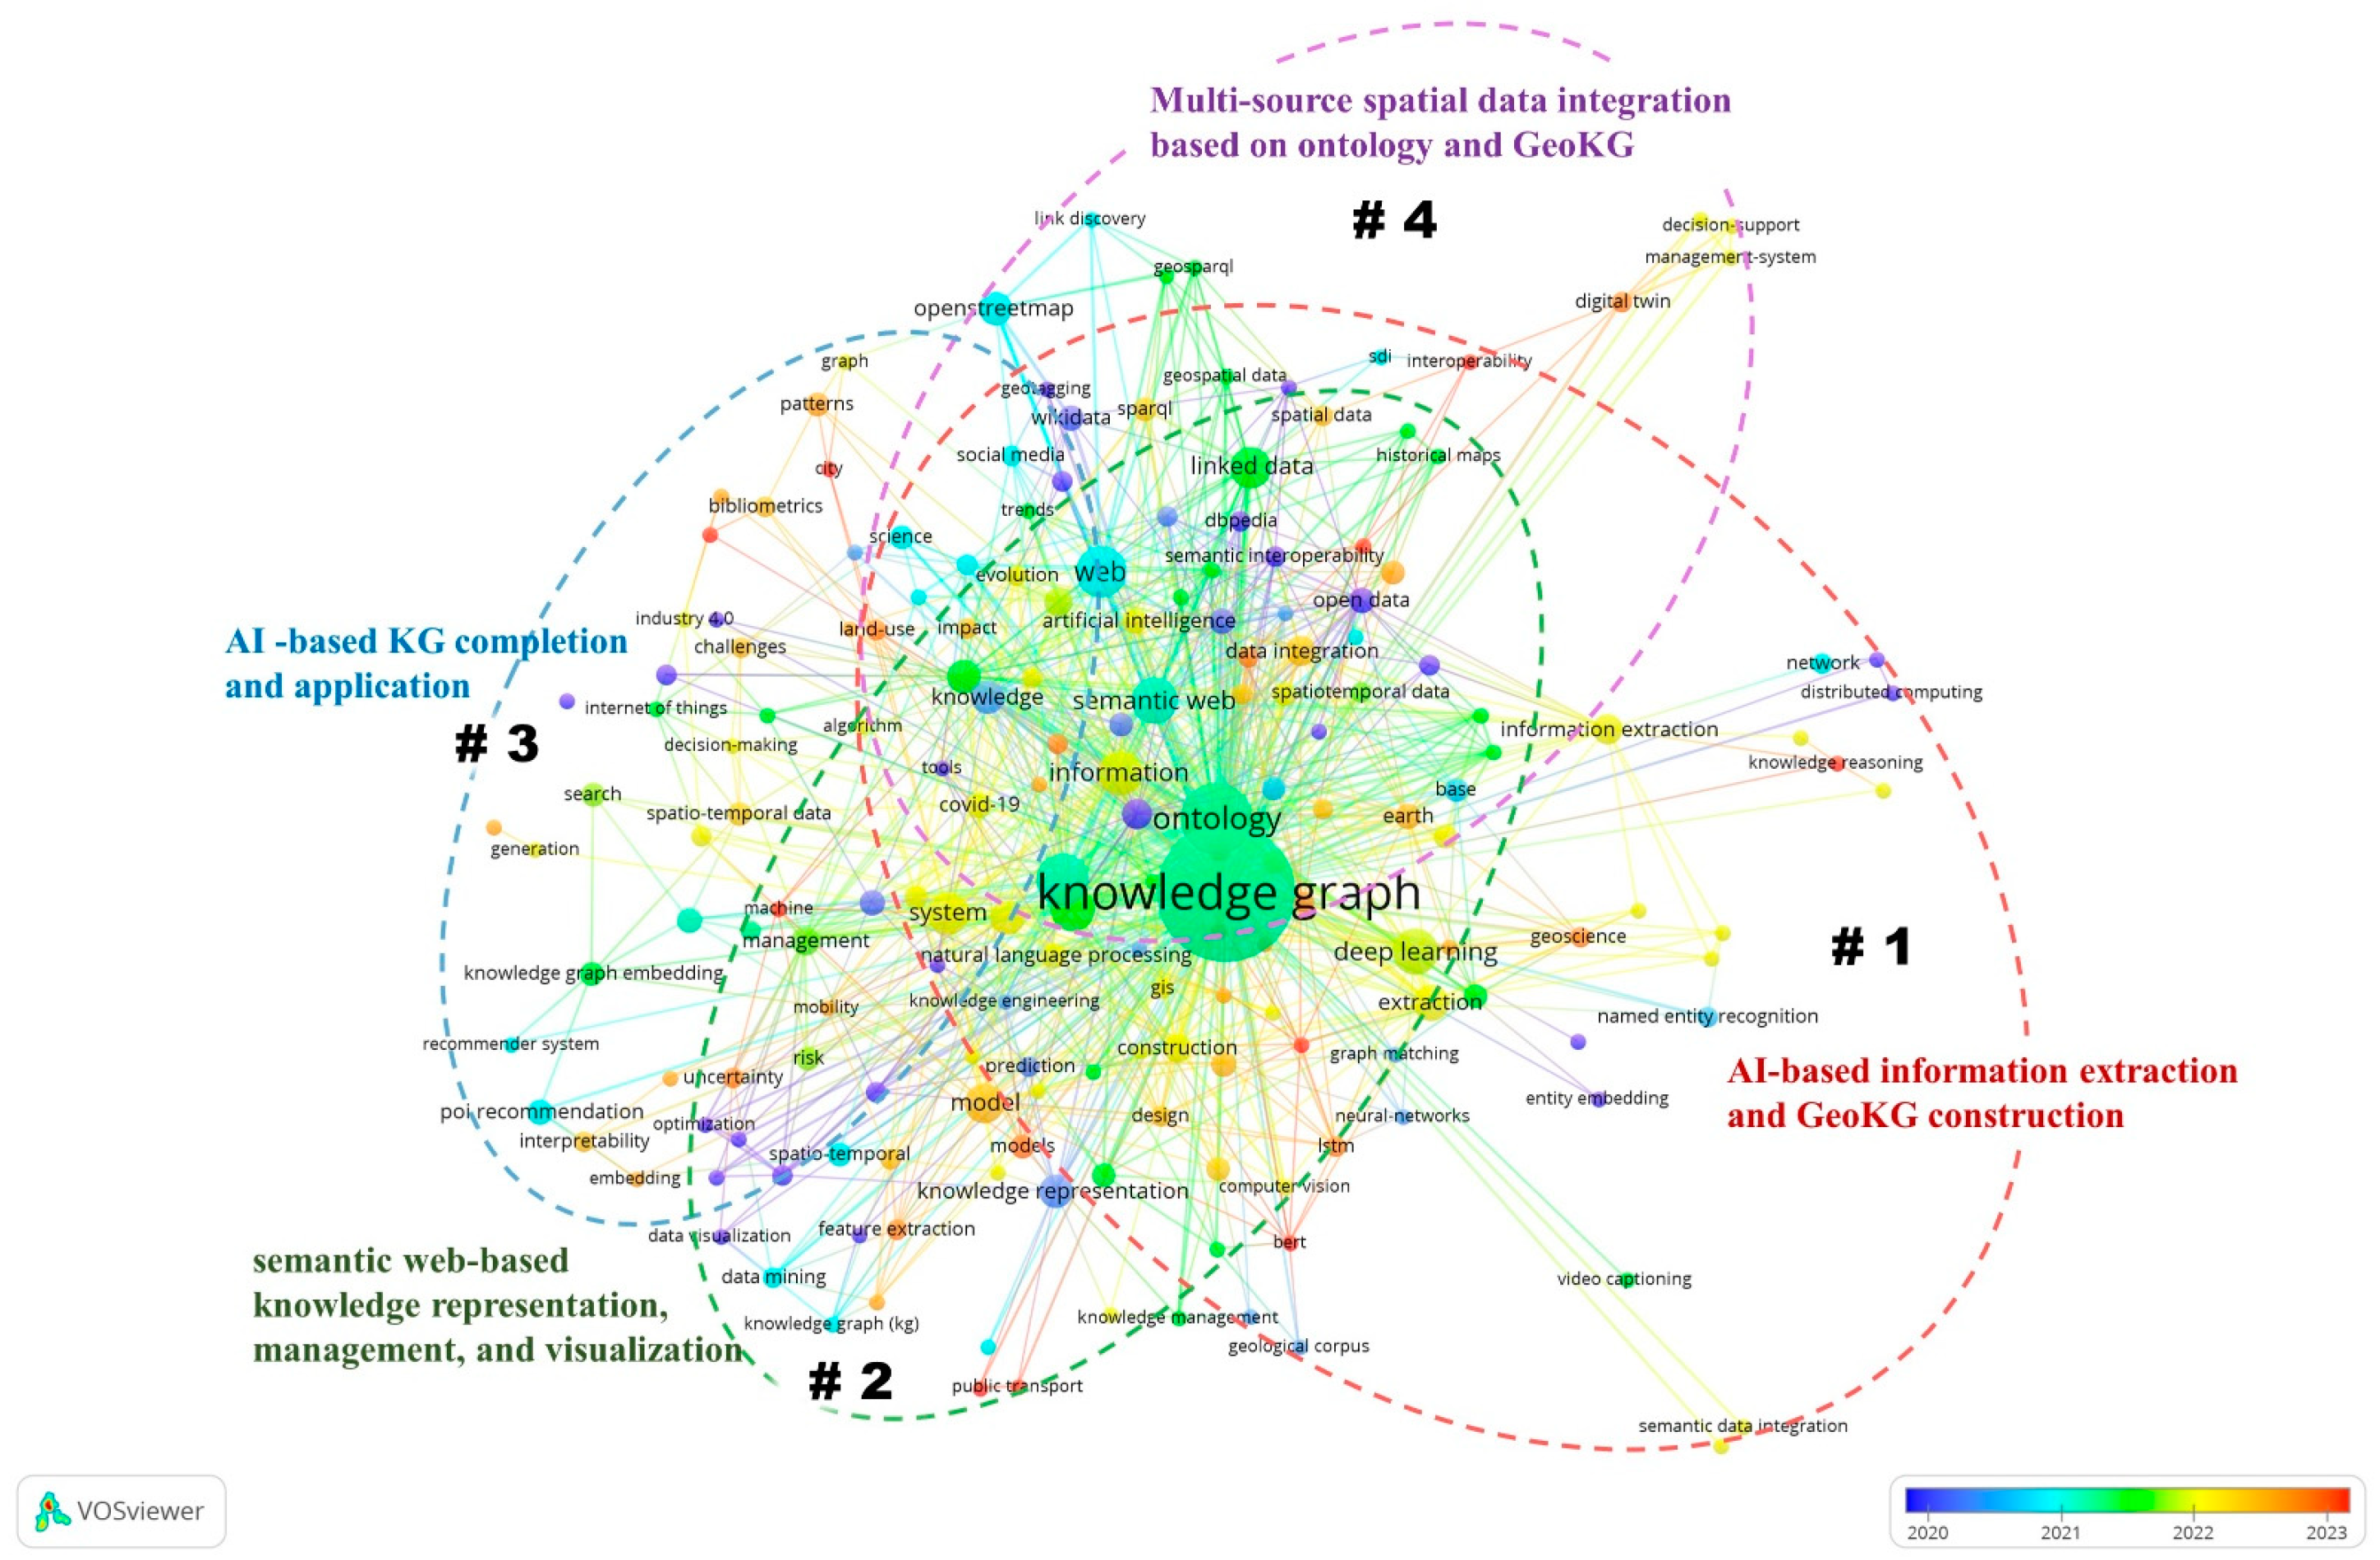
3.5. Keyword Analysis

In this section, the co-occurrence analysis of keywords was performed based on both author keywords and keywords plus using VOSviewer. To achieve better accuracy, the collected bibliometric dataset was pre-processed. Firstly, keywords in plural forms were converted to singular forms (e.g., “knowledge graphs”). Secondly, the term “geospatial knowledge graph” and its synonyms (e.g., “geographic knowledge graph”) were abbreviated as “GeoKG”. Consequently, a total of 191 keywords that appeared at least two times were clustered and visualized, as shown in Figure 9. The size of each node signifies the occurrences of the keyword. Lines connecting two nodes indicate co-occurrence among them, and the line width represents the frequency of the co-occurrence.
These keywords could be grouped into four clusters based on their association strength. Keywords that occurred at least five times in each cluster are listed in Table 7. The average link strength (ALS) of the cluster represents the closeness of the keywords contained in it. The greater the ALS of a cluster, the greater the co-occurrence strength between the keywords and the more concentrated the research topics. Otherwise, it means that the co-occurrence intensity is relatively low and the research is more dispersed. In addition, the TLS of a keyword represents the importance of the keyword in the network. The higher the TLS, the more important the keyword is for the construction of the network. Additionally, the average citation (AC) of the keywords indicates the level of interest in the cluster’s topic.
As illustrated in Figure 9, cluster 1 (red) includes terms commonly found in the topic of AI-based information extraction and GeoKG construction. It covers a variety of AI technologies such as deep learning, NLP, and graph neural networks, aiming to extract knowledge and construct GeoKGs from big data for intelligent applications in different fields [3,8,17]. Cluster 1 has the largest value of AC among the four clusters, indicating that information extraction and GeoKG construction are currently the hottest research topics in the field.
Cluster 2 (green) includes terms frequently used in studies of knowledge representation, management, and visualization that are based on semantic web techniques. It covers several research aspects such as knowledge representation models [29,38], knowledge management and visualization [45], knowledge-enhanced systems [46], and linked open data [47], as well as their applications in various areas such as COVID-19 [14], digital humanities [48], VGEs [44], and so on.
Cluster 3 (dark cyan) includes terms commonly found in the topic of GeoKG completion and application. It emphasizes the use of AI technologies such as machine learning and knowledge embedding for KG completion tasks, particularly link prediction [49]. This then could improve the effectiveness of knowledge-driven applications such as POI recommendation [50] and decision-making [51]. The cluster’s ALS value is the lowest among the four, and the TLS values of the keywords except “knowledge” and “machine learning” are less than 11, demonstrating that the research topics of this cluster are less concentrated.
Cluster 4 (purple) includes terms frequently found in the research of multi-source spatial data integration based on GeoKG. It covers multiple types of spatial data on the Web such as OpenStreetMap, Wikidata, and geologic time scales, as well as semantic web technologies such as ontology, KG, linked data, and SPARQL, aiming to improve the integration and semantic interoperability of spatio-temporal data and information in earth science [43,52]. This cluster has the largest ALS value, indicating that its research contents are highly concentrated.
Furthermore, the APY when a keyword appeared in the GeoKG research domain was calculated and added to each node in the network, shown in Figure 10. The warmer (redder) the nodes are, the more recently the keywords have emerged. The top 10 keywords with the largest value of APY were “bert” (Bidirectional Encoder Representations from Transformers) (1), “knowledge reasoning” (1), “ontology model” (1), “smart city” (1), “machine” (2), “public transport” (2), “smart card data” (2), “models” (cluster 2), “city” (3), and “interoperability” (4). Most of these keywords appear in clusters 1 and 2, indicating that knowledge representation and GeoKG construction were hot topics in recent years. Moreover, these terms could be divided into the following three categories: (a) AI techniques (e.g., BERT, machine, knowledge reasoning), (b) knowledge representation and interoperability (e.g., models, ontology model, interoperability), and (c) smart city (e.g., smart city, public transport, smart card data, city). This means that, in recent years, more attention has been paid to the utilization of AI technologies in geoscience knowledge extraction and reasoning, as well as the extended applications of GeoKG in new fields such as smart cities. Interestingly, the APY for the keyword “ontology” (including “ontology model” and “domain ontology”) is greater than 2021, as the earliest research on geo-ontology can be traced back to the 1990s [26]. Such a long history of activity in the research of geo-ontology implies the fundamental role of semantic modeling and representation of geoscience knowledge in GeoKG research. This may be because it is one of the most important goals of GeoKG to transform unstructured knowledge fragments into a formal representation, to facilitate the integration of multi-source geoscience data, and to enable intelligence.

4. Future Directions for GeoKG Research

In addition to the above-mentioned research topics, there are other important issues that should be paid attention to, but are currently being neglected, as seen in the recent research of geoscience, as well as through examination of the latest KG and AI studies. These important issues are as follows.
(1)
Representation of procedural knowledge in GeoKGs.
Generally, there are two basic types of knowledge: declarative knowledge, and procedural knowledge [5]. Declarative knowledge is also known as descriptive or conceptual knowledge. It comprises all of the explicit knowledge about facts, concepts, and principles that can be used to explain and distinguish things, helping people answer the questions of what, why, and how. Procedural knowledge is also known as operational knowledge or application-context knowledge, and is normally implicit or tacit. It refers to the cognitive processes and operational procedures that define how things are conducted, helping people answer the questions of how to do something to solve a given problem. For example, the experiences and steps to build a geographic model or geoprocessing workflow for a specific application context [53,54]. Existing GeoKGs mainly focus on declarative knowledge, since it is easier to extract and represent than procedural knowledge. Thus, new methods are required in the future to represent procedural knowledge in GeoKG. One possible solution could be case-based methods which transform the acquisition of implicit procedural knowledge from the elicitation of explicit knowledge (e.g., rules) into a task of gathering historical cases, and that is easier and more efficient [55,56,57]. Prof. John P. Wilson, a famous geographer and Editor-in-Chief of the journal Transactions in GIS, has featured case-based method as one of the future needs and opportunities to capture and use the relevant digital terrain modeling application-context knowledge [58].
(2)
Knowledge representation of geoscientific models in GeoKGs.
Geoscientific models have been recognized as powerful and effective tools to solve complex geoscientific problems. Prof. Krzysztof Janowicz outlined spatially explicit models as one of the significant research directions of GeoAI in one of his hot papers (with an LCS value of 140) [10]. To date, the number of geoscientific models available across various sub-domains of geoscience, including earth and environmental science, geography and remote sensing, and related fields, has increased significantly [59]. Consequently, it is increasingly difficult for users, especially non-experts, to discover and build fit-for-application models. Therefore, intelligent methods and tools that can minimize the dependence on users’ modeling knowledge and skills, e.g., question answering and recommendation of models and input data for specific application contexts, are urgently needed [53,54,60]. This idea is similar to the semantically aware environmental modeling approach proposed by Villa et al. [61], who have received 91 citations in the local database. However, existing GeoKGs have mostly ignored the knowledge of geoscientific models, while research on model knowledge or intelligent modeling has neglected the construction of GeoKGs [61,62,63,64]. Thus, further studies of GeoKGs regarding the knowledge representation of geoscientific models would be worthwhile.
(3)
Construction of multi-modal GeoKGs.
Multi-modal knowledge graph (MMKG) is a key step towards the realization of human-level machine intelligence [65]. The search of the term “multi-modal knowledge graph*” in WoSCC from 2020 to 2023 returned 225 publications, reflecting the research enthusiasm for this topic in the field of KG. Geoscience knowledge is inherently multi-modal. For example, both text and maps are essential for understanding, representing, and propagating geospatial information [66]. The systematization, completeness, and richness of geoscience knowledge vary significantly between different modalities [2]. In addition, learning from multi-modal sources, including the correspondences between modalities, makes it possible for AI to gain an in-depth understanding of natural phenomena, i.e., it improves the robustness and performance of deep learning models [67]. Thus, geoscience data in different modalities such as text, images, maps, schematic diagrams, data tables, and videos are important sources for constructing and updating GeoKG [2,3,68]. However, most of the existing GeoKGs focus on representing textual geoscience knowledge, while paying little attention to the proliferation of multi-modal geoscience data. This weakens the capability of machines to describe and understand the real world [65]. Thus, more efforts are required in the future to construct multi-modal GeoKGs, i.e., to associate symbolic knowledge in a traditional GeoKG, including entities, concepts, relations, etc., to their corresponding entities in other modalities [65].
(4)
Integration of Large Language Models (LLMs) and GeoKGs.
Large language models (LLMs) have achieved huge success in recent years for their great performance in the field of AI, especially in NLP tasks such as question answering and text generation. A total of 1117 related articles published in 2023 were retrieved from WoSCC using the search term “Large Language Model* or LLM*”, indicating the huge impact of LLMs on the research of AI. LLMs and KGs can mutually enhance each other. LLMs can be applied to augment various KG-related tasks, e.g., KG construction, KG embedding, KG completion, and KG-based question answering, to improve the performance and facilitate the applications, while KGs can be used to augment LLMs for, e.g., training and prompt learning, or providing explicit domain knowledge, so as to mitigate hallucination and improve interpretability [69,70]. However, while integrating LLMs into geoscience is currently a hot topic [71,72], no research has been found that investigated the integration of LLMs and GeoKGs. Therefore, it is strongly recommended to unify LLMs and GeoKGs in the future. This may not only change the trend in GeoKG research, but also delay the predicted maturity year (i.e., 2028).

5. Conclusions and Limitations

The purpose of this study is to analyze the current state and future trends in GeoKG research from a quantitative perspective using bibliometric techniques. A total of 294 papers concerning GeoKG research published from 2012 to 2023 were collected from the WoSCC database and analyzed using the bibliometrix R package and VOSviewer software. Results of the bibliometric analysis show that there has been an ongoing increase in GeoKG research over the past 12 years, particularly since 2019. This trend will be sustained until 2028, as predicted by the Logistic Growth Model. ISPRS International Journal of Geo-Information and Computers & Geosciences were the most productive and most cited journals in this field, respectively. The research areas of most publications were concentrated in computer science and the sub-disciplines of earth science, including remote sensing, geology, and geography. Moreover, researchers including Janowicz Krzysztof, Ma Xiaogang, Mai Gengchen, and Qiu Qinjun have been highly active in GeoKG research. China has contributed most of the publications in this field, and the Chinese Academy of Sciences has been the most productive institution. Scientific collaboration on GeoKG research is frequent, but still needs to be enhanced, especially for international and inter-institutional collaboration. This analysis also detected that geoscience knowledge representation, information extraction, GeoKG construction, and GeoKG-based multi-source data integration were currently the hot spots in the field. More studies are required for the application of GeoKG. Four research directions, including the representation of procedural knowledge and geoscientific model knowledge in GeoKGs, the construction of multi-modal GeoKGs, and the integration of LLMs and GeoKGs are worthy of attention, and they are expected to become the major research directions in the future.
The major contributions of this review include the following aspects. First, it provides researchers, policymakers, and practitioners with systematic information on the study of GeoKG, helping them to better understand the current state and trends in research in this field or to evaluate the effects of fundings and policies on GeoKG. Second, findings of influential publications and prolific sources provide suggestions about sources to which scholars, especially newcomers to the field, can track the research frontiers and publish their work. Additionally, the results provide valuable information for scientists and institutions to find potential collaborators. More importantly, findings from the review remind researchers of the key research methods and topics in the field as well as the future directions.
However, several limitations of this study need to be acknowledged. First, only English publications from the WoSCC database were collected. Papers written in other languages and distributed in other databases have not been included in this study, and may result in deviation in the results. Adding more data sources such as Scopus and arXiv could make the review more comprehensive. It is the same with papers written in other languages, e.g., Chinese. Second, the time is limited to 2012–2023. Thus, papers published before 2012 and after 2023 were excluded from the study. Expanding the time may provide a more historic view of the field. Third, the growth trend in the publications may last longer than the model predicts, since it could be affected by many factors such as emerging AI techniques and new big science programs. Finally, while bibliometric analysis has its advantages, it is difficult for this quantitative approach to form a deep and thorough conclusion for this interdisciplinary field adequately. Therefore, qualitative review methods that incorporate expert opinions could be employed in the future to enrich our understanding of this evolving and complex research area.

Author Contributions

Conceptualization, Zhi-Wei Hou; methodology, Zhi-Wei Hou; software, Zhi-Wei Hou and Shengnan Zhou; validation, Ji Yang and Xulong Liu; data curation, Zhi-Wei Hou, Xulong Liu and Shengnan Zhou; writing—original draft preparation, Zhi-Wei Hou; writing—review and editing, Zhi-Wei Hou, Xulong Liu and Shengnan Zhou; visualization, Zhi-Wei Hou and Shengnan Zhou; supervision, Ji Yang; project administration, Zhi-Wei Hou and Wenlong Jing; funding acquisition, Zhi-Wei Hou, Ji Yang and Wenlong Jing. All authors have read and agreed to the published version of the manuscript.

Funding

This research was funded by the National Natural Science Foundation of China, grant number 42301536; the GDAS’ Project of Science and Technology Development, grant number 2022GDASZH-2022010202, 2022GDASZH-2022010111, and 2022GDASZH-2022020402-01; and the Science and Technology Program of Guangdong, grant number 2021B1212100006. The APC was funded by 42301536.

Data Availability Statement

Data are available on request from the authors.

Conflicts of Interest

The authors declare no conflicts of interest.

References

  1. Hogan, A.; Blomqvist, E.; Cochez, M.; d’Amato, C.; de Melo, G.; Gutierrez, C.; Gayo, J.E.L.; Kirrane, S.; Neumaier, S.; Polleres, A.; et al. Knowledge graphs. Commun. ACM 2021, 64, 96–104. [Google Scholar]
  2. Zhang, X.; Huang, Y.; Zhang, C.; Ye, P. Geoscience Knowledge Graph (GeoKG): Development, construction and challenges. Trans. GIS 2022, 26, 2480–2494. [Google Scholar] [CrossRef]
  3. Zhou, C.; Wang, H.; Wang, C.; Hou, Z.; Zheng, Z.; Shen, S.; Cheng, Q.; Feng, Z.; Wang, X.; Lv, H.; et al. Geoscience knowledge graph in the big data era. Sci. China Earth Sci. 2021, 64, 1105–1114. [Google Scholar] [CrossRef]
  4. Zhu, Y.; Sun, K.; Wang, S.; Zhou, C.; Lu, F.; Lv, H.; Qiu, Q.; Wang, X.; Qi, Y. An adaptive representation model for geoscience knowledge graphs considering complex spatiotemporal features and relationships. Sci. China Earth Sci. 2023, 66, 2563–2578. [Google Scholar] [CrossRef]
  5. Lu, F.; Zhu, Y.; Zhang, X. Spatiotemporal knowledge graph: Advances and perspectives. J. Geo-Inf. Sci. 2023, 25, 1091–1105. [Google Scholar]
  6. Wang, C.; Hazen, R.M.; Cheng, Q.; Stephenson, M.H.; Zhou, C.; Fox, P.A.; Shen, S.-Z.; Oberhänsli, R.; Hou, Z.; Ma, X.; et al. The Deep-Time Digital Earth program: Data-driven discovery in geosciences. Natl. Sci. Rev. 2021, 8, nwab027. [Google Scholar] [CrossRef] [PubMed]
  7. Chen, J.; Liu, W.; Wu, H.; Li, Z.; Zhao, Y.; Zhang, L. Basic Issues and Research Agenda of Geospatial Knowledge Service. Geomat. Inf. Sci. Wuhan Univ. 2019, 44, 38–47. [Google Scholar] [CrossRef]
  8. Ma, X. Knowledge graph construction and application in geosciences: A review. Comput. Geosci. 2022, 161, 105082. [Google Scholar] [CrossRef]
  9. Mai, G.; Hu, Y.; Gao, S.; Cai, L.; Martins, B.; Scholz, J.; Gao, J.; Janowicz, K. Symbolic and subsymbolic GeoAI: Geospatial knowledge graphs and spatially explicit machine learning. Trans. GIS 2022, 26, 3118–3124. [Google Scholar] [CrossRef]
  10. Janowicz, K.; Gao, S.; McKenzie, G.; Hu, Y.; Bhaduri, B. GeoAI: Spatially explicit artificial intelligence techniques for geographic knowledge discovery and beyond. Int. J. Geogr. Inf. Sci. 2020, 34, 625–636. [Google Scholar] [CrossRef]
  11. Gao, S. A Review of Recent Researches and Reflections on Geospatial Artificial Intelligence. Geomat. Inf. Sci. Wuhan Univ. 2020, 45, 1865–1874. [Google Scholar] [CrossRef]
  12. Qian, T.; Liu, B.; Nguyen, Q.V.H.; Yin, H. Spatiotemporal Representation Learning for Translation-Based POI Recommendation. ACM Trans. Inf. Syst. (TOIS) 2019, 37, 18. [Google Scholar] [CrossRef]
  13. Scheider, S.; Nyamsuren, E.; Kruiger, H.; Xu, H. Geo-analytical question-answering with GIS. Int. J. Digit. Earth 2020, 14, 1–14. [Google Scholar] [CrossRef]
  14. Jiang, B.C.; You, X.; Li, K.K.F.; Li, T.; Zhou, X.; Tan, L. Interactive Analysis of Epidemic Situations Based on a Spatiotemporal Information Knowledge Graph of COVID-19. IEEE Access 2022, 10, 46782–46795. [Google Scholar] [CrossRef] [PubMed]
  15. Lu, F.; Yu, L.; Qiu, P. On Geographic Knowledge Graph. J. Geo-Inf. Sci. 2017, 19, 723–734. [Google Scholar]
  16. Hu, Y. Geo-text data and data-driven geospatial semantics. Geogr. Compass 2018, 12, e12404. [Google Scholar] [CrossRef]
  17. Wang, C.; Li, Y.; Chen, J. Text mining and knowledge graph construction from geoscience literature legacy: A review. In Recent Advancement in Geoinformatics and Data Science; Ma, X., Mookerjee, M., Hsu, L., Hills, D., Eds.; Geological Society of America: Boulder, CO, USA, 2023; Volume 558. [Google Scholar]
  18. Zhu, Y.; Sun, K.; Li, W.; Wang, S.; Song, J.; Cheng, Q.; Yang, J.; Mu, X.; Geng, W.; Dai, X. Comparative Analysis and Enlightenment of Geoscience Knowledge Graphs: A Perspective of Construction Methods and Contents. Geol. J. China Univ. 2023, 29, 382–394. [Google Scholar]
  19. Donthu, N.; Kumar, S.; Mukherjee, D.; Pandey, N.; Lim, W.M. How to conduct a bibliometric analysis: An overview and guidelines. J. Bus. Res. 2021, 133, 285–296. [Google Scholar] [CrossRef]
  20. Mukherjee, D.; Lim, W.M.; Kumar, S.; Donthu, N. Guidelines for advancing theory and practice through bibliometric research. J. Bus. Res. 2022, 148, 101–115. [Google Scholar] [CrossRef]
  21. Khare, A.; Jain, R. Mapping the conceptual and intellectual structure of the consumer vulnerability field: A bibliometric analysis. J. Bus. Res. 2022, 150, 567–584. [Google Scholar] [CrossRef]
  22. Li, J.; Goerlandt, F.; Li, K.W. Slip and Fall Incidents at Work: A Visual Analytics Analysis of the Research Domain. Int. J. Environ. Res. Public Health 2019, 16, 4972. [Google Scholar] [CrossRef] [PubMed]
  23. Liu, F.; Lin, A.; Wang, H.; Peng, Y.; Hong, S. Global research trends of geographical information system from 1961 to 2010: A bibliometric analysis. Scientometrics 2016, 106, 751–768. [Google Scholar] [CrossRef]
  24. Chen, X.; Xie, H.; Li, Z.; Cheng, G. Topic analysis and development in knowledge graph research: A bibliometric review on three decades. Neurocomputing 2021, 461, 497–515. [Google Scholar] [CrossRef]
  25. Buchgeher, G.; Gabauer, D.; Martinez-Gil, J.; Ehrlinger, L. Knowledge Graphs in Manufacturing and Production: A Systematic Literature Review. IEEE Access 2021, 9, 55537–55554. [Google Scholar] [CrossRef]
  26. Li, L.; Liu, Y.; Zhu, H.; Ying, S.; Luo, Q.; Luo, H.; Xi, K.; Xia, H.; Shen, H. A bibliometric and visual analysis of global geo-ontology research. Comput. Geosci. 2017, 99, 1–8. [Google Scholar] [CrossRef]
  27. Singh, V.K.; Singh, P.; Karmakar, M.; Leta, J.; Mayr, P. The journal coverage of Web of Science, Scopus and Dimensions: A comparative analysis. Scientometrics 2021, 126, 5113–5142. [Google Scholar] [CrossRef]
  28. Zhu, Y. Geospatial semantics, ontology and knowledge graphs for big Earth data. Big Earth Data 2019, 3, 187–190. [Google Scholar] [CrossRef]
  29. Wang, S.; Zhang, X.; Ye, P.; Du, M.; Lu, Y.; Xue, H. Geographic knowledge graph (GeoKG): A formalized geographic knowledge representation. ISPRS Int. J. Geo-Inf. 2019, 8, 184. [Google Scholar] [CrossRef]
  30. Steinberg, P.; Peters, K. Wet Ontologies, Fluid Spaces: Giving Depth to Volume through Oceanic Thinking. Environ. Plan. D Soc. Space 2015, 33, 247–264. [Google Scholar] [CrossRef]
  31. Hunt, S. Ontologies of Indigeneity: The politics of embodying a concept. Cult. Geogr. 2013, 21, 27–32. [Google Scholar] [CrossRef]
  32. Aria, M.; Cuccurullo, C. bibliometrix: An R-tool for comprehensive science mapping analysis. J. Informetr. 2017, 11, 959–975. [Google Scholar] [CrossRef]
  33. Batista-Canino, R.M.; Santana-Hernández, L.; Medina-Brito, P. A scientometric analysis on entrepreneurial intention literature: Delving deeper into local citation. Heliyon 2023, 9, e13046. [Google Scholar] [CrossRef] [PubMed]
  34. Shao, B.; Li, X.; Bian, G. A survey of research hotspots and frontier trends of recommendation systems from the perspective of knowledge graph. Expert Syst. Appl. 2021, 165, 113764. [Google Scholar] [CrossRef]
  35. Zhang, J.; Yu, Q.; Zheng, F.; Long, C.; Lu, Z.; Duan, Z. Comparing keywords plus of WOS and author keywords: A case study of patient adherence research. J. Assoc. Inf. Sci. Technol. 2016, 67, 967–972. [Google Scholar] [CrossRef]
  36. Zeng, L.; Li, Z.; Zhao, Z.; Mao, M. Landscapes and Emerging Trends of Virtual Reality in Recent 30 Years: A Bibliometric Analysis. In Proceedings of the 2018 IEEE SmartWorld, Ubiquitous Intelligence & Computing, Advanced & Trusted Computing, Scalable Computing & Communications, Cloud & Big Data Computing, Internet of People and Smart City Innovation (SmartWorld/SCALCOM/UIC/ATC/CBDCom/IOP/SCI), Guangzhou, China, 8–12 October 2018; pp. 1852–1858. [Google Scholar]
  37. Schraven, D.; Joss, S.; de Jong, M. Past, present, future: Engagement with sustainable urban development through 35 city labels in the scientific literature 1990–2019. J. Clean. Prod. 2021, 292, 125924. [Google Scholar] [CrossRef]
  38. Zheng, K.; Xie, M.H.; Zhang, J.B.; Xie, J.; Xia, S.H. A knowledge representation model based on the geographic spatiotemporal process. Int. J. Geogr. Inf. Sci. 2022, 36, 674–691. [Google Scholar] [CrossRef]
  39. Ma, X.; Ma, C.; Wang, C. A new structure for representing and tracking version information in a deep time knowledge graph. Comput. Geosci. 2020, 145, 104620. [Google Scholar] [CrossRef]
  40. Wang, C.; Ma, X.; Chen, J.; Chen, J. Information extraction and knowledge graph construction from geoscience literature. Comput. Geosci. 2018, 112, 112–120. [Google Scholar] [CrossRef]
  41. Li, S.; Chen, J.; Xiang, J. Prospecting Information Extraction by Text Mining Based on Convolutional Neural Networks–A Case Study of the Lala Copper Deposit, China. IEEE Access 2018, 6, 52286–52297. [Google Scholar] [CrossRef]
  42. Janowicz, K.; Hitzler, P.; Li, W.; Rehberger, D.; Schildhauer, M.; Zhu, R.; Shimizu, C.; Fisher, C.K.; Cai, L.; Mai, G.; et al. Know, Know Where, KnowWhereGraph: A densely connected, cross-domain knowledge graph and geo-enrichment service stack for applications in environmental intelligence. AI Mag. 2022, 43, 30–39. [Google Scholar] [CrossRef]
  43. Tempelmeier, N.; Demidova, E. Linking OpenStreetMap with knowledge graphs—Link discovery for schema-agnostic volunteered geographic information. Future Gener. Comput. Syst. 2021, 116, 349–364. [Google Scholar] [CrossRef]
  44. Zhang, Y.; Zhu, J.; Zhu, Q.; Xie, Y.; Li, W.; Fu, L.; Zhang, J.; Tan, J. The construction of personalized virtual landslide disaster environments based on knowledge graphs and deep neural networks. Int. J. Digit. Earth 2020, 13, 1637–1655. [Google Scholar] [CrossRef]
  45. Li, W.; Wang, S.; Chen, X.; Tian, Y.; Gu, Z.; Lopez-Carr, A.; Schroeder, A.; Currier, K.; Schildhauer, M.; Zhu, R. GeoGraphVis: A Knowledge Graph and Geovisualization Empowered Cyberinfrastructure to Support Disaster Response and Humanitarian Aid. ISPRS Int. J. Geo-Inf. 2023, 12, 112. [Google Scholar] [CrossRef]
  46. Liu, Y.; Ding, J.; Li, Y. Developing knowledge graph based system for urban computing. In Proceedings of the 1st ACM SIGSPATIAL International Workshop on Geospatial Knowledge Graphs, Seattle, WA, USA, 1 November 2022; pp. 3–7. [Google Scholar]
  47. Zhu, Y.; Zhu, A.; Song, J.; Yang, J.; Feng, M.; Sun, K.; Zhang, J.; Hou, Z.; Zhao, H. Multidimensional and quantitative interlinking approach for Linked Geospatial Data. Int. J. Digit. Earth 2017, 10, 923–943. [Google Scholar] [CrossRef]
  48. Koho, M.; Ikkala, E.; Leskinen, P.; Tamper, M.; Tuominen, J.; Hyvönen, E. WarSampo knowledge graph: Finland in the Second World War as Linked Open Data. Semant. Web 2021, 12, 265–278. [Google Scholar] [CrossRef]
  49. Wang, Y.; Zhang, H.; Xie, H. Geography-Enhanced Link Prediction Framework for Knowledge Graph Completion. In Knowledge Graph and Semantic Computing: Knowledge Computing and Language Understanding, Proceedings of the 4th China Conference, CCKS 2019, Hangzhou, China, 24–27 August 2019; Springer: Singapore, 2019; pp. 198–210. [Google Scholar]
  50. Chen, W.; Wan, H.; Guo, S.; Huang, H.; Zheng, S.; Li, J.; Lin, S.; Lin, Y. Building and exploiting spatial–temporal knowledge graph for next POI recommendation. Knowl.-Based Syst. 2022, 258, 109951. [Google Scholar] [CrossRef]
  51. Gao, J.; Peng, P.; Lu, F.; Claramunt, C.; Xu, Y. Towards travel recommendation interpretability: Disentangling tourist decision-making process via knowledge graph. Inf. Process. Manag. 2023, 60, 103369. [Google Scholar] [CrossRef]
  52. Wu, J.; Orlandi, F.; O’Sullivan, D.; Dev, S. LinkClimate: An interoperable knowledge graph platform for climate data. Comput. Geosci. 2022, 169, 105215. [Google Scholar] [CrossRef]
  53. Qin, C.-Z.; Zhu, A.-X. Towards Domain-Knowledge-Based Intelligent Geographical Modeling. In New Thinking in GIScience; Springer: Singapore, 2022; pp. 171–178. [Google Scholar]
  54. Hou, Z.-W.; Qin, C.-Z.; Zhu, A.-X.; Liang, P.; Wang, Y.-J.; Zhu, Y.-Q. From Manual to Intelligent: A Review of Input Data Preparation Methods for Geographic Modeling. ISPRS Int. J. Geo-Inf. 2019, 8, 376. [Google Scholar] [CrossRef]
  55. Watson, I.; Marir, F. Case-based reasoning: A review. Knowl. Eng. Rev. 1994, 9, 327–354. [Google Scholar] [CrossRef]
  56. Qin, C.; Wu, X.; Jiang, J.; Zhu, A.-X. Case-based knowledge formalization and reasoning method for digital terrain analysis—Application to extracting drainage networks. Hydrol. Earth Syst. Sci. 2016, 20, 3379–3392. [Google Scholar] [CrossRef]
  57. Liang, P.; Qin, C.Z.; Zhu, A.X.; Zhu, T.X.; Fan, N.Q.; Hou, Z.W. Using the most similar case method to automatically select environmental covariates for predictive mapping. Earth Sci. Inform. 2020, 13, 719–728. [Google Scholar] [CrossRef]
  58. Wilson, J.P. Environmental Applications of Digital Terrain Modeling; Wiley-Blackwell: Oxford, UK, 2018. [Google Scholar]
  59. Chen, M.; Voinov, A.; Ames, D.P.; Kettner, A.J.; Goodall, J.L.; Jakeman, A.J.; Barton, M.C.; Harpham, Q.; Cuddy, S.M.; DeLuca, C.; et al. Position paper: Open web-distributed integrated geographic modelling and simulation to enable broader participation and applications. Earth-Sci. Rev. 2020, 207, 103223. [Google Scholar] [CrossRef]
  60. Zhu, Y.; Yang, J. Automatic data matching for geospatial models: A new paradigm for geospatial data and models sharing. Ann. GIS 2019, 25, 283–298. [Google Scholar] [CrossRef]
  61. Villa, F.; Athanasiadis, I.N.; Rizzoli, A.E. Modelling with knowledge: A review of emerging semantic approaches to environmental modelling. Environ. Model. Softw. 2009, 24, 577–587. [Google Scholar] [CrossRef]
  62. Zhu, Y.; Zhu, A.-X.; Feng, M.; Song, J.; Zhao, H.; Yang, J.; Zhang, Q.; Sun, K.; Zhang, J.; Yao, L. A similarity-based automatic data recommendation approach for geographic models. Int. J. Geogr. Inf. Sci. 2017, 31, 1403–1424. [Google Scholar] [CrossRef]
  63. Jiang, J.; Zhu, A.X.; Qin, C.Z.; Liu, J. A knowledge-based method for the automatic determination of hydrological model structures. J. Hydroinform. 2019, 21, 1163–1178. [Google Scholar] [CrossRef]
  64. Xu, K.; Yue, S.; Chen, Q.; Wang, J.; Zhang, F.; Wang, Y.; Ma, P.; Wen, Y.; Chen, M.; Lü, G. Construction of an open knowledge framework for geoscientific models. Trans. GIS 2024, 28, 154–175. [Google Scholar] [CrossRef]
  65. Zhu, X.; Li, Z.; Wang, X.; Jiang, X.; Sun, P.; Wang, X.; Xiao, Y.; Yuan, N.J. Multi-Modal Knowledge Graph Construction and Application: A Survey. arXiv 2022, arXiv:2202.05786. [Google Scholar] [CrossRef]
  66. Hu, Z.; Tang, G.; Lu, G. A new geographical language: A perspective of GIS. J. Geogr. Sci. 2014, 24, 560–576. [Google Scholar] [CrossRef]
  67. Baltrusaitis, T.; Ahuja, C.; Morency, L.-P. Multimodal Machine Learning: A Survey and Taxonomy. IEEE Trans. Pattern Anal. Mach. Intell. 2019, 41, 423–443. [Google Scholar] [CrossRef] [PubMed]
  68. Deng, C.; Jia, Y.; Xu, H.; Zhang, C.; Tang, J.; Fu, L.; Zhang, W.; Zhang, H.; Wang, X.; Zhou, C. GAKG: A Multimodal Geoscience Academic Knowledge Graph. In Proceedings of the 30th ACM International Conference on Information & Knowledge Management, Virtual, 1–5 November 2021. [Google Scholar]
  69. Pan, S.; Luo, L.; Wang, Y.; Chen, C.; Wang, J.; Wu, X. Unifying large language models and knowledge graphs: A roadmap. IEEE Trans. Knowl. Data Eng. 2024, 36, 3580–3599. [Google Scholar] [CrossRef]
  70. Pan, J.Z.; Razniewski, S.; Kalo, J.-C.; Singhania, S.; Chen, J.; Dietze, S.; Jabeen, H.; Omeliyanenko, J.; Zhang, W.; Lissandrini, M.; et al. Large Language Models and Knowledge Graphs: Opportunities and Challenges. TGDK 2023, 1, 2:1–2:38. [Google Scholar]
  71. Wang, S.; Hu, T.; Xiao, H.; Li, Y.; Zhang, C.; Ning, H.; Zhu, R.; Li, Z.; Ye, X. GPT, large language models (LLMs) and generative artificial intelligence (GAI) models in geospatial science: A systematic review. Int. J. Digit. Earth 2024, 17, 2353122. [Google Scholar] [CrossRef]
  72. Deng, C.; Zhang, T.; He, Z.; Chen, Q.; Shi, Y.; Xu, Y.; Fu, L.; Zhang, W.; Wang, X.; Zhou, C. K2: A foundation language model for geoscience knowledge understanding and utilization. In Proceedings of the 17th ACM International Conference on Web Search and Data Mining, Merida, Mexico, 4–8 March 2024; pp. 161–170. [Google Scholar]
Figure 1. The research framework of this review.
Ijgi 13 00255 g001
Figure 2. Trends in the annual number of publications and citations on GeoKG during 2012–2023.
Ijgi 13 00255 g002
Figure 3. Growth trend curve of publication number.
Ijgi 13 00255 g003
Figure 4. WoS research areas of GeoKG.
Ijgi 13 00255 g004
Figure 5. Collaboration networks of core authors on GeoKG research.
Ijgi 13 00255 g005
Figure 6. Collaboration networks with the average publication year of each author.
Ijgi 13 00255 g006
Figure 7. Institutions’ collaboration network map and clusters based on VOSviewer.
Ijgi 13 00255 g007
Figure 8. Countries’ collaboration world map. Numbers in brackets represent the links between the country and others.
Ijgi 13 00255 g008
Figure 9. Distribution of keywords and topics on GeoKG research based on VOSviewer.
Ijgi 13 00255 g009
Figure 10. Keywords’ average year distribution in the GeoKG research domain.
Ijgi 13 00255 g010
Table 1. Top 11 most influential documents ranked using LCS with a minimal value of 8.
RankDocumentReferenceLCSGCSYear
1Wang S, 2019, ISPRS INT J GEO-INF[29]23362019
2Wang CB, 2018, COMPUT GEOSCI-UK[40]151082018
3Ma XG, 2020, COMPUT GEOSCI-UK[39]15252020
4Ma XG, 2022, COMPUT GEOSCI-UK[8]12432022
5Janowicz K, 2022, AI MAG[42]11212022
6Zhou CH, 2021, SCI CHINA EARTH SCI[3]10342021
7Zhang YH, 2020, INT J DIGIT EARTH[44]9232020
8Tempelmeier N, 2021, FUTURE GENER COMP SY[43]9182021
9Zheng K, 2022, INT J GEOGR INF SCI[38]9182022
10Li S, 2018, IEEE ACCESS[41]8462018
11Wang CS, 2021, NATL SCI REV[6]8412021
DOI: Digital Object Identifier; LCS: local citation score; GCS: global citation score.
Table 2. Top nine core sources on GeoKG that have published at least five papers.
RankSource NameNPTCACh_Index IFPY_StartJCR Category
1ISPRS International Journal of
Geo-Information
221336.0573.42015Computer Science, Information Systems; Geography, Physical; Remote Sensing
2Transactions in GIS16895.5752.42019Geography
3Geoscience Frontiers8263.2538.92023Geosciences, Multidisciplinary
4International Journal of Geographical Information Science67111.8355.72015Computer Science, Information Systems; Geography; Geography, Physical; Information Science and Library Science
5Remote Sensing6427352022Environmental Sciences; Geosciences, Multidisciplinary; Imaging Science and Photographic Technology; Remote Sensing
6International Journal of Digital Earth630525.12020Geography, Physical; Remote Sensing
7Computers & Geosciences519438.854.42018Computer Science, Interdisciplinary Applications; Geosciences, Multidisciplinary
8Knowledge Based Systems5295.848.82019Computer Science, Artificial Intelligence
9IEEE Access55911.823.92018Computer Science, Information Systems; Engineering, Electrical and Electronic; Telecommunications
NP: number of productions; TC: WoSCC times cited count; AC: average citations; IF: impact factor 2022; PY_start: first year published; JCR: Journal Citation Reports.
Table 3. Top ten most prolific authors ranked by the number of publications.
RankAuthorNPTCh_Indexg_IndexPY_StartCurrent Institution
1Janowicz Krzysztof122469122015University of California, Santa Barbara
2Mai Gengchen102067102017University of Georgia
3Qiu Qinjun1075482020China University of Geosciences, Wuhan
4Ma Xiaogang8221482018University of Idaho
5Zhu Rui890582019University of Bristol
6Xie Zhong875482020China University of Geosciences, Wuhan
7Demidova Elena846362020University of Bonn
8Ma Kai837362022China Three Gorges University
9Tao Liufeng774472020China University of Geosciences, Wuhan
10Lu Feng733352019Institute of Geographic Sciences and
Natural Resources Research, CAS
NP: number of productions; TC: WoSCC times cited count; PY_start: first year published; CAS: Chinese Academy of Sciences.
Table 4. The top 15 most contributed institutions with a minimal publication number of six.
RankInstitutionNPTCACLinksTLSAPYCountry
1Chinese Academy of Sciences311986.3920612021.97China
2China University of Geosciences, Wuhan2334214.8713422021.78China
3University of Chinese Academy of Sciences201276.3514422021.9China
4University of California, Santa Barbara1325319.46472019.38USA
5University of Bonn12554.58182021.67Germany
6Tsinghua University11645.8213232020.82China
7Leibniz University Hannover9495.44182021.11Germany
8Arizona State University8567492021USA
9Chengdu University of Technology8496.1312222022.75China
10China Three Gorges University8374.635182022.75China
11Ministry of Natural Resources of the PRC8151.889172022.75China
12University of Idaho822127.637162021.63USA
13Nanjing University78912.7112222022.14China
14Southwest Jiaotong University7446.29232021.86China
15Wuhan University611218.67442021.67China
NP: number of productions; TC: times cited count; AC: average citations; TLS: total link strength; APY: average publication year; PRC: People’s Republic of China.
Table 5. The top nine most contributed countries on GeoKG research.
RankCountryNPTCSCPMCPACPMCP_RatioLinksTLS
1China158905128305.730.192055
2USA4846430189.670.3752049
3Germany18701533.890.1671519
4France926722.890.2221012
5United Kingdom835624.380.25714
6Italy644427.330.33346
7Australia41302232.500.51020
8Greece426406.50011
9Ireland412403.00011
NP: number of productions; SCP: singular country publication; MCP: multi-country publication; ACP: average citations per article; TLS: total link strength.
Table 6. Detailed information on the top seven clusters.
ClusterCentered Author *NATLSNMIAAPYColorCountry
1Zhou, Chenghu152212021.50redChina
2Mai, Gengchen82632020.33green USA
3Ge, Xingtong and Peng, Ling72502022.17light blueChina
4Lu, Feng62212021.57goldenChina
5Demidova, Elena51512021.63lilacGermany
6Qiu, Qinjun43042022.50turquoiseChina
7Zhu, Jun4702021.80orangeChina
* Centered authors are those who have the largest total link strength (TLS) in the cluster; NA: number of core authors included in the cluster; NMIA: number of the most influential authors (see Table 3) included in the cluster; APY: average publication year.
Table 7. Clusters of keywords in GeoKG publications.
Cluster ColorTop Keywords (Occurrences, TLS) SizeALSACInterpretation
1redknowledge graph (135, 370), deep learning (15, 38), extraction (5, 45), framework (9, 41), information extraction (7, 21), big data (6, 34), construction (6, 37), artificial intelligence (5, 26), graph neural network (5, 14), natural language processing (5, 14)6918.578.83Information extraction and GeoKG construction based on AI
2greensemantic web (15, 72), visualization (14, 84), system (13, 61), model (11, 39), knowledge representation (8, 20), semantics (7, 34), management (6, 38), COVID-19 (5, 26), linked open data (5, 16)5216.217.26Knowledge representation, management, and visualization
3dark cyanknowledge (8, 29), machine learning (8, 30), knowledge graph completion (5, 8), link prediction (5, 11), poi recommendation (5, 7)347.626.71GeoKG completion and application
4purpleontology (37, 147), GeoKG (20, 51), web (19, 63), information (14, 77), linked data (12, 43), OpenStreetMap (8, 21), data integration (7, 40), earth (5, 37), open data (5, 29), Wikidata (5, 19)3124.356.69Multi-source spatial data integration based on GeoKG
TLS: total link strength; ALS: average link strength; AC: average citation.
Disclaimer/Publisher’s Note: The statements, opinions and data contained in all publications are solely those of the individual author(s) and contributor(s) and not of MDPI and/or the editor(s). MDPI and/or the editor(s) disclaim responsibility for any injury to people or property resulting from any ideas, methods, instructions or products referred to in the content.

