Article

The Influence of Proximity on the Evolution of Urban Innovation Networks in Nanjing Metropolitan Area, China: A Comparative Analysis of Knowledge and Technological Innovations

1
School of Architecture, Southeast University, Nanjing 210096, China
2
School of Architecture and Planning, University of Texas at San Antonio, San Antonio, TX 78209, USA
3
School of Architecture and Urban Planning, Shandong Jianzhu University, Jinan 250013, China
*
Author to whom correspondence should be addressed.
ISPRS Int. J. Geo-Inf. 2024, 13(8), 273; https://doi.org/10.3390/ijgi13080273
Submission received: 25 June 2024 / Revised: 26 July 2024 / Accepted: 30 July 2024 / Published: 1 August 2024

Abstract

:
This study investigates the dynamics of innovation element flows among metropolitan areas and examines the underlying proximity mechanisms that are crucial for elevating urban agglomerations’ innovation levels and spurring their development. Utilizing collaborative publication and patent data, this research constructs knowledge and technological innovation networks within the Nanjing metropolitan area (NMA) from 2013 to 2020. It analyzes the evolution of network structures and applies the Multiple Regression Quadratic Assignment Procedure to discern the proximity mechanisms driving the urban innovation networks’ evolution in NMA. The main findings are as follows: (1) The knowledge collaborations within NMA cities remain largely confined to cities within Jiangsu province, whereas the technological collaborations are shifting from intra-province to cross-province cooperation. (2) Both knowledge and technological innovation networks display a “core-periphery” configuration, with Nanjing maintaining a dominant central position. The scale of the KIN surpasses that of the TIN, while the latter’s growth rate outpaces the former’s. Technological collaborations demonstrate more pronounced spillover effects than their knowledge counterparts. (3) At the metropolitan area level, organizational, social, cognitive, and technological proximities exert varying degrees of influence on innovation cooperation among different innovation entities across various years. Cognitive proximity exhibits the most substantial explanatory power. Based on these findings, the study proposes relevant policy recommendations for constructing an innovative NMA and promoting collaborative innovation development among cities within the NMA.

1. Introduction

Amidst rapid urbanization and intensified regional integration, metropolitan areas are increasingly recognized as pivotal spatial platforms that underpin the shift of regional economies toward innovation-centric configurations and network proliferation. Presently, metropolises such as New York, London, Tokyo, and Chicago are at the forefront of technological innovation, aggregating a plethora of innovative endeavors and emerging as key nodes in the global wealth accumulation process [1]. These areas offer a conducive environment for innovation and entrepreneurial ventures by providing concentrated resources, a rich pool of talent, and repositories of knowledge. This, in turn, accelerates technological advancement and economic expansion and fosters the emergence and evolution of global innovation networks [2]. Looking ahead, as we move from a “local space” to a “flow space” paradigm [3], the establishment of networked regional innovation systems centered on metropolitan regions will be instrumental in facilitating the circulation of innovative components and the dissemination of knowledge and technology, heralding a new model for regional innovation development.

2. Literature Review

2.1. The Relationship between Metropolitan Areas and Urban Innovation

The exploration of how metropolitan areas influence urban innovation commenced in the 1950s with French geographer Gottmann’s seminal study of the northeastern United States’ megalopolis [4]. This concept revolutionized academic perspectives on urban clusters and their interconnectivity, garnering extensive attention and spurring continual research [5]. Initially, the focus was predominantly on the spatial configuration of urban forms [6]; the functional ties between cities were somewhat neglected [7].
Gottmann later underscored two critical roles of megalopolises: firstly, as incubators fostering the emergence of new knowledge, technologies, and innovations that propel socio-economic progress and transformation, and secondly, as pivotal hubs linking cities within and beyond the megalopolis, thus enhancing the exchange of technology, trade, knowledge, and human resources between cities [8]. This notion presaged the innovative potential of megalopolises and their intrinsic networked urban framework. Consequently, by the late 20th century, against the backdrop of the growing knowledge economy and expanding global markets, megalopolises were increasingly recognized as vital catalysts and drivers of regional economic growth [1].
At the dawn of the 21st century, a shift toward network research marked a new era in European academia [9]. In their examination of metropolitan areas such as Barcelona, Vienna, and Stockholm, Fischer et al. [10] introduced novel concepts, including metropolitan innovation systems and inter-city network cooperation. Their research revealed that metropolitan innovation systems exert a considerable influence on innovation stakeholders and underscored the benefits of networking within such interconnected frameworks for these entities. Building on this, Hall and Pain [11] employed the case of eight principal metropolitan regions in Europe to empirically illustrate the networked relationships between these areas and their adjacent cities, approached from a functional connectivity standpoint. This development expanded the scholarly landscape and offered a new context for the exploration of metropolitan regions through the lens of innovation functionality [7,11,12].

2.2. Studies on Metropolitan Areas and Their Innovation Systems in China

The concept of the metropolitan area, first introduced to China as “urban agglomeration”, has aligned with international practices [13,14]. In the 1980s, the Chinese government articulated the strategic objective of leveraging urban agglomeration as the primary spatial configuration to advance urbanization. This approach has progressively led to the emergence of economic growth centers in China, exemplified by regions such as the Beijing–Tianjin–Hebei, Yangtze River Delta, and Pearl River Delta [15]. Presently, extensive research on metropolitan innovation networks is predominantly focused on these tri-city regions as the foundational units of analysis [12,16,17,18].
In China, the rapid progression of urbanization has led to the emergence of “metropolitan areas”, which resemble their international counterparts in spatial terms. These areas are identified as the primary urban zones and their contiguous urbanizing regions within expansive urban agglomeration [15]. As a result, within the Chinese scholarly community, metropolitan areas are recognized as the leading structure of urban agglomerations. Fang and Yu [15] observe that central cities typically undergo a spatiotemporal transition from “city” to “metropolis” then to “metropolitan area” and ultimately to “urban agglomeration” driven by the dual dynamics of agglomeration and dispersion. However, the conception and structure of metropolitan areas in China have materialized following the expansion of urban agglomerations. Typically, as urban agglomeration evolves, their core cities increasingly assume critical functions in the global division of labor, developing into larger urban formations known as metropolitan areas.
Simultaneously, after decades of concentrated development, urban agglomerations in China have not only enhanced their competitiveness but have also given rise to a multitude of problems, including the so-called “urban diseases” [19]. The rapid and efficient development of various modes of transportation [20] has led to high-frequency interactions of people, goods, and knowledge flows. This complexity has surpassed the traditional regional network development model under the concept of “urban agglomerations”, necessitating the reshaping of a new urban regional pattern. Moreover, numerous Chinese cities still grapple with the issue of “passive participation” in the planning of urban agglomerations. There is an imperative need to foster knowledge spillover and diffusion on a more localized spatial scale to encourage collaborative innovation among cities and to forge robust connections within the innovation economy [21]. Consequently, the analysis of metropolitan areas and their innovation systems has become a focal point in the research agendas of Chinese scholars [22,23].

2.3. Studies on Metropolitan Areas and Innovation Networks in China

In 2014, Wang [23] introduced the concept of the “innovative metropolitan area” based on empirical observations and logical reasoning, marking an early investigation into metropolitan regions and their innovation systems. He posited that, in contrast to singular, innovative cities, the central city and its surrounding counterparts within an innovative metropolitan area establish a complex network that transcends the traditional production chain. This network facilitates the dissemination and pooling of innovation resources at the metropolitan scale, thereby enhancing the area’s overall innovative competitiveness. Building on this, Wang and Zhu [24] analyzed the hierarchical structure of innovation linkages among cities within the Nanjing metropolitan area (NMA), drawing on data from the primary business partnerships of 150 high-tech firms based in Nanjing. Their findings underscored the significance of innovation-based intercity network relationships as a distinctive spatial feature of innovative metropolitan areas. Nonetheless, current studies on the innovation networks within such areas often remain theoretical [25] or are substantiated by limited and indirect data [26], highlighting a gap in comprehensive quantitative research that delineates and examines the innovation network dynamics of innovative metropolitan areas.
In recent years, the Chinese government has notably intensified its issuance of policy documents and the implementation of planning strategies at the metropolitan level. This shift acknowledges the pivotal role that metropolitan areas play as effective units for policy execution, a recognition that is increasingly shared across various industry sectors [27]. Consequently, in contrast to sprawling urban agglomerations that grapple with complex coordination issues, a number of growing metropolitan areas, anchored by major cities within these urban agglomerations, are poised to become crucial spatial factors for supporting China’s economic innovation transformation and its engagement in global competition.

2.4. The Essence of Innovation Network Research in Metropolitan Areas

The essence of a metropolitan area’s urban innovation network lies in the intricate inter-city interactions fostered by the exchange of innovation elements among cities [28]. These elements encompass domains such as knowledge and technological innovation [29]. Contemporary research on urban innovation networks tends to concentrate on depicting two unidimensional cooperative frameworks: a knowledge network grounded in scientific paper collaborations [12,30] and a technological network derived from patent partnerships [31,32]. Knowledge innovation pertains to the discovery of novel knowledge, ideas, and methods, with universities and research institutions as primary innovators situated at the vanguard of the innovation value chain. Conversely, technological innovation involves the generation, transformation, and application of new knowledge by enterprises, which play a pivotal role as innovators. This stage accentuates technological advancement and product development, occurring midway to the latter part of the innovation value chain. As integral components of the innovation value chain, knowledge and technological innovation collectively enhance the creation, transformation, and utilization of knowledge, thereby propelling regional economic development [29]. These twin elements, interdependent and crucial, constitute the core functions of the regional innovation system [33]. Consequently, policy-making aimed at bolstering regional innovation collaboration must comprehensively account for the synergistic impact of knowledge and technological innovation.
A review of the literature reveals that metropolitan area research is a global topic that emerged early and has been continuously developing. The innovation system of metropolitan areas is a significant part of the academic research framework. In China, metropolitan areas have typically appeared in the form of “urban agglomerations”. However, the rapid development of the Chinese economy and the large-scale development of urban agglomerations have produced many problems. The need for collaborative innovation among cities urgently requires a shift to a smaller regional scope of study. Therefore, in China, the research perspective on innovation networks has begun to return to the original scale—the metropolitan area level—and has already yielded significant research results. Nonetheless, scholarly inquiry into the urban innovation networks and systems of metropolitan areas is still nascent, necessitating further research to elucidate their spatial attributes and generative processes. Deciphering the evolutionary trajectories of urban innovation networks within metropolitan areas and their underlying drivers is essential for the development of innovative metropolises and the amplification of their collaborative innovation capacities.
Based on the previous analysis, this research aims to establish an urban innovation collaborative network within the NMA, focusing on knowledge and technological innovation. Employing data from collaborative publications and patents, the objective is to elucidate the developmental traits of urban innovation networks subsequent to the formation of the Nanjing Metropolis Area Development Alliance in 2013. The study employs the Multiple Regression Quadratic Assignment Procedure (MRQAP) network regression model to quantitatively assess the underlying proximity dynamics that have shaped the evolution of these networks. It seeks to offer nuanced and actionable insights for fostering a synergistic innovation-driven metropolitan nexus that yields substantial innovation dividends in the NMA.
Hence, the paper primarily probes three research questions:
(1)
What type of network has emerged among the cities in the NMA through collaborative efforts in knowledge and technological innovation? What are its structural properties and evolutionary patterns?
(2)
Which proximity dynamics can account for the emergence of the urban innovation network within the NMA?
(3)
How do varying proximity factors influence the development of the urban innovation network in the NMA, and how do their effects differ between knowledge and technological innovation?

3. Materials and Methods
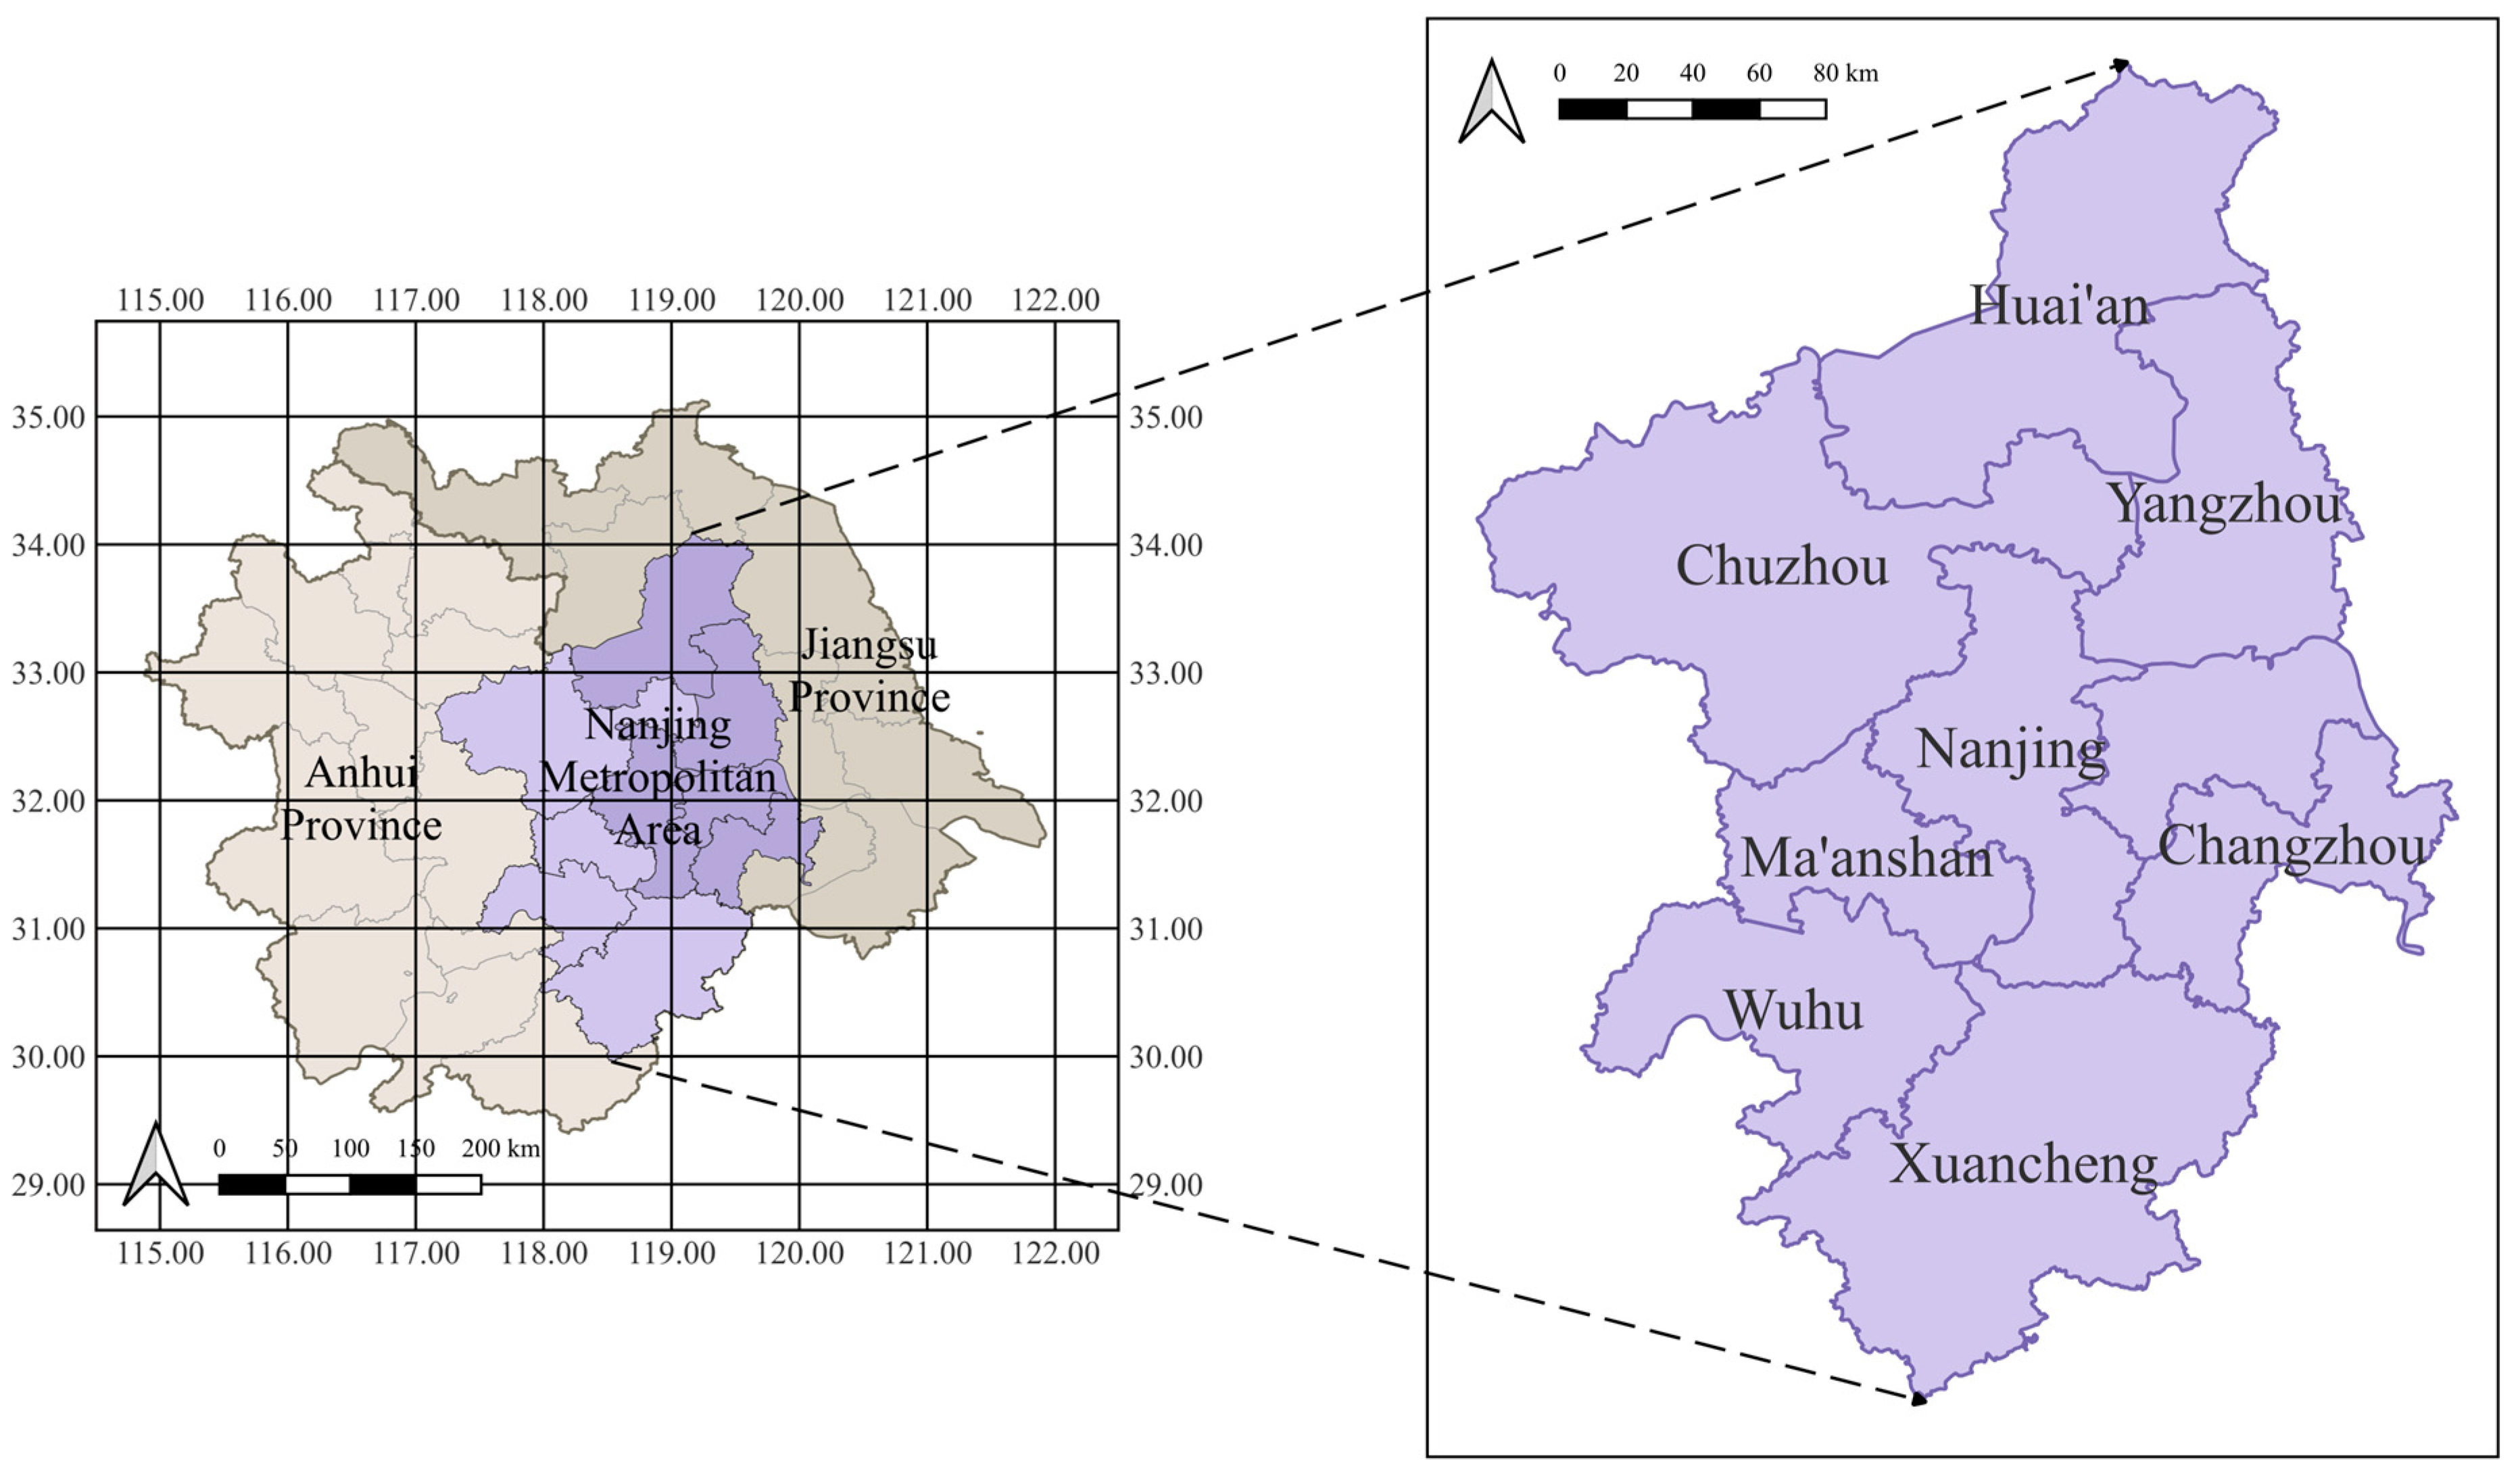
3.1. Study Area

As an integral component of the Yangtze River Delta urban agglomeration, the NMA plays a crucial role in the establishment of the Yangtze River Delta Science and Technology Innovation Community. Spanning Jiangsu and Anhui provinces, it stands as one of China’s pioneering cross-provincial metropolitan developments. It is notably the first region to formulate and adopt the comprehensive “Nanjing Metropolitan Area Plan (2002–2020)” [34]. The evolution of the NMA symbolizes a paradigm shift in China’s regional economic development strategy, transitioning from a focus on administrative regions to a balanced emphasis on both economic zones and administrative divisions. It demonstrates significant typicality and representativeness in the formation and progression of metropolitan areas within China. With two decades of sustained development and construction, the NMA has seen its constituent cities expand and evolve. The most recent “Nanjing Metropolitan Area Development Plan” issued in 2021, delineates a planned expanse that includes nine prefecture-level cities: Nanjing, Zhenjiang, Yangzhou, Huaian, and Changzhou (encompassing Liyang City and Jintan District) in Jiangsu Province, alongside Ma’anshan, Wuhu, Chuzhou, and Xuancheng in Anhui Province (Figure 1). Changzhou, the latest addition, demonstrates robust integration momentum within the Yangtze River Delta’s collaborative planning framework. Hence, this study incorporates the entirety of Changzhou’s municipal region into the NMA’s scope for an all-encompassing analysis.
In the initial phase, collaboration within the NMA predominantly hinged on an organically developed “regional economic network” that revolved around investment and the exchange of information. However, post-2013, the inception of the “Nanjing Metropolitan Area Urban Development Alliance” paved the way for the establishment of collaborative mechanisms, thereby fostering a comprehensive “collaborative work network”. As a result, the NMA has decisively transitioned into an era of innovation-driven development. Since then, the Chinese government has initiated top-down planning and restructuring to bolster the development of metropolitan regions, promulgating a slew of policy directives aimed at enhancing regional cooperation. In this context, the “metropolitan area” concept has garnered heightened attention, becoming a focal point in both planning research and practical applications across diverse regions [35]. Against this backdrop, the present study examines the timeframe from 2013 to 2020 to elucidate the evolution of the urban innovation network within the NMA, marking its foray into a phase of innovative progression.

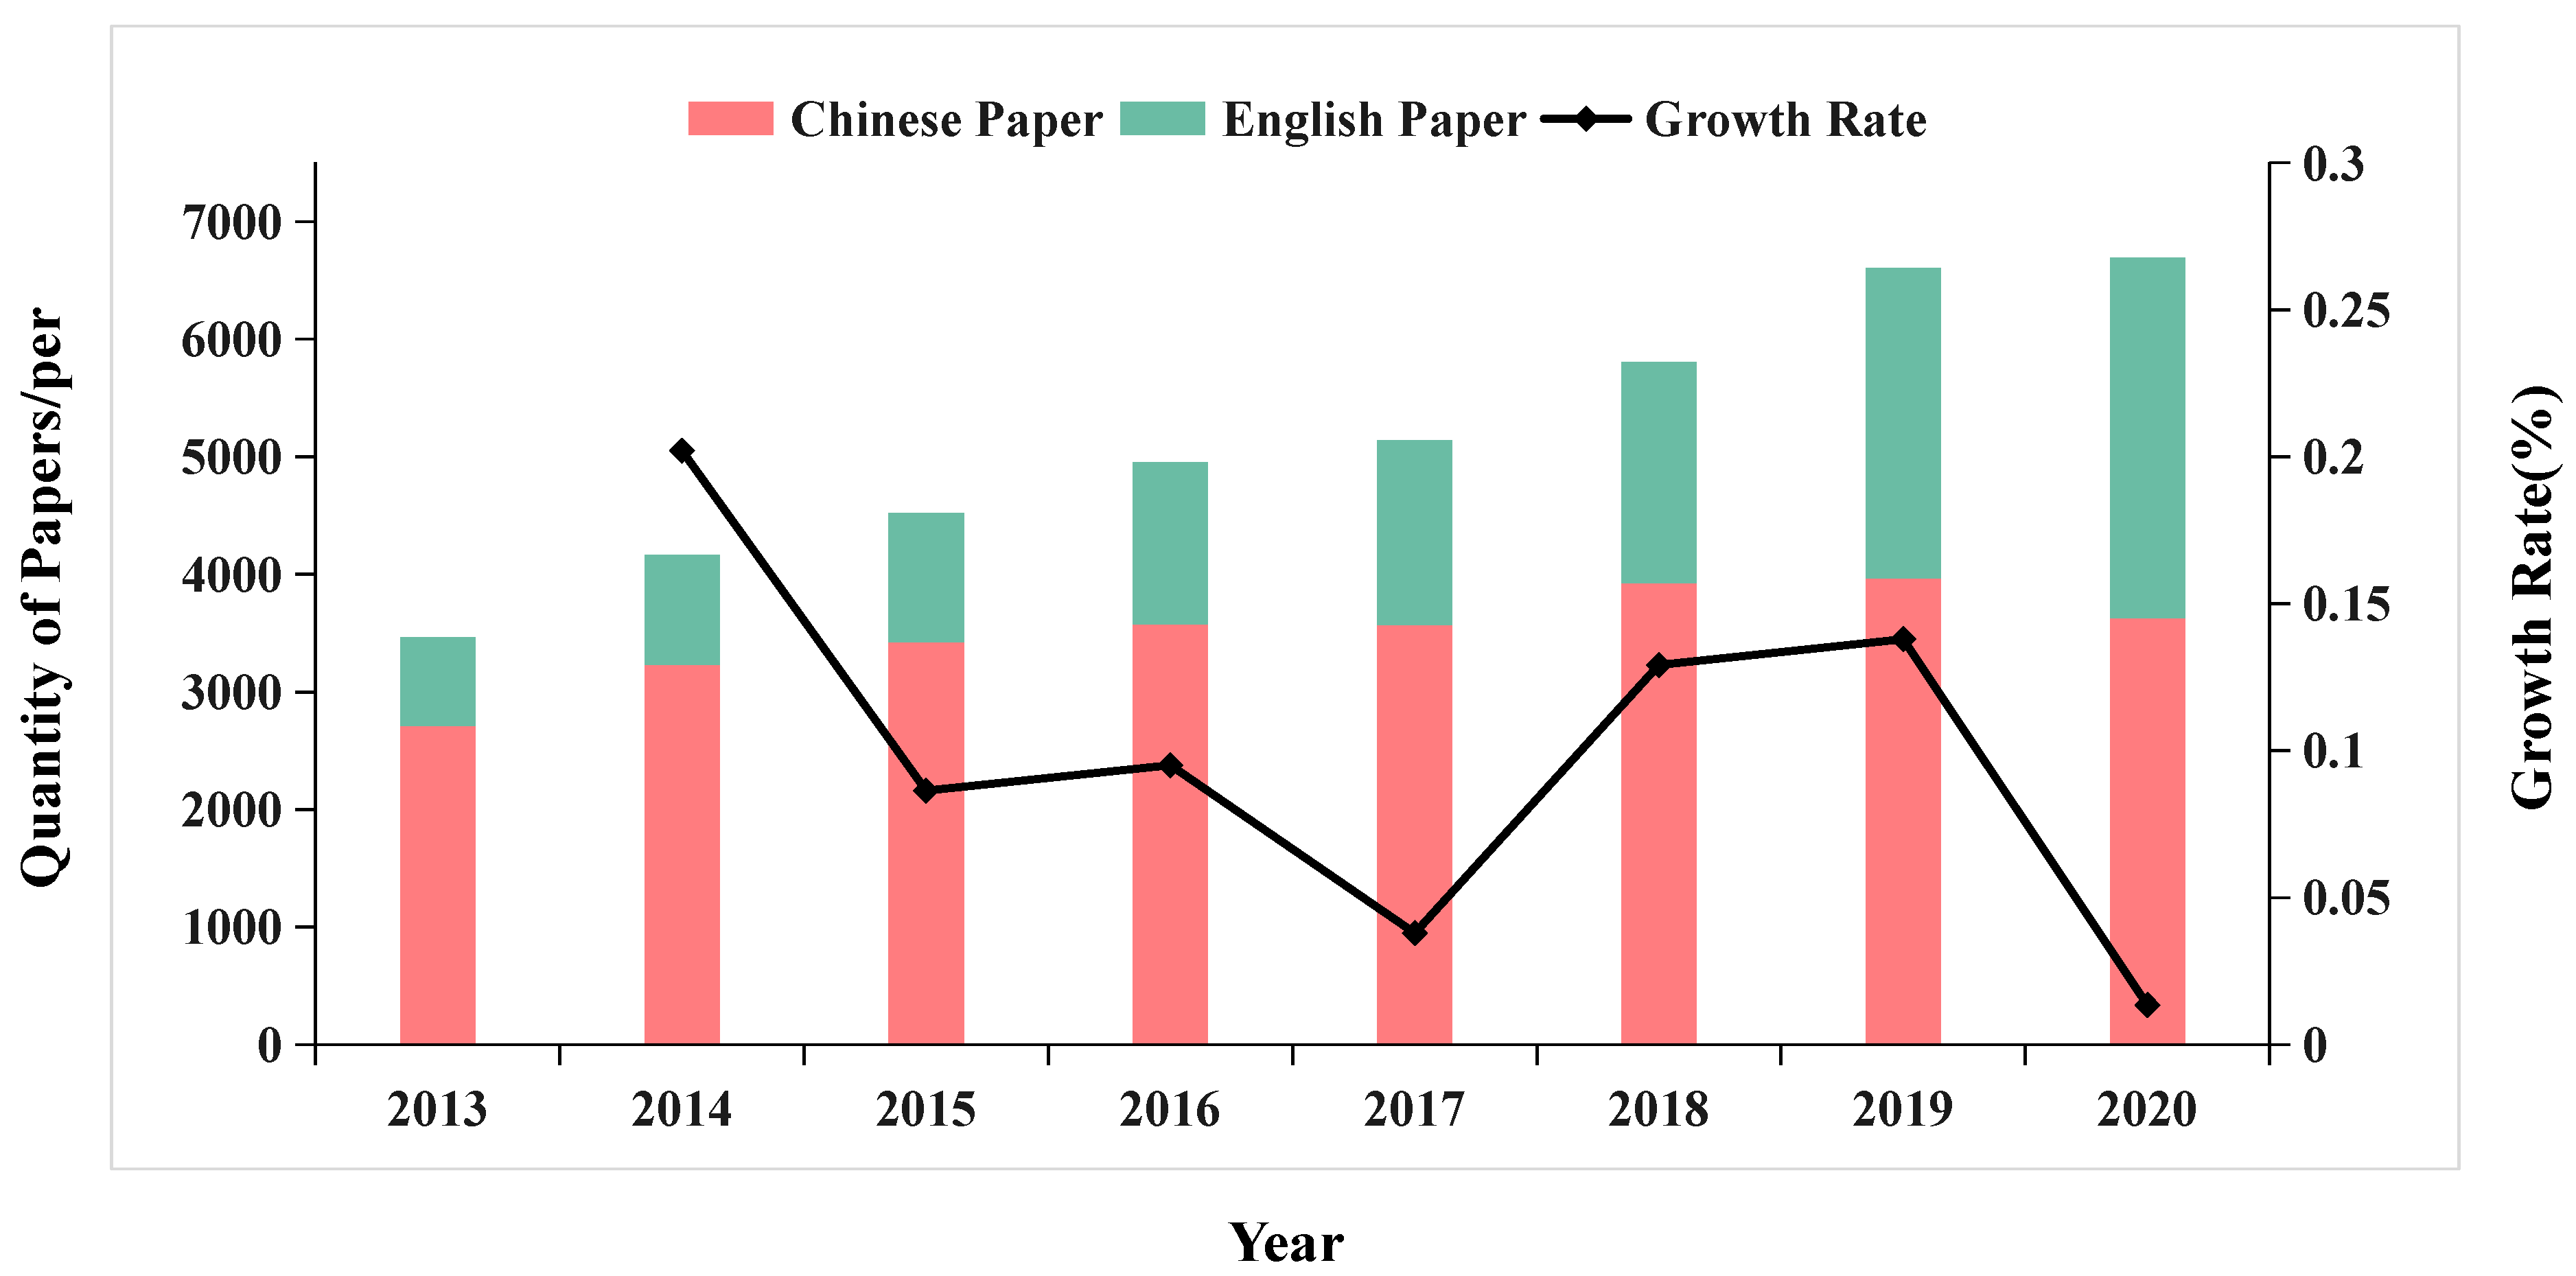
3.2. Data Description and Sources

A crucial indicator of the Knowledge Innovation Network (KIN) is the volume of co-authored publications [36]. Given the extensive collaboration data available in the country-specific local language journal databases, where the subjects of the research are situated, some researchers have analyzed the structures of scientific collaboration networks derived from both Chinese and English journal databases, revealing generally consistent trends [30]. Consequently, this paper selects publications collaboration data from Chinese and English journals from China’s Wanfang Database and the globally authoritative scientific paper database “WOS” (Web of Science). The method involves locating the cities where the co-authors are based on the authors’ affiliation information by entering the number of collaborative papers involving any two cities within the NMA for each year from 2013 to 2020. In the end, a total of 36,708 Chinese co-authored publications and 18,319 English co-authored publications between cities in the NMA from 2013 to 2020 were obtained.
For technological innovation networks (TINs), collaborative patents serve as the benchmark data [37,38]. In China, patents are categorized into invention, utility model, and design patents. Invention patents, distinguished by their advanced technical content and considerable innovation value, serve as a critical metric for gauging the quality of a region’s scientific research output and its market application potential [39]. The frequency of jointly filed invention patents stands as a robust indicator for evaluating regional collaboration in innovation. This study extracted data from the patent information database of the China National Intellectual Property Administration, focusing on invention patent filings with applicant addresses in the nine prefecture-level cities of the NMA from 1 January 2013 to 31 December 2020. Out of a total of 708,042 invention patent applications, 40,314 were filed collaboratively after excluding those submitted by single entities or individuals. Subsequent analyses scrutinized the co-applicants’ addresses, considering only those patents with addresses in the NMA and disregarding applications where the co-applicants and applicants hailed from the same city. The investigation revealed that, from 2013 to 2020, there were 2422 invention patents filed collaboratively among the nine prefecture-level cities within the NMA.

3.3. Research Methods and Procedures

This study utilizes network analysis tools, including UCINET and Gephi, to elucidate the structure and dynamics of the innovation network in the NMA, drawing on Social Network Analysis (SNA) techniques. Then, we utilize the Multiple Regression Quadratic Assignment Procedure (MRQAP) to examine the underlying mechanisms by which spatial proximity influences the development and dynamics of the urban innovation network in the NMA. The specific research methods and steps can be seen in Figure 2.
SNA methods are widely used in the structuring of urban network structures [40]. For network structure analysis, the paper introduces indicators such as network density, average clustering coefficient, and average path length to directly reflect characteristics such as central cities of the network, connection strength, density, and accessibility (Table 1). Regarding spatial heterogeneity, the research employs degree centrality network individual indicators to analyze the central position of each city in the innovation network of the NMA. Additionally, ArcGIS 10.2 software is used to visualize the spatial connections of innovation cooperation between cities.
MRQAP is a statistical technique for assessing regression relationships between one matrix and several others [41]. It employs random permutations of the matrix data, integrating quadratic assignment procedures with multiple regression analyses to relate explanatory variables to dependent variables and evaluate the significance of regression coefficients. In comparison to alternative approaches, such as the Exponential Random Graph Model (ERGM) and the Stochastic Actor-Oriented Model (SAOM), MRQAP excels at detecting the impact of external factors on urban network formations [42].

3.4. Selection and Measurement of Variables for Factors Influencing Proximity

Multidimensional proximity plays a pivotal role in the dynamics of regional knowledge spillovers, innovation, and technological diffusion. It establishes a theoretical foundation for the examination of metropolitan area innovation networks’ impact mechanisms. The “multidimensional proximity” concept, originally introduced by the French School of Proximity Dynamics, has been instrumental in understanding the essential functions of innovation interactions and knowledge exchanges [43]. Subsequent research has refined the concept of proximity into multiple dimensions, establishing an analytical framework. Interactionist scholars, such as Torre and Rallet [44], typically emphasize two key aspects: geographical and organizational proximity. They contend that these factors significantly influence innovation linkages. On the other hand, institutionalists like Kirat and Lung [45] examine the interplay among geographical, organizational, and institutional proximities. Boschma [46] provides a comprehensive perspective, both individual and regional, by categorizing multidimensional proximity into five categories: geographical, cognitive, institutional, organizational, and social proximities. This taxonomy has progressively become a pivotal lens for examining the development of innovation networks within evolutionary economic geography. Building on this foundation, Knoben and Oerlemans [47] further synthesized the concept by integrating cognitive, institutional, social, and organizational proximities into a streamlined analytical framework centered on geographical, technological, and organizational proximities. Through extensive research and collaborative efforts, scholars have crafted a widely recognized proximity framework comprising seven dimensions: geographical, technological, cognitive, cultural, institutional, social, and organizational proximities.
In light of these studies, we refine and adapt certain proximity factors within the research framework, selecting geographic, organizational, cultural, institutional, technological, and cognitive proximities as the variables for investigation (Figure 3). Due to the considerable overlap and similarity between cultural proximity and other factors, particularly social proximity, the latter is adopted as a representative term in this analysis [48]. Finally, we use inter-city spatial distance, provincial administrative boundaries, dialectal regions, market environment ambiance, patent structure similarity, and urban innovation indices to represent these proximity variables. Different dimension data are normalized to ensure the accuracy of the research. All proximity variable values are uniformly scaled to a range between [0, 1].
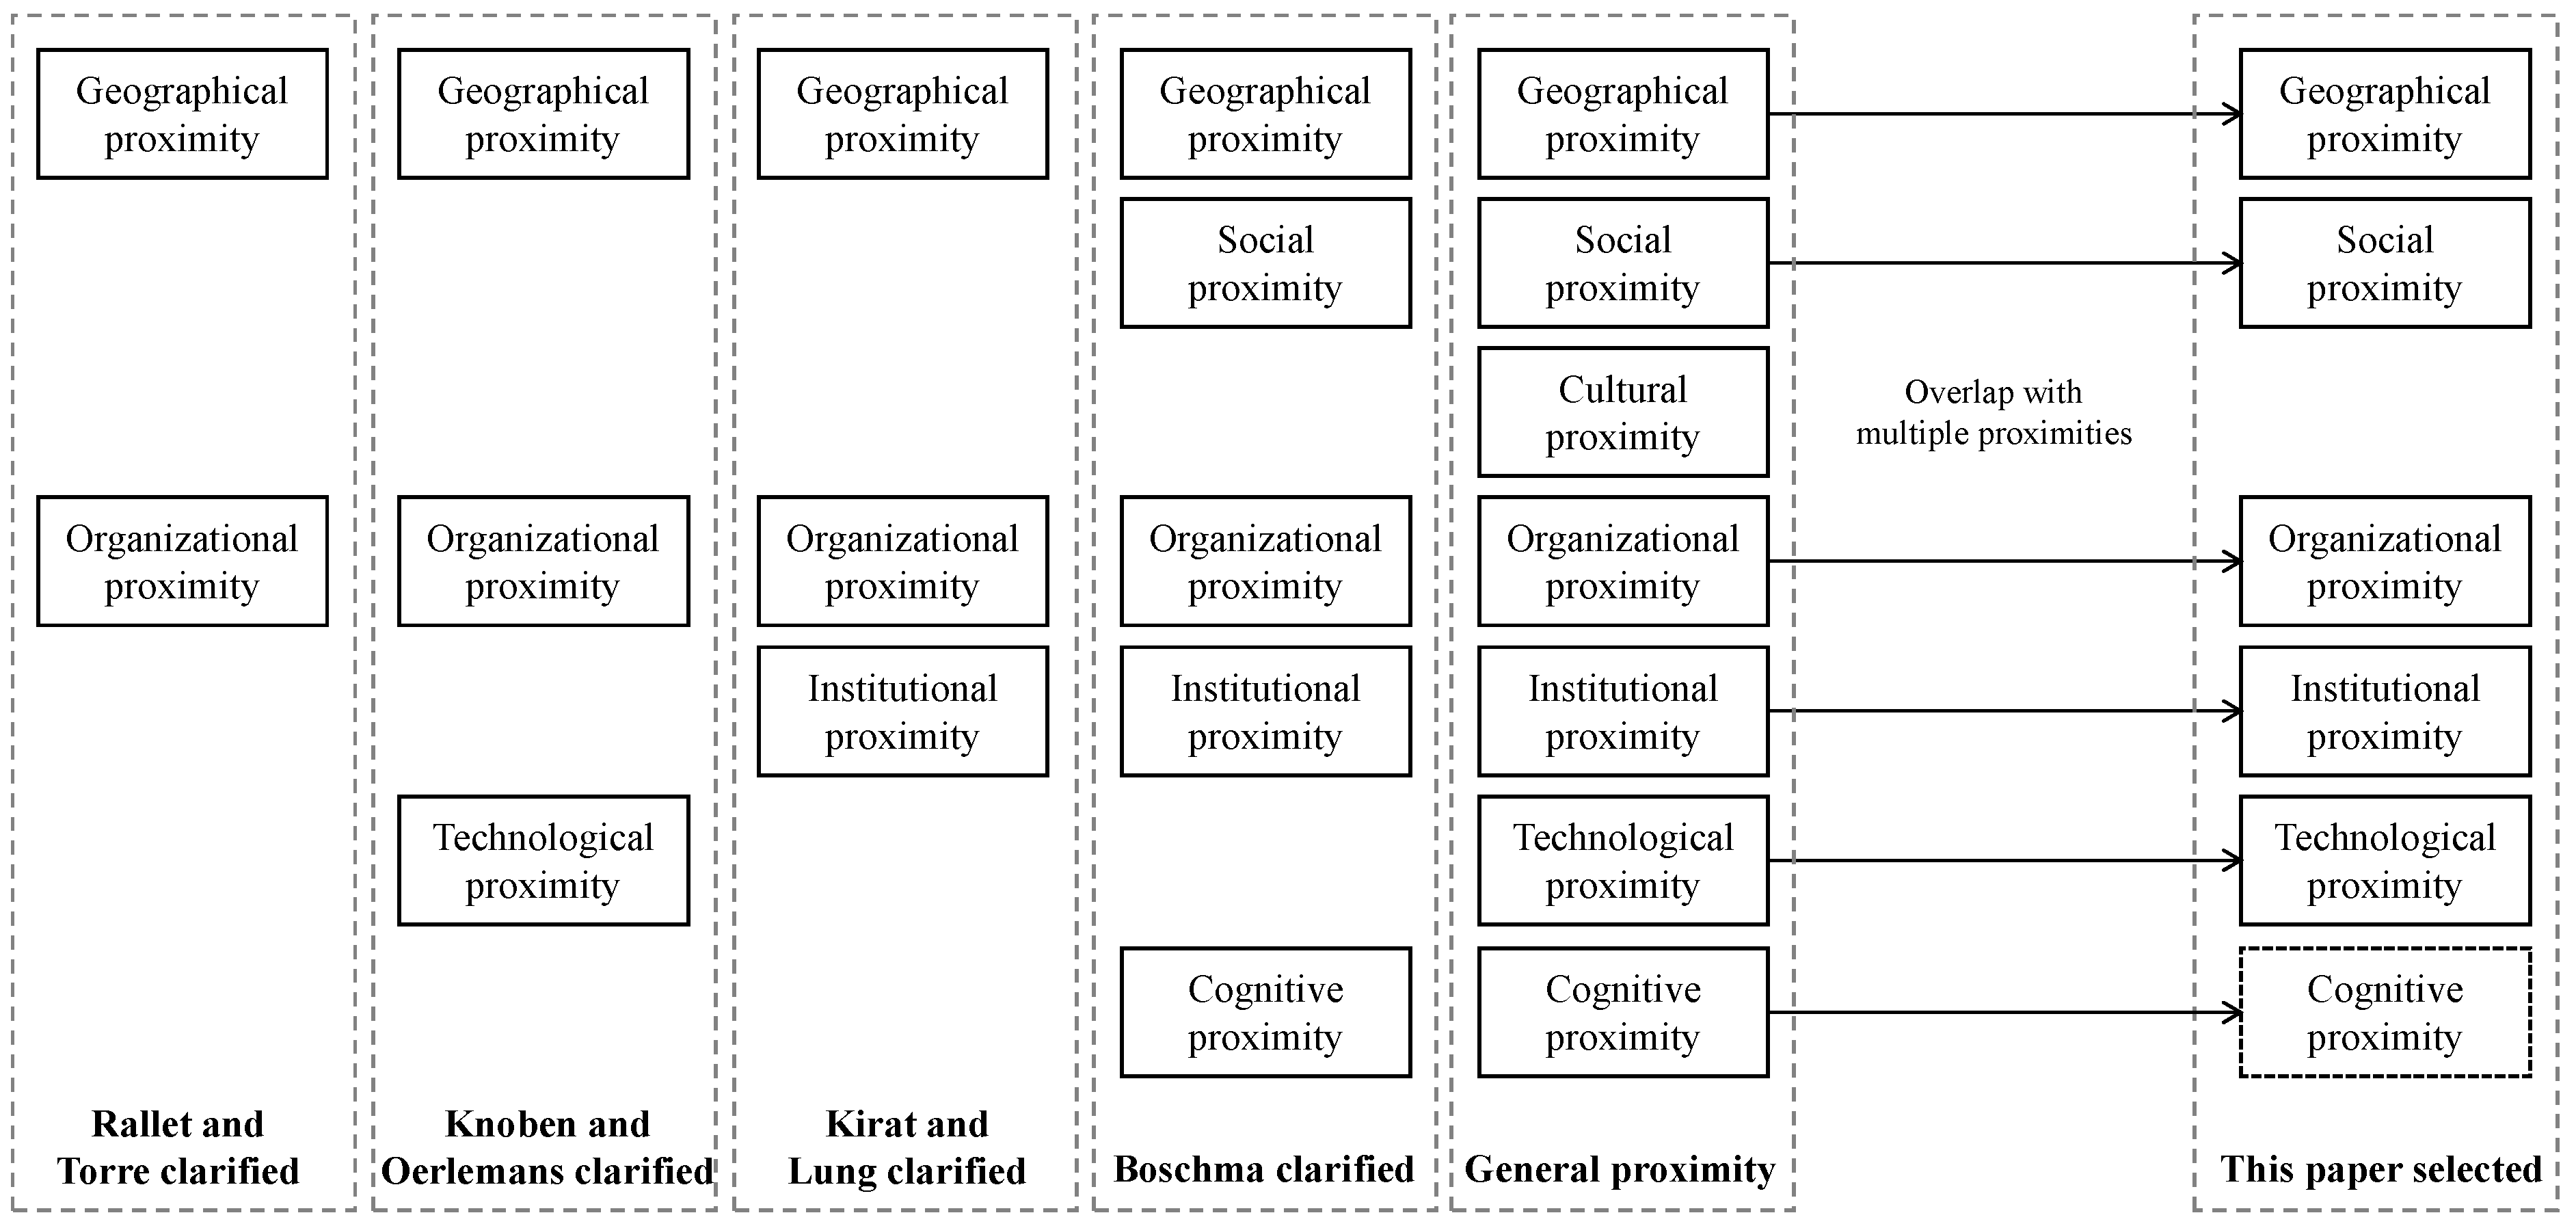
  • Geographical (Geo) Proximity. Existing research demonstrates that knowledge and technology dissemination diminishes with distance; thus, geographical proximity plays a pivotal role in enhancing innovation linkages by mitigating information exchange barriers and reducing transportation costs [46]. Proximity in geographic terms fosters communication and interaction among innovators, thereby facilitating the spillover of tacit knowledge, which is crucial for R&D collaboration [49]. Moreover, in urban innovation networks, geographical proximity can indirectly foster the emergence and growth of other forms of proximity [50]. Following the methodology of Hong and Su [51], this study computes the spherical distance between cities using their latitude and longitude data, employing the Geopy library in Python;
  • Organizational (Org) Proximity. Research utilizing Chinese datasets has revealed that collaborative entities tend to cluster at the municipal level, with organizational proximity manifesting through the administrative boundaries of provincial institutions in China [36]. There is a higher propensity for cities within the same province to collaborate. Consequently, this study assigns a value of 1 to cities located within the same province and a value of 0 to those that are not;
  • Social (Soc) Proximity. The assessment of social proximity derives from the dialectal regions to which cities are affiliated. Drawing on the studies of Zhang et al. [42] and the classification criteria set forth in “Chinese Cultural Geography” [52], the nine cities within the NMA are categorized into two dialectal regions. Cities sharing the same dialectal region receive a score of 1, while those from different regions are assigned a score of 0;
  • Institutional (Ins) Proximity. Generally, Innovation agents typically prefer to forge positive, cooperative relationships within similar institutional frameworks, exemplified by a city’s degree of marketization. Highly marketized cities not only exhibit increased enthusiasm from these agents but also promote the flow of innovative talent and resources, thereby strengthening inter-city innovation linkages. This study utilizes the “China Marketization Index” [53] to evaluate marketization structure congruity across cities, drawing on past research and data spanning several years [54];
  • Cognitive (Cog) Proximity. This concept pertains to the similarity in knowledge among cities, with closer cognitive proximity indicating a higher likelihood of forging cooperative links [55]. Given that such collaboration occurs within innovative urban networks, the disparity in city innovation indices serves as a measure of cognitive proximity in terms of innovative knowledge. The city innovation index is derived from the “China City and Industry Innovation Capability Report 2017” [56]. It is calculated using a patent value model that takes into account patent duration [57], a method that is both highly objective and recognized for effectively assessing patent value and innovation capacity;
  • Technological (Tec) Proximity. It refers to the extent of similarity in the technological foundations and knowledge infrastructures of the two cities. An optimal level of technological distance fosters effective knowledge transfer between collaborators, catalyzing the emergence of novel technologies and methodologies. In this study, we utilize the congruence of patent portfolios across cities as an indicator of technological proximity, drawing on the seminal work of Jaffe [58].

4. Results and Discussion

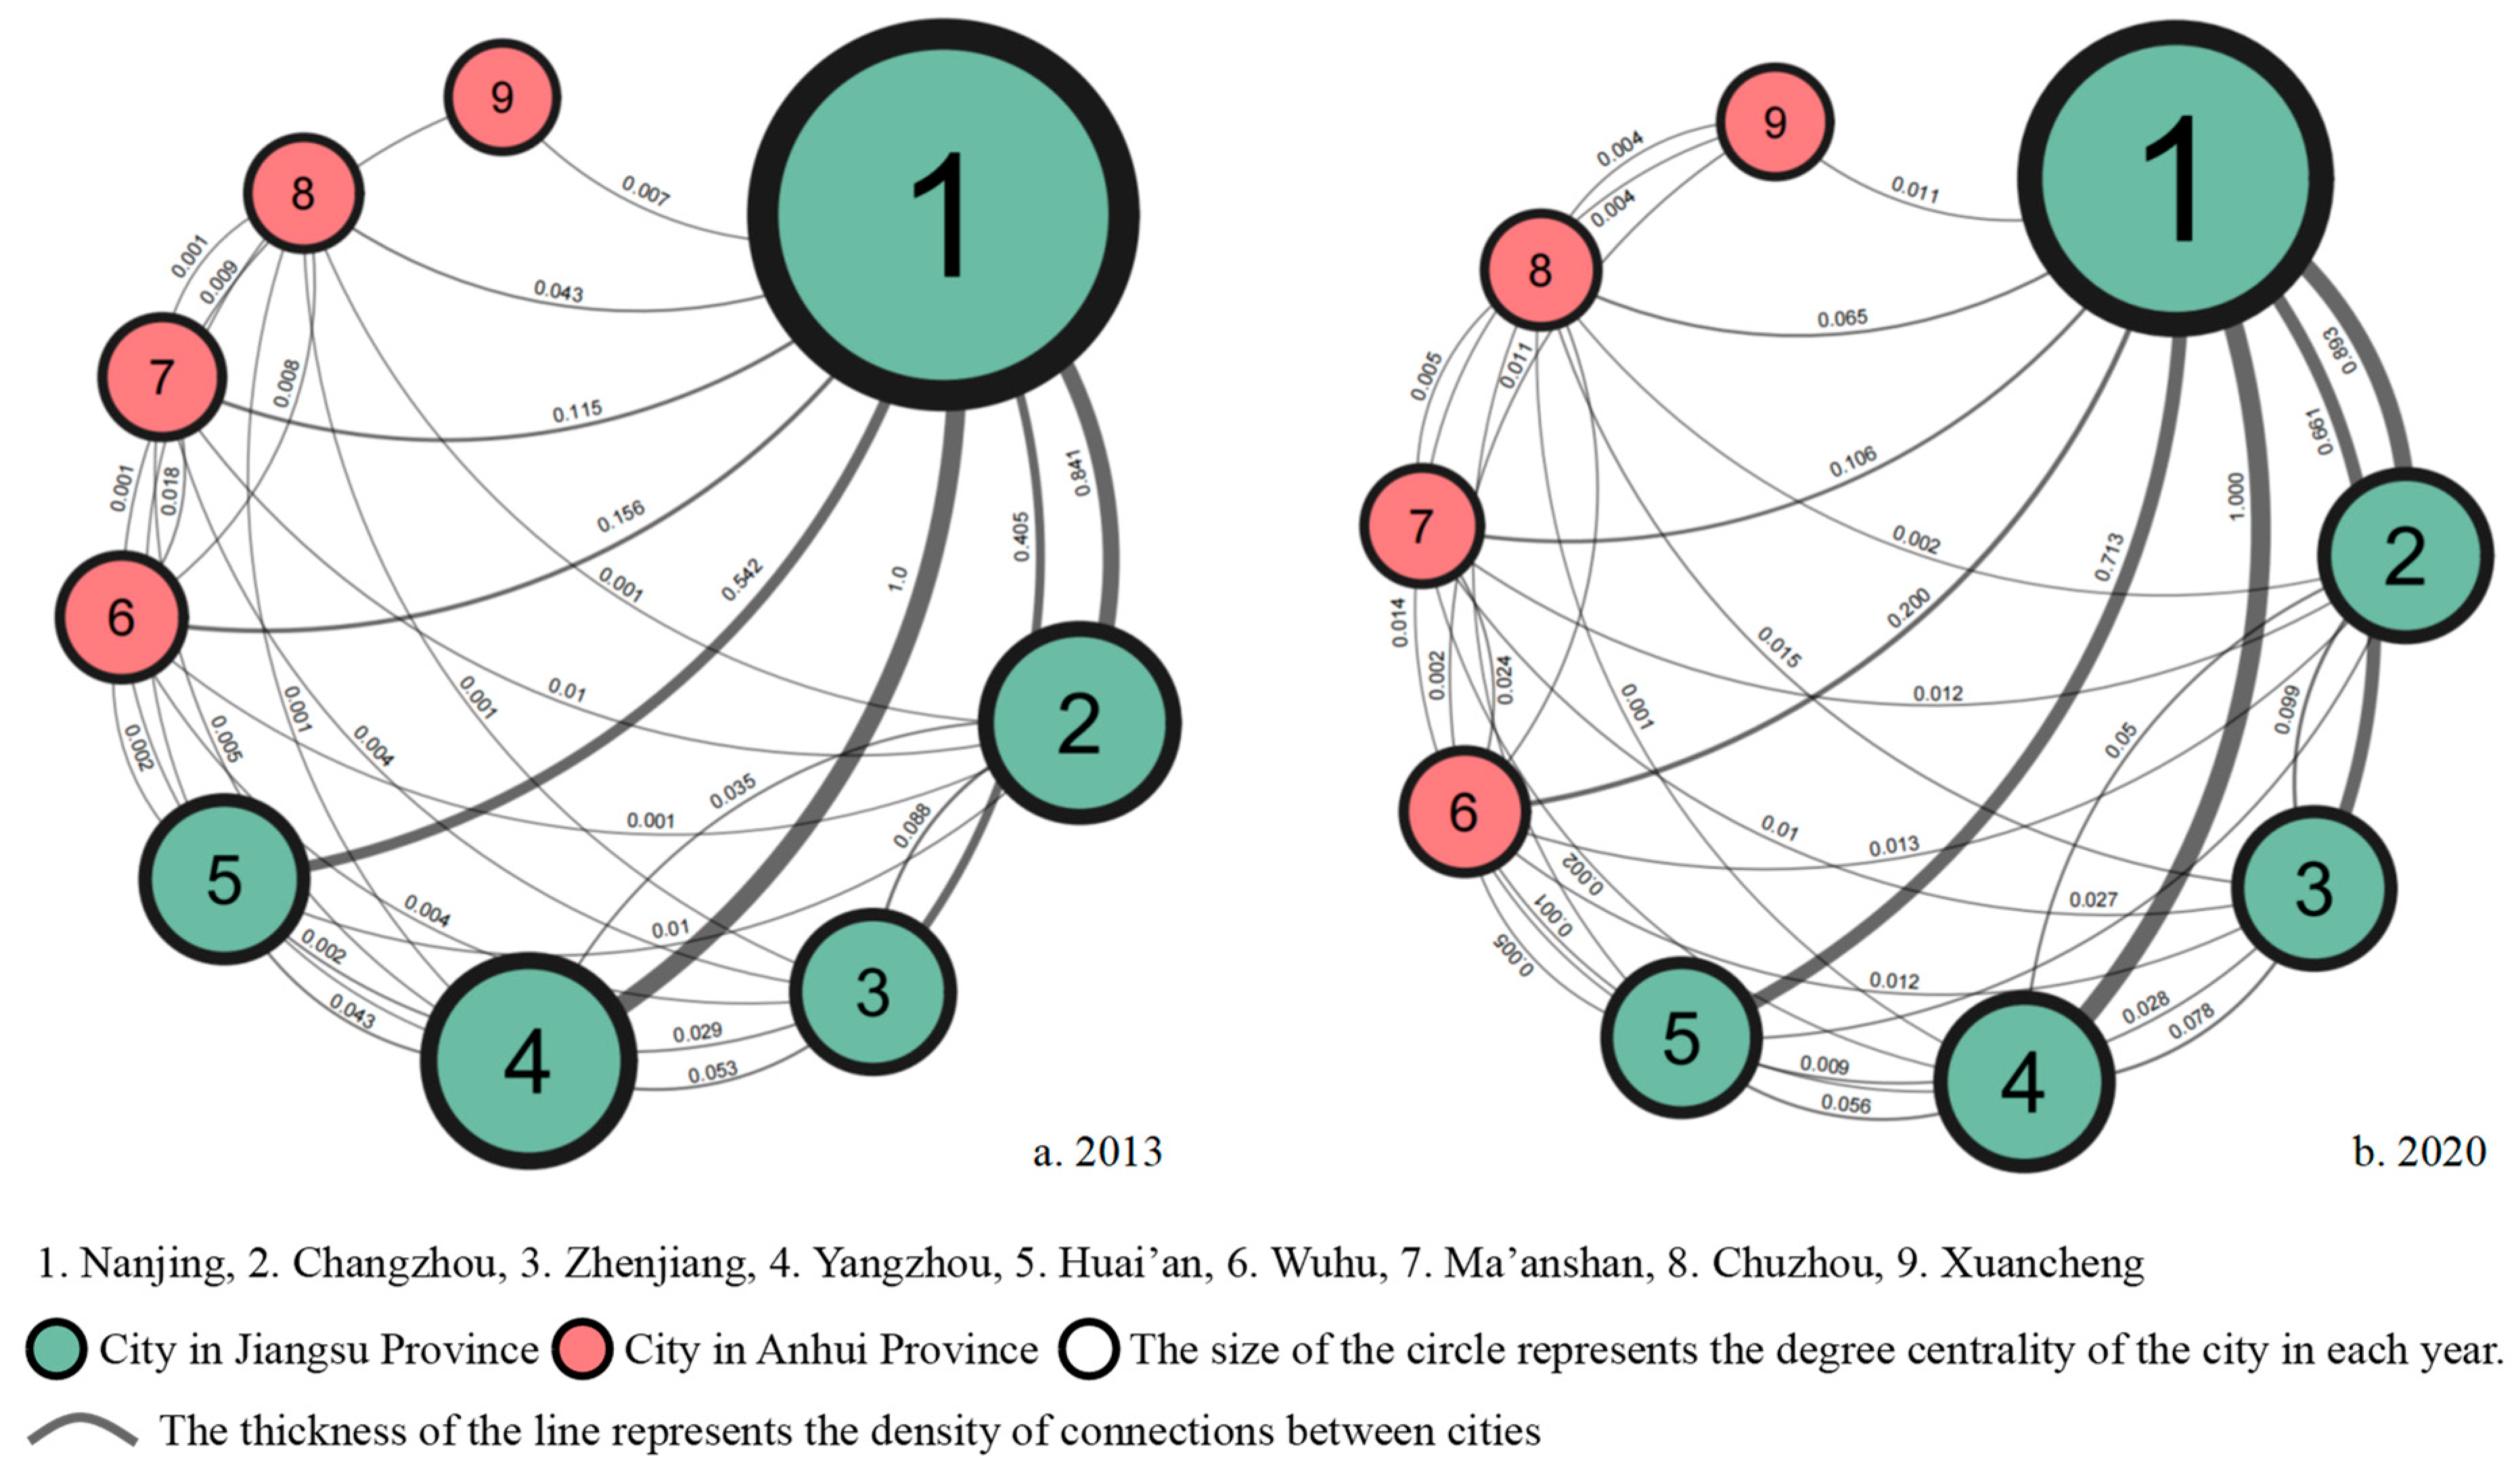
4.1. Evolutionary Dynamics of the NMA Innovation Network

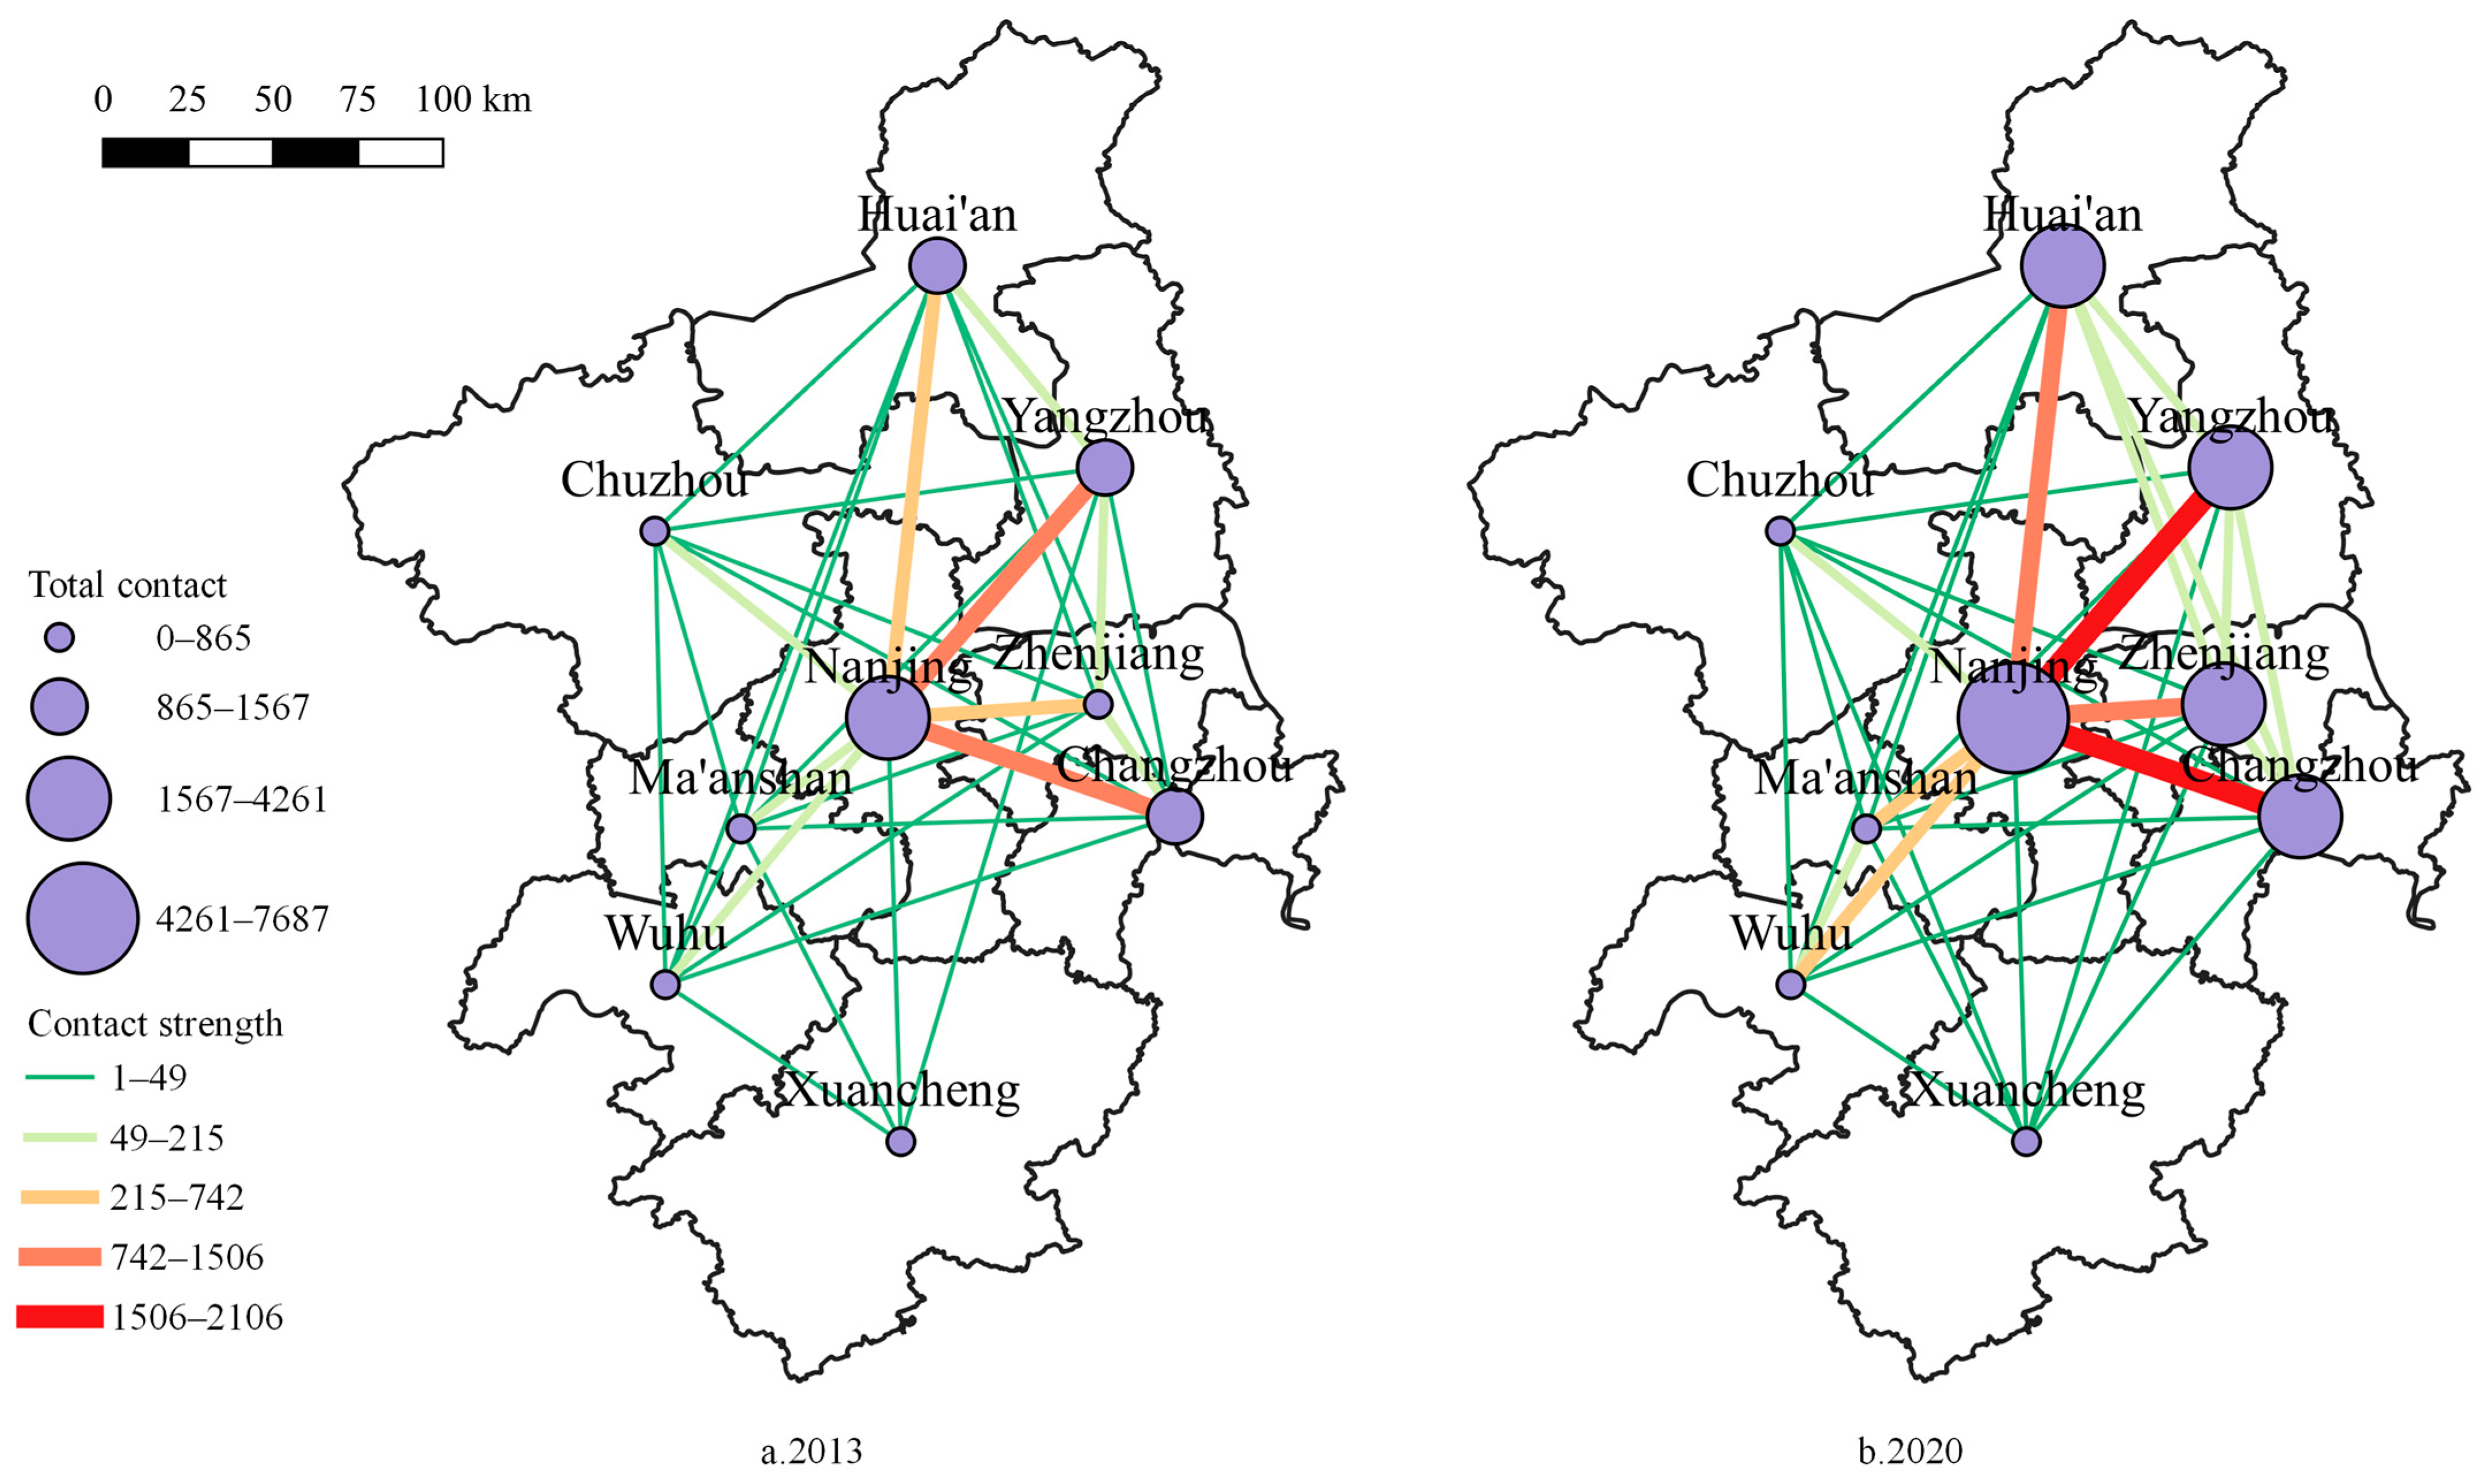
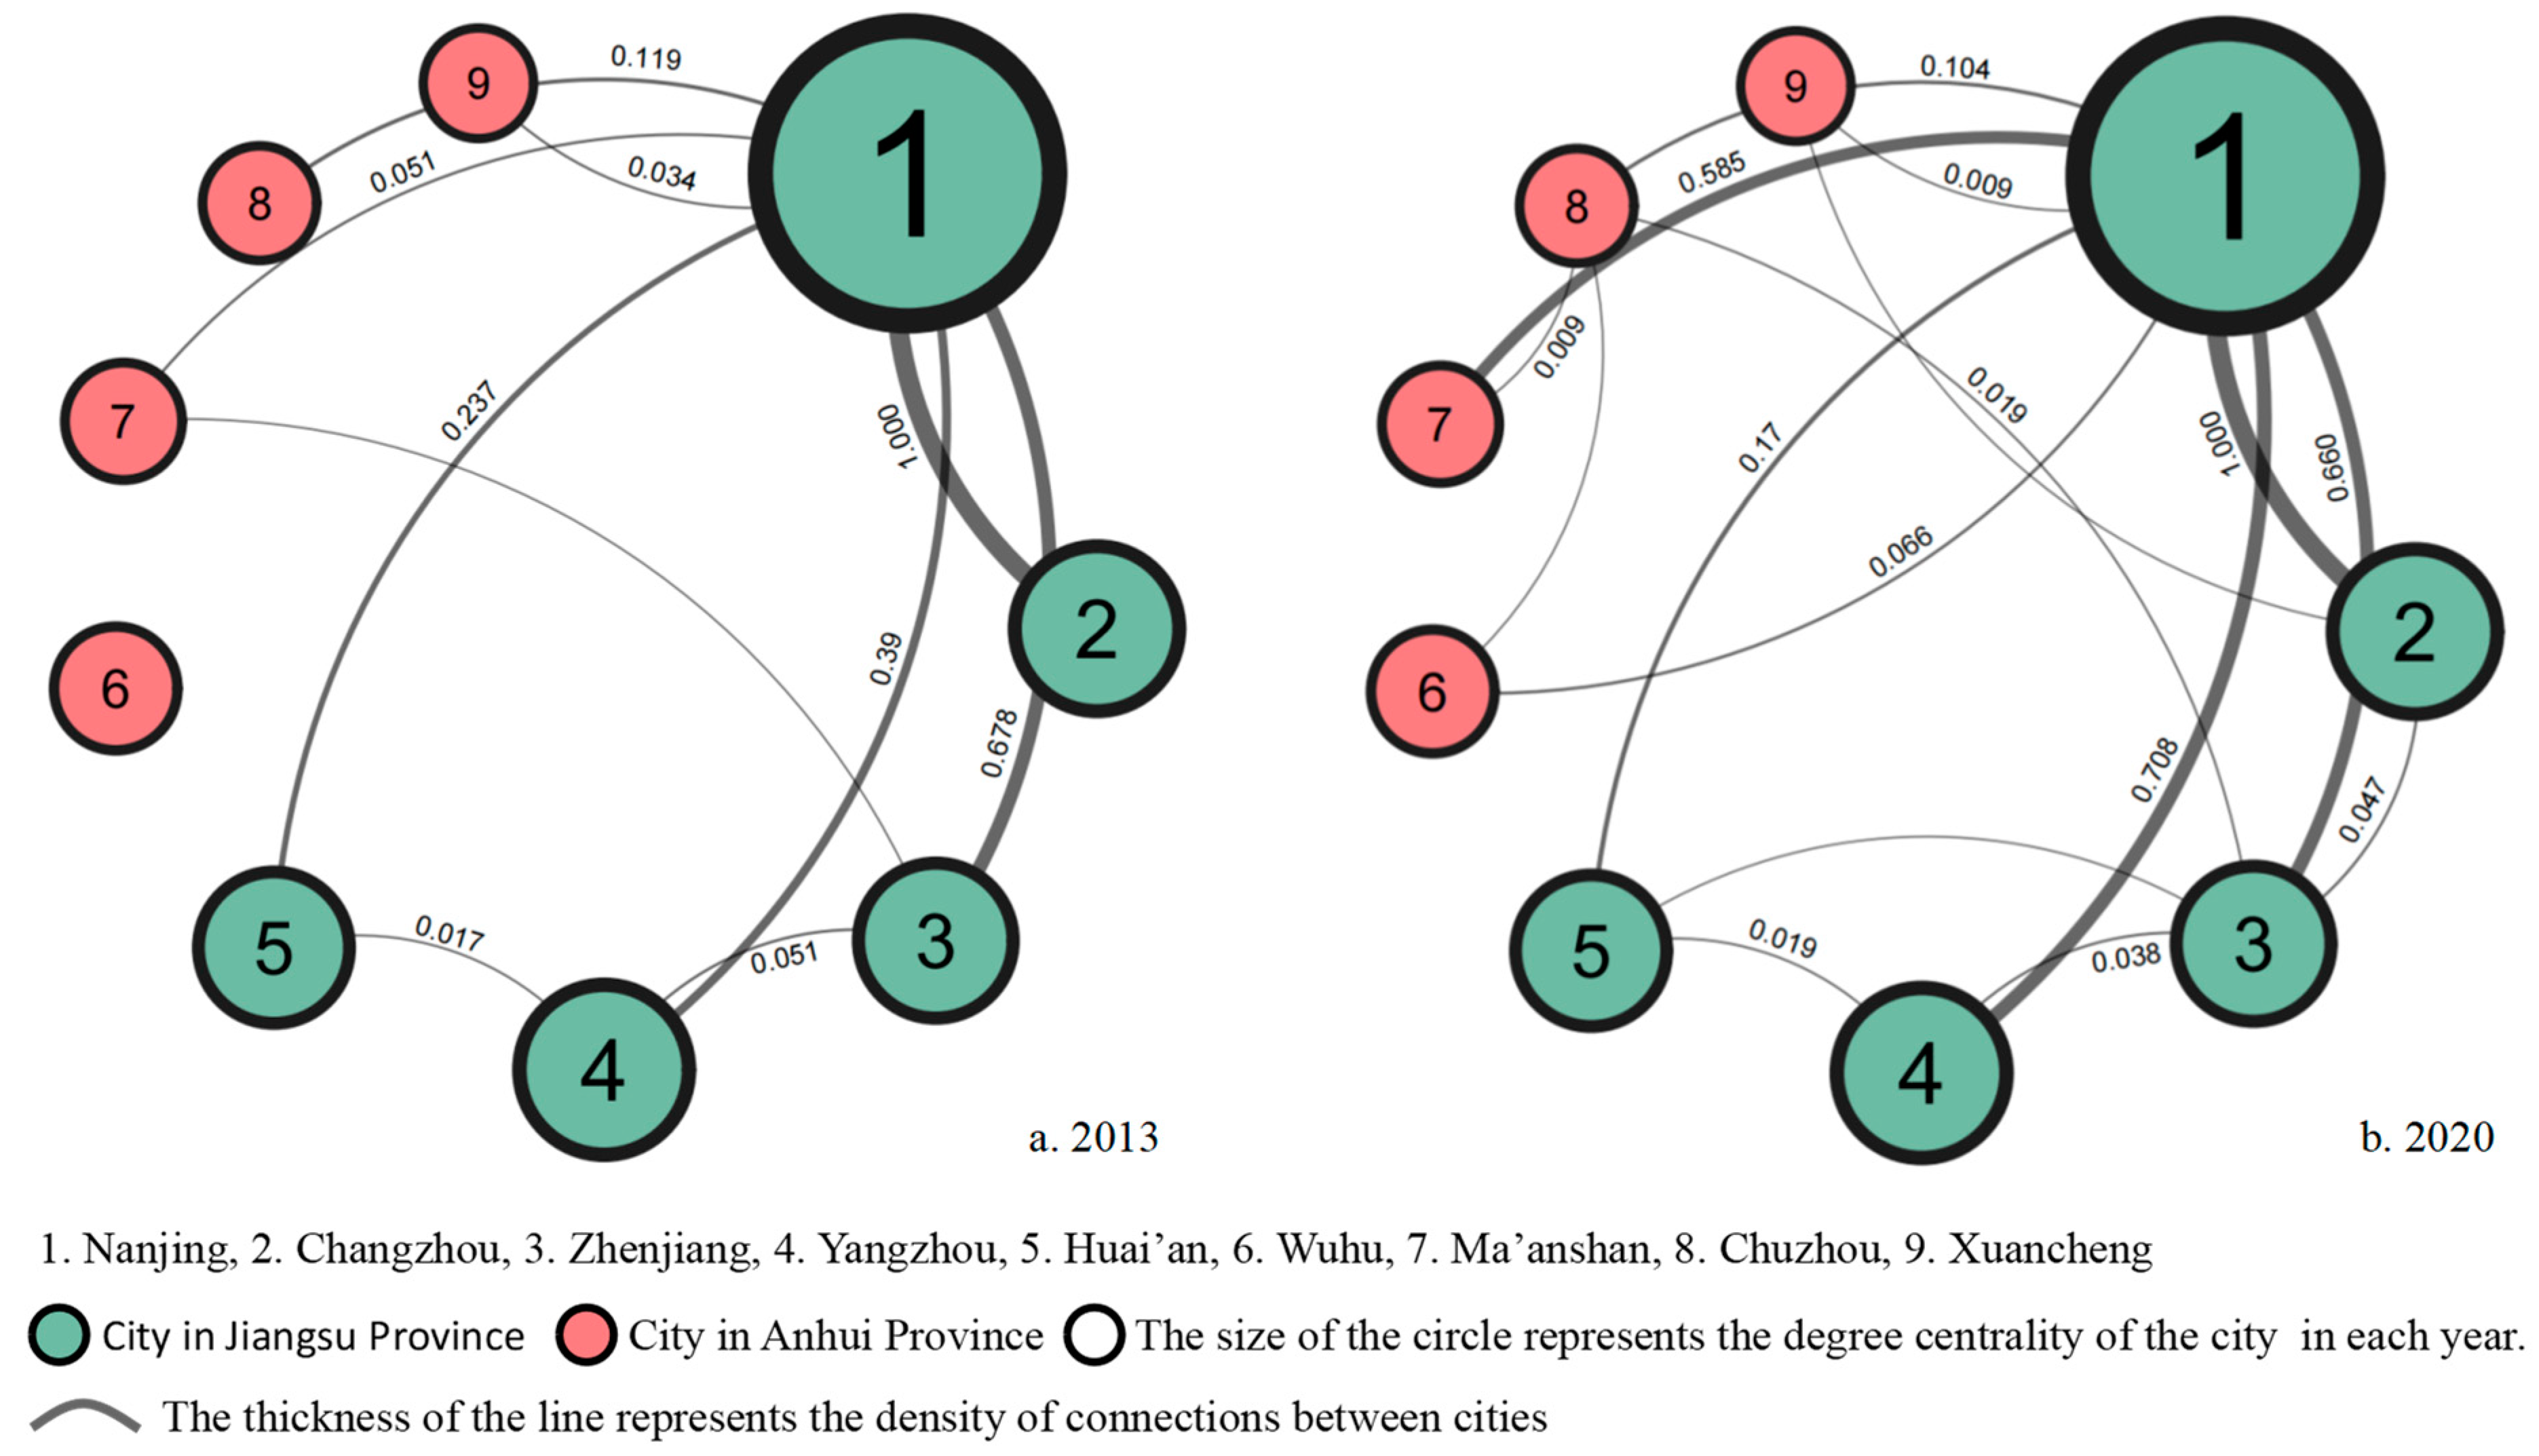
4.1.1. Evolutionary Dynamics in Urban KIN

Examining the collaborative network’s scope, the NMA saw a surge in co-authored papers to 8735 by 2020, an 85% increase from 2013 (Figure 4). This surge signals a robust upward trajectory in intercity knowledge collaboration within the area. The growth rate peaked the year after the Nanjing Metropolitan Area City Development Alliance’s inception in 2013, with a 20% rise in knowledge partnerships in 2014. Subsequently, the growth rate stabilized, albeit with some fluctuations. A comparison of paper collaborations by language from 2013 to 2020 reveals that Chinese-language papers predominated over their English-language counterparts. However, the growth patterns differed markedly. Post-2013, collaborations in English-language papers experienced a swift ascent, while those in Chinese remained relatively constant. The volume of Chinese-language papers was triple that of English-language papers in 2013; by 2018, their quantities converged, reflecting a sustained elevation in the international scope of the area’s scholarly collaborations.
(1) Structural Dynamics and Evolutionary Patterns of KIN
This study employs Gephi 0.10.1 software to scrutinize the structure of urban KINs, quantifying the total number of connections, network density, mean path length, and average clustering coefficient within Nanjing’s metropolitan KIN. Analysis of data spanning from 2013 to 2020 (Table 2; Figure 5) reveals an increase in the total number of collaborative knowledge relationships in the NMA, rising from 32 to 35. This increment signifies an enhanced engagement in collaborative endeavors between city pairs, particularly in Chinese and English academic papers. The network density escalated from 0.889 to 0.972, denoting heightened interconnectivity among the urban nodes. Concurrently, the average clustering coefficient climbed from 0.937 to 0.972, indicative of a strengthening bond among the nodes. The mean path length contracted from 1.111 to 1.028, signifying a marked enhancement in the network’s facilitation of knowledge exchange and collaboration across the cities. Moreover, from 2013 to 2020, the centralization of the urban KIN in Nanjing’s metropolitan sphere has continually increased, from 37.68% to 43.85%. This trend underscores Nanjing’s burgeoning role within the network, whereas network heterogeneity has slightly diminished, from 26.77% to 25.60%. This reduction points to a gradual convergence in the network positions of cities beyond Nanjing.
(2) Spatial Structure and Evolution of KIN
The spatial structure of urban KIN in the NMA is centered around Nanjing, with the main axes being Nanjing–Yangzhou and Nanjing–Changzhou and the secondary axes being Nanjing–Zhenjiang and Nanjing–Huaian (Figure 6). In 2020, the number of co-published papers between Nanjing and the cities of Changzhou and Yangzhou reached 3986, accounting for about half of the total co-published papers in the NMA, making it the main channel for knowledge collaboration. The knowledge connections within the NMA are primarily within the province, with Nanjing having relatively close collaboration with Anhui Province’s Wuhu and Ma’anshan, accounting for 5% and 3% of the total collaboration, respectively. Other cities are situated at the network’s periphery, with weaker knowledge connections among these peripheral nodes.
During the period from 2013 to 2020, the structure of urban KIN in the NMA remained relatively stable, with Nanjing playing a leading role as the core and Nanjing–Yangzhou and Nanjing–Changzhou serving as significant cooperation axes. In terms of the growth in node centrality, Nanjing had the highest increase in knowledge collaboration with other cities, accounting for 86% of the total increment in the NMA. In terms of network growth, the number of co-published papers among most cities in the NMA increased. Specifically, the number of co-published papers in the main urban knowledge collaboration channels in the NMA increased by 3063, representing 77% of the total increment in the NMA. Co-published papers among the three cities within the province of Nanjing remained an important driver for network growth. Regarding newly formed network connections, during the period from 2013 to 2020, the majority of new connections originated from Xuancheng, with cities showing a rapid growth in co-published papers being Nanjing–Zhenjiang, Nanjing–Chuzhou, Nanjing–Xuancheng, Nanjing–Huaian, and Nanjing–Wuhu. Among these, three city pairs involved cross-provincial collaborations, indicating a significant spillover effect of knowledge across cities in the NMA.

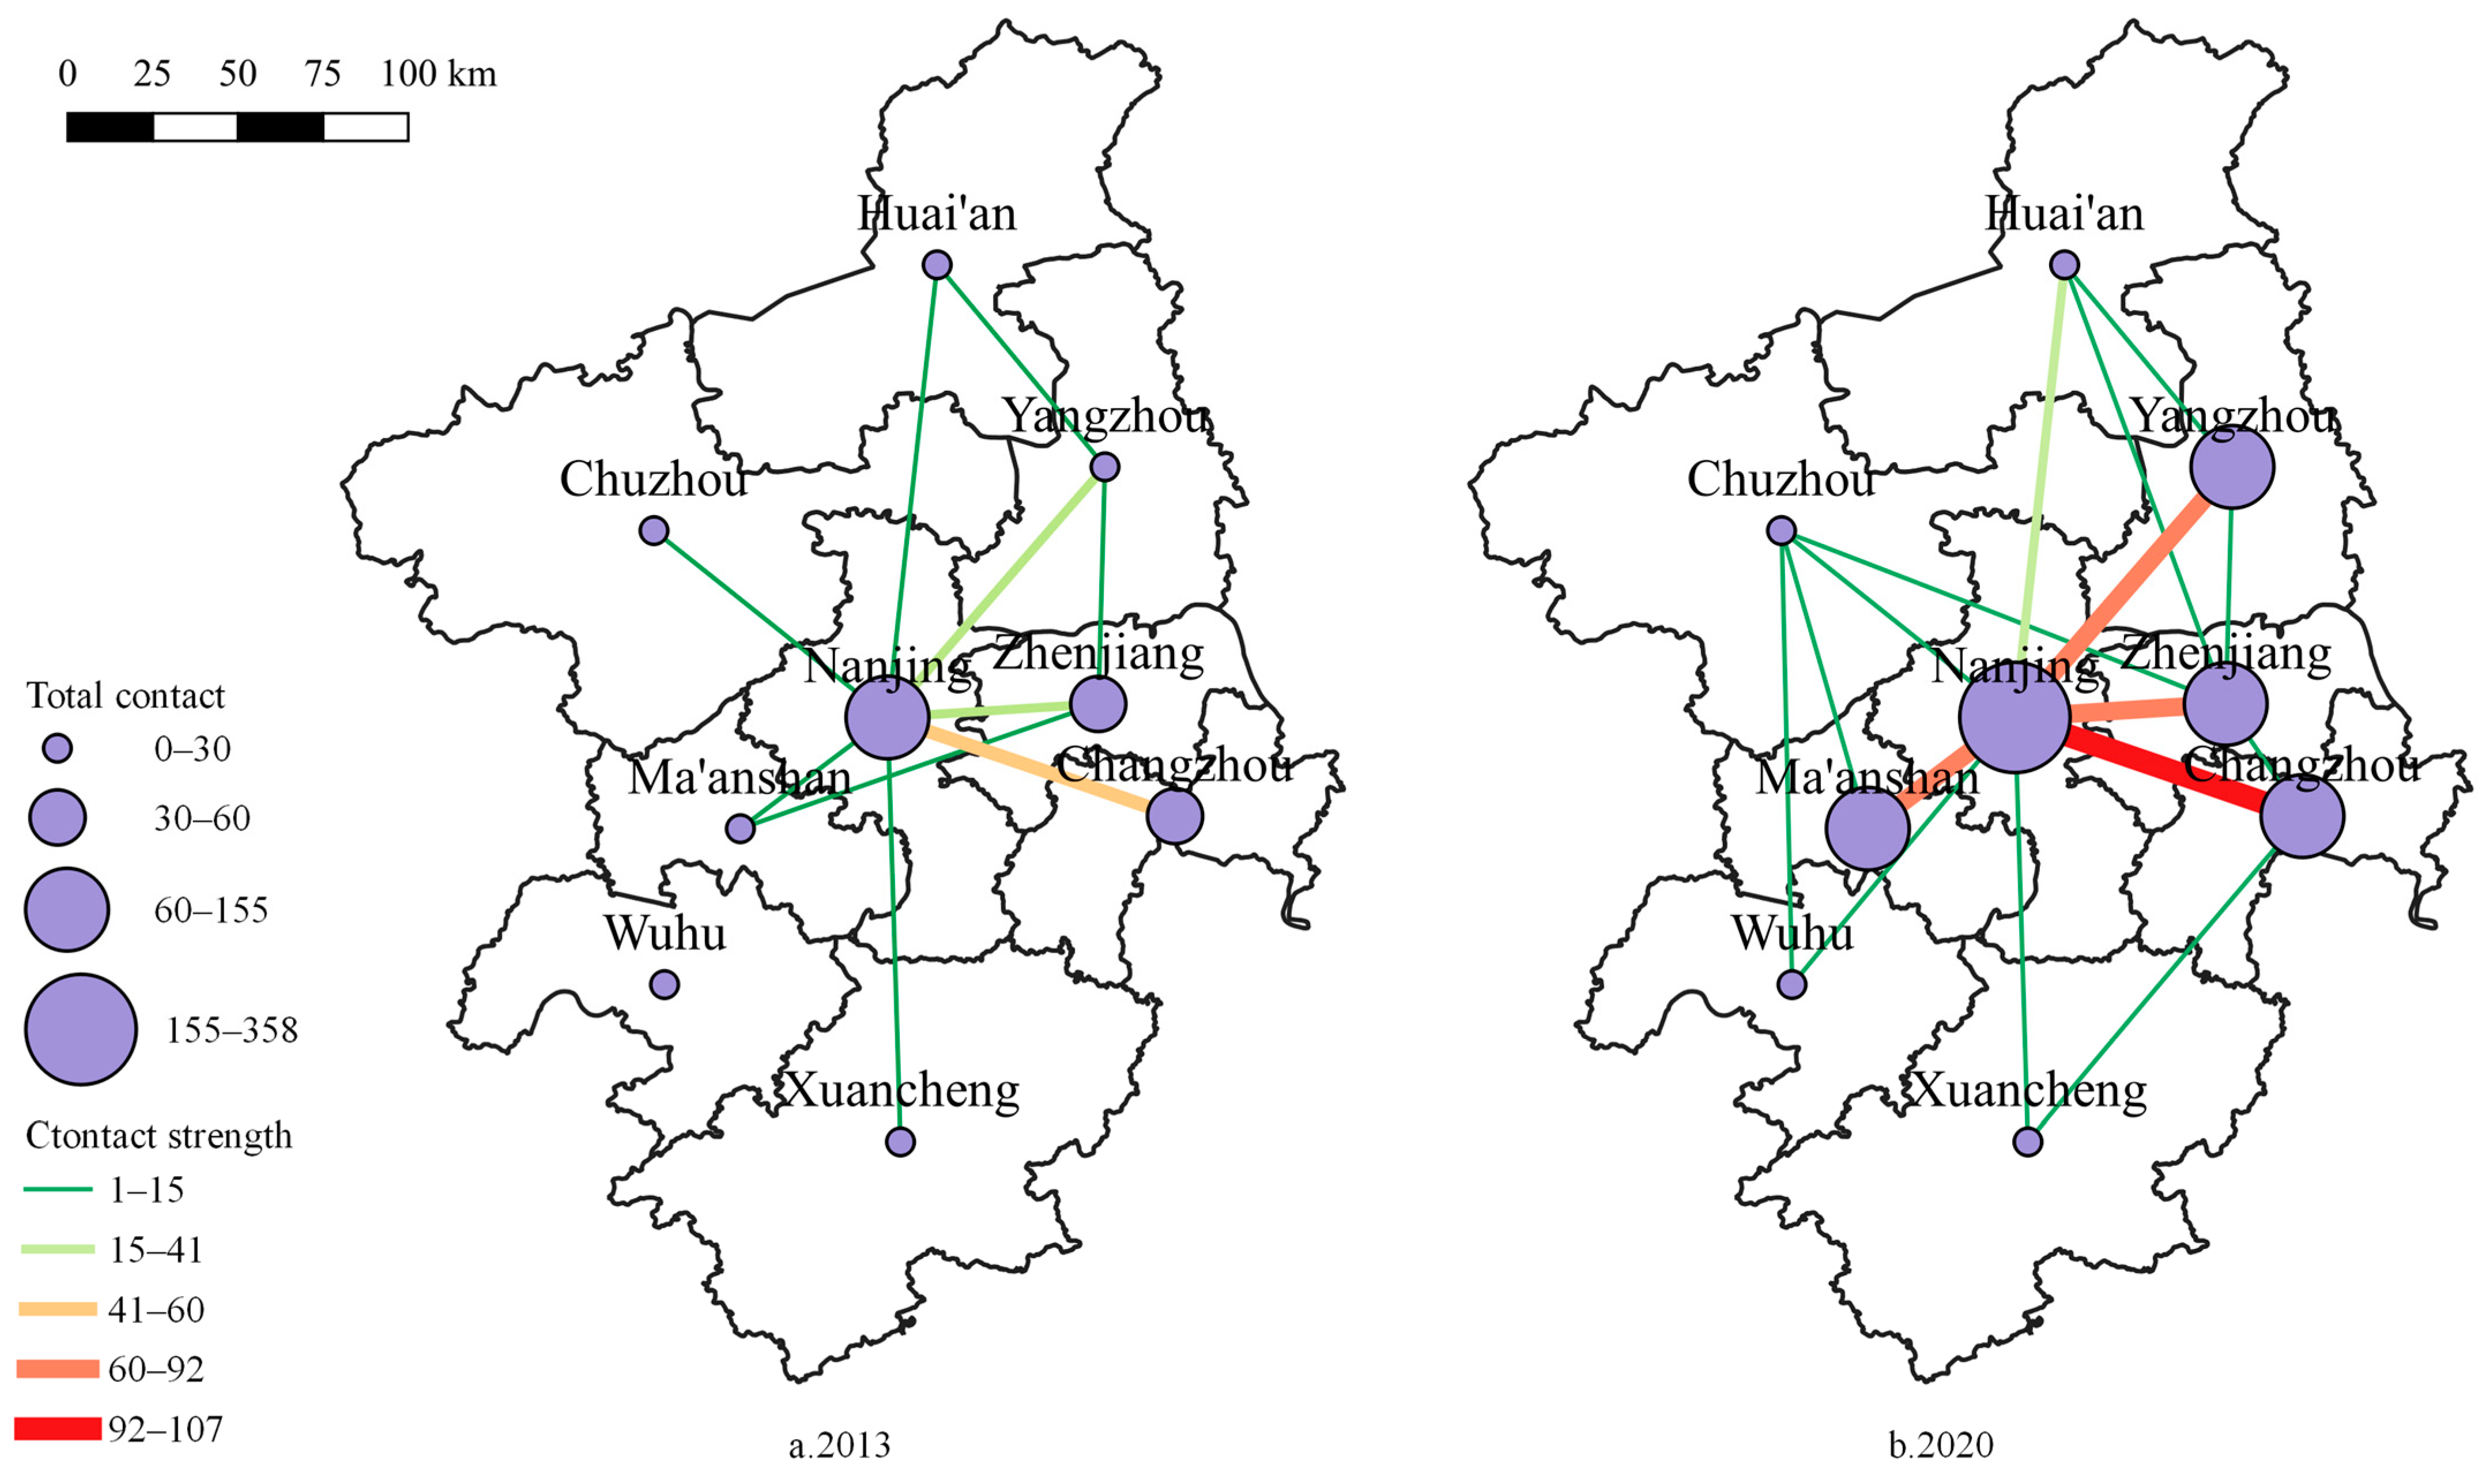
4.1.2. Evolutionary Dynamics in Urban TIN

From 2013 to 2020, the pattern of patent collaboration within the NMA exhibited a pronounced upward trajectory, with the peak annual collaboration amounting to 455 patents—nearly triple the lowest recorded figure in 2013. This surge suggests that the formation of a developmental alliance among these cities has catalyzed technological exchanges and collaborations. Between 2013 and 2020, inter-city patent applications within this area numbered 2423, a mere 6% of the total collaborative patents (40,314) (applicant > 1). Such figures reveal that patent collaboration within the NMA significantly lags behind that within individual cities, underscoring the nascent stage of the TIN across the metropolitan area.
(1) Structural Dynamics and Evolutionary Patterns of TIN
The result (Table 3; Figure 7) illustrates that from 2013 to 2020, the total number of linkages within the NMA’s city TIN grew from 10 to 16, reflecting a moderate upward trend corresponding to the substantial increase in the number of cities engaged in the network. Despite this, the network’s metrics, such as density and connectivity, still lag behind those of the KIN. The density of the network experienced a rise from 0.357 to 0.444, the mean clustering coefficient ascended from 0.695 to 0.772, and the average path length contracted from 1.643 to 1.556. While some metrics exhibited variability, the general trajectory indicates an intensification of technological collaboration among the cities, with network cohesion making steady gains. Furthermore, the centrality of the city TIN within the NMA exhibited a consistent upward trend, increasing from 24.48% to 41.09%, signifying Nanjing’s burgeoning influence as a pivotal driver of technological cooperation. Concurrently, the structural heterogeneity of the network diminished, decreasing from 31.36% to 27.84%, signaling a convergence in the roles of other cities within the network. Notably, cities in Anhui Province are transitioning from peripheral entities to significant nodes. The network topology depicted in Figure 6 for the year 2020 reveals a shift from a predominance of intra-provincial collaborations among Jiangsu Province cities towards more extensive inter-provincial cooperation.
(2) Spatial Structure and Evolution of TIN
The TIN within the NMA exhibits a spatial configuration characterized by Nanjing as the nucleus, supported by the primary Nanjing–Changzhou axis, and complemented by secondary axes including Nanjing–Yangzhou, Nanjing–Zhenjiang, and Nanjing–Ma’anshan (Figure 8). Nanjing is the dominant hub for technological collaboration within this region, contributing nearly 90% of the joint patent production. Changzhou, Yangzhou, and Zhenjiang serve as ancillary centers, with their collaborative patent outputs in 2020 constituting 30.00%, 20.79%, and 22.63% of the metropolitan area’s total, respectively. Furthermore, their cooperative patents with Nanjing represent 28.16%, 20.00%, and 18.68% of these figures, respectively. Huai’an, Chuzhou, and Ma’anshan rank as tertiary nodes in this network, with their combined patent collaborations with Nanjing accounting for approximately 25% of the metropolitan total. Additional cities within Anhui Province occupy peripheral positions in the network, engaging in limited technological cooperation with Nanjing and a select number of other municipalities.
The evolution of the TIN within the NMA, spanning from 2013 to 2020, indicates that its integrated development is increasingly pronounced. The urban innovation network is expanding beyond Jiangsu Province’s borders, with Anhui Province’s cities, such as Ma’anshan, progressively merging into this network. Notably, patent collaborations between Nanjing and Ma’anshan have surged, with Nanjing leading in the growth of such partnerships. Nonetheless, the persistent “rich club” phenomenon affects network evolution, with the increments in collaborative patents between Nanjing and the cities of Changzhou, Zhenjiang, and Yangzhou constituting 21.56%, 13.76%, and 23.85%, respectively, of NMA’s total increase.
In this study, we conducted a deeper analysis of the TIN’s composition among various innovators. Table 4 reveals that, within the NMA, company to company collaborations predominate in technological exchanges, while universities and research institutions contribute a relatively minor share of patents. Specifically, inter-company collaborations account for a substantial 67.10% of the total, compared to a mere 1.85% for inter-university, 0.69% for inter-research institutions, 5.86% for company to research institutions, and 3.79% for university to research institution collaborations. This pattern suggests that the integration of industry, academia, and research within the NMA is lacking to a certain degree. The potent resources of local universities and research institutions have not been effectively harnessed by enterprises for practical application.
Nevertheless, the topological map of all patent collaborations in the NMA from 2013 to 2020 (Figure 9) shows the formation of patent cooperation communities and clusters centered around key Nanjing universities and notable companies. The network hubs are predominantly associated with internationally acclaimed universities like Southeast University, Nanjing University, and Nanjing Agricultural University. This observation underlines the significant roles that the numerous elite Double First-Class universities and state-owned provincial enterprises play in fostering technological cooperation and exchange in the region. These entities are instrumental in the advancement and evolution of the metropolitan intercity TIN.

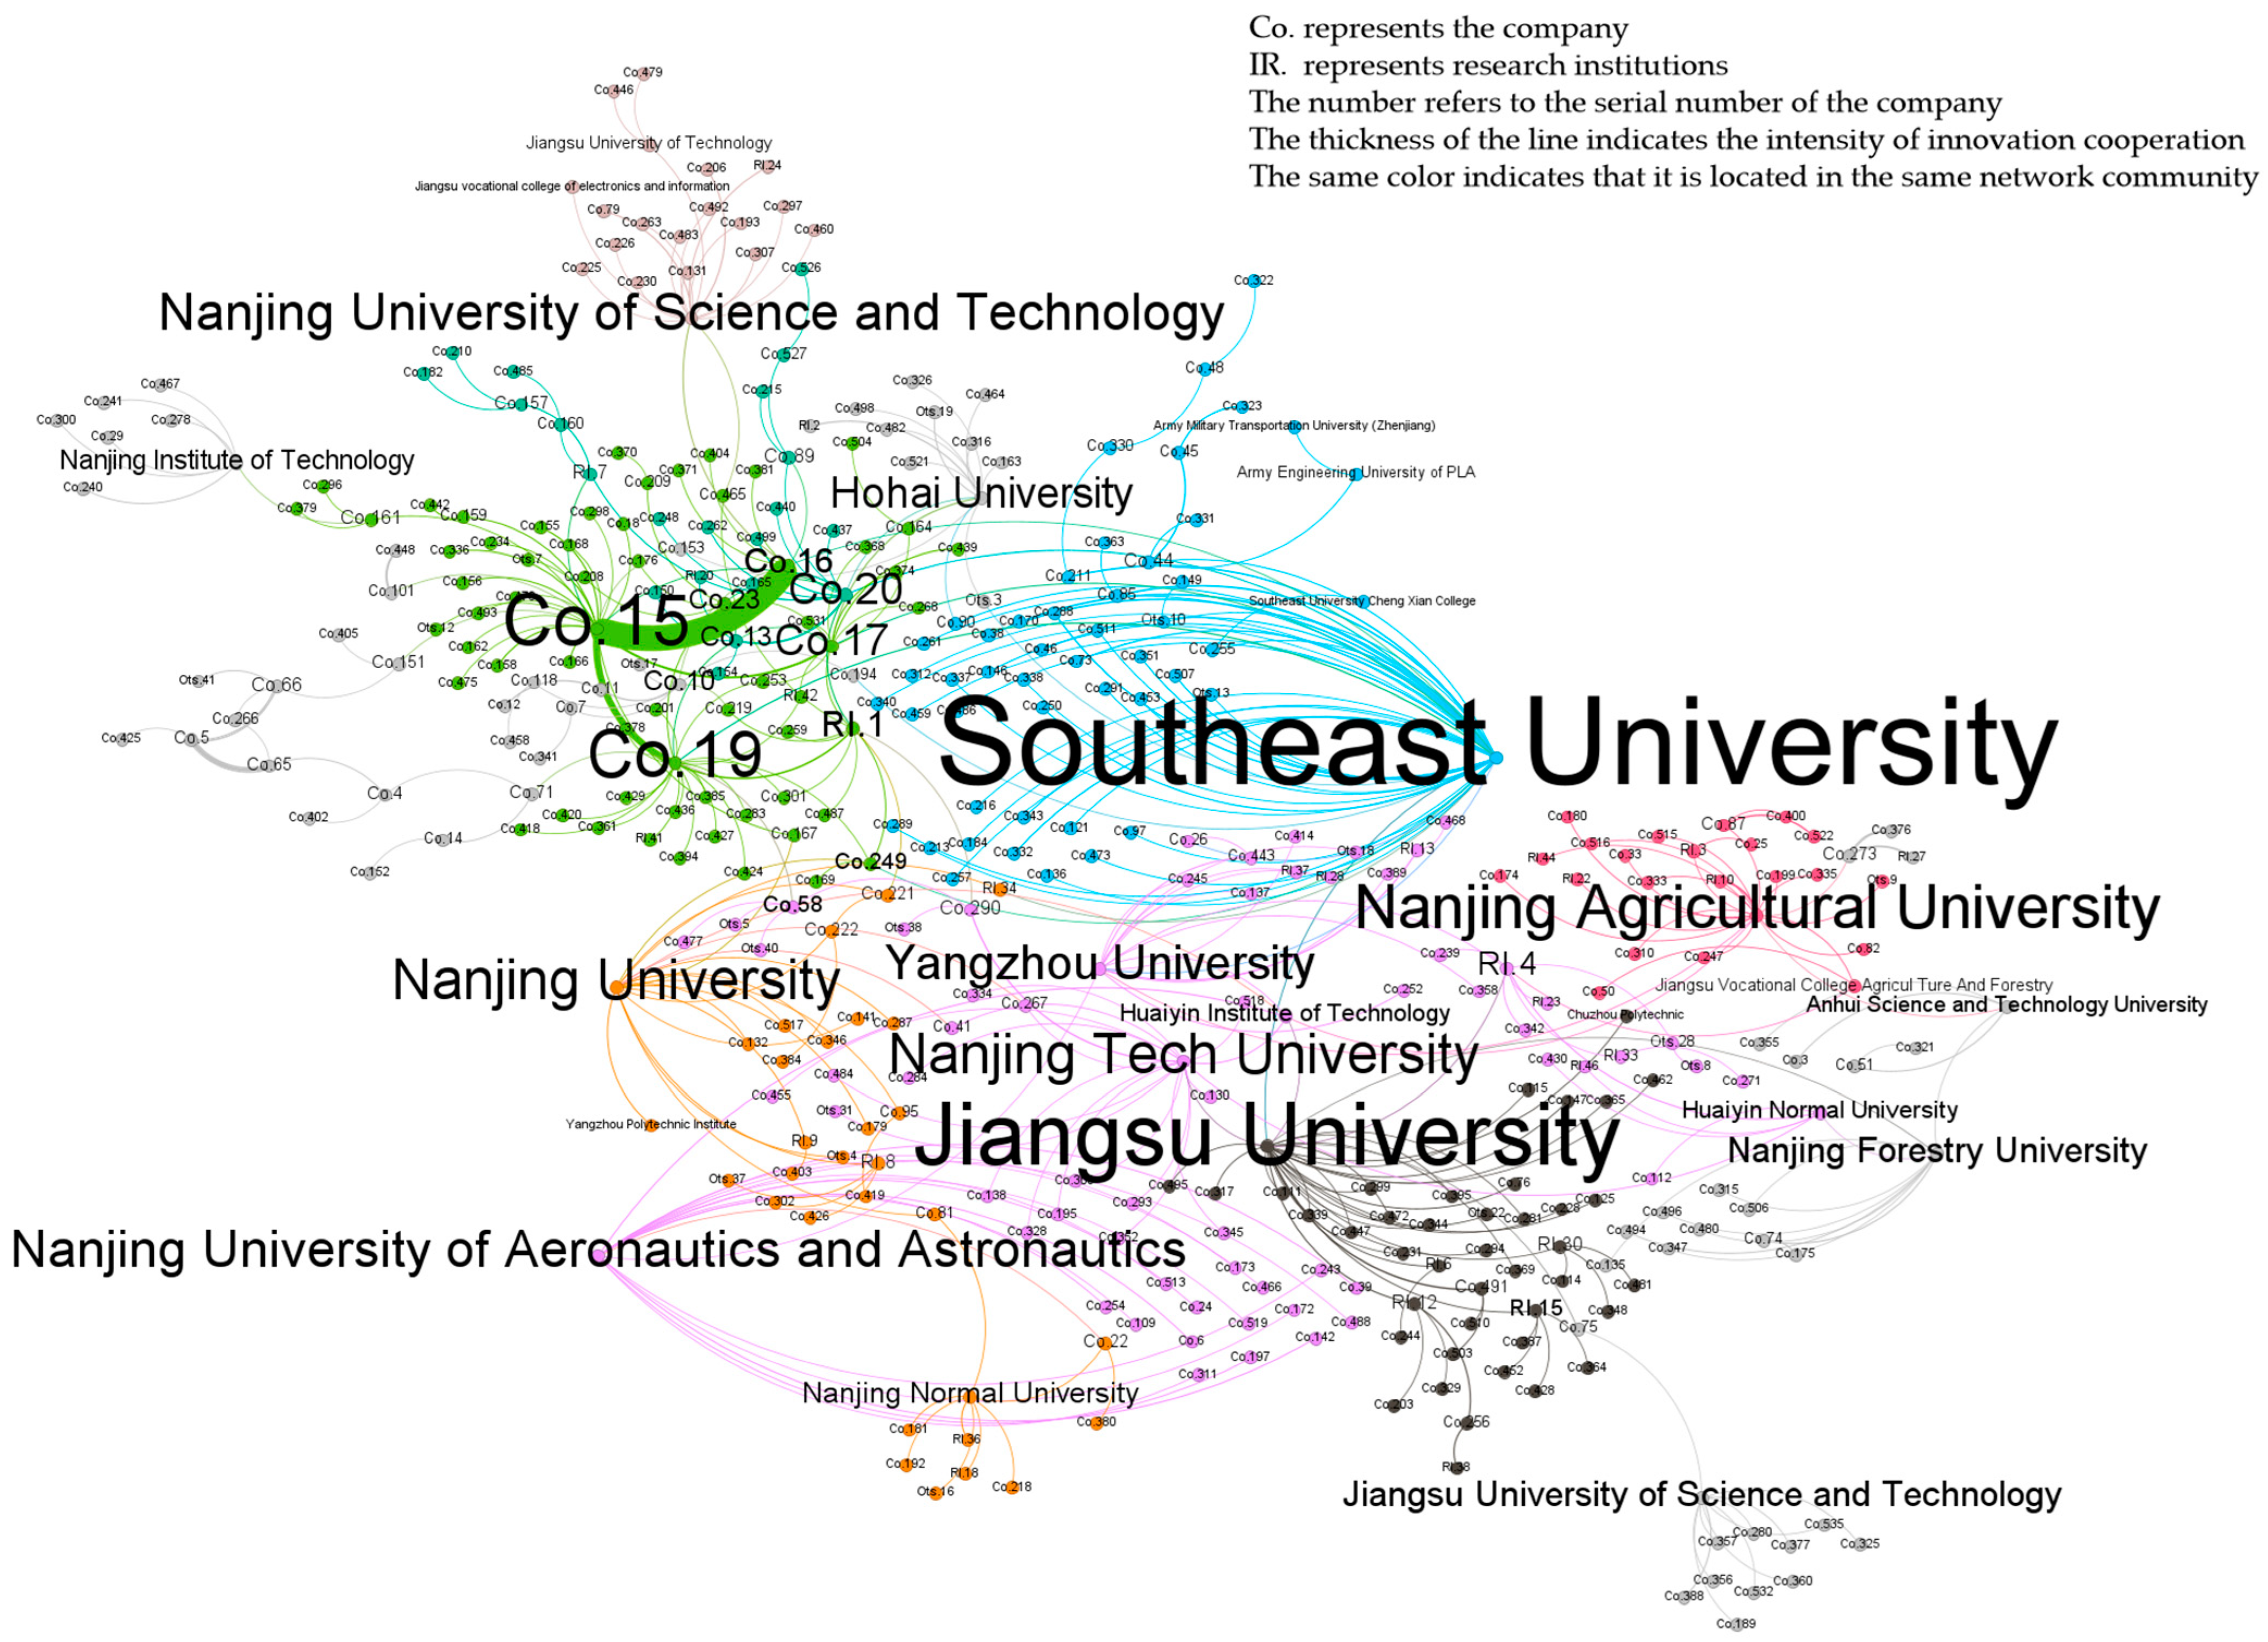
4.2. Comparison of Urban Knowledge and Technological Innovation Network

Since the inception of the Nanjing Metropolitan Area Urban Development Alliance, the region’s urban knowledge and TINs have undergone significant expansion. These networks are characterized by a pronounced “core-periphery” structure, with Nanjing’s participation exceeding 44% in both domains, thereby cementing its status as the undisputed nucleus. Nonetheless, several unique traits have been observed within this developmental framework.
(1) Differences in the Scale and Structure of the Overall Network
In evaluating the scale of innovation networks, it is evident that the KIN is more expansive than its technological counterpart, with the number of city pairs engaged in knowledge collaboration being two- to three-fold that of those involved in technological collaboration. However, the growth rate of the TIN is markedly greater than that of the KIN. In terms of network structure, distinct disparities in network centrality and structural heterogeneity were observed between the knowledge and TINs in 2013. These differences have been diminishing over time, and by 2020, the structural indicators of both networks have converged to a relatively similar level.
Concerning spatial structure, the hierarchy of the KIN has remained relatively stable, with the primary channels of cooperation concentrated between Nanjing and other cities within the Jiangsu Province. In contrast, the TIN has undergone more substantial changes, with the main channels of cooperation shifting from within the province to a broader inter-provincial scope. By 2020, Chuzhou and Ma’anshan in Anhui Province have become significant nodes within the TIN.
Examining the evolution of the networks, the expansion of the innovation networks continues to be predominantly focused around Nanjing, the core city. The overall growth rate of the TIN surpasses that of the KIN, with the most substantial contributions to this growth emanating from peripheral cities beyond Nanjing. This indicates a pronounced spillover effect of technological cooperation as opposed to knowledge cooperation. Among these cities, Ma’anshan has experienced the most rapid increase in technological collaboration. Being the nearest city to Nanjing in Anhui Province, Ma’anshan has benefited as a primary beneficiary of Nanjing’s technological spillover owing to its geographical proximity.
(2) Differences in the Roles of Various Cities within the Network
In examining the engagement of various cities within the realms of KINs and TINs (Table 5), it becomes evident that Nanjing maintains a harmonious participation in both spheres. This equilibrium stems largely from Nanjing’s status as an academic hub, boasting numerous renowned universities actively engaged in collaborative publications and patent production. As the provincial capital, Nanjing also houses the bulk of Jiangsu Province’s state-owned enterprises, which significantly contribute to patent generation.
In contrast, Changzhou exhibits a pronounced inclination towards the TIN over its knowledge counterpart. This disparity is rooted in the positive interplay between economic growth and technological advancements, with Changzhou emerging as a pivotal city in the NMA’s economic hierarchy—surpassed only by Nanjing in terms of economic development quality. By 2023, Changzhou’s GDP soared to 1.016 trillion yuan, marking it as the second city within the metropolitan area to surpass the trillion-yuan threshold, indicative of its robust patent contribution prowess.
Yangzhou and Huai’an, however, demonstrate a stronger presence in the KIN relative to the technological domain. Occupying a mid-tier economic position in the NMA, with GDPs of 742.3 billion yuan and 501.5 billion yuan, respectively, in 2023, their economic disparities somewhat influence their patent application shares within the region. Nonetheless, when viewed through the lens of scholarly collaboration, the gap narrows. Beyond the provincial capital of Nanjing, Changzhou, Zhenjiang, Yangzhou, and Huai’an are home to 11, 9, 9, and 7 tertiary education institutions, respectively. These institutions are pivotal in driving research partnerships, thereby mitigating the disparities in knowledge cooperation relative to those in economic development. Consequently, Yangzhou and Huai’an’s contributions to the KIN are marginally more pronounced than to the TIN.

4.3. Proximity Mechanisms of Innovation Collaboration in the NMA

Utilizing the MRQAP model and a suite of proximity variables, this study analyzed co-published papers and collaborative patent matrices from 2013 and 2020 as dependent variables, incorporating geographic, organizational, social, institutional, cognitive, and technological proximities within cities as explanatory variables for regression analysis. We executed 2000 random permutations, with the regression outcomes detailed in Table 6. The R² values for the regressions of co-published papers and collaborative patents across the two distinct years were 0.555, 0.466, 0.580, and 0.515, respectively, all with significance probabilities below 0.04. This indicates that the chosen proximity variables account for between 46.6% and 58% of the innovation collaboration in the NMA. Generally, the in MRQAP regression analyses are lower compared to those in ordinary least squares analyses; hence, the findings of this study possess considerable explanatory power.
Overall, the influences of geographical and institutional proximities on innovation cooperation are not substantial. This finding holds true for both co-authored publications and collaborative patents, with neither type of proximity significantly elucidating the degree of collaborative innovation. Typically, at urban agglomeration scales or broader, geographical proximity tends to enhance innovation cooperation positively [33,59], suggesting that shorter geographical distances correlate with tighter collaborative ties. Nonetheless, within the metropolitan context, geographical distance ceases to be a pivotal determinant of innovation collaboration. This observation may stem from the specifics of the study region’s scale and the developmental phase of its network. The NMA under scrutiny, situated in China’s densely populated Yangtze River Delta, boasts a high-speed rail network with a density of approximately 5.6 times the national average and a highway network roughly 2.8 times denser than the national average. Cities within this metropolitan zone, including Nanjing, essentially form a one-hour commuting loop, markedly diminishing the influence of physical distance on innovative collaboration. Moreover, innovation partnerships among these cities, whether reflected in joint publications or patents, are still nascent, displaying a pronounced “core-periphery” structural dynamic. Predominantly, innovation collaborations transpire between Nanjing and its neighboring metropolitan cities. As these cities are geographically proximate to Nanjing, spatial distance variations within the metropolitan area are negligible. Consequently, the vigor of innovation cooperation is more reliant on other factors of proximity.
In a similar vein, institutional proximity fails to account for the degree of innovation collaboration within the NMA. From the indicators, the marketization index difference between Nanjing and other cities within the NMA is relatively small. This may be because, since 1986, the Nanjing Regional Economic Coordination Council has been established in the NMA, the Jiangsu provincial government approved the “Nanjing Metropolitan Area Plan” in 2002, the “Nanjing Metropolitan Area Common Development Action Plan” was released in 2007, and the Nanjing Metropolitan Area Urban Development Alliance was established in 2013. Guided by the overarching strategy for coordinated regional development, cities within the NMA have increasingly integrated their marketization processes. The “Nanjing Metropolitan Area Development Plan”, released in 2021, advocates for the accelerated establishment of a unified market characterized by consistent, transparent regulations, standardized mutual recognition, and the orderly circulation of factors. While the harmonization of institutional environments is likely to expedite factor mobility across the NMA, it does not significantly alter the innovation network configurations within the region. Typically, in the nascent stages of marketization, the alignment of institutional frameworks aids in mitigating the impediments posed by local protectionism to inter-regional innovation collaboration. Nonetheless, the benefits derived from such institutional harmonization tend to diminish swiftly as market mechanisms become more sophisticated [60]. Positioned within the Yangtze River Delta urban cluster—one of China’s three economic powerhouses—the NMA has witnessed its nine constituent cities surpass the national average in marketization levels since 2013. Consequently, the NMA exhibits a high degree of marketization, and the resulting institutional convergence does not impede the vigor of innovation cooperation.
In the NMA, the factors of organizational, social, cognitive, and technological proximity have consistently passed significance tests across various years and types of innovation collaborations. This suggests that these proximity dimensions provide substantial explanatory power for the dynamics of innovation cooperation. As the innovation network matures, an increasing number of proximity factors become explicable, likely reflecting the innovation network’s rapid developmental phase in Nanjing. Moreover, the expansion of the innovation cooperation database offers clearer insights into how explanatory factors influence the outcomes. The R2 coefficients for patents and publications in the 2020 MRQAP regression results exceed those in 2013, further substantiating this observation.
The regression coefficients for organizational proximity in both paper and patent collaborations are positive, which suggests that organizational proximity positively influences innovation cooperation. Within the NMA, cities in the same province are more likely to establish innovation partnerships. This phenomenon aligns with the findings of [36], who observed a “provincial bias” in the innovation networks of Chinese metropolitan areas. Such bias implies that shared policies or management systems within a province can diminish the costs associated with knowledge exchange and spillover. However, the significance of organizational proximity differed between 2013 and 2020. In 2013, it was significant for both patent and paper collaborations, whereas in 2020, significance remained only for paper collaborations. Moreover, the explanatory power and significance of organizational proximity for co-authored papers in 2020 were weaker than in 2013. This trend indicates that as the NMA develops more rapidly, inter-city knowledge spillovers and innovation collaborations are increasingly transcending the limits of provincial organizational structures, leading to a growing degree of innovation integration.
Social proximity negatively influences innovation collaboration. In 2020, the regression analysis indicated that the coefficient for academic collaboration was −0.077, significant at the 1% level, while for patent collaboration, it stood at −0.096, significant at the 5% level. These findings suggest that, on the whole, cities across different dialect zones tend to engage in more collaborative endeavors, signifying that dialectal diversity does not impede innovation collaboration within the NMA. A similar pattern is observed in the corporate networks of the Yangtze River Delta region [42]. Hence, it can be deduced that innovation, collaboration, and communication predominantly occur through Standard Mandarin, a language that enjoys broader dissemination and acceptance as a universal linguistic framework. This ensures a robust communicative foundation for the integrated development of the NMA, with dialectal barriers exerting minimal impact on innovation collaboration in the contemporary era.
In 2020, technological proximity was a significant factor for both patent and paper collaboration. However, while the regression coefficient for patent cooperation was positive, indicating a higher likelihood of collaboration between cities with similar technological infrastructures, it was negative for paper cooperation, suggesting greater challenges in engaging in scholarly exchanges. This finding aligns with prior research on the Beijing–Tianjin–Hebei and Yangtze River Delta regions in China, which revealed that excessively close or distant technological proximities impede urban innovation partnerships. Overly close proximity can result in a “lock-in” effect, limiting technological diversity, whereas a vast distance may hinder the establishment of cooperative relationships due to inadequate knowledge overlap between cities. These insights imply that the current technological distances within the NMA are conducive to fostering technological alliances. Nonetheless, for knowledge collaboration, these distances might be suboptimal, either being too narrow or too broad. Furthermore, the use of patent types as proxies for measuring technological proximity may not accurately capture the dynamics of knowledge collaboration strength.
Cognitive proximity passed the significance test for patent cooperation and paper cooperation in 2013 and 2020. The regression coefficient was positive and had the highest absolute value, indicating that cognitive proximity plays a positive and significantly influential role in innovation cooperation, surpassing other proximity factors. This suggests that in the current stage of the NMA, cities with similar innovation capabilities are more likely to engage in paper and patent cooperation. This finding aligns with conclusions drawn by other scholars in their research on urban innovation networks in the Yangtze River Delta region, highlighting the strong promoting effect of cognitive proximity in intercity innovation cooperation [61]. This strong promoting effect typically occurs in the early stages of forming an innovation network, which is in line with the trend of the urban innovation network in the NMA being in a growth phase [62]. During the initial stages of innovation cooperation, cities with similar knowledge bases and innovation capabilities are more likely to jointly explore new knowledge and enhance the efficiency of innovation cooperation.

4.4. Limitations and Prospects

Although this paper uses data from collaborative publications and patents to measure the innovation network of the NMA, these are merely explicit factors. A substantial amount of tacit, unrecordable knowledge and technological cooperation is not included. Future research needs to further consider the measurement of these cooperation data and the study of the innovation networks they form. Additionally, the MRQAP method focuses on the impact of exogenous drivers, namely proximity factors, on city networks. There are many models that address the impact of endogenous drivers on city networks. Future research can further explore the endogenous influence mechanisms of metropolitan innovation networks.
While this paper analyzes the evolution of the knowledge and technology innovation network among cities in the NMA from a multidimensional proximity perspective, it only examines the data from the initial and final years. It also only considers the impact mechanism of independent proximity factors. However, in reality, proximity mechanisms are not mutually exclusive, and their impacts may overlap and intertwine [63]. Therefore, in future research, we should adopt a dynamic evolution perspective to explore the direct effects and interactions of multidimensional proximity at different stages of the network.
Since the introduction of the “Metropolitan Area” concept in China, it has propelled regional economic growth through “Urban Agglomeration” spatial configurations. Yet, it has also given rise to “hollowing-out development” issues [64]. In the future, metropolitan areas, with a single city at their core and on a smaller scale, will become vital in executing national strategies and enhancing urban and county development. Accordingly, the precision of innovation network research within metropolitan areas should be refined. It is necessary to augment research precision, delve into the evolution and proximity mechanisms of metropolitan area innovation networks at city and county levels, and more accurately discern the elements that facilitate efficient innovation flow within these areas.

5. Conclusions and Recommendations

5.1. Conclusions

In this study, we examined the evolving dynamics of knowledge and technological collaboration networks among cities within the NMA from 2013 to 2020. Our analysis utilized microdata from co-authored publications and joint patents. Employing the MRQAP method, we explored the proximity mechanisms influencing the formation of innovation networks in the metropolitan area, yielding the following conclusions:
The scale of the KIN within the NMA has experienced rapid growth, with increasing international integration, strengthening the interconnectedness of nodes within the city’s KIN. The closeness among the node cities in the knowledge innovation network has significantly increased, with Nanjing’s importance in the network continually rising and the network node status of other cities gradually converging. Spatially, a structure has emerged with Nanjing at its core, supported by primary axes Nanjing–Yangzhou and Nanjing–Changzhou and secondary axes Nanjing–Zhenjiang and Nanjing–Huai’an. Knowledge cooperation is predominantly within Jiangsu province, with collaborative papers between Nanjing and the cities of Changzhou and Yangzhou accounting for approximately half of the total co-authored publications. The number of principal knowledge collaboration channels within the NMA is rising markedly, propelling network expansion. Furthermore, knowledge collaboration between Nanjing and Anhui province cities such as Chuzhou, Xuancheng, and Wuhu is exhibiting notably rapid growth.
The scale of the TIN among NMA cities also shows a consistent upward trend, though patent collaboration is less extensive than within individual cities. The TIN in the metropolitan area is still nascent. From a network structure perspective, although the various indicators of the technological innovation network among NMA cities are significantly lower than those of the knowledge innovation network, there is a strong growth trend driven by Nanjing’s robust technological cooperation. Spatially, the pattern features Nanjing as the hub, with Nanjing–Changzhou as the main axis and secondary axes, including Nanjing–Yangzhou, Nanjing–Zhenjiang, and Nanjing–Ma’anshan. Over time, the TIN has been transitioning from intra-provincial to inter-provincial cooperation. Nevertheless, the technological network is characterized by a “rich-club” phenomenon, affecting the innovation network’s evolution. In terms of innovation collaboration entities, technological collaboration is predominantly among companies, with the substantial resources of universities and research institutions in the NMA occupying pivotal positions in the network.
Both the knowledge and technological networks in the NMA demonstrate a “core-periphery” configuration, with Nanjing’s participation surpassing 44% in each, securing its position as the unequivocal nucleus. Nanjing’s engagement in both knowledge and TINs is comparatively balanced. Changzhou assumes a more significant role in the TIN than in the KIN, whereas Yangzhou and Huai’an are more influential in the KIN than in the TIN. The overall magnitude of the urban KIN exceeds that of the TIN. Nonetheless, the TIN’s overall growth rate surpasses that of the KIN, with the principal contributions to this advancement coming from the peripheral cities in the patent collaboration network. Technological collaboration, in contrast to knowledge sharing, exhibits pronounced spillover effects.
Geographic and institutional proximities do not sufficiently account for knowledge and technological collaboration. Organizational, social, cognitive, and technological proximities offer explanatory power for innovation collaboration within the NMA across different years and types of innovation activities. As the urban innovation network matures, an increasing number of proximity factors become explicable. Notably, cognitive proximity is the chief driver of knowledge and technological collaboration between cities in the metropolitan area, with cities of similar innovation capacities more inclined towards collaborative research and patent endeavors.

5.2. Recommendations

Firstly, the sustainable and synergistic development of the metropolitan innovation network can be fostered by capitalizing on the general attributes of KIN and TIN. Given that both networks exhibit a “core-periphery” structure, Nanjing’s role as the absolute central city should be further leveraged. This involves upgrading its functions to those of a global city, continuously enhancing Nanjing’s nodal position in both Chinese and international innovation networks, linking knowledge and technological cooperation with external central cities, and absorbing external knowledge spillovers. This will profoundly drive the comprehensive and sustainable development of the metropolitan area. Additionally, there is a need to expedite the capability enhancement of pivotal node cities such as Yangzhou, Changzhou, and Zhenjiang. By leveraging their intermediary roles in the network, they can catalyze the synergistic growth of the entire region through network effects and economies of scale.
Secondly, acknowledging that enterprises are the principal applicants for patents, an innovation ecosystem centered on industry-academia-research collaboration is essential. To foster intimate cooperation between universities and enterprises, increased policy support and financial investment are required. Encouraging joint research project applications and facilitating the commercialization of scientific and technological breakthroughs are pivotal. Such measures will effectively harness the copious resources of universities and research institutions within the NMA for business application.
Thirdly, among the various dimensions of proximity, cognitive proximity is notably influential in enhancing knowledge cooperation and technological collaboration. In light of this, measures should be taken to further narrow the cognitive distance between cities within the NMA regarding knowledge and technology. Establishing and sharing R&D platforms, such as innovation research institutes, joint laboratories, and technology transfer centers equipped with advanced facilities, ample resources, and high-caliber talent, is advisable. This strategy will not only strengthen the innovation network but also establish a robust innovation cooperation alliance, actively fostering an innovative NMA. It will also contribute to propelling the Yangtze River Delta urban agglomeration towards realizing a community of science and technology innovation, thereby accelerating its innovation trajectory.

Author Contributions

Conceptualization, Yu Shi; Data curation, Yiran Yan; Formal analysis, Yu Shi; Funding acquisition, Xingping Wang; Methodology, Yu Shi and Yiran Yan; Project administration, Xingping Wang; Supervision, Xingping Wang; Visualization, Yu Shi; Writing—original draft, Yu Shi; Writing—review and editing, Wei Zhai. All authors have read and agreed to the published version of the manuscript.

Funding

This research was funded by the Key Program of the National Social Science Foundation of China, grant number No. 22AZD052.

Data Availability Statement

The data on co-authored publications are available in China’s Wanfang database (https://www.wanfangdata.com.cn/) (accessed on 26 June 2024) and the Web of Science (WOS) (https://www.webofscience.com/wos/author/search) (accessed on 26 June 2024). Patent data can be found in the patent information database of the China National Intellectual Property Administration (http://epub.cnipa.gov.cn/) (accessed on 26 June 2024). The methodology for measuring variables influencing proximity has already been detailed in the paper. For further inquiries, please contact the author at [email protected].

Conflicts of Interest

The authors declare no conflicts of interest.

References

  1. Huggins, R. Competitiveness and the Global Region: The Role of Networking Innovation Networks and Learning Regions; Jessica Kingsley Publishers: London, UK, 1997. [Google Scholar]
  2. Diez, J.R. Metropolitan Innovation Systems: A Comparison between Barcelona, Stockholm, and Vienna. Int. Reg. Sci. Rev. 2002, 25, 63–85. [Google Scholar] [CrossRef]
  3. Castells, M. The Rise of the Network Society; Blackwell: Oxford, UK, 1996. [Google Scholar]
  4. Gottmann, J. Megalopolis or the Urbanization of the Northeastern Seaboard. Econ. Geogr. 1957, 33, 189. [Google Scholar] [CrossRef]
  5. Vicino, T.J.; Hanlon, B.; Short, J.R. Megalopolis 50 Years On: The Transformation of a City Region. Int. J. Urban Reg. Res. 2007, 31, 344–367. [Google Scholar] [CrossRef]
  6. Lang, R.; Knox, P.K. The New Metropolis: Rethinking Megalopolis. Reg. Stud. 2009, 43, 789–802. [Google Scholar] [CrossRef]
  7. Li, Y. A Preliminary Analysis on Urban Innovation Network of Metropolitan Region and its Characteristics. City Plan. Rev. 2019, 43, 27–33+39. (In Chinese) [Google Scholar]
  8. Gottmann, J. Megalopolis Revisited: 25 Years Later; University of Maryland Urban Studies: College Park, MD, USA, 1987. [Google Scholar]
  9. Taylor, P.J.; Catalano, G.; Walker, D.R.F. Measurement of the World City Network. Urban Stud. 2002, 39, 2367–2376. [Google Scholar] [CrossRef]
  10. Fischer, M.M.; Diez, J.R.; Snickars, F. Metropolitan Innovation Systems: Theory and Evidence from Three Metropolitan Regions in Europe; Springer Science & Business Media: Berlin/Heidelberg, Germany, 2001. [Google Scholar]
  11. Bettencourt, L.M.A.; Lobo, J.; Strumsky, D. Invention in the city: Increasing returns to patenting as a scaling function of metropolitan size. Res. Policy 2007, 36, 107–120. [Google Scholar] [CrossRef]
  12. Li, Y.; Phelps, N. Megalopolis unbound: Knowledge collaboration and functional polycentricity within and beyond the Yangtze River Delta Region in China. Urban Stud. 2018, 55, 443–460. [Google Scholar] [CrossRef]
  13. Yu, H.; Ning, Y. Introduction to Urban Geography; Anhui Science and Technology Press: Hefei, China, 1983. [Google Scholar]
  14. Dong, L. Initial thoughts of China’s Urbanization; Chinese Construction Industry Press: Beijing, China, 1989. [Google Scholar]
  15. Fang, C.; Yu, D. Urban agglomeration: An evolving concept of an emerging phenomenon. Landsc. Urban Plan. 2017, 162, 126–136. [Google Scholar] [CrossRef]
  16. Zhang, Y.; Li, H. Innovation search of new ventures in a technology cluster: The role of ties with service intermediaries. Strateg. Manag. J. 2010, 31, 88–109. [Google Scholar] [CrossRef]
  17. Fu, W.; Revilla Diez, J.; Schiller, D. Interactive learning, informal networks and innovation: Evidence from electronics firm survey in the Pearl River Delta. China Res. Policy 2013, 42, 635–646. [Google Scholar] [CrossRef]
  18. Chen, J.; Jiang, L.; Tian, Y.; Luo, J. The Study of Regional Innovation Network Structure: Evidence from the Yangtze River Delta Urban Agglomeration. ISPRS Int. J. Geo-Inf. 2023, 12, 428. [Google Scholar] [CrossRef]
  19. Liang, L.; Wang, Z.; Li, J. The effect of urbanization on environmental pollution in rapidly developing urban agglomerations. J. Clean. Prod. 2019, 237, 117649. [Google Scholar] [CrossRef]
  20. Macioszek, E.; Jurdana, I. Transport of Goods on the Example of a Selected Section of Transport in Poland. Sci. J. Silesian Univ. Technol. Ser. Transp. 2023, 121, 127–140. [Google Scholar] [CrossRef]
  21. Zhang, Q.; Su, S. Determinants of urban expansion and their relative importance: A comparative analysis of 30 major metropolitans in China. Habitat Int. 2016, 58, 89–107. [Google Scholar] [CrossRef]
  22. Wang, Y.; Wang, C.; Mao, X.; Liu, B.; Zhang, Z.; Jiang, S. Spatial Pattern and Benefit Allocation in Regional Collaborative Innovation of the Yangtze River Delta, China. Chin. Geogr. Sci. 2021, 31, 900–914. [Google Scholar] [CrossRef]
  23. Wang, X. Preliminary study on the basic characteristics and develoment mechanism of innovative metropolitan area. Nanjing J. Soc. Sci. 2014, 9–16. (In Chinese) [Google Scholar] [CrossRef]
  24. Wang, X.; Zhu, K. Innovative space of metropolitan area: Types, patterns and evolution: The caseof Nanjing metropolitan area. Urban Dev. Stud. 2015, 22, 8–15. (In Chinese) [Google Scholar]
  25. Zhan, X.; Wang, B. A study on knowledge ecology and metropolitan innovation system: The review based on literature. Stud. Sci. Sci. 2014, 32, 1909–1920. (In Chinese) [Google Scholar]
  26. Wang, X.; Feng, M.; Gu, H. A study discriminative characteristics of intercity innovation linkage at different scales: A case study of Yangtze River Delta. J. Southeast Univ. Philos. Soc. Sci. 2015, 17, 108–116+148. (In Chinese) [Google Scholar]
  27. Shen, M.; Wang, Z.; Cui, G. Planning metropolitan regions in China: Theoretical originsand planning practices. Urban Plan. Forum 2023, 2023, 57–66. (In Chinese) [Google Scholar]
  28. Bathelt, H.; Malmberg, A.; Maskell, P. Clusters and knowledge: Local buzz, global pipelines and the process of knowledge creation. Prog. Hum. Geogr. 2004, 28, 31–56. [Google Scholar] [CrossRef]
  29. Karlsson, C.; Johansson, B.; Stough, R. Entrepreneurship and Dynamics in the Knowledge Economy; Routledge: London, UK, 2006; Volume 25. [Google Scholar]
  30. Ma, H.; Li, Y.; Huang, X. Proximity and the evolving knowledge polycentricity of megalopolitan science: Evidence from China’s Guangdong-Hong Kong-Macao Greater Bay Area, 1990–2016. Urban Stud. 2021, 58, 2405–2423. [Google Scholar] [CrossRef]
  31. Lu, T.; Wu, Z.; Huang, L. Network relations and spatial organization: A comparative analysis of innovative cooperation relations between the Yangtze River Delta and northeastern U. S. city groups. Urban Plan. Forum 2016, 31, 51–60. (In Chinese) [Google Scholar]
  32. Jiao, M.; Du, D.; Gui, Q.; Hou, C. The spatio-temporal evolution and influencing factors of urban technical corporation networks: From the perspective of Belt and Road. Geogr. Res. 2021, 40, 913–927. (In Chinese) [Google Scholar]
  33. Xi, Q.; Li, G.; Sun, Y.; Lyu, S. Evolutionary characteristics of science and technology cooperation network of Beijing-Tianjin-Hebei region and its influencing factors. Acta Geogr. Sin. 2022, 77, 1359–1373. (In Chinese) [Google Scholar]
  34. Zhang, J.G.; Wang, H. The holist transforation implied in the San Francisco Bay Areaplanning: With discussion on Chinese metropolitan area planning. Urban Plan. Int. 2022, 37, 114–121. (In Chinese) [Google Scholar]
  35. Yin, Z.; Yuan, X.; Lu, Q.; Lin, P.; Wang, Q. China Metropolitan Area Development Report; Tsinghua University Press: Beijing, China, 2019. (In Chinese) [Google Scholar]
  36. Li, Y.; Phelps, N. Knowledge polycentricity and the evolving Yangtze River Delta megalopolis. Reg. Stud. 2017, 51, 1035–1047. [Google Scholar] [CrossRef]
  37. Hagedoorn, J.; Cloodt, M. Measuring innovative performance: Is there an advantage in using multiple indicators? Res. Policy 2003, 32, 1365–1379. [Google Scholar] [CrossRef]
  38. Huallachain, B.Ó.; Lee, D.S. Urban centers and networks of coinvention in American biotechnology. Ann. Reg. Sci. 2014, 52, 799–823.1. [Google Scholar] [CrossRef]
  39. Sun, Y.; Lu, Y.; Wang, T.; Ma, H.; He, G. Pattern of patent-based environmental technology innovation in China. Technol. Forecast. Soc. Chang. 2008, 75, 1032–1042. [Google Scholar] [CrossRef]
  40. Yan, Y.; Wang, X. Global Contraction and Local Strengthening of Firms’ Supply and Sales Logistics Networks in the Context of COVID-19: Evidence from the Development Zones in Weifang, China. ISPRS Int. J. Geo-Inf. 2021, 10, 477. [Google Scholar] [CrossRef]
  41. Broekel, T.; Balland, P.-A.; Burger, M.; van Oort, F. Modeling knowledge networks in economic geography: A discussion of four methods. Ann. Reg. Sci. 2014, 53, 423–452. [Google Scholar] [CrossRef]
  42. Zhang, W.; Derudder, B.; Wang, J.; Witlox, F. An analysis of the determinants of the multiplex urban networks in the Yangtze River Delta. Tijdschr. Voor Econ. En Soc. Geogr. 2020, 111, 117–133. [Google Scholar] [CrossRef]
  43. Shaw, A.T.; Gilly, J.-P. On the Analytical Dimension of Proximity Dynamics. Reg. Stud. 2000, 34, 169–180. [Google Scholar] [CrossRef]
  44. Torre, A.; Rallet, A. Proximity and localization, Reg. Stud. 2005, 39, 47–59. [Google Scholar] [CrossRef]
  45. Kirat, T.; Lung, Y. Innovation and proximity: Territories as loci of collective learning processes. Eur. Urban Reg. Stud. 1999, 6, 27–38. [Google Scholar] [CrossRef]
  46. Boschma, R. Proximity and innovation: A critical assessment. Reg. Stud. 2005, 39, 61–74. [Google Scholar] [CrossRef]
  47. Knoben, J.; Oerlemans, L.A.G. Proximity and inter-organizational collaboration: A literature review. Int. J. Manag. Rev. 2006, 8, 71–89. [Google Scholar] [CrossRef]
  48. Liu, Y.; Shao, X.; Tang, M.; Lan, H. Spatio-temporal evolution of green innovation network and its multidimensional proximity analysis: Empirical evidence from China. J. Clean. Prod. 2021, 283, 124649. [Google Scholar] [CrossRef]
  49. Hoekman, J.; Frenken, K.; Tijssen, R.J.W. Research collaboration at a distance: Changing spatial patterns of scientific collaboration within Europe. Res. Policy 2010, 39, 662–673. [Google Scholar] [CrossRef]
  50. Balland, P.A.; Boschma, R.; Frenken, K. Proximity and innovation: From statics to dynamics. Reg. Stud. 2015, 49, 907–920. [Google Scholar] [CrossRef]
  51. Hong, W.; Su, Y.S. The effect of institutional proximity in non local university-industry collaborations: An analysis based on Chinese patent data. Res. Policy 2013, 42, 454–464. [Google Scholar] [CrossRef]
  52. Wang, E.; Hu, Z.; Zhou, S.; Hao, W.; Liu, Y. Chinese Cultural Geography; Science Press: Beijing, China, 2008. (In Chinese) [Google Scholar]
  53. Fan, G.; Wang, X.; Zhu, H. Indexes on Chinese Marketization; Economic Science Press: Beijing, China, 2011. (In Chinese) [Google Scholar]
  54. Liu, F.; Nan, D. The impact of geographical proximity on enterprise innovation performance. Stud. Sci. Sci. 2018, 36, 1708–1715. (In Chinese) [Google Scholar]
  55. Frenken, K.; Van Oort, F.; Verburg, T. Related variety, unrelated variety and regional economic growth. Reg. Stud. 2007, 41, 685–697. [Google Scholar] [CrossRef]
  56. Kou, Z.; Liu, X. FIND Report on City and Industrial Innovation in China (2017); Fudan Institute of Industrial Development, School of Economics, Fudan University: Shanghai, China, 2017. (In Chinese) [Google Scholar]
  57. Lanjouw, J.O. Patent protection in the shadow of infringement: Simulation estimations of patent value. Rev. Econ. Stud. 1998, 65, 671–710. [Google Scholar] [CrossRef]
  58. Jaffe, A.B. Demand and supply influences in R&D intensity and productivity growth. Rev. Econ. Stat. 1988, 70, 431–437. [Google Scholar] [CrossRef]
  59. Scherngell, T.; Hu, Y. Collaborative knowledge production in China: Regional evidence from a gravity model approach. Reg. Stud. 2011, 45, 755–772. [Google Scholar] [CrossRef]
  60. Wang, Q.; Hu, Z. Urban Innovation network of Zhejiang from the perspective of multidimensional proximities. Sci. Geogr. Sin. 2021, 41, 1380–1388. (In Chinese) [Google Scholar]
  61. Dai, L.; Liu, C.; Wang, S.; Ji, Y.; Ding, Z. Proximity and self-organizing mechanisms underlying scientific collaboration of cities in the Yangtze River Delta. Geogr. Res. 2022, 41, 2499–2515. (In Chinese) [Google Scholar]
  62. Wang, H.; Sun, Q.; Guo, J.; Du, M. Research on evolution dynamic of collaborative innovation network in the urban agglomeration of Yangtze River Delta based on ERGM. Sci. Technol. Prog. Policy 2021, 38, 45–53. (In Chinese) [Google Scholar]
  63. Cao, Z.; Derudder, B.; Peng, Z. Interaction between different forms of proximity in inter-organizational scientific collaboration: The case of medical sciences research network in the Yangtze River Delta region. Pap. Reg. Sci. 2019, 98, 1903–1924. [Google Scholar] [CrossRef]
  64. Fang, C. Important progress and future direction of studies on China’s urban agglomerations. J. Geogr. Sci. 2015, 25, 1003–1024. [Google Scholar] [CrossRef]
Figure 1. Location of study area.
Ijgi 13 00273 g001
Figure 2. Analysis steps.
Ijgi 13 00273 g002
Figure 3. Selection of variables for proximity influence factors.
Ijgi 13 00273 g003
Figure 4. Number and growth rate of co-published papers in the NMA.
Ijgi 13 00273 g004
Figure 5. Composition of urban KIN in the NMA, 2013 (a) versus 2020 (b).
Ijgi 13 00273 g005
Figure 6. The structure of the urban knowledge collaboration network in the NMA, 2013 (a) compared to 2020 (b).
Ijgi 13 00273 g006
Figure 7. Composition of urban TIN in the NMA, 2013 (a) versus 2020 (b).
Ijgi 13 00273 g007
Figure 8. The structure of the urban TIN in the NMA, 2013 (a) compared to 2020 (b).
Ijgi 13 00273 g008
Figure 9. Innovation entities’ collaborative network topological diagram in the NMA, 2013–2020.
Ijgi 13 00273 g009
Table 1. Indicators of social network analysis and their interpretations.
IndicatorCalculation FormulaFormula ExplanationMeaning of Indicator
Degree Centrality D C i = j = 1 N X i j ( i j ) Total number of connections of node i with other nodes.The significance of nodes within a network
Network Density D N = L N ( N 1 ) The proportion of existing connections among network nodes relative to the maximum potential connections.Tightness of the network
Average Clustering Coefficient C ¯ = 1 N i = 1 N e i E i ( E i 1 ) The average ratio of the actual number of edges linking nodes within the network to the maximum feasible number of edges.Describes the degree to which nodes in the entire network are clustered into small groups
Average Path Length L = 1 N ( N 1 ) i j d i j The mean length of the shortest paths connecting all pairs of nodes in the network.Measures the connectivity of the network
Note: i, j represent nodes; N represents the total number of nodes in the network; X i j represents the number of connections between node i and node j; C ¯ represents the average clustering coefficient of the nodes; e i represents the actual number of edges connected to node i in the network; E i represents the maximum possible number of connecting edges for node i in the network; L represents the average path length of the network; d i j represents the shortest path between node i and node j.
Table 2. Urban KIN Characteristics in the NMA, 2013–2020.
YearNumber of RelationshipsNetwork DensityAverage Clustering CoefficientAverage Path Length
2013320.8890.9371.111
2014330.9170.9401.083
2015310.8610.9091.139
2016320.8890.9371.111
2017310.8610.8781.139
2018350.9720.9721.028
2019350.9720.9721.028
2020350.9720.9721.028
Table 3. Urban TIN characteristics in the NMA, 2013–2020.
YearNumber of RelationshipsNetwork DensityAverage Clustering CoefficientAverage Path Length
2013100.3570.6951.643
2014120.4290.8011.571
2015100.3570.6951.643
2016120.3330.6431.833
2017140.3890.6501.611
2018140.5000.8461.500
2019150.4170.6651.583
2020160.4440.7721.556
Table 4. Collaboration ratios among various entities in the NMA’s TIN, 2013–2020 (%).
Type of CollaborationNMANanjing–ChangzhouNanjing–YangzhouNanjing–Zhenjiang
Company to Company67.10%85.48%59.12%53.17%
University to University1.85%0.30%1.95%1.75%
Research Institution to Research Institution0.69%2.12%00.22%
Company to University20.71%5.75%27.25%33.70%
Company to Research Institution5.86%6.20%9.00%5.25%
University to Research Institution3.79%0.15%2.68%5.91%
Table 5. Assessment of the ratio of co-published papers and collaborative patents among cities within the NMA.
CityPercentage of Co-Published PapersPercentage of Collaborative Patents
2013202020132020
Nanjing45.02%44.44%48.61%47.11%
Changzhou14.33%13.38%24.56%15.00%
Zhenjiang8.51%11.04%11.65%11.32%
Yangzhou16.56%14.60%7.59%11.05%
Huai’an9.14%10.16%4.30%3.03%
Ma’anshan2.29%1.06%1.27%8.55%
Chuzhou0.89%1.36%2.03%2.37%
Wuhu2.99%3.54%0.00%1.18%
Xuancheng0.27%0.40%0.00%0.39%
Table 6. Results from MRQAP regression analysis on innovation networks within the NMA for the Years 2013 and 2020.
Variable20132020
PaperPatentPaperPatent
Stdized
Coefficient
SignificanceStdized
Coefficient
SignificanceStdized
Coefficient
SignificanceStdized
Coefficient
Significance
Geo0.0670.282−0.0380.3960.0330.341−0.130.175
Org0.3600.005 ***0.2800.047 **0.3510.016 **0.190.12
Soc−0.0800.180−0.1250.064 *−0.0770.003 ***−0.0960.038 **
Ins−0.0750.316−0.0430.403−0.0420.4020.0300.427
Cog0.6930.003 ***0.6270.018 **0.6430.001 ***0.6200.004 ***
Tec0.1130.2150.1660.135−0.0160.000 ***0.0090.000 ***
R-square0.5550.4660.5800.515
Adj R-Sqr0.5490.4250.5490.478
Note: * p < 0.1, ** p < 0.05, *** p < 0.01.
Disclaimer/Publisher’s Note: The statements, opinions and data contained in all publications are solely those of the individual author(s) and contributor(s) and not of MDPI and/or the editor(s). MDPI and/or the editor(s) disclaim responsibility for any injury to people or property resulting from any ideas, methods, instructions or products referred to in the content.

