Abstract
Amid urban expansion, historic districts face challenges such as declining vitality and deteriorating spatial quality. Using the streets of Xi’an’s historical and cultural district as examples, this research utilizes multisource data, including points of interest (POIs), street view images, and Baidu heatmaps, alongside analytical techniques such as machine learning. This study explores the determinants of street vitality from the dual perspectives of its external manifestation and spatial carriers. A quantitative framework for measuring street vitality in historic districts is established, thoroughly examining the driving factors behind street vitality. Additionally, the relationship between built environment indicators and street vitality is elucidated through statistical analysis methods. The findings reveal significant, time-varying influences of these spatial carriers on human vitality, with distinct spatial distribution patterns of human activity across different times, and the significance of the influence of external representations of human vitality and various types of spatial carriers varies over time. Based on these insights, this paper proposes strategies for enhancing the vitality of historic streets, aiming to rejuvenate and sustain the diverse and dynamic energy of these districts. It provides a foundation for revitalizing the vigor of cultural heritage zones and offers strategies applicable to similar urban contexts.
1. Introduction
In the early 1930s, modern urban planning concepts, such as those proposed by Le Corbusier in The Radiant City (La Ville Radieuse), advocated for the zoning of urban functions and emphasized the organization and efficiency of transportation [1]. This planning method prioritized traffic efficiency in road design but did not sufficiently consider the multiple functions of streets as urban public spaces, including their social and placemaking roles. As road rights gradually shifted toward motorized vehicles, the nature of the street was simplified to a single transportation function [2]. This led to isolated buildings and a lack of interaction, causing urban life to become monotonous and dull [3]. This phenomenon suggests that urban design that aims purely for smooth transportation ignores the importance of the composite functionality and human scale of urban space. Since the 1960s, with the rethinking of modern function-oriented urban planning, people have aspired to diverse and vibrant urban spaces [4]. Vibrant cities and streets not only are conducive to improving residents’ well-being and social cohesion but also enhance the attractiveness of cities and their potential for sustainable development [5,6]. The spread of urban boundaries has led to a steady decline in the density of urban core areas and even the emergence of “urban decay” and “ghost cities” [7,8]. Streets have been neglected in the rapid expansion of cities and have gradually become lost urban public spaces, and the vitality of streets has also been seriously affected or even disappeared. Since Jane Jacobs first proposed the concept of “street vitality”, street vitality and its influencing factors have attracted extensive theoretical exploration and empirical research in a large number of cities and regions. However, the applicability of these theoretical or empirical findings to streets in historic districts in developing countries remains uncertain, and identifying potential influences on vitality remains challenging.
In the process of efficiency-oriented urbanization, many developing countries have experienced rapid development and transformation, and urban historic districts have been declining [9,10]. These districts contain large numbers of tangible elements (buildings, landscapes, etc.) and intangible elements (traditional customs and regional culture) that perpetuate the customs and memories of the place and exhibit distinctive local characteristics [11]. The decline of historic districts is manifested in the deterioration of their functions, loss of population, and diminished vitality [12,13]. This decline is caused by a variety of factors, including urbanization, modernization, and globalization [14,15,16]. In response to this declining trend, policymakers and urban planners have adopted the concept of dynamic preservation. The modest development and renovation of historic districts is considered to be an effective means of reviving vitality and is well recognized [17,18]. However, it is evident that many historic districts still exhibit a coexistence of prosperity and decline, with an uneven distribution of vitality. Further research is needed to understand how to develop vibrant historic districts effectively. As essential public spaces, the streets of historic districts facilitate the primary interactions and activities of residents and tourists, directly reflecting the vitality of these areas. Investigating the vitality distribution characteristics of streets in historic districts during dynamic protection phases, along with their built environment factors, can help uncover the underlying driving mechanisms of street vitality. This, in turn, provides theoretical support for the comprehensive revitalization of historic districts.
In terms of research content, most of the current research focuses on the main streets of urban areas, while research on historic districts is often limited to specific elements rather than the perspective of vitality revival [12], which is easily caught in “not seeing the big picture”, resulting in a lack of comprehensive exploration of the internal driving mechanism of the vitality of historic and cultural districts [19]. On the one hand, historic districts lacking vitality, even if well preserved, will only be fossilized and eventually excluded from the development of modern society. On the other hand, enhancing the vitality of historic districts can provide more conditions needed for survival and development. For example, in terms of commerce, it can attract more customers; in terms of community, it can improve community cohesion; and in terms of culture, it can enhance cultural confidence. Revitalizing vitality is a driving force for the sustainable development of historic districts, and it is crucial to identify the external and internal factors affecting the vitality of historic districts and to study the extent of their impact on vitality. In early research methods, questionnaires, field research, and expert ratings were mostly used for vitality evaluation [20]. Such traditional data reflect the detailed characteristics of human activities and built environment features to a certain extent, because such methods require large amounts of time, labor, and financial resources, and it is also difficult to capture dynamic changes in vitality [21,22]. Consequently, most of the studies using this data collection method focus on only a few typical streets, and it is difficult to expand the scope of these studies [23,24]. With the development of big data technology, POI data, social media check-in data, cell phone signaling, and other local service-based (LBS) data have been gradually applied to the study of urban space, and the research methods and perspectives have gradually diversified [25,26,27]. These big data have significant advantages, such as wide spatial coverage and rich humanistic information. LBS data are clustered according to location, and the degree of clustering presented can reflect the vitality of streets to a certain extent, which is widely used by academics because of its high resolution and relatively open API.
Therefore, this study takes the streets of Xi’an’s historic and cultural districts as an empirical case study, constructs a street vitality evaluation index system for historic districts using online open-source data, measures the distribution characteristics of street vitality, reveals the specific influencing factors of street vitality using correlation analysis, and proposes corresponding optimization strategies for street vitality. This study attempts to answer the following two questions: (1) What are the characteristics of street vitality in historic districts? (2) What factors influence the distribution characteristics of street vitality in Xi’an’s historic and cultural districts?
The contributions of this study include the following: (1) to study street revitalization in historic districts from the perspective of vitality; (2) to explore the impacts on street vitality from a multidimensional perspective; (3) to reveal the dynamic distribution pattern of human activities and the relevance of the physical spatial environment; and (4) to provide insights for policymakers and urban practitioners who try to revitalize historic districts.
The remainder of this paper is organized as follows: Section 2 reviews the relevant theories of neighborhood vitality and vitality measurement methods, and it highlights the shortcomings of the current research; Section 3 introduces the research site and data selection; Section 4 elaborates upon the research methodology; Section 5 presents the analysis results; and finally, Section 6 provides a discussion and conclusions.
2. Literature Review and Conceptual Framework
2.1. Studies of Street Vitality
Streets, as crucial linear public spaces in urban environments, are key components of urban morphology and the fundamental framework of urban spatial organization. They are also significant places where people perceive urban form and engage in various socioeconomic activities [28]. Jane Jacobs introduced the concept of street vitality, asserting through her observations of human behavior that the vitality of streets arises from “diversity”—the interactions among people and the interweaving of human activities with living spaces, breathing life into the streets. Subsequently, Kevin Lynch defined vitality in terms of survivability, safety, and adaptability, highlighting that “vitality” is the primary indicator for evaluating urban morphology. Jan Gehl explored the mechanisms for generating and enhancing street vitality from the perspectives of outdoor spaces and activities. Modern street design often prioritizes automobiles and efficiency, resulting in strong correlations between streets and metrics such as traffic flow, building density, and floor area ratio, which gradually marginalize pedestrians within the transportation system [29]. Current research on spatial vitality, driven by urban development strategies such as “high-quality development”, “urban renewal”, and “refined design” as well as the densification trends observed in some Chinese cities, is increasingly focused on the perspective of streets in urban studies. Recent studies have emphasized the role of streets as public spaces, aligning more closely with human-centered values. In the context of new data environments and humanistic principles, if streets are to function as the supportive skeletons connecting cities and urban blocks to invigorate urban life, it is imperative to analyze the factors influencing their vitality and explore methods to enhance it.
Scholars’ research on street vitality has focused on two main aspects: on the one hand, the built environment of streets is regarded as vital, and attention is given to characteristics such as the physical spatial environment and functional diversity of streets. On the other hand, street vitality is explored through the richness and diversity of human activities, and the interactions, behavioral patterns, and feelings between people and the spatial environment of streets are analyzed in greater depth to understand the manifestations of street vitality in a comprehensive manner. Together, these two research perspectives contribute to the understanding and practical application of the complexity of street vitality.
Regarding research on the physical spatial attributes of streets, academics have explored the physical factors affecting the vitality of districts from two major perspectives: urban form, and the built environment. For example, Yoshinobu proposed the creation of street space from the streets, squares, and external spatial environments of buildings and conducted research on street width ratios [30], while Jacobs selected representative streets around the globe and analyzed the influence of their built features and design characteristics on the spatial form of streets [31]. Stephen Marshall focused on the spatial form and planning layout of streets and explored their impact on urban structure from the perspective of the traffic service function of districts [32]. Yue and Zhu investigated the relationship between street centrality evaluated in terms of centrality and urban vitality [33]. In addition, other scholars have observed and interpreted streets from the perspectives of street greening [34], district functional density and mixing [35], street visual quality [36], street spatial quality [37], street lighting [38], mixed land use [39], accessibility [40], and cityscape to stimulate district vitality [24]. Such studies tend to view street vitality as a spatial quality based on human perception from a visual and experiential perspective [41,42].
From the perspective of sociologists, who are primarily concerned with human activities, street vitality can be viewed as a series of socioeconomic activities related to people [43]. The starting point for the study of streets from a humanistic perspective is the idea that streets cannot simply be equated with roads but that, in addition to being accessible, they also have a social and place-based nature that meets the needs of residents for rest, conversation, and activity. Jacobs, in The Life and Death of Great American Cities (1961), introduced four key conditions for vibrant cities and diversity: mixed primary use, small blocks, aged buildings, and a dense concentration of people [44]. Jacobs emphasized the significance of pedestrian flow in maintaining vitality, an idea that has had a profound global impact [24]. Her theory has been empirically tested in places such as Seoul [20,45], Barcelona [46], Cyprus [47], and London [25], demonstrating that these four conditions are positively correlated with vitality. Scholars also have explored vitality from several perspectives. For instance, Kevin Lynch considered “vitality” to be the primary indicator for evaluating the quality of urban spatial form [48], while Ian Bentley viewed “human vitality” as a factor that influences the extent to which a given spatial extent can accommodate the diversity of different functions [49]. Montgomery suggested that a vibrant space should have a detailed texture, a variety of functions, a human scale, and a high degree of accessibility to the district [50]. Jan Gehl argues that human outdoor activities can create vibrant urban spaces—for example, slow-moving traffic and longer stays outdoors, implying vitality [42]. Tang analyzed the impact on urban vitality based on the built environment of urban centers at both the street and block scales [50]. Many scholars have explored vitality from human behavioral perspectives, such as commuting data [45], bike-sharing usage data [51], social media check-in data [8,33,40], and cell phone signaling [52].
In recent studies, scholars have tended to synthesize these two major aspects, considering street vitality as a human activity under the influence of the built environment. Some studies show that human activities are closely linked to the physical structure of the urban form. Therefore, street vitality can be understood as the phenomenon of people engaging in diverse activities and the physical environment that fulfills these activities [53,54].
2.2. Measurement and Evaluation of Street Vitality
Early explorations by scholars and the impetus of big data technologies have sparked quantitative research on vitality. There is a strong connection between streets and people. Therefore, quantitative research on streets in the new data environment mainly centers on these two subjects and is divided into two main categories: the first is to quantify the spatial form of streets based on the built environment of the streets; the second is to assess and quantify the effects of street use from the perspective of street users. Table 1 lists some of the most widely used vibrancy measurement tools and research avenues that have recently gained prominence.

Table 1.
Recent studies have incorporated diverse proxies for vibrancy.
In the conventional approach to measuring street vitality, qualitative analyses and subjective experiences of scholars, as well as data gathered through field observations and questionnaires, are commonly used. The traditional process of data acquisition is time-consuming and laborious, and the limited scope of observations restricts the depth and breadth of the research but still promotes quantitative research on vitality. For instance, Sung conducted an extensive examination of 9571 streets in Seoul, revealing the relationships between various natural environments and walking activities [20]. Additionally, Chi-Man Hui’s team utilized data from interviews and fieldwork as the foundation for their study, which further validated the critical roles of microarchitecture, cultural displays, and public participation in enhancing community vitality [55].
In recent years, with the rapid development of information and communications technology (ICT) and location-based services (LBSs), quantitative research methods have been favored by researchers, and the quantification of vitality has become possible [39]. Geographic big data with spatiotemporal tagging features provide new data support for studying urban issues, which not only substantially saves time but also significantly increases the sample size and provides more possibilities for indicator selection. For instance, researchers have constructed vitality measures based on a variety of data sources, such as pedestrian flow [11], spatial interactions of cyclists in a city [51], intensity of activity on social media [25], cell phone signaling [62], and urban take-out businesses [56]. Other scholars have established multiple indicators to comprehensively assess vitality from a diversified data perspective. For example, Yang et al. explored the generation and maintenance of urban vitality from the dual perspective of economic and human activities [57]. Kim utilized data such as pedestrian cell phone activity, bank card transactions, and Wi-Fi access points to quantify vitality [58]. In addition to quantifying vitality from the perspective of human activities, other scholars have assessed it indirectly from the perspective of the built environment. For example, Ye et al. explored urban vitality unilaterally through the distribution of small restaurant businesses [63], and Lan et al. explored urban vitality through nighttime lighting data [59]. Chen et al. explored the efficacy of wearable cameras coupled with the “5D Model” for real-time assessment of community vitality [27]. Liu and Li [60], Zeng et al. [4], Meng and Xing [24], and Guo and Chen et al. [61] have constructed comprehensive indicators from multiple dimensions to conduct comprehensive and in-depth studies of the spatial pattern of urban human vitality.
2.3. Current Trends, Gaps, and Our Study
After reviewing the above studies, the main development trends of street vitality can be summarized as follows: (1) The theoretical and practical research results on street vitality are increasingly abundant, and the research perspective has gradually shifted from the macro to the micro. When scholars measure vitality, they mainly focus on the performance indicators of street vitality based on people and the composition indicators of street vitality based on spatial elements. (2) The application of new technologies has promoted changes in research methods, transforming from qualitative analysis to quantitative research and from traditional research to big data methods, and the research content reflects unprecedented precision. (3) The concept of people-oriented planning has been increasing, as has the practice of street beautification and street improvement to build a better living environment, but how to build a vibrant street has become an urgent problem for academia and industry.
Despite the strong interest of the academic community in the use of new technologies to test the methods of urban planning and design, the current research still suffers from the following shortcomings: (1) Most of the current research focuses on revealing existing problems but lacks predictions of future street development trends and in-depth exploration of the specific patterns and causal mechanisms of the revitalization of street vitality. (2) Currently, significant progress has been made in the data collection and methodology of street space research, but these research results have not been effectively integrated into the control planning and design process of street spaces. This disconnect indicates that there is a certain gap between research and practice, which affects the efficiency and effectiveness of research results in practical applications. Therefore, establishing an effective interface and integrating research results with street space planning and design practices has become a key challenge for improving the quality of urban space planning. (3) The existing research mainly focuses on city streets, while there is a relative lack of research on the streets of historic and cultural neighborhoods that have a profound historic culture and humanistic spirit. As an important carrier of urban cultural heritage, the maintenance and enhancement of the vitality of these blocks is highly important for the sustainable development of urban public spaces, the inheritance of regional culture, and the continuation of urban memory. Future research should pay more attention to these historic neighborhoods and explore how to strengthen the vitality of these areas through effective planning and management strategies to promote the overall harmonious progress of the city. (4) Despite significant advancements in research data and methodologies, many scholars have developed quantitative evaluation frameworks for street vitality focused primarily on a limited set of spatial elements. However, there are inconsistencies in the indicator systems used across these studies, and a widely accepted quantitative indicator system for street spaces that encompasses multiple attributes has not yet been established [64,65]. Some researchers have investigated the factors influencing street vitality, such as the degree of development, functional mix, diversity, and transportation accessibility, which are regarded as key contributors to enhancing street vitality [66,67,68,69]. Due to challenges in data collection and analytical methods, large-scale studies on the built environment of streets often remain at a two-dimensional level, rarely incorporating fine-grained three-dimensional environmental elements into the interaction framework between the built environment and street vitality. Recent advances in computer vision technology have enabled the large-scale extraction of three-dimensional built environment indicators. Several studies have leveraged this technology to automate the processing of streetscape data from mapping platforms, extracting various 3D built environment features. These features have been utilized in research areas such as street environment quality assessment, environmental comfort measurement, and urban health environment evaluation [70,71,72].
To address the aforementioned gaps, this study utilizes mobile location service data to measure the intensity of street vitality in historical and cultural neighborhoods of Xi’an over a one-week period. It compares the vitality intensity and spatiotemporal characteristics of these neighborhoods on an hourly basis throughout the week. Street view data are employed to quantify three-dimensional indicators such as safety and comfort, integrating both two-dimensional and three-dimensional built environment indicators into a temporal model. This paper elucidates the spatial and temporal distribution of built environment elements’ impact on street vitality from multiple perspectives, providing academic support for optimizing the built environment and enhancing street vitality. Furthermore, this study emphasizes the role of temporal changes in street vitality, uncovering the spatial distribution patterns and dynamics of crowd activities at different times, a topic less explored in previous research. To offer a comprehensive understanding of the vitality characteristics of various historic districts, this study conducts a comparative analysis across several historic and cultural districts within the same city. This approach aims to identify the dominant factors and differences in vitality characteristics among different districts, contributing new insights to the study of street vitality in historic areas.
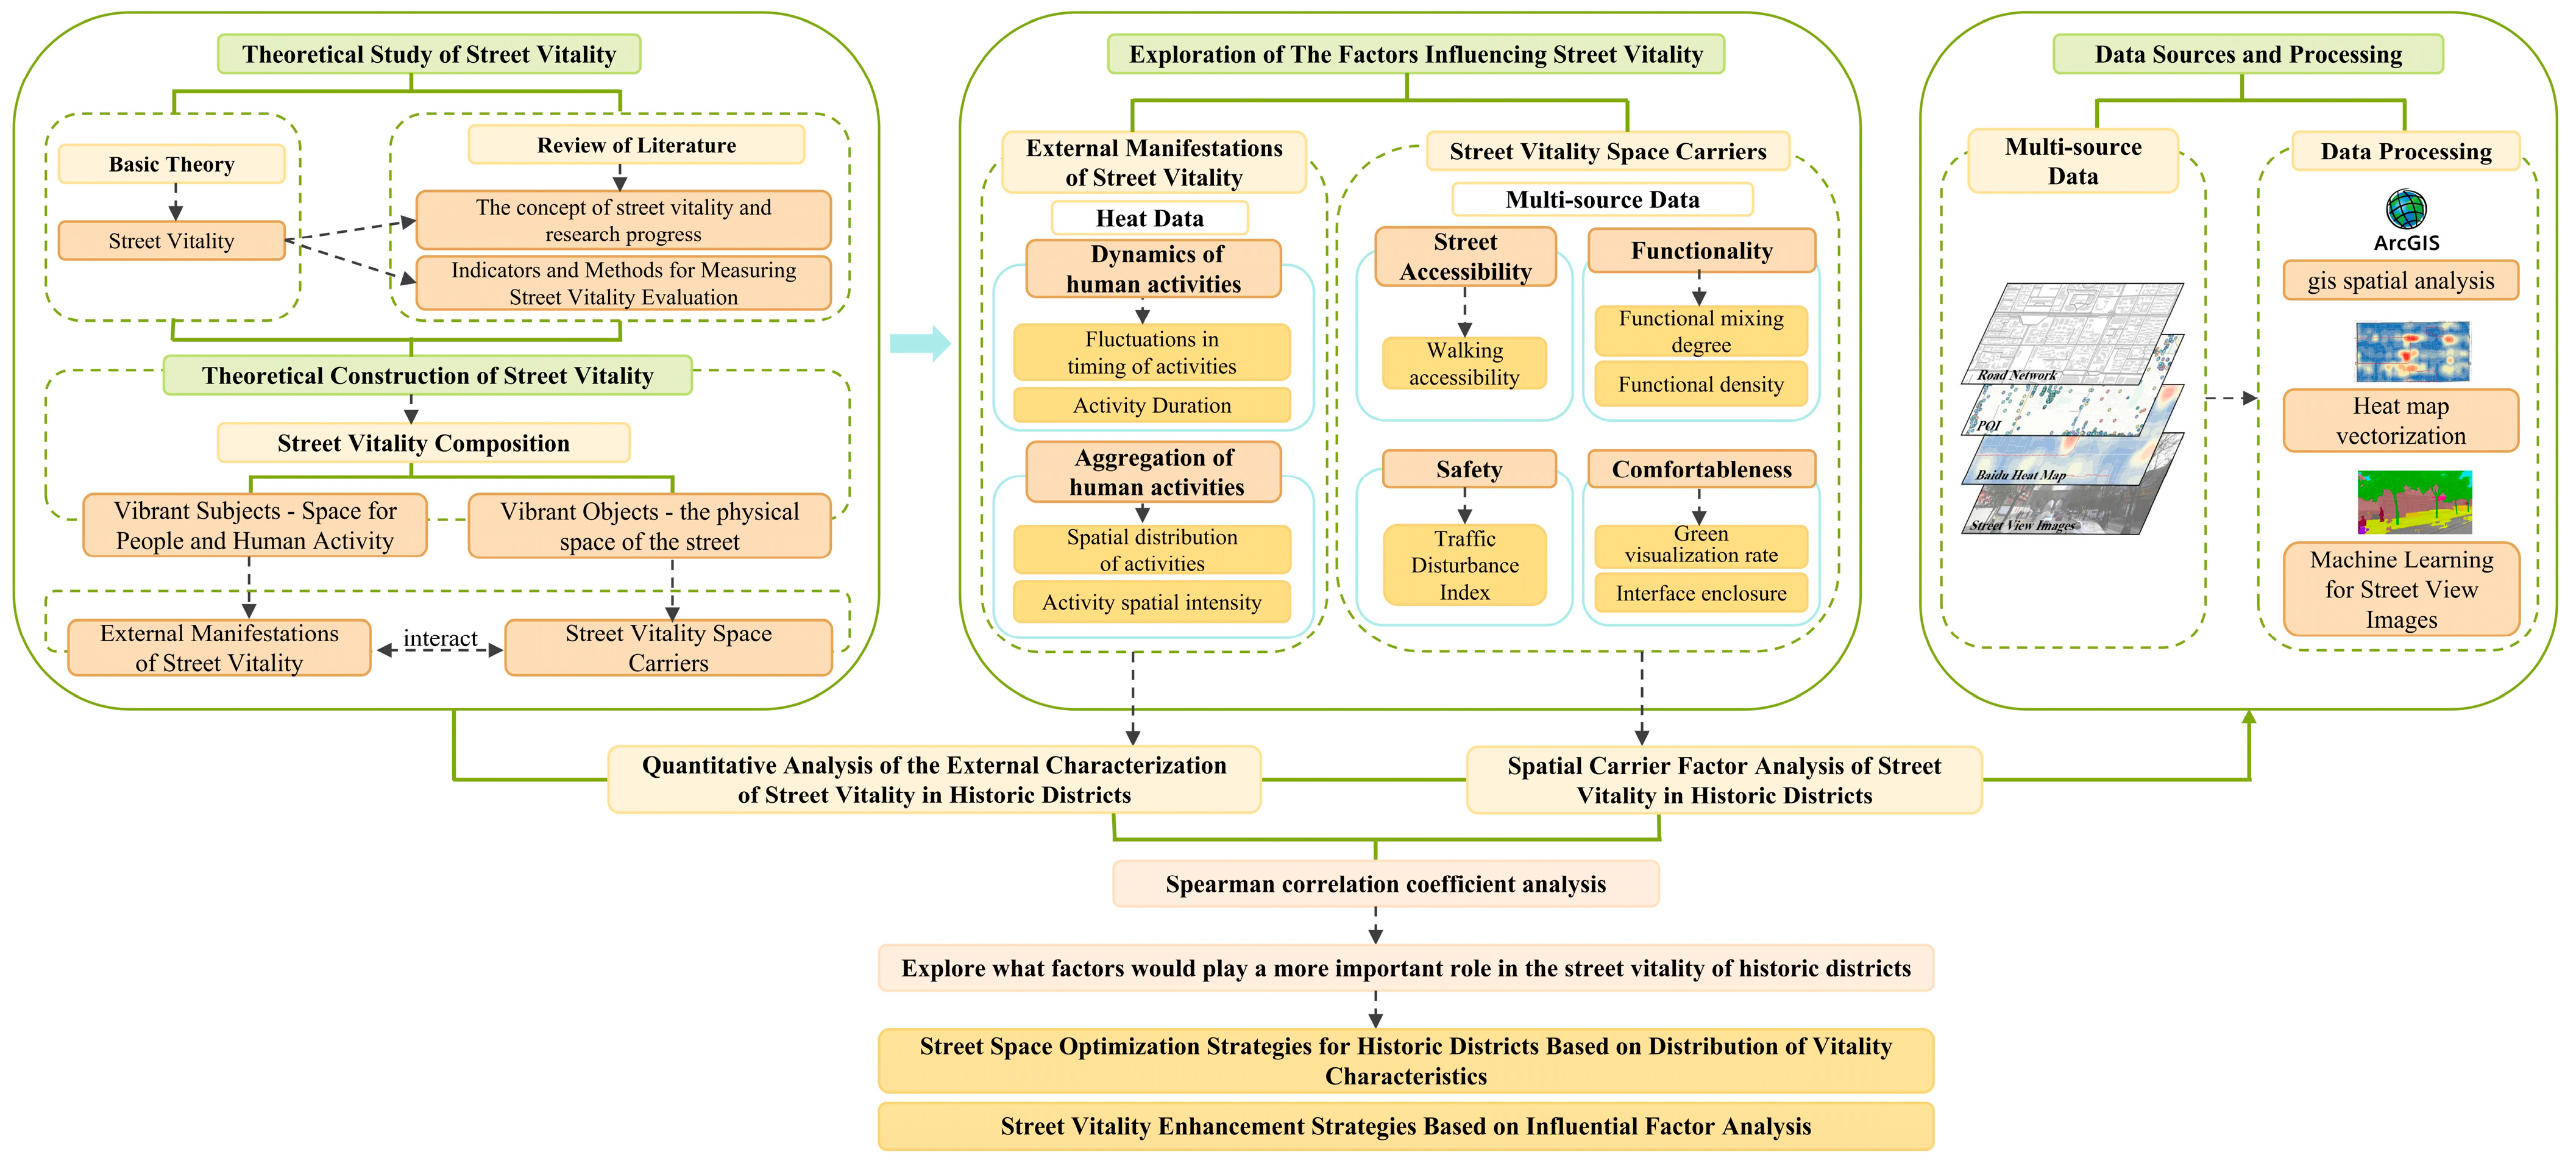
Based on the above limitations, this study takes the streets of Xi’an’s historic and cultural districts as the unit of analysis, and the research framework is shown in Figure 1.
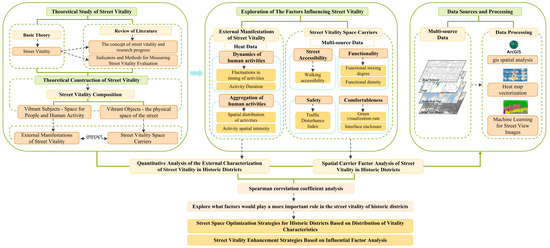
Figure 1.
Research framework.
This study examines the influencing factors of street vitality from the dimensions of external representations of vitality and spatial carriers. First, the quantitative analysis of the external representations of street vitality, including both temporal and spatial dimensions, explores the dynamics and the aggregation of crowd activities. The quantitative analysis of the external representations of street vitality, including both temporal and spatial dimensions, explores the dynamics of crowd activities and the aggregation of human activities. The quantitative analysis of the spatial carriers of street vitality focuses on four parts: transportation accessibility, functional diversity, street safety, and spatial comfort. Second, a correlation analysis between street vitality indicators and spatial element indicators is performed to explore the influencing factors of street vitality. Finally, spatial design strategies are proposed according to the influencing factors of street vitality, which can be used to guide urban planning practices, realize street vitality remodeling, and improve the quality of life of residents. Moreover, to reveal the vitality characteristics of different cultural types of historic blocks more comprehensively, this study selects several historic and cultural blocks within the same city for a horizontal comparative analysis to explore the dominant factors and characteristic differences in the vitality of different blocks, in order to make a new attempt to study street vitality in historic districts.
3. Study Area and Data Collection
3.1. Study Area
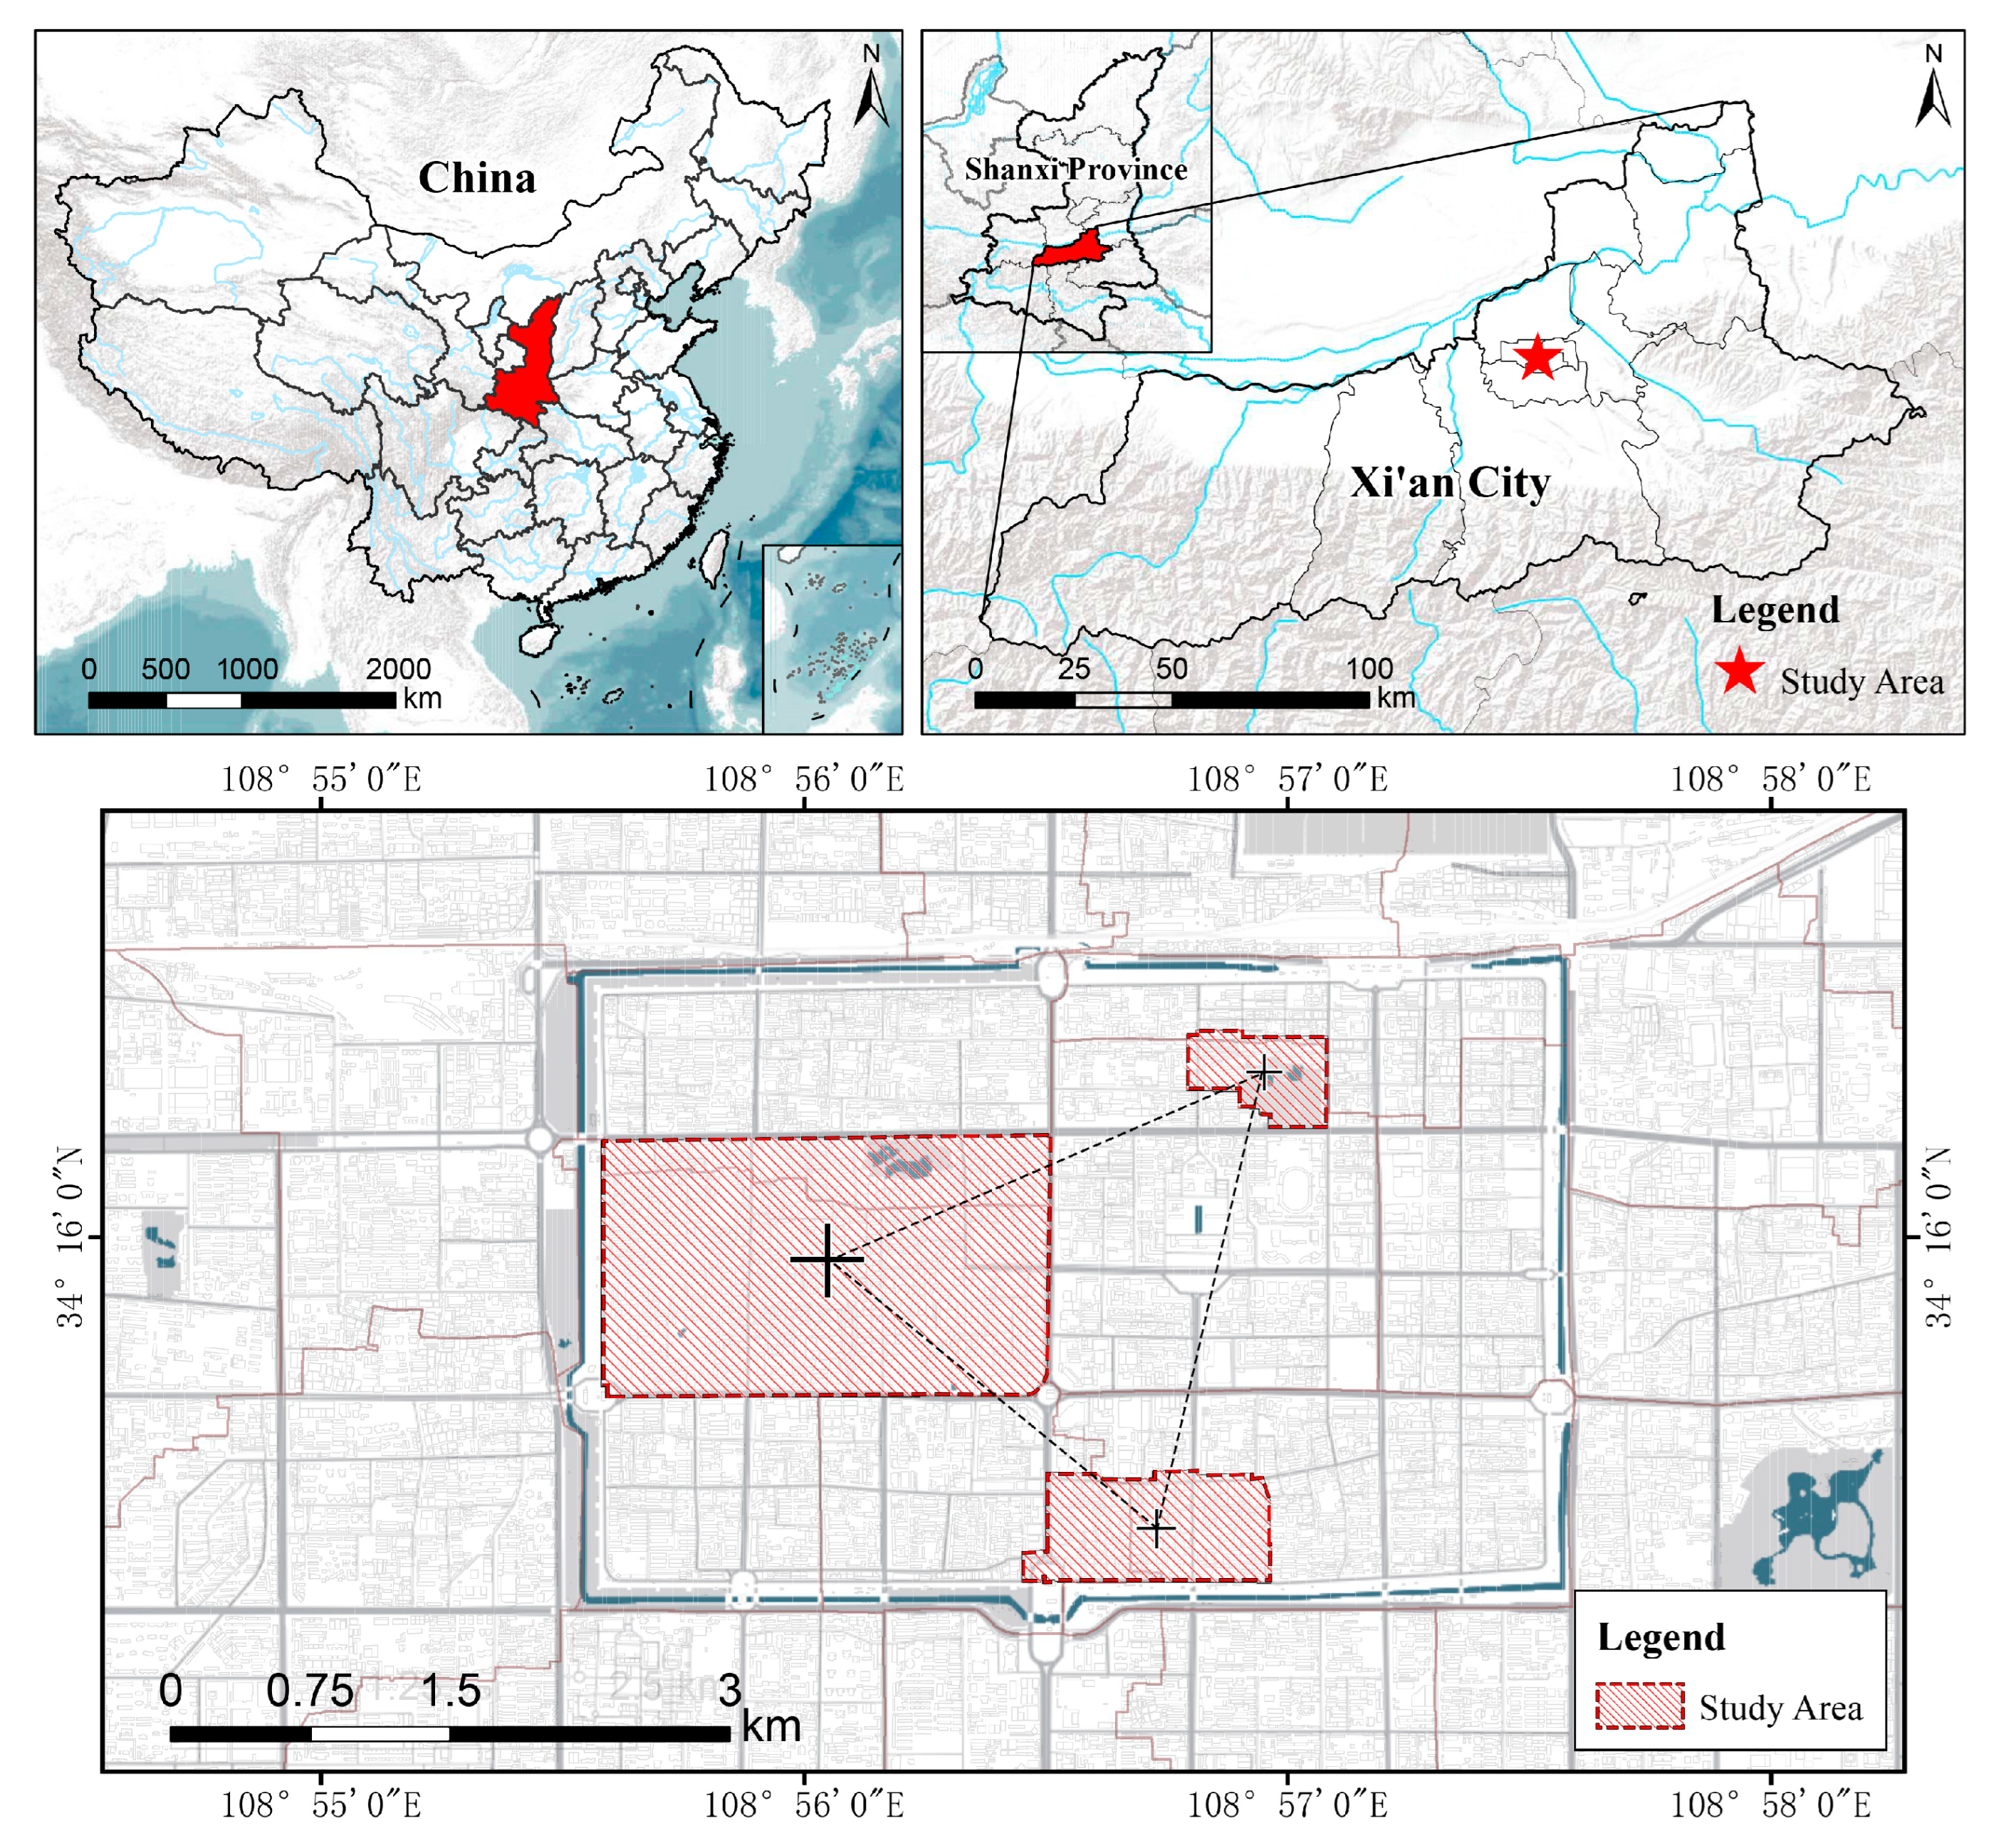
The study area was situated in the three historic and cultural districts of Beiyuanmen, Sanxuejie, and Qixianzhuang, which are located within the Ming City Wall of Xi’an, as shown in Figure 2. The streets in these districts served as the primary units of analysis. The area encompassed by the Ming City Wall, which was constructed during the early Ming Dynasty, is the core region for protecting Xi’an’s renowned historic and cultural city. Since the Ming and Qing Dynasties, the traditional urban spatial layout within the Ming City Wall has remained largely intact. Most of Xi’an’s representative historic districts and traditional buildings are located within the boundaries of the Ming City Wall, making them not only a symbol of the ancient Chinese civilization’s history but also important carriers of traditional national culture. In terms of spatial structure, this area follows the well-proportioned and symmetrical road network of Tang Chang’an city, with the bell tower serving as the central point and the four main roads in the east, west, south, and north forming the backbone. Streets, alleys, courtyards, and squares collaborate to shape the distinctive spatial patterns of ancient cities.
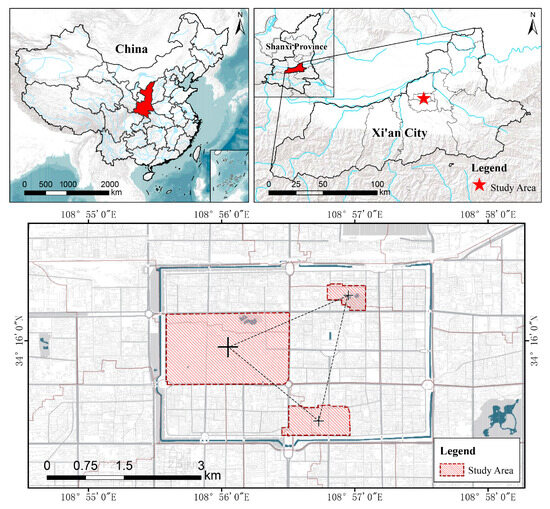
Figure 2.
Study area.
The Beiyuanmen Historic and Cultural District was formed during the Ming Dynasty and is located in the core of the ancient city of Xi’an, adjacent to the bell tower in the city center, and is the main area of the Muslim population in Xi’an. Its core protection area has a planned land area of 73.4 hm2, and the construction control zone has a planned land area of 224 hm2. The Sanxuejie Historic District is located in the area from the south gate of the Ming City Wall to the Wenchang Gate and is famous for its culture, with a planned land area of 33.8 hm2 for the core protection area and 50.2 hm2 for the construction control zone. The Qixianzhuang Historic and Cultural District is located in the northeastern corner of the Ming City Wall, which is a model of the residential area in the Republic of China, with approximately 1.6 hm2 of planned land for the core protection zone and 19.9 hm2 for the construction control zone. At present, these three districts are mainly for residential functions, supplemented by tourism and commerce, which not only continue the lifestyle and business style of the traditional residents of Xi’an but also carry out multiple functions, such as administration, culture, tourism, residence, and commerce. They represent historic areas with multiple functions, as well as meeting points for citizens’ lives, urban memory, and historic and cultural lineage.
The present study revealed that the historic districts within the Ming City Wall of Xi’an possess diverse functions but do not provide sufficient benefits. The disparity between spatial quality and functional structure, as well as the gradual disparity between the land economy and supporting facilities, has led to a decline in function within the Ming City Wall area. It no longer serves as an urban center but has been transformed into a residential area. As a result, these districts face the threat of stagnation in vitality. During the urban renewal process, the Ming City Wall area has undergone historic city preservation, industrial restructuring, and community emotional maintenance, and it has become an important destination for tourists to experience Xi’an’s humanity and regional culture. Therefore, this study chose the streets of the historic and cultural districts within the Xi’an Ming City Wall area as a case study to investigate their street vitality and the influencing factors, as they are both typical and representative of larger samples.
3.2. Data Collection
Baidu heatmaps are based on signaling data from cell phone base station positioning and are analyzed and processed by software to present to users the population concentration in a certain area with different shades of colors [73], which reflects, to a large extent, the urban space being used and can intuitively reflect the spatial vitality of districts. In this study, the heat values reflected by Baidu’s heatmaps served as external indicators of street vitality. We analyzed heat data from 8 April to 14 April 2024, vectorizing them as the foundational dataset for vitality analysis. Using Python, we scraped hourly data from the Baidu Maps open platform, amassing 168 h of data in xlsx format, including population density points and their geographic coordinates. These data were vectorized using the ArcGIS platform, beginning with the Add XY Data tool to spatialize the points, followed by kernel density analysis to generate population heatmaps.
The road network data used in this study were obtained from the open-source project Open Street Map (OSM). To ensure accuracy, road network maps of Xi’an city were obtained for verification. The study area comprises 472 streets, including 277 streets in the Beiyuanmen District, 109 streets in the Qixianzhuang District, and 86 streets in the Sanxuejie District.
Streetscape images have been increasingly utilized as valuable data sources for investigating districts and linear spaces in recent years. These images can provide insights into the environmental quality of historic districts from a human perspective. In this study, a distance of 100 m was established between street scene photographs of pedestrians along roads in the research area using the Baidu Maps open platform and a web crawling tool. Subsequently, a programming tool was used to identify the material environment within the captured street scene photos, calculate the percentage of pixels for each type of material, and generate quantitative measurements.
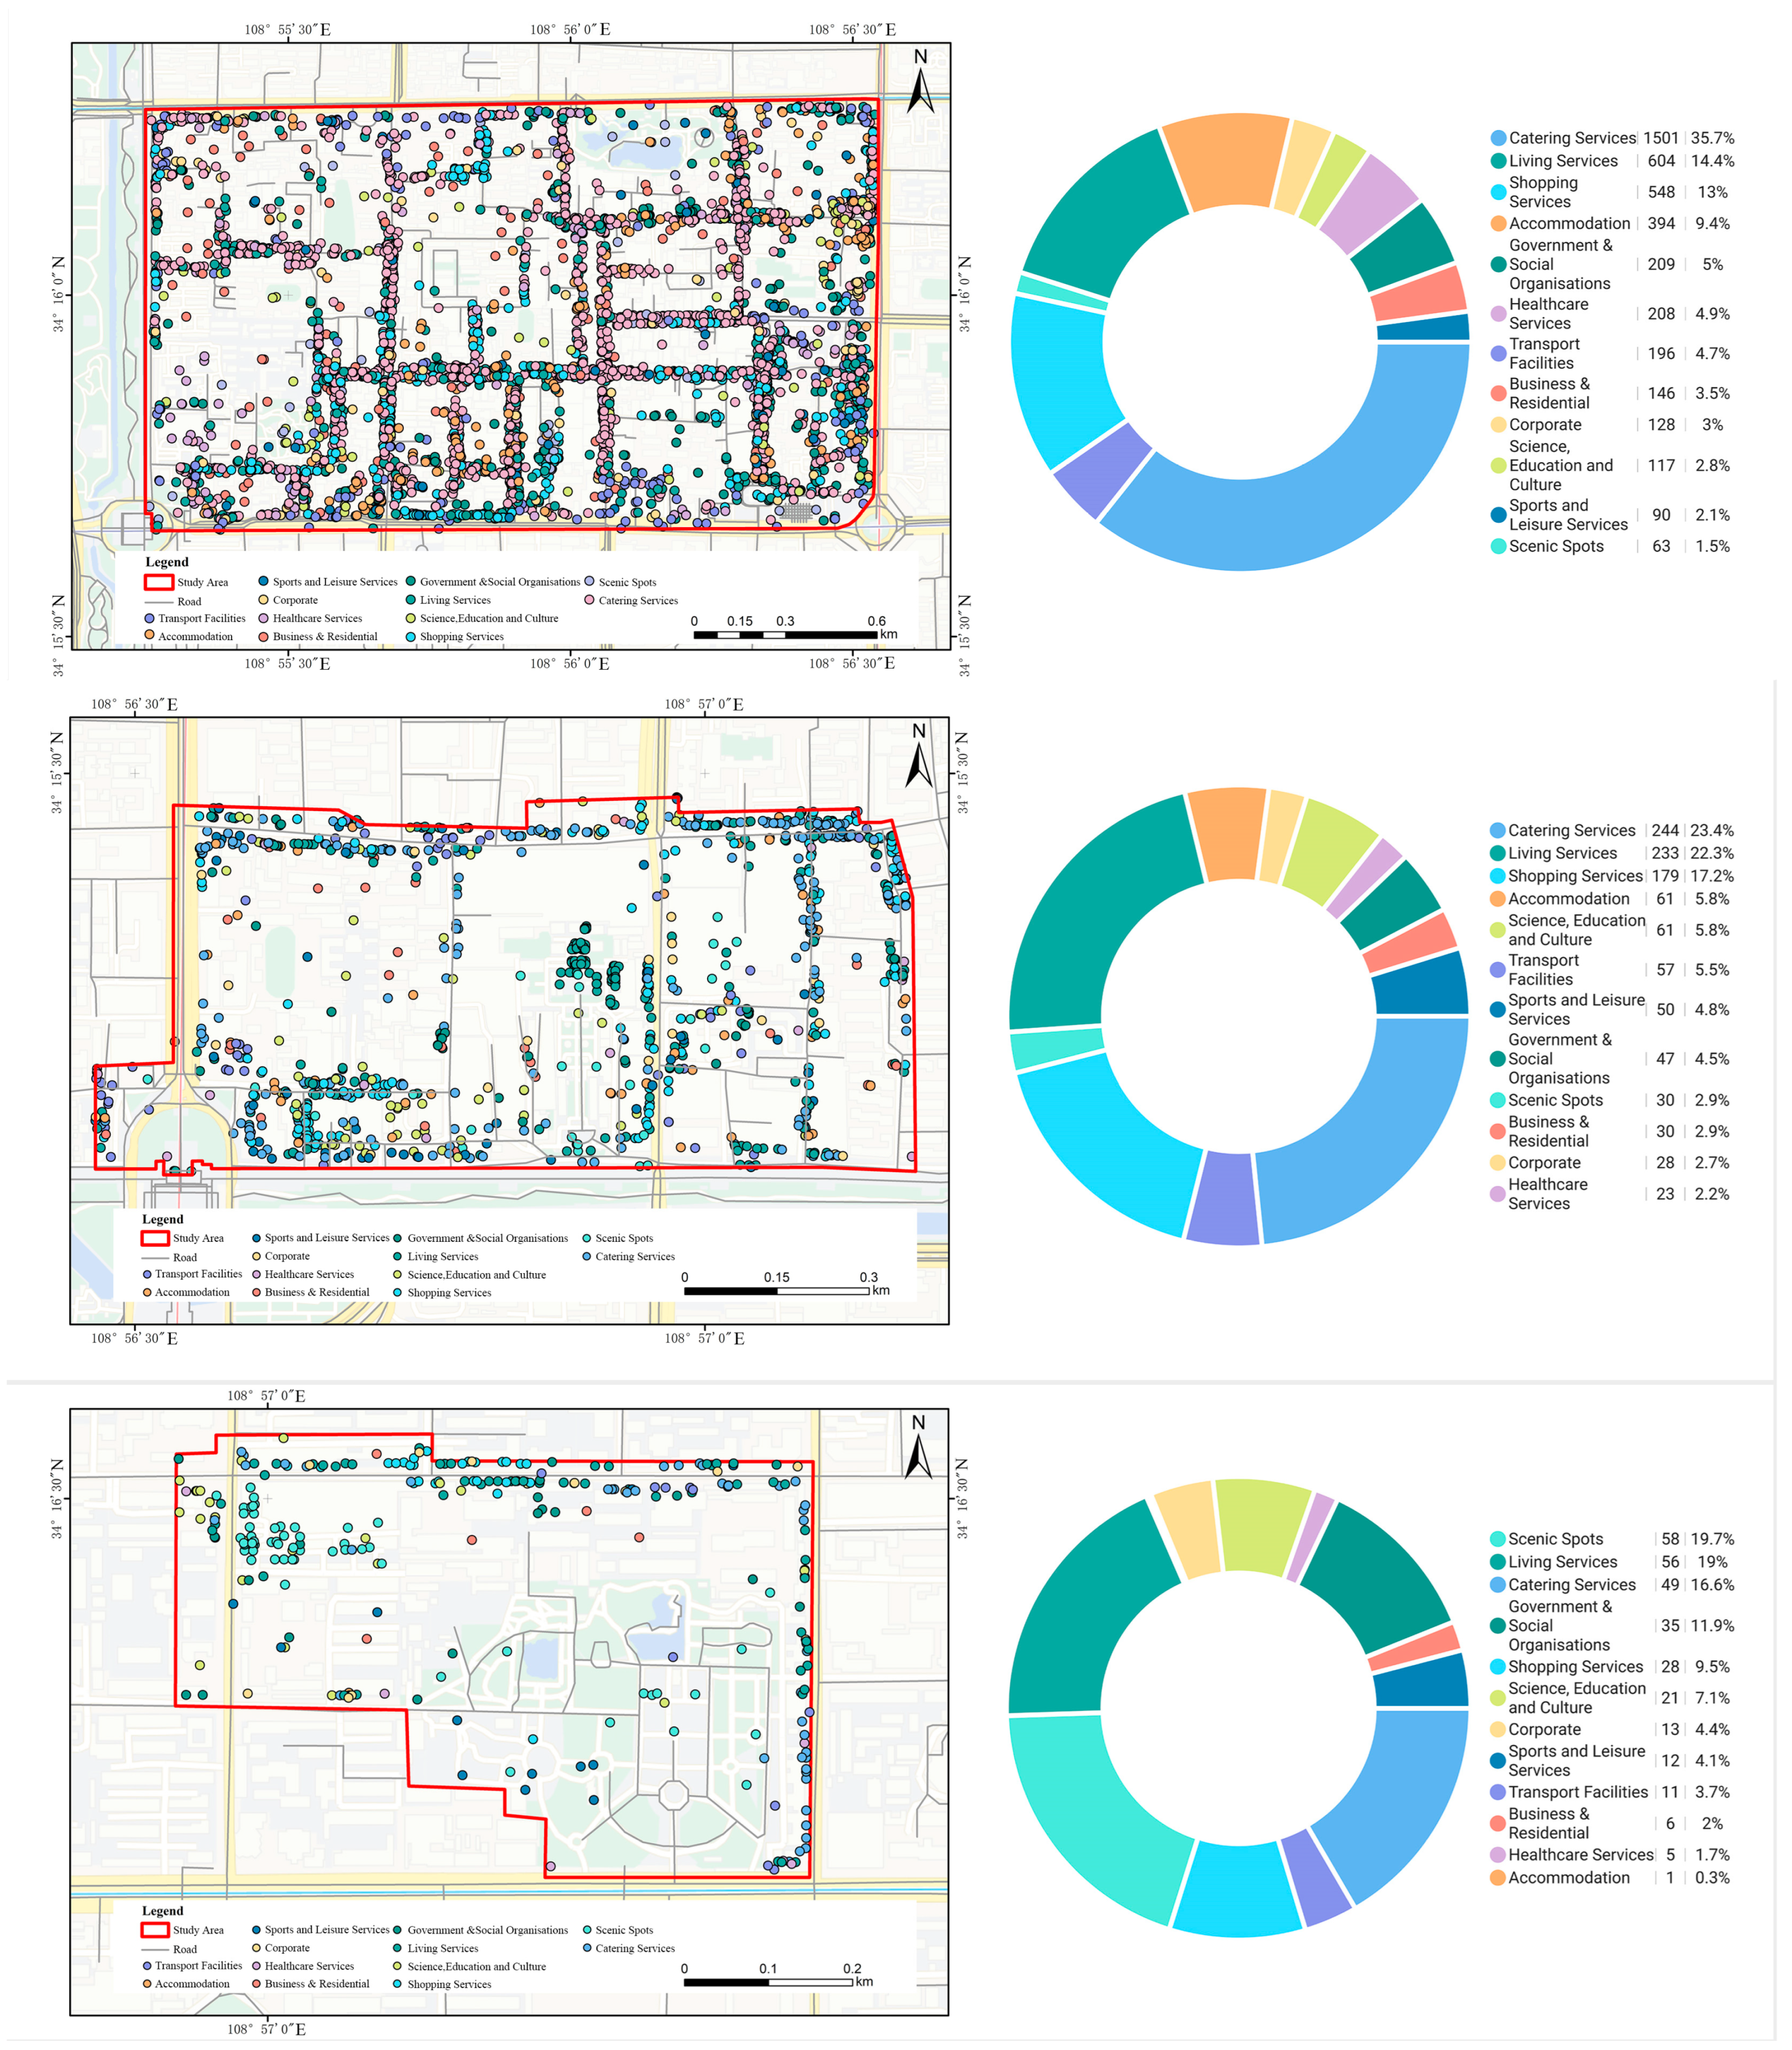
POI data: Points of interest (POIs) encapsulate spatial information and have proven pivotal in urban spatial function analysis, reflecting human activity within urban spaces [74]. For this research, we acquired POI data from three historic cultural districts in Xi’an for 2024 using the Amap API, visualizing them with the ArcGIS Add XY Data tool. After refining Gaode Maps’ original POI categories to exclude those irrelevant to street vitality, we retained 12 categories comprising 5541 records. These included food and beverage services (32.3%), transportation facilities (4.8%), shopping services (13.6%), scenic spots (2.7%), lifestyle services (16.1%), accommodation services (8.2%), companies (3%), educational and cultural services (3.6%), healthcare services (4.3%), government and social organizations (5.3%), commercial and residential areas (3.3%), and sports and leisure services (2.7%). Figure 3 illustrates the distribution and proportions of these POI categories across the districts.
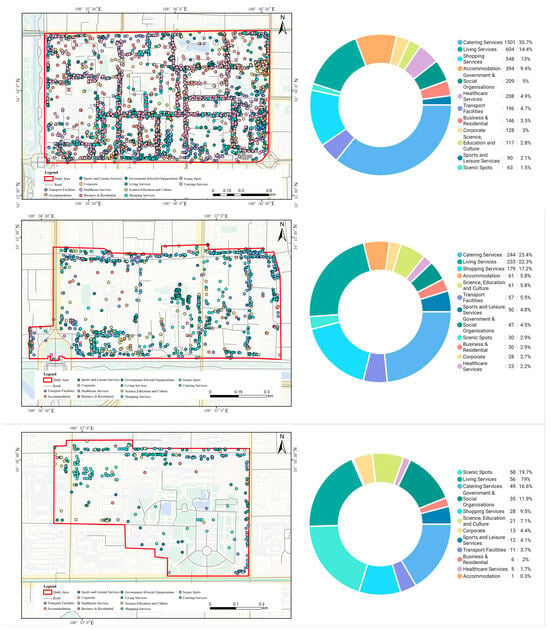
Figure 3.
POIs’ spatial distribution.
4. Methodology of Data Processing
4.1. Methodological Construction of Research on Factors Influencing Street Vitality
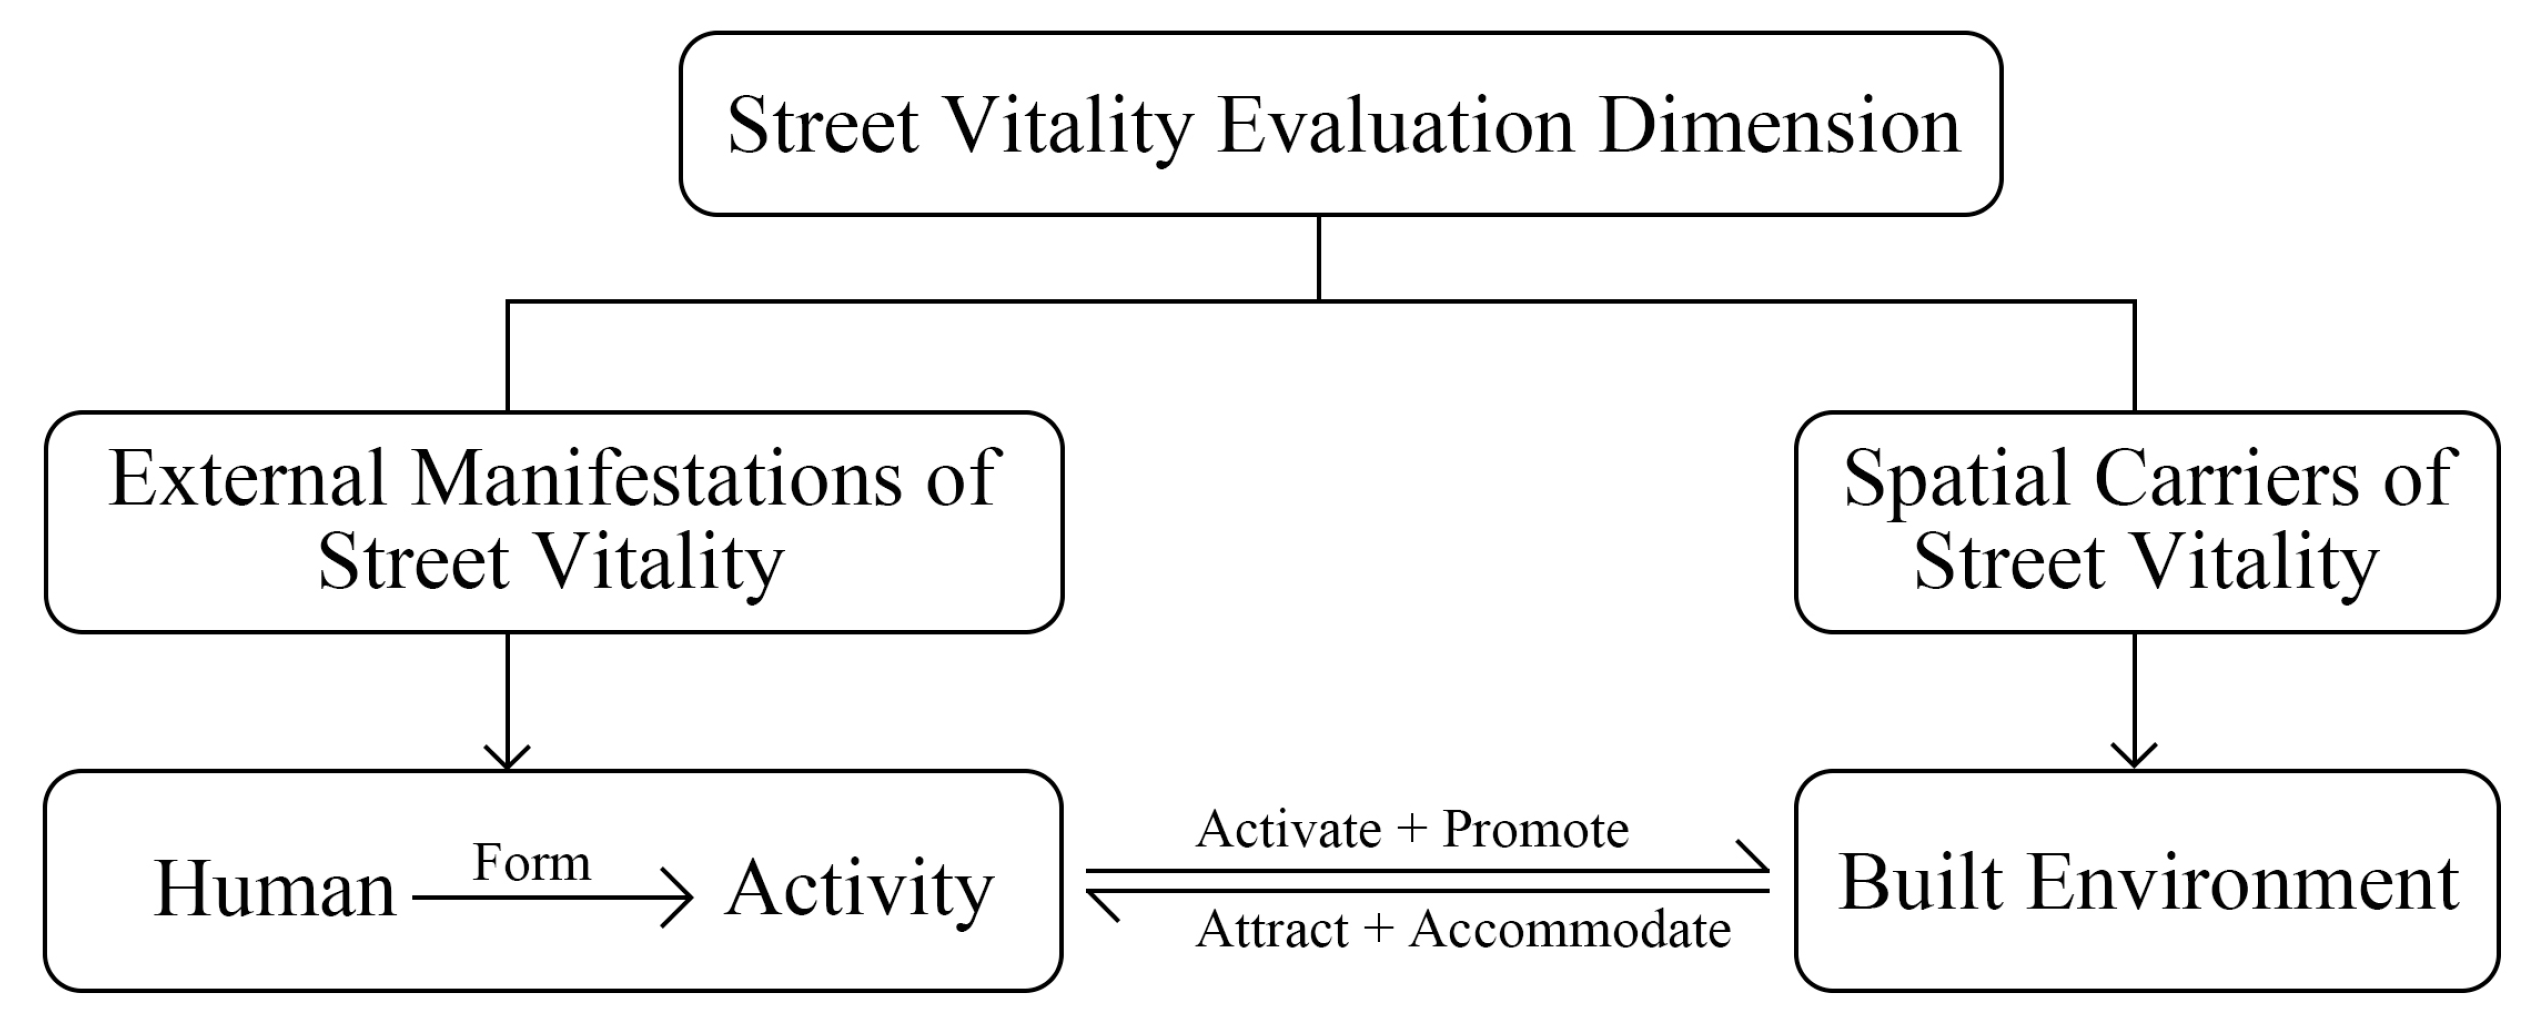
This study is rooted in the development of the evaluation dimensions and criteria for street vitality. Given that vitality is a complex and abstract concept, it must be translated into specific features that can be effectively observed and analyzed. The indicator system employed in this study was based on the existing street vitality indicator system and was screened accordingly. Through a subject–object analysis of the composition and elements of street vitality, the built environment of the street is regarded as the spatial carrier of vitality, while the dynamic activity behavior of humans serves as an external characterization of street vitality. These two factors are interdependent and mutually causal, as shown in Figure 4.
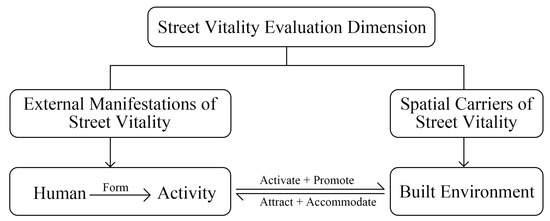
Figure 4.
Street vitality evaluation dimensions.
As the main subject of street space, people’s behavioral activities stimulate the generation of street vitality, crowd density, and spatial and temporal activity characteristics, and the continuity of activity time can be quantified as an element reflecting vitality. The built environment of the street, as a space that carries people’s activities, has its own attributes, such as accessibility, diversity, safety, and comfort, all of which are accommodating and attractive to the vitality of the street. Therefore, it is of great significance to explore the intrinsic connection between human behavior and activity patterns and the physical space of the street for the continuity of street vitality and the direction of future construction.
4.2. Selection and Quantification Methods of Vitality Values and Influencing Factors
4.2.1. External Characterization of Street Vitality
In this study, vitality value data were used as basic data to evaluate the external manifestations of street vitality in the three historic districts. Considering the dynamic nature of human activities, as well as a greater comparison of activities on weekdays and days off, and the variability in the vitality values of the three districts, a 24 h thermal value analysis of the districts was carried out. The seven-day vitality value data obtained from crawling at 1 h intervals were processed for relative and average values. The relative vitality value is the ratio of the actual thermal value of the district at moment i of day n to the minimum thermal value; the minimum thermal value is the smallest among all seven days of thermal data in the three districts. The relative thermal mean value of the district at moment i needs to avoid the influence of the block area on the thermal value. Therefore, in Formula (1), where i = 0, 1, 2, 3…… 23 is the total number of days, weekdays = 5, rest days = 2, and S is the total area of the block.
4.2.2. Spatial Carriers of Street Vitality
The built environment of a street, as a space that supports people’s activities, possesses attributes such as accessibility, diversity, safety, and comfort, all of which accommodate and attract street vitality. Based on relevant research, quantifiable influencing factors were selected to describe the built environment as a spatial carrier of street vitality.
The transportation accessibility of a street reflects the ease of walking and is an important reflection of the strength of the street’s connection to the surrounding space. Jacobs and Gale suggested that good streets should focus on pedestrian friendliness rather than motorized transportation convenience, and that the greater the accessibility of the street is, the greater the frequency of use of the street and the stronger the connection with the surrounding environment, which can promote street vitality [31,75]. Therefore, this study selected pedestrian accessibility as the transportation accessibility index. The calculation formula applies the spatial syntax model, where Di in Formula (2) is the depth of element i, MDi = TDi/(n − 1); TDi is the global depth of element i; and n is the total number of elements in the system.
The functional diversity of streets is based on the diverse needs of users, and the diversity of functions relates to the degree of satisfaction of street users, the carrying capacity of services, and the richness of pedestrian activities. Streets that satisfy the different needs of users and provide a variety of functions are more inclusive. This is also a key element for the sustainability of street vitality. In this study, the functional density and functional mixed degree of the street were chosen as influencing factors to reflect the function of the district. The functional mixed degree indicates the diversification of various types of businesses on the street, which is closely related to vitality. In Formula (3), Pi indicates the proportion of a certain type of POI to the total number of POIs in the street, and n indicates the number of categories of POIs in the street. The functional density reflects the density of the distribution of amenity points related to vitality; poi_num in Formula (4) refers to the total number of POIs within the buffer zone of the street, and road_length indicates the length of the street.
Street safety in old urban areas is greatly affected by motorized traffic, and street traffic flow and traffic accidents affect pedestrians’ perceptions of safety [76,77]. A comfortable walking space and the reasonable planning of roads can greatly enhance walkers’ sense of security. The vehicle interference index and walking feasibility were selected as the evaluation indices. In Equation (5), Nn represents the number of pixels of motor vehicles in the street view picture, and Vn is the total number of pixels of motorized roads in the whole picture.
Comfort meets the psychological and physiological needs of street users and is a key factor in maintaining the vitality of a street and ensuring its continuity. Yoshinobu Ashihara argued that an appropriate street scale, landscape environment, sense of atmosphere, street color, etc., can improve the comfort of users [30]. Most of the comfort of the physical environment of a street comes from the influence of plants, environmental scales, etc. Therefore, green visibility and interface enclosures were selected as indicators for evaluating street comfort. The above indicators were semantically segmented by street view images, and the DeepLap semantic segmentation tool was selected to accurately extract the vegetation, vehicles, people, roads, and other elements on the road to obtain the quantitative values of the enclosure and the green visibility of each street. Research by the Japanese scholar Yoji Aoki shows that the greater the proportion of people with green color in their field of vision is, the more intimate people are with the surrounding environment [78]. In this study, the proportion of vegetation elements in the street view picture was used to determine the proportion of green space in the street. Gn in Equation (6) represents the sum of the number of pixels occupied by the trees and vegetation in street view picture n, and Vn represents the sum of all of the pixels of the surface area in the street view picture. A higher enclosure of the street provides a sense of comfort and seclusion, and related studies have shown that streets with higher enclosures can provide a stronger sense of security. Harvey C selected the ratio of buildings, trees, structures, and other elements accounted for in the streetscape picture to calculate the degree of enclosure. In Equation (7), Wn is the sum of the number of pixels occupied by buildings, walls, and fences in streetscape picture n, and Vn is the sum of all faceted pixels in the streetscape picture.
This study constructed a street spatial vitality evaluation system for the spatial carriers of street vitality by interpreting the four aspects of street accessibility, functionality, safety, and comfort and screening the indicators in the literature, as shown in Table 2.

Table 2.
Spatial carrier indicators of vitality.
4.3. Correlation Analysis of Street Vitality and Influencing Factors
Correlation analysis was conducted using the SPSS platform to study the relationships between the spatial vitality of historic and cultural districts and their influencing factors, with a 15 m buffer of 472 streets as the study unit. Population vitality value data were used to characterize the district vitality value L, which is the total thermal value of the district on weekdays or rest days, and both were weighted at 0.5 because they have the same importance for the district vitality value.
Correlation analysis refers to the analysis of two or more variables with correlation indicators and is used to study the relationships between quantitative data, including whether there is a relationship and the degree of closeness of the relationship. Pearson correlation analysis is typically used when the data satisfy normality, and Spearman correlation analysis can be used when the data do not satisfy normality.
First, the vitality values of the districts were obtained using the Raster Calculator function of ArcGIS. Beiyuanmen District had the highest value of 18.52, followed by Sanxuejie District with a vitality value of 13.09 and Qixianzhuang with the lowest value of 6.29. Then, using ArcGIS’s Zonal Statistics as a table function, with the statistical type of MEAN, we extracted the vitality value of the research unit and the values of the six influencing factors. The obtained data were tested for normality using the Kolmogorov–Smirnov test and the Shapiro–Wilk test.
5. Results
5.1. Characteristics of Spatial Variation and Temporal Changes in the Intensity of Street Vitality
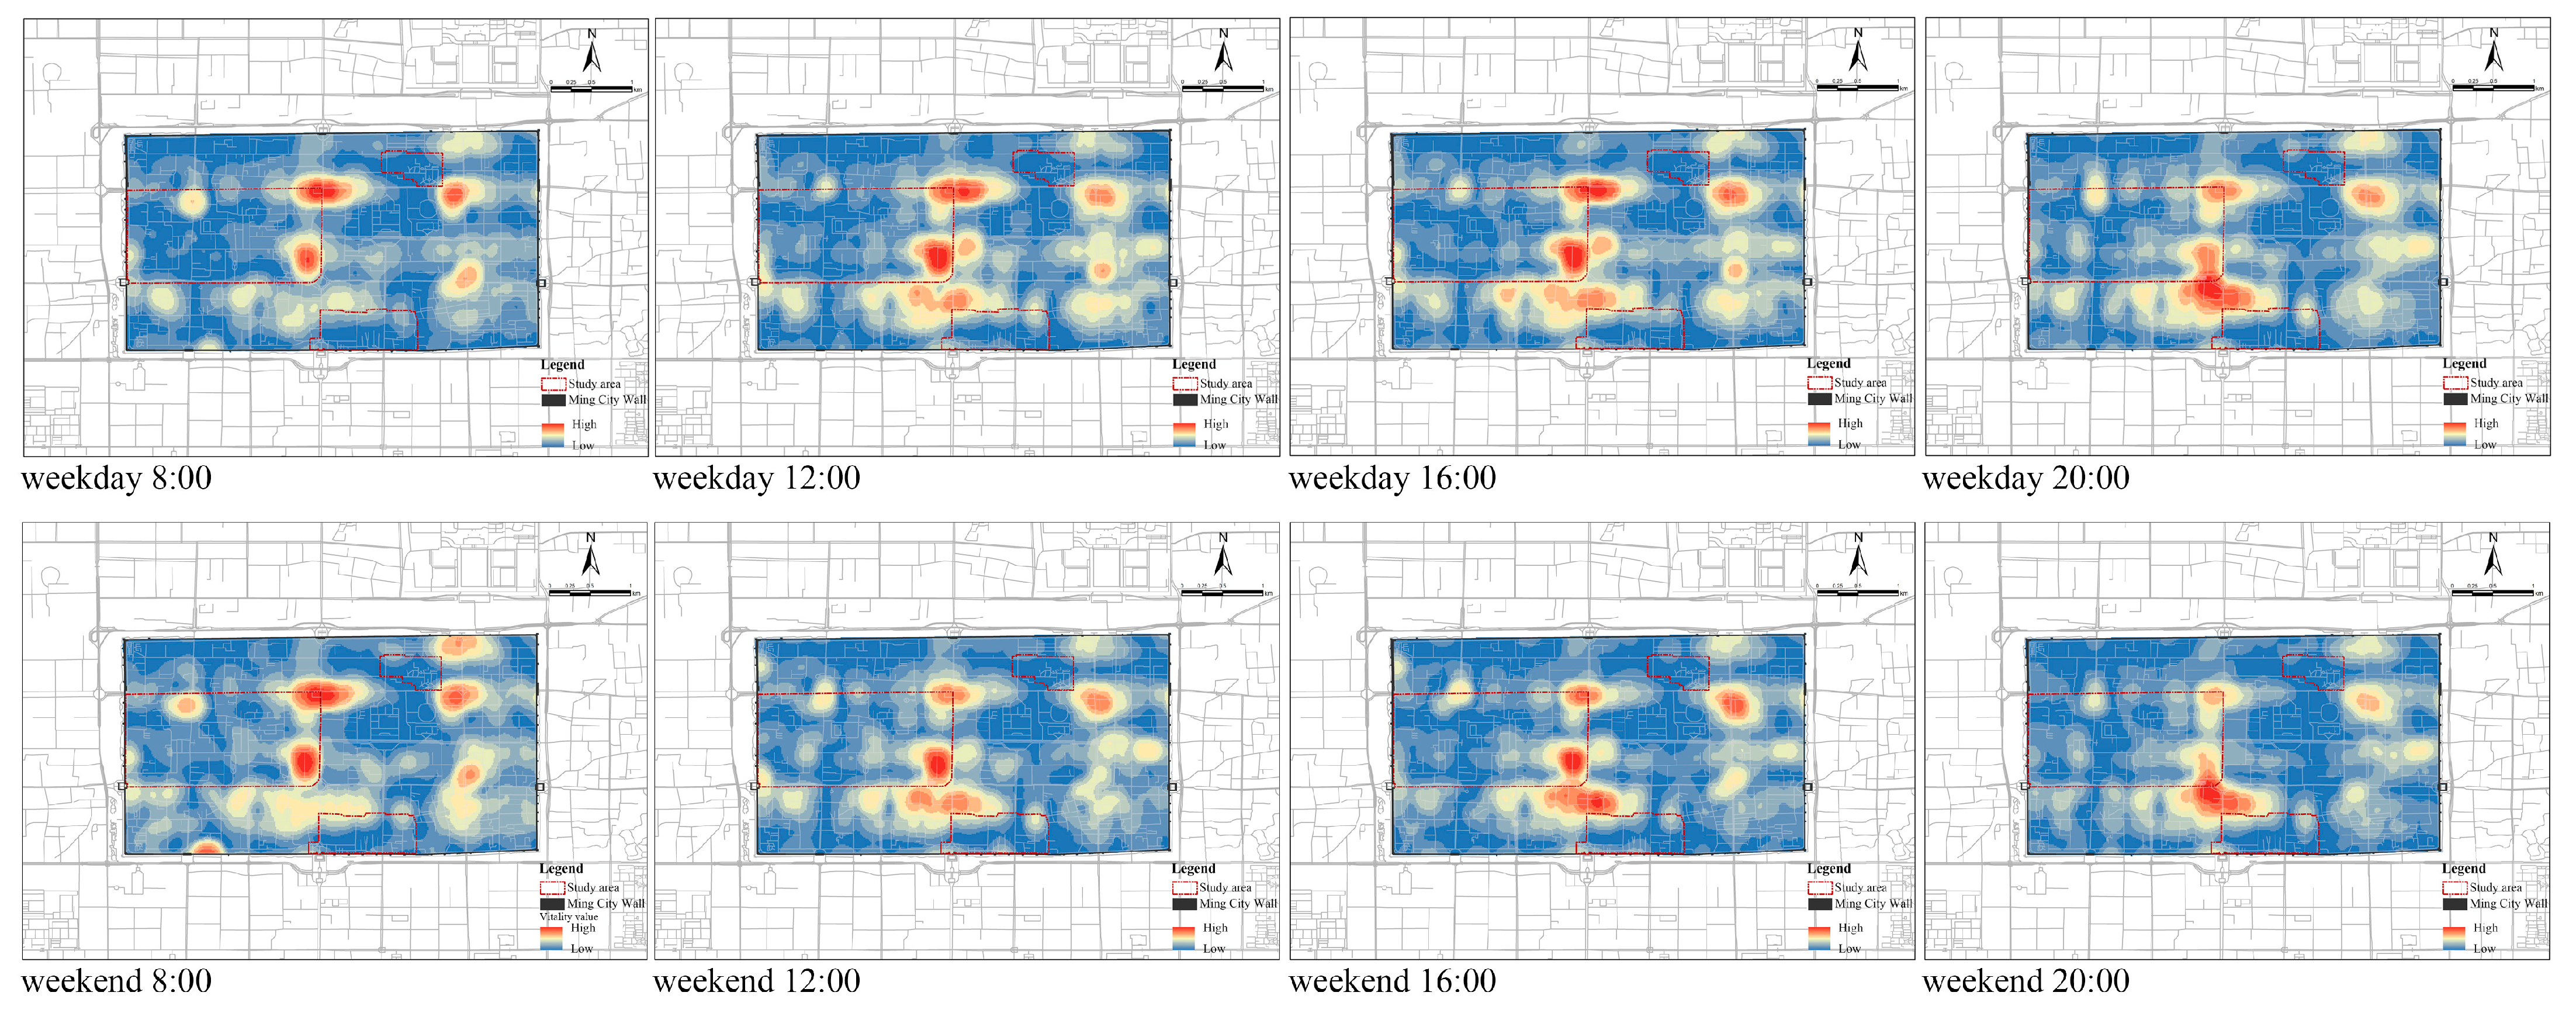
In terms of spatial distribution, the spatial vitality of the Beiyuanmen Historic District was high in the east and low in the west, with large differences in vitality values. The vitality values around Beidajie and the bell tower were higher, and those in areas with subway stations, hospitals, and schools were also higher, whereas the residential-oriented areas had lower vitality values, and there were no obvious fluctuations on weekdays and weekends. The spatial vitality of the Sanxuejie Historic District showed a spatial vitality distribution of high in the north and low in the south, high in the west, and low in the east, with little difference in vitality values. East Street, the bell tower area, and Yongningmen had relatively high vitality values. Among the three districts, the vitality value of the Qixianzhuang Historic District was generally low and unaffected by holiday factors. After field research, the Qixianzhuang Historic District was dominated by traditional communities and buildings, which are the living places of the aborigines. From a comprehensive point of view, the scope of human activities in the three districts is relatively fixed and is mainly concentrated in offices, shopping places, and scenic spots. The distribution of crowded places on weekends is more extensive, with no obvious fluctuations in the heat values on weekdays and rest days, and the heat values on weekends were greater than those on weekdays, as shown in Figure 5.
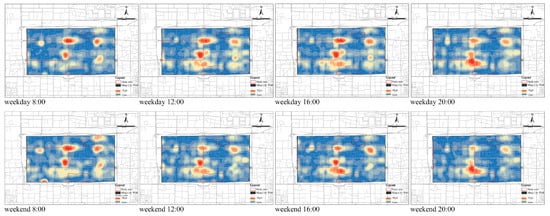
Figure 5.
Spatial distribution characteristics of population aggregation.
In terms of the temporal distribution, the overall spatial vigor was lower on weekdays than on days off, and pedestrians in blocks under different periods had different spatial distribution patterns, as shown in Figure 6. On weekdays, spatial vitality surged from 6:00 to 8:00, followed by an early peak, gradually decreased during the lunch break from 12:00 to 15:00, and then showed a late peak after 16:00 and continued until 18:00, after which spatial vitality continued to decline. The spatial vitality on rest days grew faster from 6:00 to 10:00, lasted longer than that on weekdays, had a gradual upward trend, and peaked at 13:00–15:00, with heat beginning to decline after 18:00 and spatial vitality plummeting after 22:00.

Figure 6.
Plot of relative vitality value changes on weekends and weekdays.
5.2. Quantitative Results of Street Vitality Impact Factors
5.2.1. Walking Accessibility
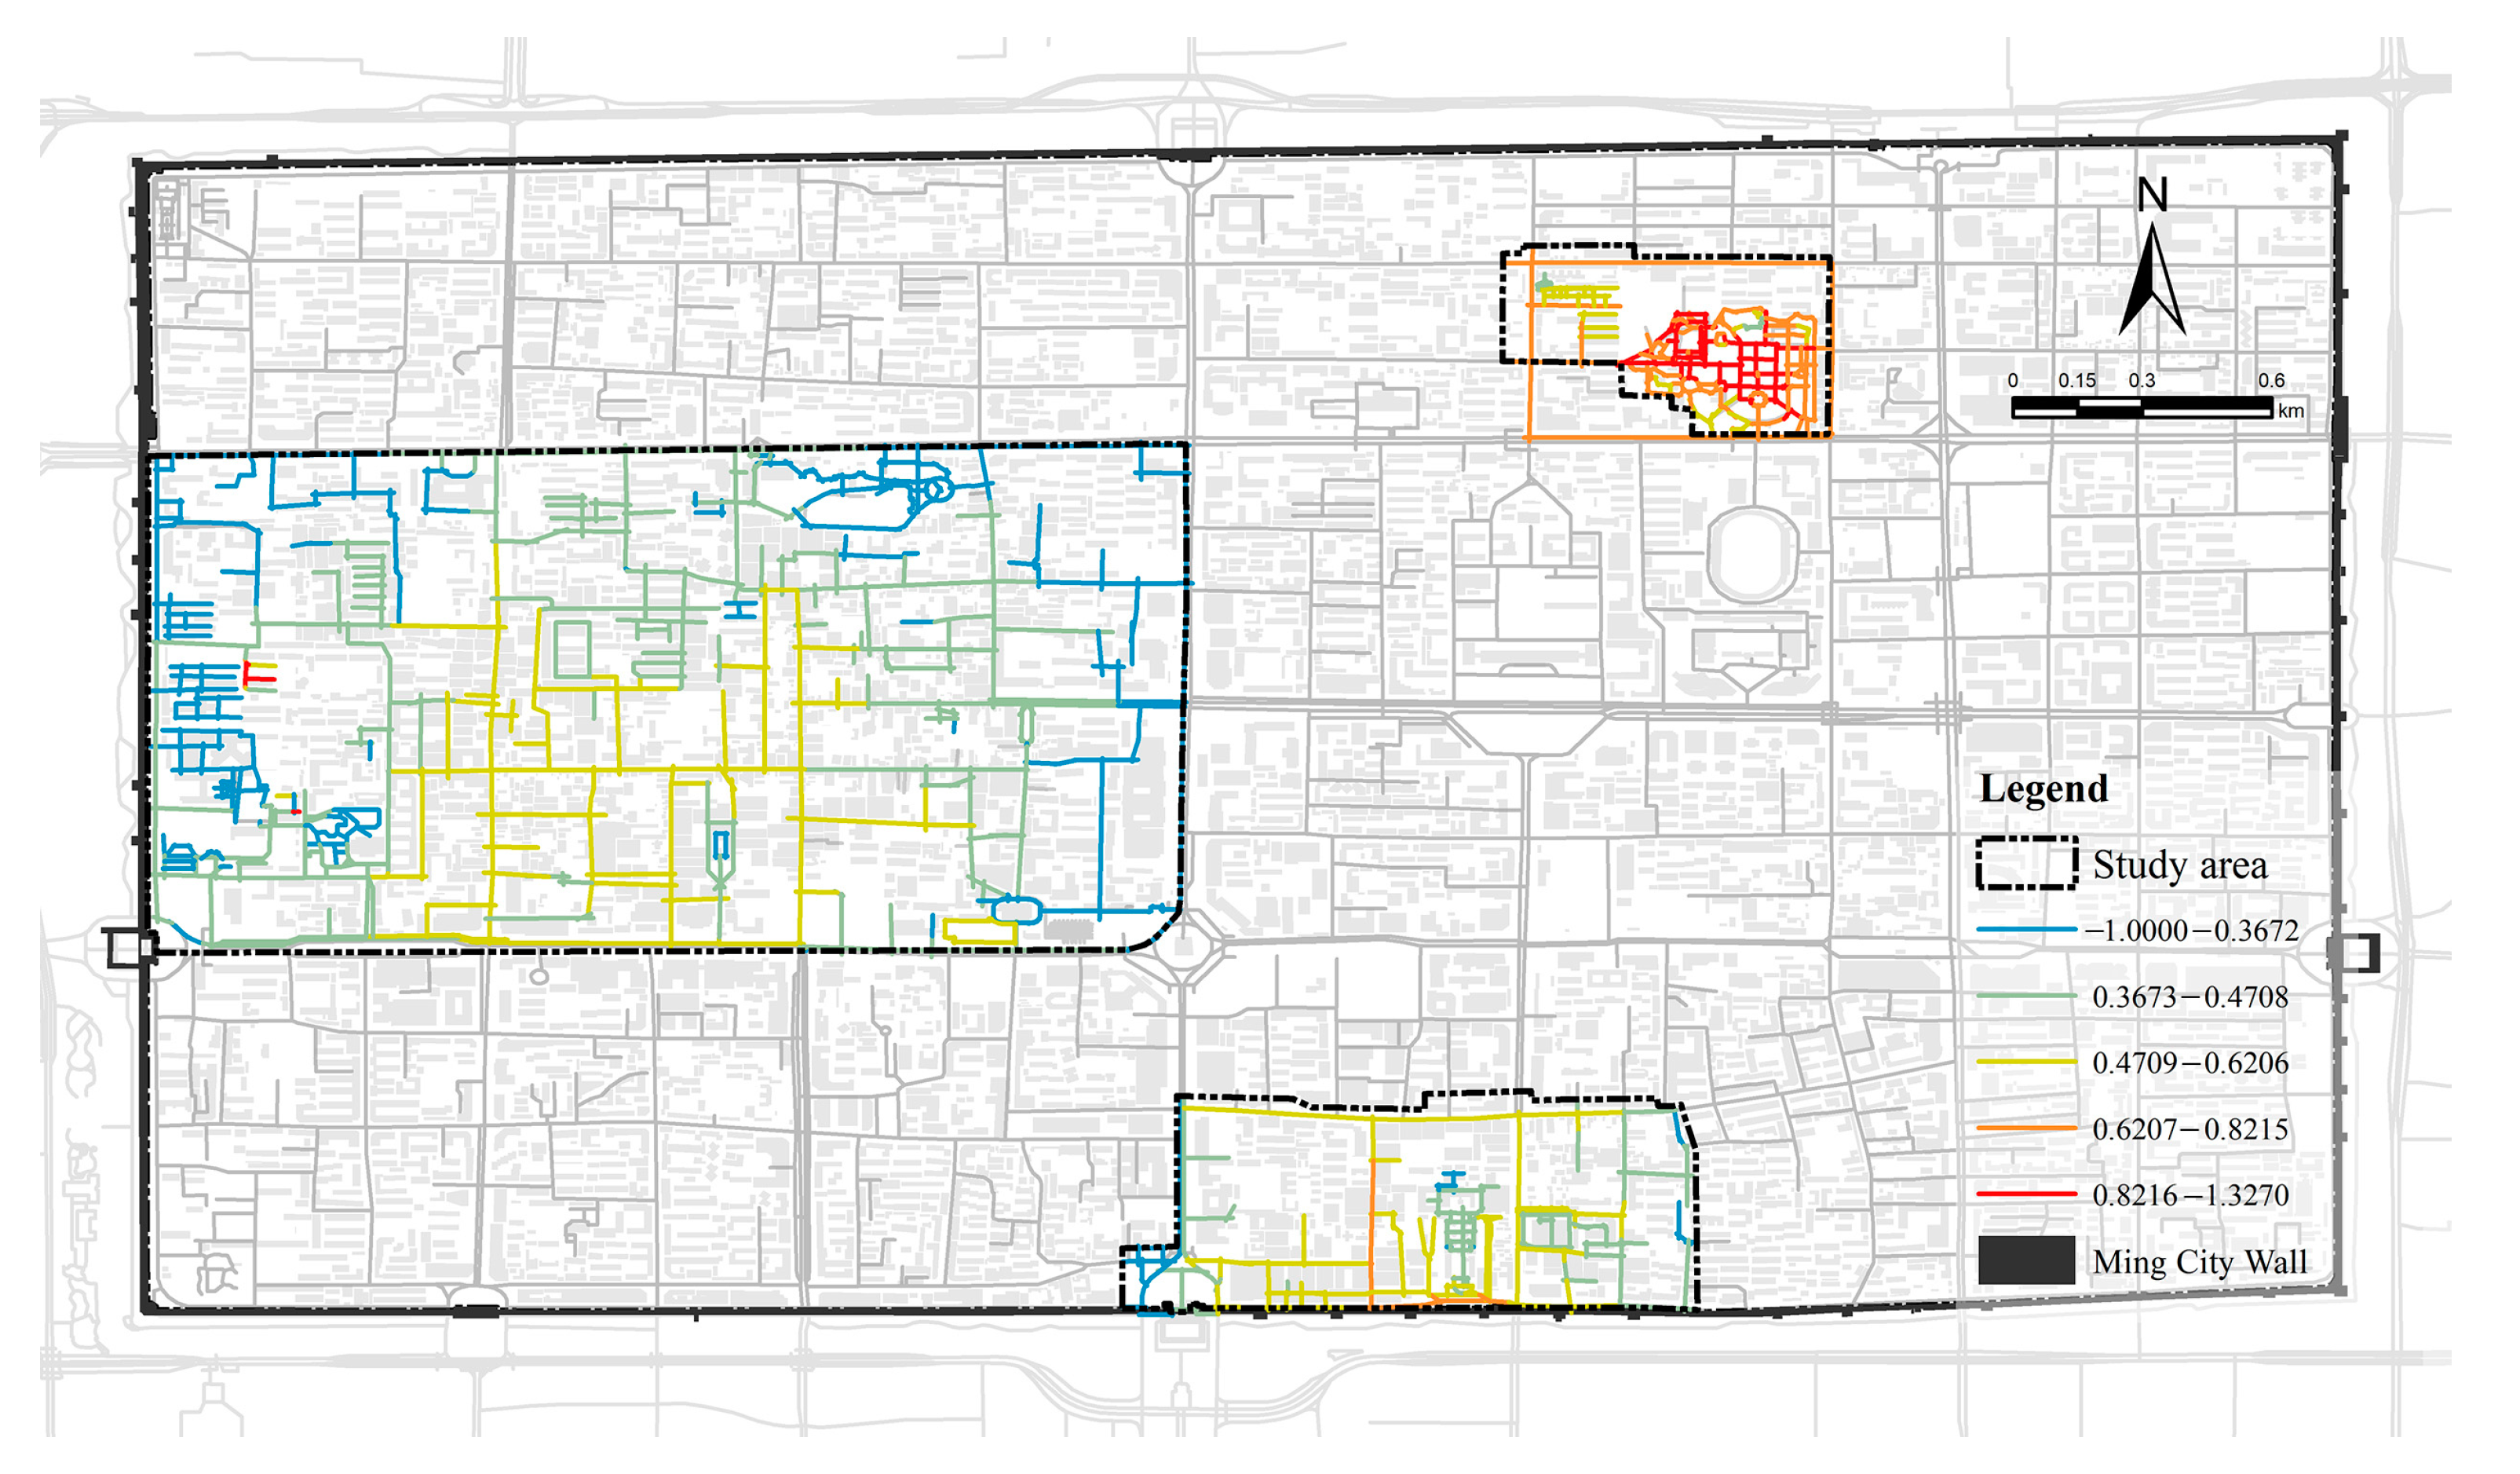
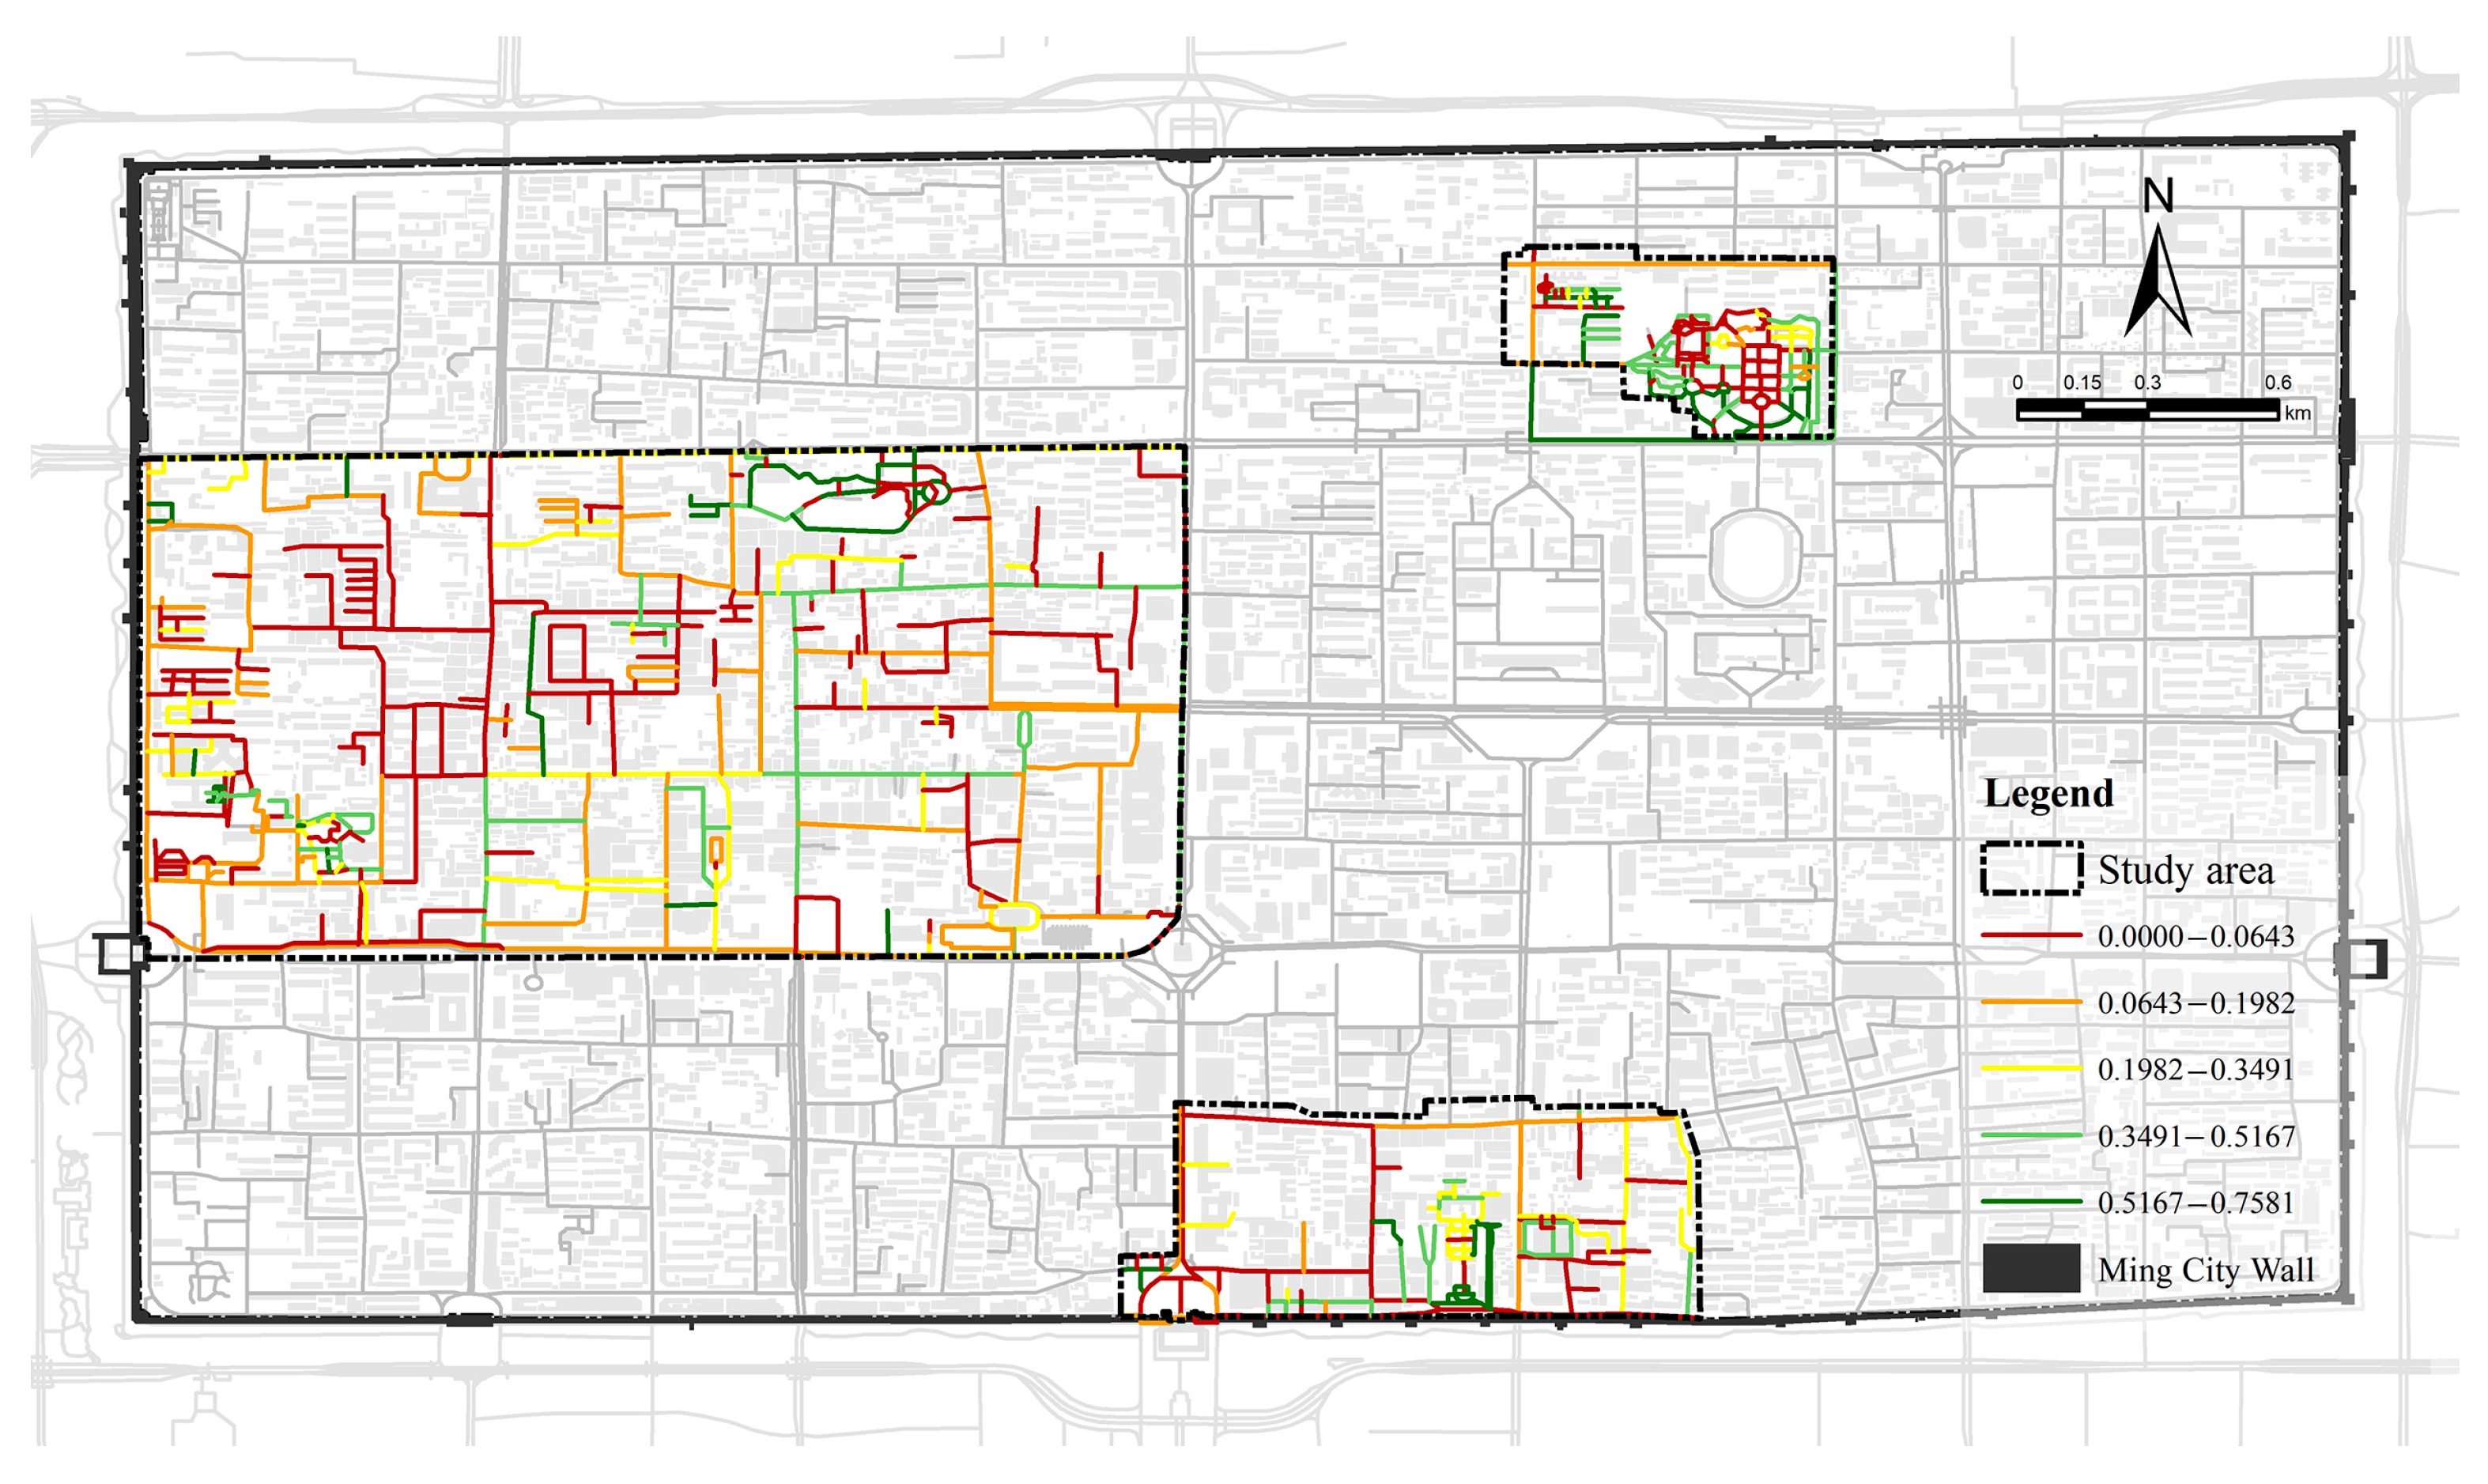
According to the line segment model analysis of spatial syntax, the walking accessibility of Qixianzhuang District was the highest, followed by that of Sanxuejie, and the walking accessibility of Beiyuanmen was the lowest, as shown in Figure 7.
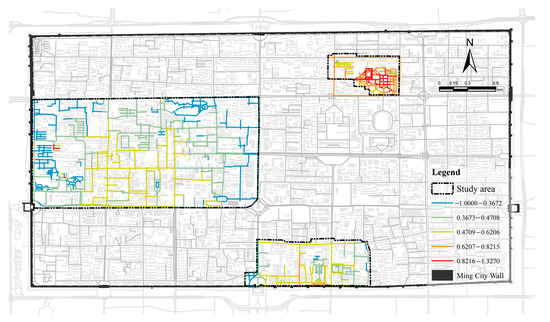
Figure 7.
Walking accessibility.
The analysis of the road network of the Qixianzhuang Historic and Cultural District is shown in the red line segment, which represents a higher pedestrian accessibility index (0.8216–1.3270). It has the greatest pedestrian accessibility, and the road network in the area is dense and has a grid-like shape, which provides more path choices and is conducive to walking activities.
The Beiyuanmen Historic and Cultural District is located in the middle–left area of the analysis map, which is shown primarily in blue and some green line segments, representing a pedestrian accessibility index ranging from low (−1.0000 to −0.3672) to moderate (−0.3673 to 0.4708). Walking accessibility in the area is poor–moderate and is affected by a less dense road network, resulting in residents and visitors experiencing inconveniences when walking. Low pedestrian accessibility means that the area lacks sufficient footpaths, safe crossing facilities, and public amenities (e.g., parks, supermarkets, and schools), making the walking environment less friendly. Taken together, the Beiyuanmen Historic and Cultural District has room for improvement in terms of pedestrian accessibility, and further planning and measures are needed to enhance the walking experience and convenience.
The Sanxuejie Historic and Cultural District is shown predominantly in yellow and light yellow line segments, representing a moderate (0.4709 to 0.6246) to good (0.6207 to 0.8215) pedestrian accessibility index. This indicates that the pedestrian accessibility of the Sanxuejie District is relatively good, and that the infrastructure and road network are relatively complete; however, there is still room for improvement. It is recommended that pedestrian accessibility be further optimized by increasing the density of facilities and rationally distributing commercial and service points while optimizing the existing road network to enhance the walking experience of residents and tourists.
5.2.2. Functional Density
The functional density is affected by the functional layout of the district, which has different characteristics. As shown in Figure 8, the Beiyuanmen and Sanxuejie Historic and Cultural Districts have a greater density of facilities overall. Beiyuanmen District is a large-scale living neighborhood dotted with scenic spots and ancient monuments. Its facilities are mainly concentrated in the southern part of the center of the district, and the areas with lower functional density are mainly small streets and alleys within the residential area. Sanxuejie District mainly consists of buildings of cultural relic protection units; therefore, the streets with higher functional density are those outside the buildings of cultural relic protection units. The Revolutionary Park on the southeast side of Qixianzhuang District occupies most of the area, and the former office site is on the northwest side, so the overall functional density is lower. However, the north side is one of the main living streets within the city wall, so the functional density is greater.
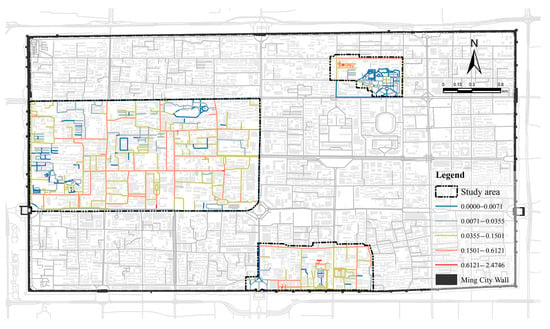
Figure 8.
Functional density.
5.2.3. Functional Mixing Degree
Figure 9 shows that the distribution of the degree of functional mixing was consistent with that of the functional density. All three districts show that the degree of functional mixing increases with increasing function density, and areas with lower density have low functional mixing. In the Beiyuanmen District, as the streets with higher functional density are mostly residential streets, to meet the diverse living needs of the residents in the neighborhood, the functions are characterized by diversity, with a consequently higher degree of functional mixing, whereas the streets with lower functional density are mainly small streets within the residential area, with lower pedestrian accessibility and, consequently, a lower variety of functions.
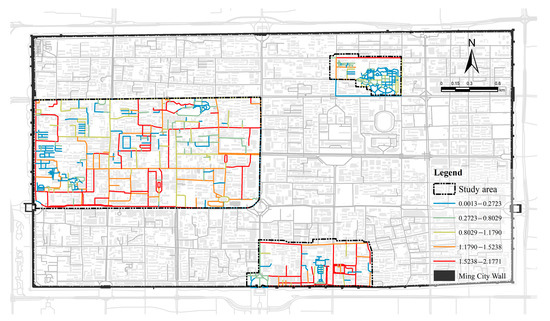
Figure 9.
The functional mixing degree.
In the Sanxuejie District, the streets with higher functional density are mostly at the periphery of the attractions, and the functions need to serve both tourists and residents, which leads to a higher degree of functional mixing, whereas the lower areas are the internal streets of the scenic spots, and the types of functions are more homogeneous. In the Qixianzhuang District, since the Revolutionary Park occupies most of the area, the park’s internal function is relatively limited; in addition to scenic areas, there are only three types of facilities: science, education, and cultural services; transportation facility services; and food and beverage services. While the northern street is one of the main living streets within the wall, the southern part of the street is adjacent to the old site of attraction, and the street functions are diverse.
5.2.4. Green Visualization Rate
Figure 10 shows that the green visualization was analyzed by crawling and semantic segmentation of three blocks of street view. The analysis results show that, in terms of the distribution of green visibility in the historic districts, the streets with high green visibility in the Qixianzhuang and Sanxuejie Districts account for a high percentage of streets with high green visibility and are relatively concentrated compared with the overall low green visibility of the streets in the Beiyuanmen District. The high percentage of streets with high green visibility and relative concentration in the Qixianzhuang and Sanxuejie Historic and Cultural Districts, the overall high green visibility of the external streets of Qixianzhuang, and the low green visibility of the internal streets reflect the importance of full investment in greening in historic planning and construction. This high GVR stems from the rich green vegetation, landscaping, and public green spaces within the district, which provide a pleasant living environment for residents. In contrast, the overall low green visibility rate in streets in the Beiyuanmen District indicates that the area suffers from insufficient greening. This results in a lack of adequate greening facilities, inadequate management, or improper maintenance in the district. A low green visibility rate results in a lack of recreational areas and fresh air for residents, directly affecting their quality of life and living experience.
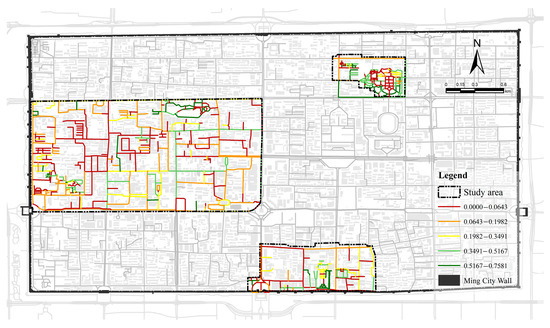
Figure 10.
Green visualization rate.
5.2.5. Interface Enclosure
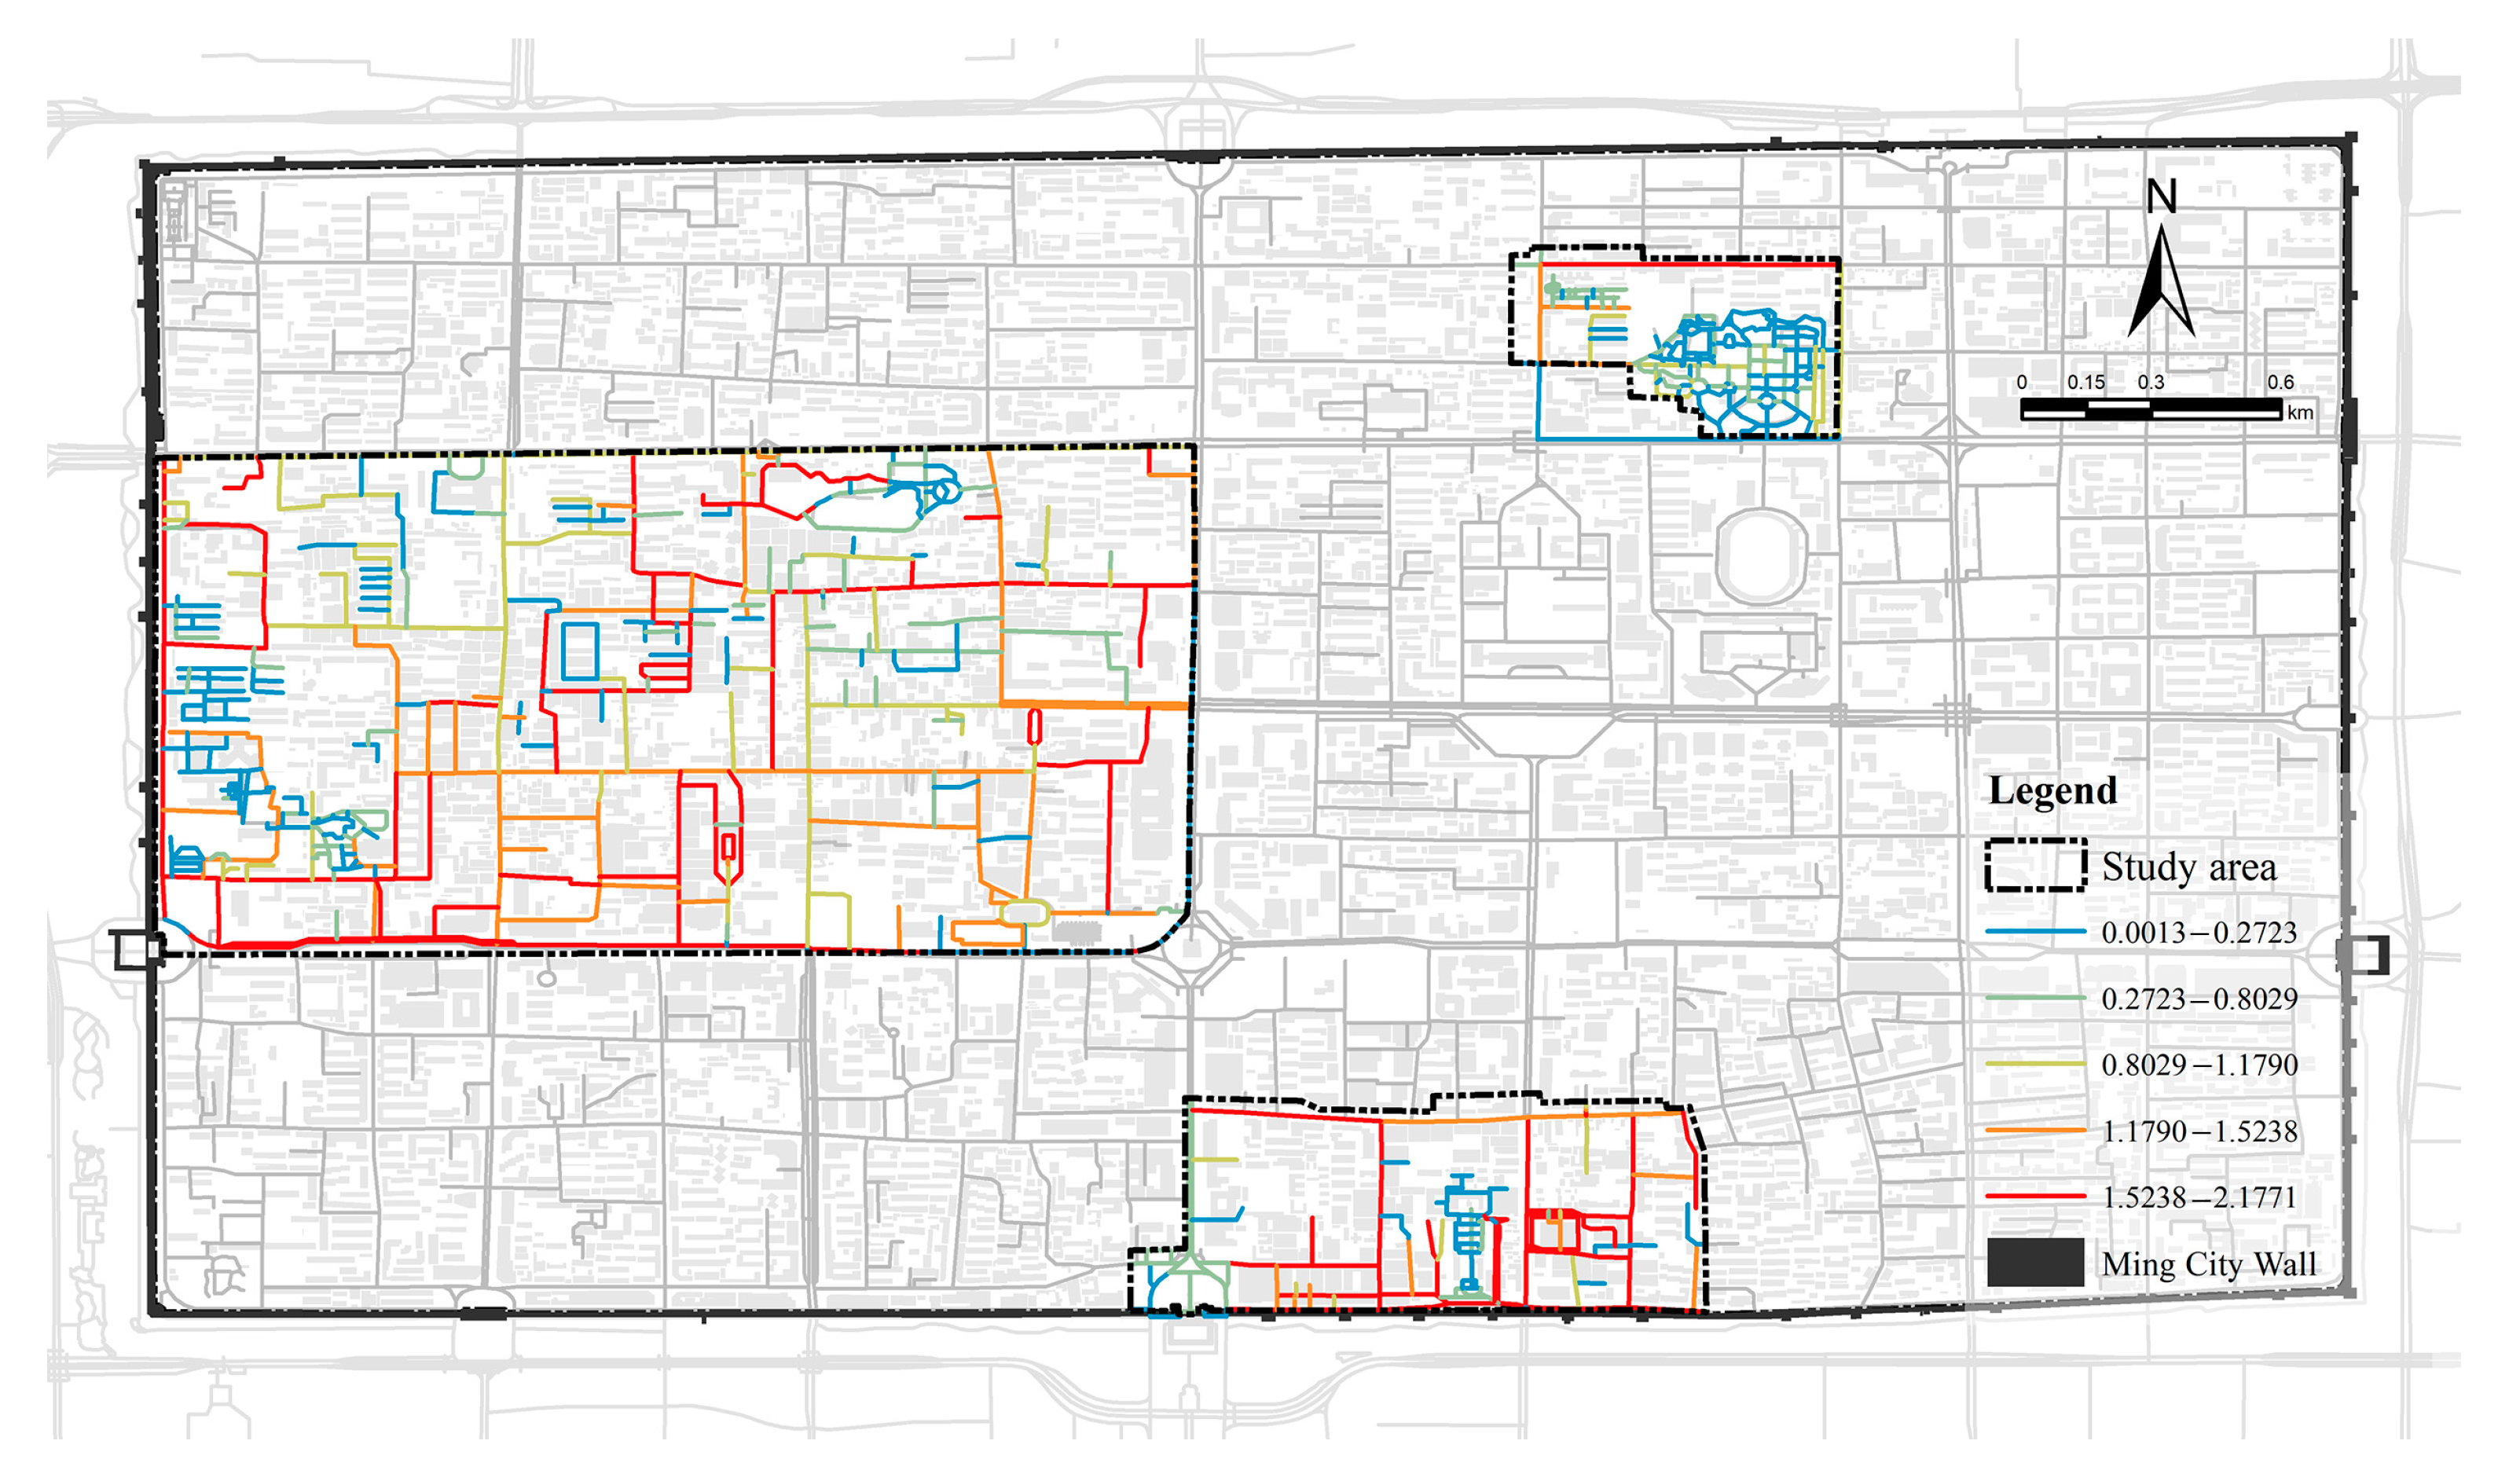
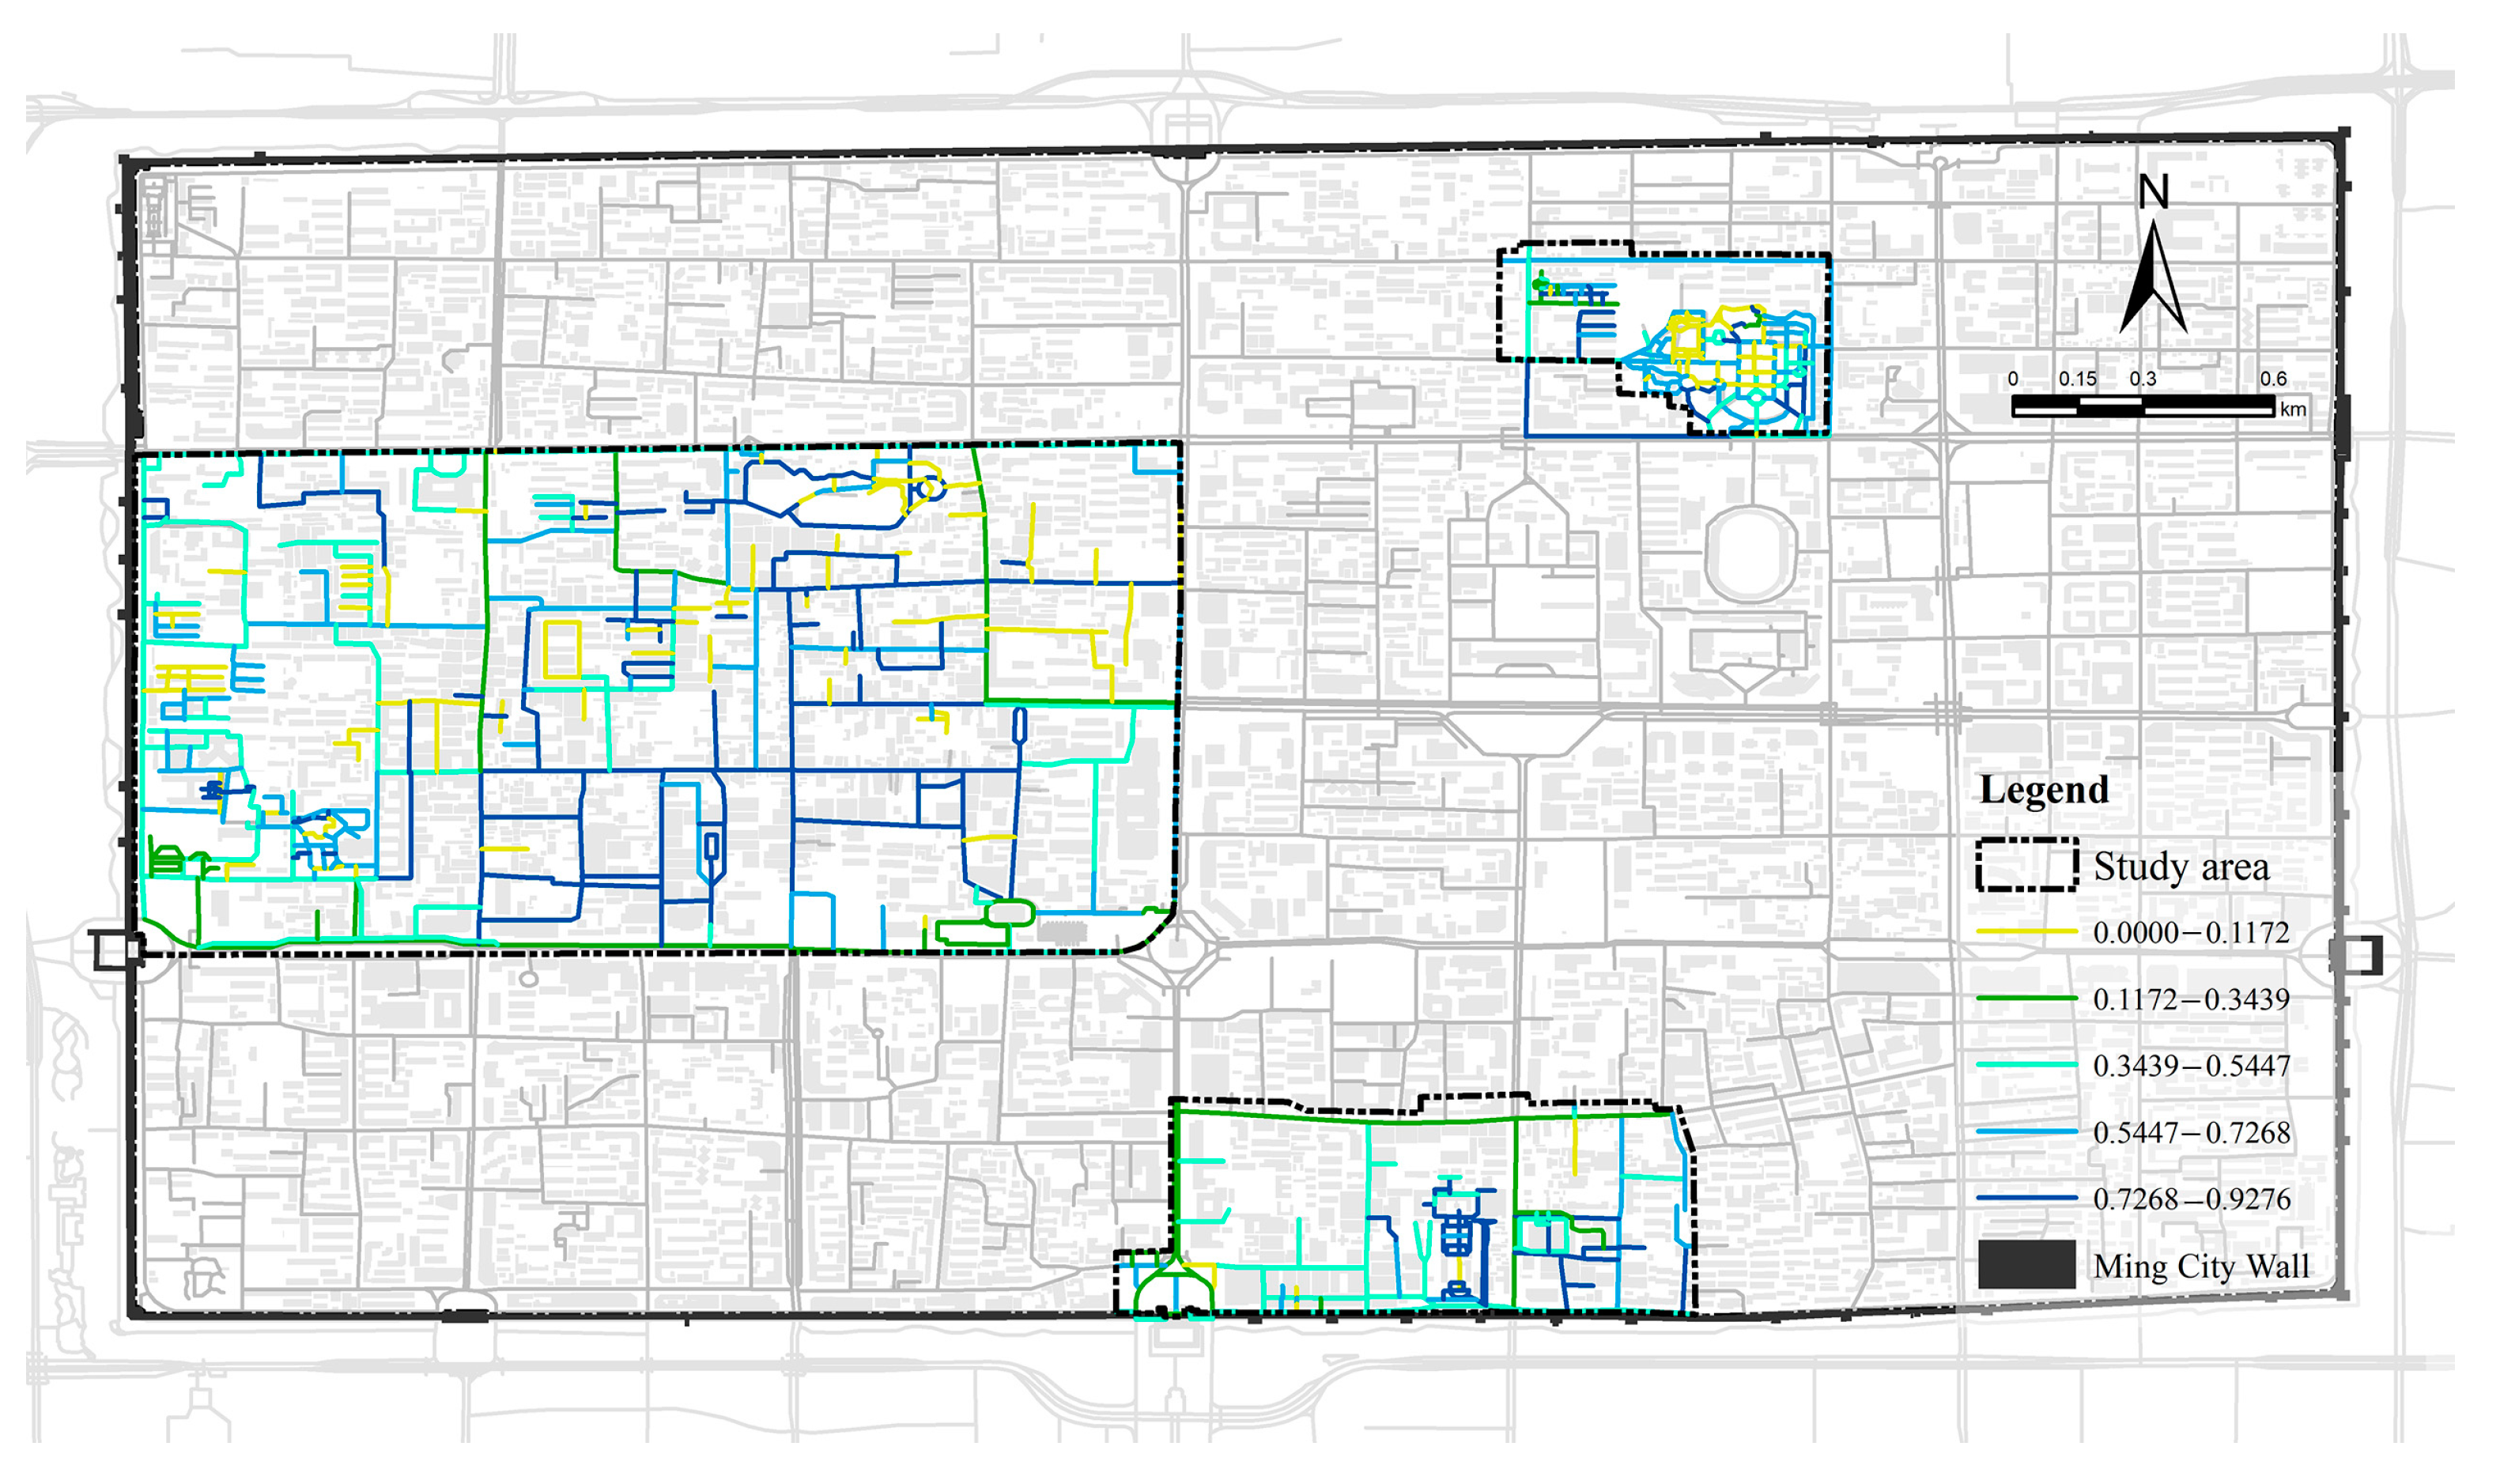
Through street scene deep learning semantic segmentation technology, the street scenes of the three historic and cultural districts were crawled and semantically segmented, and the interface enclosure was visualized and analyzed, as shown in Figure 11.
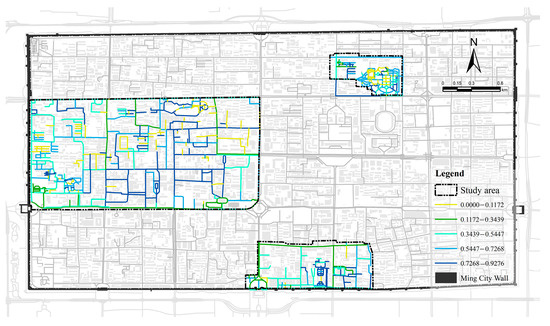
Figure 11.
Interface enclosure.
The analysis results show that the interface enclosures of the three historic and cultural districts are characterized by an overall high degree of distribution. The interface enclosure of the Qixianzhuang Historic District is high overall in the periphery and low in the interior, while the interface enclosure of the Beiyuanmen Historic District is high overall in the interior and low in the exterior. The interface enclosure of the Sanxuejie Historic District is high on the south side and low on the north side, and it is strongly influenced by the height and density of buildings within the historic district. On the one hand, historic and cultural districts are usually the more complete traditional building groups in the city, and for historical reasons the land use in these districts tends to be more compact, and their building density is higher. On the other hand, these districts are the core areas or cultural heritage protection zones of the city, so they are subject to strict planning and protection, and the demolition and reconstruction of buildings are restricted, resulting in a high building density.
According to the analysis of the planning layout and street network, the planning layout of historic and cultural districts is more complicated, and their street networks are intricate, which affects the enclosure between buildings. Some districts have dense alleys and congested streets, resulting in a high degree of enclosure between buildings, whereas other districts have wide streets and open spaces, resulting in a relatively low degree of enclosure between buildings. In terms of historic and cultural character analysis, different historic and cultural districts have different historical and cultural characteristics that affect the layout and style of the buildings in the districts. Some districts have dense clusters of traditional buildings that are closely connected, resulting in a high degree of enclosure, whereas others have open historic squares or courtyards with a relatively low degree of enclosure between buildings. From the perspective of landscape and environmental factors, those factors surrounding the districts also affected the degree of enclosure between buildings. Some districts are surrounded by natural or man-made landscapes and have low visual isolation between buildings, resulting in low levels of enclosure, whereas others are located in dense areas of cities or lots with tall buildings and high visual isolation between buildings, resulting in high levels of enclosure.
5.2.6. Motorized Traffic Interference Index
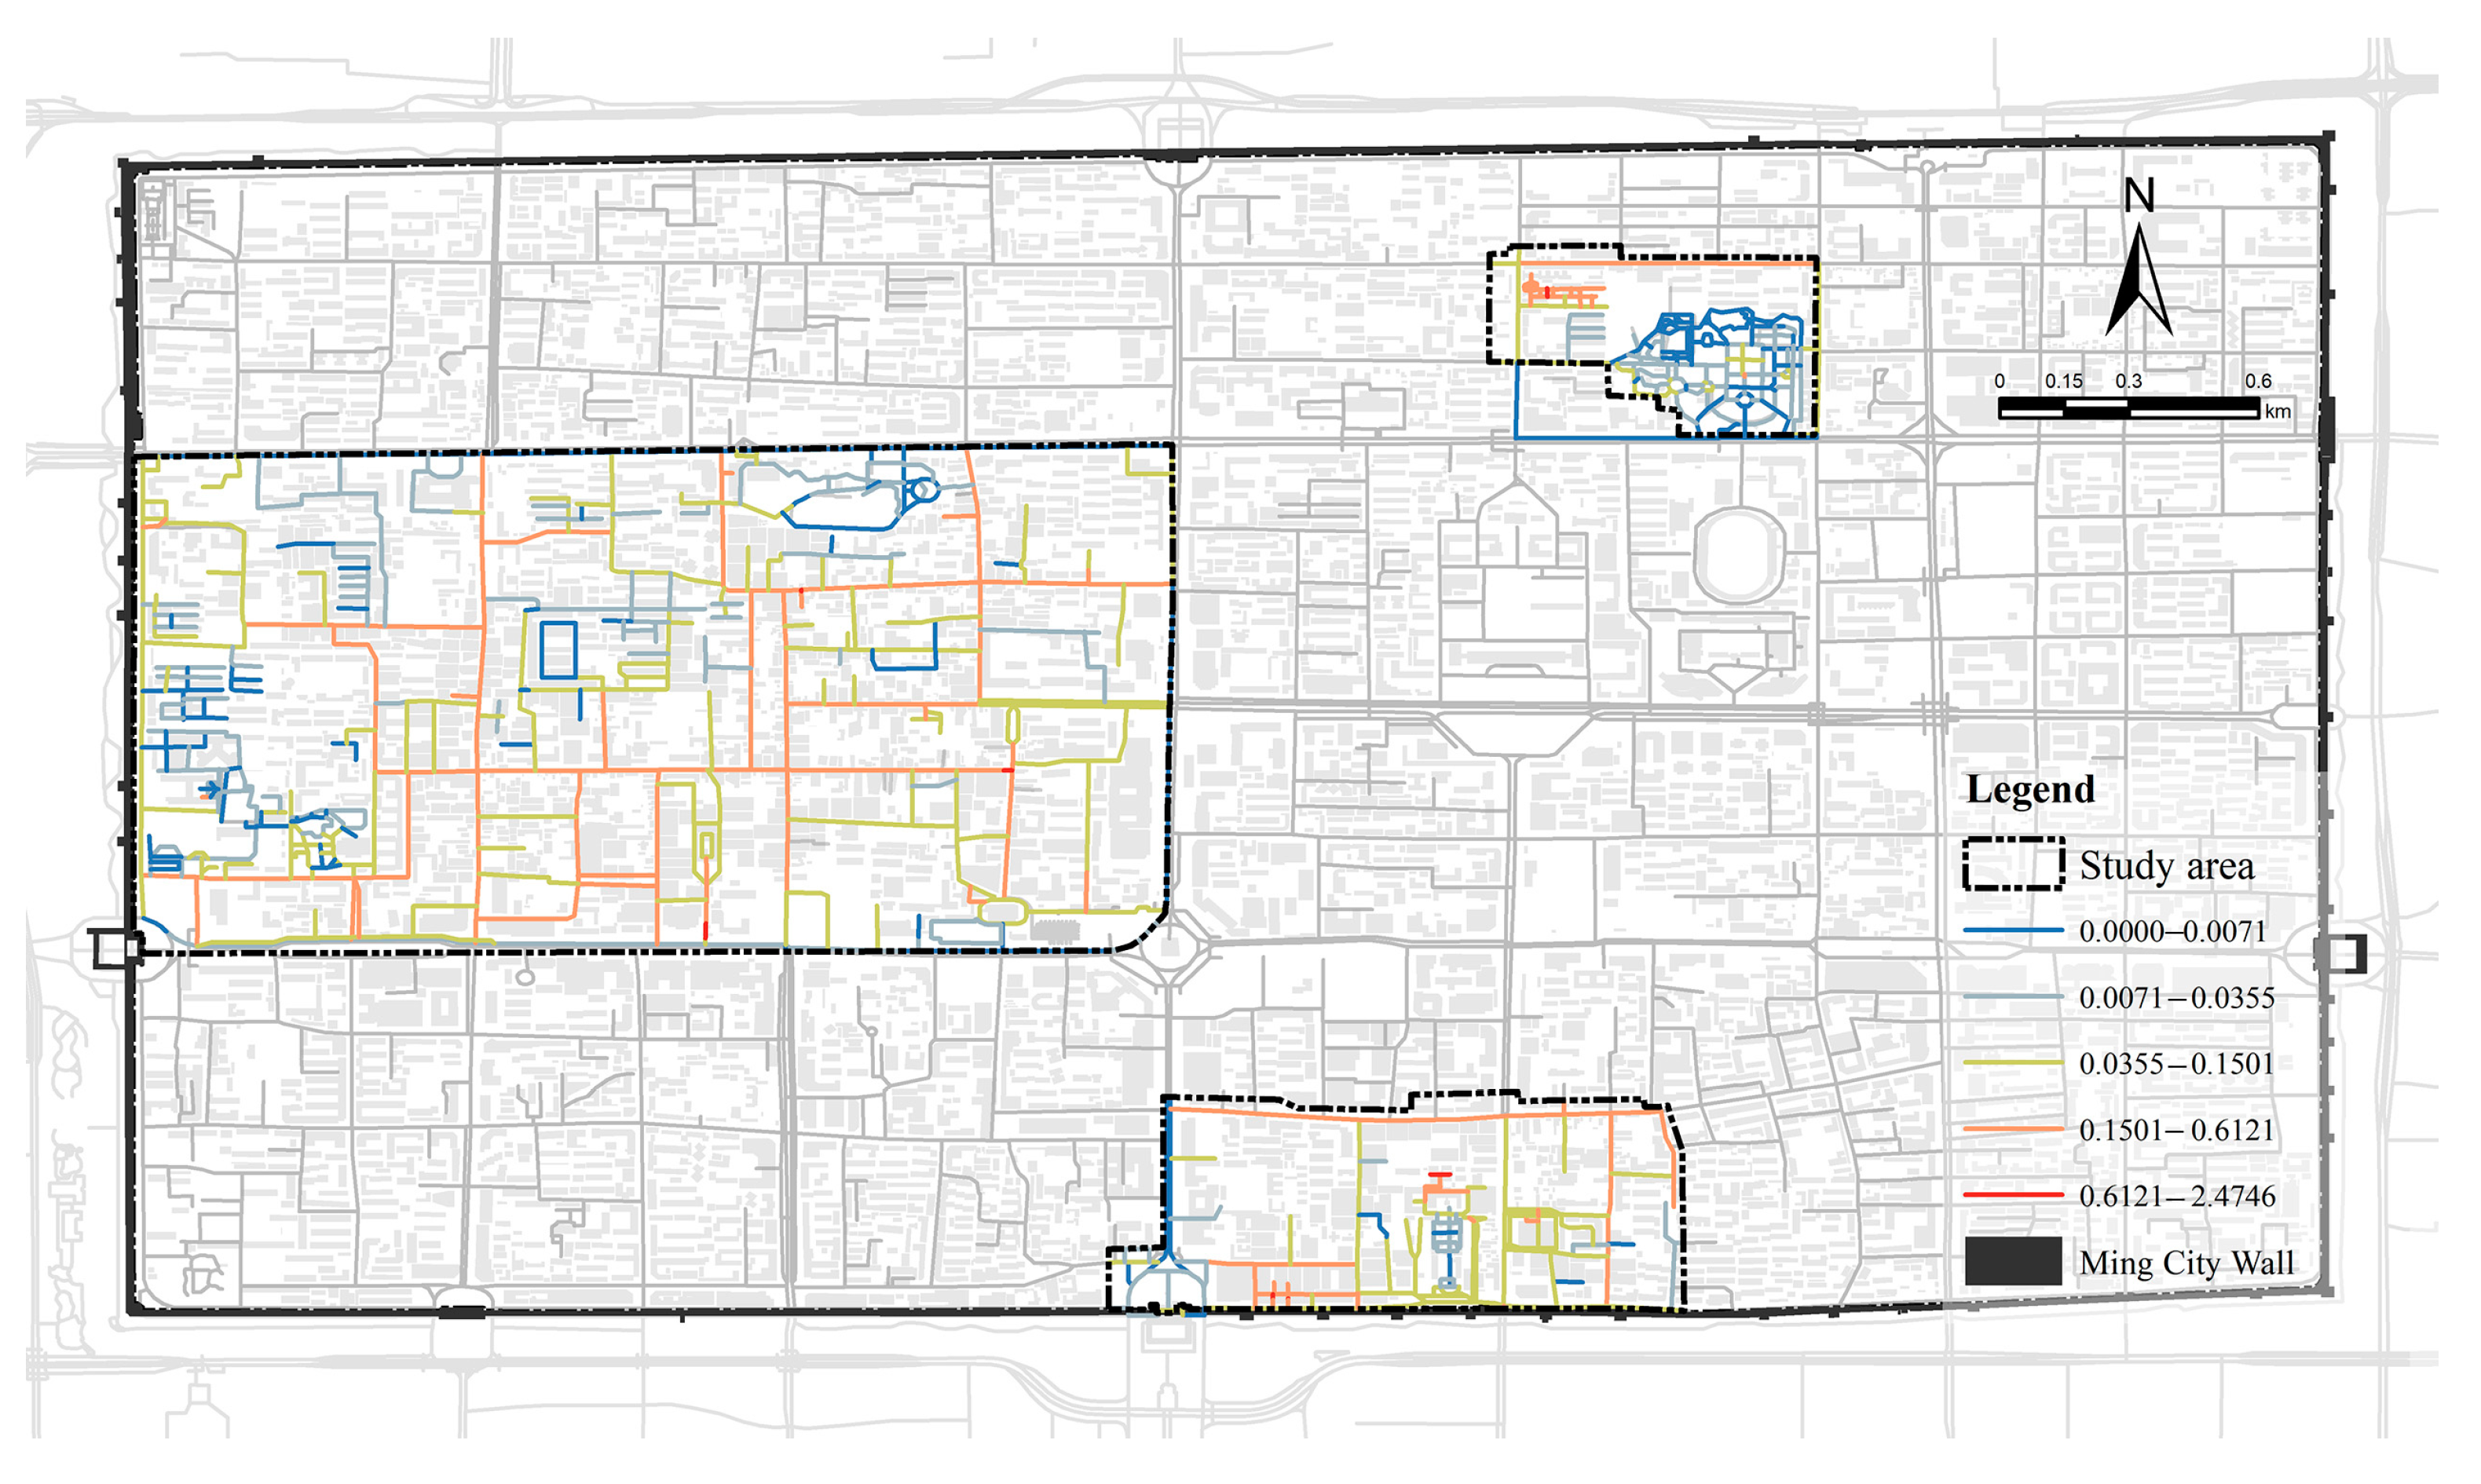
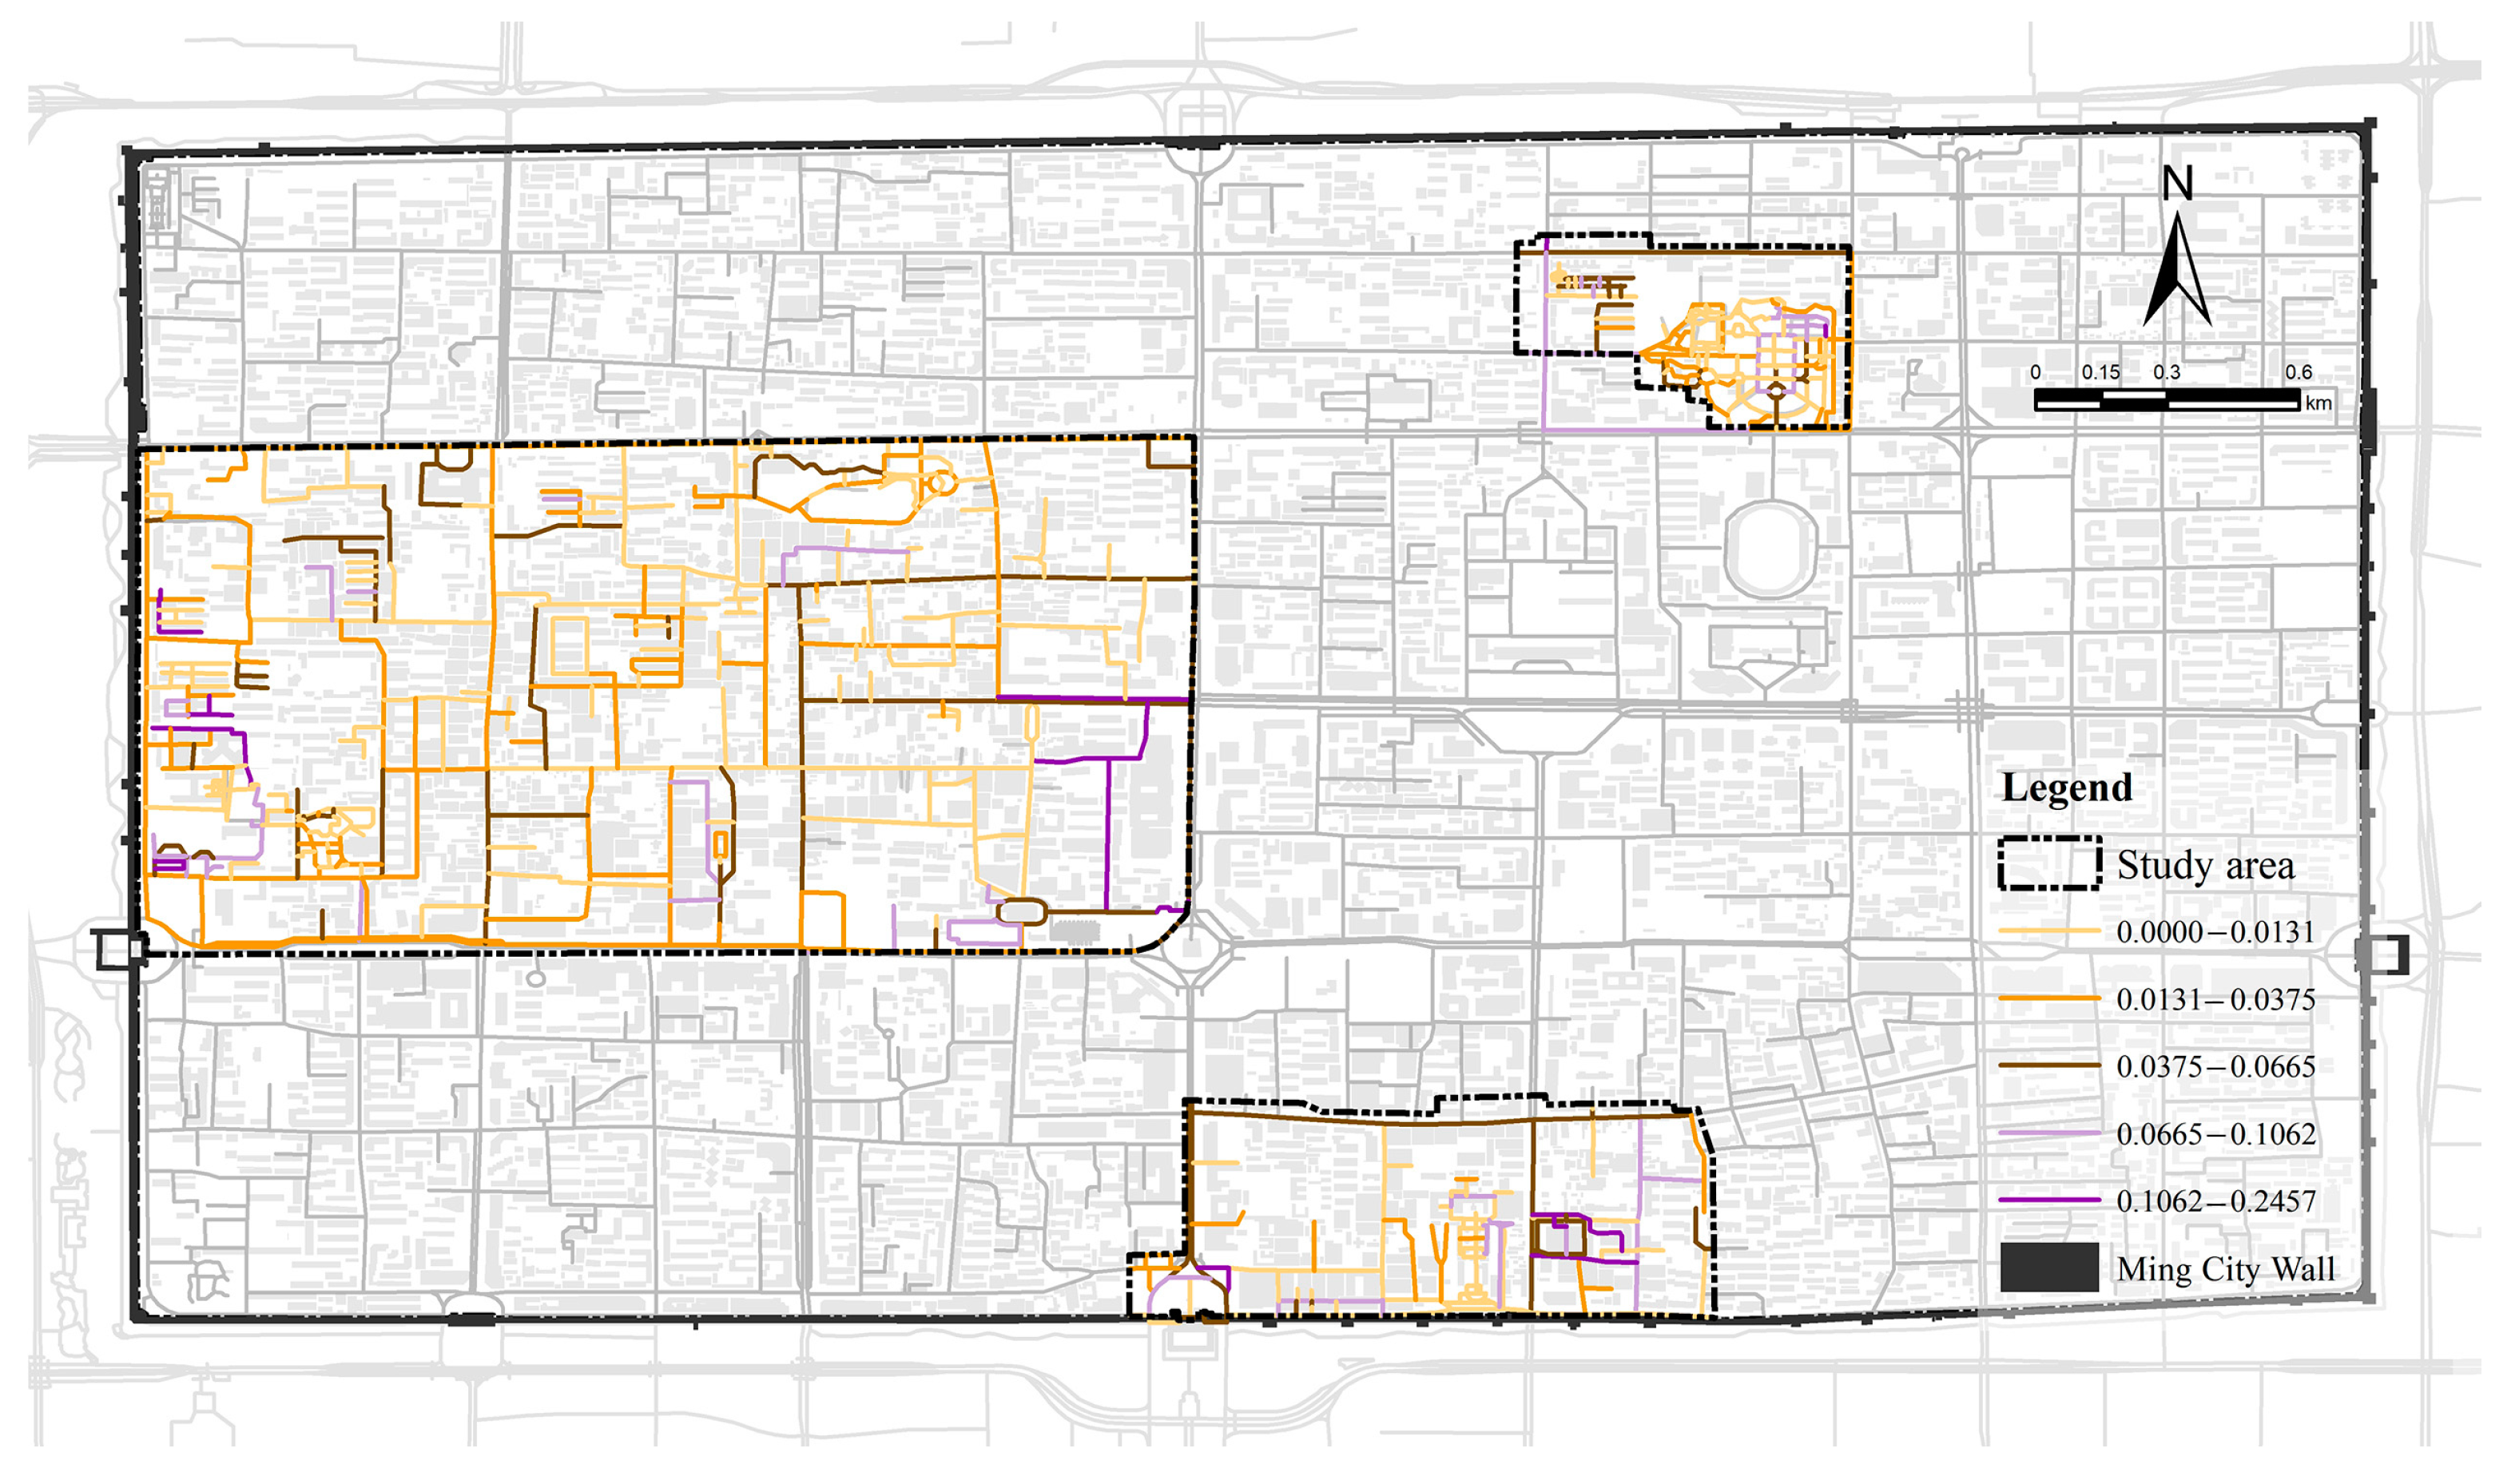
Through street scene deep learning semantic segmentation technology, the street scenes of the three historic and cultural districts were crawled and semantically segmented, and a visual analysis of the motorized traffic interference degree was carried out, as shown in Figure 12.
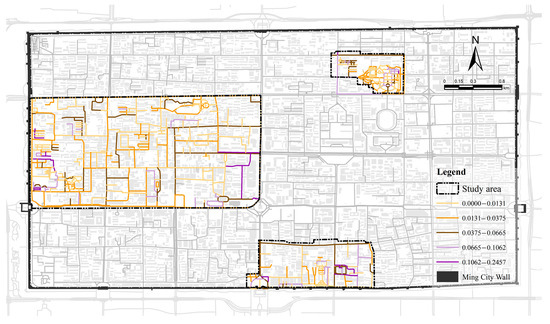
Figure 12.
Motorized traffic interference index.
The analysis results show that in the distribution of the interface enclosure of the historic districts, the motorized traffic interference degrees of the three historic and cultural districts are all characterized by overall low values, with individual roads being higher. However, the motorized traffic interference degree of Xihuamen Street and Social North Road in the Beiyuanmen Historic and Cultural District is high, and the motorized traffic interference degree of Open West Lane in the Sanxuejie Historic and Cultural District is higher.
There are differences in the road structure and traffic organization of the three historic districts, namely, Qixianzhuang, Beiyuanmen, and Sanxuejie. Qixianzhuang has narrow streets, but the overall traffic interference is low because of certain traffic restrictions that limit motorized traffic in the district. In contrast, the Beiyuanmen Historic District has several main streets with high traffic interference, such as Xihuamen Street and Social North Road. As a result of higher traffic flow or insufficiently strict traffic control measures, there are some streets in Sanxuejie, such as Kaikaixi Lane, with a higher degree of motorized traffic interference, because these streets are the main access routes for the travel of the surrounding residents and carry a greater number of motorized vehicles through them.
The three historic districts have adopted varying degrees of parking and access restrictions, which have had an impact on the level of motorized traffic interference. Qixianzhuang implemented stricter access restriction measures to limit motorized vehicle traffic, thus reducing the degree of traffic disturbance. Beiyuanmen and Sanxuejie have less stringent parking and access restrictions on certain streets, resulting in higher levels of traffic disruption on some streets.
5.3. Results of Correlation Analysis between Street Vitality and Influencing Factors
Commonly used methods include Pearson correlation analysis and Spearman correlation analysis. The primary difference between these two methods lies in the requirement for normality in the data: Pearson correlation is used when the data are normally distributed, while Spearman correlation is typically applied when the data do not meet the normality assumption. As shown in Table 3, both the Kolmogorov–Smirnov and Shapiro–Wilk tests indicated that the data did not exhibit normality (p < 0.05), implying that the original hypothesis of normal distribution of the data is not valid. Consequently, Spearman correlation analysis was deemed appropriate for this study.
where r represents the Spearman correlation coefficient; di denotes the rank difference between xi and yi, where x and y represent the two sets of data; and n is the sample size. When 0 ≤ |r| ≤ 1, if r is positive, it is positively correlated, and vice versa; the larger the value, the stronger the correlation. A p-value less than 0.05 or 0.01 indicates that the two research variables are significantly correlated, and vice versa for general correlation.

Table 3.
Data normality test results.
As shown in Table 4, the analysis results show that the three districts have different significant influencing factors. Although they all include pedestrian accessibility and interface enclosure, the correlation relationships are different—some positive and some negative—which may be due to the different dominant elements and functions of the districts.

Table 4.
Correlation analysis of spatial vitality and its influencing factors.
The factors that significantly affect the vitality of the Beiyuanmen Historic District are pedestrian accessibility and interface enclosure. The second most significant factor are the motorized traffic interference index and the mixing degree of facilities, and the basic factors that have no effect are the density of facilities and the green visibility rate. Moreover, pedestrian accessibility is negatively correlated, and the motorized traffic interference index is positively correlated. Combined with the heatmap, it can be seen that the areas with high vitality values are distributed in the east, the northeast side is the intersection of the main roads in the inner area of the wall, and there is a subway station on Beidajie, which is a point of pedestrian flow explosion. The southeast side is the iconic attraction of the bell tower, and there is the only integrated shopping mall in the district, the New World Department Store, and the Grade 3A Provincial Chinese Medicine Hospital (the highest-level hospital), which is in the middle of the city’s urban area, with vehicular traffic congestion. Because these elements have a strong siphoning effect and people tend to arrive by car, the lower the pedestrian accessibility and the stronger the motor vehicle interference are, the stronger the vitality value of the area. The interface enclosure is negatively correlated; that is, the greater the vitality, the lower the interface enclosure. This is because the building density inside the district is greater, while the area with lower enclosure is mostly outside the district, close to the main traffic roads in the inner area of the wall, with a more spacious view, which provides people with a more comfortable walking experience and, therefore, has greater vitality.
The factors that significantly affect the vitality of the Qixianzhuang Historic District are pedestrian accessibility, green visibility, and interface enclosure, and the next most significant factor is facility density, all of which are positively correlated; the factors that generally have no effect are the facility mixing degree and motorized traffic interference degree. As the main function of the district is as a park, the greater the accessibility is, the greater the green visibility, and the greater the facility density is, the greater the vitality value. At the same time, areas with higher interface enclosures are mostly rich in botanical landscapes, park attractions, and service buildings, leading to greater vitality of the areas with higher interface enclosures.
The factors that significantly affected district vitality in the Sanxuejie Historic District were pedestrian accessibility, facility mix, and interface enclosure; the next most significant factor was green visibility, and the factors that had no effect were facility density and the agitation traffic interference index. Walking accessibility and facility mix are positively correlated, whereas green visibility and interface enclosure are negatively correlated. Because the buildings in the district are mainly heritage conservation units, the greater the pedestrian accessibility and the greater the mix of facilities are, the better the ability to meet the needs of tourists and residents simultaneously and, therefore, the greater the vitality value. For tourists, the main object is architecture, so the lower the enclosure and the lower the green visibility, the more elements that can be viewed, which leads to a negative correlation between the two and the vitality value, indicating that the historic architectural elements have a greater role in promoting the vitality of the district.
6. Discussion
The disappearance of historic and cultural districts has become a common phenomenon in the context of rapid urban development and unbalanced development among regions in developing countries. The loss of functions, inhabitants, and traditional roles of historic districts is fundamentally due to the lack of vitality of the districts [79]. Therefore, the core and essence of revitalizing historic districts lies in restoring their vitality; however, few studies on historic districts have explored this issue from the perspective of vitality and streets. In this study, from the multiple perspectives of “street subject”, “street object”, and “street carrier”, we also investigated the vitality of historic and cultural districts and the factors influencing that vitality, considering people’s activities as the visual manifestation of their vitality and the existing physical environment as the spatial bearer of their vitality, and testing whether the classical theory of Jacobs et al. is suitable for historic districts and ancient cities.
In terms of people’s activities, the results show that street vitality shows a trend of “slow rise–smooth fluctuation–rapid decline”, with clear peaks and troughs in the fluctuation pattern on both weekdays and days off. The population vitality values on weekdays increased faster, while the changes on the weekends were relatively smooth. Compared with weekdays, weekends had greater thermal peaks, the thermal peaks occurred later, and the street vitality lasted longer at night. The results in terms of the built environment show that the main influences on the vitality of the three historic districts are different due to their respective cultural heritage and regional characteristics, but accessibility and interface enclosure are significant differentiating influences on the street vitality of these three historic districts. Pedestrian accessibility refers to the street’s potential to host people’s activities and the attractiveness of the street, while the density of the street and road network closely connected to the main road is crucial to the vitality of the street. For example, the functional density and road length of streets such as Erfu Street in the Beiyuanmen District are appropriate, but low accessibility also leads to a lack of street vitality. In this regard, the original texture of the street can be appropriately dredged to strengthen the connection, and through the enrichment of functional diversity, the visual guidance to attract people and functions can be strengthened to improve the reconstruction of the section of the street that has a high pedestrian flow and good connectivity. The degree of interface enclosure significantly affects the vitality of streets, and the three historic districts have a high degree of enclosure owing to the large numbers of historic buildings, historic heritage sites, and other resources. However, the street texture and historical and cultural resources of the three historic districts cannot be easily changed because of their protection. Therefore, the subsequent development of the street can be integrated into the assessment of the current state of the buildings and value assessment, the selective demolition of part of the buildings, the formation of public space, and the encouragement of the integration of fragmented space within the street to create a wealth of small streets, a variety of public open spaces, and the addition of movable stores and other facilities to enrich the experience of pedestrians.
The results of this study provide ideas for urban renewal and practice. The three historic districts represent different historical cultures and memories of Xi’an, continue unique cultural genes, and have survived the past process of urbanization and large-scale demolition and construction, which is of great significance to the cultural heritage of the ancient city. For street spaces with high vitality, we can protect and maintain them and carry out targeted design according to different street types, moderately increase the comfort of the street space, continuously improve street facilities, enhance people’s sense of identity and the spatial quality of the street, and build it as a demonstrative street of the ancient city. For street spaces with high vitality, planners can carry out continuous optimization and enhancement, and they can further explore the space that can be discovered and integrated, such as by appropriately increasing public facilities, as well as further excavating it, such as by appropriately increasing public facilities. For street spaces with medium vitality, continuous optimization and improvement can be carried out, and the space can be further explored and integrated, such as by appropriately increasing public facilities, rationally allocating public resources, increasing community activities in public spaces, and enhancing connectivity with main streets. For street spaces with low vitality, gradual renovation can be carried out to gradually improve the lower elements of various indices, and the results of this study show that the vitality of residential streets in these three districts is relatively low and that the users of such spaces are mostly elderly people. Therefore, it is necessary to focus on aging-friendly design, optimize the walkability of the streets, and add small stores to increase the frequency of socialization among elderly people. However, streets should also pursue appropriate spatial vitality, as both over- and under-vitalization can have a negative impact on the healthy development of streets.
These detailed optimization measures can be implemented through city street design guidelines as well as China-specific detailed control planning. On the one hand, specific design requirements can be established by formulating urban street design guidelines, akin to those in London, New York, Beijing, and Shanghai. These guidelines propose design concepts, elements, and management systems to supplement and optimize existing norms and standards. They aim to clarify the fundamental concepts and design requirements for streets, build a shared understanding and consensus across society, coordinate various related elements, and promote comprehensive cooperation among all stakeholders. This provides clear guidance for planning, design, construction, and management. On the other hand, the detailed control plan, which includes mandatory indicators such as plot ratio, building height, and green space rate, as well as the placement of public facilities, ensures that the optimization measures for street enhancement can be effectively implemented. Since street design guidelines are not legally binding in China, it is possible to innovatively incorporate certain indicators that are usually found in these guidelines to legally ensure the implementation of street space optimization measures—for instance, introducing road density indicators to enhance neighborhood accessibility, or implementing discount rate indicators to control the degree of interface enclosure, while moderately increasing open spaces to provide areas for public activities, thereby enhancing street vitality.
This study had some limitations in the selection of data collection and the vitality impact factors. First, big data have limitations in understanding the complexity of street life in depth, and Baidu heatmaps cannot represent all age groups. Future research needs to integrate the age composition, residence time, and activity types of streets for in-depth excavation, analyze the spatial distribution of street vitality in different periods, explore the factors influencing street vitality and their mechanisms of action on this basis, and consider integrating text and emoticons in check-in data to analyze the emotional state of users and explore various factors affecting street vitality in depth from the subjective perspective of users. Second, this study established a quantitative indicator system for the built environment and human activity in historic districts. However, the popularization and development of information and communication technologies have led to unprecedented changes in people’s lifestyles, and studies have not focused on the inheritance and preservation of digital virtual spaces in historic districts. A city is not only a spatial container but also an organism composed of multidimensional things. Therefore, the measurement of street vitality can be extended to digital virtual spaces to explore revitalization strategies for historic districts. In addition, there was no significant relationship between the green visibility rate and the spatial distribution of people in this study, and we will consider adding comparative analysis with other cities at a later stage to further explore the influence mechanism between the green visibility rate and the distribution of people. Moreover, the complexity of street vitality constitutes a factor, and the spatial vitality of the urban population cannot fully reflect the economic, social, and cultural factors of the street; rather, it can only be regarded as the density of people’s activities in the space, and it cannot express the subjective feelings of the crowd. In follow-up research, the collection and analysis of subjective and objective information from individuals can be increased to enhance the subconscious awareness of the whole population and society about the inheritance of history and culture.
7. Conclusions
By crawling open-source data from the internet, this paper attempted to construct a street vitality evaluation system for Xi’an’s historic and cultural districts and conducted a quantitative and comparative study on the street vitality of three historic districts identified by the Xi’an municipal government. The evaluation of the external representation dimension of street vitality incorporated human activities, and the evaluation of the spatial carrier dimension of street vitality focused on transportation accessibility, functional diversity, street safety, and street comfort. In addition, Spearman correlation coefficient analysis was used to explore the drivers of neighborhood vitality in depth, and corresponding optimization strategies were proposed based on revealing the factors influencing neighborhood vitality. This study revealed that the vitality of the three historic districts exhibited a “rising–fluctuating–declining” trend, with the intensity of vitality on weekends being greater than that on weekdays but overall similar. Walking accessibility, interface enclosure, and functional mixing played important roles in inducing vitality, and the presence of quality shopping, living, dining, and convenient transportation services on streets with a high intensity of vibrancy confirmed previous findings that transportation accessibility is an important driver of vibrancy [64]. However, streets with low-intensity vitality in Xi’an’s historic and cultural neighborhoods still have a wide distribution, and some of the main streets in the ancient city mainly serve vehicles, with less consideration given to street walkability. The three historic districts are located in the ancient city of Xi’an, where land resources are very limited, and the density of the road network and the degree of interface enclosure are difficult to improve due to the large amount of historic heritage. Therefore, these three historic and cultural districts need to make full use of their land resources, integrate the fragmented space of their streets, enrich their types of industries, and configure their urban functions in a more reasonable way to achieve the multiplication effect of “space-people-flow-functions” and to form a benign cycle, enabling historic districts to both retain cultural memory and further create vibrant public spaces.
This study identified several areas that require further refinement. Firstly, although Baidu heatmap data provide information on relative population density, they do not distinguish specific behavior patterns and characteristics of individuals, such as differentiating between stationary and moving populations. Future research will employ data with higher spatial resolution to distinguish between static and dynamic populations, and to explore in detail the habits and attributes of these populations. Secondly, the focus of this study is on the Xi’an ancient city area, which is a core area of a major city. The mechanisms influencing street vitality in this context may not be applicable to medium-sized cities or mountainous cities. The generalizability of our findings needs to be verified, and future research will discuss the distribution of vitality in historical districts across various types of cities based on a diverse database. Thirdly, this study directly analyzes the correlation between external manifestations of street vitality and built environment indicators, lacking an investigation into the optimal values of these indicators from the perspective of human behavior and perception. Additionally, this study does not encompass all potential spatial components influencing street vitality, such as street width ratios, environmental color, and street facilities. Future research will utilize streetscape data and machine learning techniques for in-depth analysis and will consider incorporating economic, cultural, and policy factors to explore a more comprehensive and integrated picture of the factors that influence street vitality. Finally, the current study does not capture the long-term trends or seasonal variations in street vitality. To comprehensively understand the dynamic characteristics of street vitality distribution and identify changes over time, future research should include longitudinal studies to track these long-term changes.
Author Contributions
Conceptualization, Bing Yu and Jing Sun; methodology, Bing Yu; software, Zhaoxing Wang; validation, Jing Sun, Bing Yu, and Sanfeng Jin; formal analysis, Zhaoxing Wang; investigation, Sanfeng Jin; resources, Jing Sun; data curation, Bing Yu; writing—original draft preparation, Bing Yu; writing—review and editing, Jing Sun; visualization, Zhaoxing Wang; supervision, Jing Sun; project administration, Jing Sun; funding acquisition, Jing Sun. All authors have read and agreed to the published version of the manuscript.
Funding
This research was funded by the Shaanxi Provincial Philosophy and Social Science Research Special Project (grant number 2024HZ616) and the Shaanxi Provincial Social Science Fund Project (grant number 2019K007).
Data Availability Statement
The data presented in this study are available upon request from the corresponding author. The data are not publicly available due to the fact that they contain data that are subject to further research.
Conflicts of Interest
The authors declare no conflicts of interest.
References
- Corbusier, L. The Radiant City (La Ville Radieuse); Éditions de l’Architecture d’Aujourd’hui: Paris, France, 1935. [Google Scholar]
- von Schönfeld, K.C.; Bertolini, L. Urban streets: Epitomes of planning challenges and opportunities at the interface of public space and mobility. Cities 2017, 68, 48–55. [Google Scholar] [CrossRef]
- Wang, H.Y.; Tang, J.; Xu, P.P.; Chen, R.D.; Yao, H.N. Research on the Influence Mechanism of Street Vitality in Mountainous Cities Based on a Bayesian Network: A Case Study of the Main Urban Area of Chongqing. Land 2022, 11, 728. [Google Scholar] [CrossRef]
- Zeng, C.; Song, Y.; He, Q.; Shen, F.J.S.C. Spatially explicit assessment on urban vitality: Case studies in Chicago and Wuhan. Sustain. Cities Soc. 2018, 40, 296–306. [Google Scholar] [CrossRef]
- Mouratidis, K.; Poortinga, W. Built environment, urban vitality and social cohesion: Do vibrant neighborhoods foster strong communities? Landsc. Urban Plan. 2020, 204, 9. [Google Scholar] [CrossRef]
- Zhang, A.Q.; Li, W.F.; Wu, J.Y.; Lin, J.; Chu, J.Q.; Xia, C. How can the urban landscape affect urban vitality at the street block level? A case study of 15 metropolises in China. Env. Plan. B-Urban Anal. City Sci. 2021, 48, 1245–1262. [Google Scholar] [CrossRef]
- Yang, Z.S.; Pan, Y.H. Are cities losing their vitality? Exploring human capital in Chinese cities. Habitat Int. 2020, 96, 14. [Google Scholar] [CrossRef]
- Williams, S.; Xu, W.; Tan, S.B.; Foster, M.J.; Chen, C. Ghost cities of China: Identifying urban vacancy through social media data. Cities 2019, 94, 275–285. [Google Scholar] [CrossRef]
- Zhou, T.; Zhou, Y.; Liu, G. Comparison of critical success paths for historic district renovation and redevelopment projects in China. Habitat Int. 2017, 67, 54–68. [Google Scholar] [CrossRef]
- Throsby, D. Investment in urban heritage conservation in developing countries: Concepts, methods and data. City Cult. Soc. 2016, 7, 81–86. [Google Scholar] [CrossRef]
- Li, M.; Liu, J.; Lin, Y.; Xiao, L.; Zhou, J. Revitalizing historic districts: Identifying built environment predictors for street vibrancy based on urban sensor data. Cities 2021, 117, 103305. [Google Scholar] [CrossRef]
- Hu, C.; Gong, C. Creating an Ecological Historic District: Rethinking a Chinese Challenge through the Case of Oakland District, Pittsburgh. Procedia Eng. 2016, 145, 1572–1579. [Google Scholar] [CrossRef]
- Li, M.; Hasemi, Y.; Tanaka, W.; Nozoe, Y.; Nagasawa, M. A Fire Prevention Measure for Disaster Prevention Planning Based on Resident Conditions and Community Characteristics in Preserved Historic Districts/Village in Japan. Int. J. Archit. Herit. 2023, 1–22. [Google Scholar] [CrossRef]
- Doratli, N.; Hoskara, S.O.; Fasli, M. An analytical methodology for revitalization strategies in historic urban quarters: A case study of the Walled City of Nicosia, North Cyprus. Cities 2004, 21, 329–348. [Google Scholar] [CrossRef]
- Park, D.; Nakagawa, D.; Matsunaka, R.; Oba, T. Structural relationship about pedestrian vibrancy and street environment in central areas of Kyoto, Seoul, Beijing and Florence. Int. J. Urban Sci. 2012, 16, 187–202. [Google Scholar] [CrossRef]
- Xie, J.; Heath, T. Conservation and revitalization of historic streets in China: Pingjiang Street, Suzhou. J. Urban Des. 2017, 22, 455–476. [Google Scholar] [CrossRef]
- Li, X.; Hui, E.C.M.; Chen, T.; Lang, W.; Guo, Y. From Habitat III to the new urbanization agenda in China: Seeing through the practices of the “three old renewals” in Guangzhou. Land Use Policy 2019, 81, 513–522. [Google Scholar] [CrossRef]
- Li, X.; Wang, X.; Snyder, M.P. Metformin Affects Heme Function as a Possible Mechanism of Action. G3 Genes Genomes Genet. 2019, 9, 513–522. [Google Scholar] [CrossRef] [PubMed]
- Lyu, Y.; Abd Malek, M.I.; Ja’afar, N.H.; Sima, Y.; Han, Z.; Liu, Z. Unveiling the potential of space syntax approach for revitalizing historic urban areas: A case study of Yushan Historic District, China. Front. Archit. Res. 2023, 12, 1144–1156. [Google Scholar] [CrossRef]
- Sung, H.G.; Go, D.H.; Choi, C.G. Evidence of Jacobs’s street life in the great Seoul city: Identifying the association of physical environment with walking activity on streets. Cities 2013, 35, 164–173. [Google Scholar] [CrossRef]
- Xiao, L.; Lo, S.; Liu, J.; Zhou, J.; Li, Q. Nonlinear and synergistic effects of TOD on urban vibrancy: Applying local explanations for gradient boosting decision tree. Sustain. Cities Soc. 2021, 72, 103063. [Google Scholar] [CrossRef]
- Szeto, W.Y.; Yang, L.; Wong, R.C.P.; Li, Y.C.; Wong, S.C. Spatio-temporal travel characteristics of the elderly in an ageing society. Travel Behav. Soc. 2017, 9, 10–20. [Google Scholar] [CrossRef]
- Delclòs-Alió, X.; Gutiérrez, A.; Miralles-Guasch, C. The urban vitality conditions of Jane Jacobs in Barcelona: Residential and smartphone-based tracking measurements of the built environment in a Mediterranean metropolis. Cities 2019, 86, 220–228. [Google Scholar] [CrossRef]
- Meng, Y.; Xing, H. Exploring the relationship between landscape characteristics and urban vibrancy: A case study using morphology and review data. Cities 2019, 2019, 102389. [Google Scholar] [CrossRef]
- Sulis, P.; Manley, E.; Zhong, C.; Batty, M. Using mobility data as proxy for measuring urban vitality. J. Spat. Inf. Sci. 2018, 2018, 137–162. [Google Scholar] [CrossRef]
- Zhang, L.; Chiaradia, A.J. Three-dimensional Spatial Network Analysis and Its Application in a High Density City Area, Central Hong Kong. Urban Plan. Int. 2019, 34, 46–53. [Google Scholar] [CrossRef]
- Chen, J.; Tian, W.; Xu, K.; Pellegrini, P. Testing Small-Scale Vitality Measurement Based on 5D Model Assessment with Multi-Source Data: A Resettlement Community Case in Suzhou. ISPRS Int. J. Geo-Inf. 2022, 11, 626. [Google Scholar] [CrossRef]
- Moudon, A. Public Streets for Public Use; Book News, Inc.: Portland, OR, USA, 1987. [Google Scholar]
- Khayesi, M.; Monheim, H.; Nebe, J.M.J.A. Negotiating “streets for all” in urban transport planning: The case for pedestrians, cyclists and street vendors in Nairobi, Kenya. Antipode 2010, 42, 103–126. [Google Scholar] [CrossRef]
- Ashihara, Y. The Aesthetic Townscape, 3rd ed.; MIT Press: Cambridge, Ma, USA, 1989; pp. 154–196. [Google Scholar]
- Jacobs, A.B. Great Streets; MIT Press: Cambridge, MA, USA, 1993. [Google Scholar]
- Marshall, S. Streets and Patterns; Routledge: London, UK, 2011. [Google Scholar]
- Yue, H.; Zhu, X.Y. Exploring the Relationship between Urban Vitality and Street Centrality Based on Social Network Review Data in Wuhan, China. Sustainability 2019, 11, 19. [Google Scholar] [CrossRef]
- Ye, Y.; Richards, D.; Lu, Y.; Song, X.P.; Zhuang, Y.; Zeng, W.; Zhong, T. Measuring daily accessed street greenery: A human-scale approach for informing better urban planning practices. Landsc. Urban Plan. 2019, 191, 13. [Google Scholar] [CrossRef]
- Yin, Z.; Ying, L. Urban Development Analysis and Simulation to Address Inventory andIncrement Planning: A Case Study of Chengdu. Geogr. Geo-Inf. Sci. 2016, 32, 45–51. [Google Scholar] [CrossRef]
- Tang, J.X.; Long, Y. Measuring visual quality of street space and its temporal variation: Methodology and its application in the Hutong area in Beijing. Landsc. Urban Plan. 2019, 191, 18. [Google Scholar] [CrossRef]
- Ma, S.; Wang, B.Y.; Liu, W.; Zhou, H.X.; Wang, Y.Q.; Li, S.J. Assessment of street space quality and subjective well-being mismatch and its impact, using multi-source big data. Cities 2024, 147, 15. [Google Scholar] [CrossRef]
- Belloni, E.; Cotana, F.; Nakamura, S.; Pisello, A.L.; Villacci, D. A new smart laser photoluminescent light (LPL) technology for the optimization of the on-street lighting performance and the maximum energy saving: Development of a prototype and field tests. Sustain. Energy Grids Netw. 2023, 34, 23. [Google Scholar] [CrossRef]
- Yue, Y.; Zhuang, Y.; Yeh, A.G.O.; Xie, J.Y.; Ma, C.L.; Li, Q.Q. Measurements of POI-based mixed use and their relationships with neighbourhood vibrancy. Int. J. Geogr. Inf. Sci. 2017, 31, 658–675. [Google Scholar] [CrossRef]
- Chen, T.T.; Hui, E.C.M.; Wu, J.M.; Lang, W.; Li, X. Identifying urban spatial structure and urban vibrancy in highly dense cities using georeferenced social media data. Habitat Int. 2019, 89, 11. [Google Scholar] [CrossRef]
- Montgomery, J. Making a city: Urbanity, vitality and urban design. J. Urban Des. 1998, 3, 93–116. [Google Scholar] [CrossRef]
- Gehl, J.; Kaefer, L.J.; Reigstad, S. Close encounters with buildings. Plan. Archit. 2006, 11, 29–47. [Google Scholar] [CrossRef]
- Zijderveld, A.C. A Theory of Urbanity; Taylor & Francis: London, UK, 2017. [Google Scholar] [CrossRef]
- Jacobs, J. The Death and Life of Great American Cities; Random House: New York, NY, USA, 1961. [Google Scholar]
- Sung, H.; Lee, S.; Cheon, S. Operationalizing Jane Jacobs’s Urban Design Theory: Empirical Verification from the Great City of Seoul, Korea. J. Plan. Educ. Res. 2015, 35, 117–130. [Google Scholar] [CrossRef]
- Gómez-Varo, I.; Delclòs-Alió, X.; Miralles-Guasch, C. Jane Jacobs reloaded: A contemporary operationalization of urban vitality in a district in Barcelona. Cities 2022, 123, 15. [Google Scholar] [CrossRef]
- Jalaladdini, S.; Oktay, D. Urban Public Spaces and Vitality: A Socio-Spatial Analysis in the Streets of Cypriot Towns. Procedia—Soc. Behav. Sci. 2012, 35, 664–674. [Google Scholar] [CrossRef]
- Lynch, K. A Theory of Good City Form; The MIT Press: Cambridge, MA, USA, 1981. [Google Scholar]
- Bentley, I. Responsive Environments: A Manual for Designers; Routledge: London, UK, 1985. [Google Scholar]
- Tang, S.; Ta, N. How the built environment affects the spatiotemporal pattern of urban vitality: A comparison among different urban functional areas. Comput. Urban Sci. 2022, 2, 39. [Google Scholar] [CrossRef] [PubMed]
- Zeng, P.; Wei, M.; Liu, X.Y. Investigating the Spatiotemporal Dynamics of Urban Vitality Using Bicycle-Sharing Data. Sustainability 2020, 12, 14. [Google Scholar] [CrossRef]
- Wang, Y.; You, Y.Y.; Huang, J.Y.; Yue, X.L.; Sun, G.Q. Differences in urban daytime and night block vitality based on mobile phone signaling data: A case study of Kunming’s urban district. Open Geosci. 2024, 16, 17. [Google Scholar] [CrossRef]
- Jiang, Y.; Han, Y.; Liu, M.; Ye, Y. Street vitality and built environment features: A data-informed approach from fourteen Chinese cities. Sustain. Cities Soc. 2022, 79, 103724. [Google Scholar] [CrossRef]
- Zhang, L.; Zhang, R.; Yin, B. The impact of the built-up environment of streets on pedestrian activities in the historical area. Alex. Eng. J. 2021, 60, 285–300. [Google Scholar] [CrossRef]
- Hui, E.C.M.; Chen, T.T.; Lang, W.; Ou, Y.B. Urban community regeneration and community vitality revitalization through participatory planning in China. Cities 2021, 110, 11. [Google Scholar] [CrossRef]
- Zikirya, B.; He, X.; Li, M.; Zhou, C.S. Urban Food Takeaway Vitality: A New Technique to Assess Urban Vitality. Int. J. Environ. Res. Public Health 2021, 18, 3578. [Google Scholar] [CrossRef] [PubMed]
- Yang, F.F.; Lin, G.; Lei, Y.; Wang, Y.; Yi, Z. Understanding Urban Vitality from the Economic and Human Activities Perspective: A Case Study of Chongqing, China. Chin. Geogr. Sci. 2024, 34, 52–66. [Google Scholar] [CrossRef]
- Kim, Y.L. Seoul’s Wi-Fi hotspots: Wi-Fi access points as an indicator of urban vitality. Comput. Environ. Urban Syst. 2018, 72, 13–24. [Google Scholar] [CrossRef]
- Lan, F.; Gong, X.; Da, H.; Wen, H. How do population inflow and social infrastructure affect urban vitality? Evidence from 35 large- and medium-sized cities in China. Cities 2019, 100, 102454. [Google Scholar] [CrossRef]
- Liu, H.; Li, X.M. Understanding the Driving Factors for Urban Human Settlement Vitality at Street Level: A Case Study of Dalian, China. Land 2022, 11, 20. [Google Scholar] [CrossRef]
- Guo, X.; Chen, H.F.; Yang, X.P. An Evaluation of Street Dynamic Vitality and Its Influential Factors Based on Multi-Source Big Data. ISPRS Int. J. Geo-Inf. 2021, 10, 19. [Google Scholar] [CrossRef]
- Fu, X.; Yu, G.; Liu, Z. Spatial–temporal convolutional model for urban crowd density prediction based on mobile-phone signaling data. IEEE Trans. Intell. Transp. Syst. 2021, 23, 14661–14673. [Google Scholar] [CrossRef]
- Ye, Y.; Li, D.; Liu, X.J. How block density and typology affect urban vitality: An exploratory analysis in Shenzhen, China. Urban Geogr. 2018, 39, 631–652. [Google Scholar] [CrossRef]
- Seong, E.Y.; Kim, H.M.; Kang, J.; Choi, C.G. Developing pedestrian cities: The contribution of land readjustment projects to street vitality in Seoul, South Korea. Land Use Policy 2023, 131, 106735. [Google Scholar] [CrossRef]
- Xia, C.; Yeh, A.G.-O.; Zhang, A. Analyzing spatial relationships between urban land use intensity and urban vitality at street block level: A case study of five Chinese megacities. Landsc. Urban Plan. 2020, 193, 103669. [Google Scholar] [CrossRef]
- Bordoloi, R.; Mote, A.; Sarkar, P.P.; Mallikarjuna, C. Quantification of Land Use Diversity in The Context of Mixed Land Use. Procedia—Soc. Behav. Sci. 2013, 104, 563–572. [Google Scholar] [CrossRef]
- Durand, C.P.; Andalib, M.; Dunton, G.F.; Wolch, J.; Pentz, M.A. A systematic review of built environment factors related to physical activity and obesity risk: Implications for smart growth urban planning. Obes. Rev. 2011, 12, e173–e182. [Google Scholar] [CrossRef] [PubMed]
- Sallis, J.F.; Cerin, E.; Conway, T.L.; Adams, M.A.; Frank, L.D.; Pratt, M.; Salvo, D.; Schipperijn, J.; Smith, G.; Cain, K.L.; et al. Physical activity in relation to urban environments in 14 cities worldwide: A cross-sectional study. Lancet 2016, 387, 2207–2217. [Google Scholar] [CrossRef]
- Mohareb, E.; Derrible, S.; Peiravian, F. Intersections of Jane Jacobs’ Conditions for Diversity and Low-Carbon Urban Systems: A Look at Four Global Cities. J. Urban Plan. Dev. 2016, 142, 05015004. [Google Scholar] [CrossRef]
- Ki, D.; Lee, S. Analyzing the effects of Green View Index of neighborhood streets on walking time using Google Street View and deep learning. Landsc. Urban Plan. 2021, 205, 103920. [Google Scholar] [CrossRef]
- Rzotkiewicz, A.; Pearson, A.L.; Dougherty, B.V.; Shortridge, A.; Wilson, N. Systematic review of the use of Google Street View in health research: Major themes, strengths, weaknesses and possibilities for future research. Health Place 2018, 52, 240–246. [Google Scholar] [CrossRef] [PubMed]
- Paköz, M.Z.; Yaratgan, D.; Şahin, A. Re-mapping urban vitality through Jane Jacobs’ criteria: The case of Kayseri, Turkey. Land Use Policy 2022, 114, 105985. [Google Scholar] [CrossRef]
- Fan, Z.; Duan, J.; Luo, M.; Zhan, H.; Liu, M.; Peng, W. How Did Built Environment Affect Urban Vitality in Urban Waterfronts? A Case Study in Nanjing Reach of Yangtze River. Int. J. Geo-Inf. 2021, 10, 611. [Google Scholar] [CrossRef]
- Yuan, X.; Chen, B.; He, X.; Zhang, G.; Zhou, C. Spatial Differentiation and Influencing Factors of Tertiary Industry in the Pearl River Delta Urban Agglomeration. Land 2024, 13, 172. [Google Scholar] [CrossRef]
- Gehl, J. Life between Buildings: Using Public Space; Island Press: Washington, DC, USA, 2011. [Google Scholar]
- Rastogi, A.; Sangal, A.L. Accident Risk Rating of Streets Using Ensemble Techniques of Machine Learning. In Innovations in Computer Science and Engineering; Saini, H.S., Sayal, R., Govardhan, A., Buyya, R., Eds.; Springer: Singapore, 2021; pp. 623–631. [Google Scholar] [CrossRef]
- Zhou, E.; Mao, S.; Li, M. Investigating Street Accident Characteristics and Optimal Safe Route Recommendation: A Case Study of New York City; IEEE: New York, NY, USA, 2017; pp. 1–7. [Google Scholar] [CrossRef]
- Mochizuki, A. Relationship between percieved greenery and width of visual fields. J. Inst. Telev. Eng. Jpn. 1987, 51, 1–10. [Google Scholar] [CrossRef]
- UNESCO. Recommendation on the Historic Urban Landscape. 2011. Available online: https://whc.unesco.org/en/hul/ (accessed on 11 June 2024).
Disclaimer/Publisher’s Note: The statements, opinions and data contained in all publications are solely those of the individual author(s) and contributor(s) and not of MDPI and/or the editor(s). MDPI and/or the editor(s) disclaim responsibility for any injury to people or property resulting from any ideas, methods, instructions or products referred to in the content. |
© 2024 by the authors. Licensee MDPI, Basel, Switzerland. This article is an open access article distributed under the terms and conditions of the Creative Commons Attribution (CC BY) license (https://creativecommons.org/licenses/by/4.0/).

