Abstract
The division of urban functional zones is crucial for understanding urban characteristics and aiding in urban management and planning. Traditional methods, like dividing based on blocks and grids, are insufficient for modern demands. To address this, a knowledge-graph-supported method for building functional category division is proposed. Firstly, the associations between points of interest (POI) and buildings are established using triangulation and buffer zones. Then, a knowledge graph of buildings is constructed through entity and relationship extraction. A functional category classification model supported by the Z-score is designed using the semantic characterizations of surrounding POIs for inference rules. The results demonstrate high accuracy in building functional category division, supporting the refinement and intelligent expression of urban functional zones for urban construction, planning, and management.
1. Introduction
Urban functional zones serve as crucial spatial components for fulfilling various economic functions within cities. Different types of functional zones contribute to the formation of distinct urban spaces [1,2]. Accurate classification of these zones provides essential data support for urban management, planning, land policy formulation, and residents’ daily lives [3,4,5]. Research on urban functional zone classification primarily focuses on utilizing diverse datasets including POI data, trajectory data, and hyperspectral remote sensing imagery to classify spatial boundaries and identify zones with similar urban characteristics or functions in order to effectively describe urban morphologies [6,7,8,9,10]. Among these approaches, POI data have received increasing attention due to their rich semantic features, low acquisition cost, high timeliness, and high presentationality [10,11,12,13,14].
Numerous studies have been conducted by scholars to explore the effective utilization of POI data for delineating and understanding urban functional zones, yielding notable results. For instance, Deng et al. [10] employed grids as classification units and functional categories to analyze urban traffic patterns. Meanwhile, Deng et al. [12] established urban functional zones by calculating the proportion of POI categories within each grid. Similarly, Chen et al. [13] identified neighborhood functional categories using POI data, facilitating the evaluation of urban planning and design effectiveness. Additionally, Du et al. [14] correlated POI data with zones delineated by the road network, enabling the classification of functional categories and further investigation into the driving factors behind urban heat island phenomena. A comprehensive analysis of the aforementioned literature reveals that many existing methods for delineating urban functional zones rely on dividing the study area into grids or blocks as basic spatial units. These methods then generalized the functional attributes of POIs within these units to generate functional zones. However, utilizing grids or neighborhoods as basic spatial units may pose challenges such as inaccurate classification of functional categories due to the large spatial extent of these units and limited correlation with POI data.
Functional zone classification based on traditional spatial units is no longer sufficient to meet the current demand for refined and intelligent urban construction, management, and planning [15,16]. The increasingly complex and diversified internal structures of cities are driving the demand for more refined spatial units, as seen in current smart city and real-life three-dimensional construction scenarios. Buildings are crucial for people’s production, life, and urban economic development [15]. Building data, serving as the fundamental spatial cognitive objects in urban morphology and structure, play a crucial role in numerous practical applications, including urban planning, land use analysis, population estimation, etc. [17]. POI data, which are closely tied to buildings, exhibit a strong spatial correlation with building data. Utilizing POI data enriched with semantic features to classify the functional categories of building spatial units contributes to a more refined and precise expression of urban functional zones, enhancing the granularity perceived within a city [9,16]. However, achieving this refined expression often necessitates efficient processing of vast amounts of building and POI data. Automating or even imbuing intelligence into the task of classifying building functional categories is pivotal to enhancing the capability for fine-grained urban functional zone delineation.
Knowledge engineering offers a novel solution for efficiently processing large datasets, advancing data processing from automation to intelligence. The knowledge graph, a significant outcome of knowledge engineering since its inception by Google in 2012 [18,19], has revolutionized critical fields such as intelligent searches, Q&A, and recommendations. It functions as a semantic network and knowledge base with a directed graph structure that explicates entities (concepts) and their relations in the physical world through ternary <Entity, Relation, Entity> [18] representations, thereby empowering computers with explainable, comprehensible, and rational intelligence [20]. In recent years, scholars have increasingly applied knowledge graphs in geoscience, particularly in geographic information retrieval [21,22], spatio–temporal information mining [23], epidemic prevention, and disaster management [24,25]. However, effectively applying knowledge graphs to classify building functional categories remains an area ripe for further exploration, promising to enhance the refinement and intelligent expression of urban functional zones. Leveraging the advantages of a comprehensive knowledge graph based on POI data and building data with rich semantic characterizations enables the establishment of a POI semantic characterization knowledge graph. This knowledge graph can classify building space units into functional categories, enhancing the refinement and intelligent of urban functional zone expressions and improving the perceived granularity of cities [9,16].
Therefore, to achieve a more refined and intelligent expression of urban functional zones, we propose a method supported by a POI semantic characterization knowledge graph for classifying the functional categories of buildings. The approach involves designing a Delaunay triangular network combined with buffer zones to match buildings with POIs. Subsequently, entity extraction and relation establishment are used to construct a knowledge graph. Furthermore, a Z-score-supported functional category delineation model is developed to enhance the rationality of the functional category delineation results. Combined with the functional category classification model, a building functional category reasoning method is designed to effectively reason about building functional categories. Finally, the effectiveness of this method is validated through experiments, aiming to advance the refinement and intelligent division of urban functional zones and elevate the service level of urban management and planning.
2. Methodology
We propose a POI semantic characterization knowledge-graph-supported method for classifying the functional categories of buildings. The method takes buildings as the main spatial unit for constructing the building knowledge graph and achieves the reasoning of building functional categories by designing category reasoning rules. Figure 1 illustrates the main flow of the method. Initially, a Delaunay triangular network combined with buffers is employed to match buildings and POIs. Subsequently, entity extraction and relation extraction operations are conducted to construct the necessary knowledge graph. A functional category classification model with Z-score support is then developed. Combined with the Z-score functional classification model, the building functional category reasoning rules are designed for the two cases of matched and unmatched POIs, respectively, so as to realize the effective reasoning of building functional categories.
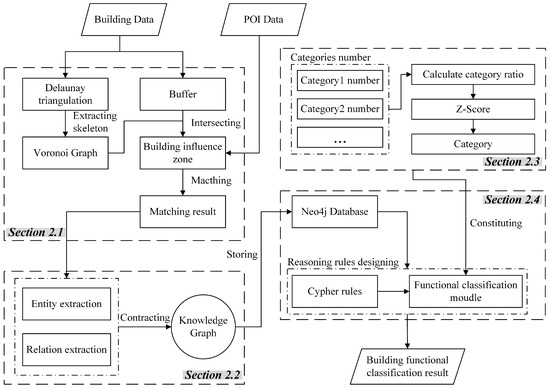
Figure 1.
Main process for automatic classification of building functional categories supported by POI semantic characterization knowledge graph.
2.1. Building and POI Matching
Due to the crowdsourcing nature of POI production, ensuring the quality of POI data can be challenging. Common issues include location offsets, missing data, and non-standardized attributes. Additionally, the spatial distribution of POIs is often uneven, with zones like large shopping malls having a higher concentration of POIs, while larger industrial parks, neighborhoods, and campuses may have sparser distributions. These factors often result in the absence of POI distributions inside many buildings or the displacement of the original POIs from the inside to the outside of buildings, as depicted in Figure 2.

Figure 2.
Spatial distribution of POI data.
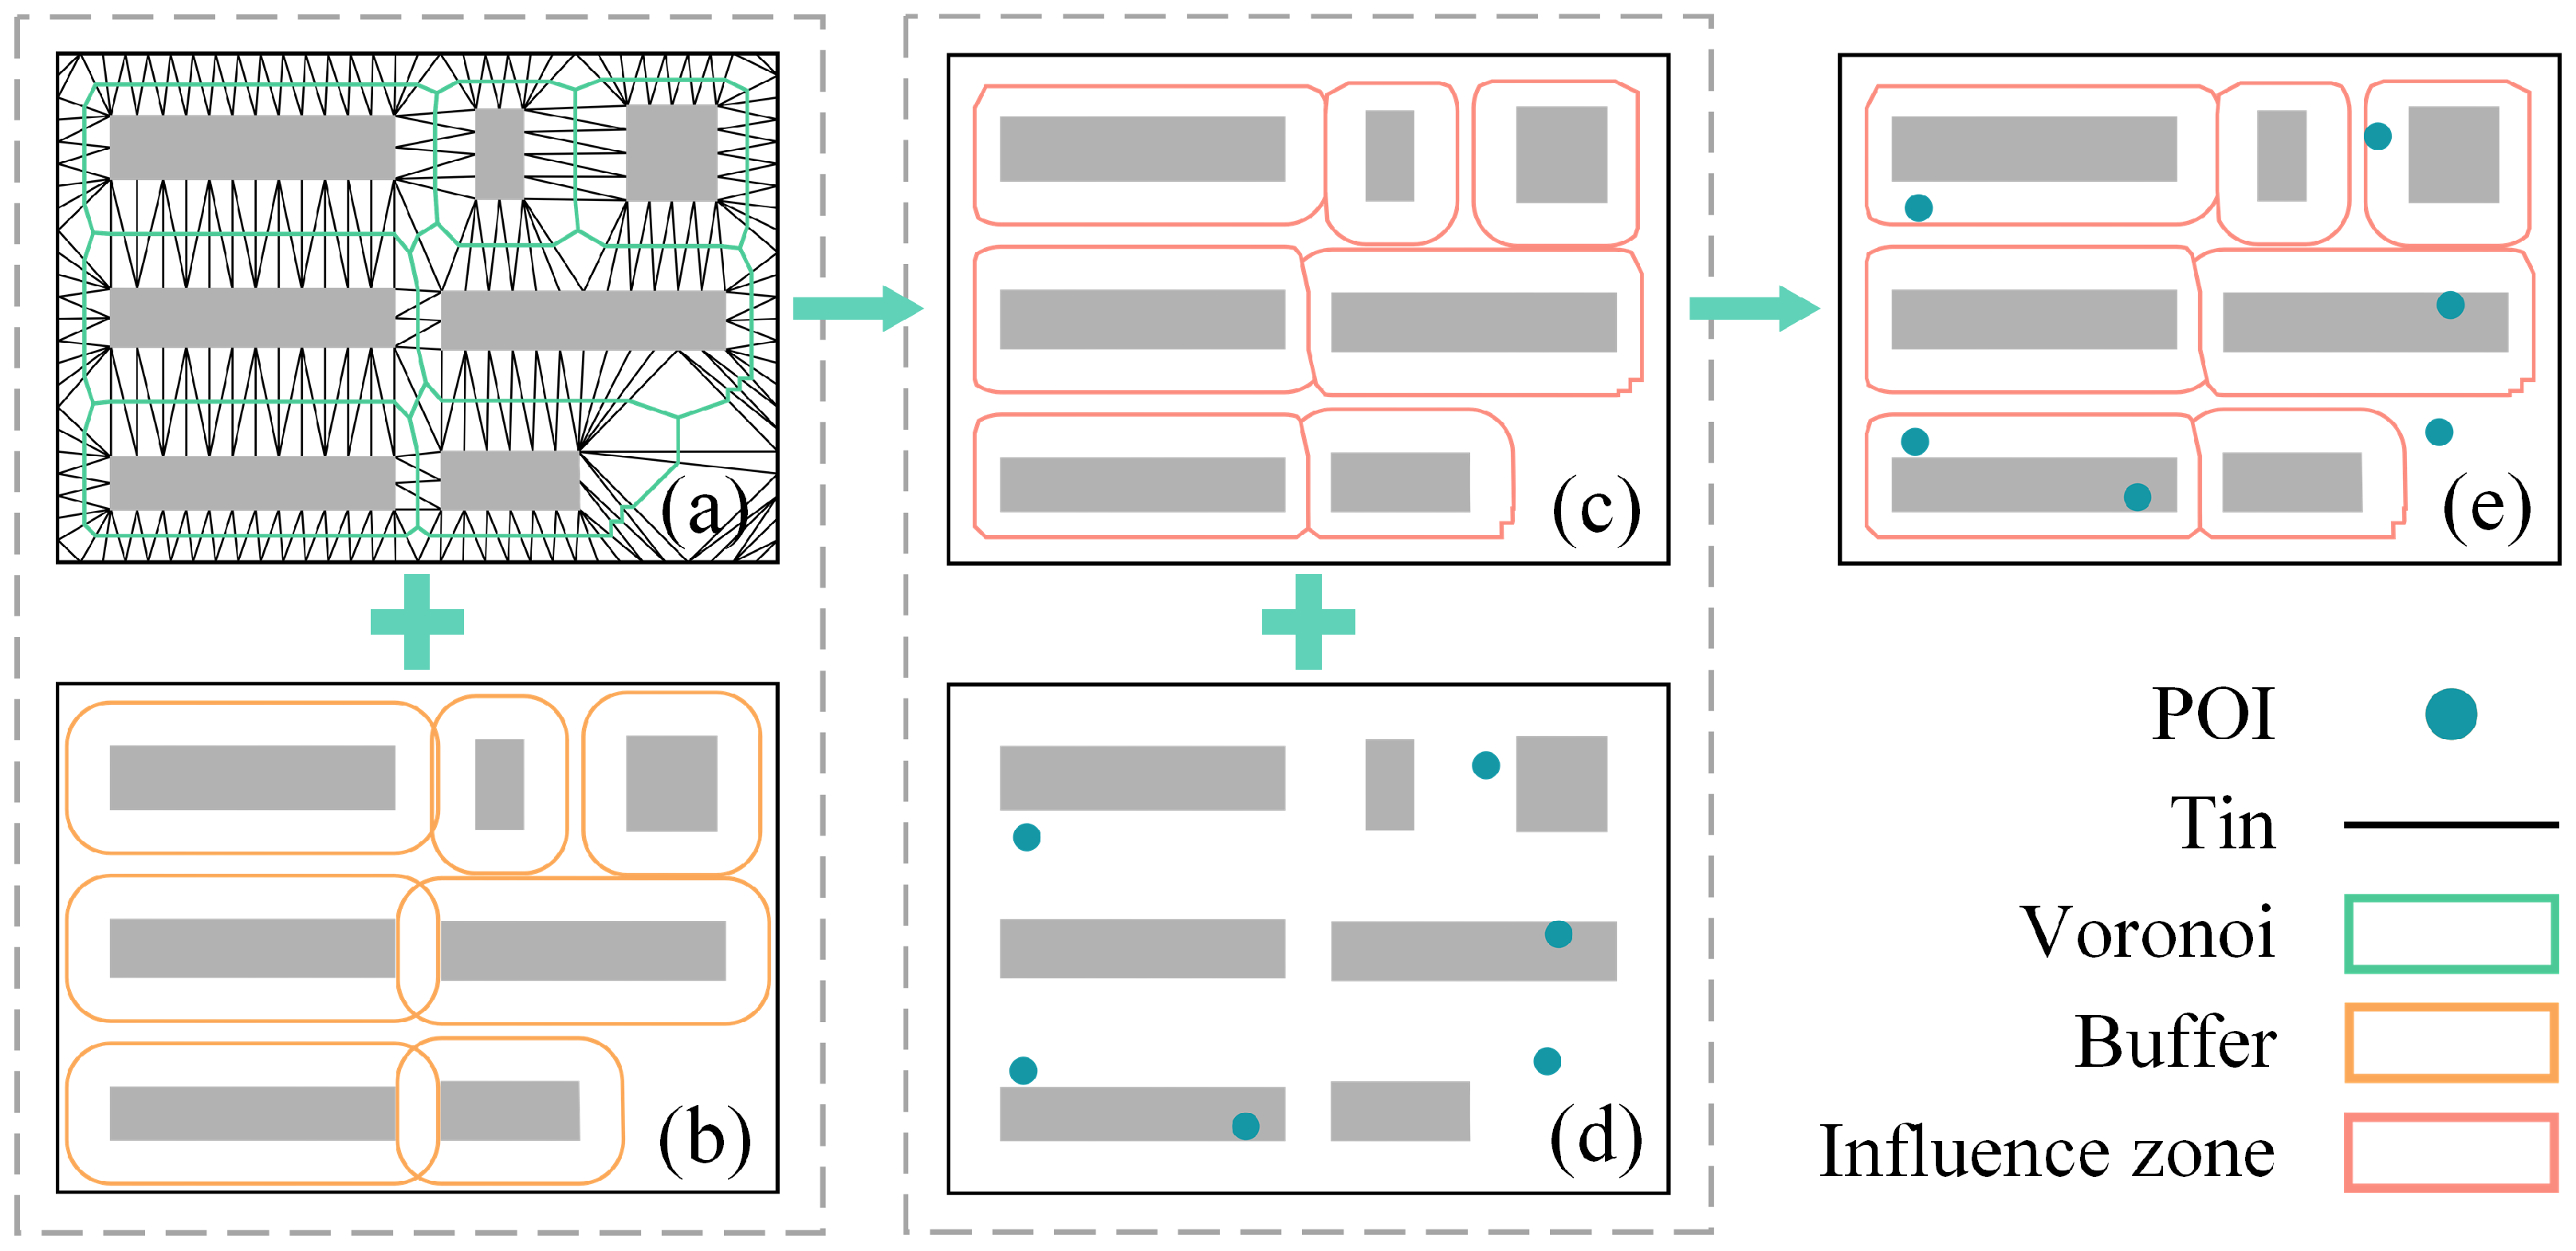
To facilitate the classification of building functional categories, it is crucial to effectively correlate POIs with buildings. Determining the influence zone of buildings is a key prerequisite for this association. Existing methods often rely on Delaunay triangulation networks or buffer zones to determine the influence zone of buildings [26]. The Delaunay-based method effectively dissects the space where buildings are situated while considering their topological relations (Figure 3a). However, it overlooks the influence of distances, potentially resulting in POIs that are located farther away from buildings being erroneously classified within the influence zone. On the other hand, the buffer-based method takes into account the influence of distance on the building, but it does not consider the topological relation of the building when constructing the influence zone (Figure 3b). Consequently, we propose a hybrid approach that combines Delaunay triangular networks and buffer zones to establish the association between buildings and POIs. The main process is as follows:

Figure 3.
The process of establishing the relations between POIs and buildings.
- Step 1.
- We construct a Delaunay triangular network of the building and extract skeleton lines to form a Voronoi surface based on the Delaunay triangular network (Figure 3a).
- Step 2.
- We create a buffer zone around the building based on a distance threshold dis_thresh (determined by analyzing building spacing in Shanghai and consulting the relevant literature [15,27,28], typically set to 10 m). The result is depicted in Figure 3b.
- Step 3.
- We intersect the Voronoi polygon obtained from Step 1 and the buffer zone obtained from Step 2 with the building to determine the influence zone of the building, as shown in Figure 3c.
- Step 4.
2.2. Building Knowledge Graph Construction
Buildings, as a typical geographic element, should be constructed with careful consideration of their proximity relations and geographic attributes when integrating them into a knowledge graph. Therefore, when developing a POI semantic characterization knowledge graph, it is essential to accurately define and express the attributes of entities and relations. Simultaneously, it is crucial to define and express the attributes of entities and relations effectively. We designed a knowledge graph structure, as illustrated in Figure 4, which encapsulates various relations. These include proximity relations between buildings (e.g., <B1, , B2>), containment relations between buildings and points of interest (POIs) (e.g., <B2, , P1>), relations between building entities and categories (e.g., <B2, , C1>), attribute information contained in entities and relations, etc.

Figure 4.
Structural design of POI semantic characterization knowledge graph.
2.2.1. Proximity Relation
Proximity relations serve as a crucial foundation for the construction and application of geographic knowledge graphs [29,30,31]. It is essential to choose an appropriate method for constructing proximity relations when building knowledge graphs. Thanks to its robust ability to detect proximity relations, the Delaunay triangular network is frequently utilized in detecting building proximities [26,32]. For this purpose, the Delaunay triangular network is employed to establish building proximity relations, as depicted in Figure 5. The Delaunay triangular network of building nodes is constructed, and then the building proximity graph is formed by determining the presence of shared triangles between buildings. represents the set of building nodes, where indicates the set of proximity relations between nodes, with denoting that buildings and are in proximity to each other (i.e., there exists a proximity relation ) or ).
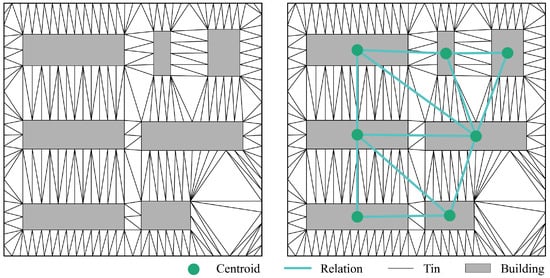
Figure 5.
The construction of building proximity relations.
2.2.2. Entity Properties
For the construction of building entities, POI entities, and functional category entities, their respective attributes are documented in Table 1. Geometric information for these entities is stored in well-known text (WKT) format, exemplified by POINT(13535970.6954 3668878.2461), representing a specific point in the spatial reference. The spatial reference system conforms to the geographic coordinate system and projection standards established by the European Petroleum Survey Group (EPSG), such as EPSG:3587, indicating the widely utilized Web Mercator projection. This projection, renowned for its isometric cylindrical format, is prevalent in online map services and web map applications. The “functional_category” attribute for POI entities is typically classified into categories like “public”, “commercial”, and “residential”.

Table 1.
Properties of the entities.
2.2.3. Relation Property
The proximity relation between building entities, serving as the primary relation, and its associated attributes are depicted in Table 2. For buildings B1 and B2 with a proximity relation, the minimum distance from all vertices on B1 to B2, denoted as minDis1, and the minimum distance from all vertices on B2 to B1, denoted as minDis2, are calculated to determine the shortest distance min(minDis1, minDis2) as detailed in [33], which is documented in the field “min_distance”. The “is_intersect” field is utilized to indicate whether B1 and B2 intersect: “True” is recorded if they intersect; otherwise, “False” is recorded.
Table 2.
Properties of the proximity relation.
2.3. Building Functional Classification Model
A POI, as a type of geographic entity, expresses the name, functional category, spatial location, and other attributes of the geographic entity. Analyzing the category ratios (CRs) of various POI functional categories within a building’s sphere of influence enables the determination of the building’s functional category; the CRs are calculated as shown in Equation (1).
where denotes the percentage of the number of POIs in category i, denotes the number of POIs in category i, and N denotes the total number of POIs within the building’s sphere of influence.
After calculating the percentage for each functional category of the POI, the classification of the building’s functional category is conducted. The common method involves using 0.5 as the threshold for categorization. If a category has a greater than 0.5, then this is considered the building’s functional category; if all values are less than 0.5, the building is recognized as having mixed functionality. While this method accurately divides functional categories in most cases, it sometimes yields unreasonable results. For example, when the type proportions are , , , using the 0.5 threshold would incorrectly categorize the building as belonging to the first category. However, considering the overall values, it is more reasonable to classify the building as having a mixed functional category consisting of categories 1 and 2. Therefore, we designed a building functional category classification model based on the Z-score [34,35]. The main classification process is as follows:
- Step 1.
- Calculate the mean E and standard deviation S of each category share .
- Step 2.
- Calculate the Z-score value for each category share .
- Step 3.
- Obtain the maximum value in and record the functional category corresponding to . Further determine the functional category of the building by comparing the magnitude of and 1.
- Step 4.
- If , then determine the building functional category as .
- Step 5.
- If , then determine the building functional category as mixed type. Identify the functional functional categories that satisfy the condition and classify the building as a mixed functional zone composed of these categories.
The Z-score is a method used for detecting outliers in a one-dimensional or low-dimensional space. It evaluates the distance between a sample point and the overall mean. The main application of the Z-score is to measure how many standard deviations the original data differs from the overall mean, as calculated in Equation (2). When applied to the problem of classifying the functional categories of buildings, the percentage for for the corresponding functional category of a single functional category building should be higher than the percentages of other functional categories. Otherwise, the building is classified as a mixed functional category. Since takes the value in the range of [0,2), taking as the condition can effectively identify the functional category of the building.
2.4. Rule-Based Reasoning for Functional Classes of Buildings
Mining valuable hidden knowledge from large-scale data relies on the support of reasoning techniques [36], and Neo4j, as a knowledge graph storage, management, and reasoning tool [37,38,39], is often used for geographic knowledge graph storage and reasoning [40,41,42]. Based on the Cypher query language provided in Neo4j, users can achieve efficient queries with customized rules [37]. Matching buildings with POIs based on the method described in Section 2.1 results in two scenarios: buildings with POI matches or buildings with no POI matches. The buildings in these two cases are analyzed separately, and the corresponding reasoning rule design is developed to realize the recognition of the functional categories of the buildings.
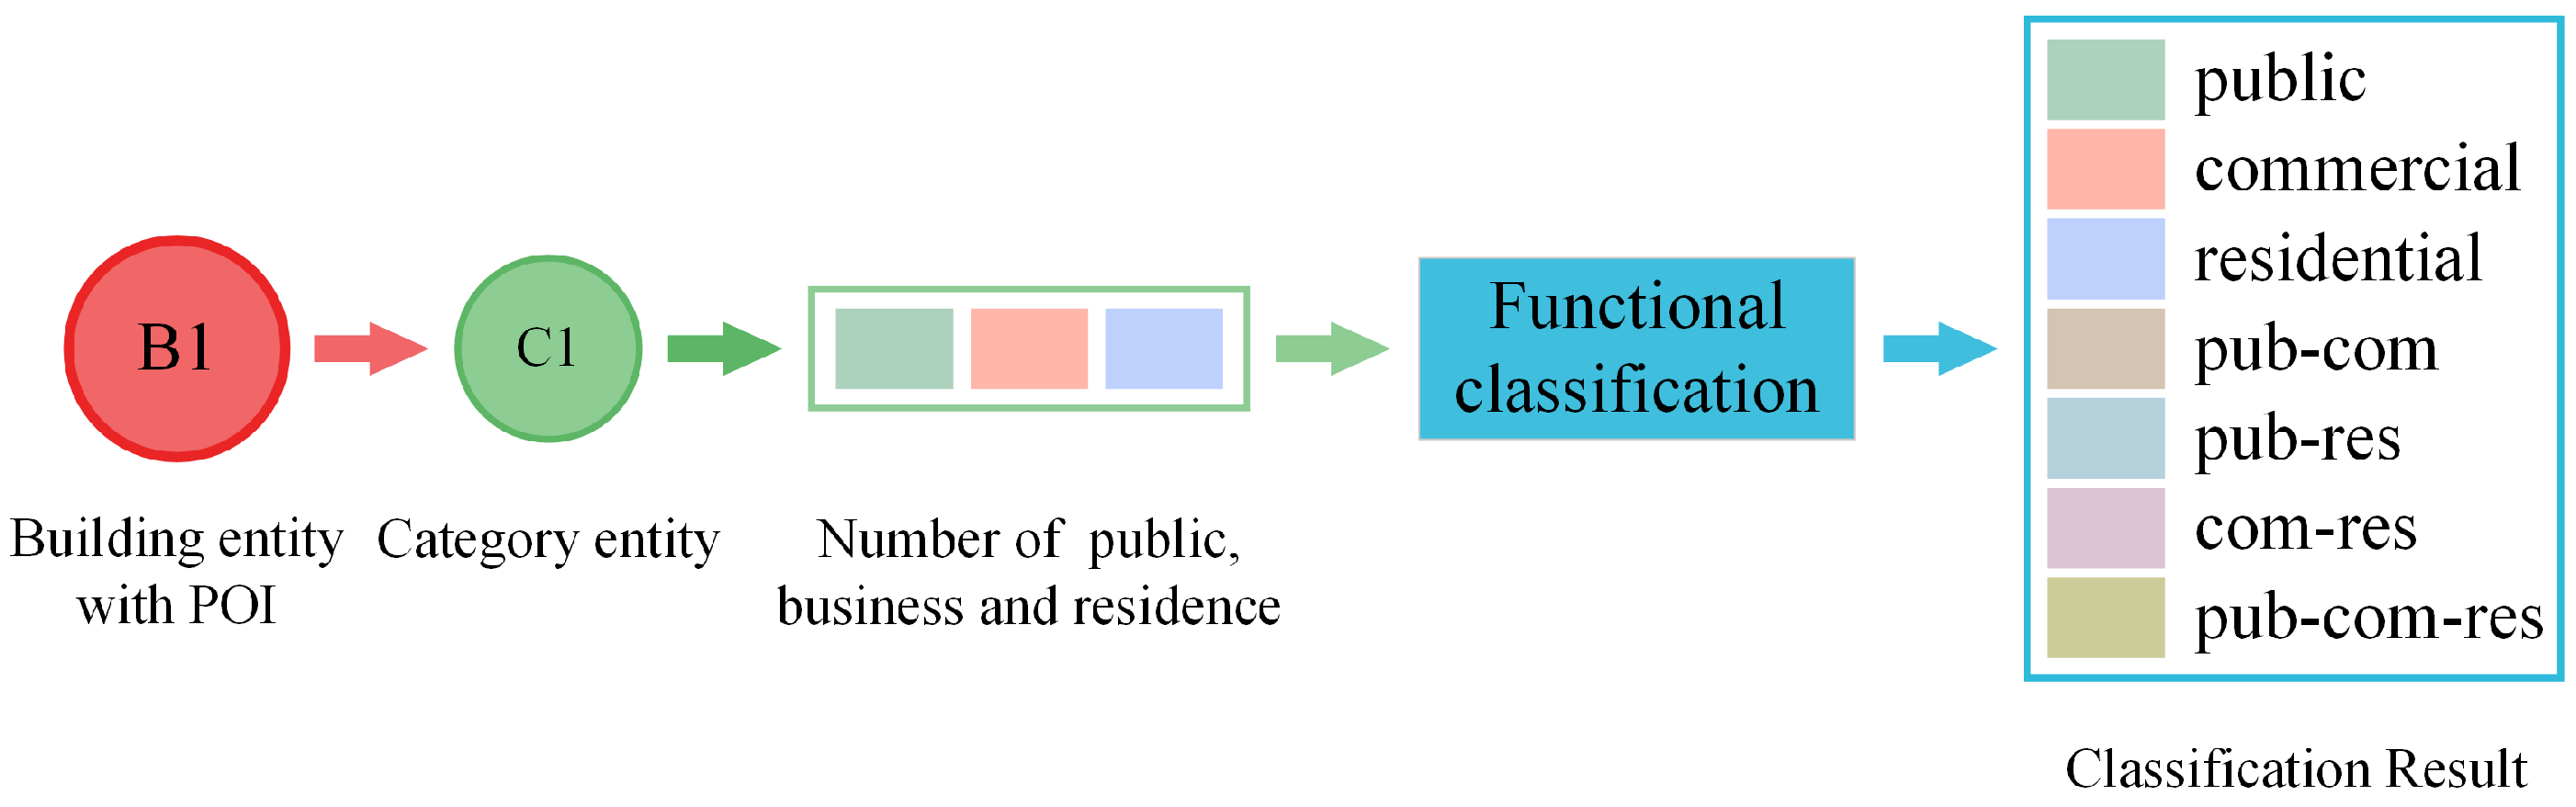
2.4.1. Category Reasoning for Buildings with Matched POIs
The reasoning for building categories with matched POIs mainly consists of the following process (Figure 6):

Figure 6.
Category reasoning process for buildings with unmatched POIs: “pub-com” denotes a mixed function category containing “public” and “commercial”; “pub-res” denotes a mixed function category containing “public” and “residential”; “com-res” indicates a mixed function category containing “commercial” and “residential”; “pub-com-res” indicates a mixed function category containing “public”, “commercial”, and “residential”.
- Step 1.
- The building entities are reasoned to obtain the buildings that include POIs in the influence zone. For example, the building entity B1 with the attribute “include_poi” set to “True” is reasoned to obtain the buildings in the influence zone that include POIs.
- Step 2.
- Based on the building entity B1 obtained in Step (1), further reasoning is performed to obtain the category entity “category entity” C1 that has a “has_category” relation with the building entity.
- Step 3.
- The maximum value in is obtained, and the functional category corresponding to is recorded. The functional category of the building is further determined by comparing the magnitude of to 1.
- Step 4.
- Reasoning is done on the category entity C1 obtained from Step (2) to obtain the attribute values in for the fields “public_number”, “commercial_number”, “residential_number” in the entity, and the category array is constructed.
- Step 5.
- The obtained building category array is subjected to category prediction using the method from Section 2.3 to obtain the functional category of building B1.
2.4.2. Category Reasoning for Buildings with Unmatched POIs
The reasoning for building categories with unmatched POIs mainly consists of the following process (Figure 7):
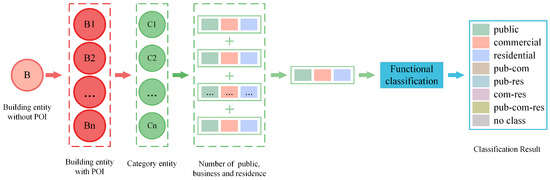
Figure 7.
Category reasoning process for buildings with unmatched POIs: “pub-com” denotes a mixed function category containing “public” and “commercial”; “pub-res” denotes a mixed function category containing “public” and “residential”; “com-res” indicates a mixed function category containing “commercial” and “residential”; “pub-com-res” indicates a mixed function category containing “public”, “commercial”, and “residential”; “no class” denotes not categorized.
- Step 1.
- The building entities are reasoned to obtain the buildings that include POIs in the influence zone. For example, building entity B with the attribute “include_poi” set to “False” is reasoned to obtain the buildings in the influence zone that include POIs.
- Step 2.
- Proximity building reasoning is performed on building B, and the proximity building group that has a “has_proximity” relation with B and the attribute “include_poi” set to “True” is obtained. The proximity buildings with a “has_proximity” relation with B and the attribute “include_poi” set to “True” are identified.
- Step 3.
- Based on the building group obtained in Step (2), category inference of building entities is performed to obtain the corresponding category entity group .
- Step 4.
- For the category entity group in Step (3), reasoning is performed to obtain the attribute values , , and of the entities with the field names “public_number”, “commercial_number”, and “residential_number”, respectively, and the corresponding category array is constructed.
- Step 5.
- The elements in the category array in Step (4) are summed to get a new category array .
- Step 6.
- Category reasoning is performed on the obtained building category array using the method in Section 2.3 to obtain the functional category of building B.
3. Experiments and Results
3.1. Study Area and Data
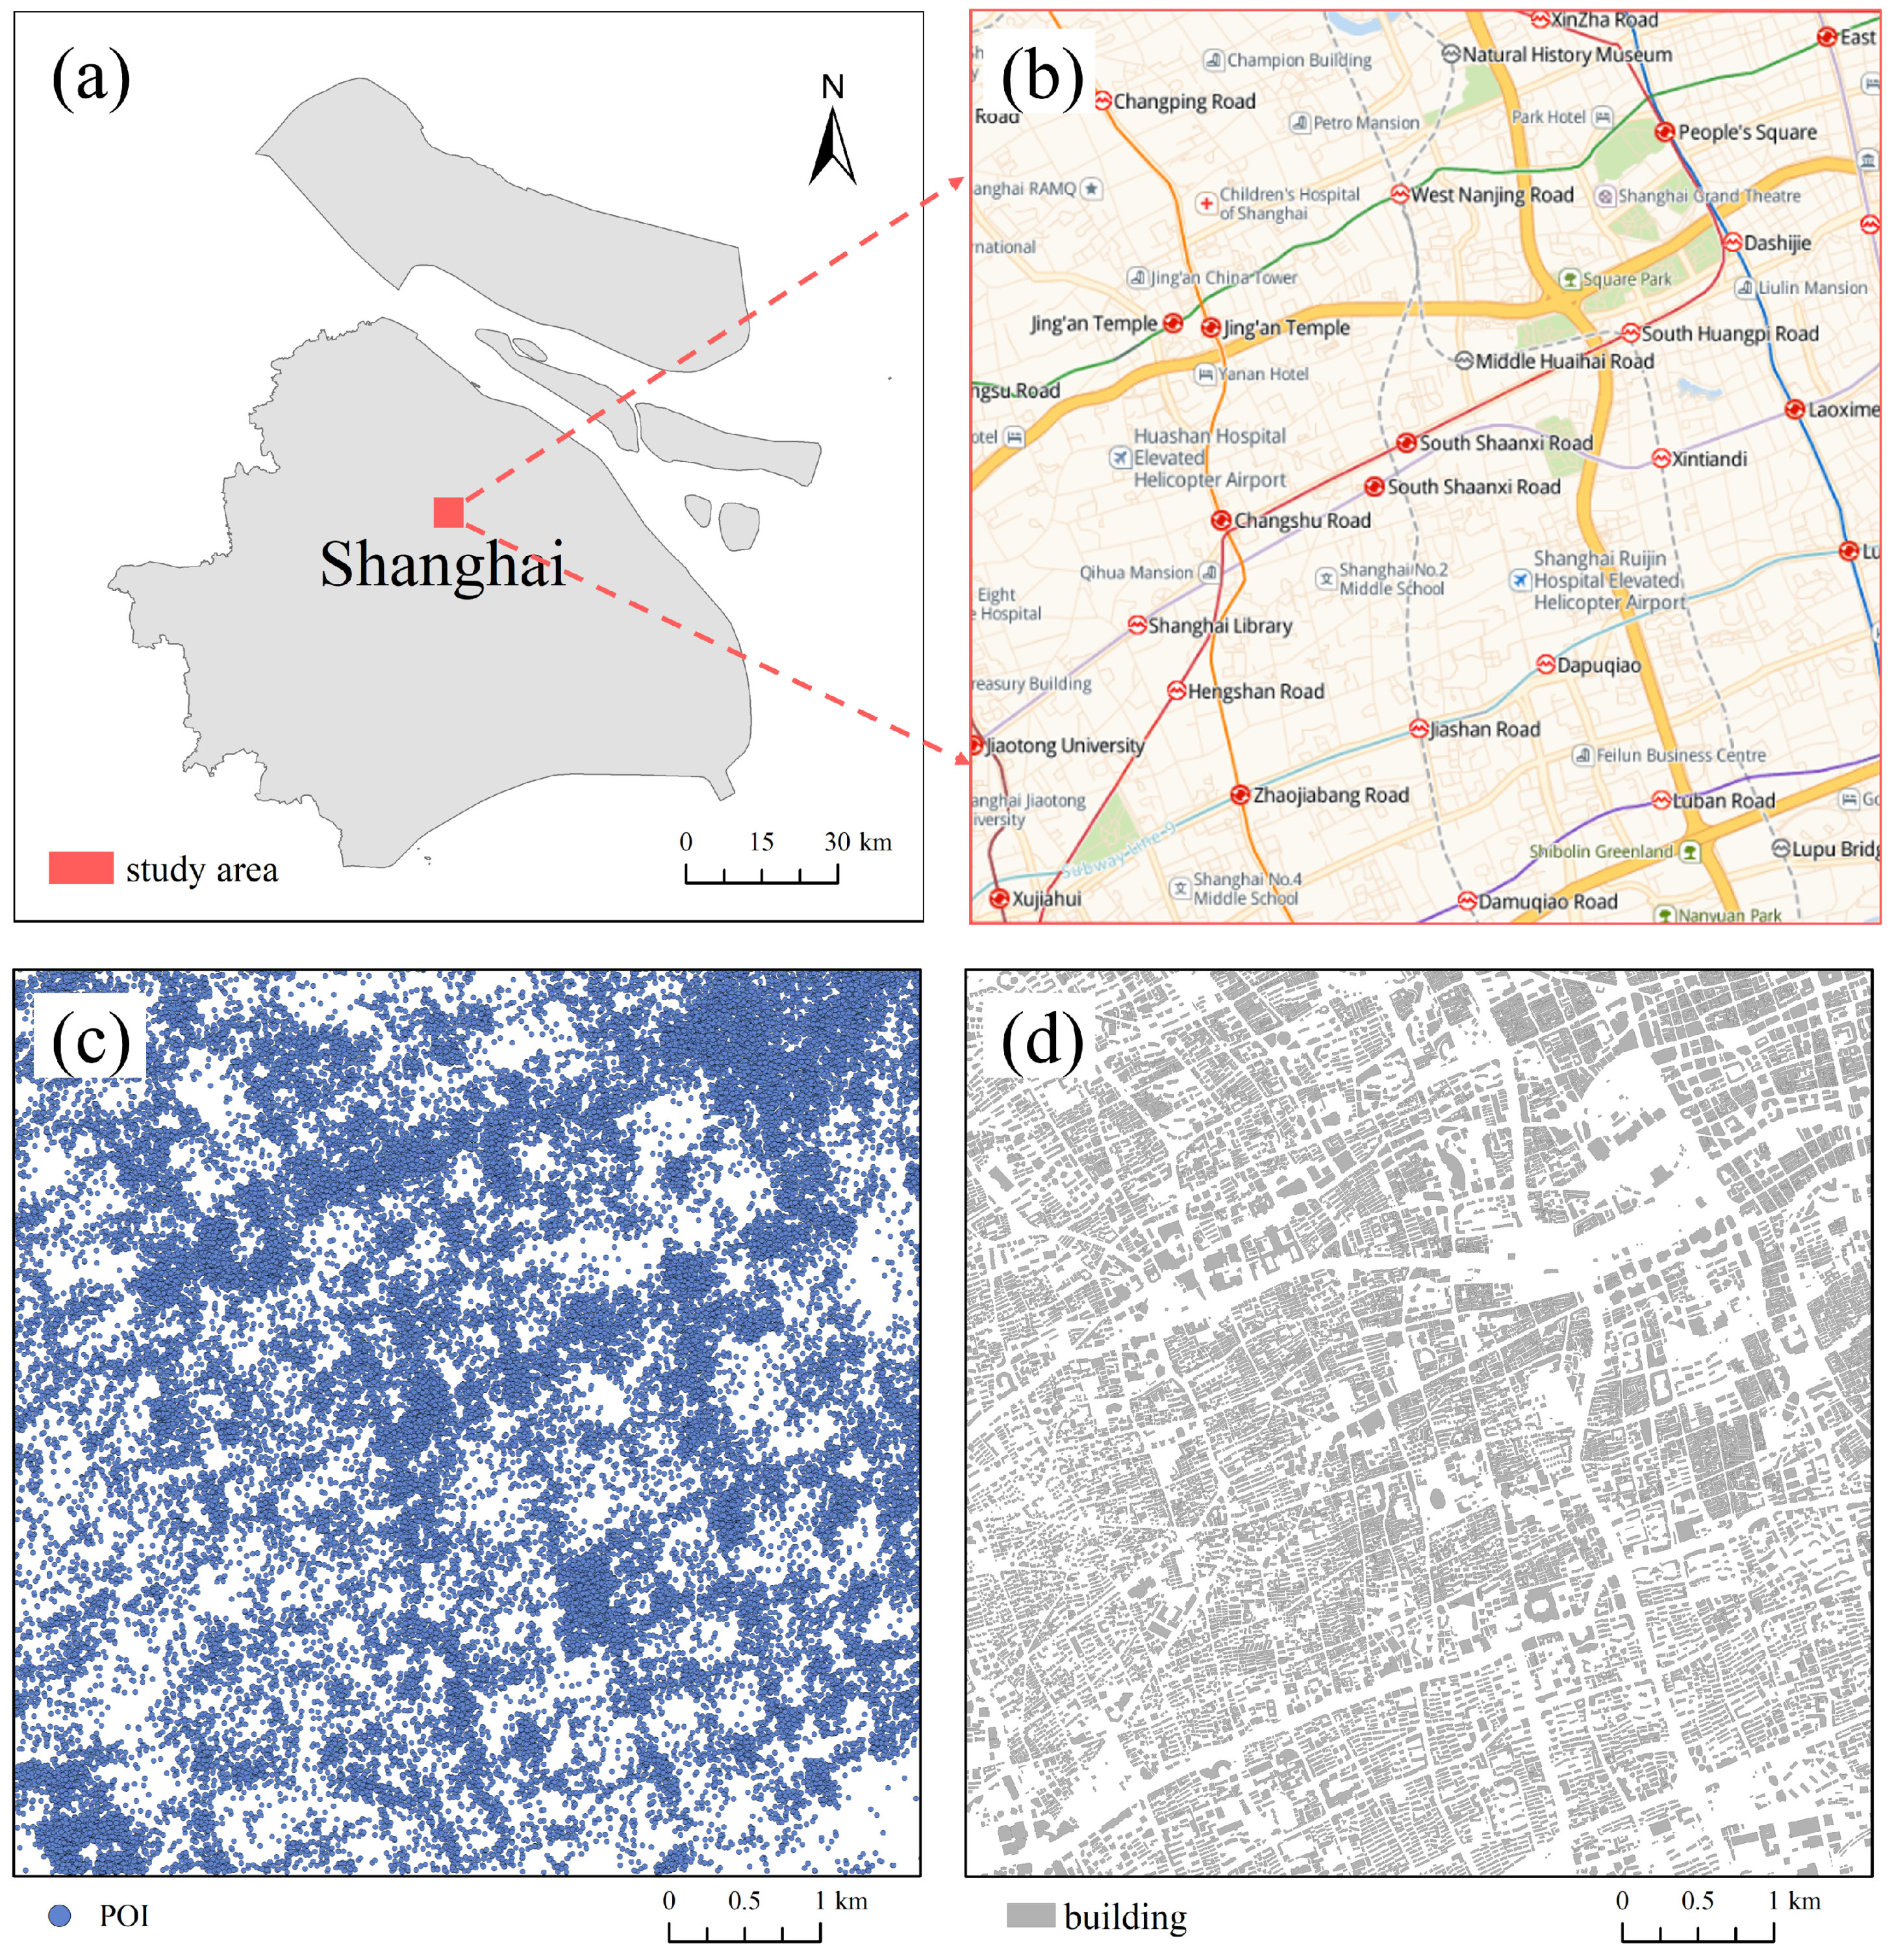
The study area covers a 6 km × 6 km zone within the main city of Shanghai, China, as shown in Figure 8a. As a professional digital map provider in China, Amap (https://ditu.amap.com/) has spatial data services at multiple scales and is also an important data source for carrying out related scientific research activities. POI data and building data on Amap were collected, and 47,291 POI data (Figure 8c) and 14,281 building data (Figure 8d) were obtained, with the data acquisition time being April 2024.
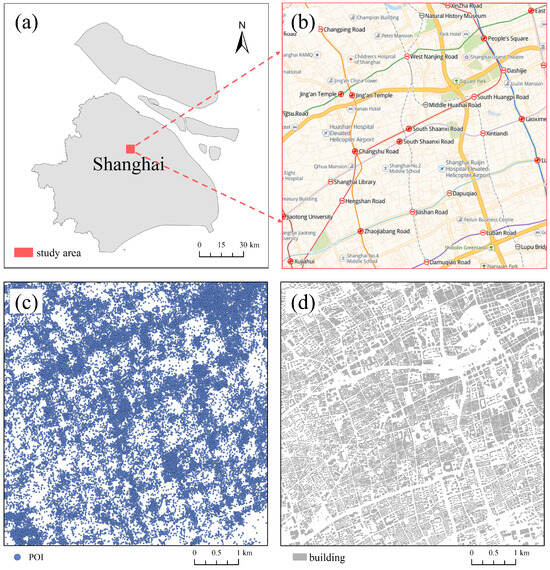
Figure 8.
Study area and data. (a) Location of the study area. (b) Details of the study area. (c) Distribution of POIs in the study area. (d) Distribution of buildings in the study area.
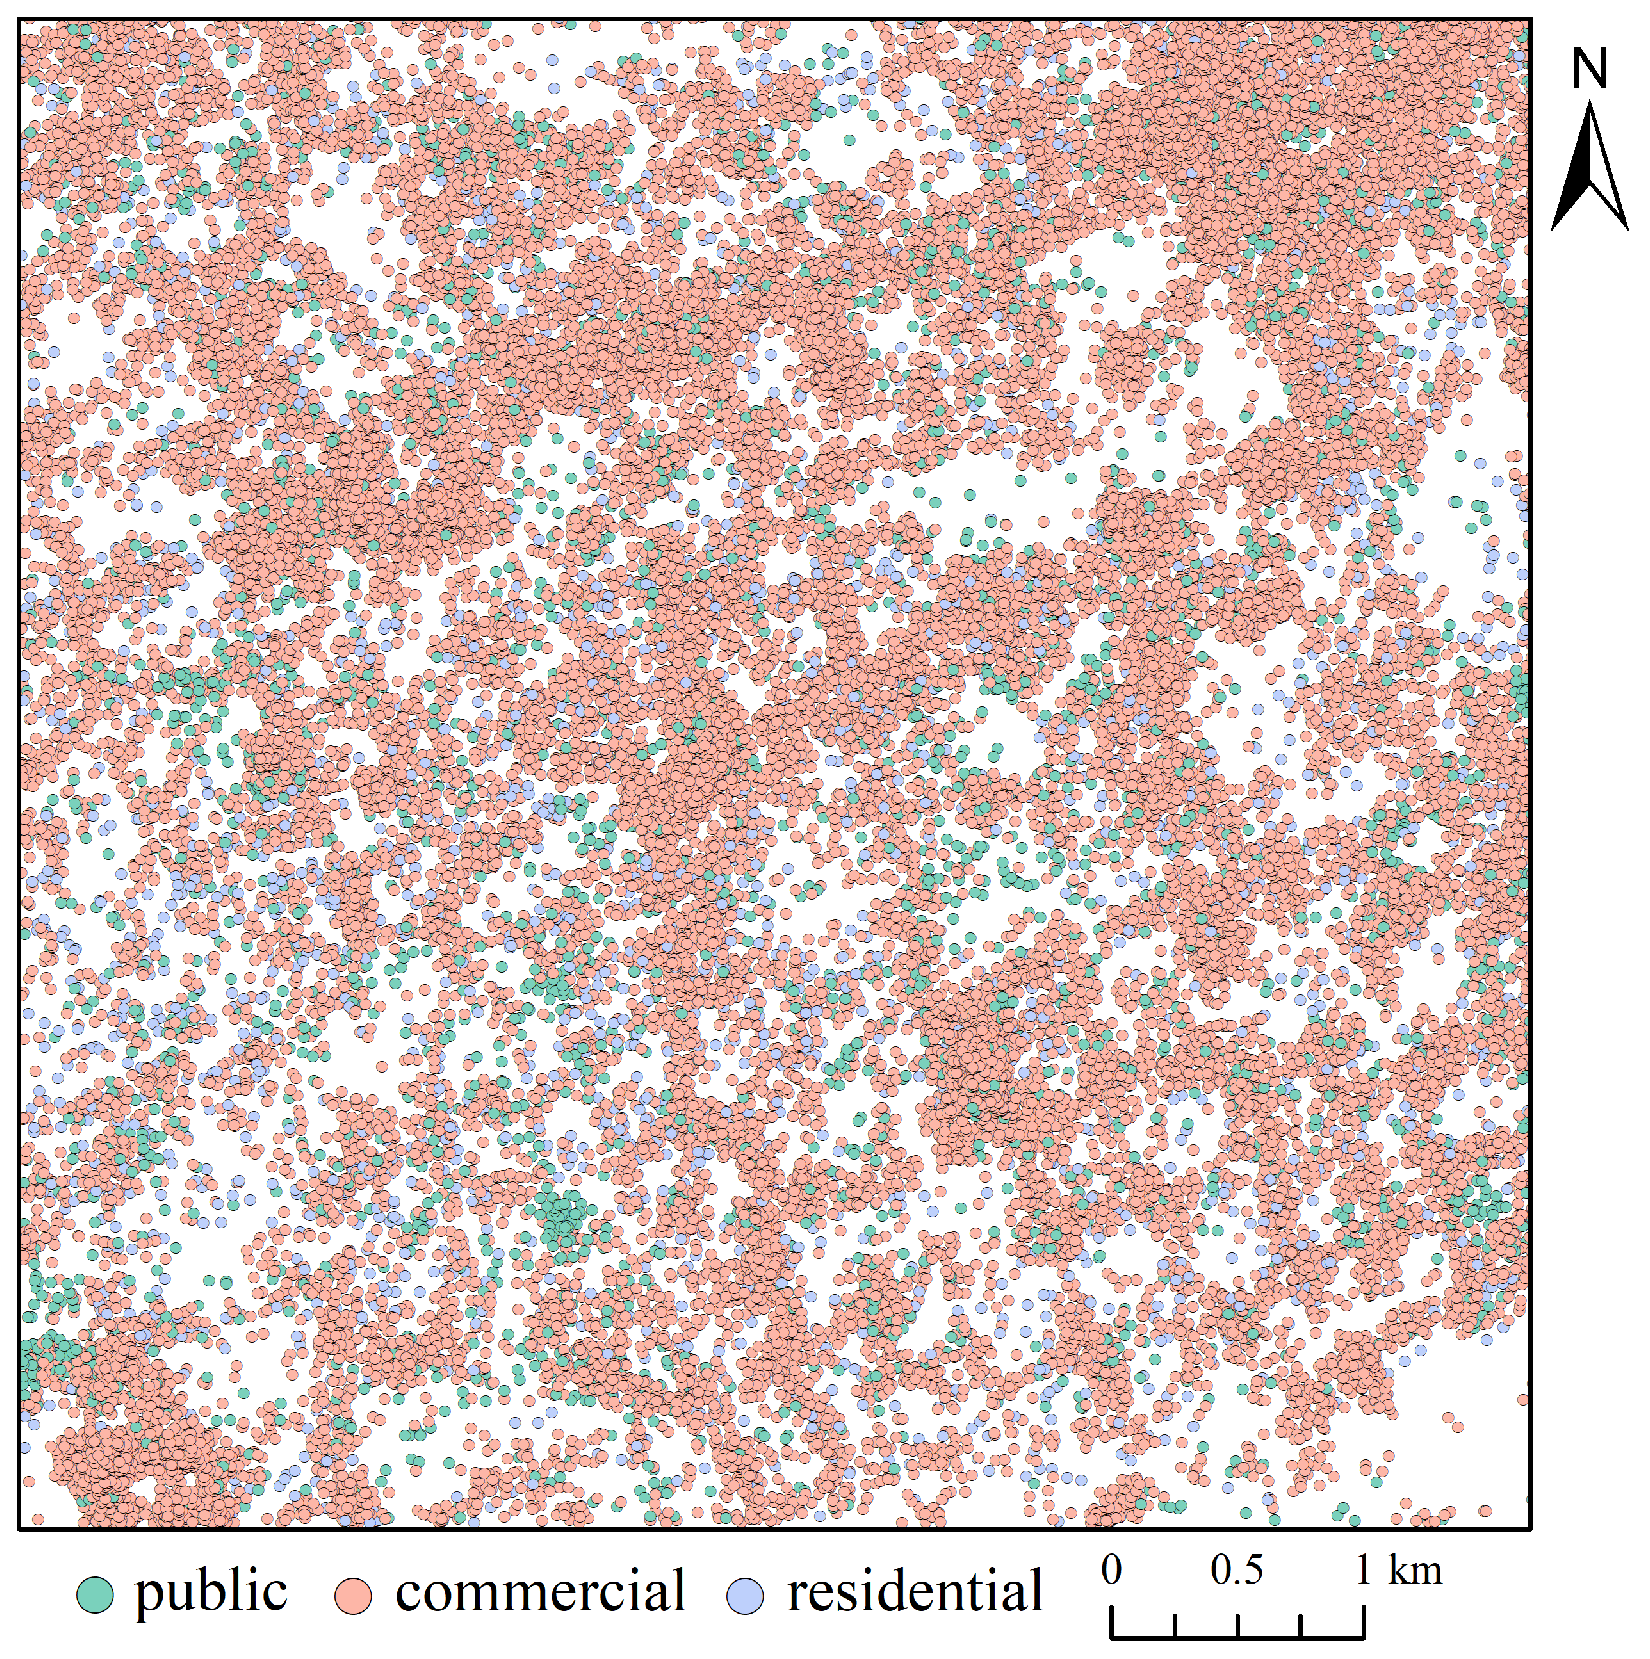
POI data mainly include information such as ID, name, type, address, latitude, and longitude. As the original POI data were more complex, there were some POIs with lower cognition, which affected the inference effect for building functional categories to a certain extent. Therefore, it was necessary to remove some points with low cognition, such as convenience stores, public restrooms, ATMs, bus stops, etc., from the original data with reference to Du et al. [14] and Cao et al. [17]. And the remaining POI points were reclassified with reference to the “Code for classification of urban and rural land use and planning standards of development land (GB50137)”. We classified POI data into three categories: public, commercial, and residential. After reclassifying POIs, a total of 43,726 POI data points were obtained (Table 3), and the spatial distribution is shown in Figure 9.
Table 3.
POI reclassification results.
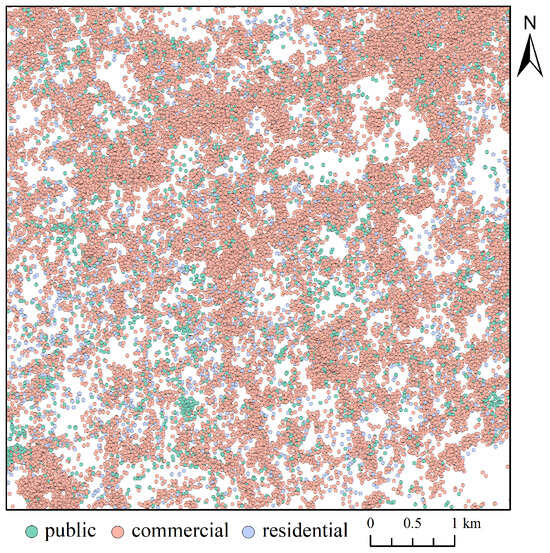
Figure 9.
Spatial distribution of POI reclassification results.
3.2. Experimental Setting
In this study, the Python language was used for processing building data and extracting relations, Neo4j was used for storing knowledge graphs, and the Cypher language in Neo4j was used for knowledge reasoning. The experimental equipment used included a Gold 6226R CPU, 126 GB of memory, and the Windows 10 (64-bit) operating system.
3.3. Results of Knowledge Graph Construction
The main process of POI semantic characterization knowledge graph construction proceeded as follows: Firstly, the method outlined in Section 2.1 was employed to match buildings and POIs, establishing the “has_poi” relations between building and POI entities. Next, POI entities linked via the “has_poi” relations with building entities were categorized and tallied. Subsequently, POI entities categorized as “public”, “commercial”, or “residential” were used to construct category entities that were linked by “has_category” relations with buildings. A Delaunay triangulation network was utilized to detect building proximities and establish the “has_proximity” relation between building entities. Finally, Neo4j was utilized to store the acquired entities and relations, as depicted in Figure 10, showcasing part of the knowledge graph construction results. The scale of the specific knowledge graph is outlined in Table 4, revealing 14,281 building entities and 8242 category entities and indicating extensive associations between building and POI entities.
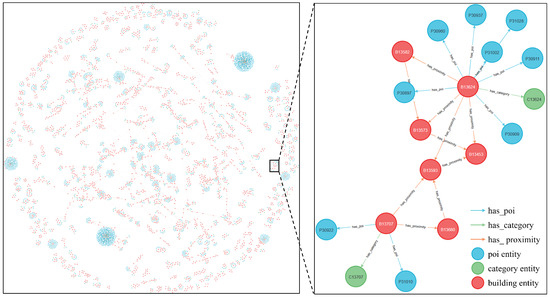
Figure 10.
Partial POI semantic characterization knowledge graph construction results.
Table 4.
Scale of POI semantic characterization knowledge graph.
3.4. Knowledge-Graph-Based Functional Category Reasoning for Buildings
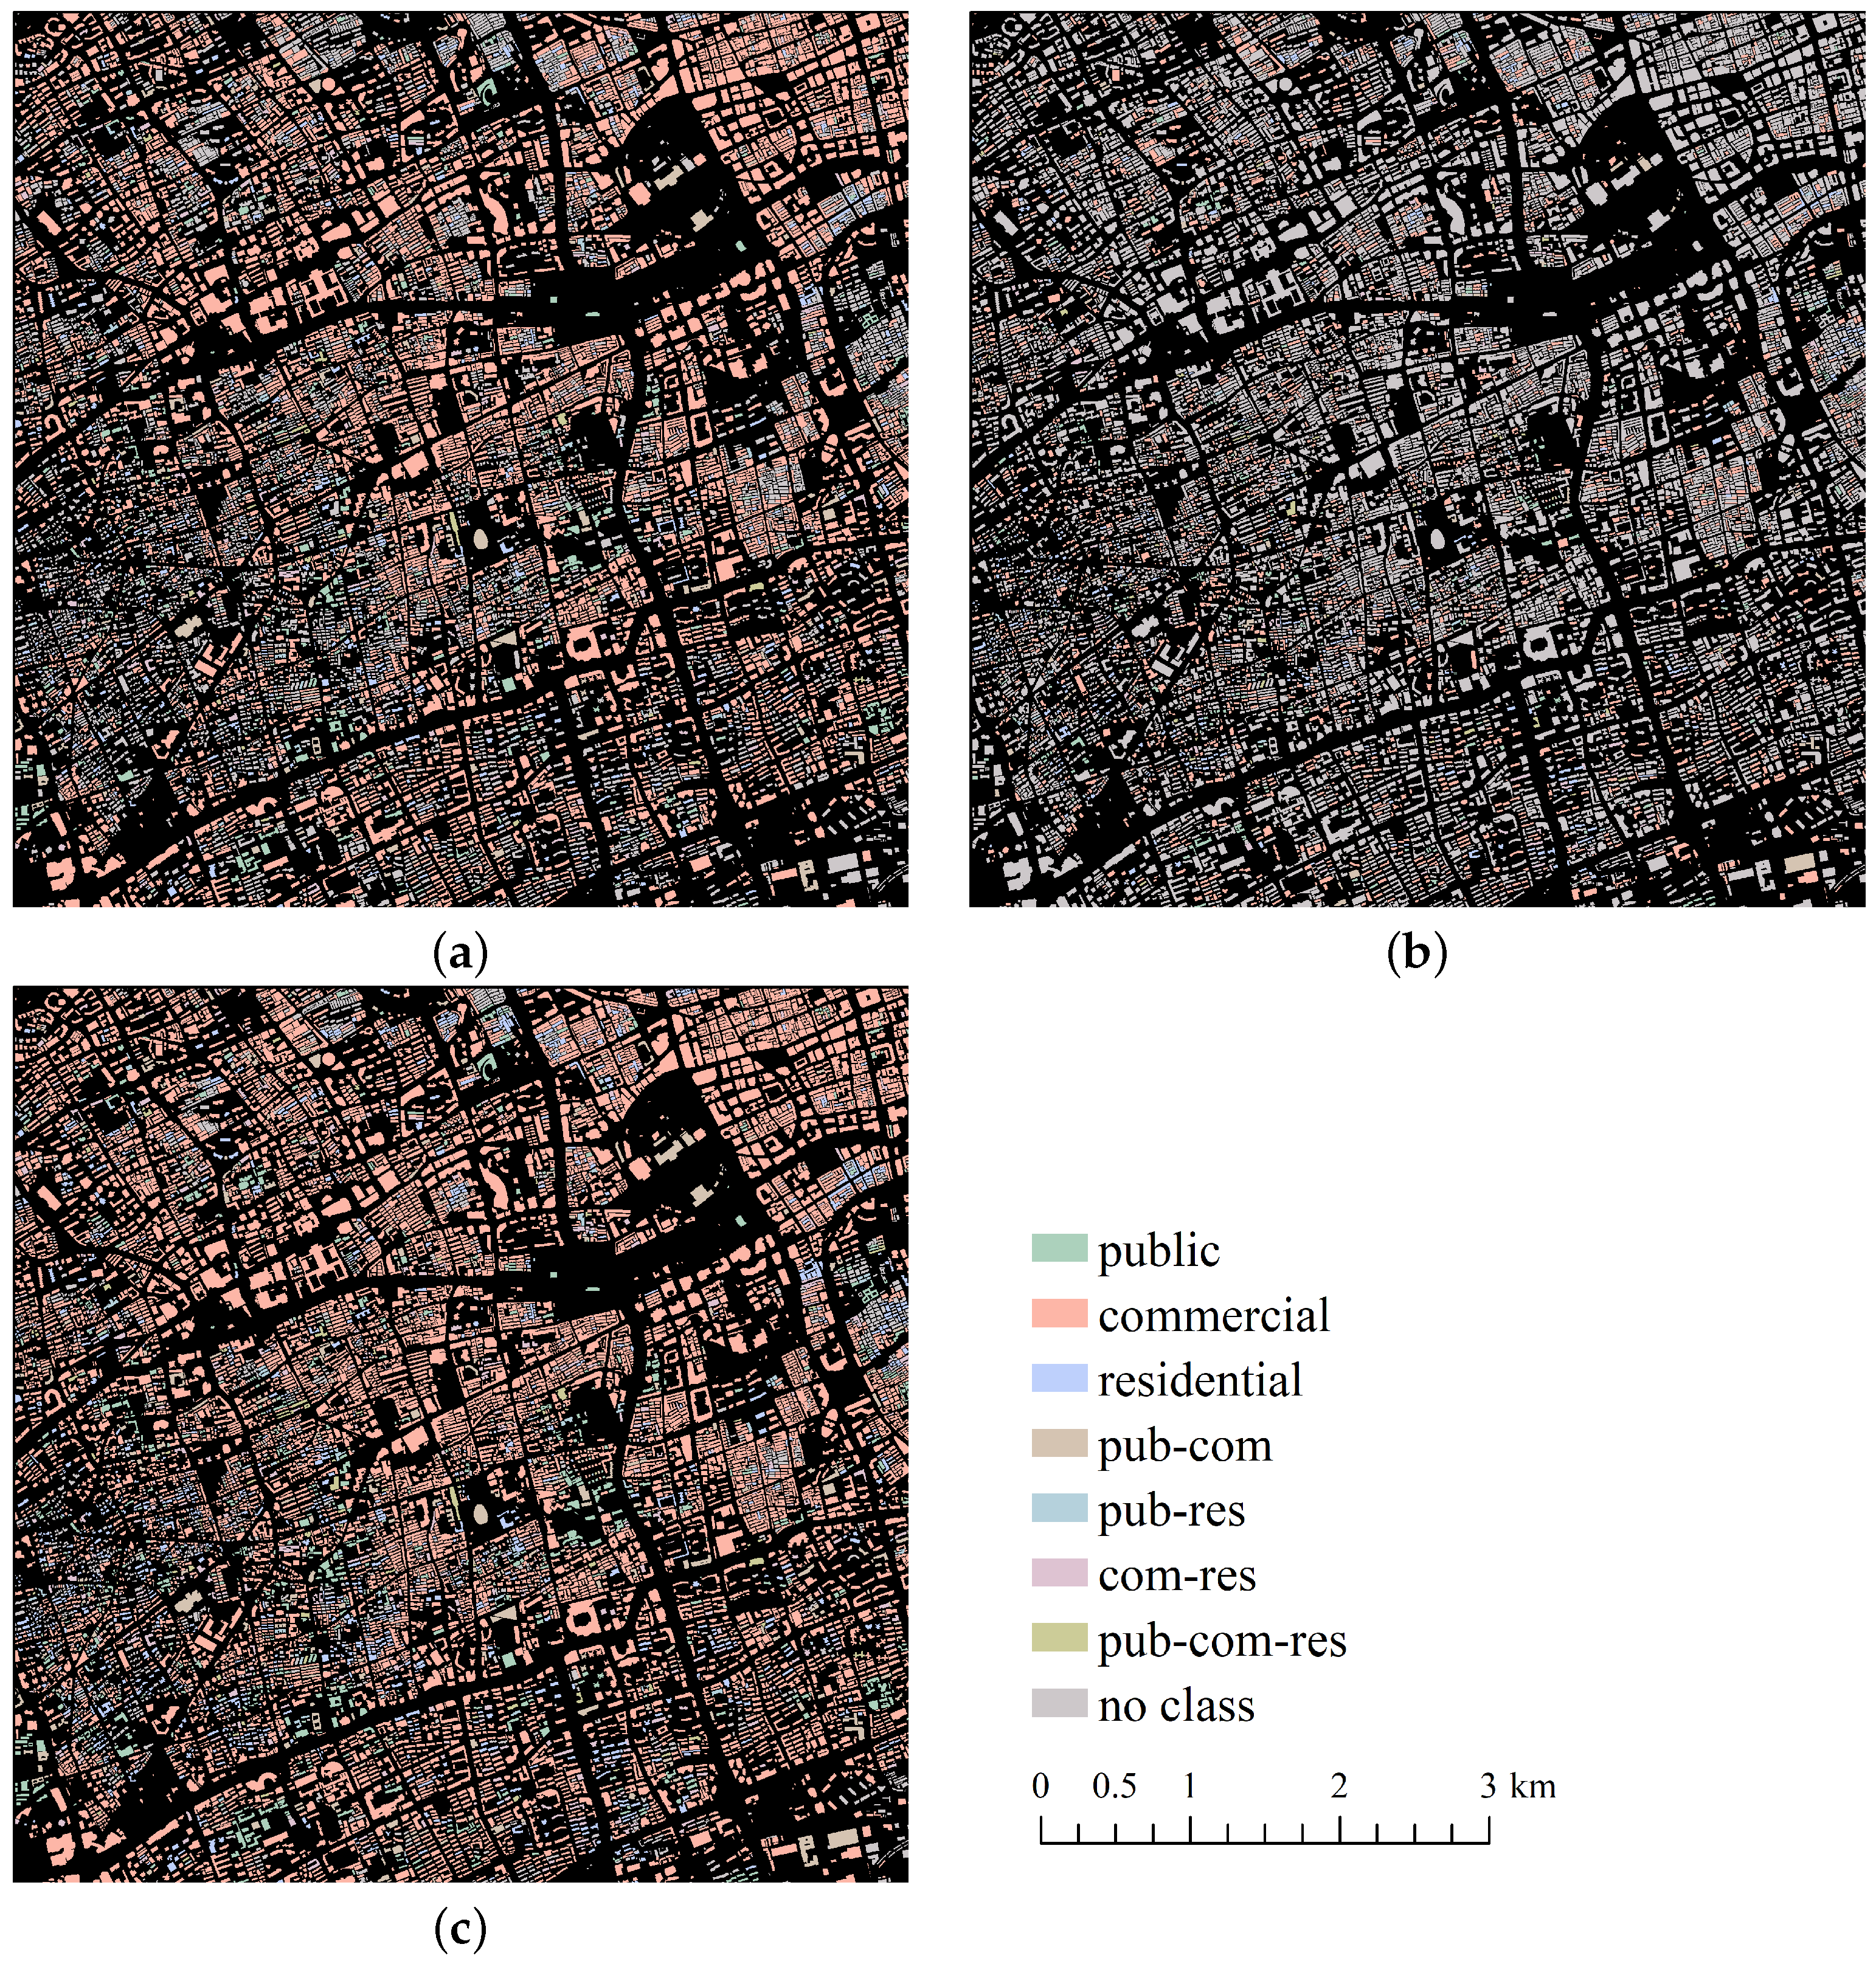
Based on the constructed POI semantic characterization knowledge graph, building functional category reasoning was carried out according to the method described in Section 2.4, and the functional category reasoning results of the matched POI buildings (Figure 11a) and the functional category reasoning results of the unmatched buildings (Figure 11b) were obtained. The reasoning results in both cases were superimposed to obtain the final functional category reasoning result of the buildings, as shown in Figure 11c. Analyzing the inference results, it is observed that: (1) Most of the functional categories of the buildings in the region are commercial categories, which is mainly related to the prosperous economy of Shanghai shaping the commercial space distribution pattern in the region. (2) By reasoning the functional categories of the buildings matching POIs, most of the functional categories of the buildings in the region could be obtained, and on this basis, combined with the results of the reasoning of the functional categories of the buildings with unmatched POIs, the recognition rate of the functional categories of the buildings could be effectively improved. (3) Buildings near roads were almost always recognized; this is mainly related to the feature that POIs are mostly collected from and distributed along roads, resulting in a higher density of POIs near roads and fewer cases of unrecognized buildings.
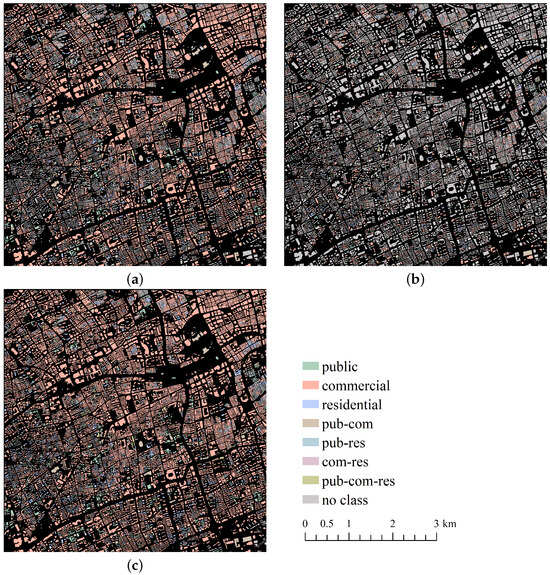
Figure 11.
Building functional category reasoning results. (a) Category reasoning results for buildings with matched POIs. (b) Category reasoning results for buildings with unmatched POIs. (c) Category reasoning results overall for all buildings.
The recognition rate is crucial for functional classifications of buildings. Without a sufficient recognition rate, achieving high accuracy in classifying buildings into their correct functional categories becomes meaningless [17]. The recognition rate is calculated according to Equation (3). By counting buildings categorized as “public”, “commercial”, and “residential”, we obtained the following results, which are summarized in Table 5. The statistical results presented in Table 5 provide insights into the recognition rates of building functional categories under different reasoning scenarios. Here is a breakdown of the findings: (1) When considering only buildings that matched POIs, the recognition rate of building functional categories was 57.71%. (2) However, when the reasoning results of both matched and unmatched buildings were combined, the final recognition rate of building functional categories increased significantly to 94.94%. These results indicate that the reasoning method employed in this study demonstrates a high recognition rate for determining the functional categories of buildings. Moreover, its adaptability is highlighted by its ability to effectively handle buildings with low densities or missing POIs.
where denotes the recognition rate; I denotes the number of buildings identified; N denotes the total number of buildings.
Table 5.
Scale of knowledge graph.
3.5. Validation of Building Category Reasoning Results
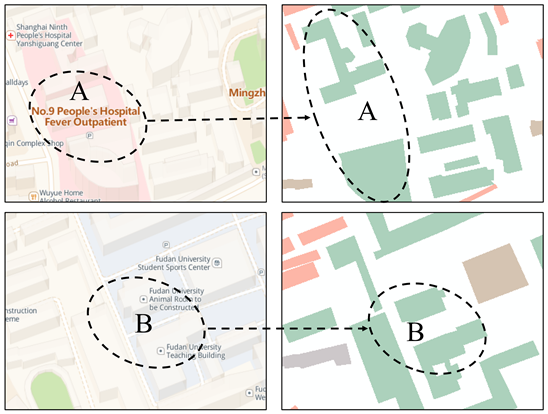
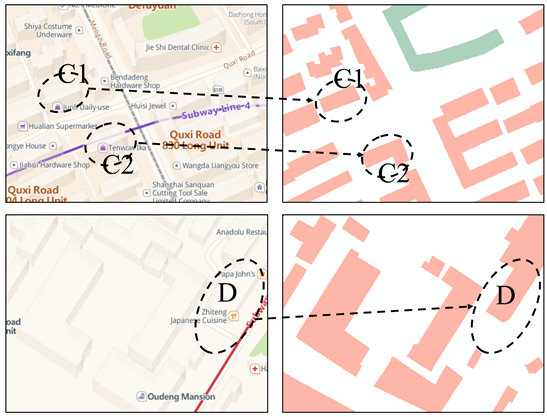
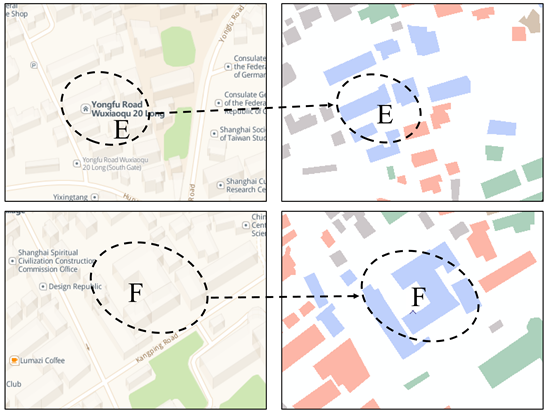
To assess the accuracy of reasoning the functional categories of buildings, the results obtained from the method described in this study were compared and analyzed against Amap online map information. The comparative results for several typical buildings are presented in Table 6.
Table 6.
Verification of building functional category reasoning results.
In Table 6, for zone A, the Amap displays “No.9 People’s Hospital Fever Outpatient”, which is categorized as a medical public service: consistent with the inference result of “public”. For zones C1 and C2, the online map indicates shopping, aligning with the inference result of “commercial” for the building functional category in these zones. Similarly, for zone E, the online map identifies it as a residential zone, corresponding to the reasoning result of “residential” for the building’s functional category in that zone. These validation results demonstrate that the building functional category reasoning method outlined can accurately recognize the functional categories of buildings.
3.6. Comparison and Analysis
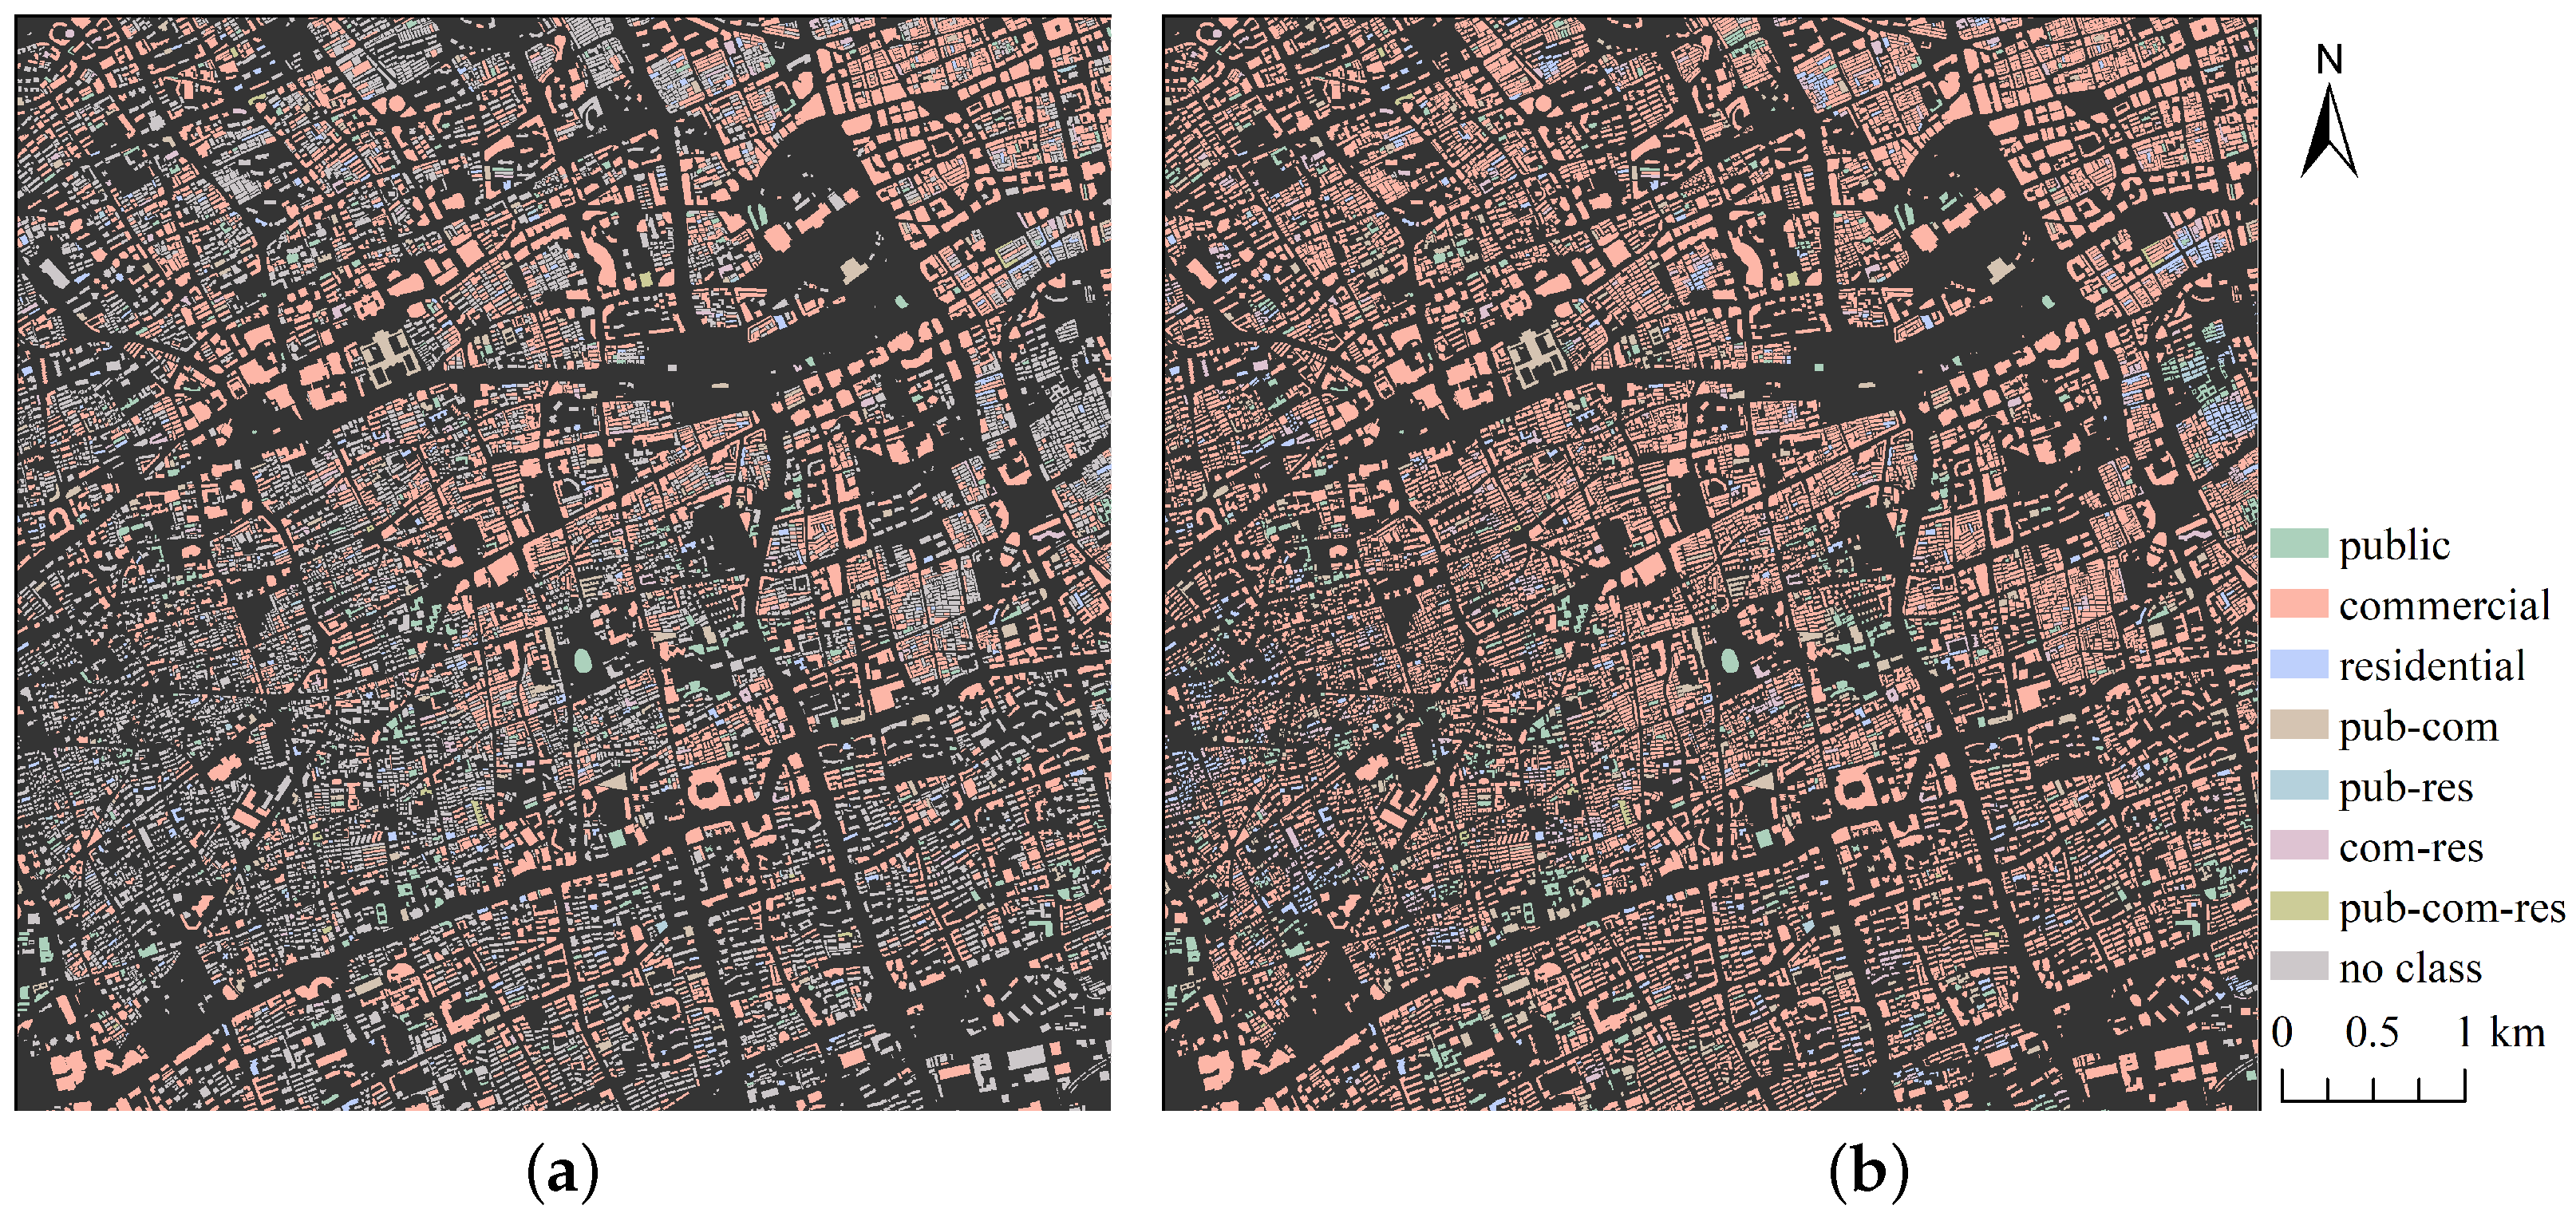
To further validate the superiority of our method, the traditional frequency density method (referred to as Method 1) and the inverse-distance-weighted frequency density method (referred to as Method 2) proposed by Cao et al. [17] were selected for a comparative analysis. The results from utilizing these two methods for reasoning about building functional categories are depicted in Figure 12. By comparing Figure 12a with Figure 12b and Figure 11c, respectively, it is evident that the number of unrecognized buildings in the inference results of building functional categories obtained by Method 1 is significantly higher than for Method 2 and our method, indicating that the recognition rate of Method 1 for building functional categories is lower.
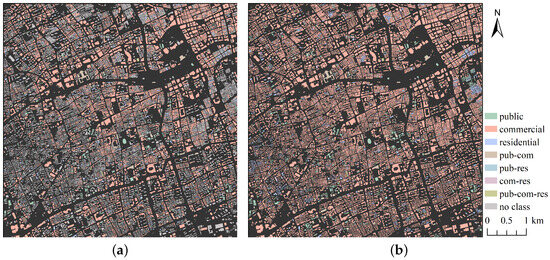
Figure 12.
Functional category reasoning results for buildings using two different methods. (a) Functional category reasoning results for buildings based on Method 1. (b) Functional category reasoning results for buildings based on Method 2.
Statistics on the reasoning results of the functional categories of the buildings that were obtained by the three ways are shown in Table 7. Among the reasoning results of the three methods, the commercial type accounted for the largest proportion, indicating that the commercial development of the study area selected is better and dominant. However, the three methods also showed different degrees of unclassified phenomena, in which the number of unclassified buildings in Method 1 is the largest, accounting for 62.98%, and the number of unclassified buildings in Method 2 is smaller, accounting for 0.02%. Further analysis revealed that Method 1 only considered POIs falling inside the building for the classification of building functional categories, so it led to a lower recognition rate of building functional categories, while Method 2, on the basis of improving Method 1, took POIs within 100 m of the building as the basis for reasoning about the functional categories of the buildings with missing POIs, which led to a higher recognition rate of functional categories. The building functional category recognition rate of Method 2 was 99.80%, which was 4.86% higher compared to our method, but further comparison was needed to see how correct the reasoning results were.
Table 7.
Functional category reasoning for buildings using three different methods.
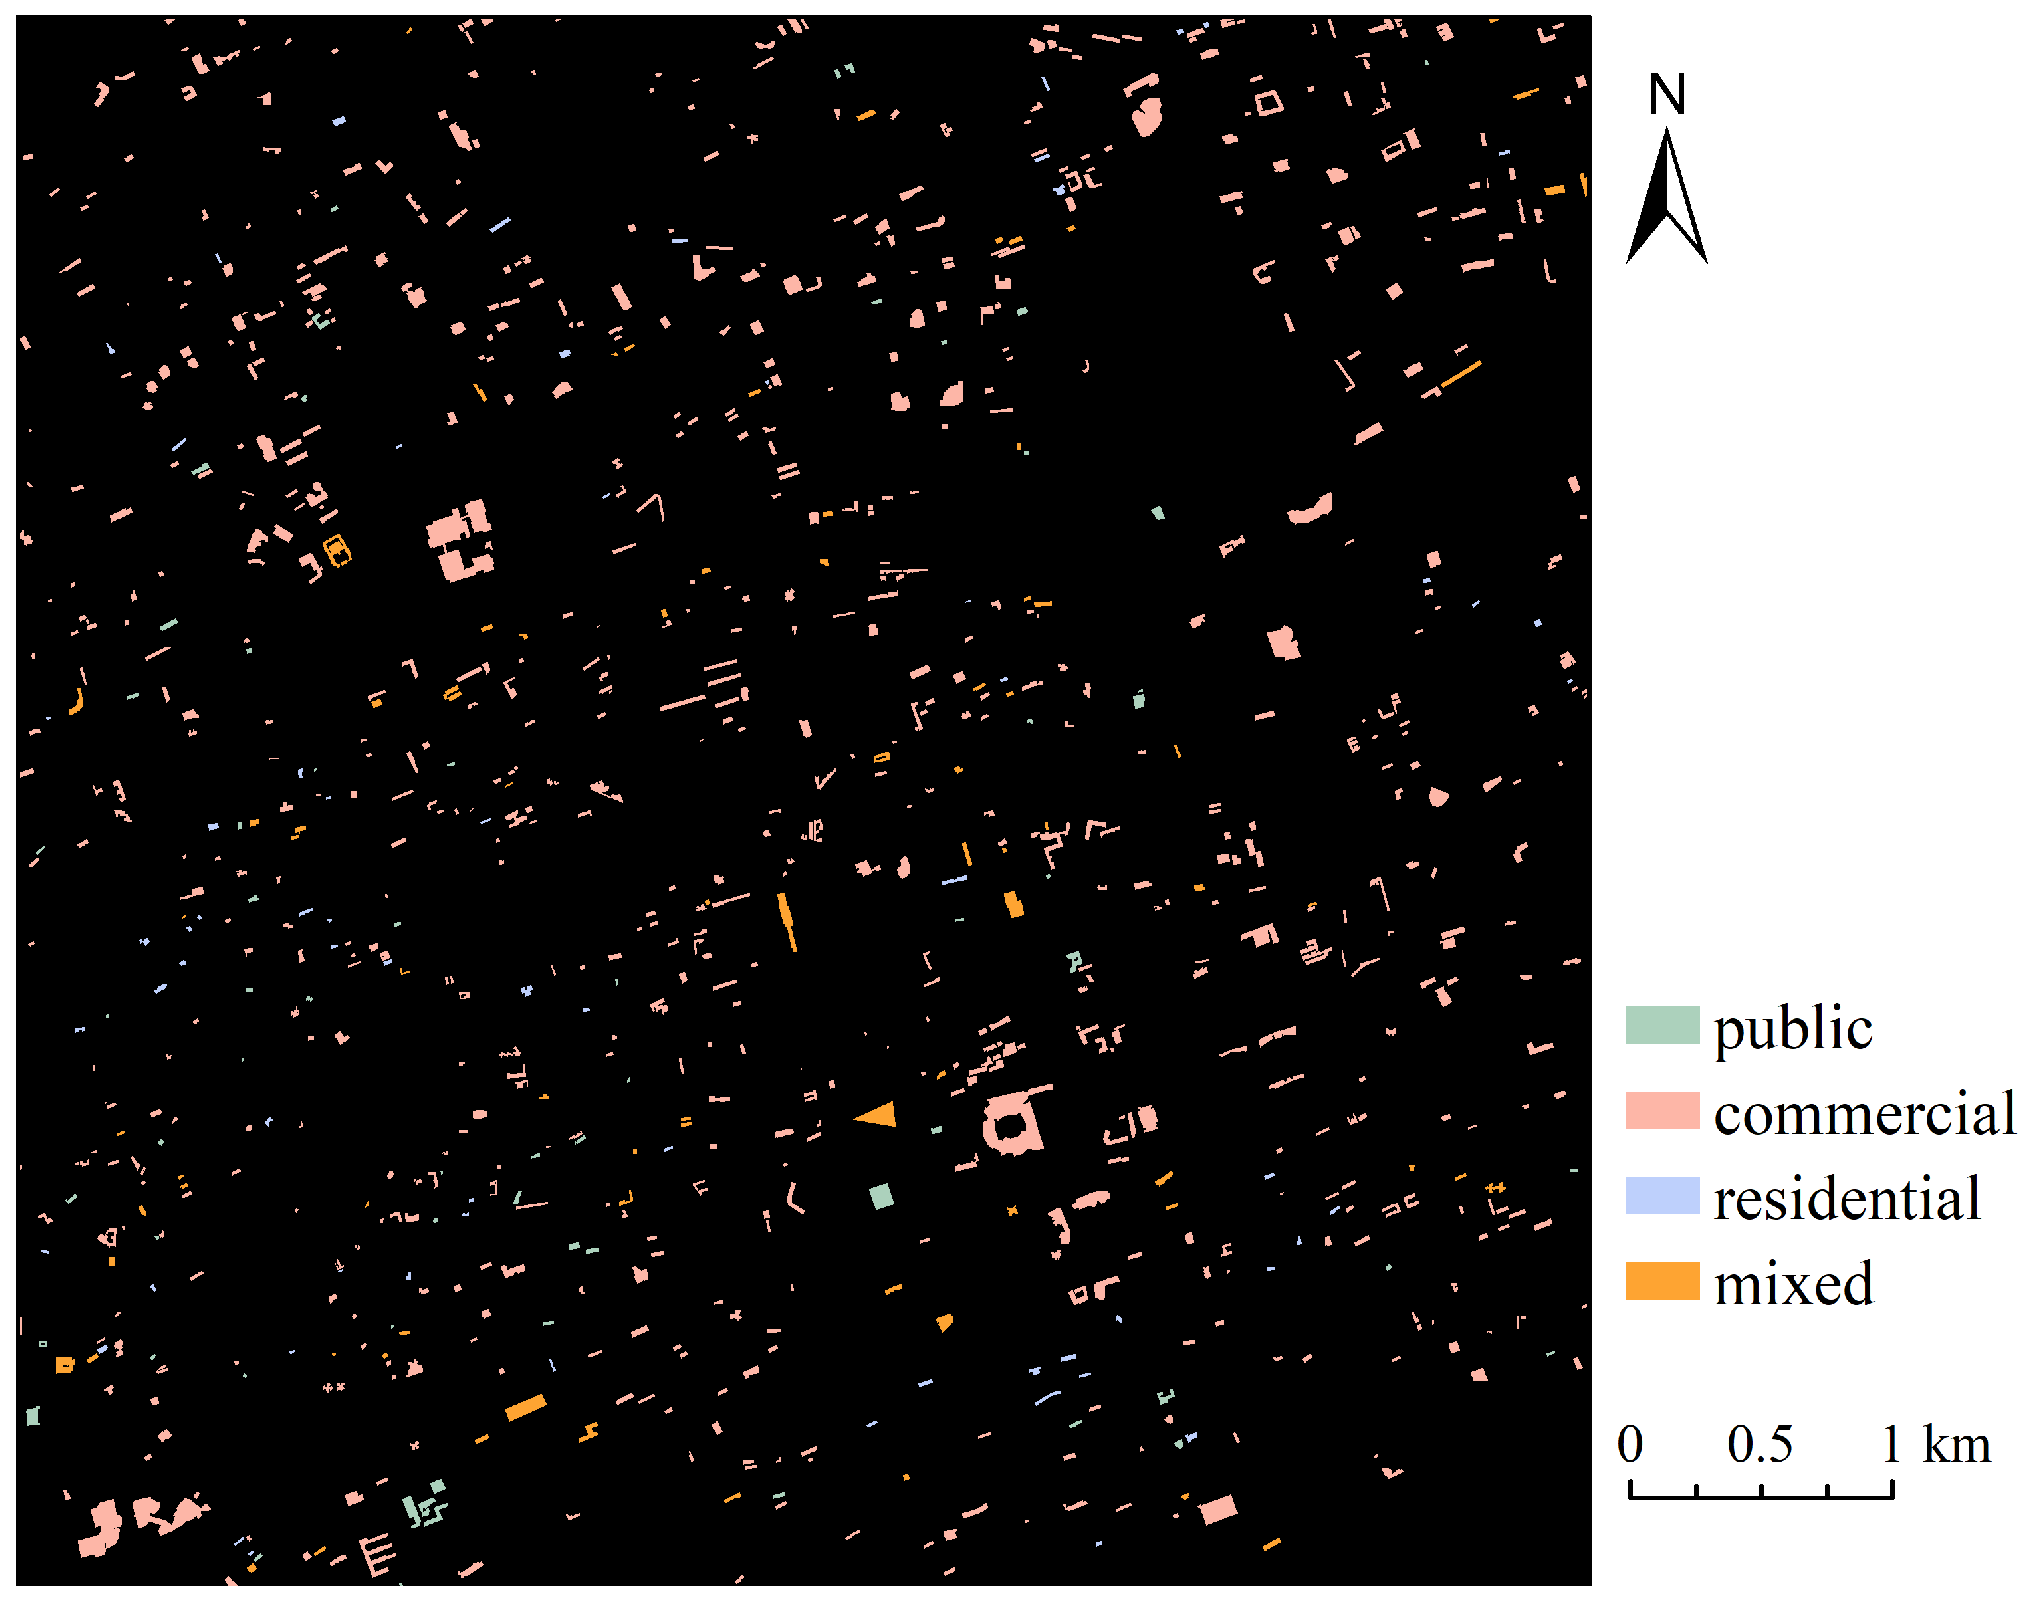
To further compare the correctness rate of Method 2 and our method in terms of functional category classification results (the correctness rate was calculated as shown in Equation (4)), the following process was used to carry out the comparison test: Firstly, 1000 randomly selected buildings were labeled according to the four categories of “public”, “commercial”, “residential”, or “mixed”, and the labeling results are shown in Figure 13. Secondly, the reasoning results of Method 2 and our method were compared with the labeled building dataset, and the confusion matrix was calculated (Figure 14).
where denotes the rate of correct recognition results, denotes the number of correct ones in the recognition results, and denotes the number of recognition results.
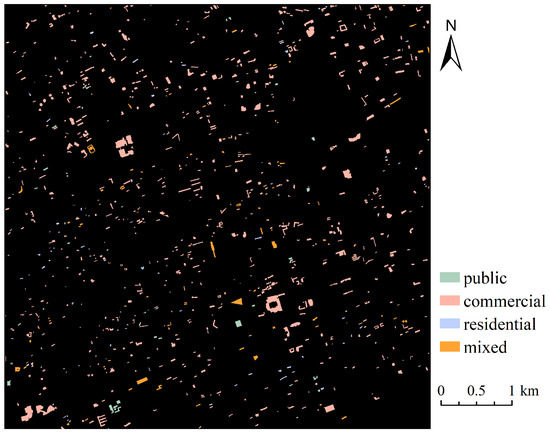
Figure 13.
Randomly selected building labeling results.
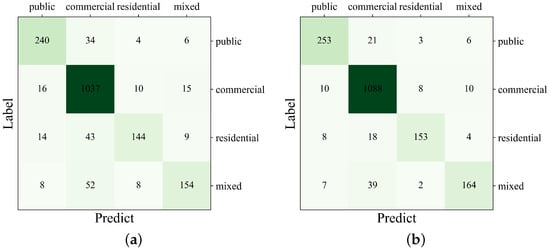
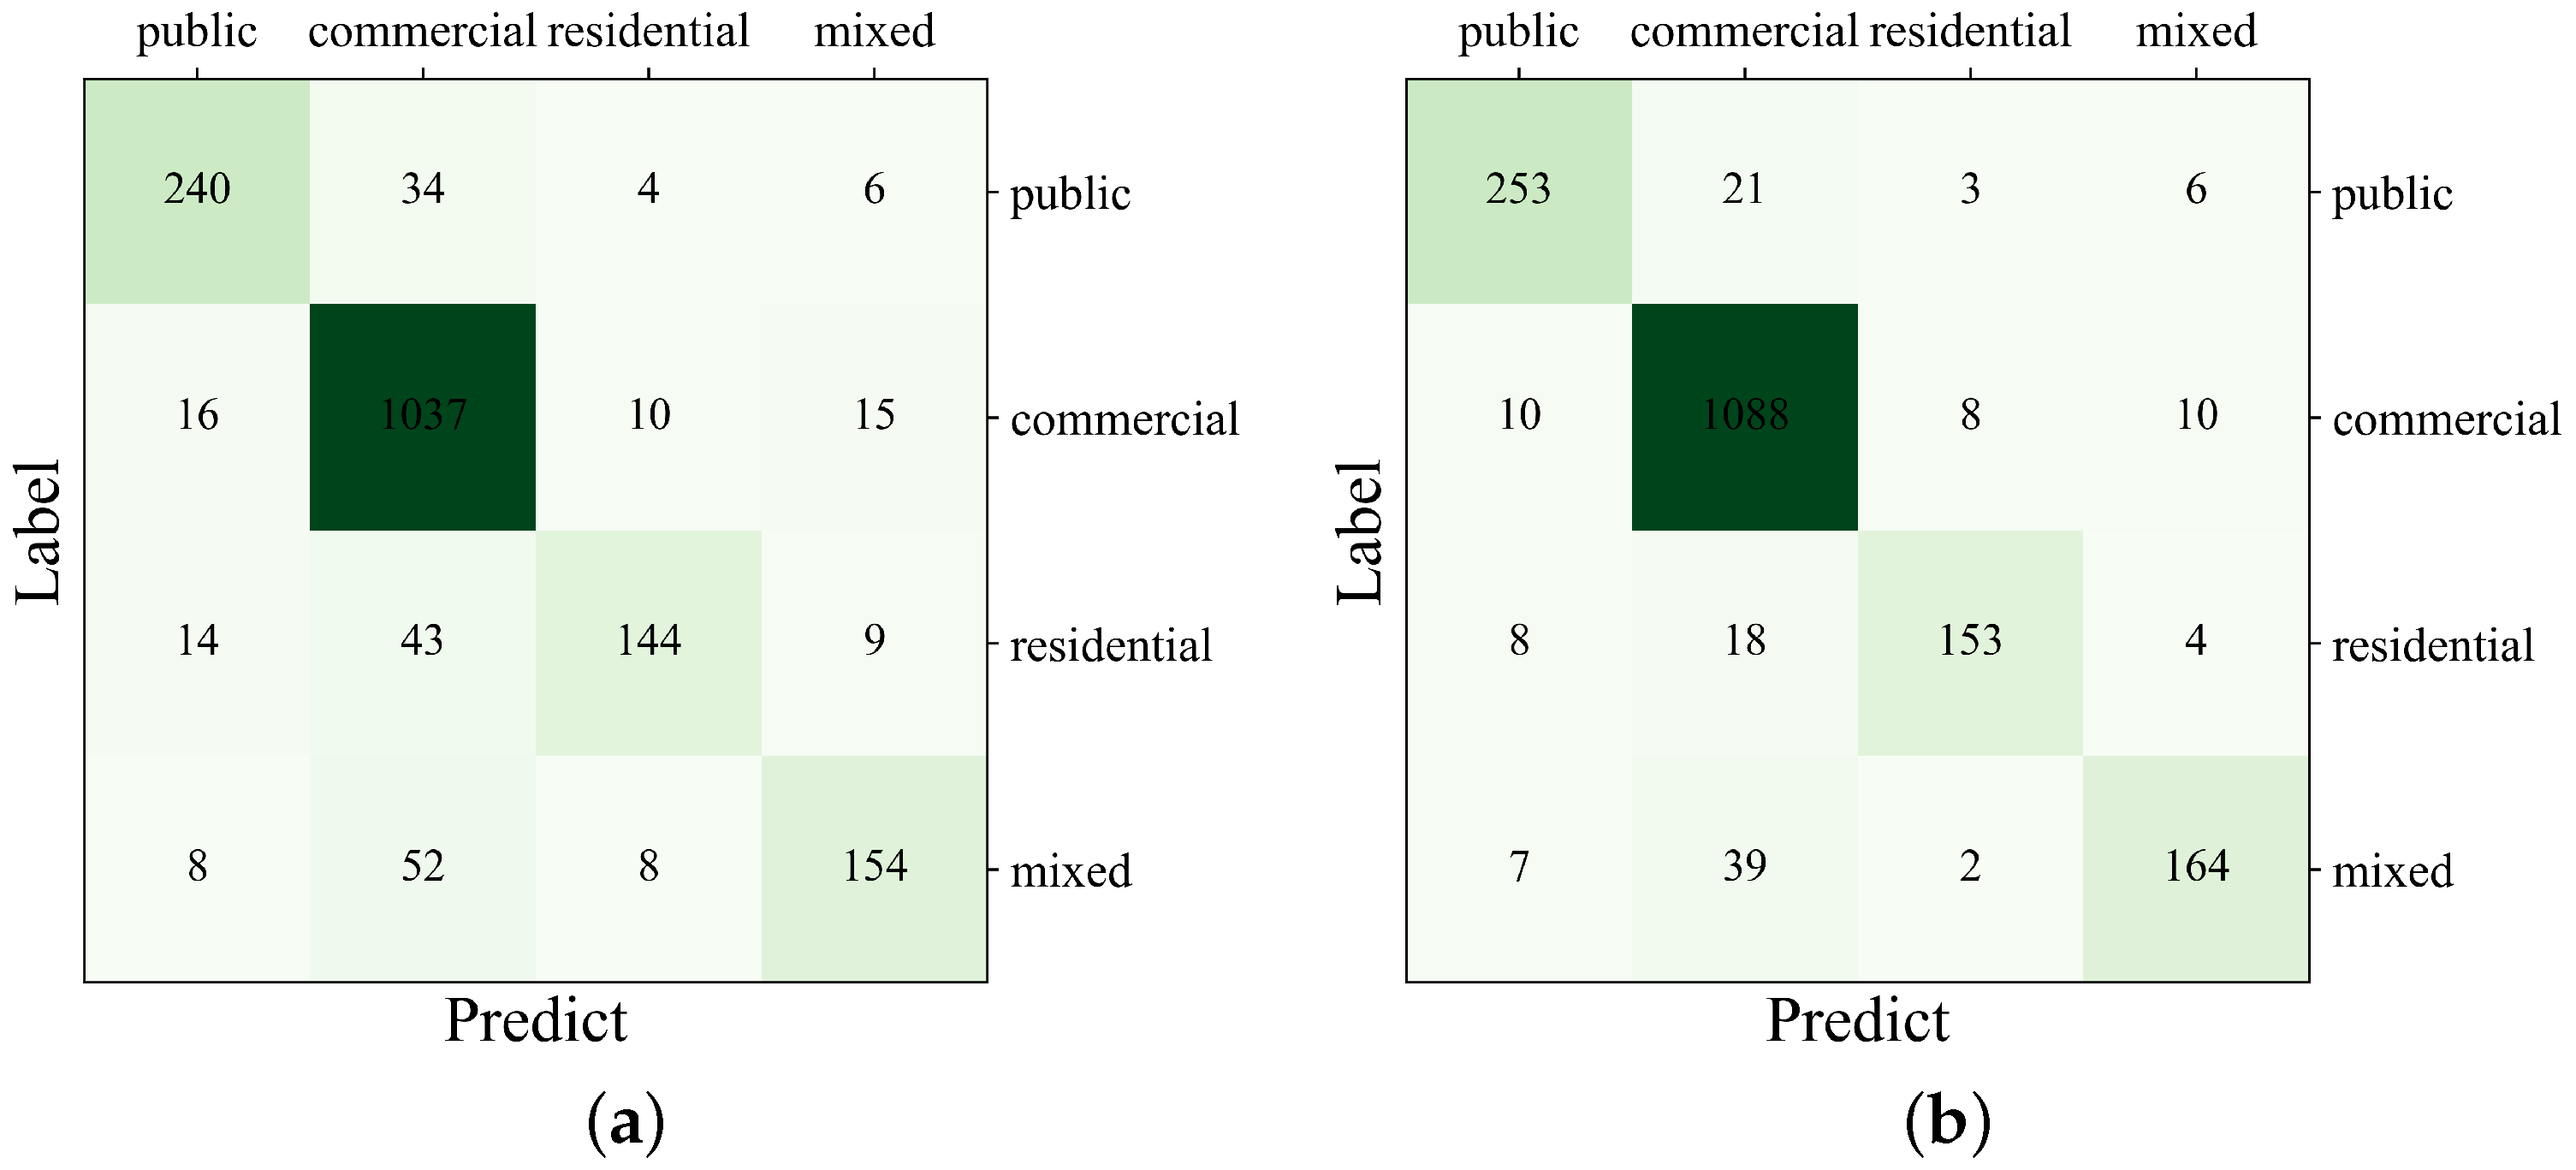
Figure 14.
Calculation of confusion matrices of two methods. (a) Confusion matrix of Method 2. (b) Confusion matrix of our method.
From the confusion matrix (Figure 14), it was observed that the number of commercial-type buildings was higher in the prediction results, which is consistent with the commercial-oriented building functional categories in the area. Further calculations based on the confusion matrix were conducted to determine the accuracy in categorizing building functional categories using the two methods, as shown in Table 8. Both methods exhibited a high correctness rate for inferring building functional categories, indicating their suitability for classifying the functional categories of buildings. However, compared to Method 2, the correctness rate of our method was higher for the reasoning for each functional type, with the overall correctness rate also being 9% higher than that of Method 2. This demonstrates that our method achieved a high correctness rate when reasoning about building functional categories and can be applied to the automatic reasoning and delineation of functional categories of large-scale buildings.
Table 8.
Correctness of reasoning for two methods.
4. Discussion
Most of the existing studies on urban functional districts achieve the construction of functional districts by summarizing the POI attributes within the spatial units of blocks or grids. To promote a more refined and intelligent division of functional zones, we have conducted research on constructing and reasoning with a knowledge graph to categorize building functions. This research has achieved a high recognition rate and correctness rate for building functional categories, providing robust support for city management and planning.
In terms of the use of reference data for delineating building functional categories, we relied solely on POI data for classifying building functions. However, for achieving more precise classification of building functional categories, relying solely on POI data was inadequate, and we required diverse types of data. In the future, we will incorporate data related to daily human activities (e.g., human mobility [43,44], travel behaviors [45,46], mobile signaling [47,48], etc.) to explore the correlations between buildings and peoples’ daily routines. This approach will help us extend the existing knowledge graph and will enable more accurate and intelligent classification of building functional categories.
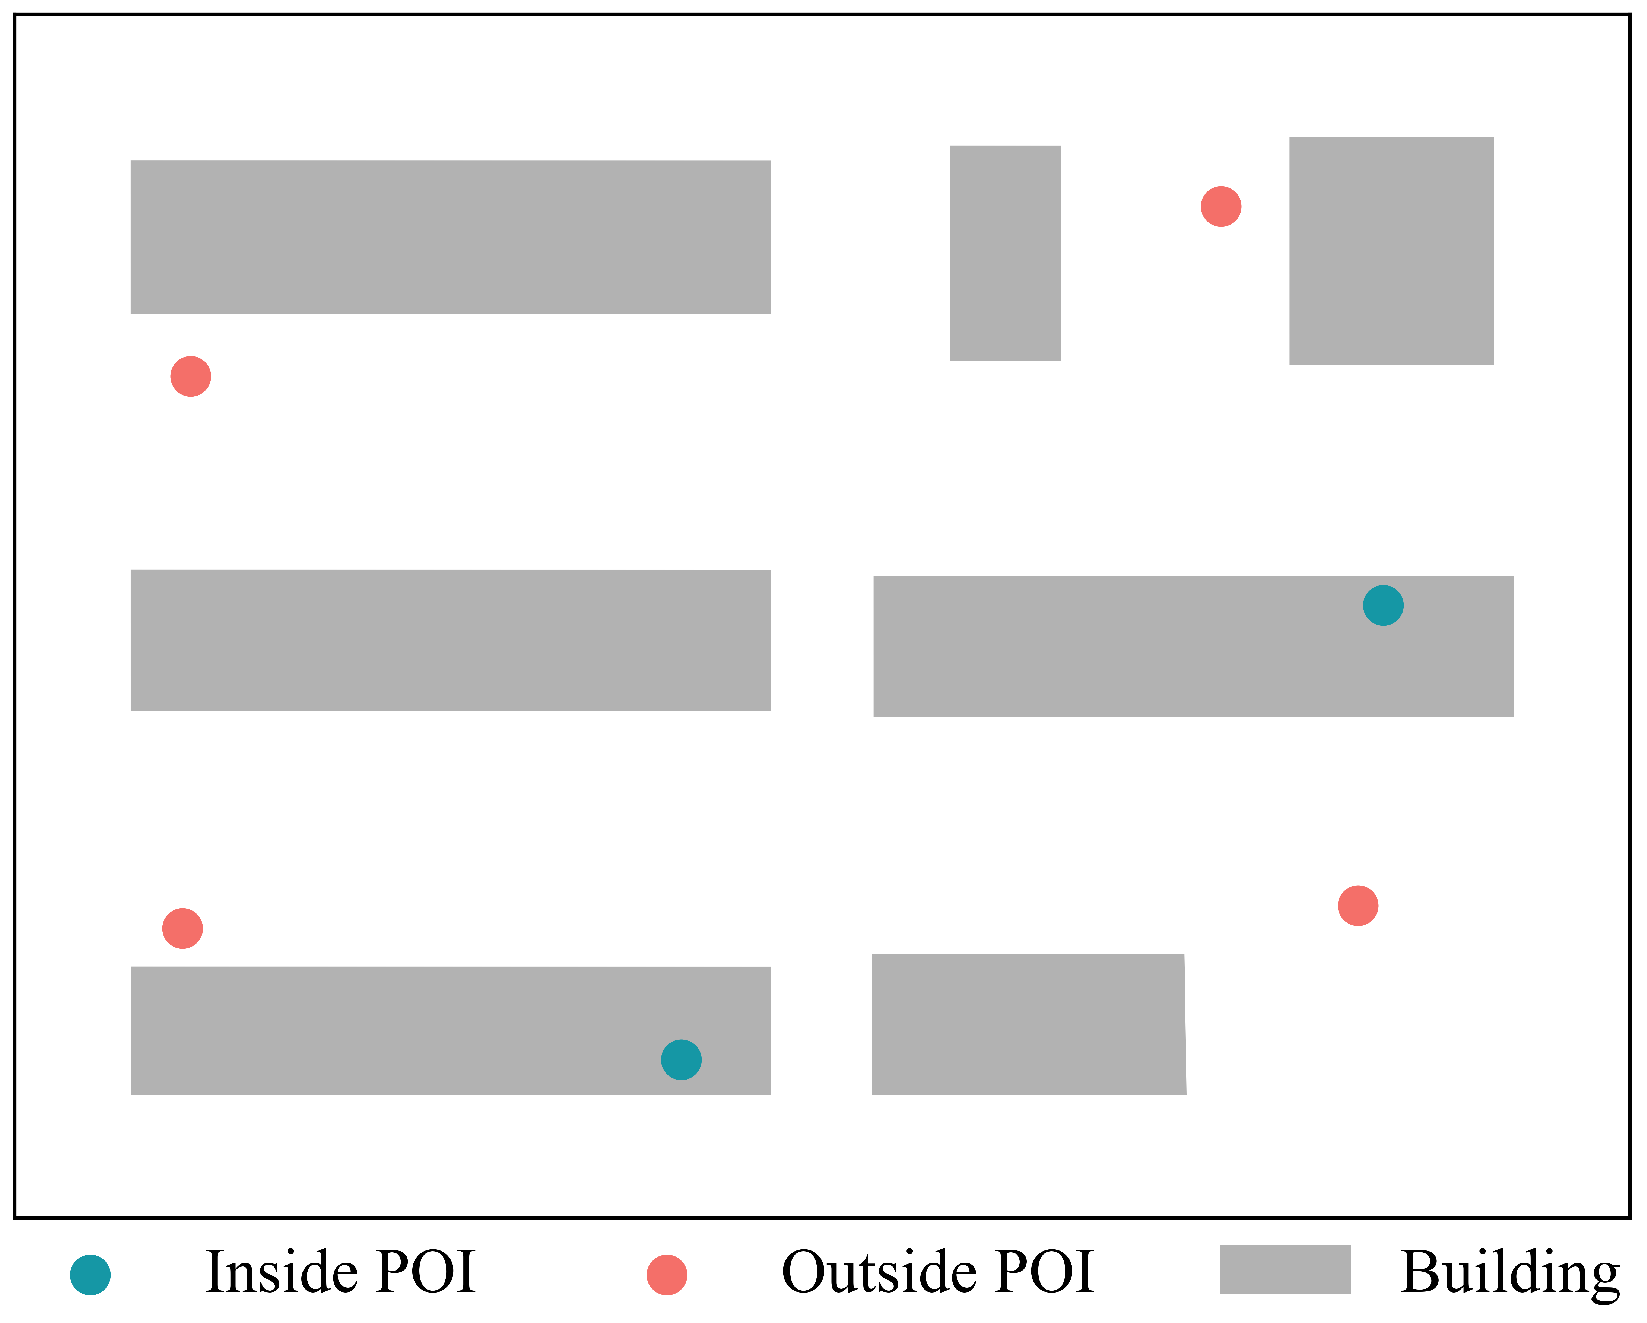
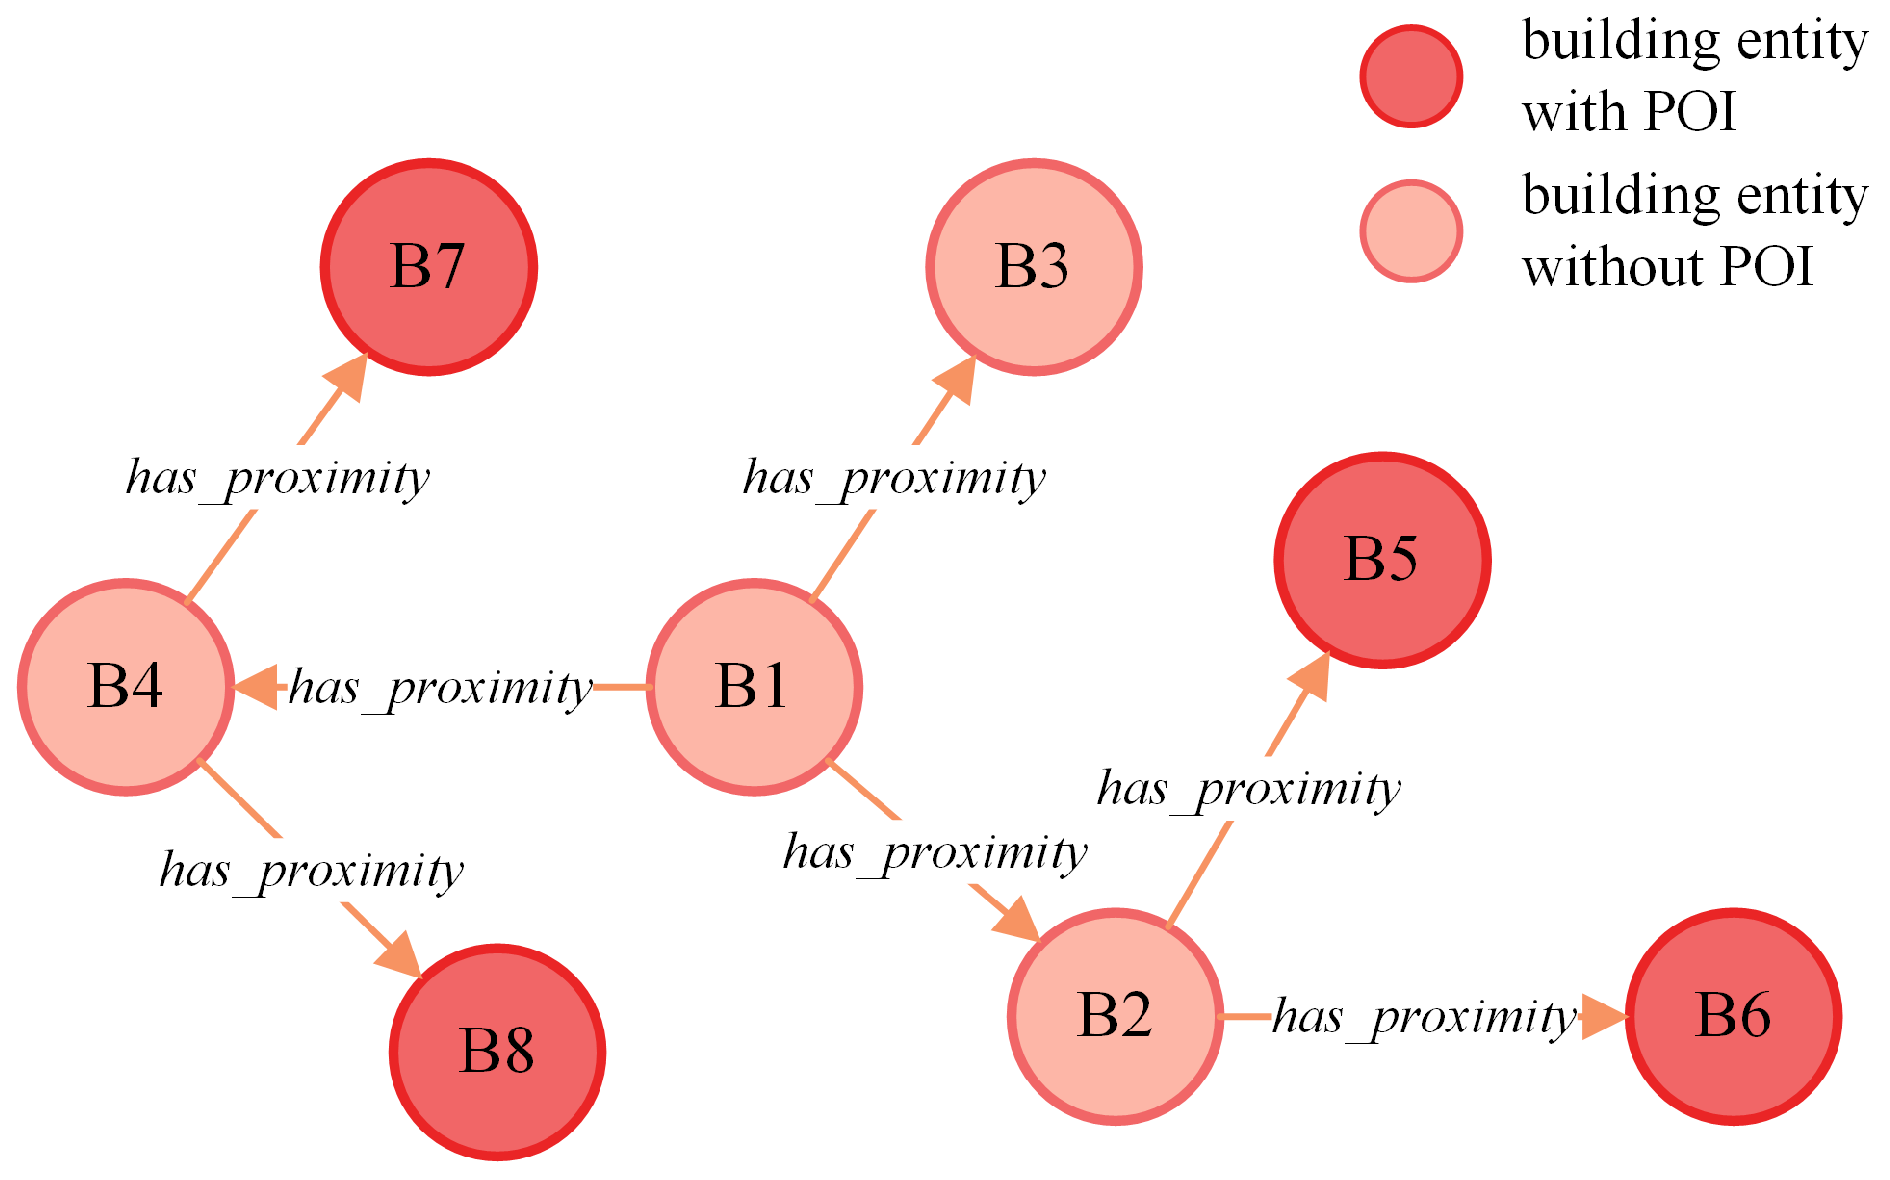
In terms of the recognition rate for inferring building functional categories, this paper achieved a lower rate compared to Method 2. One significant reason was that our method relied solely on buildings with first-order neighboring relationships (with matched POIs) to infer functional categories for buildings with unmatched POIs. Therefore, in cases like B1 in Figure 15, we could not determine the functional category of B1 because none of its first-order neighboring buildings (B2, B3, and B4) had matched POIs. To address this limitation, we proposed considering higher-order neighboring buildings (e.g., second, third, fourth, etc.) of B1 for functional category inference when first-order neighbors were insufficient. Given that spatially proximate entities often exhibited similar characteristics due to the first law of geography, our approach involved carefully considering the interaction degree of functional categories and spatial distances when reasoning about building functional categories using higher-order neighboring entities. In our future work, we aim to improve the recognition rate of knowledge-graph-supported methods for classifying building functional categories. This will be achieved by carefully considering distance factors and conducting research on higher-order-based inference methods.

Figure 15.
First-order proximity building entities containing POIs.
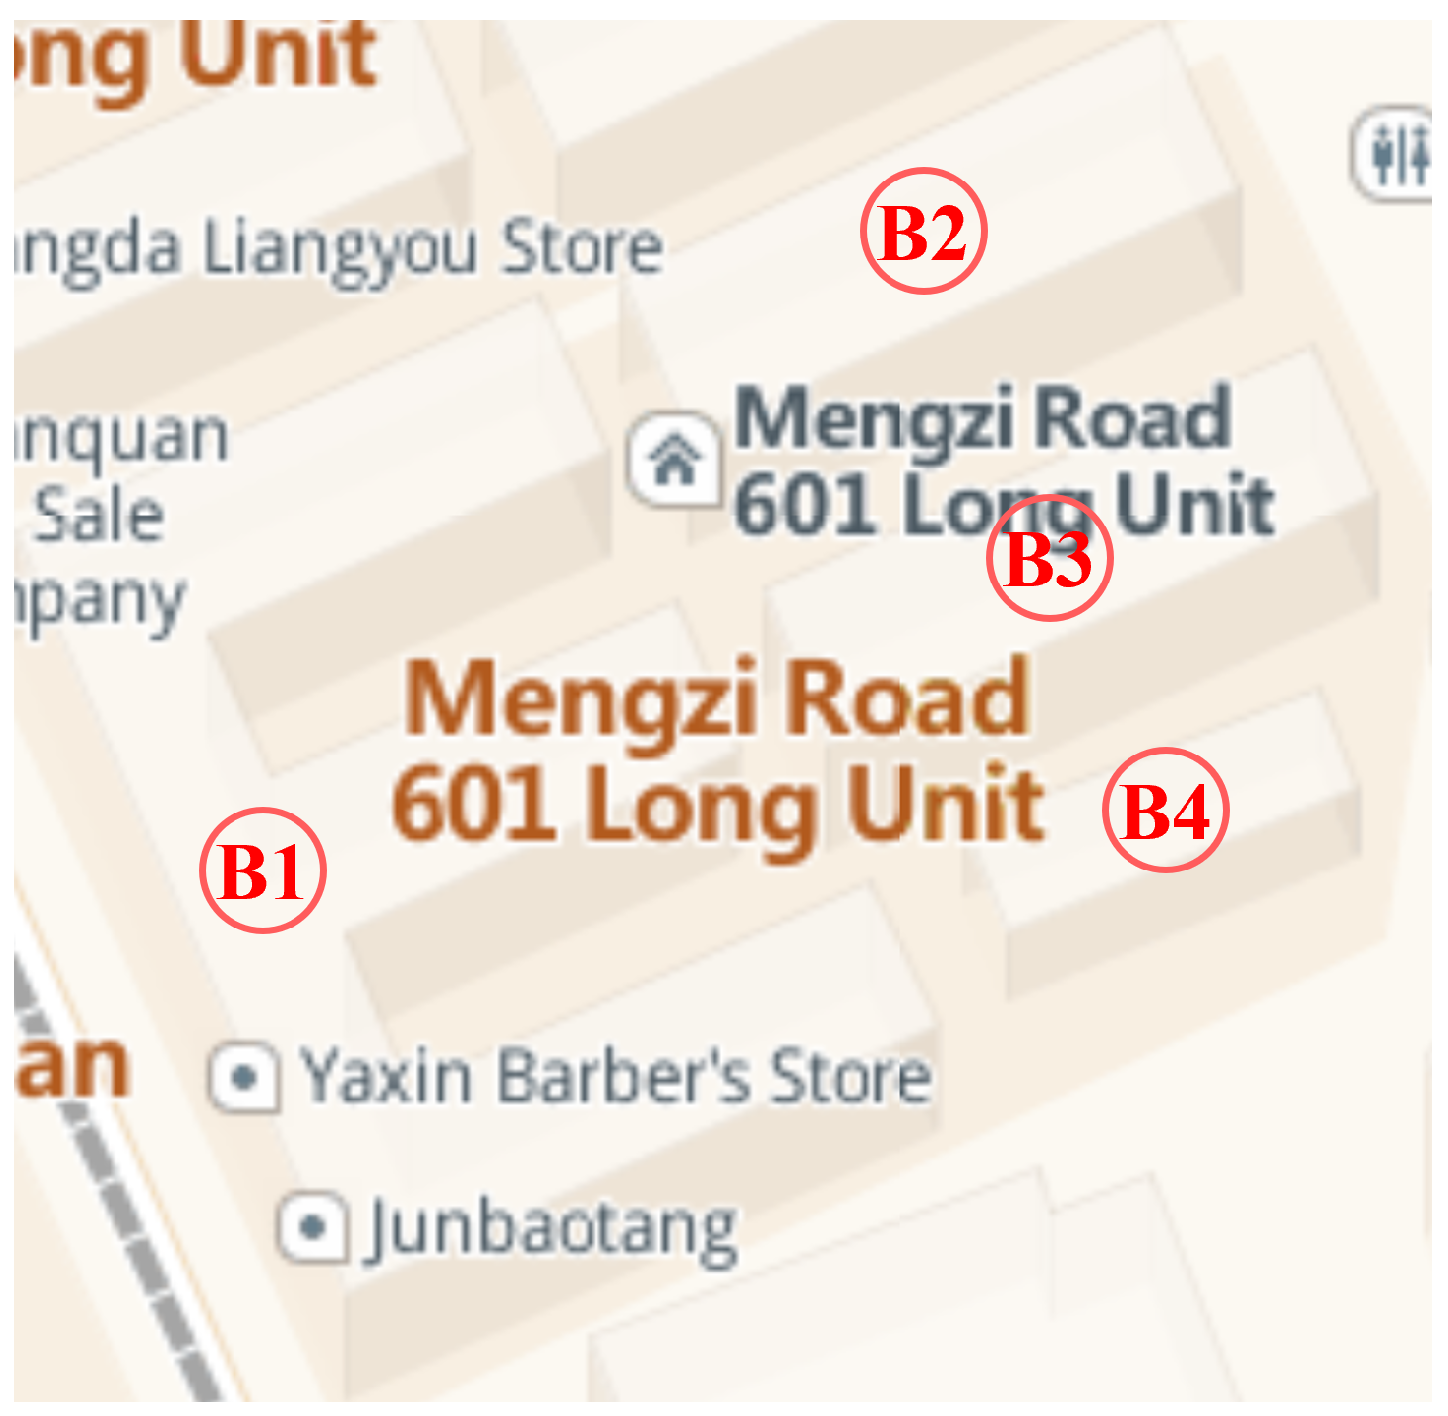
In terms of the accuracy of building functional category inference, the method proposed in this paper achieved a higher accuracy rate compared to Method 2. However, there were instances of misclassification in specific areas within the district. For example, as shown in Figure 16, buildings B1 to B4 are located in the residential area “Mengzi Road 601 Long Unit” and should be classified as residential based on their functional categories. Nonetheless, due to B1 containing two commercial POIs, it was incorrectly classified as commercial using the method described in this paper. To address this issue, we initially attempted to improve the accuracy by removing some low-recognition POI points, such as convenience stores. However, this approach alone does not provide a comprehensive solution to such problems. In the future, we will integrate AOI (area of interest) data, enhance our knowledge graph by establishing associations between AOI data and building data, and develop corresponding reasoning rules for building functional categorization. This approach will aim to improve the accuracy of building functional category classification results.
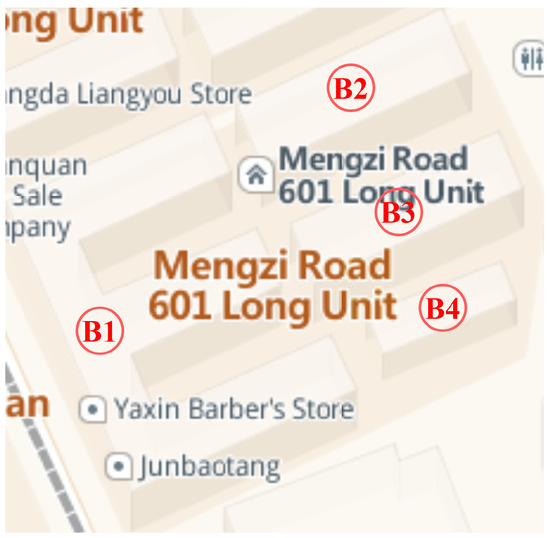
Figure 16.
Situation of settlements prone to misclassification.
Further integration of POI semantic embedding technology will enhance the recognition rate and accuracy of functional category classification in our approach. POI semantic embedding improves the semantic understanding and reasoning performance of computers for POIs by virtue of its expression of POI information in the form of a continuous vector space [49]. Consequently, POI semantic embedding has been constantly utilized for delineating functional zones by enhancing the accuracy of urban zone delineation through embedded representations of multiple POI functional categories [50,51]. In our forthcoming work, we will focus on POI semantic embedding technology and explore its integration with a knowledge graph to develop a method for constructing functional category classification supported by POI semantic embedding. Leveraging POI embedding will enrich the representation of POIs’ diverse functional category information and enhance the granularity of the knowledge graph’s depiction of POI functional categories. Additionally, we will design reasoning rules that combine POI embedding to improve the accuracy and correctness of building functional category classification.
Our research results show promising outcomes in multi-scale representation of functional zones. The knowledge graph we constructed accurately classified building functional categories, fulfilling the requirements for generating and depicting functional zones at various scales (such as at the building level, neighborhood level, block level, township level, city level, etc.). Enabling the expansion of building functional areas to larger scales often involves cartographic synthesis guided by existing knowledge graphs [52] to enhance their capability to reason and represent functional categories across different scales. In our future work, we intend to integrate knowledge graph technology with cartographic generalization technology [30,37]. This will involve refining our current knowledge graph and optimizing reasoning rules by implementing techniques such as merging, deleting, and shifting to enable a cross-scale representation of buildings. Ultimately, we aim to develop a versatile knowledge graph capable of classifying building functional categories and generating multi-scale functional zones. This approach will support automatic and intelligent representation of urban functional areas and will meet various scales of urban management and planning requirements.
5. Conclusions
To enhance the sophistication and intelligent representation of urban functional zones, we proposed a building functional classification method supported by a knowledge graph. The method primarily included four main processes: building and POI matching, building knowledge graph construction, building functional classification model design, and building functional category reasoning based on the knowledge graph. The effectiveness of our method was verified through a case study using building and POI data from Shanghai. The following conclusions were drawn: (1) In terms of the recognition rate, our method had a high recognition rate, reaching 94.94%, and demonstrated strong adaptability to buildings with low or missing POI density. (2) In terms of the correctness rate, our method was equivalent to Method 2 with a high correctness rate of 92.40%, making it applicable for the automatic reasoning and classification of large-scale building functional categories.
Our method can be adapted to the delineation of functional categories of buildings in large-scale and large areas and can promote the refinement and intelligent expression of urban functional zones. However, our method has some limitations in the delineation of building functional categories, and there are inaccuracies in the delineation of building functional categories for similar residential zones. In our future work, we will consider expanding the knowledge graph by adding multivariate data to improve the correctness of the classification of building functional categories. Simultaneously, we will integrate comprehensive cartographic knowledge into the knowledge graph to enhance the multi-scale representation of building functional zones.
Author Contributions
Conceptualization, Youneng Su; methodology, Qing Xu, Xinming Zhu, Fubing Zhang, and Yi Liu; software, Qing Xu, Xinming Zhu, and Yi Liu; validation, Youneng Su; formal analysis, Youneng Su, Qing Xu, Xinming Zhu, and Fubing Zhang; investigation, Youneng Su and Qing Xu; resources, Youneng Su, Qing Xu, and Xinming Zhu; data curation, Qing Xu, Xinming Zhu, and Fubing Zhang; writing–original draft, Youneng Su; writing–review and editing, Youneng Su, Qing Xu, Xinming Zhu, Fubing Zhang, and Yi Liu; visualization, Youneng Su, Qing Xu, Xinming Zhu, and Yi Liu; supervision, Youneng Su and Qing Xu; project administration, Qing Xu. All authors have read and agreed to the published version of the manuscript.
Funding
This work was supported by The National Natural Science Foundation of China [grant numbers 42101454, 42101455] and was funded by the Key Laboratory of Smart Earth [grant number KF2023YB02-02].
Data Availability Statement
The data that support the findings of this study are available from the corresponding author upon reasonable request.
Acknowledgments
We are grateful to the editor and the anonymous referees for their helpful and constructive comments that greatly contributed to improving the manuscript.
Conflicts of Interest
The authors declare no conflicts of interest.
References
- Krier, L. Architecture: Choice or Fate; Papadakis Publisher: Winterbourne, UK, 1998. [Google Scholar]
- Sorin, B.; Gavrilă, A.; Popescu, I.M.; Gombos, S.P.; Vasilache, P.C. Theories and Models of Functional Zoning in Urban Space. Rev. Manag. Comp. Int. 2020, 21, 21–53. [Google Scholar] [CrossRef]
- Wang, Y.; Liu, W.; Tan, Y.; Li, Y. Classification of Urban Functional Areas by Convolution Neural Network Recognition Combined with Sliding Window and Semantic Reasoning. Geomat. Inf. Sci. Wuhan Univ. 2023, 48, 950–959. [Google Scholar] [CrossRef]
- Zhang, H.; Zhang, L.; Che, F.; Jia, J.; Shi, B. Revealing Urban Traffic Demand by Constructing Dynamic Networks With Taxi Trajectory Data. IEEE Access 2020, 8, 147673–147681. [Google Scholar] [CrossRef]
- Schiavina, M.; Melchiorri, M.; Freire, S.; Florio, P.; Ehrlich, D.; Tommasi, P.; Pesaresi, M.; Kemper, T. Land use efficiency of functional urban areas: Global pattern and evolution of development trajectories. Habitat Int. 2022, 123, 102543. [Google Scholar] [CrossRef]
- CHEN, Y.; LI, X. Applications and New Trends of Machine Learning in Urban Simulation Research. Geomat. Inf. Sci. Wuhan Univ. 2020, 45, 1884–1889. [Google Scholar] [CrossRef]
- Liu, F.; Andrienko, G.; Andrienko, N.; Chen, S.; Janssens, D.; Wets, G.; Theodoridis, Y. Citywide Traffic Analysis Based on the Combination of Visual and Analytic Approaches. J. Geovisualization Spat. Anal. 2020, 4, 15. [Google Scholar] [CrossRef]
- Huang, X.; Yang, J.; Li, J.; Wen, D. Urban functional zone mapping by integrating high spatial resolution nighttime light and daytime multi-view imagery. ISPRS J. Photogramm. Remote Sens. 2021, 175, 403–415. [Google Scholar] [CrossRef]
- Lin, A.; Sun, X.; Wu, H.; Luo, W.; Wang, D.; Zhong, D.; Wang, Z.; Zhao, L.; Zhu, J. Identifying Urban Building Function by Integrating Remote Sensing Imagery and POI Data. IEEE J. Sel. Top. Appl. Earth Obs. Remote Sens. 2021, 14, 8864–8875. [Google Scholar] [CrossRef]
- Deng, Z.; You, X.; Shi, Z.; Gao, H.; Hu, X.; Yu, Z.; Yuan, L. Identification of Urban Functional Zones Based on the Spatial Specificity of Online Car-Hailing Traffic Cycle. ISPRS Int. J. Geo-Inf. 2022, 11, 435. [Google Scholar] [CrossRef]
- Chen, B.; Zhang, H.; Wong, C.U.I.; Chen, X.; Li, F.; Wei, X.; Shen, J. Research on the Spatial Distribution Characteristics and Influencing Factors of Educational Facilities Based on POI Data: A Case Study of the Guangdong–Hong Kong–Macao Greater Bay Area. ISPRS Int. J. Geo-Inf. 2024, 13, 225. [Google Scholar] [CrossRef]
- Deng, Y. Research on the Method of Dividing Urban Functional Areas Based on Multi-Source Points of Interest Data. Master’s Thesis, Chinese Academy of Surveying and Mapping, Beijing, China, 2018. [Google Scholar]
- Pan, C.; Wu, S.; Li, E.; Li, H.; Liu, X. Identification of urban functional zones in Macau Peninsula based on POI data and remote information sensors technology for sustainable development. Phys. Chem. Earth Parts A/B/C 2023, 131, 103447. [Google Scholar] [CrossRef]
- Du, S.; Wu, Y.; Guo, L.; Fan, D.; Sun, W. How Does the 2D/3D Urban Morphology Affect the Urban Heat Island across Urban Functional Zones? A Case Study of Beijing, China. ISPRS Int. J. Geo-Inf. 2024, 13, 120. [Google Scholar] [CrossRef]
- Kong, B.; Ai, T.; Zou, X.; Yan, X.; Yang, M. A graph-based neural network approach to integrate multi-source data for urban building function classification. Comput. Environ. Urban Syst. 2024, 110, 102094. [Google Scholar] [CrossRef]
- Xie, X.; Xu, Y.; Feng, B.; Wu, W. Multiscale Urban Functional Zone Recognition Based on Landmark Semantic Constraints. ISPRS Int. J. Geo-Inf. 2024, 13, 95. [Google Scholar] [CrossRef]
- Cao, Y.; Liu, J.; Wang, Y.; Wang, L.; Wu, W.; Su, F. A study on the method for functional classification of urban buildings by using POI data. J. Geo-Inf. Sci. 2020, 22, 1339–1348. [Google Scholar] [CrossRef]
- Ehrlinger, L.; Wöß, W. Towards a Definition of Knowledge Graphs. SEMANTiCS (Posters, Demos, SuCCESS) 2016, 48, 2. [Google Scholar]
- Peng, C.; Xia, F.; Naseriparsa, M.; Osborne, F. Knowledge graphs: Opportunities and challenges. Artif. Intell. Rev. 2023, 56, 13071–13102. [Google Scholar] [CrossRef]
- Hogan, A.; Blomqvist, E.; Cochez, M.; D’amato, C.; Melo, G.D.; Gutierrez, C.; Kirrane, S.; Gayo, J.E.L.; Navigli, R.; Neumaier, S.; et al. Knowledge Graphs. ACM Comput. Surv. 2022, 54, 1–37. [Google Scholar] [CrossRef]
- Laurini, R. A conceptual framework for geographic knowledge engineering. J. Vis. Lang. Comput. 2014, 25, 2–19. [Google Scholar] [CrossRef]
- Hamdani, Y.; Xiao, G.; Ding, L.; Calvanese, D. An Ontology-Based Framework for Geospatial Integration and Querying of Raster Data Cube Using Virtual Knowledge Graphs. ISPRS Int. J. Geo-Inf. 2023, 12, 375. [Google Scholar] [CrossRef]
- Zheng, K.; Xie, M.H.; Zhang, J.B.; Xie, J.; Xia, S.H. A knowledge representation model based on the geographic spatiotemporal process. Int. J. Geogr. Inf. Sci. 2022, 36, 674–691. [Google Scholar] [CrossRef]
- Fan, R.; Wang, L.; Yan, J.; Song, W.; Zhu, Y.; Chen, X. Deep Learning-Based Named Entity Recognition and Knowledge Graph Construction for Geological Hazards. ISPRS Int. J. Geo-Inf. 2019, 9, 15. [Google Scholar] [CrossRef]
- Li, W.; Wang, S.; Chen, X.; Tian, Y.; Gu, Z.; Lopez-Carr, A.; Schroeder, A.; Currier, K.; Schildhauer, M.; Zhu, R. GeoGraphVis: A Knowledge Graph and Geovisualization Empowered Cyberinfrastructure to Support Disaster Response and Humanitarian Aid. ISPRS Int. J. Geo-Inf. 2023, 12, 112. [Google Scholar] [CrossRef]
- Usui, H.; Teraki, A.; Okunuki, K.i.; Satoh, T. A comparison of neighbourhood relations based on ordinary Delaunay diagrams and area Delaunay diagrams: An application to define the neighbourhood relations of buildings. Int. J. Geogr. Inf. Sci. 2020, 34, 2177–2203. [Google Scholar] [CrossRef]
- Xie, X.; Liu, Y.; Xu, Y.; He, Z.; Chen, X.; Zheng, X.; Xie, Z. Building Function Recognition Using the Semi-Supervised Classification. Appl. Sci. 2022, 12, 9900. [Google Scholar] [CrossRef]
- Chen, Y.; Liu, X.; Li, X.; Liu, X.; Yao, Y.; Hu, G.; Xu, X.; Pei, F. Delineating urban functional areas with building-level social media data: A dynamic time warping (DTW) distance based k -medoids method. Landsc. Urban Plan. 2017, 160, 48–60. [Google Scholar] [CrossRef]
- Huang, Y. Construction of the Geographic Scenario Data Model and Its Ontological Representation. Ph.D. Thesis, Nanjing Normal University, Nanjing, China, 2020. [Google Scholar] [CrossRef]
- Zhiwei, W.; Yi, X.; Ying, T.; Wenjia, X.; Yang, W. Linear building pattern recognition via spatial knowledge graph. Acta Geod. Cartogr. Sin. 2023, 52, 1355–1363. [Google Scholar]
- Qiu, P.; Gao, J.; Yu, L.; Lu, F. Knowledge Embedding with Geospatial Distance Restriction for Geographic Knowledge Graph Completion. ISPRS Int. J. Geo-Inf. 2019, 8, 254. [Google Scholar] [CrossRef]
- Wang, L.; Zhang, J.; Yao, G. The analysis and experiments of least-squares method for settlements generalization. In Proceedings of the 2012 IEEE International Conference on Information Science and Technology, Wuhan, China, 23–25 March 2012; pp. 210–214. [Google Scholar] [CrossRef]
- Regnauld, N. Contextual Building Typification in Automated Map Generalization. Algorithmica 2001, 30, 312–333. [Google Scholar] [CrossRef]
- Fei, N.; Gao, Y.; Lu, Z.; Xiang, T. Z-Score Normalization, Hubness, and Few-Shot Learning. In Proceedings of the 2021 IEEE/CVF International Conference on Computer Vision (ICCV), Montreal, QC, Canada, 10–17 October 2021; pp. 142–151. [Google Scholar] [CrossRef]
- Curtis, A.; Smith, T.; Ziganshin, B.; Elefteriades, J. The Mystery of the Z-Score. AORTA 2016, 04, 124–130. [Google Scholar] [CrossRef]
- Chen, X.; Jia, S.; Xiang, Y. A review: Knowledge reasoning over knowledge graph. Expert Syst. Appl. 2020, 141, 112948. [Google Scholar] [CrossRef]
- Wei, Z.; Xu, W.; Xiao, Y.; Shu, M.; Cheng, L.; Wang, Y.; Liu, C. Enhancing building pattern recognition through multi-scale data and knowledge graph: A case study of C-shaped patterns. Int. J. Digit. Earth 2023, 16, 3860–3881. [Google Scholar] [CrossRef]
- Fang, J.; Yan, X. Classification of multi-modal remote sensing images based on knowledge graph. Int. J. Remote Sens. 2023, 44, 4815–4835. [Google Scholar] [CrossRef]
- Liu, X.; Lu, H.; Li, H. Intelligent generation method of emergency plan for hydraulic engineering based on knowledge graph-take the South-to-North Water Diversion Project as an example. LHB 2022, 108, 2153629. [Google Scholar] [CrossRef]
- Da, M.; Zhong, T.; Huang, J. Knowledge Graph Construction to Facilitate Indoor Fire Emergency Evacuation. ISPRS Int. J. Geo-Inf. 2023, 12, 403. [Google Scholar] [CrossRef]
- Jiang, B.; Tan, L.; Ren, Y.; Li, F. Intelligent Interaction with Virtual Geographical Environments Based on Geographic Knowledge Graph. ISPRS Int. J. Geo-Inf. 2019, 8, 428. [Google Scholar] [CrossRef]
- Guo, C.; Xu, T.; Liu, L. Construction of Knowledge Graph Based on Geographic Ontology. IOP Conf. Ser. Earth Environ. Sci. 2019, 252, 052161. [Google Scholar] [CrossRef]
- Liu, E.J.; Yan, X.Y. A universal opportunity model for human mobility. Sci. Rep. 2020, 10, 4657. [Google Scholar] [CrossRef]
- Schläpfer, M.; Dong, L.; O’Keeffe, K.; Santi, P.; Szell, M.; Salat, H.; Anklesaria, S.; Vazifeh, M.; Ratti, C.; West, G.B. The universal visitation law of human mobility. Nature 2021, 593, 522–527. [Google Scholar] [CrossRef]
- Yuan, J.; Zheng, Y.; Xie, X. Discovering regions of different functions in a city using human mobility and POIs. In Proceedings of the Proceedings of the 18th ACM SIGKDD International Conference on Knowledge Discovery and Data Mining, Beijing, China, 12–16 August 2012; pp. 186–194. [Google Scholar] [CrossRef]
- Irawan, M.Z.; Belgiawan, P.F.; Joewono, T.B.; Bastarianto, F.F.; Rizki, M.; Ilahi, A. Exploring activity-travel behavior changes during the beginning of COVID-19 pandemic in Indonesia. Transportation 2022, 49, 529–553. [Google Scholar] [CrossRef]
- Yan, X.Y.; Wang, W.X.; Gao, Z.Y.; Lai, Y.C. Universal model of individual and population mobility on diverse spatial scales. Nat. Commun. 2017, 8, 1639. [Google Scholar] [CrossRef] [PubMed]
- Chen, J.; Wang, C.; Zhang, Y.; Li, D. Measuring spatial accessibility and supply-demand deviation of urban green space: A mobile phone signaling data perspective. Front. Public Health 2022, 10, 1029551. [Google Scholar] [CrossRef] [PubMed]
- Bing, J.; Chen, M.; Yang, M.; Huang, W.; Gong, Y.; Nie, L. Pre-Trained Semantic Embeddings for POI Categories Based on Multiple Contexts. IEEE Trans. Knowl. Data Eng. 2023, 35, 8893–8904. [Google Scholar] [CrossRef]
- Huang, W.; Cui, L.; Chen, M.; Zhang, D.; Yao, Y. Estimating urban functional distributions with semantics preserved POI embedding. Int. J. Geogr. Inf. Sci. 2022, 36, 1905–1930. [Google Scholar] [CrossRef]
- Liu, K.; Yin, L.; Lu, F.; Mou, N. Visualizing and exploring POI configurations of urban regions on POI-type semantic space. Cities 2020, 99, 102610. [Google Scholar] [CrossRef]
- Zhang, F.; Sun, Q.; Ma, J.; Lyu, Z.; Huang, Z. A polygonal buildings aggregation method considering obstacle elements and visual clarity. Geocarto Int. 2023, 38, 2266672. [Google Scholar] [CrossRef]


Disclaimer/Publisher’s Note: The statements, opinions and data contained in all publications are solely those of the individual author(s) and contributor(s) and not of MDPI and/or the editor(s). MDPI and/or the editor(s) disclaim responsibility for any injury to people or property resulting from any ideas, methods, instructions or products referred to in the content. |
© 2024 by the authors. Licensee MDPI, Basel, Switzerland. This article is an open access article distributed under the terms and conditions of the Creative Commons Attribution (CC BY) license (https://creativecommons.org/licenses/by/4.0/).