Article

Grid Density Algorithm-Based Second-Hand Housing Transaction Activity and Spatio-Temporal Characterization: The Case of Shenyang City, China

College of Management, Shenyang Jianzhu University, Shenyang 110168, China
*
Author to whom correspondence should be addressed.
ISPRS Int. J. Geo-Inf. 2024, 13(8), 286; https://doi.org/10.3390/ijgi13080286
Submission received: 2 July 2024 / Revised: 12 August 2024 / Accepted: 15 August 2024 / Published: 16 August 2024

Abstract

:
Second-hand housing transactions constitute a significant segment of the real estate market and are vital for its robust development. The dynamics of these transactions mirror the housing preferences of buyers, and their spatial and temporal analysis elucidates evolving market patterns and buyer behavior. This study introduces an innovative grid density clustering algorithm, dubbed the RScan algorithm, which integrates Bayesian optimization with grid density techniques. This composite methodology is employed to assess clustering outcomes, optimize hyperparameters, and facilitate detailed visualization and analysis of transaction activity across various regions. Focusing on Shenyang, a major urban center in Northeast China, the research spans from 2018 to 2023, exploring the second-hand housing transaction activity and its spatio-temporal attributes. The results reveal temporal fluctuations in transaction intensity across different Shenyang regions, although core areas of high activity remain constant. These regions display a heterogeneous pattern of irregularly stepped and clustered distributions, with a notable absence of uniformly high-activity zones. This study pioneers a novel methodological framework for investigating second-hand housing transactions, offering crucial insights for market development and policy formulation in Shenyang.

1. Introduction

Since the initiation of real estate market reforms in 1998, China’s real estate market has transitioned from a phase of rapid growth to a more stable developmental trajectory. In 2020, the Chinese government implemented a series of policies related to real estate aimed at stabilizing the market [1]. These measures, anchored by the principle of “housing without speculation”, include “transferring with charge”, “recognizing houses but not loans”, and “lowering mortgage rates.” These initiatives have effectively stimulated the second-hand housing market, generating various transaction hotspots. The analysis of second-hand housing transaction activity not only provides a deeper insight into the evolution of homebuyers’ preferences but also helps to elucidate the dynamics of the market and the behavioral characteristics of buyers. Consequently, investigating the spatio-temporal dynamics of these transactions is of significant research value as it promotes efficient resource utilization, optimal land use, community economic development, and balanced growth in the housing market.
Since the publication of the first research paper on second-hand housing in 2000, scholars have extensively examined this sector from various perspectives and methodologies, focusing on areas such as policy influence, appraisal, and taxation.
In studying the impact of government policies on the prices of second-hand housing, Yujie Huang and HuiChul An developed a system dynamics model to explore the influence of these policies on second-hand housing prices, providing a systematic framework for understanding the relationship between these policies and the market [2]. However, the complexity and underlying assumptions of the model may limit its broader applicability. Chuanhao Tian and colleagues explored the spatial and temporal effects of city–county mergers on house prices using the double-difference method and characteristic price model in the Fuyang and Xihu areas. Nevertheless, this approach is only effective when there is a distinct contrast between the conditions before and after policy implementation and fails to capture the ongoing impacts of a continuous policy [3]. Yaoyao Li and associates analyzed second-hand house transaction data in Langfang City using a regression discontinuity design and observed that the HPR policy had an insignificant impact on second-hand house prices, although it revealed significant spatial heterogeneity. This highlights regional variations in policy impacts, but the limitations of the RDD approach make it challenging to capture the dynamic effects of HPR policies, such as policy delays and the duration of effects [4]. Ying Peng and Chuanhao Tian investigated the effects of the demolition and redevelopment of urban villages on second-hand house prices in Hangzhou using a multi-period double-difference model, yet this model does not adequately capture the dynamics of policy effects [5]. To explore the interaction mechanisms between the real estate market, second-hand housing transactions, and policy interventions, Shenjun Qi and colleagues developed a dynamic model of second-hand housing transactions, using policy interventions as a control variable and simulating the impact of different policy scenarios. Although the system dynamics approach is adept at managing complex market systems, its outcomes are heavily dependent on the assumptions and parameters set within the model, which is an aspect of the study that requires further enhancement [6].
To enhance the valuation of urban real estate, develop an accurate and efficient bulk assessment model, and advance the reform of the real estate tax system, it is imperative to further investigate and develop models and methods tailored for appraising second-hand commercial housing [7]. Lulin Xu and Zhongwu Li utilized machine learning techniques in conjunction with web crawlers, Geographic Information Systems, and natural language processing to construct a two-layer stacked framework that improves the performance of models assessing second-hand house prices. While this approach enhances model performance, it demands high-quality data and robust model generalization capabilities, potentially underperforming in regions with limited or heterogeneous data [8]. Dai et al. employed the least squares method alongside real estate transaction data and the stand-alone board rate to dynamically adjust the batch appraisal benchmark price for taxation purposes, using real estate agency appraisals as a benchmark. Although this method offers innovative approaches for tax assessment, the speed and precision of its adjustments require further validation in the context of the highly volatile real estate market [9]. Guangli Liu and Xiaohui Zong used a twin support vector regression method, based on data mining and big data analytics, to predict second-hand house prices, providing insights for government macro-control and market demand forecasting. However, effectively applying these forecasts to actual regulatory measures remains a challenge [10].
In examining the transaction behavior of second-hand houses and their influencing factors, Rui Wang and Deng-Feng Li explored the bargaining dynamics between buyers and sellers in the second-hand housing market, developing both indefinite and finite bargaining models and deriving equilibrium solutions through game theory analysis. However, actual market bargaining often includes irrational behaviors, rendering the model’s application scenario somewhat idealized [11]. Jingjing Feng and Yan Hu investigated bargaining issues using the final offer arbitration model to determine a Nash equilibrium solution, but the generalizability and practical applicability of this model require further validation [12]. Xiuzhi Zhang et al. discovered that the entry of Chain Home Realty, a prominent Chinese platform, leads to reduced prices and enhanced sales of second-hand houses. Despite attempts to control for endogeneity bias using various methods, the broad applicability and depth of the findings are somewhat constrained by the limitations of relying on secondary data and the absence of detailed operational insights from the platform [13]. Hui Eddie C. M. and Liang Cong initially explored the Venturi effect of the Special Stamp Duty (SSD) on Hong Kong’s real estate market using spatial scan statistics and multivariate logistic regression analyses. Although this approach introduced a novel spatial perspective, the generalizability of the results and the long-term impacts require further examination [14].
Regarding the investigation into the determinants of second home prices, Haimin Wei and Wenjia Hu utilized interpretative structural modeling to elucidate the key factors influencing these prices. However, the explanatory power of the model and the practical relevance of their findings might be constrained by the limited breadth and representativeness of the data [15]. Song Xu and Zhen Zhang employed a multi-scale geographically weighted regression (MGWR) model to examine the spatial distribution characteristics and influential factors of second-hand house transaction prices in Binhu New Area. They identified significant spatial positive correlations and heterogeneity, with the proximity to schools being a pivotal factor. Nonetheless, the applicability of their conclusions to broader urban contexts may be limited due to data and study scope constraints [16]. Weizheng Liang et al. analyzed second-hand housing data using TF-IDF and K-means methods, pinpointing housing type as a primary determinant of price. However, they did not extensively explore other potential factors such as socio-economic characteristics and policy influences, and the necessity for manual setting of cluster numbers in K-means clustering introduces subjective bias, thus limiting the thoroughness of the analysis [17]. Perez-Sanchez V.R. et al. explored the influence of residential characteristics and location on the asking prices of second homes in Alicante using a characteristic price model. Their findings indicate substantial variations in residential asking prices based on these factors, yet other socio-economic influences on prices were not considered [18]. Ronghui Tan et al. demonstrated the positive influence of metro station proximity on housing prices by examining land use changes around metro stations and the prices of second-hand houses in Wuhan City. However, the absence of authoritative sample data on house prices constrains a comprehensive analysis of the relationship between subway stations and house prices [19]. Ling Zhang et al. investigated the spatial heterogeneity of shopping center accessibility on house prices using a geographically weighted regression model based on second-hand housing transaction data in Hangzhou. Nevertheless, due to data and temporal limitations, the broad applicability of their findings warrants further investigation [20]. W.D. Chen analyzed the failures and policy impacts on China’s real estate market through a dynamic equilibrium model, concluding that the 2010 policy enhanced market efficiency and mitigated the rapid increase in house prices. However, the analysis did not adequately consider the long-term economic changes and regional disparities affecting policy efficacy [21]. Shichang Ma et al. assessed the appreciation, dynamic, and heterogeneity effects of elevator installations on house prices using transaction data from second-hand houses with elevators in old residential areas of Beijing, employing a multi-period double-difference model. Nevertheless, the homogeneity of the data region and the stringent assumptions of the model restrict the generalizability of the results [22].
In exploring the trends in the spatial and temporal evolution of second-hand house prices, Zheng Yin et al. used spatial autocorrelation and spatial Markov methods to empirically analyze second-hand houses in Hefei City. They found that house prices show divergent trends in the north–south direction with notable spatial autocorrelation. However, the small sample size and brief time span of the study are inadequate to fully capture the complexity and dynamics of the overall market [23].
The existing body of literature provides a robust theoretical and empirical framework for investigating government policies, assessment methods, transaction behaviors, and influencing factors within the real estate sector. Despite these advances, further enhancements are needed in the innovation of research methodologies, the expansiveness of model applications, and the practicality of results, particularly in the context of second-hand housing prices. Furthermore, a more detailed analysis of the second-hand housing market is warranted, taking into account specific regional characteristics as well as spatial and temporal dynamics. These studies typically consider variations in economic development, market supply and demand, geographical location, distribution of educational resources, and living conveniences [16,17,18]. Consequently, the frequency of second-hand housing transactions exhibits significant regional disparities. To date, the concept of “activity” in this context, which could serve as a metric to quantify the frequency of transaction-related events and thus reflect the intensity of market activity, has not been thoroughly investigated. This oversight represents a notable gap in the research. In this study, we define transaction activity of second-hand houses as the rate of change in the number of transactions per region, where transactions are recorded when houses are registered with the housing authority for a title change and successfully transferred within a specified timeframe.
Research on activity has primarily focused on exploring influencing factors and developing models in various domains, employing big data analytics and machine learning to uncover complex patterns and challenges in the real world. The relevant literature includes studies on urban hotspot area mining [24,25,26,27,28], public space utilization [29], and location recommendation frameworks [30]. Building on this foundation, the current study aims to advance this research paradigm by integrating Geographic Information Systems (GIS) and machine learning technologies [31], drawing inspiration from hotspot detection clustering [32,33], and applying Bayesian optimization algorithms [34,35,36,37,38,39] alongside grid density clustering algorithms [27,28,40,41,42,43,44]. In an innovative approach, we propose to investigate the activity of second-hand housing transactions in Shenyang city as a case study. This research will identify active transaction areas and analyze their spatio-temporal characteristics to gain insights into the preferences of transaction groups and market dynamics. Ultimately, this study seeks to provide robust data support for decision-making and enhance the understanding of the operational trends in the real estate market.
The study of second-hand house transaction activity presents a compelling avenue for in-depth research. A detailed analysis of transaction activity across various regions and time periods elucidates the dynamic fluctuations within the second-hand property market. This not only furnishes a scientific foundation for government bodies to devise effective real estate policies but also offers crucial insights for sellers to set reasonable property prices and for buyers to optimize the timing of their purchases, thereby facilitating market transactions. Furthermore, this research addresses existing gaps in academic studies concerning the activeness of second-hand housing transactions, establishing a robust theoretical base and literature framework for future investigations.
The principal contributions of this study are outlined as follows:
(1)
Innovations in perspective:
This study pioneers research into the activity of second-hand housing transactions, augmenting the theoretical framework for managing second-hand housing transactions within the real estate market. It addresses research voids in the domain of second-hand housing transaction management and provides fresh perspectives and theoretical underpinnings for subsequent research in related areas.
(2)
Methodological innovation:
Building upon the existing grid density clustering algorithm, this study introduces the RScan algorithm, which incorporates elements of Bayesian optimization. This algorithm enhances the technical capabilities for analyzing data from the second-hand housing market and fosters methodological advancements in the realm of real estate data analysis.
(3)
Interdisciplinary research:
By integrating machine learning techniques with real estate studies, this research applies advanced algorithms and data analysis methods to the second-hand housing market. This approach not only expands the research boundaries within the real estate field but also introduces novel methodologies and perspectives for exploring this sector.

2. Materials and Methods

2.1. Data

2.1.1. Data Sources

Shell.com was chosen as the primary data source for this study. As one of the largest real estate portals in China and a major second-hand housing website in Shenyang, Shell.com is recognized for its vast user base and robust data collection mechanism, ensuring the credibility of second-hand housing transaction data. The website covers the second-hand housing market across various cities, is mature in development, provides comprehensive and frequently updated data to reflect market changes, and maintains a strong reputation among users.

2.1.2. Data Acquisition

In this study, data were collected using a Python web crawler. More than 90,000 data entries from Shenyang City on Shell.com were automatically identified and crawled multiple times, spanning from August 2018 to August 2023. By obtaining an API key from Gaode Maps, the Python crawler technology was also used to gather latitude and longitude information of the transacted second-hand houses. Data were then cleaned and preprocessed according to research needs, removing noise to yield 87,632 valid data entries. The turnover statistics for specific study areas in Shenyang City are illustrated in Figure 1, with corresponding data shown in Table 1.

2.1.3. Data Range

The data range for this study was confined within the fourth ring road of Shenyang. The selection of Shenyang City was primarily due to the following reasons:
(1)
Representation: As the capital of Liaoning Province, Shenyang is highly representative of the second-hand housing market in Northeast China. It is an influential economic, cultural, and transportation hub in the region, making it a significant area for study.
(2)
Market size: Shenyang boasts a large population, a positive population growth rate, a relatively developed economy, and a substantial second-hand housing market. Studying this market in Shenyang provides comprehensive data, facilitating in-depth analysis and research.
(3)
Data availability: Accurate data related to the secondary market are more readily available in Shenyang, which is crucial for conducting both quantitative and qualitative analyses.
The algorithm results are specifically distributed within the fourth ring road of Shenyang. There is a notable disparity in development levels between various districts within Shenyang and the main urban areas. This study focuses on Tiexi District, Heping District, Shenhe District, Hunnan District, Dandong District, Huanggu District, Yuhong District, Sujiatun District, and Shenbei New District. Regions with 0–100 second-hand housing transactions over the past five years are considered inactive second-hand housing market areas and are excluded from the study. This exclusion ensures that the study is more targeted and focuses on analyzing the market situation and characteristics of the major regions, thus providing more precise and targeted research findings. It also avoids confusion and inaccuracies in the results due to differences between primary and secondary urban areas.

2.2. Methods

2.2.1. Methodology

Clustering algorithms are pivotal in machine learning for analyzing extensive, multidimensional datasets and hold substantial value in addressing big data analytical challenges [43]. The grid density clustering algorithm employed in this study is a density-based approach where the data space is segmented into grids, and clustering is achieved by evaluating the density of data points within these grids [32,42]. Unlike traditional distance-based clustering methods, the grid density algorithm excels in identifying irregularly shaped clusters without the need for pre-defined cluster counts. This algorithm has demonstrated its efficacy across various domains, including image segmentation [41,44] and spatial data analysis [40,45]. Nonetheless, it requires the manual determination of grid dimensions and density thresholds, which introduces a degree of subjectivity. Given the complexities and uncertainties inherent in the development of the second-hand housing market, a reliance on traditional empirical methods or subjective judgments may prove inadequate. To address this, the study incorporates the Bayesian optimization algorithm to refine the selection of grid parameters scientifically. This algorithm treats grid dimensions and thresholds as hyperparameters [35], optimizing them through a Gaussian process model that treats the objective function as a black-box function [46]. This method facilitates more efficient hyperparameter estimation compared to traditional techniques [39,46,47,48].
Building on existing research and emphasizing an interdisciplinary approach, this study uniquely combines grid density clustering [32,41,43,49], GScan [42], and Bayesian optimization algorithms [34,36,38,39]. An enhanced density algorithm, the RScan algorithm, is introduced by integrating Bayesian optimization into the framework of grid density and GScan algorithms, marking a significant advancement in the application of machine learning techniques to the real estate sector.

2.2.2. RScan Algorithm Core Content Definition

(1)
Definition 1—Region:
Given a spatial dataset  S d = { p 1 , p 2 , . . . , p n } where each  p i ( 1 i n )  represents a spatial data sampling point, the extent of the area containing this spatial data collection can be defined as shown in Table 2.
(2)
Definition 2—Grid length and threshold:
Grid length determines the size of the region  D    to be partitioned into grids, denoted as k.
A threshold is used to determine the neighborhood around a data point, denoted as  λ . A grid is only considered to be an active region if the number of data points in the grid exceeds this set threshold  λ .
(3)
Definition 3—Grid cells:
For region  D , whose longitude range is in  [ l o n m i n l o n m a x ]    and latitude range is in  [ l a t m i n l a t m a x ] , the region  D  is partitioned into two dimensions, longitude and latitude. Each attribute dimension is equidistributed into small intervals of length  k . The region  D  is then divided into a number of rectangular cells of size  k × k , each consisting of small intervals, referred to as grid cells, denoted as  U
(4)
Definition 4—Grid density:
For a grid cell  U , the spatial data points belonging to the grid cell are computed, the total number of which is the grid density of the grid cell  U , denoted by  d e n ( U ) . When   d e n ( U ) = 0 , it is called an empty grid cell; when  d e n ( U ) > 0 , it is referred to as a non-empty grid cell.
(5)
Definition 5—Active grid cells:
For a grid cell  U , if its grid density satisfies the condition  d e n ( U ) λ then the grid cell  U    is said to be an active grid cell; otherwise, it is referred to as an ordinary grid cell.
(6)
Definition 6—Grid level classification:
The geographic area is divided into different grid cells, and each grid cell is assigned a level based on different levels of the number of second-hand home transactions within each grid area to identify and categorize the activity in different areas.
(7)
Definition 7—Grid reachability:
For two grid cells  U  and  U , if there exists a sequence of grids  U 1 , U 2 , . . . , U a 1 , U a , where   U 1 = U i    and  U a = U j and if for  1 t a , the grid density of each grid cell Ut is directly reachable to its next grid cell   U t + 1 , then  U i  is said to be grid-density reachable for  U j . This also means that  U i  is connected to  U j  through the direct reachability of a series of grid cells, i.e.,  U i  grid is reachable to  U j .
(8)
Definition 8—Grid direct reachability:
There exists a direct connection between two grid cells without passing through other grid cells, provided that the distance between them is within reasonable limits. In a given set of grids  U , there exist two grid cells  U i  and  U j  such that the distance between them does not exceed α times the size of the grid cell  k , i.e., the following condition is satisfied:  d i s ( U i , U j ) α × k .
Where  d i s ( U i , U j )  denotes the distance between grid cells  U i  and  U j ,  k    is the grid cell size, and  α    is the distance coefficient. Typically, the distance coefficient  α  takes a value between 1 and 2, often taking the value of 1.3.
(9)
Definition 9—Active region:
An active region is a non-empty subset  H    of a given set  U    of grid cells that meets the following conditions as shown in Table 3:
In essence, a region consisting of a grid set  H  qualifies as an active region if it forms a dense, interconnected, and maximally inclusive subset of grid cells. This active region represents a significant level of activity within the second-hand housing market.

2.2.3. Evaluation of the RScan Algorithm

Evaluating the clustering outcomes achieved through optimal hyperparameters is crucial for verifying the accuracy and effectiveness of the active region mining results. The RScan algorithm, an unsupervised lattice density clustering algorithm, cannot be assessed directly using external metrics due to the absence of actual labeling or categorical information for comparison. Consequently, internal evaluation metrics such as the silhouette coefficient and Davies–Bouldin Index are employed to gauge the compactness, separation, and overall distribution of clusters.
The silhouette coefficient is utilized to measure both the cohesion and separation of the clustering results. For each sample point ( x ) its silhouette coefficient s ( x ) is computed. The average of these silhouette coefficients across all sample points is then calculated to represent the overall clustering result’s silhouette coefficient.
The Davies–Bouldin Index (DBI) evaluates the validity and separateness of the clustering results. It is determined based on the distance between clusters and the cohesion within each cluster. The DBI calculates the quality of clusters by assessing the ratio of the average distance between clusters to the cohesion within those clusters. The calculation is as follows:
s ( x ) = b ( x ) a ( x ) m a x { a ( x ) , b ( x ) }
Silhouette   Coefficient = mean ( s ( x ) )
D B I ( i ) = c o h e s i o n ( i ) + c o h e s i o n ( j ) s e p a r a t i o n ( i , j )
D B I = mean ( D B I ( i ) )
where  a ( x )  is the average distance of sample point x from all other sample points in the same cluster (cohesion) and b ( x )  is the average distance between sample point  x and all sample points in different clusters in the nearest neighbor (separation).
For each cluster i,  D B I ( i ) is calculated with its nearest neighboring cluster j . Subsequently, the average D B I ( i ) across all values, DBI(i), is computed; cohesion is defined as the average distance between all sample points in a cluster i ; and separation is the average distance between cluster i and other clusters.

2.2.4. RScan Algorithm Steps and Processes

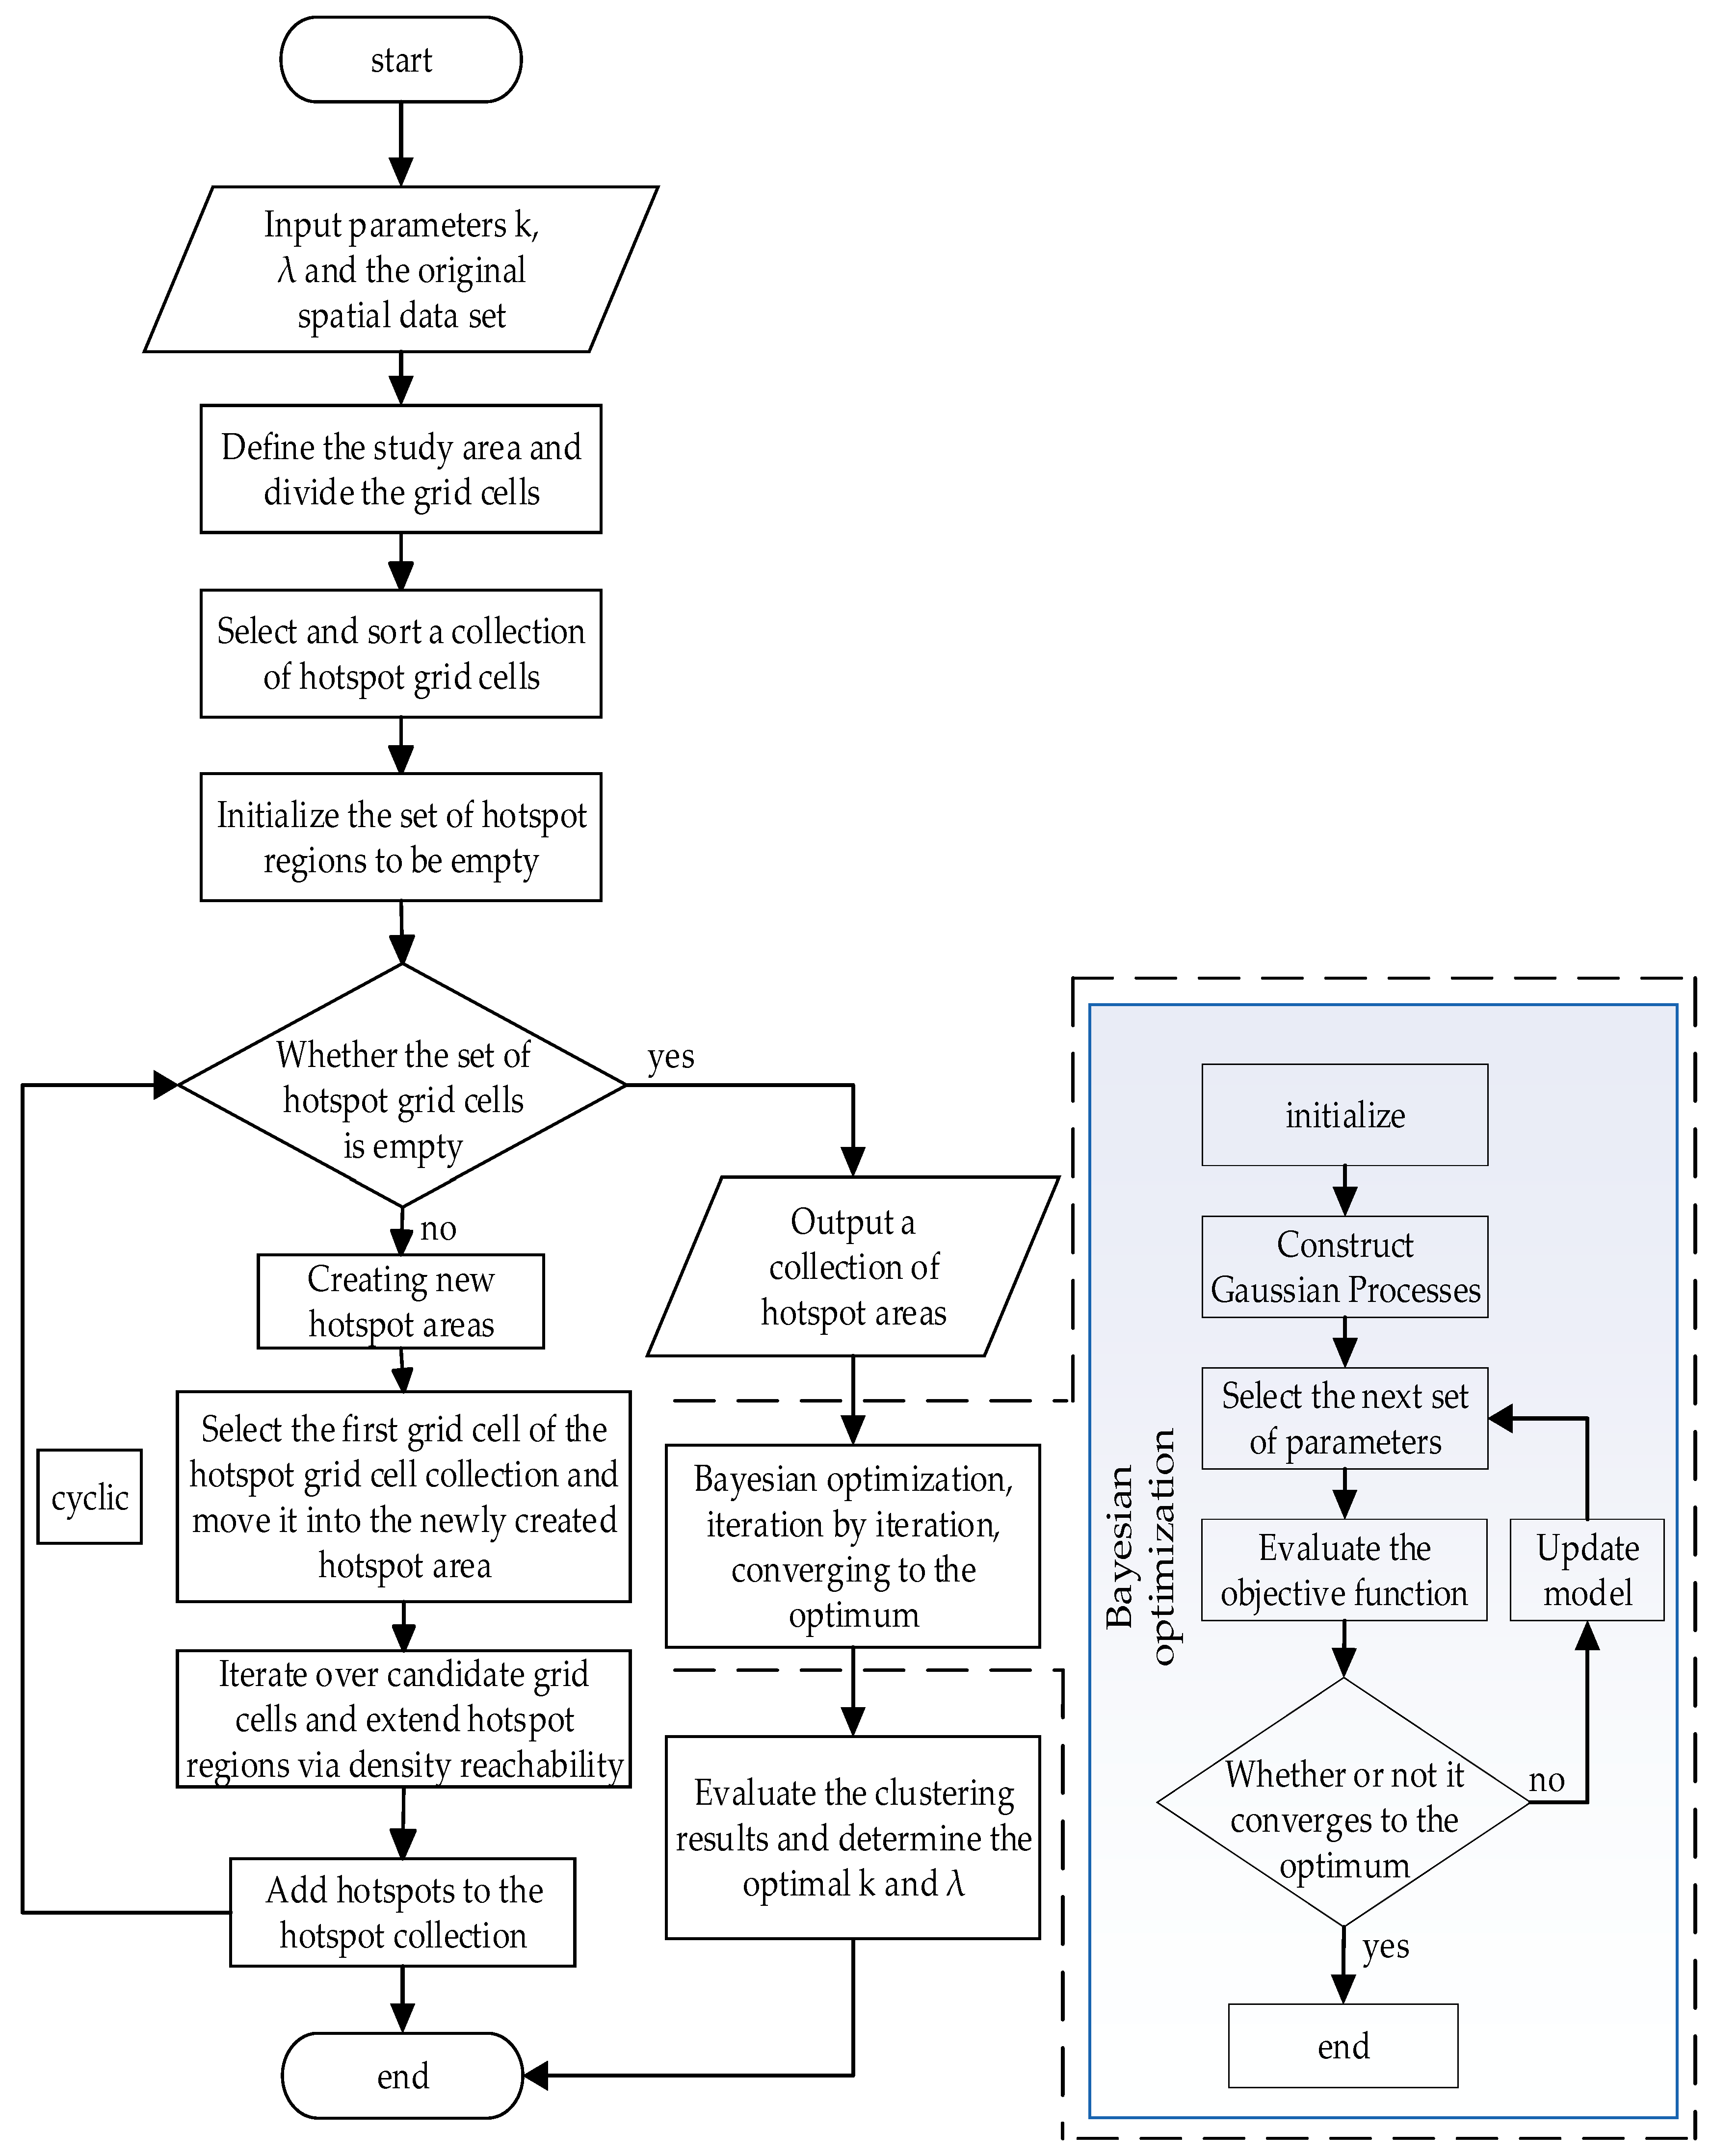
Distinct from the grid density clustering algorithm and the GScan algorithm, this study employs a Bayesian optimization algorithm to adjust hyperparameters, determining the optimal grid cell size k and grid density threshold λ , and assesses the clustering results using internal evaluation metrics. The aggregated results for hotspot areas reflect the spatial aggregation pattern of secondary housing transaction activity. As depicted in Figure 2, the main steps of the RScan algorithm include the following:
(1)
Enter the original spatial dataset with estimates for k   and λ as initial values.
(2)
The area covered by the spatial data objects is divided into a series of non-overlapping grid cells of size k × k .
(3)
Iterate over the original dataset and map the spatial data to the corresponding grid cells using a mapping function.
(4)
Calculate the data density within each grid cell to identify hotspot grid cells and remove any common, non-hotspot grid cells.
(5)
Analyze the distribution of data points within hotspot grid cells, calculate their locations, and merge them based on proximity to form regions indicative of varying levels of second-hand housing transaction activity.
(6)
Apply Bayesian optimization algorithms (BOA) to the grid cell edge length k and density threshold λ , iterating until optimal parameters are achieved.
(7)
Assess the performance of the RScan algorithm using the selected clustering evaluation metrics.
(8)
Input the improved values for k   and λ and repeat steps 1–7 to visualize and refine the active region mining results.

3. Results

3.1. Performance Evaluation Results

This study employs both internal assessment metrics and visualization methods to evaluate the clustering results of the RScan algorithm. When evaluating internal indicators, the silhouette coefficient ranges between −1 and 1: values closer to 1 indicate better clustering quality, values near 0 suggest average clustering quality, and values closer to −1 denote poor clustering quality. The Davies–Bouldin Index (DBI), which assumes values greater than or equal to 0, indicates that lower values correspond to better clustering quality.
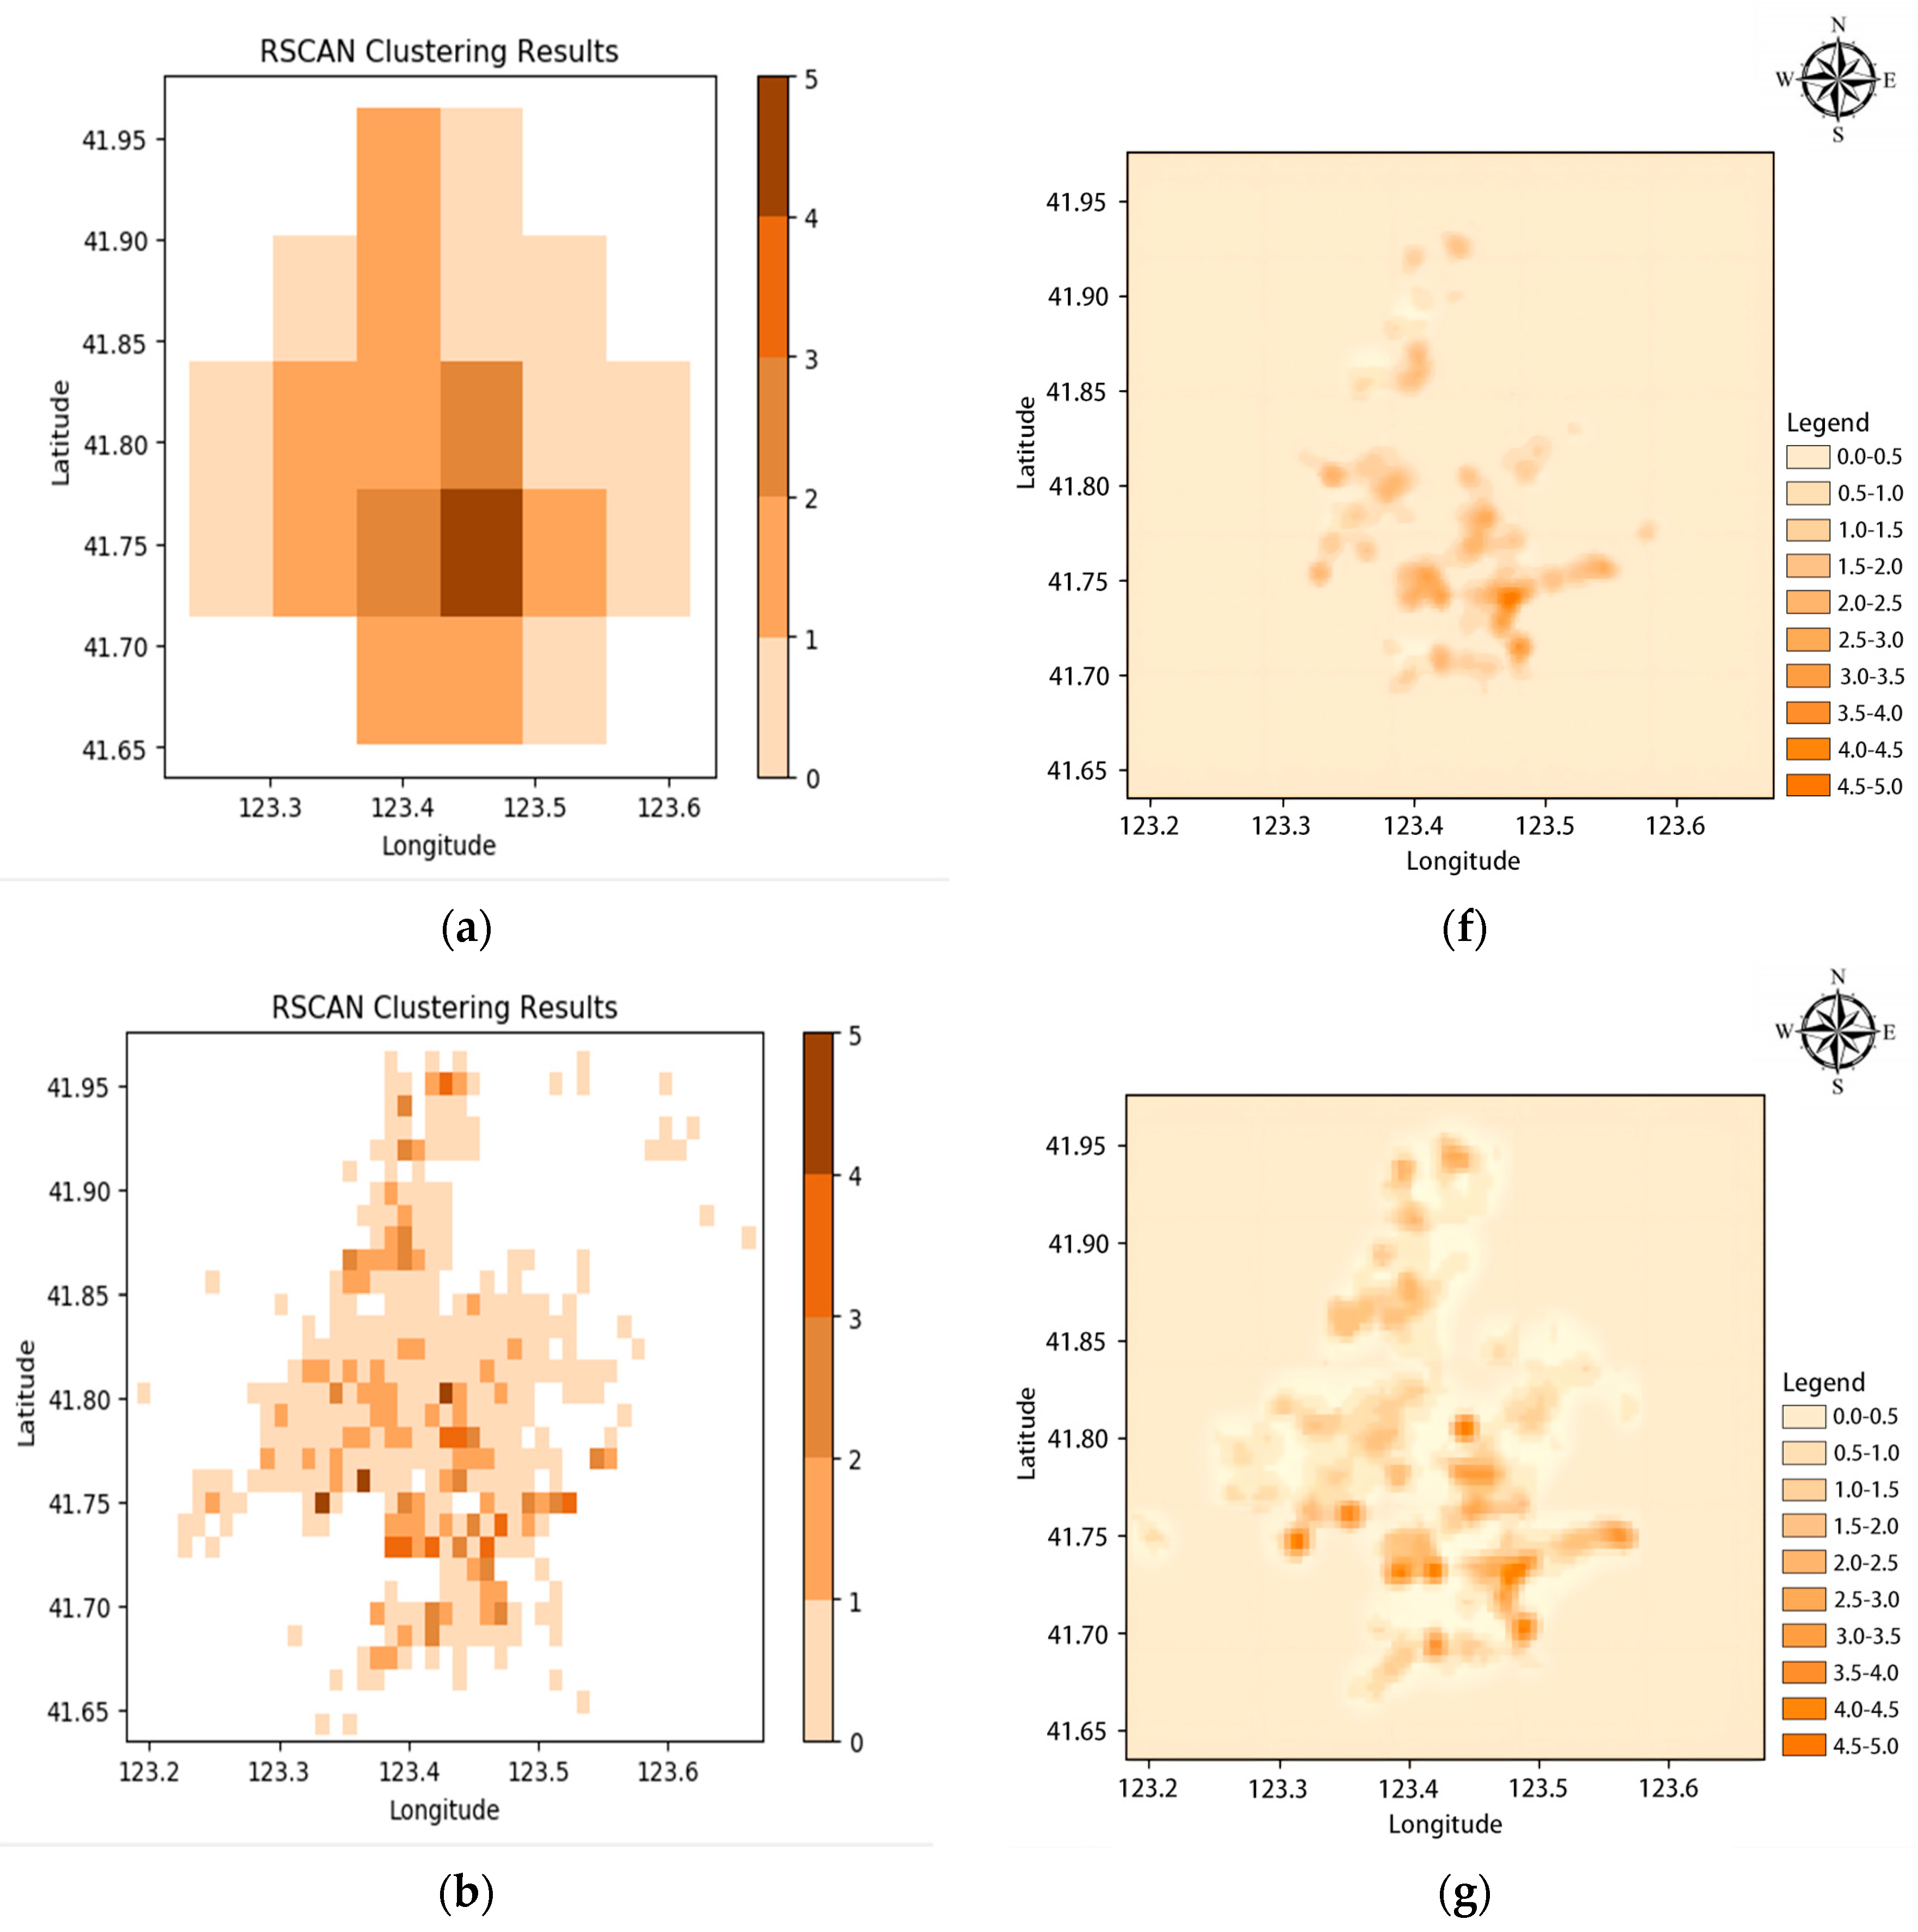
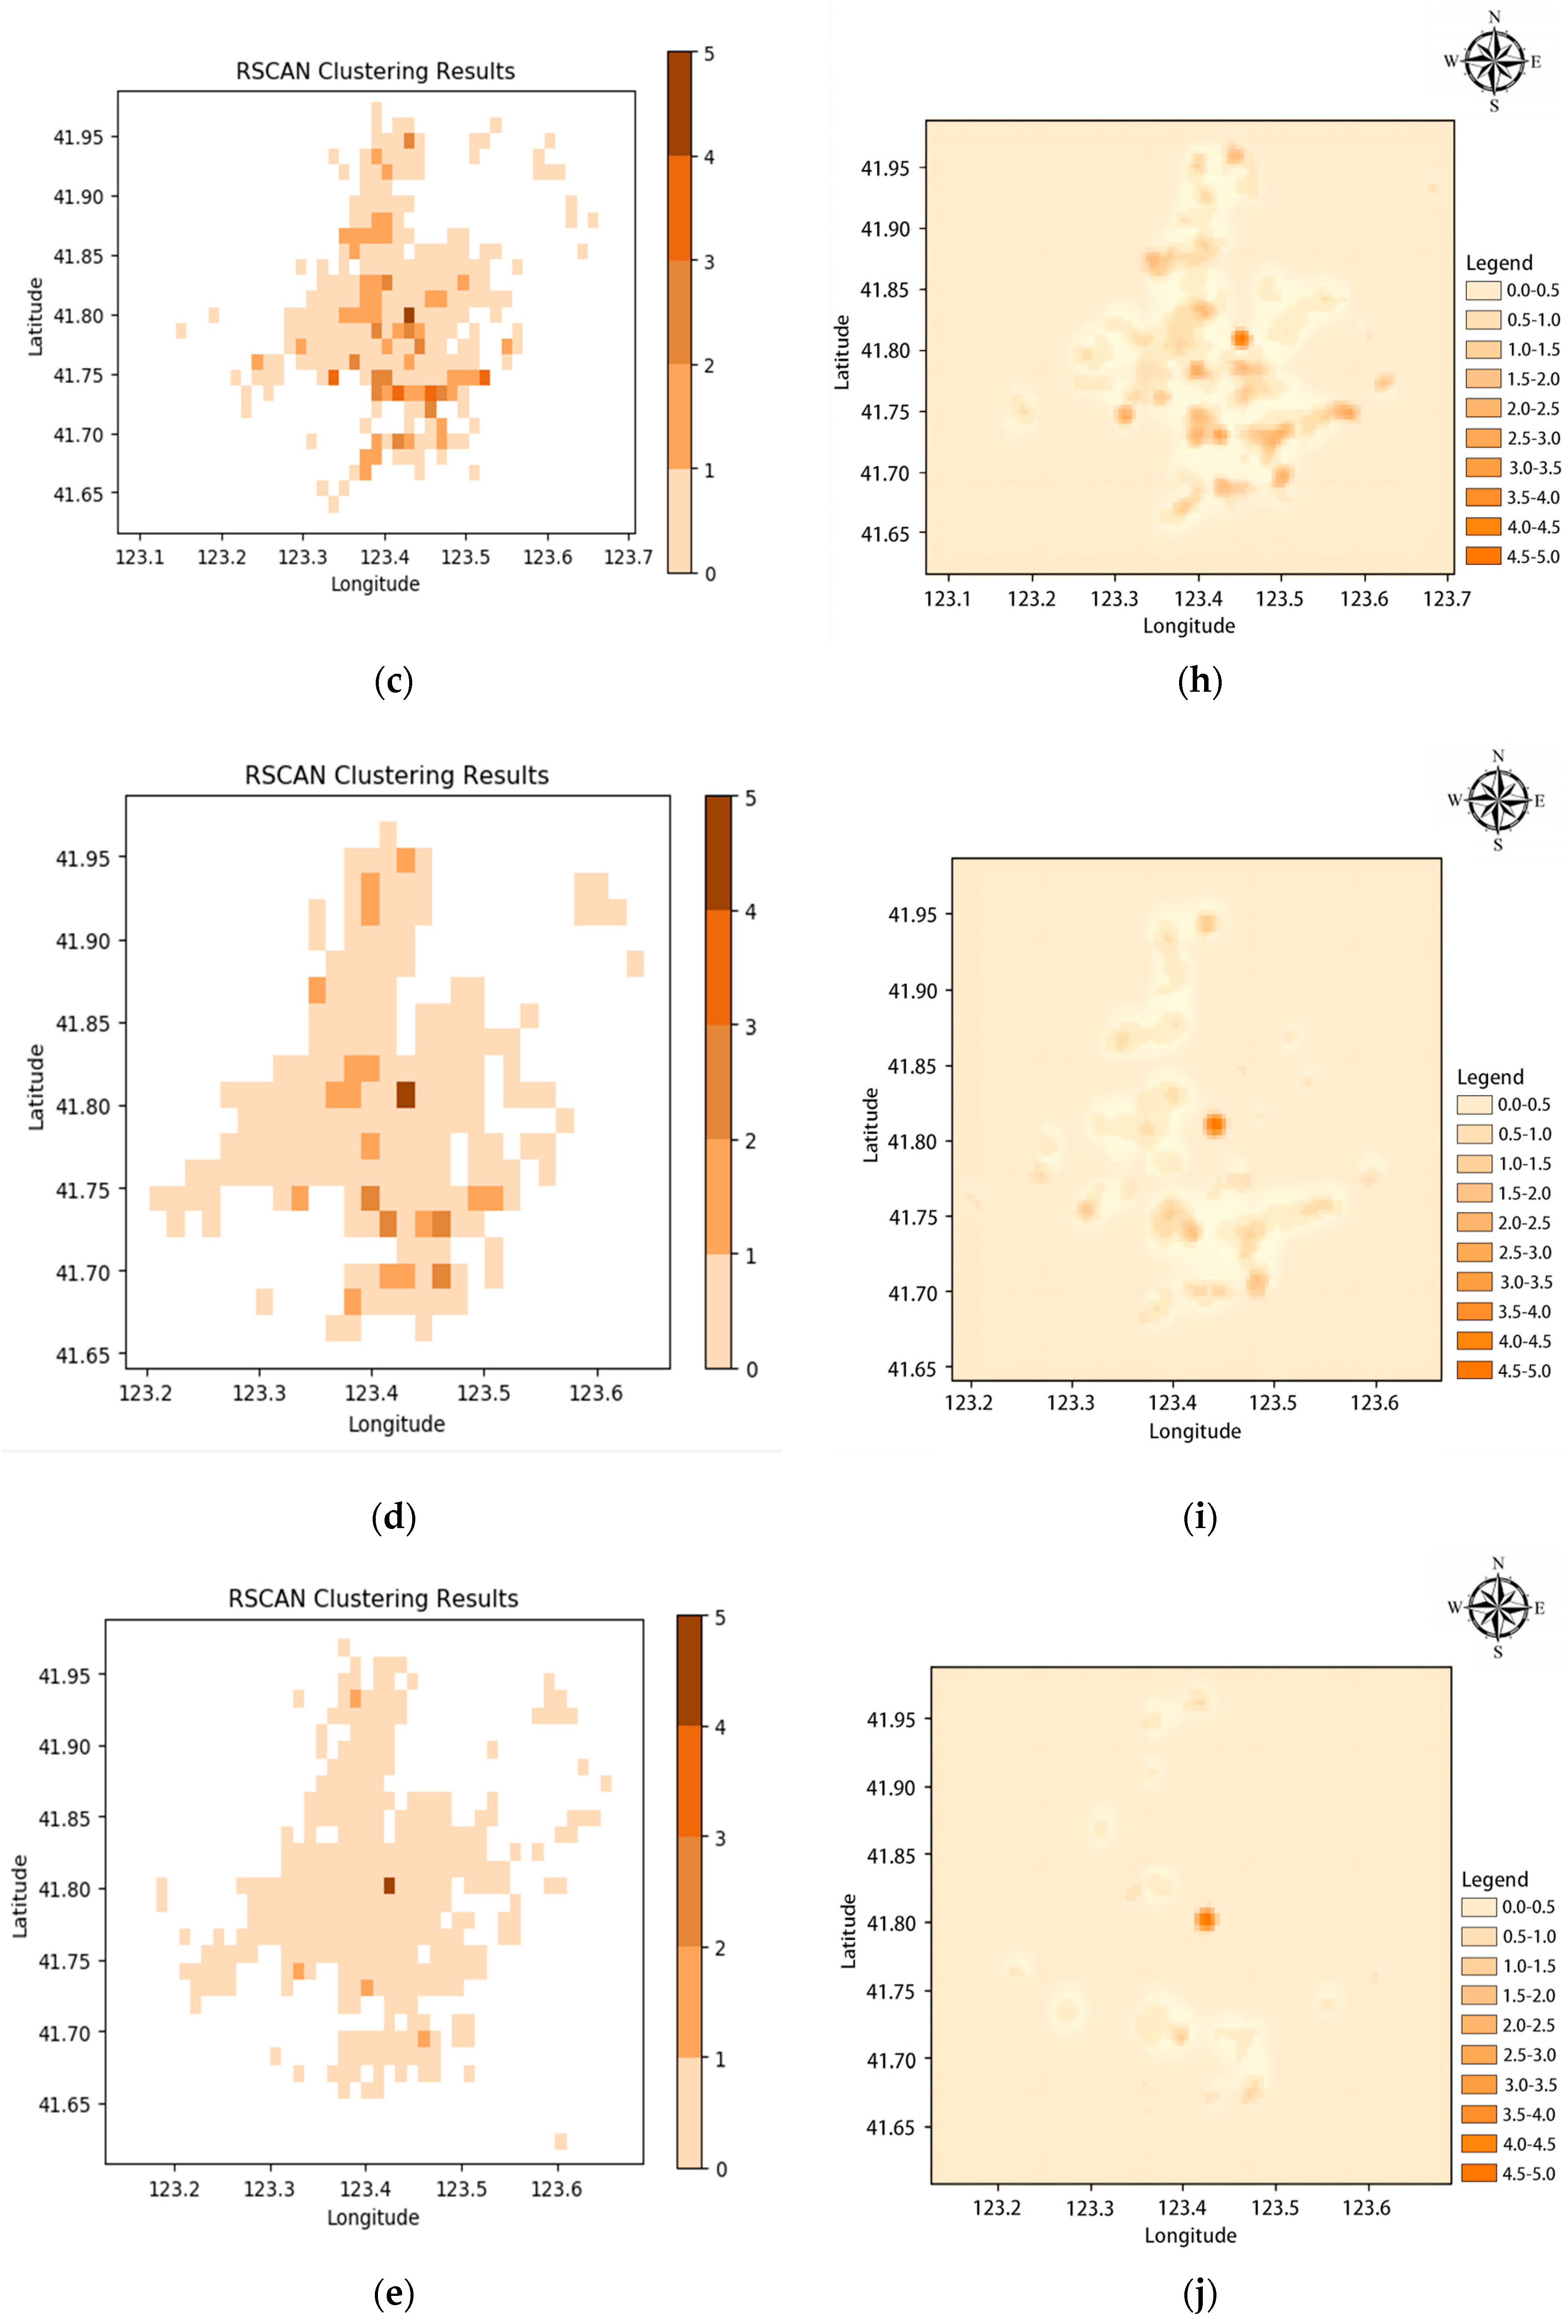
The clusteRunning results of the RScan algorithm are demonstrated to be valid and credible, as evidenced by the silhouette coefficient values and DBI values presented in Table 4. To enhance the validity and credibility of the study further, a visualization analysis was also conducted. The visualization of the intermediate results of the clustering process is displayed in Figure 3. Specifically, Figure 3a–e show the clustering results using the RScan algorithm, while Figure 3f–j display the results obtained through the kernel density estimation method, where the intensity of color represents the level of activity. To maintain clear differentiation among categories without overly dispersing the grid clustering categorization, this study segments the levels of activity identified by the RScan algorithm into five distinct categories.
By comparing and analyzing the intermediate results from the operation of the RScan algorithm and the visualization results of second-hand housing transaction activity in Shenyang City using the classical kernel density estimation method, it was found that the characteristics of the clustering results obtained by the two methods are largely similar. This similarity further substantiates the effectiveness and reliability of the improvements made in the RScan algorithm in this study.

3.2. Results of the Spatio-Temporal Evolution of Second-Hand Housing Transaction Activity

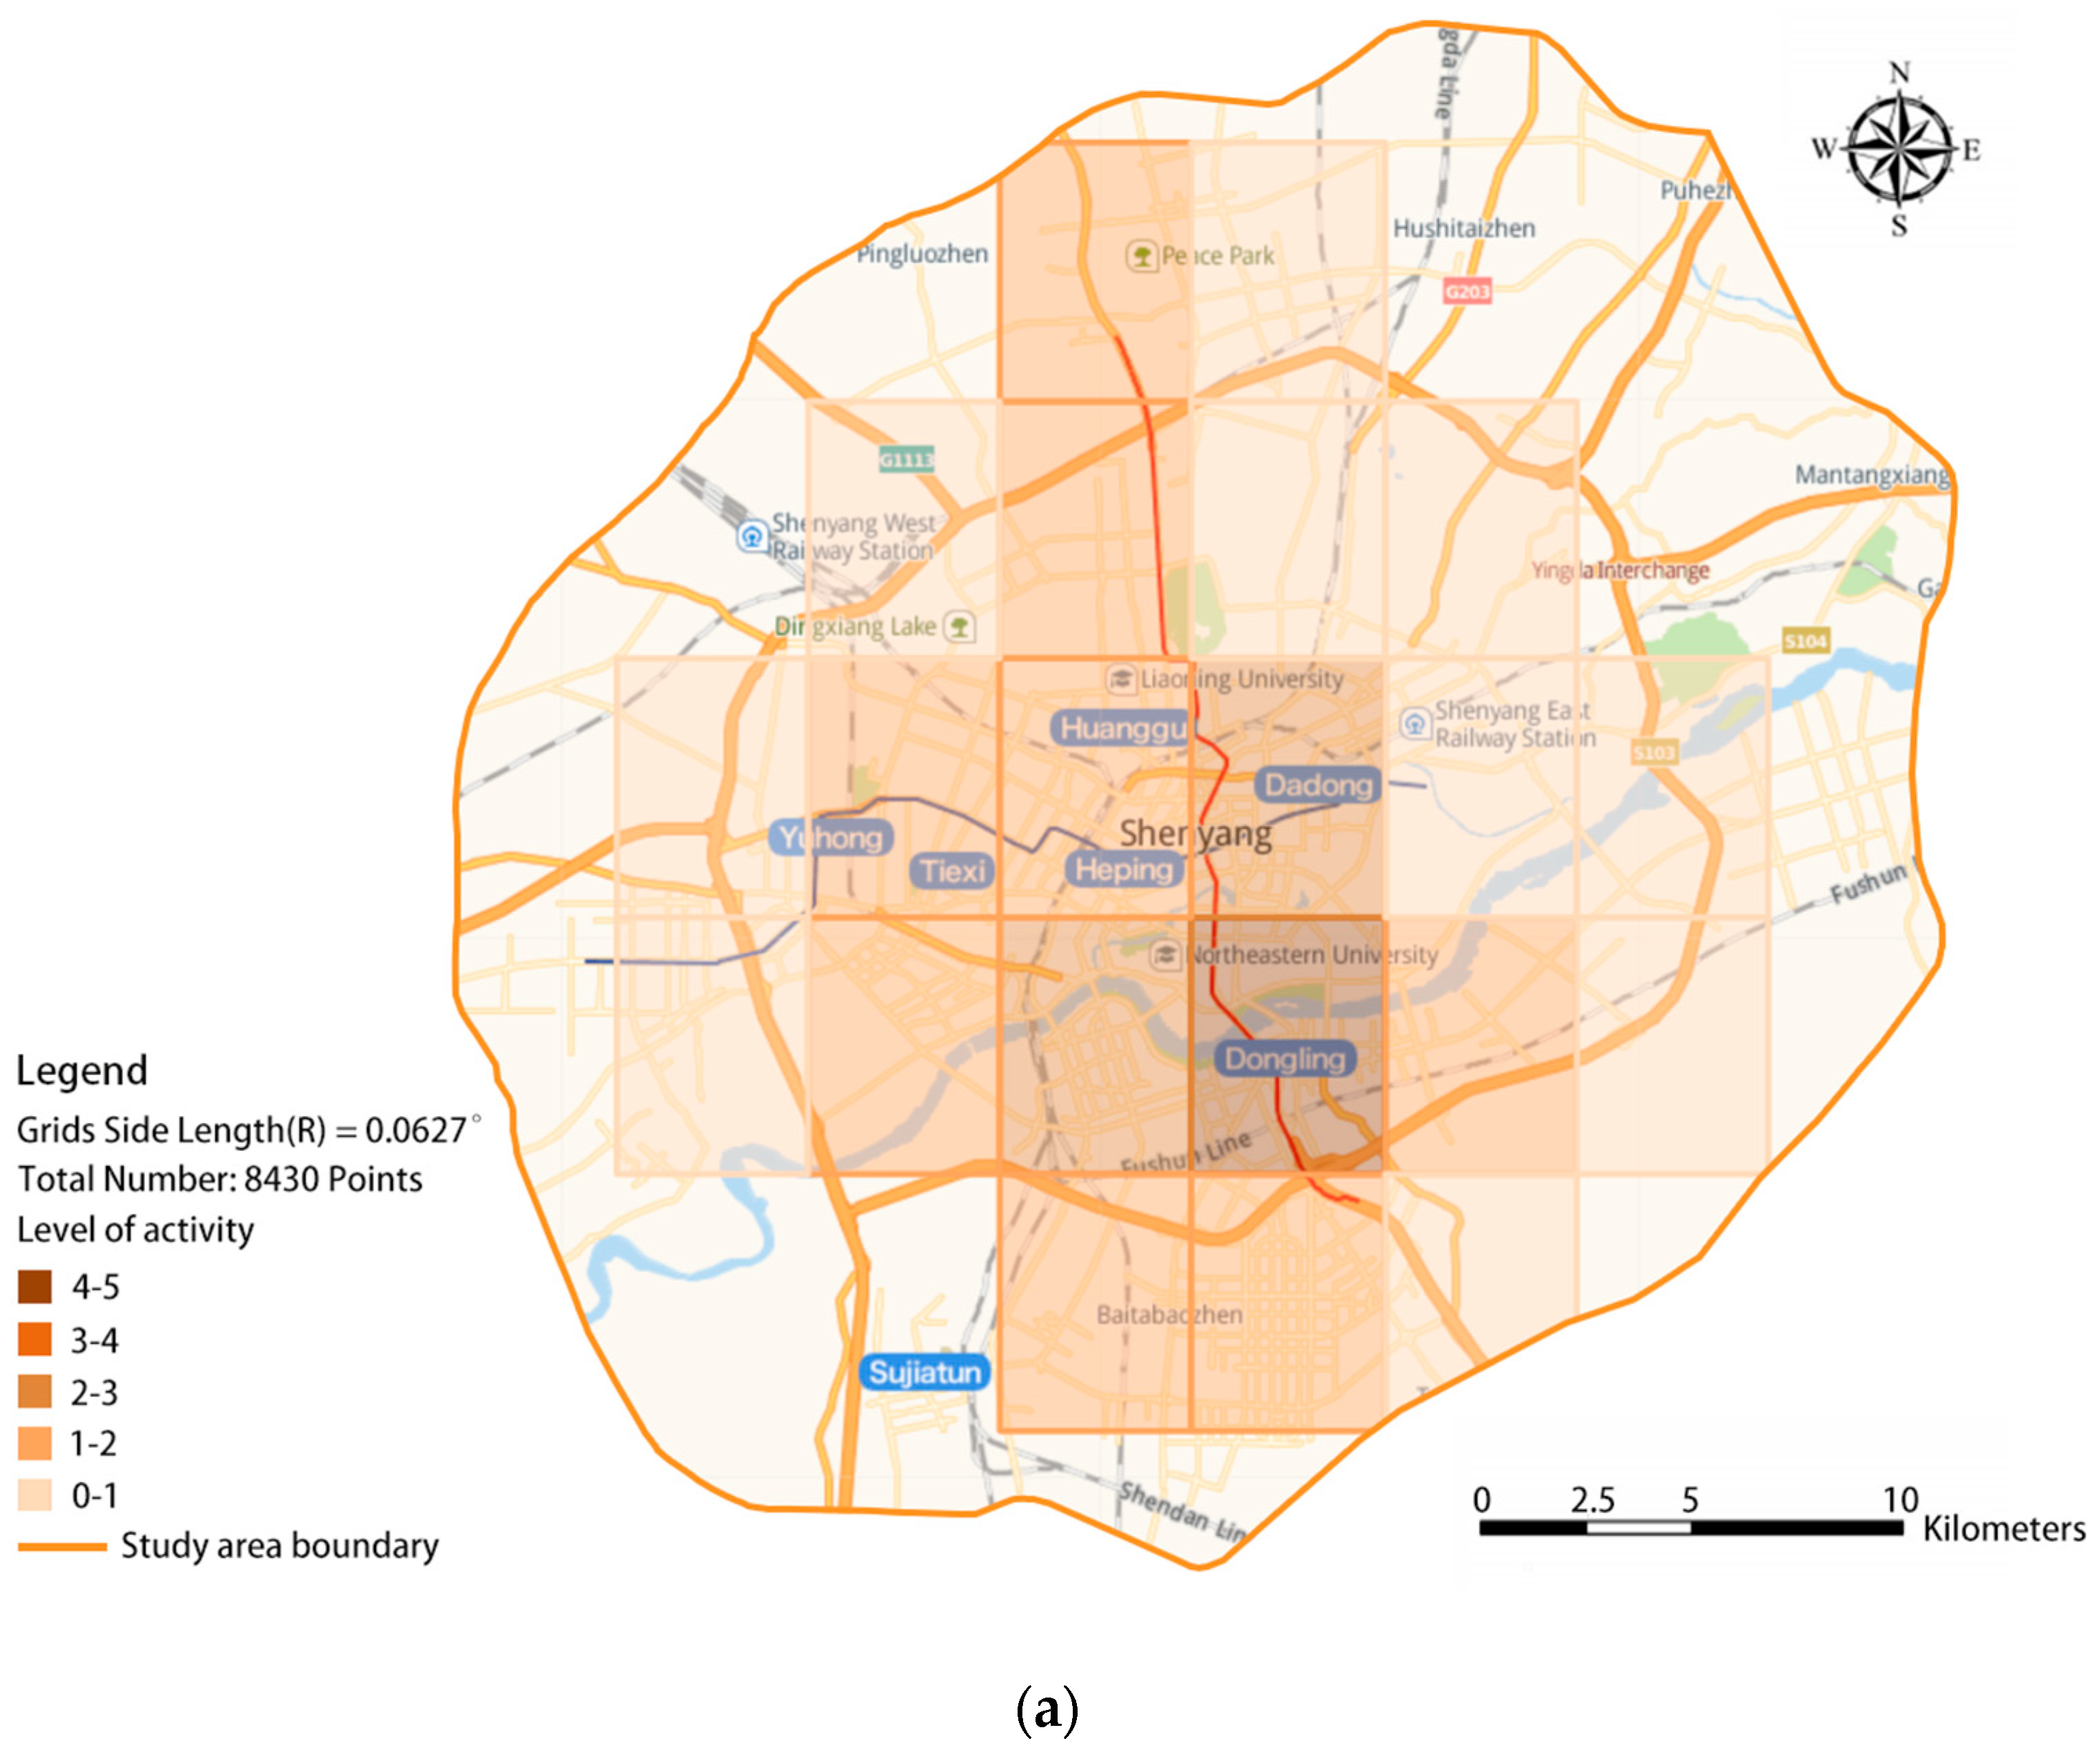
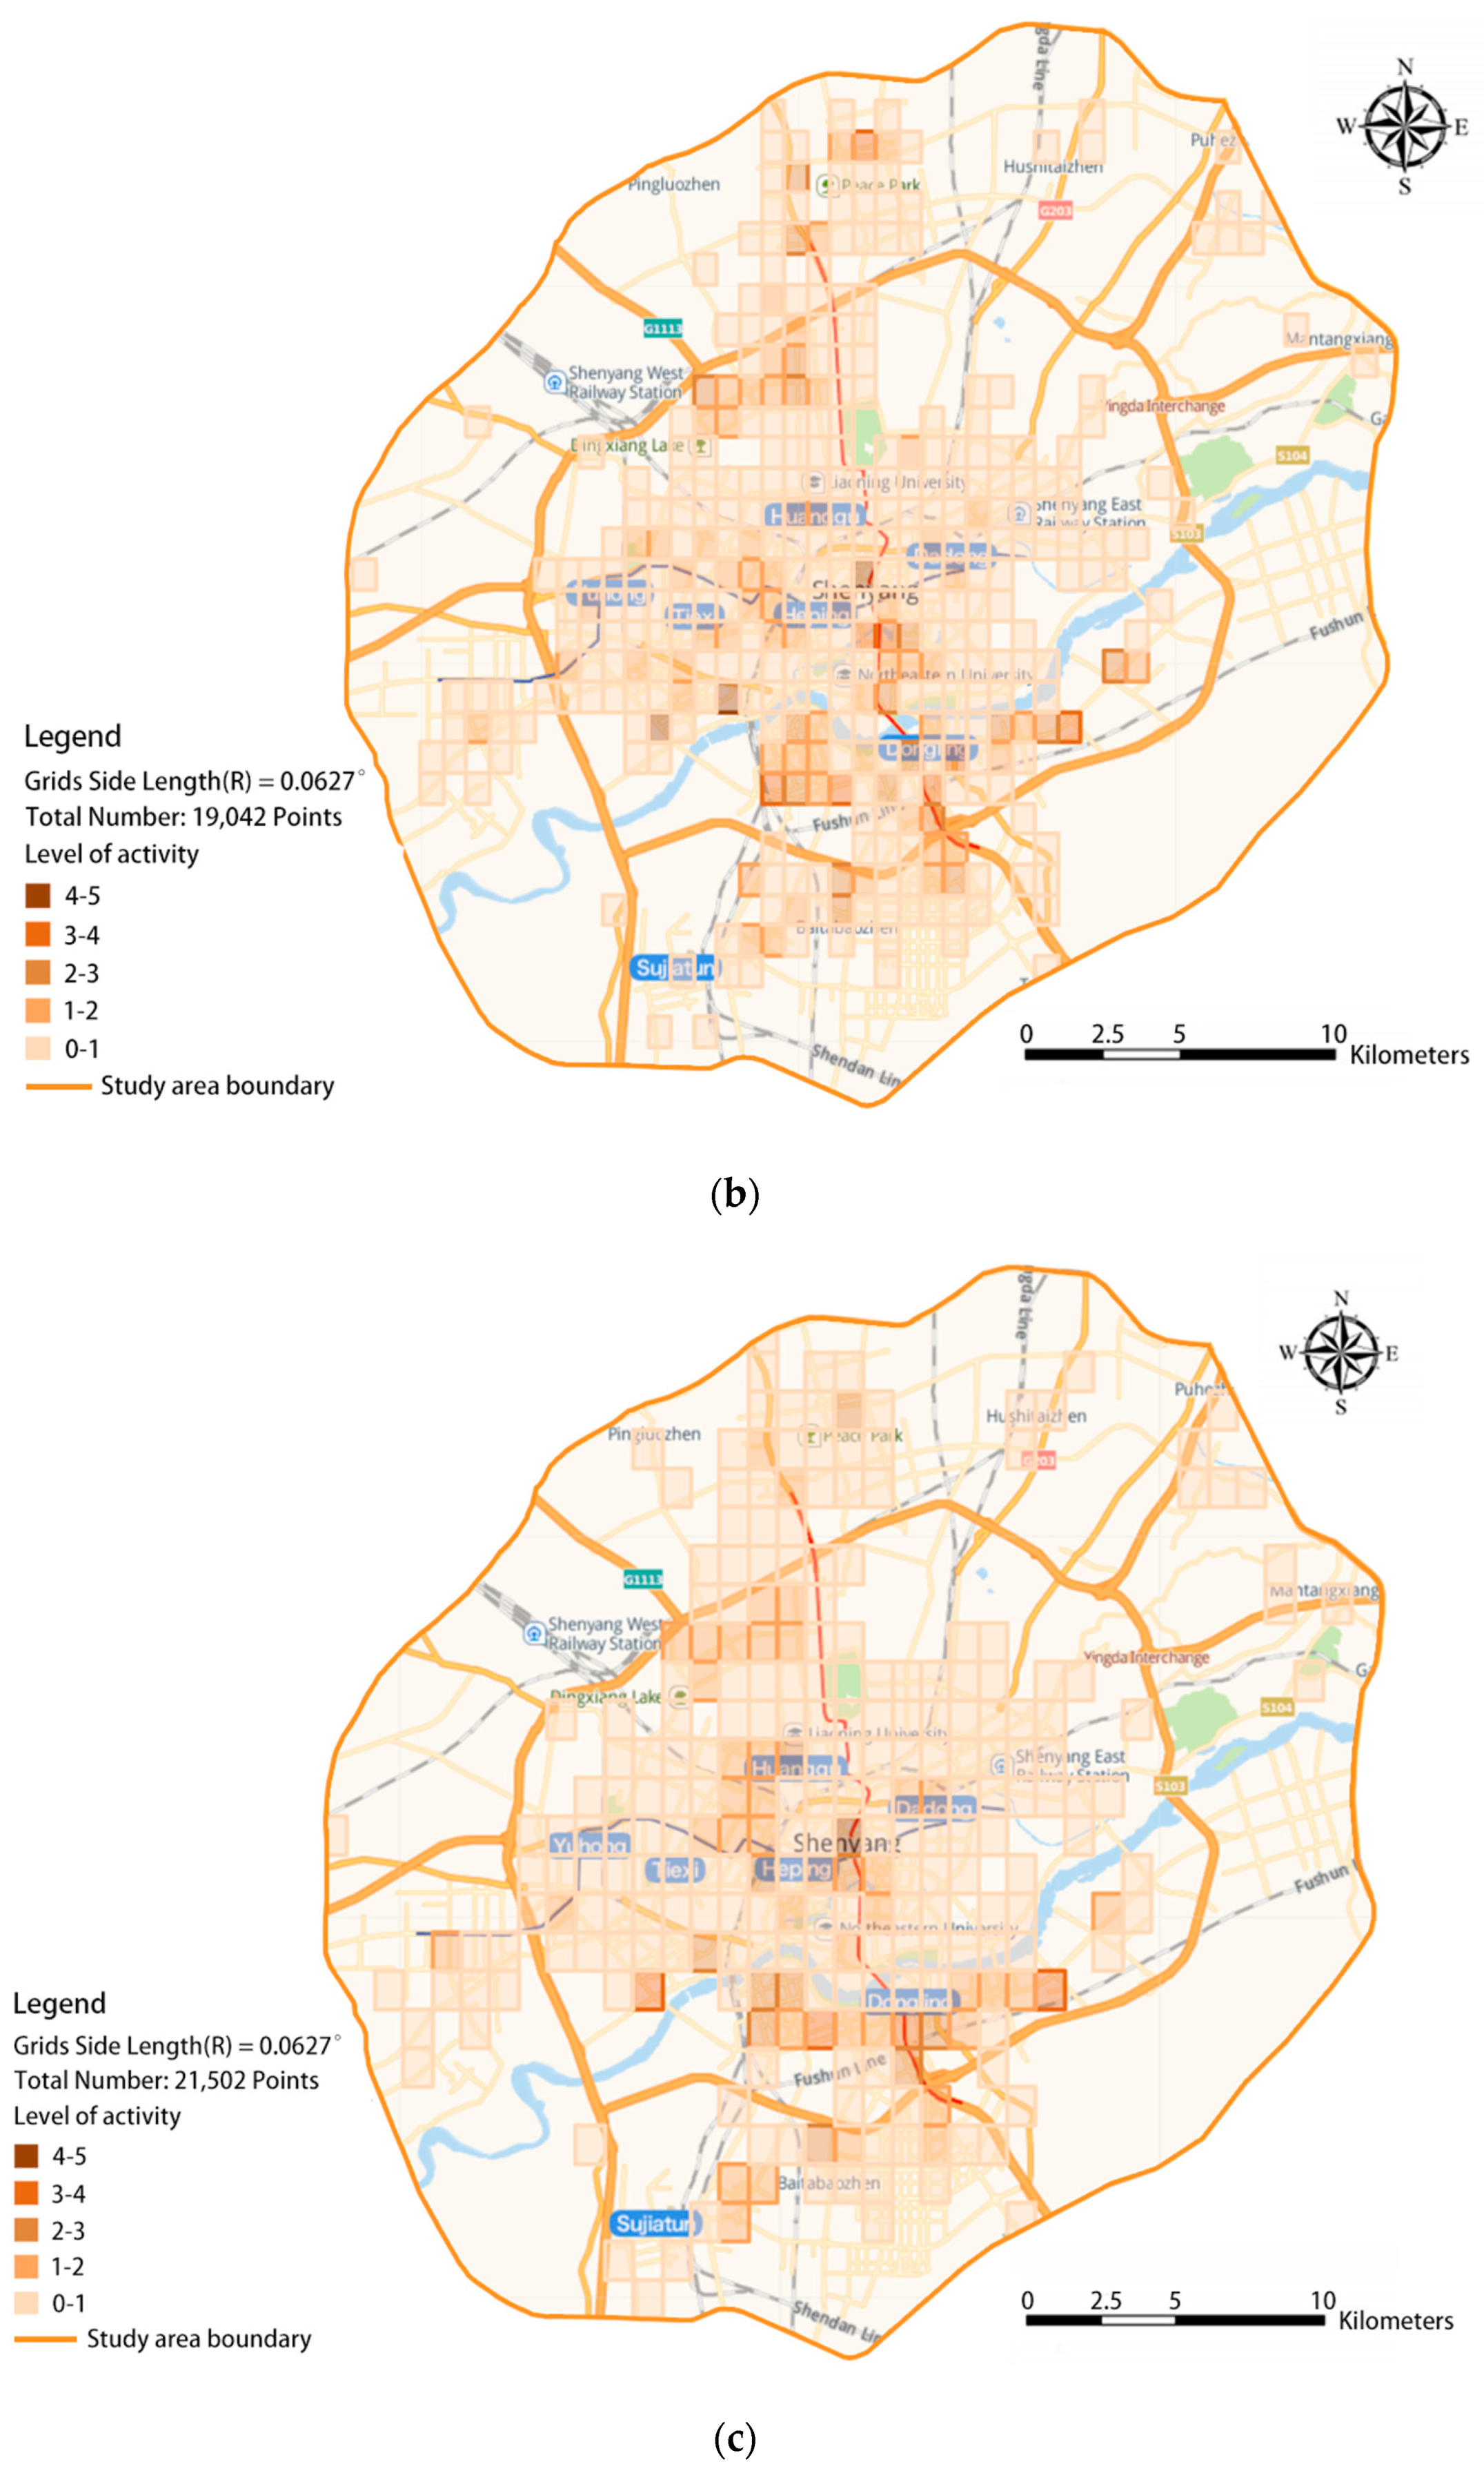
This study utilizes the RScan algorithm to visualize the spatial and temporal evolution characteristics of the second-hand housing market activity in Shenyang. The timeframe of the study spans from August 2018 to August 2023, covering five annual intervals. The spatial and temporal patterns of second-hand housing market activity in each region of Shenyang City were derived by analyzing the transaction data at each yearly interval. Figure 4 illustrates the visualization results of the regional spatio-temporal evolution of second-hand housing transaction activity in Shenyang.
In the period from 2018 to 2019, as illustrated by the data in Figure 4a and Table 1, the range of active areas and the number of transactions for second homes were the smallest observed over the last five years. The categorization of activity areas during this time was relatively coarse. Generally, the active areas displayed a distribution pattern of “high in the south and low in the north”, with a “ladder-like” stratification that gradually increased from the outer to the inner layers. According to the activity levels, nearly 50% of the area was in a low-activity state. There was only one high-activity area, penetrated by Metro Line 2, situated between the Industrial Exhibition Center and the Century Building metro stations, at the junction of the Hunnan, Heping, and Shenhe Districts.
During the 2019–2020 period, the transaction volume of second-hand housing in Shenyang City increased, the range of active regions expanded, and the activity across all levels became more evident in the visualization results. As shown in Figure 1 and Figure 4b, overall activity significantly increased compared to the previous year, yet the “high in the south and low in the north” pattern persisted. The distribution of high-activity areas became more scattered, with notable gaps in second-hand real estate transaction activity between these areas and their neighboring regions. Three level 5 activity areas were located in the Yuhong, Tiexi, and Shenhe Districts; level 4 activity areas were in Shenbei New District, Heping District, Shenhe District, and Hunnan District, with nearly 50% in Hunnan District. Level 3 activity areas were mostly concentrated south of the Hun River, while level 2 activity was primarily in Tiexi District, and level 1 activity areas showed a wider distribution.
For the period of 2020–2021, the active areas for second-hand housing transactions in Shenyang City mainly expanded in Huanggu District, typically within low-level-activity areas. The overall activity showed a downward trend, and the range of active areas stabilized. The north–south disparity still existed but was less pronounced than in the previous year. The number of high-activity areas significantly decreased, with the only level 5 activity area remaining between the Hunnan and Shenhe Districts, consistent with the previous year. The Hunnan District’s second-hand real estate market gradually emerged as a leading area of activity. There were four level 4 activity areas, with one in Yuhong District and two in Hunnan District, consistent with the previous year, and one spanning the Heping and Hunnan Districts, marking a shift northward from last year’s active areas. The distribution of level 2 and 3 activity areas across the Hun River was relatively balanced, with clustering that was irregular.
In the 2021–2022 period, there was a general decline in activity among the high-activity level areas. The only level 5 activity areas were in the Heping and Shenhe Districts. Additionally, there were four level 3 activity areas: one in Heping District, maintaining the previous year’s level of activity; two resulting from the decline in level 4 areas, one spanning the Heping and Hunnan Districts and the other in Hunnan District; and the last level 3 area, which emerged due to an increase in activity, also in Hunnan District. The level 2 activity areas were relatively balanced on both sides of the Hun River, with a more concentrated distribution north of the river, while other areas remained low in activity.
In 2022–2023, the overall level of second-hand housing transaction activity in Shenyang City declined, although the coverage of the visualization results remained fairly stable. However, there was a noticeable change in the area of activity. The activity level of the city’s second-hand housing market varied significantly between different regions. The only level 5 active regions were still located in the Heping and Shenhe Districts, with all other regions showing low activity. As depicted in Figure 4, this solitary level 5 active region has consistently maintained a high level of activity over the past five years, generally stabilizing at level 4 and above.

4. Discussion

The visualization of the regional spatio-temporal evolution of the second-hand housing market activity in Shenyang City (Figure 4) reveals that over the past five years, activity across all regions has generally been subdued. This trend aligns with broader challenges in the real estate market, notably declining demand and price volatility [50].
Amidst ongoing refinements in national property regulation policies, the second-hand housing market is poised for increasingly differentiated and diversified development. It is becoming crucial to leverage big data technology to analyze current market trends and identify active areas. A detailed examination of the results from the RScan algorithm operation (Figure 4) reveals the following characteristics in the spatio-temporal evolution of second-hand housing transaction activity in Shenyang:
1. The magnitude of change in transaction activity over time varies by region, with the central high-activity area remaining stable. Despite a general declining trend in Shenyang’s second-hand real estate transaction activity, specific areas, notably the Heping, Hunnan, and Shenhe Districts, have experienced localized rebounds, even displaying sustained growth. Conversely, low-activity areas, particularly in Huanggu District, have seen a significant outward diffusion of activity. Despite low property density, the rising number of transactions in Huanggu District sends a positive signal for the city’s second-hand property market. The visualization results (Figure 4) indicate that the majority of high-activity areas are significantly more active than their surroundings, with minimal change in the core points of these areas, especially in the Heping and Shenhe Districts, maintaining high activity over the past five years. This underscores the strong demand for cost-effective housing and quality compulsory education among homebuyers, aligning with findings from a study in Hefei, Anhui Province [16].
2. The activity levels display an irregularly stepped and clustered distribution, though regional dominance is not yet clear. The analysis of Figure 4 shows that the “irregular ladder-like” distribution of activity levels from 5 to 3 was particularly pronounced between 2019 and 2021 (Figure 4b,c), concentrated around transportation hubs. As activity levels decreased, signs of ladder distribution persisted but were less evident than before. Level 2 activity areas are relatively consolidated, mainly forming irregular clusters between high- and low-activity areas. Over the five-year period, the area surrounding Metro Line 2, which passes through most of the relatively high-activity zones, is almost entirely covered by activity zones, emphasizing that ease of living remains a crucial factor for homebuyers when selecting a second home. This finding is highly consistent with results from a study in Wuhan, Hubei Province [20].
3. Historically, the distribution of second-hand housing transaction activity in Shenyang exhibited a distinct pattern of being higher in the south and lower in the north. Over time, however, this disparity has diminished, leading to a more equalized activity level across the city. Although the overall activity of second-hand housing in Shenyang has declined, the pronounced “high in the south and low in the north” distribution has gradually faded, resulting in better overall accessibility and a convergence of activity levels among different regions. Continuous monitoring of market trends is essential to accurately predict the future development of the second-hand housing market in Shenyang. A detailed examination of the strategies employed in high-activity areas and the potential improvements in low-activity areas could positively influence the real estate market, attracting more homebuyers and investors.
Overall, the temporal and spatial evolution characteristics of Shenyang City’s second-hand housing transaction activity display diverse features, with marked differences in activity changes across various regions. The general trend is downward, and the market has yet to recover fully, but some regions exhibit signs of stabilization or even improvement. These observations provide valuable insights into the temporal and spatial dynamics of the second-hand housing market in Shenyang and offer crucial data for future market analysis and forecasting.

5. Conclusions

This study leverages concepts such as grid density and the GScan algorithm to introduce a Bayesian optimization algorithm that develops the novel RScan algorithm for identifying active regions. It empirically analyzes the second-hand housing transaction activity in Shenyang City, examining its spatio-temporal evolution. The findings indicate variability in the activity levels of Shenyang’s second-hand housing market, characterized by “fluctuating” changes. The degree of activity varies across different regions, with activity levels distributed in an irregular, ladder-like manner and clustered. This research not only deepens our understanding of the development trends and spatial distribution patterns of Shenyang’s second-hand housing market but also aids governmental bodies and related organizations in making informed decisions and regulations. Additionally, it serves as a decision-making reference for investors, developers, and homebuyers.
There remains a gap in the research concerning the activity of second-hand housing transactions, and this study enriches the existing literature, offering new theoretical perspectives and foundations for future scholarly research. By adopting an interdisciplinary approach, it extends the application of machine learning to the real estate sector and fosters innovation in data analysis methods and concepts within this field. The effectiveness of the proposed RScan algorithm is validated through evaluation indices and visualization and analysis methods, demonstrating its applicability and potential for broader adoption.
As investment demand wanes and owner-occupier demand resurfaces, the cost-effectiveness of the second-hand housing market becomes increasingly significant. Amid consumer downgrading, residents are prioritizing residential qualities over the allure of high-priced new homes. Moreover, the inherent uncertainties and risks associated with new home deliveries contrast sharply with the transparent nature of second-hand homes, which align with homebuyers’ expectations of “what you see is what you get.” Post-pandemic, as homebuyers gradually regain confidence in their future income prospects, the overall activity in Shenyang’s second-hand housing market has declined, yet the scope and volume of transactions have expanded. Some local areas are beginning to show signs of recovery, though full restoration will take time. The visualization results emphasize that the spatial and temporal distribution of second-hand housing transaction activity in Shenyang City is closely tied to locational differences, with highly active areas often featuring rich educational resources, strong transportation links, thriving businesses, or high greenery rates. The next phase of research will focus on developing a semantic mining model to deeply explore the impact of various factors on second-hand housing transaction activity, providing a more detailed foundation and reference for future analyses.
The study presented here has certain limitations which are important to acknowledge:
(1)
Limitations of time span: The dataset used in this research spans from 2018 to 2023. Although this timeframe allows for an analysis of recent changes in the activity of the second-hand housing market in Shenyang, it may not be sufficiently extensive to fully capture the long-term trends of the market. Given the cyclical nature of real estate markets and the delayed effects of policy changes, this shorter duration could restrict a comprehensive understanding of the broader market dynamics.
(2)
Lack of research on spatio-temporal dynamic mechanisms: This study primarily documents the shifts in the distribution characteristics of second-hand real estate transaction activity in Shenyang City across different periods. However, it does not delve into the intrinsic dynamic mechanisms driving these changes. Going forward, by addressing the limitations related to the time span, we aim to continue collecting data on second-hand house transactions to enhance the richness of the dataset. This will support a more detailed investigation into the spatio-temporal dynamic change mechanisms, thereby facilitating a more accurate depiction of long-term trends in second-hand house activity. Concurrently, we plan to develop a semantic mining model and integrate theories from economics and sociology to probe into the underlying mechanisms driving changes in the activity of the second-hand housing market.

Author Contributions

Conceptualization, methodology, software, validation, formal analysis, investigation, resources, data curation, writing—original draft preparation, writing—review and editing, visualization, and supervision, Jiaqiang Ren and Xiaomeng Gao. Funding acquisition, Jiaqiang Ren. All authors have read and agreed to the published version of the manuscript.

Funding

This research was funded by Liaoning Provincial Department of Education Project, grant number JYTMS20231589.

Institutional Review Board Statement

Not applicable.

Informed Consent Statement

Not applicable.

Data Availability Statement

The data presented in this study are available on request from the corresponding author.

Acknowledgments

We greatly appreciate the financial support from Liaoning Provincial Department of Education Project, grant number JYTMS20231589.

Conflicts of Interest

The authors declare no conflicts of interest.

References

  1. Li, B.; Li, R.Y.M.; Wareewanich, T. Factors Influencing Large Real Estate Companies’ Competitiveness: A Sustainable Development Perspective. Land 2021, 10, 1239. [Google Scholar] [CrossRef]
  2. Huang, Y.J.; An, H.C. Impact to the Second-handed Housing Price Made by the Government Policies, Based on the System Dynamics and a Case Study of Second-handed Housing Market of Beijing. In Proceedings of the International Conference on Advances in Management Engineering and Information Technology, Bangkok, Thailand, 28–29 June 2015. [Google Scholar]
  3. Tian, C.; Ji, W.; Chen, S.; Wu, J. The time and spatial effects of a “City-County merger” on housing prices—Evidence from Fuyang. Sustainability 2020, 12, 1639. [Google Scholar] [CrossRef]
  4. Li, Y.; Zhu, D.; Zhao, J.; Zheng, X.; Zhang, L. Effect of the housing purchase restriction policy on the Real Estate Market: Evidence from a typical suburb of Beijing, China. Land Use Policy 2020, 94, 104528. [Google Scholar] [CrossRef]
  5. Peng, Y.; Tian, C. Removal and reconstruction: Multi-period price effects on nearby housing from urban village redevelopment. Land Use Policy 2022, 113, 105877. [Google Scholar] [CrossRef]
  6. Qi, S.J.; Zhang, T.J.; Zhang, Y.B. Sensitivity Simulation between the New and the Old Residential Real Estate Market on the Basal of System Dynamics. In Proceedings of the International Conference on Industrial Engineering and Management Science (ICIEMS), Shanghai, China, 28–29 September 2013. [Google Scholar]
  7. Zhang, D.D. Discussion on the Second-hand Commercial Housing Valuation Problems under the Theory of Differential Rent. In Proceedings of the SSR International Conference on Social Sciences and Information (SSR-SSI 2015), Tokyo, Japan, 29–30 November 2015. [Google Scholar]
  8. Xu, L.; Li, Z. A new appraisal model of second-hand housing prices in China’s first-tier cities based on machine learning algorithms. Comput. Econ. 2021, 57, 617–637. [Google Scholar] [CrossRef]
  9. Dai, L.; Zhu, A.; Zhao, L.; Wang, C. Establishment of Mass Appraisal of the Estate Benchmark Price by the Mathematics Model of the Least-squares Method. In Proceedings of the 2012 7th International Conference on System of Systems Engineering (SoSE), Genoa, Italy, 16–19 July 2012. [Google Scholar]
  10. Liu, G.; Zong, X. Research of second-hand real estate price forecasting based on data mining. In Proceedings of the IEEE 2nd Information Technology, Networking, Electronic and Automation Control Conference (ITNEC), Chengdu, China, 15–17 December 2017. [Google Scholar]
  11. Wang, R.; Li, D.F. Two Bargain Game Models of the Second-Hand Housing Commence. In Proceedings of the 3rd Joint China-Dutch Workshop on Game Theory and Applications/7th China Meeting on Game Theory and Applications (GTA), Fuzhou, China, 20–23 November 2016. [Google Scholar]
  12. Jingjing, F.; Yan, H. The Analysis of Nash Equilibrium on second-hand housing transactions Based on the Final-offer Arbitration Model. In Proceedings of the 4th International Conference on Social Sciences and Economic Development (ICSSED), Wuhan, China, 15–17 March 2019. [Google Scholar]
  13. Zhang, X.; Lin, Z.; Zhang, Y.; Zheng, Y.; Zhang, J. Online property brokerage platform and prices of second-hand houses: Evidence from Lianjia’s entry. Electron. Commer. Res. Appl. 2021, 50, 101104. [Google Scholar] [CrossRef]
  14. Hui, E.C.; Liang, C. The spatial clustering investment behavior in housing markets. Land Use Policy 2015, 42, 7–16. [Google Scholar] [CrossRef]
  15. Wei, H.M.; Hu, W.J. Research on the Influencing Factors of the Second-Hand Housing Prices Based on Interpretive Structure Model (ISM). In Proceedings of the International Conference on Complex Science Management and Education Science (CSMES), Kuming, China, 23–24 November 2013. [Google Scholar]
  16. Xu, S.; Zhang, Z. Spatial differentiation and influencing factors of second-hand housing prices: A case study of Binhu new district, Hefei city, Anhui province, China. J. Math. 2021, 2, 8792550. [Google Scholar] [CrossRef]
  17. Liang, W.; Pan, L.; Sun, J.; Wang, J. Guangzhou House Price Analysis based on Machine Learning Methods.3rd International Conference on Machine Learning, Big Data and Business Intelligence (MLBDBI). Electr. Netw. 2021, 3, 3–5. [Google Scholar]
  18. Perez-Sanchez, V.R.; Mora-Garcia, R.T.; Perez-Sanchez, J.C.; Cespedes-Lopez, M.F. The influence of the characteristics of second-hand properties on their asking prices: Evidence in the Alicante market. Inf. Constr. 2020, 6, 72–79. [Google Scholar]
  19. Tan, R.; He, Q.; Zhou, K.; Xie, P. The effect of new metro stations on local land use and housing prices: The case of Wuhan, China. J. Transp. Geogr. 2019, 79, 102488. [Google Scholar] [CrossRef]
  20. Zhang, L.; Zhou, J.; Hui, E.C.M. Which types of shopping malls affect housing prices? From the perspective of spatial accessibility. Habitat Int. 2020, 96, 102118. [Google Scholar]
  21. Chen, W.D. Policy failure or success? Detecting market failure in China’s housing market. Econ. Model. 2016, 56, 109–121. [Google Scholar] [CrossRef]
  22. Ma, S.; Li, T.; Yang, Y. Housing Price Appreciation Effects of Elevator Installation in Old Residential Areas: Empirical Evidence Based on a Multiperiod DID Model. Adv. Civ. Eng. 2022, 2022, 7949–7952. [Google Scholar] [CrossRef]
  23. Yin, Z.; Sun, R.; Bi, Y. Spatial-temporal change trend analysis of second-hand house price in hefei based on spatial network. Comput. Intell. Neurosci. 2022, 2022, 564–572. [Google Scholar] [CrossRef]
  24. Zhou, Y.; Fang, Z.; Thill, J.C.; Li, Q.; Li, Y. Functionally critical locations in an urban transportation network: Identification and space–time analysis using taxi trajectories. Comput. Environ. Urban Syst. 2015, 52, 34–47. [Google Scholar] [CrossRef]
  25. Wang, Y.; Ren, J. Taxi passenger hot spot mining based on a refined K-means++ algorithm. IEEE Access 2021, 9, 66587–66598. [Google Scholar] [CrossRef]
  26. Shiode, S.; Shiode, N. A network-based scan statistic for detecting the exact location and extent of hotspots along urban streets. Comput. Environ. Urban Syst. 2020, 83, 101500. [Google Scholar] [CrossRef]
  27. Hall, D.R.; Ngan, C.H.; Zerbe, B.S.; Kozakov, D.; Vajda, S. Hot spot analysis for driving the development of hits into leads in fragment-based drug discovery. J. Chem. Inf. Model. 2012, 52, 199–209. [Google Scholar] [CrossRef]
  28. Tao, L.; Su, Y.; Fang, X. Global carbon emission spatial pattern in 2030 under INDCs: Using a gridding approach based on population and urbanization. Int. J. Clim. Change Strateg. Manag. 2022, 14, 78–99. [Google Scholar] [CrossRef]
  29. Lau, B.P.L.; Ng, B.K.K.; Yuen, C.; Tunçer, B.; Chong, K.H. The study of urban residential’s public space activeness using space-centric approach. IEEE Internet Things J. 2021, 8, 11503–11513. [Google Scholar] [CrossRef]
  30. Elangovan, R.; Vairavasundaram, S.; Varadarajan, V.; Ravi, L. Location-based social network recommendations with computational intelligence-based similarity computation and user check-in behavior. Concurr.Comput. Pract. Exp. 2021, 33, e6106. [Google Scholar] [CrossRef]
  31. Abdali, E.; Valadan Zoej, M.J.; Taheri Dehkordi, A.; Ghaderpour, E. A parallel-cascaded ensemble of machine learning models for crop type classification in Google earth engine using multi-temporal sentinel-1/2 and landsat-8/9 remote sensing data. Remote Sens. 2023, 16, 127. [Google Scholar] [CrossRef]
  32. Wang, X.; Zhang, Z.; Luo, Y. Clustering methods based on stay points and grid density for hotspot detection. ISPRS Int. J. Geo-Inf. 2022, 11, 190–197. [Google Scholar] [CrossRef]
  33. Habib, M.F.; Bridgelall, R.; Motuba, D.; Rahman, B. Exploring the robustness of alternative cluster detection and the threshold distance method for crash hot spot analysis: A study on vulnerable road users. Safety 2023, 9, 57. [Google Scholar] [CrossRef]
  34. Sultana, N.; Hossain, S.Z.; Abusaad, M.; Alanbar, N.; Senan, Y.; Razzak, S.A. Prediction of biodiesel production from microalgal oil using Bayesian optimization algorithm-based machine learning approaches. Fuel 2022, 309, 122184. [Google Scholar] [CrossRef]
  35. Aslan, M.F.; Sabanci, K.; Durdu, A.; Unlersen, M.F. COVID-19 diagnosis using state-of-the-art CNN architecture features and Bayesian Optimization. Comput. Biol. Med. 2022, 142, 105244. [Google Scholar] [CrossRef] [PubMed]
  36. Bai, H.; Li, G.; Liu, C.; Li, B.; Zhang, Z.; Qin, H. Hydrological probabilistic forecasting based on deep learning and Bayesian optimization algorithm. Hydrol. Res. 2021, 52, 927–943. [Google Scholar] [CrossRef]
  37. Chepiga, T.; Zhilyaev, P.; Ryabov, A.; Simonov, A.P.; Dubinin, O.N.; Firsov, D.G.; Kuzminova, Y.O.; Evlashin, S.A. Process parameter selection for production of stainless steel 316L using efficient multi-objective Bayesian optimization algorithm. Materials 2023, 16, 1050–1053. [Google Scholar] [CrossRef]
  38. Sultana, N.; Hossain, S.Z.; Almuhaini, S.H.; Düştegör, D. Bayesian optimization algorithm-based statistical and machine learning approaches for forecasting short-term electricity demand. Energies 2022, 15, 3425–3432. [Google Scholar] [CrossRef]
  39. Wang, Y.; Kandeal, A.W.; Swidan, A.; Sharshir, S.W.; Abdelaziz, G.B.; Halim, M.A.; Kabeel, A.E.; Yang, N. Prediction of tubular solar still performance by machine learning integrated with Bayesian optimization algorithm. Appl. Therm. Eng. 2021, 184, 116233. [Google Scholar] [CrossRef]
  40. Wang, L.; Yan, X.; Liu, Y.; Liu, X.; Chen, D. Grid mapping for road network abstraction and traffic congestion identification based on probe vehicle data. J. Transp. Eng. Part A Syst. 2021, 147, 04021024. [Google Scholar] [CrossRef]
  41. Sarmah, S.; Bhattacharyya, D.K. A grid-density based technique for finding clusters in satellite image. Pattern Recognit. Lett. 2012, 33, 589–604. [Google Scholar] [CrossRef]
  42. Loh, W.K.; Moon, Y.S.; Park, Y.H. Fast density-based clustering using graphics processing units. IEICE Trans. Inf. Syst. 2014, 97, 1349–1352. [Google Scholar] [CrossRef]
  43. Saxena, A.; Prasad, M.; Gupta, A.; Bharill, N.; Patel, O.P.; Tiwari, A.; Er, M.J.; Ding, W.; Lin, C.T. A review of clustering techniques and developments. Neurocomputing 2017, 267, 664–681. [Google Scholar] [CrossRef]
  44. Chen, X.; Peng, X.; Wang, S.A. Superpixel segmentation based on grid point density peak clustering. Sensors 2021, 21, 6374. [Google Scholar] [CrossRef]
  45. Zhao, X.; Hu, C.; Liu, Z.; Meng, Y. Weighted dynamic time warping for grid-based travel-demand-pattern clustering: Case study of Beijing bicycle-sharing system. ISPRS Int. J. Geo-Inf. 2019, 8, 281–289. [Google Scholar] [CrossRef]
  46. Garrido-Merchán, E.C.; Fernández-Sánchez, D.; Hernández-Lobato, D. Parallel predictive entropy search for multi-objective Bayesian optimization with constraints applied to the tuning of machine learning algorithms. Expert Syst. Appl. 2023, 215, 119328. [Google Scholar] [CrossRef]
  47. Abbas, F.; Zhang, F.; Ismail, M.; Khan, G.; Iqbal, J.; Alrefaei, A.F.; Albeshr, M.F. Optimizing machine learning algorithms for landslide susceptibility mapping along the Karakoram Highway, Gilgit Baltistan, Pakistan: A comparative study of baseline, bayesian, and metaheuristic hyperparameter optimization techniques. Sensors 2023, 23, 6843–6847. [Google Scholar] [CrossRef] [PubMed]
  48. Tani, L.; Veelken, C. Comparison of Bayesian and particle swarm algorithms for hyperparameter optimisation in machine learning applications in high energy physics. Comput. Phys. Commun. 2024, 294, 108955. [Google Scholar] [CrossRef]
  49. Zhao, Y.; Cao, J.; Zhang, C.; Zhang, S. Enhancing grid-density based clustering for high dimensional data. J. Syst. Softw. 2011, 84, 1524–1539. [Google Scholar] [CrossRef]
  50. Wang, B. Housing market volatility under COVID-19: Diverging response of demand in luxury and low-end housing markets. Land Use Policy 2022, 119, 106191. [Google Scholar] [CrossRef] [PubMed]
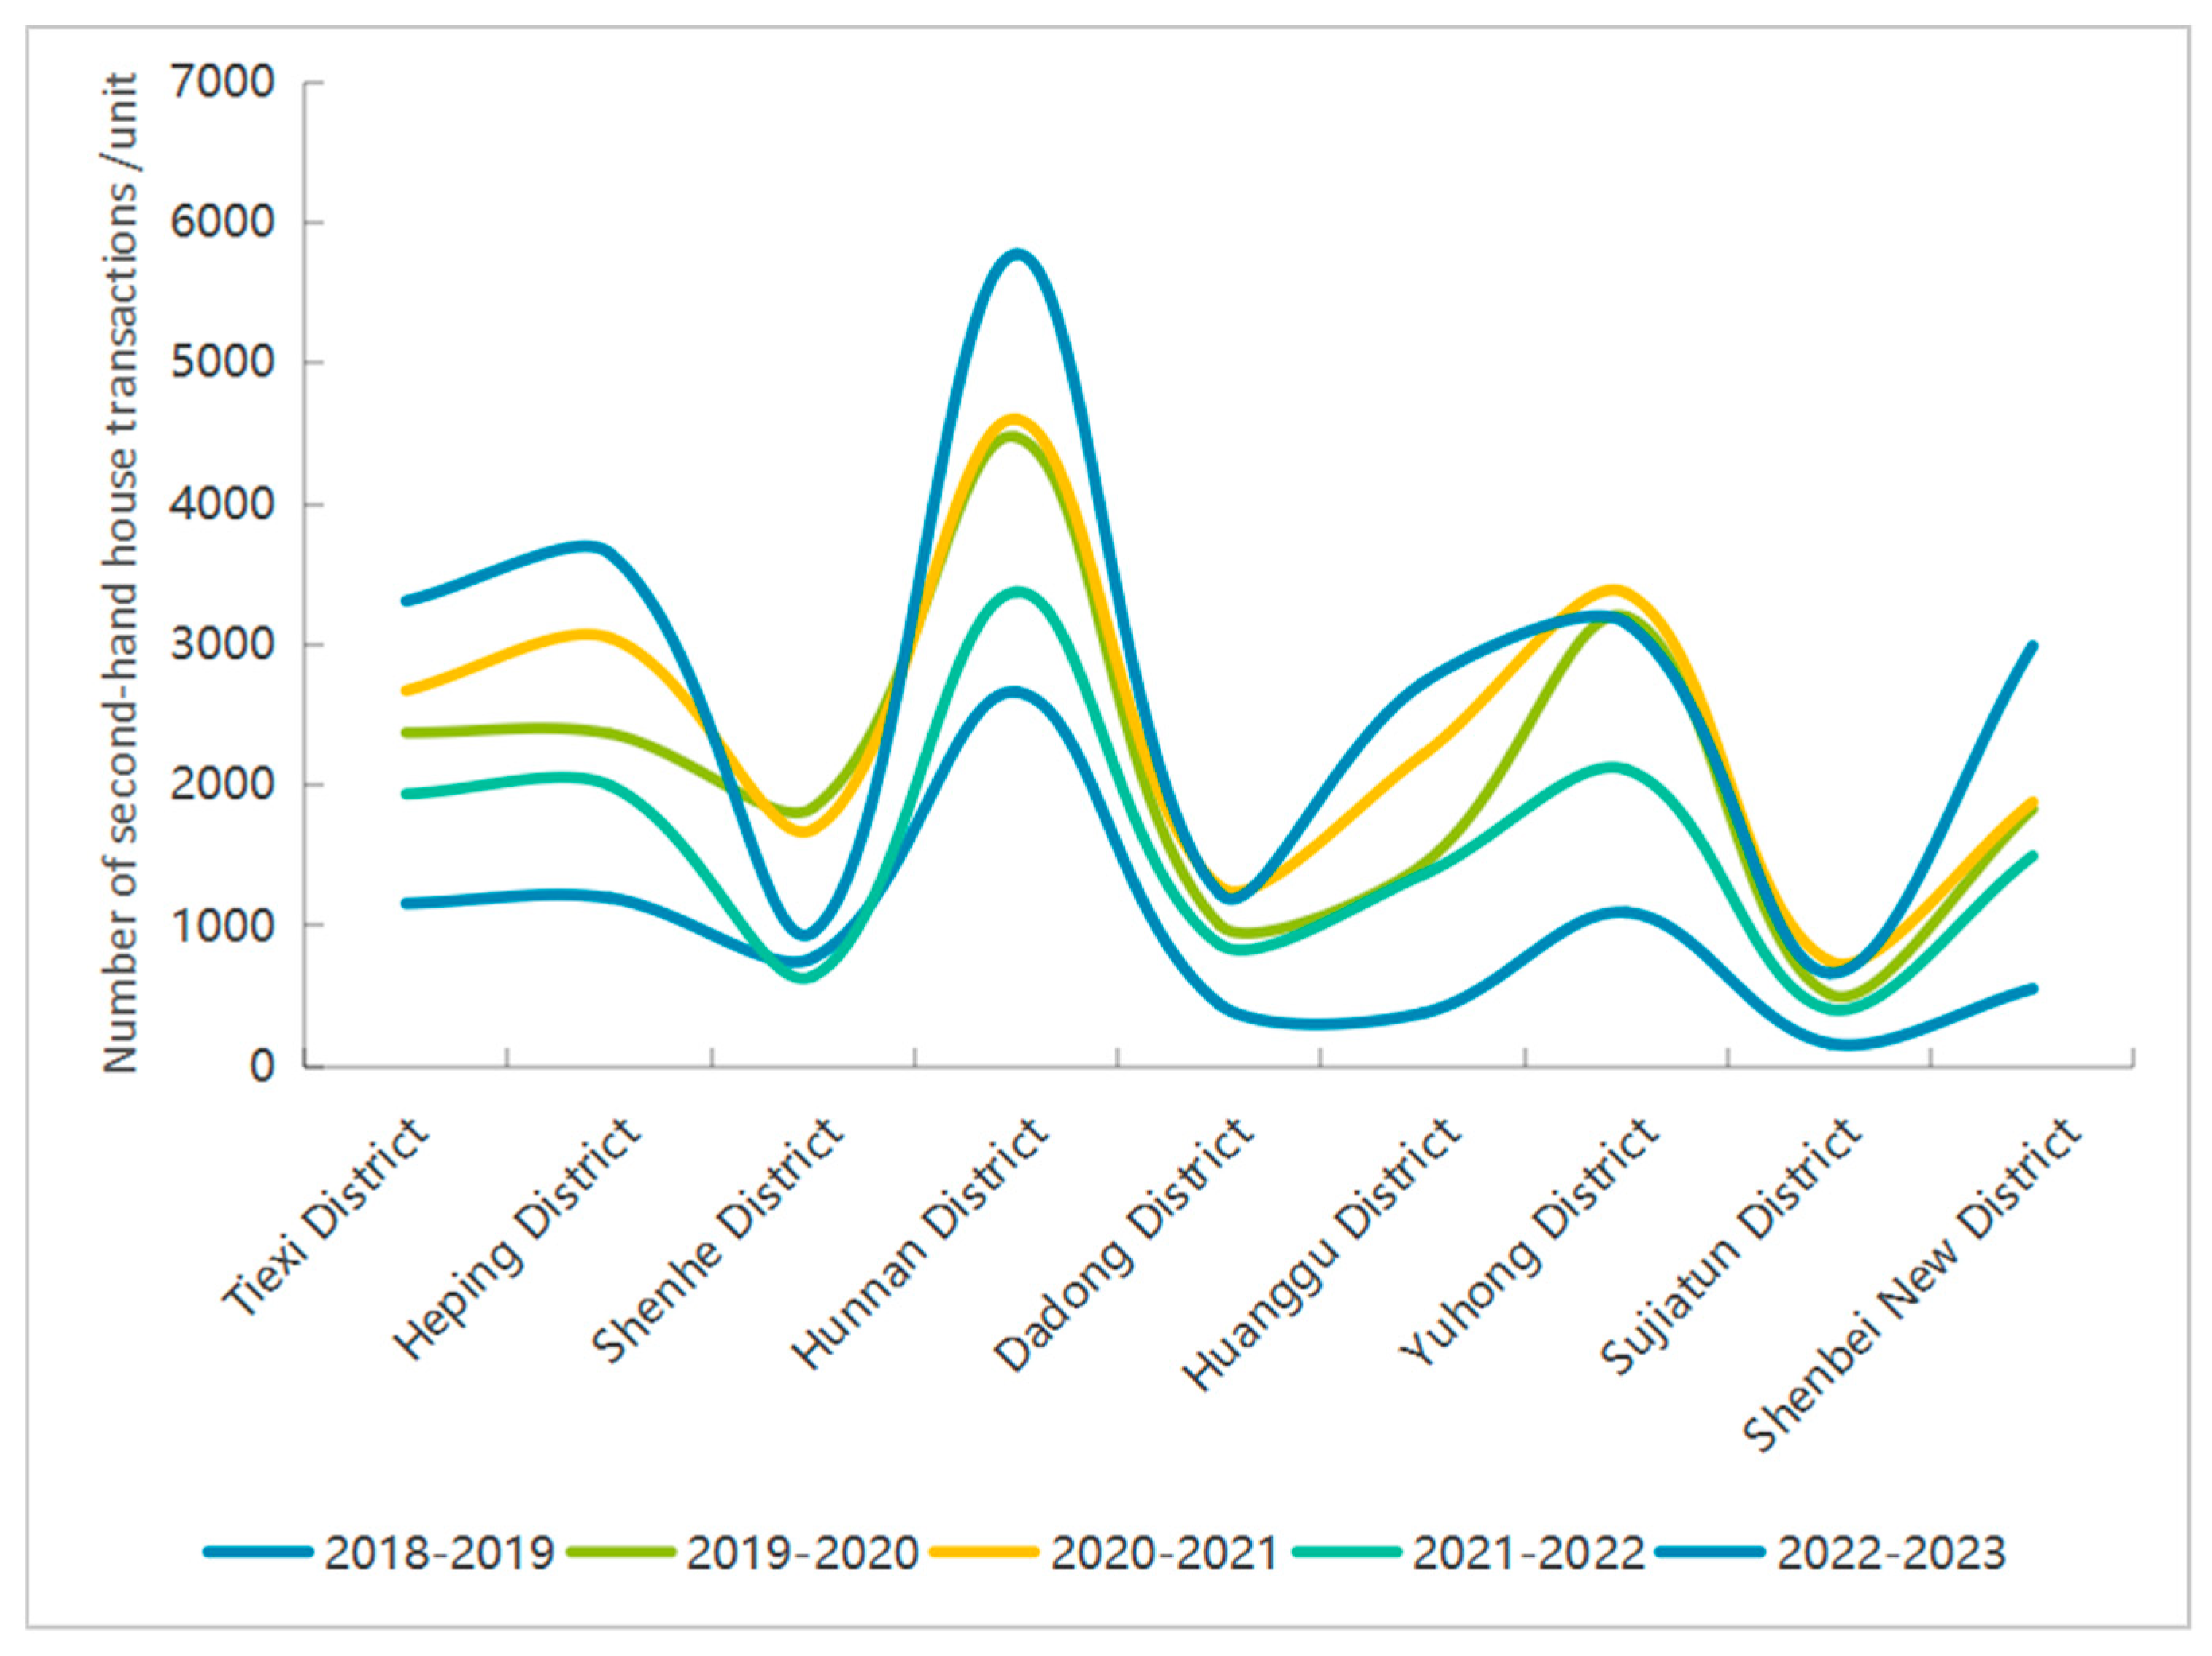
Figure 1. Trend of transaction volume of second-hand houses in Shenyang and its regions.
Ijgi 13 00286 g001
Figure 2. Flowchart of the RScan clustering algorithm.
Ijgi 13 00286 g002
Figure 3. Map of intermediate results of the spatio-temporal evolution of second-hand housing activity by the RScan algorithm and the kernel density estimate. Maps (ae) represent the regional mining results of the RScan algorithm for second-hand housing transaction activity in Shenyang city from 2018 to 2023, each figure corresponding to one-year increments and (fj) depict the results from the kernel density estimation method for the same periods.
Ijgi 13 00286 g003aIjgi 13 00286 g003b
Figure 4. Visualization of the results of the spatio-temporal evolution of second-hand housing activity in Shenyang city. Maps (ae) depict the outcomes of the RScan algorithm for visualizing the regional spatio-temporal evolution of the second-hand housing transaction activity in Shenyang City from 2018 to 2023, each corresponding to one of the five years analyzed.
Ijgi 13 00286 g004aIjgi 13 00286 g004bIjgi 13 00286 g004c
Table 1. Summary of transaction data of second-hand houses in Shenyang City and its regions.
Time/AreaTiexi
District
/Unit
Heping
District
/Unit
Shenhe
District
/Unit
Hunnan
District
/Unit
Dadong
District
/Unit
Huanggu
District
/Unit
Yuhong
District
/Unit
Sujiatun
District
/Unit
Shenbei New District
/Unit
Total
/Unit
2018–201911601199772266244338010961655538430
2019–20202374236718404474100814363198514183119,042
2020–20212673304816854601128022163368750188121,502
2021–202219381999643337486913642112408149714,204
2022–2023331036499555775123127263154665298924,454
Table 2. Definition of the regional scope of spatial data collections.
DefineElucidate
Longitude rangeThis range includes the longitudes of all data points in the dataset, where  l o n m i n  denotes the minimum longitude and  l o n m a x   denotes the maximum longitude.
Latitude rangeThis range encompasses the latitudes of all data points in the dataset, where  l a t m i n  denotes the minimum latitude and  l a t m a x    represents the maximum latitude.
Region   D This covers all the latitude and longitude location data, forming a collection of rectangular regions with longitude ranging from  l o n m i n  to  l o n m a x  and latitude ranging from  l a t m i n   to  l a t m a x .
D = [ l o n m i n , l o n m a x ] × [ l a t m i n , l a t m a x ]
The region D contains all the data points in the entire spatial dataset  S d  and covers all the latitude and longitude location data in a minimal rectangular fashion.
Table 3. Grid set composition of active region conditions.
Serial NumberConditionElement
1DensenessFor U i H , where U i represents an independently active grid cell.
2ConnectivityFor U i H and U j H , there exists a path defined by grid density reachability, ensuring that every intermediate grid cell in the path also belongs to the subset H . This indicates that grid cells within the active region are interconnected through grid density reachability.
3MaximalityFor U i H , if any grid cell U i is grid density reachable from U j , then U i H .
Table 4. Results of running RScan algorithm.
Time PeriodOptimal k-Value (°)Optimal λ-Value
(Number)
Silhouette Coefficient Davies-Bouldin Index (DBI)
2018–20190.062740.42170.0280
2019–20200.010630.36390.0687
2020–20210.013370.38820.0686
2021–20220.015790.39320.0603
2022–20230.011930.44550.0720
Disclaimer/Publisher’s Note: The statements, opinions and data contained in all publications are solely those of the individual author(s) and contributor(s) and not of MDPI and/or the editor(s). MDPI and/or the editor(s) disclaim responsibility for any injury to people or property resulting from any ideas, methods, instructions or products referred to in the content.