

Spatial Planning Data Structure Based on Blockchain Technology

Abstract
1. Introduction
2. Methods
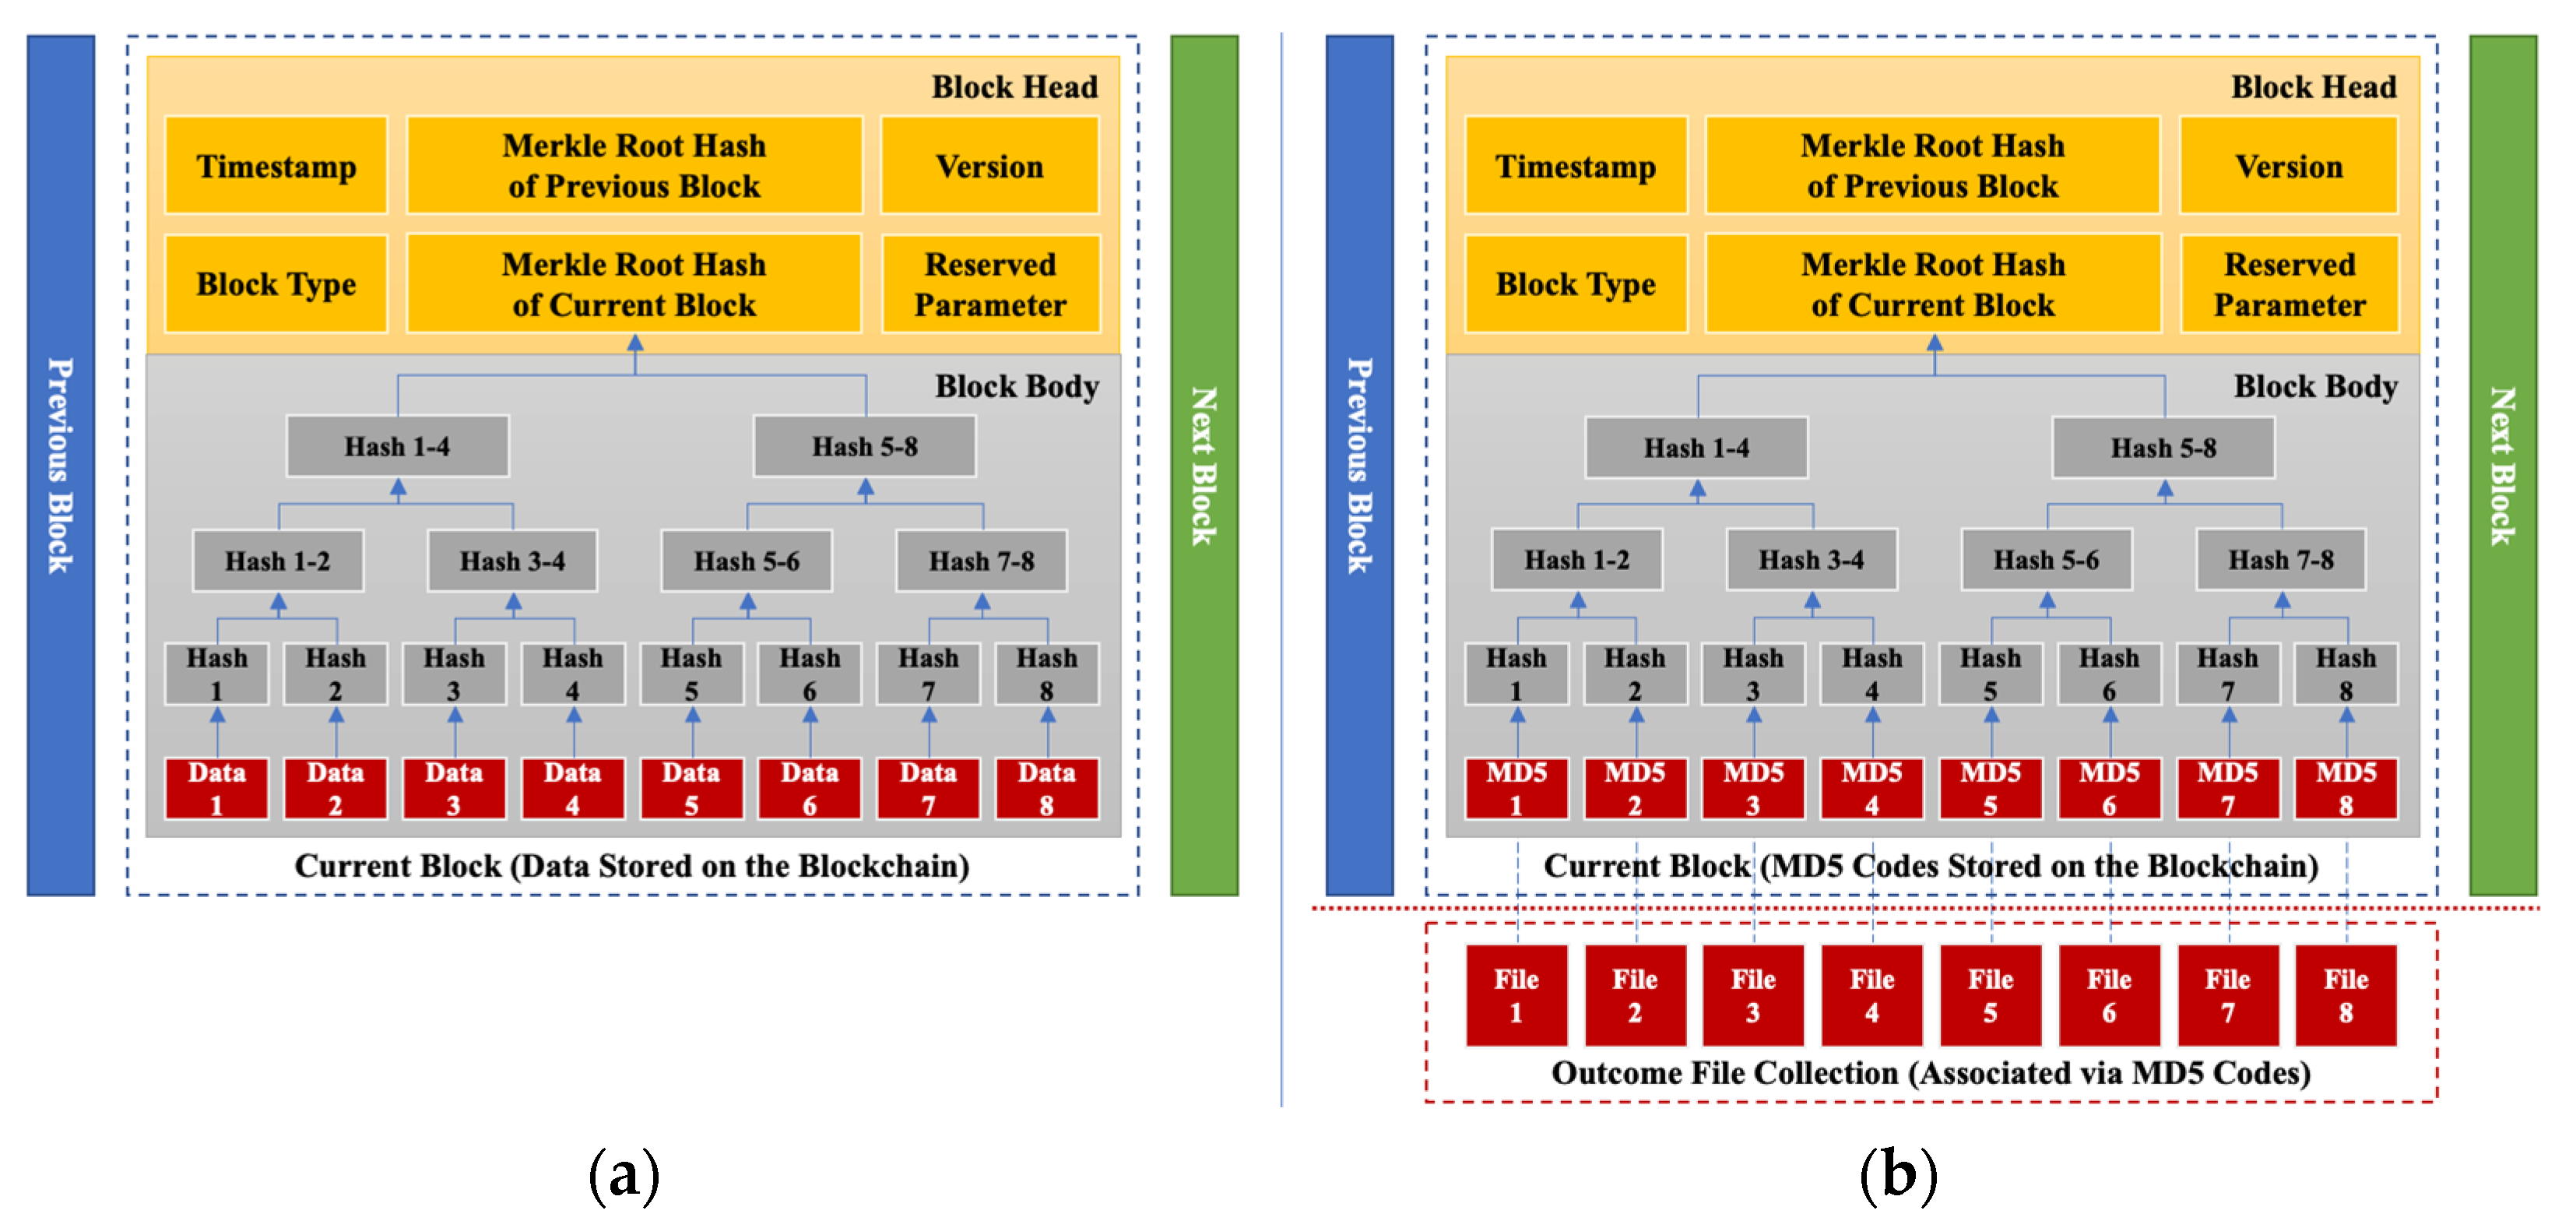
2.1. Block Structure
2.1.1. Block Structure of Structured Data
- (1)
- Block Body of Structured Data
- (2)
- Block Header of Structured Data
- (3)
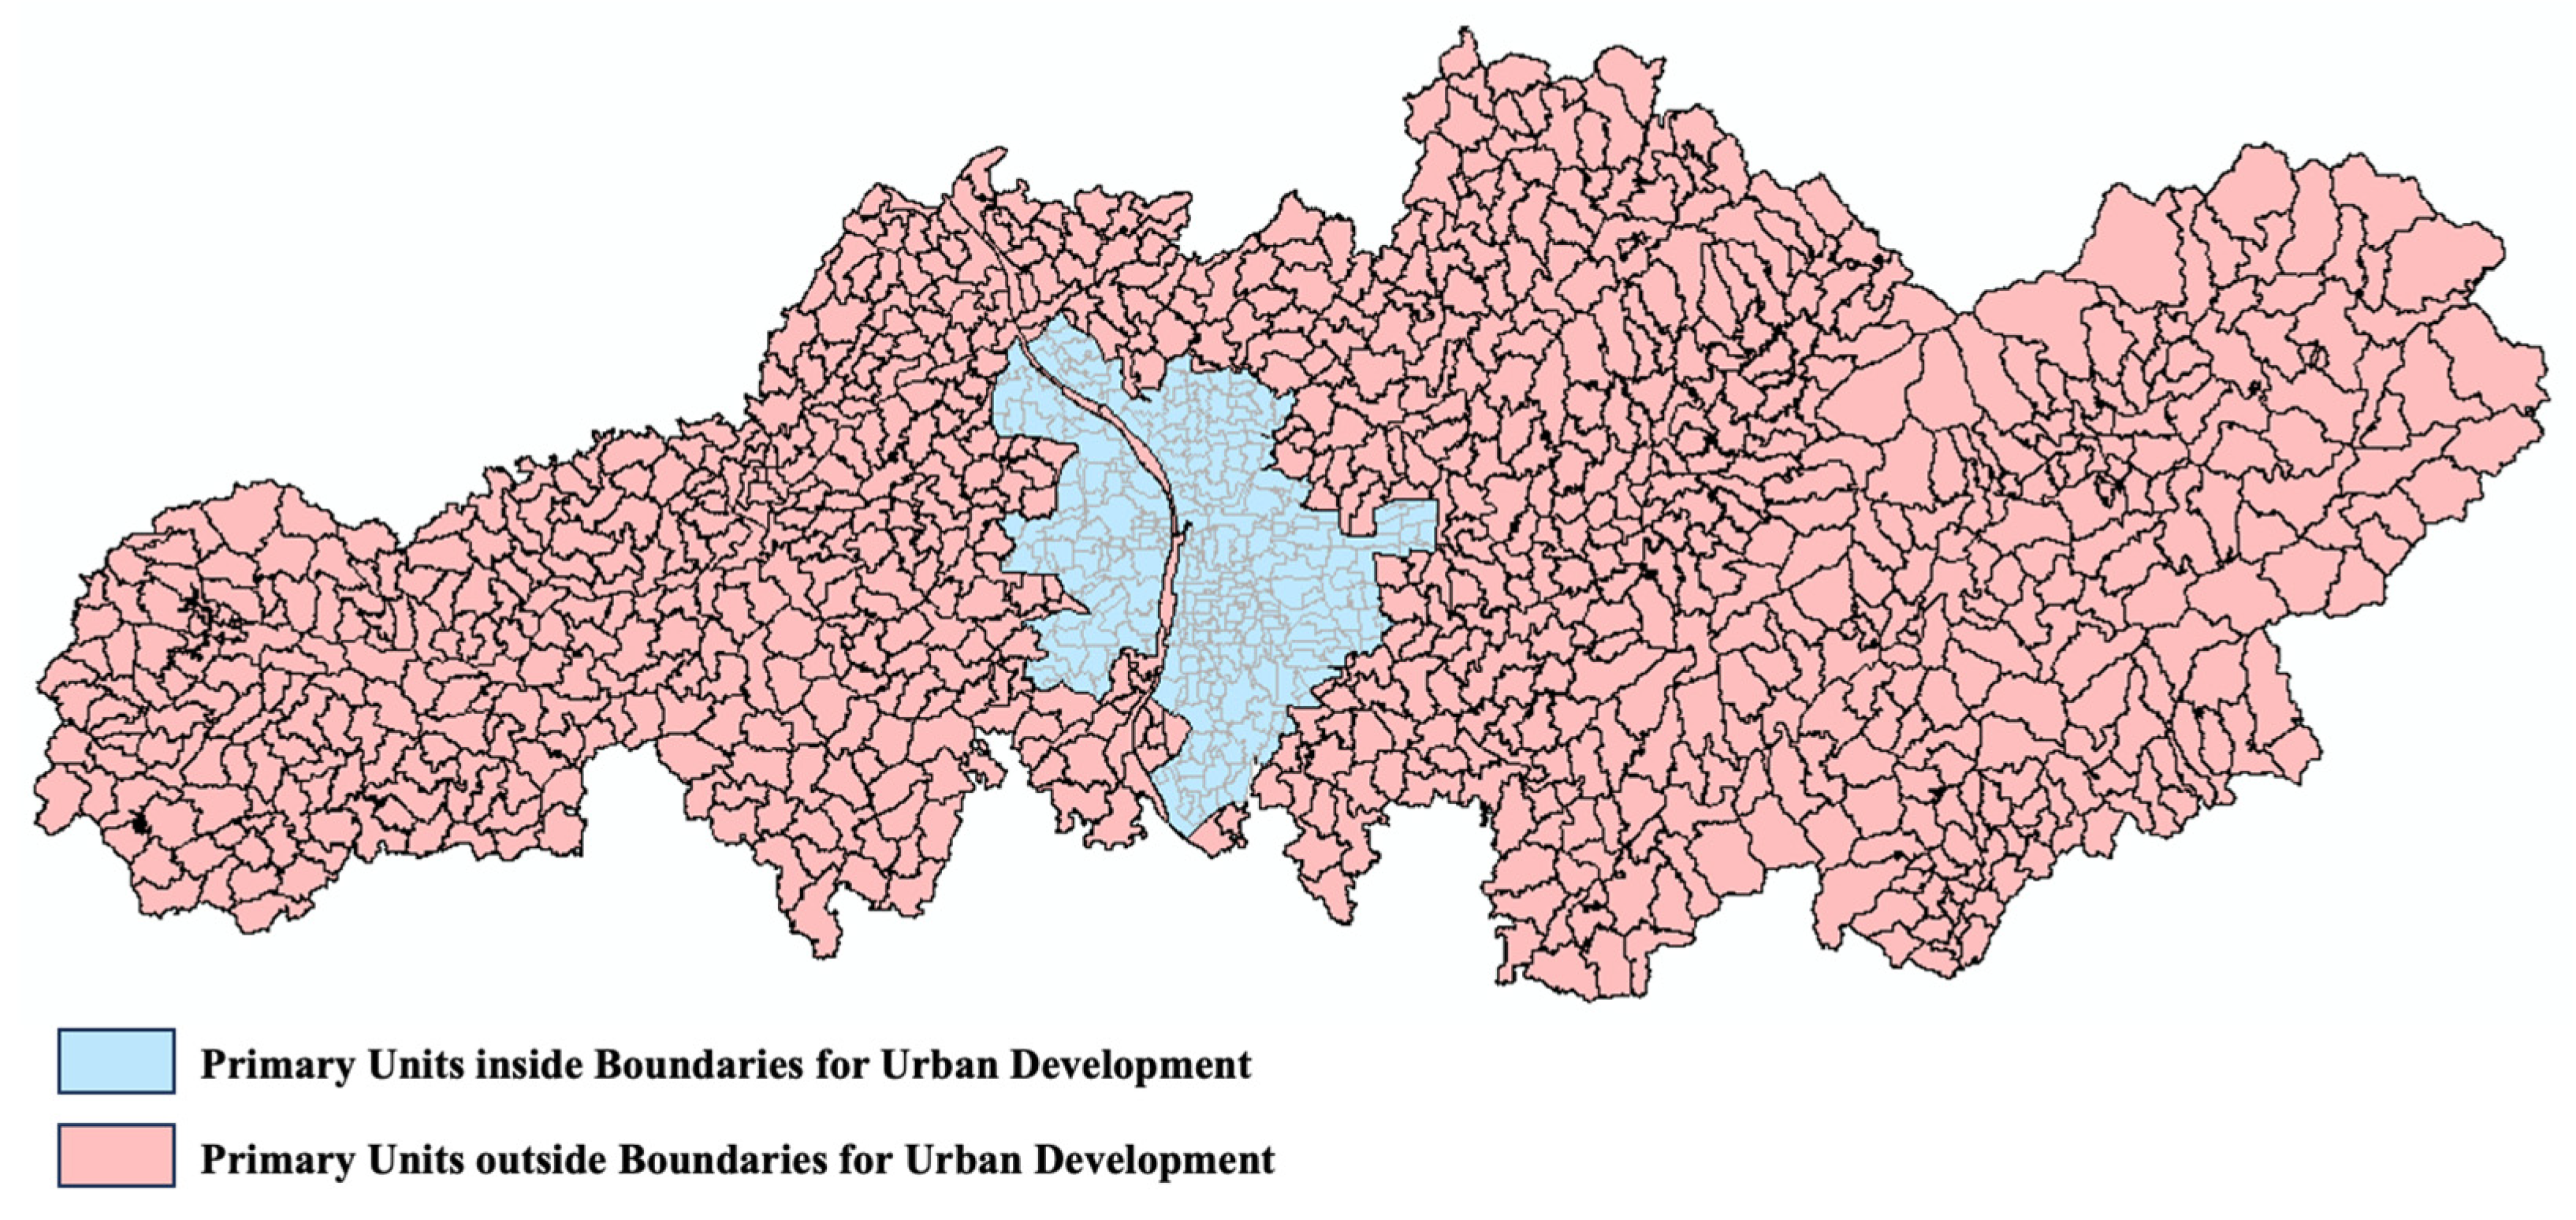
- Primary Unit Division for Structured Data
2.1.2. Block Structure of Unstructured Data
- (1)
- Block Body of Unstructured Data
- (2)
- Block Header of Unstructured Data
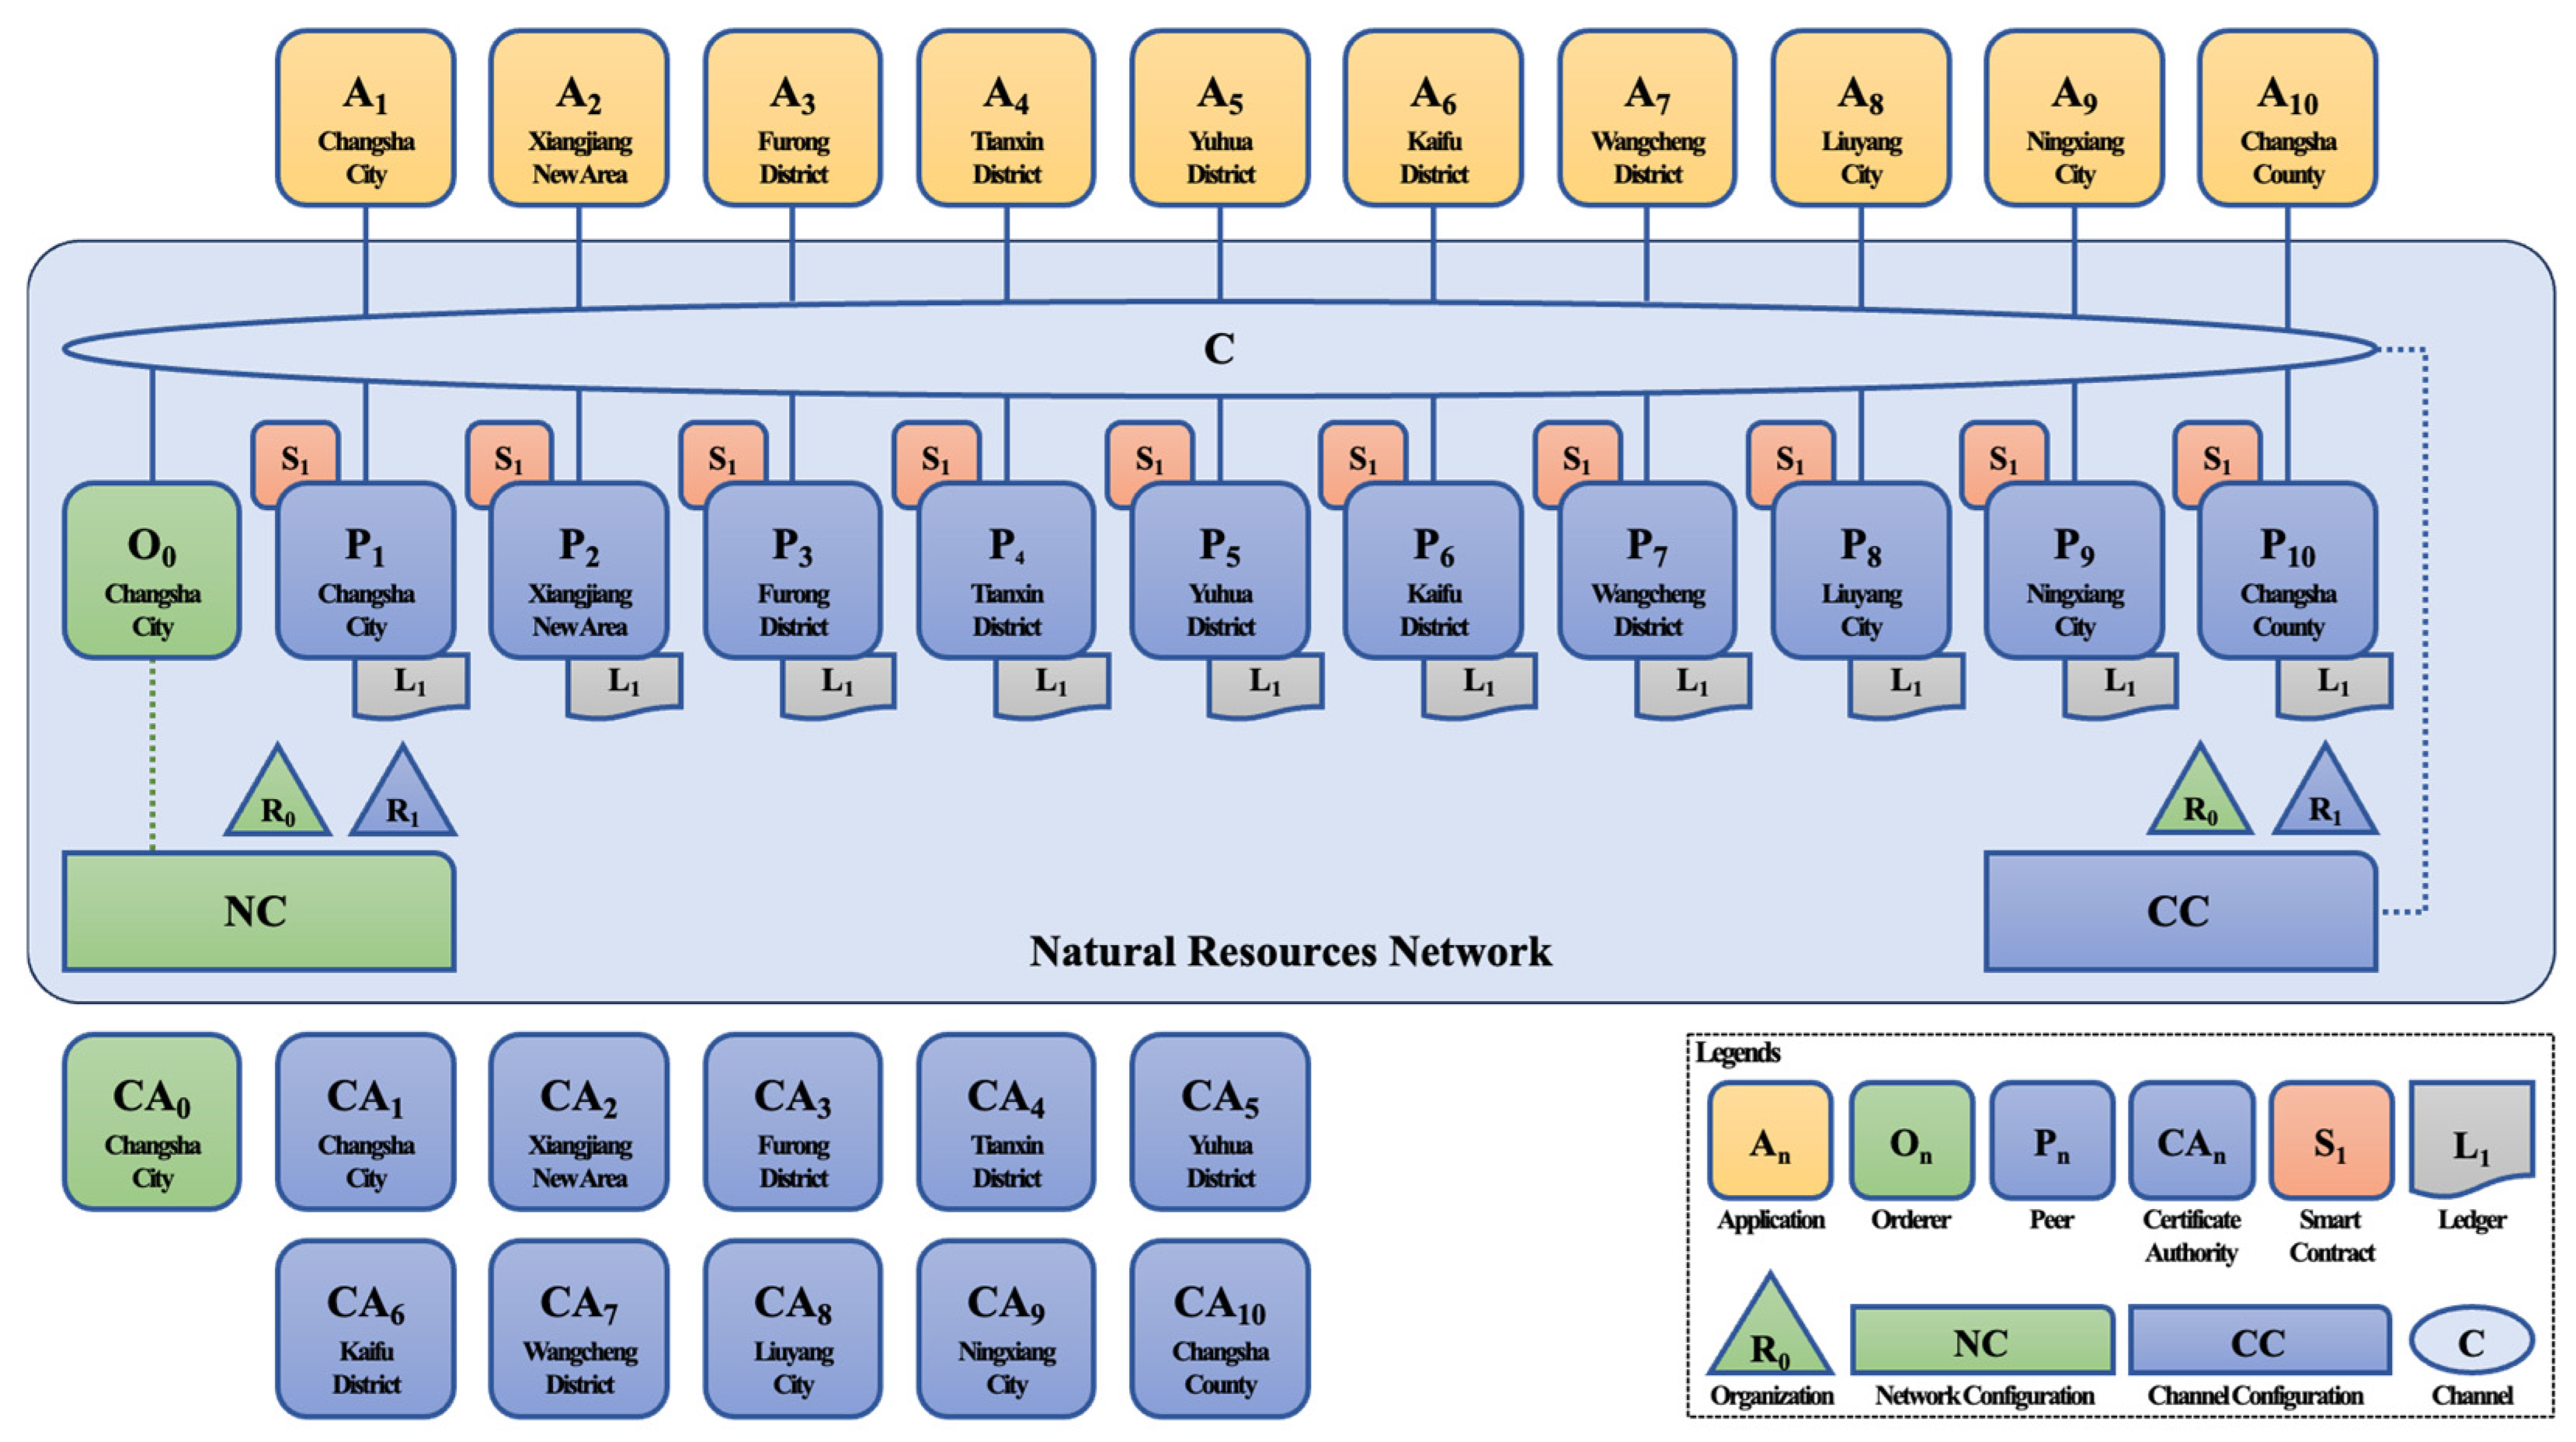
2.2. Chain Structure
2.2.1. Initializing the Chain Structure of Spatial Planning Data
2.2.2. Updating the Chain Structure of Spatial Planning Data
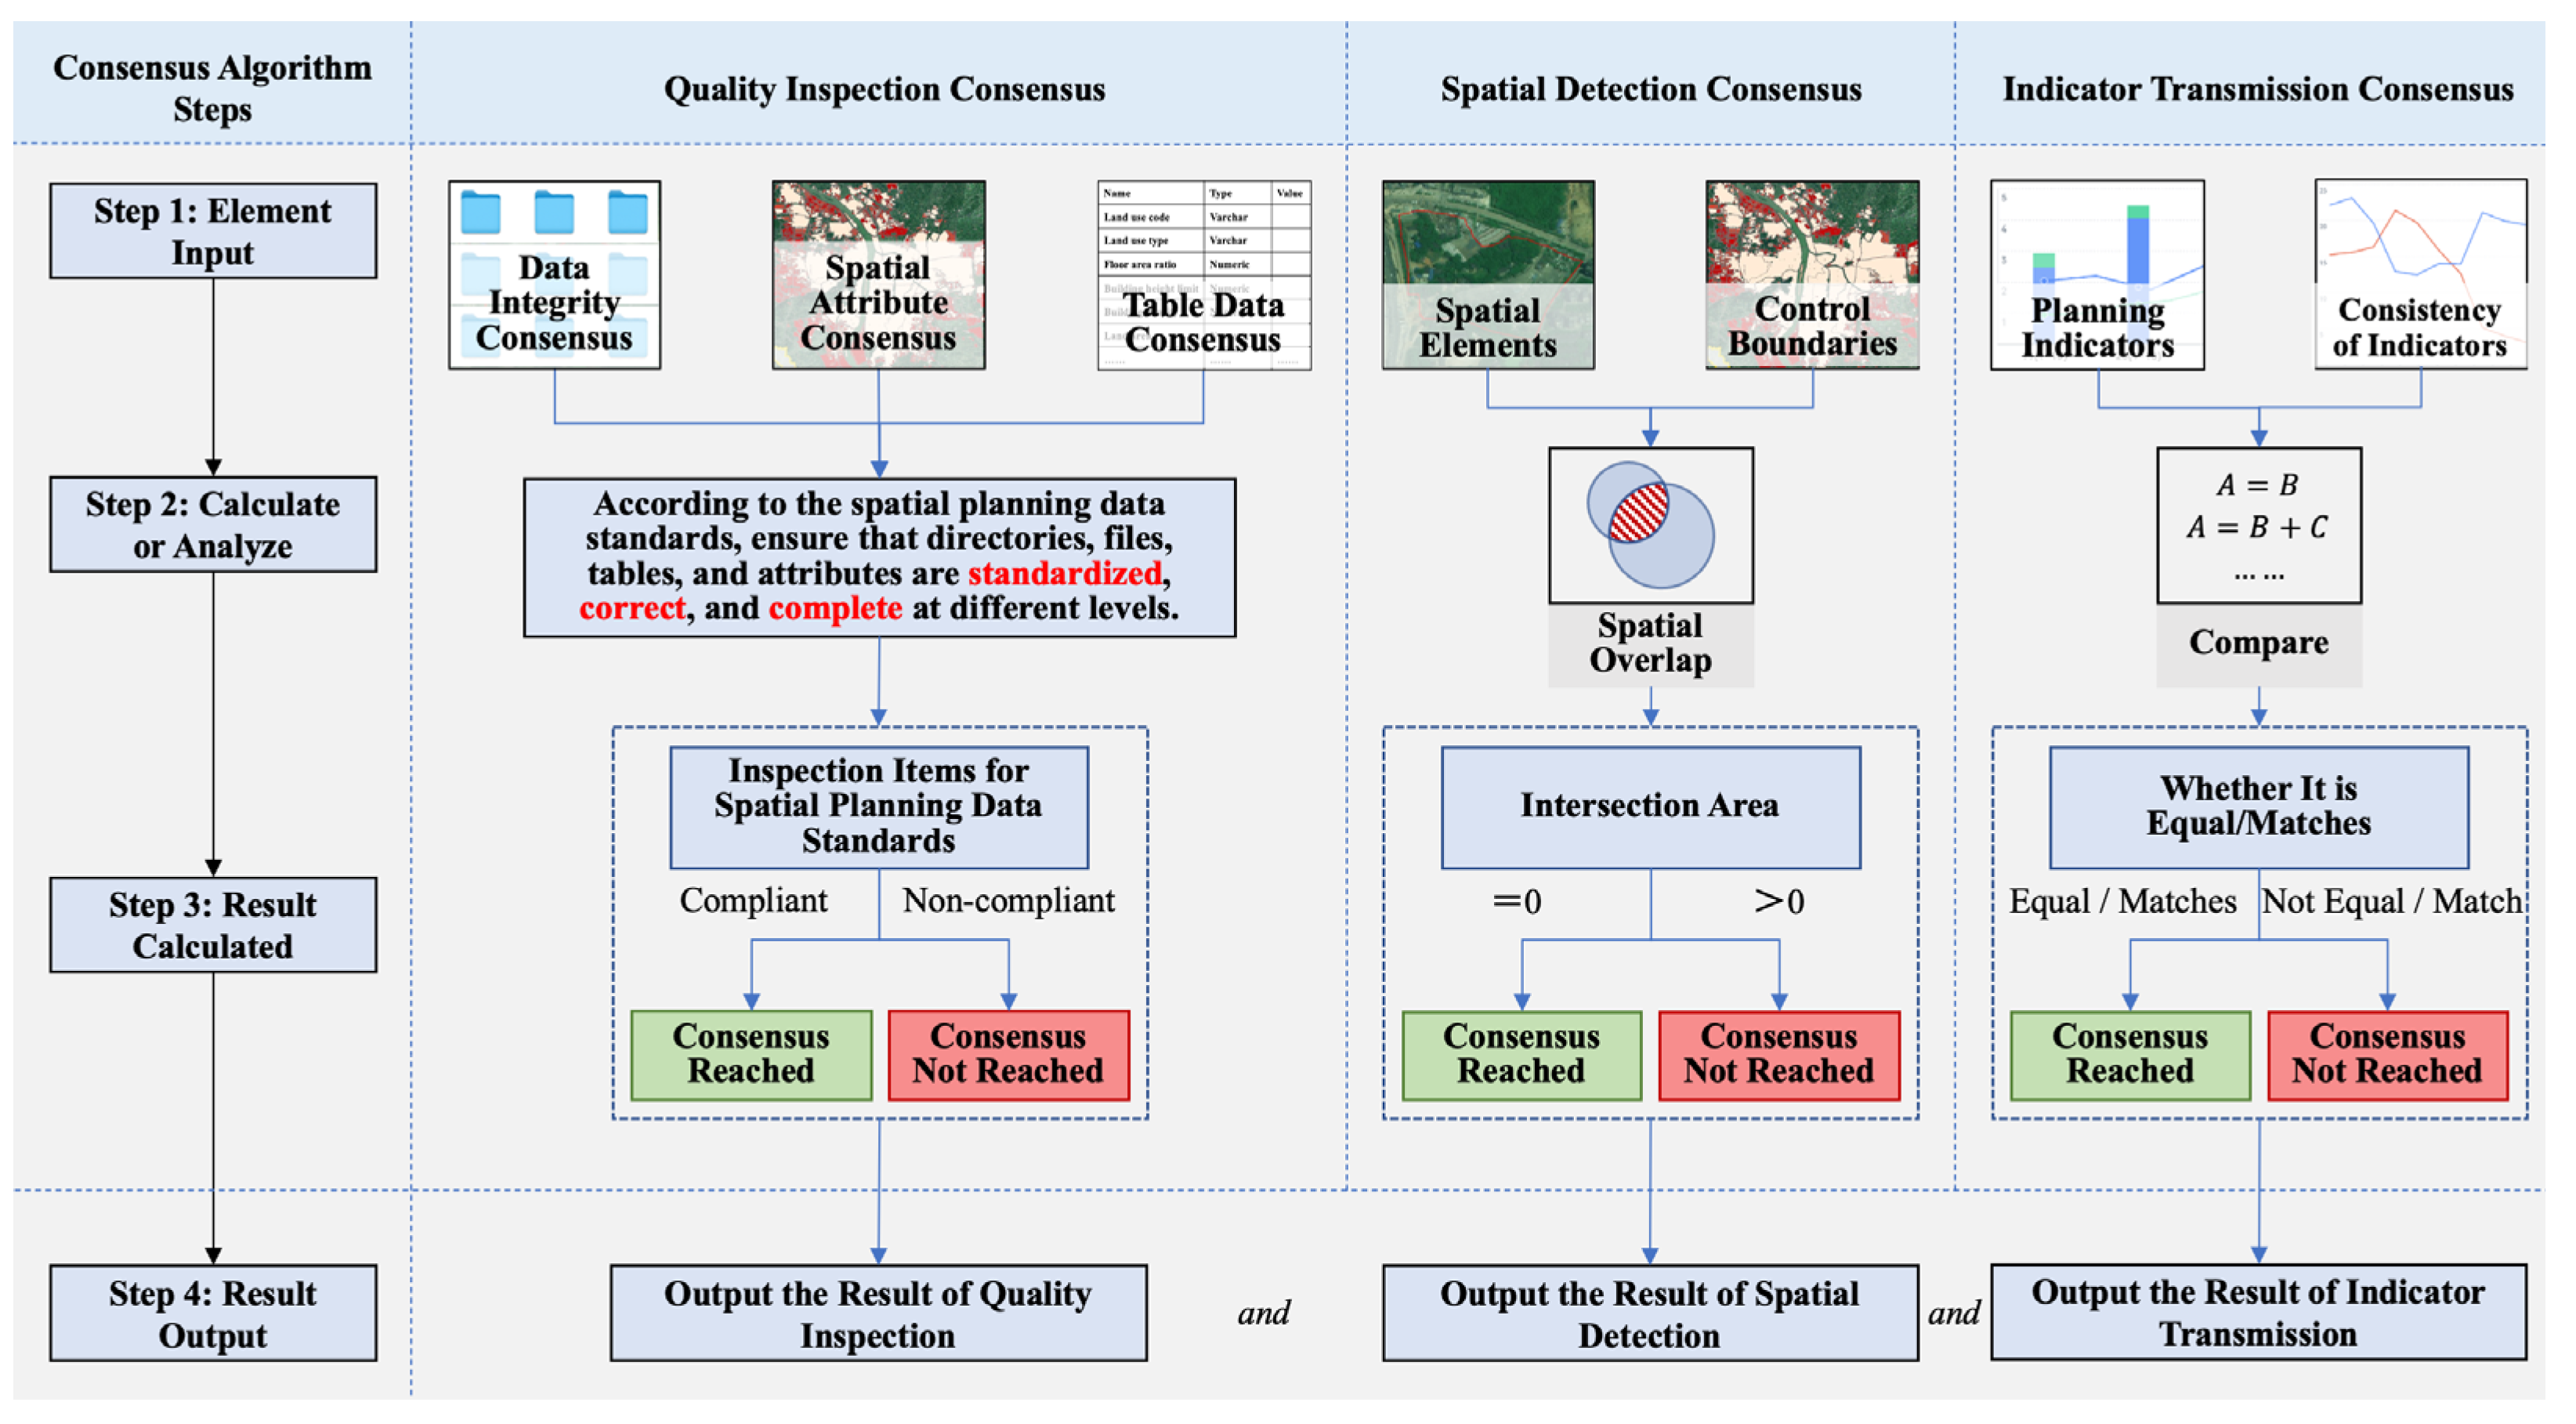
2.3. Consensus Algorithms
3. Experiments
3.1. Data
- (1)
- Spatial Planning Data
- (2)
- Current Spatial Data
- (3)
- Other Data
3.2. Experimental Procedures
3.2.1. Primary Unit Division for Structured Data
- (1)
- Defining Regional Classes and Extracting Minimum Elements
- (2)
- Combining Minimum Elements
- (3)
- Dividing, Calibrating, and Optimizing Primary Units
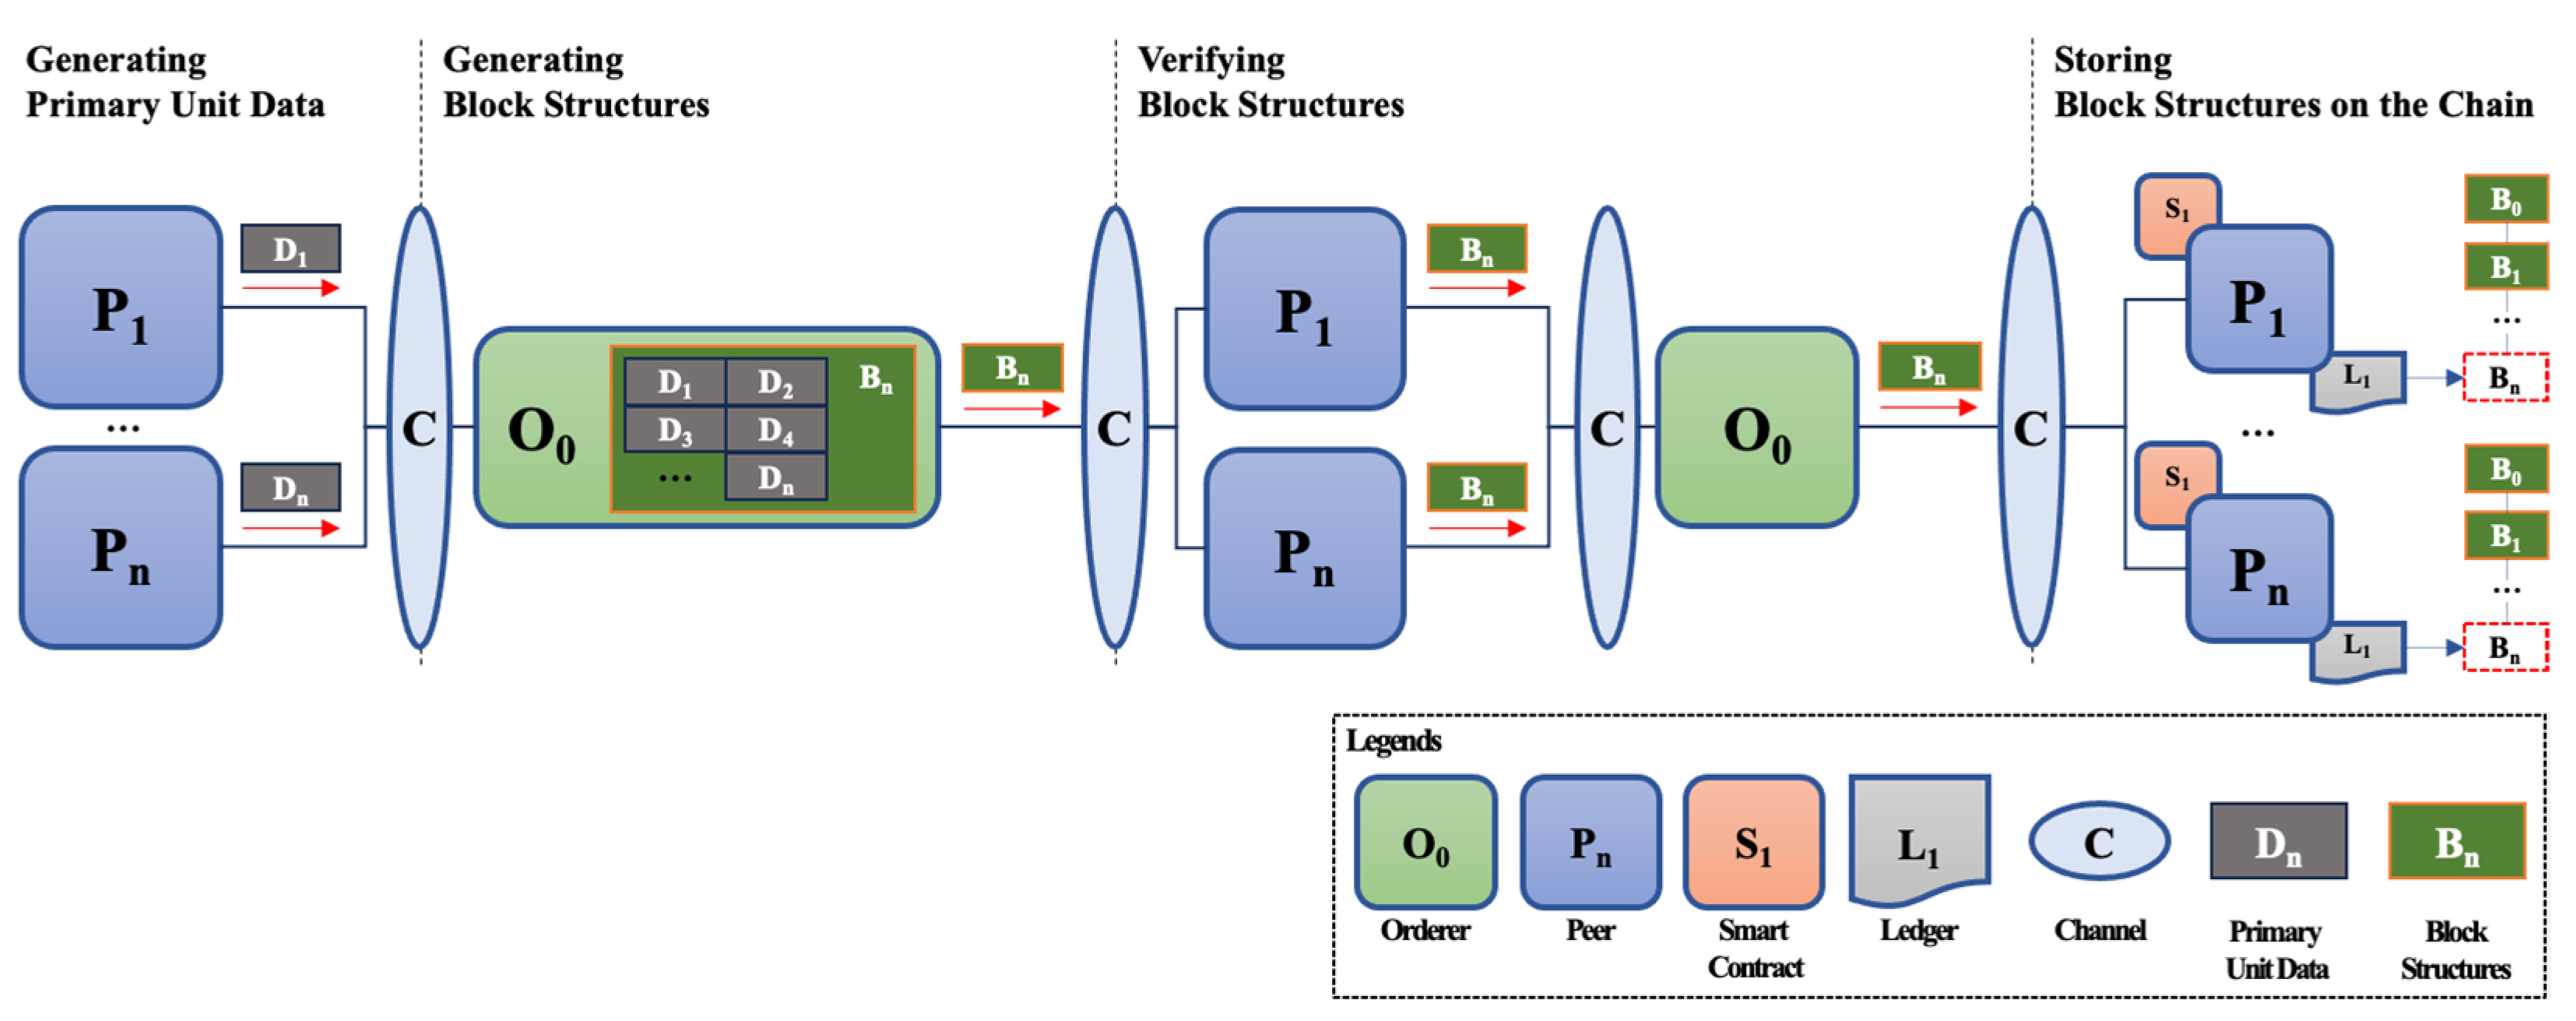
3.2.2. Spatial Planning Data Structures
- (1)
- Generating Primary Unit Data
- (2)
- Generating Block Structures
- (3)
- Verifying Block Structures
| The Pseudocode for Consensus Verification of Primary Unit Data in Blocks | |
| 1 | //Pseudocode for Hyperledger Fabric 2.0 Chaincode, compliant with Java 8 Standard |
| 2 | @Transaction(intent = Transaction.TYPE.SUBMIT) |
| 3 | public Response validatePrimaryUnitData(Context context, String type, String key, String value) { |
| 4 | try { |
| 5 | //Parse the input data into a list of data entries |
| 6 | List<Map<String, Object>> inputDataList = parseInputData(value); |
| 7 | //Iterate over each data entry in the data list |
| 8 | for (Map<String, Object> dataEntry: inputDataList) { |
| 9 | String dataType = dataEntry.get(“dataType”).toString(); |
| 10 | //Validate based on data type |
| 11 | Response result; |
| 12 | if (“structured”.equals(dataType)) { |
| 13 | result = validateStructuredData(dataEntry); |
| 14 | } else if (“unstructured”.equals(dataType)) { |
| 15 | result = validateUnstructuredData(dataEntry); |
| 16 | } else { |
| 17 | //Unknown data type case |
| 18 | return new Response(Response.Status.FAILURE, “Unknown data type.”); |
| 19 | } |
| 20 | //If any validation fails, return a failure response |
| 21 | if (result.getStatus() == Response.Status.FAILURE) { |
| 22 | return result; |
| 23 | } |
| 24 | } |
| 25 | //All validations passed |
| 26 | return new Response(Response.Status.SUCCESS, “All data entries are valid.”); |
| 27 | } catch (Exception e) { |
| 28 | //Handle exceptions generically |
| 29 | return new Response(Response.Status.ERROR, “Validation error.”); |
| 30 | } |
| 31 | } |
| 32 | //Method to validate structured data |
| 33 | private Response validateStructuredData(Map<String, Object> dataEntry) { |
| 34 | //Perform quality, spatial, and indicator validations for structured data |
| 35 | boolean valid = ConsensusValidator.validateQuality(dataEntry).SUCCESS |
| 36 | ConsensusValidator.validateSpatial(dataEntry).SUCCESS |
| 37 | ConsensusValidator.validateIndicator(dataEntry).SUCCESS; |
| 38 | return valid ? new Response(Response.Status.SUCCESS, “Structured data valid.”) |
| 39 | : new Response(Response.Status.FAILURE, “Structured data validation failed.”); |
| 40 | } |
| 41 | //Method to validate unstructured data |
| 42 | private Response validateUnstructuredData(Map<String, Object> dataEntry) { |
| 43 | //Perform MD5 validation for unstructured data |
| 44 | boolean valid = ConsensusValidator.validateMD5(dataEntry).SUCCESS; |
| 45 | return valid ? new Response(Response.Status.SUCCESS, “Unstructured data valid.”) |
| 46 | : new Response(Response.Status.FAILURE, “Unstructured data validation failed.”); |
| 47 | } |
| 48 | //Example input data structure for validation |
| 49 | String value = “{ \”id\”: 202407270001, \”data\”: [ { \”dataType\”: \”structured\”, \”floorAreaRatio\”: 2.0, \”planningLandBoundaryPoint\”: \”MULTIPOLYGON(((lat1 lon1, lat2 lon2, …)))\”, … }, { \”dataType\”: \”unstructured\”, \”fileMD5\”: \”D56D71ECADF2137BE09D8B1D35C6C042\”, …} ] }”; |
- (4)
- Storing Block Structures on the Chain
3.3. Results Evaluation
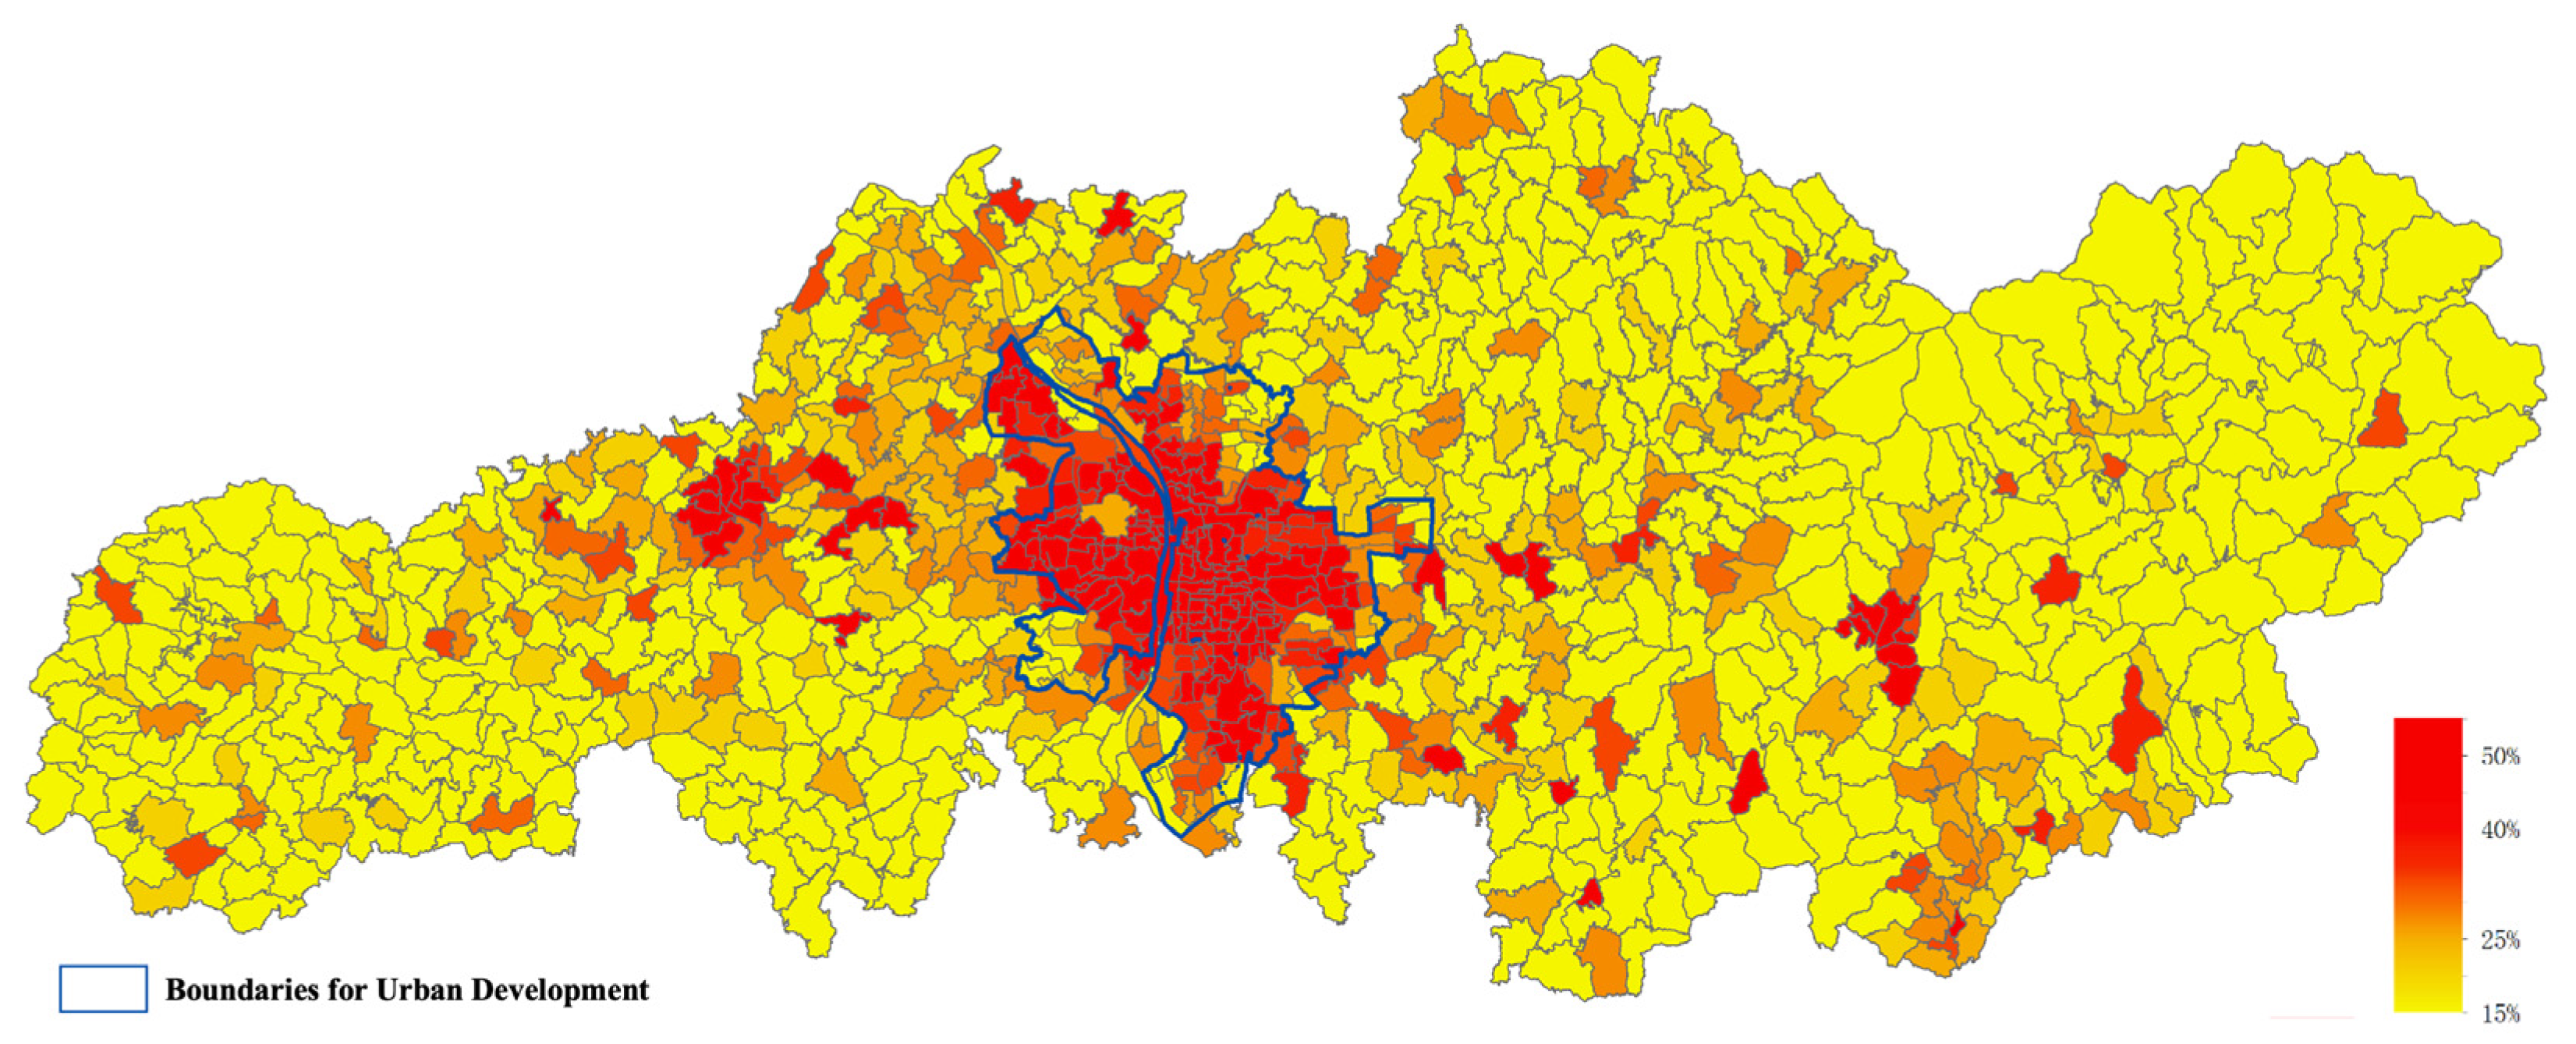
3.3.1. Evaluating the Rationality of Primary Unit Division
3.3.2. Efficiency Assessment of Spatial Planning Data Structure
- (1)
- Block Size and Data Redundancy Evaluation
- (2)
- Consensus Algorithm Efficiency and Data Throughput Evaluation
3.3.3. Comprehensive Assessment of Results
4. Discussion
4.1. The Applications in Monitoring and Early Warning
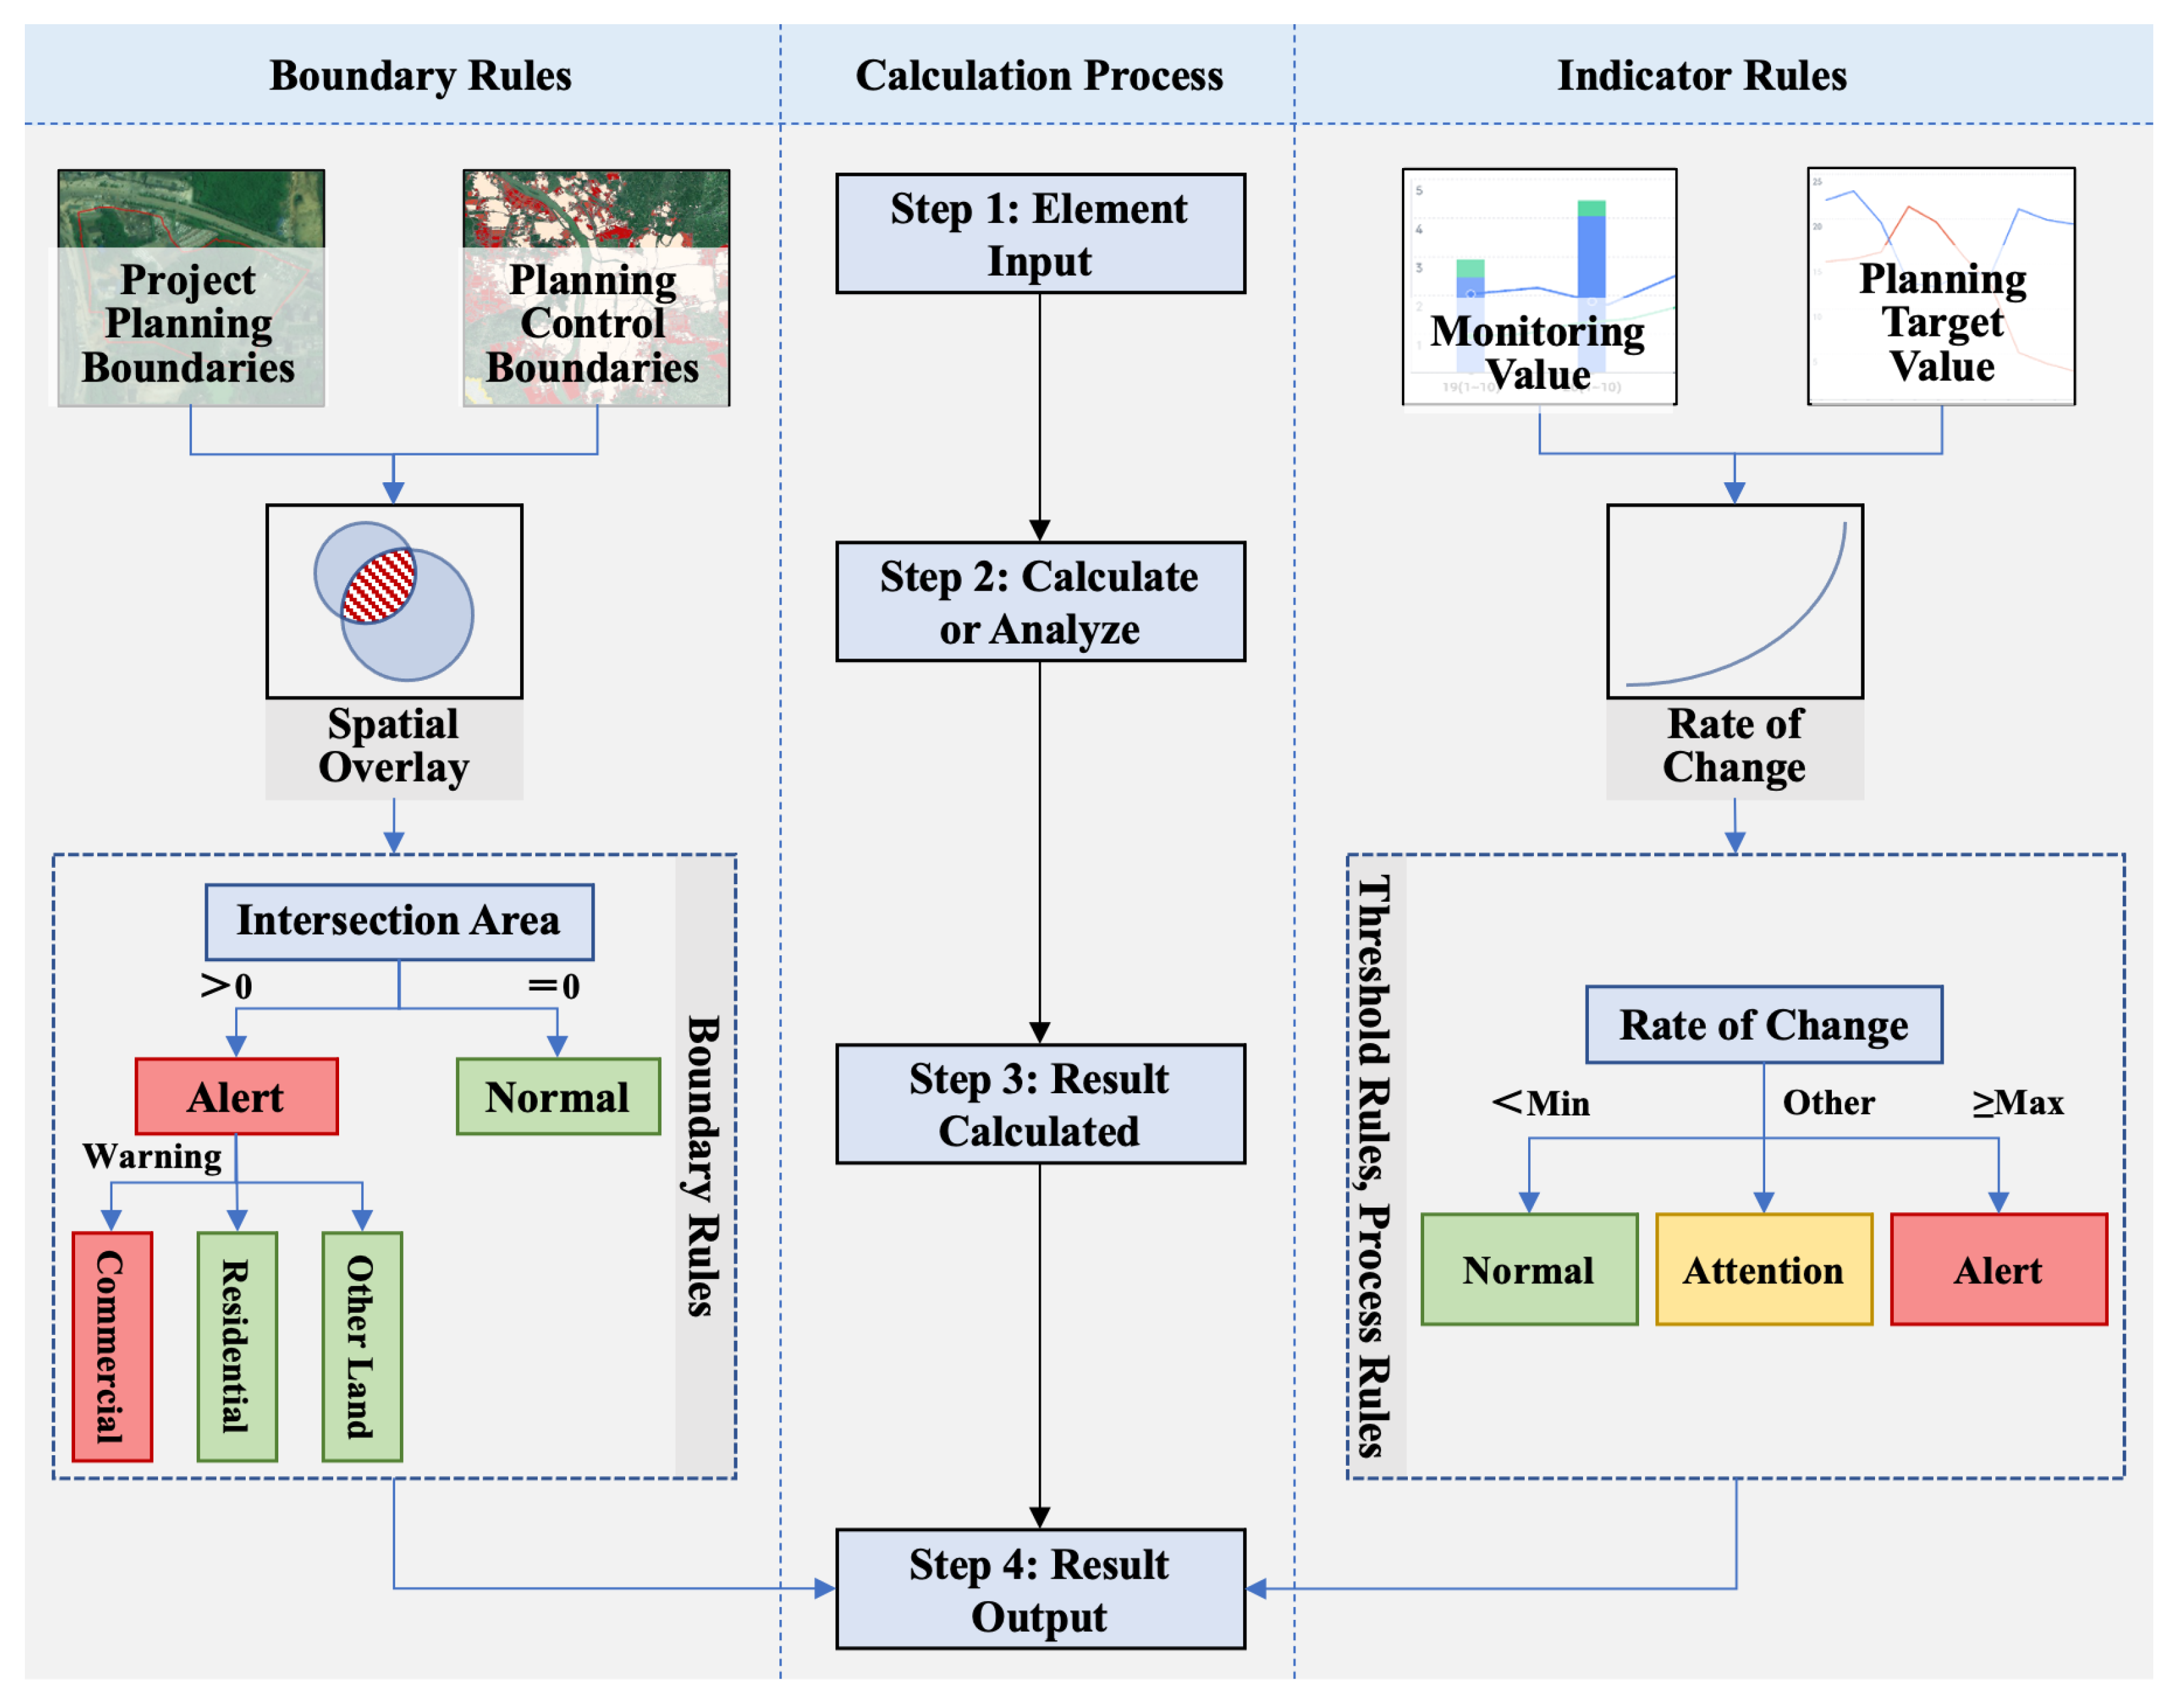
4.1.1. Spatial Monitoring and Early Warning
- (1)
- Inputting Elements:
- (2)
- Calculating Intersections:
- (3)
- Calculating and Outputting Results:
4.1.2. Indicator Monitoring and Early Warning
- (1)
- Inputting Elements
- (2)
- Analyzing Trends
- (3)
- Calculating and Outputting Results
4.2. Generalizability, Limitations, and Future Research Considerations
- (1)
- Enhancing Cross-Industry Coordination and Expanding Users Using Cross-Chain Technology
- (2)
- Providing Public Disclosure and Verification Services Using Off-Chain Interaction Technology
5. Conclusions
6. Patents
Author Contributions
Funding
Data Availability Statement
Acknowledgments
Conflicts of Interest
References
- Wang, Y. Theoretical Exploration and Practical Research on the Construction of Chongqing Spatial Planning System. Ph.D. Thesis, Chongqing University, Chongqing, China, 2021. [Google Scholar]
- Zhu, J.-X. Research on “Multiple Planning Integration” Information System Based on GIS Technology: A Case Study of Lin’an District, Hangzhou City. Master’s Thesis, Zhejiang University, Hangzhou, China, 2021. [Google Scholar]
- Huo, Y.-Q. Research on Dynamic Monitoring and Evaluation Indexes and Technologies of “One Map” of Territorial Spatial Planning. Master’s Thesis, Huaqiao University, Xiamen, China, 2021. [Google Scholar]
- Nakamoto, S. Bitcoin: A Peer-to-Peer Electronic Cash System. 2008. Available online: https://bitcoin.org/bitcoin.pdf (accessed on 13 June 2024).
- Wang, Q.; Li, F.-J.; Wang, Z.-L.; Liang, G.-J.; Xu, J. The Principle and Core Technology of Blockchain. J. Front. Comput. Sci. Technol. 2020, 14, 1621–1643. [Google Scholar]
- Zhou, L.-J. Research on Blockchain Privacy Technology. Ph.D. Thesis, Beijing University of Posts and Telecommunications, Beijing, China, 2019. [Google Scholar]
- Liu, F.; Fan, H.-Y.; Qi, J.-Y. Blockchain Technology, Cryptocurrency: Entropy-Based Perspective. Entropy 2022, 24, 557. [Google Scholar] [CrossRef] [PubMed]
- Alam, K.M.; Rahman, J.M.A.; Tasnim, A.; Akther, A. A Blockchain-based Land Title Management System for Bangladesh. J. King Saud. Univ. Comput. Inf. Sci. 2022, 34, 3096–3110. [Google Scholar] [CrossRef]
- Bennett, R.M.; Pickering, M.; Sargent, J. Transformations, Transitions, or Tall Tales? A Global Review of the Uptake and Impact of NoSQL, Blockchain, and Big Data Analytics on the Land Administration Sector. Land Use Policy 2019, 83, 435–448. [Google Scholar] [CrossRef]
- Stefanovic, M.; Przulj, D.; Ristic, S.; Stefanovic, D.; Nikolic, D. Smart Contract Application for Managing Land Administration System Transactions. IEEE Access 2022, 10, 39154–39176. [Google Scholar] [CrossRef]
- Thakur, V.; Doja, M.N.; Dwivedi, Y.K.; Ahmad, T.; Khadanga, G. Land Records on Blockchain for Implementation of Land Titling in India. Int. J. Inf. Manag. 2020, 52, 9. [Google Scholar] [CrossRef]
- Liu, F.; He, S.-H.; Li, Z.-H.; Li, Z.-B. An Overview of Blockchain Efficient Interaction Technologies. Front. Blockchain 2023, 6, 996070. [Google Scholar] [CrossRef]
- Zheng, Y.; Hou, J.; Li, Z.; Yang, L. Exploring the Use of Blockchain Technology in National Spatial Planning and Management. Resour. Habitant Environ. 2022, 03, 25–32. [Google Scholar]
- Jia, W.-J.; Li, Z.-H. Preliminary Research on the Application of Blockchain Technology in Natural Resources Management. Nat. Resour. Informatiz. 2020, 04, 3–8. [Google Scholar]
- Tian, Y.; Yi, J.-B.; Yi, G.-Z. Strategic Research on the Application of Block-chain in Land Space Planning and Management. In Proceedings of the Annual National Planning Conference 2019, Chongqing, China, 19–21 October 2019; pp. 791–797. [Google Scholar] [CrossRef]
- Cao, X.; Zhang, H.; Gao, X.; Wang, C.-Y. Smart Urban Space-temporal Data Platform with Block Chain Technology. Planners 2020, 36, 46–51. [Google Scholar]
- Xue, T.-F. Research on Several Issues in Blockchain Applications. Ph.D. Thesis, Beijing University of Posts and Telecommunications, Beijing, China, 2019. [Google Scholar]
- Chai, Y.-W.; Li, C.-J.; Xia, W.-Q.; Wang, J.; Zhang, X.; Sun, D.-S. Study on the Delineation Model of Urban Community Life Circle: Based on Qinghe District in Haidian District, Beijing. Urban. Dev. Stud. 2019, 26, 1–8. [Google Scholar]
- Wang, X.-R.; Liu, S.; Wang, Q.-K.; Gao, A.-P. Developing a Community Quality Evaluation System and Analyzing Spatial Characteristics: A Case Study of Hongkou District. Archit. Technol. 2021, 52, 55–58. [Google Scholar]
- Yang, Y.; Qian, Y.-S.; Zeng, J.-W.; Wei, X.-T.; Yang, M.-N. Walkability Measurement of 15-Minute Community Life Circle in Shanghai. Land 2023, 12, 153. [Google Scholar] [CrossRef]
- Wu, H.-Y.; Wang, L.-X.; Zhang, Z.-H.; Gao, J. Analysis and Optimization of 15-minute Community Life Circle Based on Supply and Demand Matching: A Case Study of Shanghai. PLoS ONE 2021, 16, 21. [Google Scholar] [CrossRef] [PubMed]
- Mi, W.-S.; Chai, X.-Y.; Li, D.; Li, L.-T. The Delineation and Planning of 15-Minute Life Circle in Xi’an Hi-tech Industries Development Zone. Huazhong Archit. 2022, 40, 118–123. [Google Scholar] [CrossRef]
- Jiao, H.-Z.; Xiao, M.-M. Delineating Urban Community Life Circles for Large Chinese Cities Based on Mobile Phone Data and POI Data-The Case of Wuhan. ISPRS Int. J. Geo-Inf. 2022, 11, 548. [Google Scholar] [CrossRef]
- Wang, Y.-L.; Wang, T.-P.; Li, X.-C. Delimitation and Optimization on Pedestrain Network of 15 Minute Communtiy Life Circle in Lanzhou City. Sci. Technol. Ind. 2022, 22, 240–247. [Google Scholar]
- Wu, W.; Divigalpitiya, P. Availability and Adequacy of Facilities in 15 Minute Community Life Circle Located in Old and New Communities. Smart Cities 2023, 6, 2176–2195. [Google Scholar] [CrossRef]
- Xiao, Z.-P.; Chai, Y.-W.; Zhang, Y. Overseas Life Circle Planning and Practice. Planners 2014, 30, 89–95. [Google Scholar]
- Zhang, Y.-B. Research on the Spatial Differentiation Characteristics and Optimal Allocation of Community Public Service Facilities Based on Life Circle. Master’s Thesis, Southwest University of Science and Technology, Mianyang, China, 2022. [Google Scholar]
- Chen, Y.-N.; Li, M.; Zhu, X.-H.; Fang, K.; Ren, Q.-S.; Guo, T.; Chen, X.-X.; Li, C.; Zou, Z.-Y.; Deng, Y.-C. An Improved Algorithm for Practical Byzantine Fault Tolerance to Large-scale Consortium Chain. Inf. Process. Manag. 2022, 59, 102884. [Google Scholar] [CrossRef]
- Liu, J.; Xie, M.-Y.; Chen, S.-Y.; Ma, C.; Gong, Q.-H. An Improved DPoS Consensus Mechanism in Blockchain Based on PLTS for the Smart Autonomous Multi-robot System. Inf. Sci. 2021, 575, 528–541. [Google Scholar] [CrossRef]
- Cheng, H.; Ren, C.; Zhang, L.-Y. Developing a Data Governance System for National Spatial Planning that Utilizes Global Multi-Level Planning Unit. Beijing Plan. Rev. 2020, S01, 61–67. [Google Scholar]
- Ma, X.; Zhang, K.; Zhang, Y.-F. Innovative Practice and Method of Urban Master Plan Implementation Evaluation in the New Era: A Case Study of Implementation Assessment of Hangzhou Master Plan. Shanghai Urban. Plan. Rev. 2020, 01, 61–68. [Google Scholar]
- Pan, R.; Yang, Y.-D.; Zhu, L. Establishing the Transmission System of Territorial Space Planning, Hangzhou. Planners 2022, 38, 66–70. [Google Scholar]


| Field Name | Field Code | Field Type | Field Length |
|---|---|---|---|
| Land use code | YDCode | Varchar | 50 |
| Land use type | YDType | Varchar | 10 |
| Land use name | YDName | Varchar | 50 |
| Regulatory detailed planning code | GHCode | Numeric | 38 |
| Regulatory detailed planning name | GHName | Varchar | 100 |
| Floor area ratio | Capability | Numeric | 38 |
| Building height limit | BLDHLimit | Numeric | 38 |
| Building density | BLDDensity | Numeric | 38 |
| Greening rate | GreenRate | Numeric | 38 |
| Total area | AreaTotal | Numeric | 38 |
| Land area | AreaYD | Numeric | 38 |
| Road area | AreaRoad | Numeric | 38 |
| Green area | AreaGreen | Numeric | 38 |
| Building area | AreaBuild | Numeric | 38 |
| Population size | PopNum | Numeric | 38 |
| Population density | PopDensity | Numeric | 38 |
| Supporting service facilities | PubEstab | Varchar | 200 |
| Planning land boundary point | Shape | Binary | Indefinite Length |
| Dimension | Dimension Weight | Specific Indicators | Indicator Weight |
|---|---|---|---|
| Education facilities (A) | 0.138 | Kindergarten coverage (A1) | 0.393 |
| Primary school coverage (A2) | 0.321 | ||
| Middle school coverage (A3) | 0.286 | ||
| Government services (B) | 0.115 | Community public service center coverage (B1) | 0.354 |
| Subdistrict administrative management coverage (B2) | 0.314 | ||
| Police station coverage (B3) | 0.332 | ||
| Public culture (C) | 0.241 | Community cultural activity room coverage (C1) | 0.186 |
| Cultural activity center coverage (C2) | 0.152 | ||
| Regional level or above cultural venues coverage (C3) | 0.127 | ||
| Street green space coverage (C4) | 0.191 | ||
| Community park coverage (C5) | 0.180 | ||
| Comprehensive park coverage (C6) | 0.164 | ||
| Sports facilities (D) | 0.122 | Community multi-function sports field coverage (D1) | 0.393 |
| National fitness activity center coverage (D2) | 0.324 | ||
| Regional level or above sports facilities coverage (D3) | 0.283 | ||
| Medical health (E) | 0.132 | Community health service station coverage (E1) | 0.376 |
| Subdistrict health service center coverage (E2) | 0.321 | ||
| Hospital coverage (E3) | 0.303 | ||
| Welfare care (F) | 0.115 | Home care service station coverage (F1) | 0.529 |
| Day care center coverage (F2) | 0.471 | ||
| Daily life (G) | 0.137 | Nursing home coverage (G1) | 0.282 |
| Farmers’ market coverage (G2) | 0.372 | ||
| Public toilet coverage (G3) | 0.209 | ||
| Garbage collection station coverage (G4) | 0.137 |
| Control Boundaries | Reference Data | Monitoring and Early Warning Rules |
|---|---|---|
| Urban development boundaries | Various boundaries, complete survey maps, and aerial photo enforcement polygons | Prohibit crossing. Construction must be confined within the urban development boundaries. A red warning will be issued if crossing is detected. |
| Permanent bare cropland protection boundaries and ecological conservation boundaries | Prohibit occupation. A red warning will be issued if occupation is detected. | |
| Nature reserve boundaries | Prohibit occupation. The core protection areas and general control areas are managed separately. A red warning will be issued if occupation is detected. | |
| Historical protection zone boundaries, urban green space boundaries, urban surface water protection and control zone boundaries, and urban infrastructure land control zone boundaries | Strictly controlled occupation. A red warning will be issued if occupation or land misuse is detected. |
| Indicators | Indicator and Data Source | Monitoring and Early Warning Rules |
|---|---|---|
| Master planning indicators |
| The corresponding warning rules can be developed based on the actual application of each indicator. The rules provided in this research are for reference only.
|
| Detailed planning indicators |
| Each indicator follows the corresponding early warning rules. The following are some indicator rules:
|
Disclaimer/Publisher’s Note: The statements, opinions and data contained in all publications are solely those of the individual author(s) and contributor(s) and not of MDPI and/or the editor(s). MDPI and/or the editor(s) disclaim responsibility for any injury to people or property resulting from any ideas, methods, instructions or products referred to in the content. |
© 2024 by the authors. Licensee MDPI, Basel, Switzerland. This article is an open access article distributed under the terms and conditions of the Creative Commons Attribution (CC BY) license (https://creativecommons.org/licenses/by/4.0/).
Share and Cite
Tang, M.; Dai, W.; Yin, C.; Hu, B.; Chen, J.; Liu, H. Spatial Planning Data Structure Based on Blockchain Technology. ISPRS Int. J. Geo-Inf. 2024, 13, 290. https://doi.org/10.3390/ijgi13080290
Tang M, Dai W, Yin C, Hu B, Chen J, Liu H. Spatial Planning Data Structure Based on Blockchain Technology. ISPRS International Journal of Geo-Information. 2024; 13(8):290. https://doi.org/10.3390/ijgi13080290
Chicago/Turabian StyleTang, Minwen, Wujiao Dai, Changlin Yin, Bing Hu, Jun Chen, and Haoming Liu. 2024. "Spatial Planning Data Structure Based on Blockchain Technology" ISPRS International Journal of Geo-Information 13, no. 8: 290. https://doi.org/10.3390/ijgi13080290
APA StyleTang, M., Dai, W., Yin, C., Hu, B., Chen, J., & Liu, H. (2024). Spatial Planning Data Structure Based on Blockchain Technology. ISPRS International Journal of Geo-Information, 13(8), 290. https://doi.org/10.3390/ijgi13080290