

The Impact of Airbnb on Long-Term Rental Markets in San Francisco: A Geospatial Analysis Using Multiscale Geographically Weighted Regression

Abstract
1. Introduction
2. Literature Review
2.1. Peer-to-Peer Accommodation
2.2. Impact of Airbnb on the Local Community

| Study | Dependent Variable | Study Area | Data Year | Heterogeneity of Renters | Heterogeneity of Airbnb | Estimation Method |
|---|---|---|---|---|---|---|
| Ayouba et al. [36] |
| 8 French cities | 2014–2016 | Yes (Move-in year) | Yes (Entire home or rented more than 120 days/year) | Spatial Autoregressive Combined (SAC) |
| Barron et al. [11] |
| US | 2008–2016 | No | No | 2SLS (with instrument variable and fixed effects) |
| Benítez-Aurioles and Tussyadiah [13] |
| London, UK | 2016–2019 | Yes (# of bedrooms) | No | System GMM |
| Garcia-López et al. [38] |
| Barcelona, Spain | 2007–2017 | No | No | 2SLS (with instrument variable and fixed effects) |
| Horn and Merante [34] |
| Boston, US | 2015–2016 | Yes (# of bedrooms) | No | Panel fixed effects |
| Lee and Kim [14] |
| New York City, US | 2016–2019 | No | Yes (Entire home and multi-listing host) | Dynamic Spatial Durbin Model |
| Ram and Tchetchik [35] |
| Tel Aviv, Israel | 2017–2018 | Yes (# of bedrooms) | Yes (# of bedrooms) | System GMM |
| Shabrina et al. [37] |
| London, UK | 2015–2019 | No | Yes (Entire home, rented more than 180 days/year, and multi-listing hosts) | OLS |
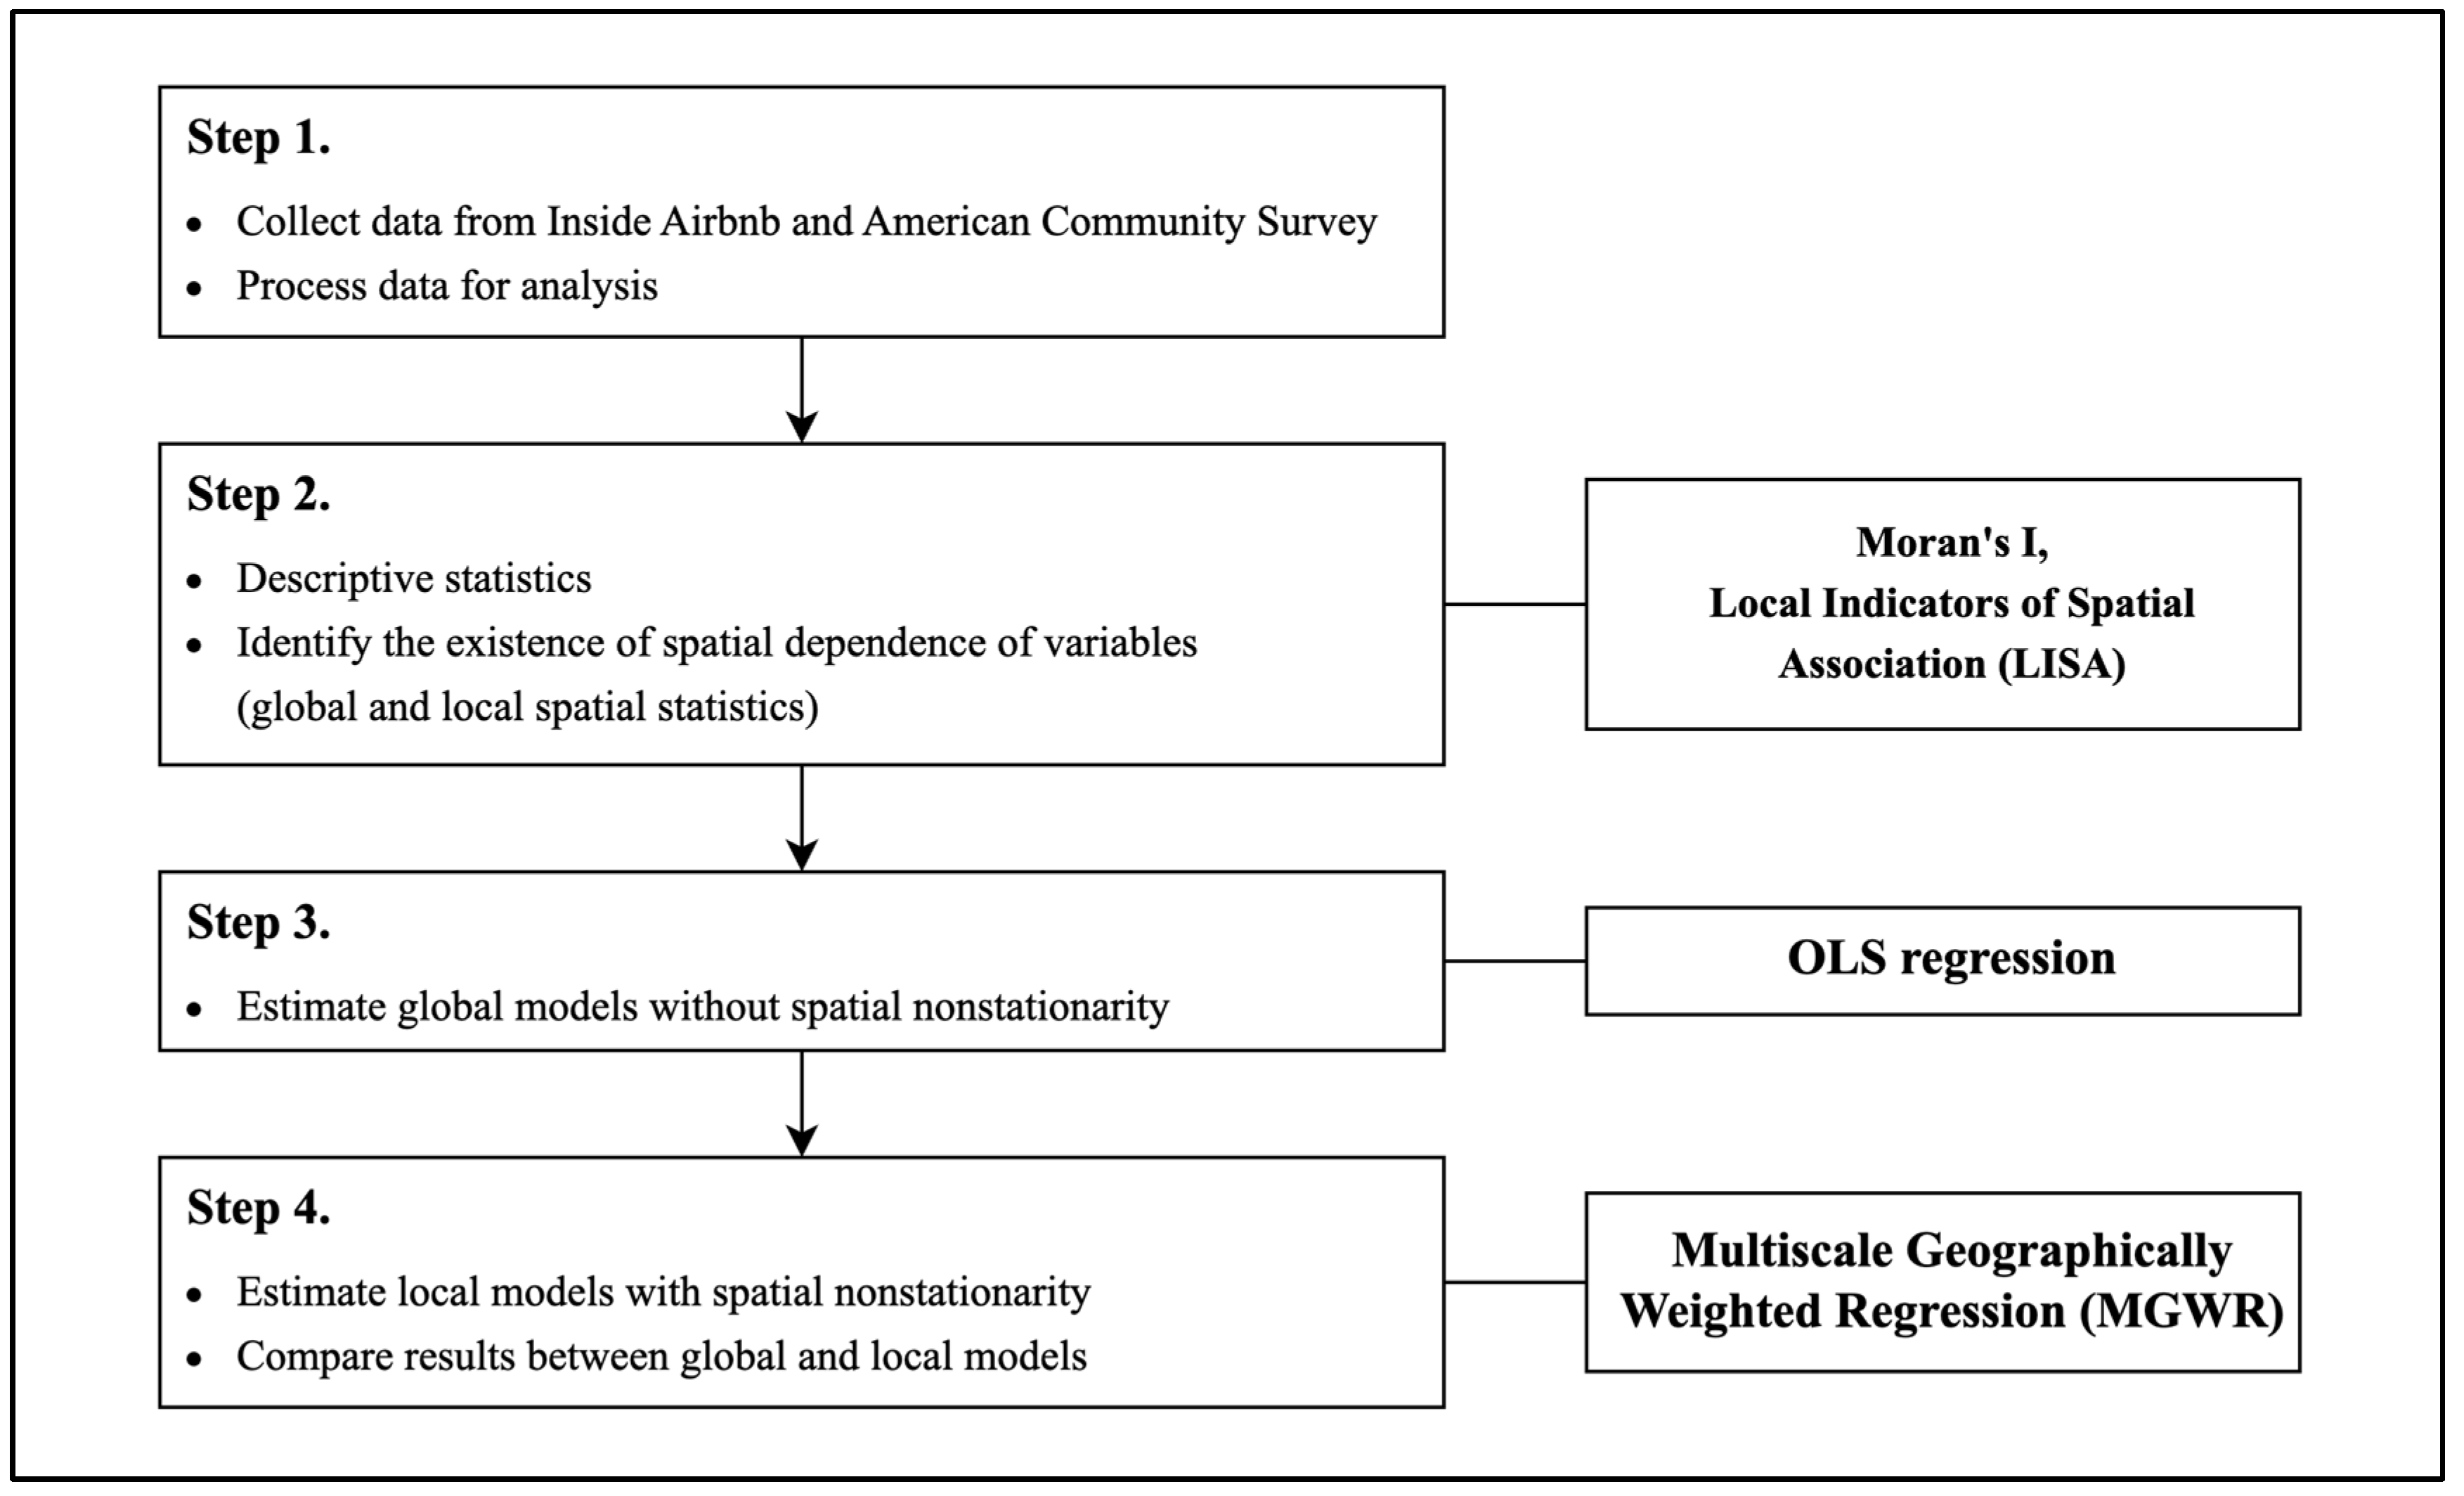
3. Methodology
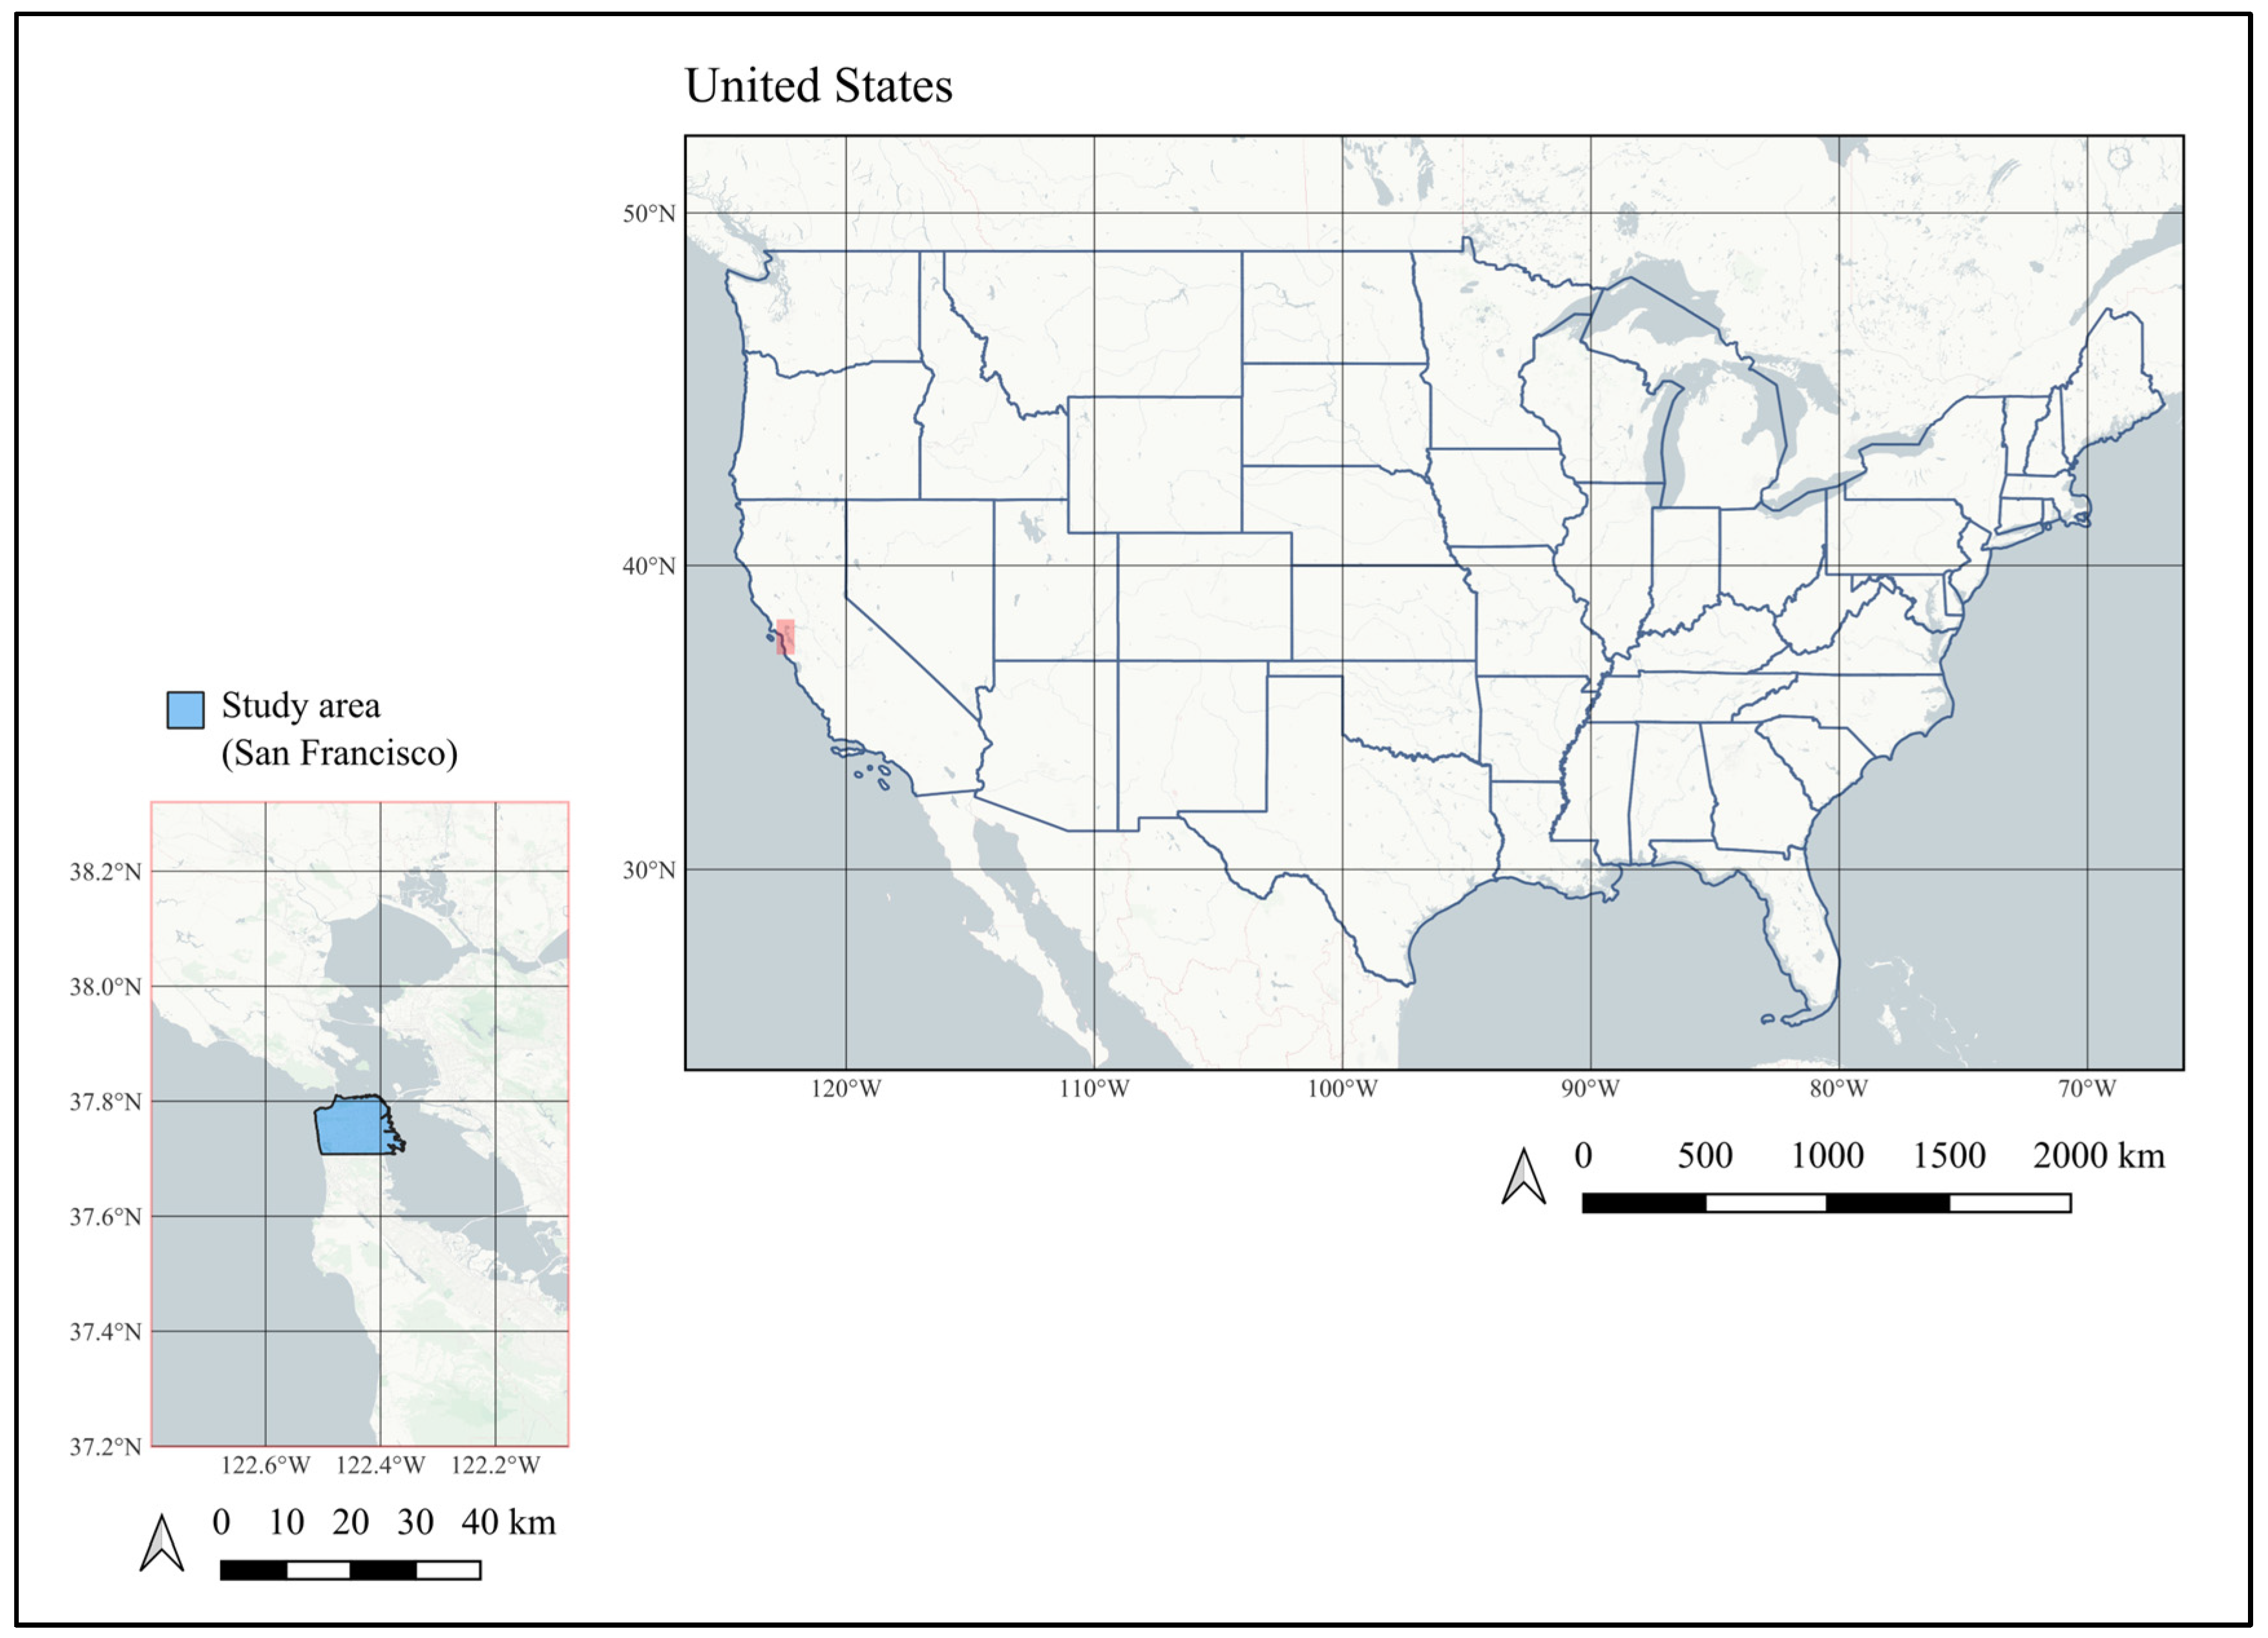
3.1. Data Collection
3.2. Geographically Weighted Regression (GWR)
4. Results
4.1. Characteristics of Variables
4.2. Regression Results
5. Discussions
6. Limitations and Future Studies
7. Conclusions
Author Contributions
Funding
Data Availability Statement
Conflicts of Interest
References
- Guttentag, D. Airbnb: Disruptive Innovation and the Rise of an Informal Tourism Accommodation Sector. Curr. Issues Tour. 2015, 18, 1192–1217. [Google Scholar] [CrossRef]
- Wang, Y.; Asaad, Y.; Filieri, R. What Makes Hosts Trust Airbnb? Antecedents of Hosts’ Trust toward Airbnb and Its Impact on Continuance Intention. J. Travel. Res. 2020, 59, 686–703. [Google Scholar] [CrossRef]
- Yang, S.-B.; Lee, K.; Lee, H.; Koo, C. In Airbnb We Trust: Understanding Consumers’ Trust-Attachment Building Mechanisms in the Sharing Economy. Int. J. Hosp. Manag. 2019, 83, 198–209. [Google Scholar] [CrossRef]
- Dogru, T.; Mody, M.; Suess, C. Adding Evidence to the Debate: Quantifying Airbnb’s Disruptive Impact on Ten Key Hotel Markets. Tour. Manag. 2019, 72, 27–38. [Google Scholar] [CrossRef]
- Gurran, N.; Zhang, Y.; Shrestha, P. ‘Pop-up’ Tourism or ‘Invasion’? Airbnb in Coastal Australia. Ann. Tour. Res. 2020, 81, 102845. [Google Scholar] [CrossRef]
- Guttentag, D.; Smith, S.; Potwarka, L.; Havitz, M. Why Tourists Choose Airbnb: A Motivation-Based Segmentation Study. J. Travel. Res. 2018, 57, 342–359. [Google Scholar] [CrossRef]
- Mody, M.; Suess, C.; Lehto, X. Going Back to Its Roots: Can Hospitableness Provide Hotels Competitive Advantage over the Sharing Economy? Int. J. Hosp. Manag. 2019, 76, 286–298. [Google Scholar] [CrossRef]
- Paris, C. Re-positioning Second Homes within Housing Studies: Household Investment, Gentrification, Multiple Residence, Mobility and Hyper-consumption. Hous. Theory Soc. 2009, 26, 292–310. [Google Scholar] [CrossRef]
- Ferreri, M.; Sanyal, R. Platform Economies and Urban Planning: Airbnb and Regulated Deregulation in London. Urban Stud. 2018, 55, 3353–3368. [Google Scholar] [CrossRef]
- Fang, B.; Ye, Q.; Law, R. Effect of Sharing Economy on Tourism Industry Employment. Ann. Tour. Res. 2016, 57, 264–267. [Google Scholar] [CrossRef]
- Barron, K.; Kung, E.; Proserpio, D. When Airbnb Listings in a City Increase, so Do Rent Prices. Harv. Bus. Rev. 2019, 17, 1–62. [Google Scholar]
- Wachsmuth, D.; Weisler, A. Airbnb and the Rent Gap: Gentrification through the Sharing Economy. Environ. Plan A 2018, 50, 1147–1170. [Google Scholar] [CrossRef]
- Benítez-Aurioles, B.; Tussyadiah, I. What Airbnb Does to the Housing Market. Ann. Tour. Res. 2021, 90, 103108. [Google Scholar] [CrossRef]
- Lee, S.; Kim, H. Four Shades of Airbnb and Its Impact on Locals: A Spatiotemporal Analysis of Airbnb, Rent, Housing Prices, and Gentrification. Tour. Manag. Perspect. 2023, 49, 101192. [Google Scholar] [CrossRef]
- Yrigoy, I. Rent Gap Reloaded: Airbnb and the Shift from Residential to Touristic Rental Housing in the Palma Old Quarter in Mallorca, Spain. Urban Stud. 2019, 56, 2709–2726. [Google Scholar] [CrossRef]
- Yeager, E.P.; Boley, B.B.; Woosnam, K.M.; Green, G.T. Modeling Residents’ Attitudes toward Short-Term Vacation Rentals. J. Travel. Res. 2020, 59, 955–974. [Google Scholar] [CrossRef]
- Smigiel, C. Why Did It not Work? Reflections on Regulating Airbnb and the Complexity and Agency of Platform Capitalism. Geogr. Helv. 2020, 75, 253–257. [Google Scholar] [CrossRef]
- Tang, L.R.; Kim, J.; Wang, X. Estimating Spatial Effects on Peer-to-Peer Accommodation Prices: Towards an Innovative Hedonic Model Approach. Int. J. Hosp. Manag. 2019, 81, 43–53. [Google Scholar] [CrossRef]
- Zach, F.J.; Nicolau, J.L.; Sharma, A. Disruptive Innovation, Innovation Adoption and Incumbent Market Value: The Case of Airbnb. Ann. Tour. Res. 2020, 80, 102818. [Google Scholar] [CrossRef]
- Dolnicar, S. A Review of Research into Paid Online Peer-to-Peer Accommodation: Launching the Annals of Tourism Research Curated Collection on Peer-to-Peer Accommodation. Ann. Tour. Res. 2019, 75, 248–264. [Google Scholar] [CrossRef]
- Deboosere, R.; Kerrigan, D.J.; Wachsmuth, D.; El-Geneidy, A. Location, Location and Professionalization: A Multilevel Hedonic Analysis of Airbnb Listing Prices and Revenue. Reg. Stud. Reg. Sci. 2019, 6, 143–156. [Google Scholar] [CrossRef]
- Dogru, T.; Mody, M.; Suess, C.; Line, N.; Bonn, M. Airbnb 2.0: Is It a Sharing Economy Platform or a Lodging Corporation? Tour. Manag. 2020, 78, 104049. [Google Scholar] [CrossRef]
- Demir, E.; Emekli, G. Is Airbnb No Longer a Sharing Economy Platform? Evidence from Europe’s Top 10 Airbnb Destinations. Anatolia 2021, 32, 470–488. [Google Scholar] [CrossRef]
- Gil, J.; Sequera, J. The Professionalization of Airbnb in Madrid: Far from a Collaborative Economy. Curr. Issues Tour. 2022, 25, 3343–3362. [Google Scholar] [CrossRef]
- Guttentag, D. Progress on Airbnb: A Literature Review. J. Hosp. Tour. Technol. 2019, 10, 814–844. [Google Scholar] [CrossRef]
- Blal, I.; Singal, M.; Templin, J. Airbnb’s Effect on Hotel Sales Growth. Int. J. Hosp. Manag. 2018, 73, 85–92. [Google Scholar] [CrossRef]
- Choi, K.H.; Jung, J.H.; Ryu, S.Y.; Kim, S.D.; Yoon, S.M. The Relationship between Airbnb and the Hotel Revenue: In the Case of Korea. INDJST 2015, 8, 1–8. [Google Scholar] [CrossRef]
- Ginindza, S.; Tichaawa, T.M. The Impact of Sharing Accommodation on the Hotel Occupancy Rate in the Kingdom of Swaziland. Curr. Issues Tour. 2019, 22, 1975–1991. [Google Scholar] [CrossRef]
- Guttentag, D.; Smith, S.L.J. Assessing Airbnb as a Disruptive Innovation Relative to Hotels: Substitution and Comparative Performance Expectations. Int. J. Hosp. Manag. 2017, 64, 1–10. [Google Scholar] [CrossRef]
- Benítez-Aurioles, B. Is Airbnb Bad for Hotels? Curr. Issues Tour. 2019, 25, 3076–3079. [Google Scholar] [CrossRef]
- Hajibaba, H.; Dolnicar, S. Substitutable by Peer-to-Peer Accommodation Networks? Ann. Tour. Res. 2017, 66, 185–188. [Google Scholar] [CrossRef]
- Xie, K.L.; Kwok, L. The Effects of Airbnb’s Price Positioning on Hotel Performance. Int. J. Hosp. Manag. 2017, 67, 174–184. [Google Scholar] [CrossRef]
- Yeon, J.; Song, H.J.; Lee, S. Impact of Short-Term Rental Regulation on Hotel Industry: A Difference-in-Differences Approach. Ann. Tour. Res. 2020, 83, 102939. [Google Scholar] [CrossRef]
- Horn, K.; Merante, M. Is Home Sharing Driving up Rents? Evidence from Airbnb in Boston. J. Hous. Econ. 2017, 38, 14–24. [Google Scholar] [CrossRef]
- Ram, Y.; Tchetchik, A. Complementary or Competitive? Interrelationships between Hotels, Airbnb and Housing in Tel Aviv, Israel. Curr. Issues Tour. 2022, 25, 3579–3590. [Google Scholar] [CrossRef]
- Ayouba, K.; Breuillé, M.-L.; Grivault, C.; Le Gallo, J. Does Airbnb Disrupt the Private Rental Market? An Empirical Analysis for French Cities. Int. Reg. Sci. Rev. 2020, 43, 76–104. [Google Scholar] [CrossRef]
- Shabrina, Z.; Arcaute, E.; Batty, M. Airbnb and Its Potential Impact on the London Housing Market. Urban Stud. 2022, 59, 197–221. [Google Scholar] [CrossRef]
- Garcia-López, M.-À.; Jofre-Monseny, J.; Martínez-Mazza, R.; Segú, M. Do Short-Term Rental Platforms Affect Housing Markets? Evidence from Airbnb in Barcelona. J. Urban Econ. 2020, 119, 103278. [Google Scholar] [CrossRef]
- Airbnb about Us. Available online: https://news.airbnb.com/about-us/ (accessed on 16 May 2022).
- Berube, A. All Cities Are Not Created Unequal; The Brookings Institution: Washington, DC, USA, 2014. [Google Scholar]
- Stehlin, J. The Post-Industrial “Shop Floor”: Emerging Forms of Gentrification in San Francisco’s Innovation Economy. Antipode 2016, 48, 474–493. [Google Scholar] [CrossRef]
- Brandt, N. San Francisco Hotels Are World’s Priciest as Rates Surge 88%. Bloomberg. Available online: https://www.bloomberg.com/news/articles/2015-06-30/san-francisco-hotels-are-world-s-priciest-as-rates-surge (accessed on 16 May 2022).
- Zervas, G.; Proserpio, D.; Byers, J.W. The Rise of the Sharing Economy: Estimating the Impact of Airbnb on the Hotel Industry. J. Mark. Res. 2017, 54, 687–705. [Google Scholar] [CrossRef]
- Pérez-Rodríguez, J.V.; Hernández, J.M. The Effect of Type of Lodging and Professionalism on the Efficiency of P2P Accommodation. Tour. Econ. 2023, 29, 1624–1642. [Google Scholar] [CrossRef]
- Brunsdon, C.; Fotheringham, A.S.; Charlton, M.E. Geographically Weighted Regression: A Method for Exploring Spatial Nonstationarity. Geogr. Anal. 1996, 28, 281–298. [Google Scholar] [CrossRef]
- Tobler, W.R. A Computer Movie Simulating Urban Growth in the Detroit Region. Econ. Geogr. 1970, 46, 234–240. [Google Scholar] [CrossRef]
- Fotheringham, A.S.; Brunsdon, C.; Charlton, M. Quantitative Geography: Perspectives on Spatial Data Analysis; SAGE: Thousand Oaks, CA, USA, 2000; ISBN 978-1-84787-641-6. [Google Scholar]
- Brunsdon, C.; Fotheringham, S.; Charlton, M. Geographically Weighted Regression. J. R. Stat. Soc. Ser. D (Stat.) 1998, 47, 431–443. [Google Scholar] [CrossRef]
- Huang, Y.; Leung, Y. Analysing Regional Industrialisation in Jiangsu Province Using Geographically Weighted Regression. J. Geogr. Syst 2002, 4, 233–249. [Google Scholar] [CrossRef]
- Bivand, R.; Brunstad, R. Further Explorations of Interactions between Agricultural Policy and Regional Growth in Western Europe-Approaches to Nonstationarity in Spatial Econometrics; European Regional Science Association (ERSA): Wallonia, Belgium, 2005. [Google Scholar]
- Fotheringham, A.S.; Brunsdon, C.; Charlton, M. Geographically Weighted Regression: The Analysis of Spatially Varying Relationships; John Wiley & Sons: Hoboken, NJ, USA, 2002; ISBN 978-0-470-85525-6. [Google Scholar]
- Oshan, T.M.; Li, Z.; Kang, W.; Wolf, L.J.; Fotheringham, A.S. Mgwr: A Python Implementation of Multiscale Geographically Weighted Regression for Investigating Process Spatial Heterogeneity and Scale. ISPRS Int. J. Geo-Inf. 2019, 8, 269. [Google Scholar] [CrossRef]
- Gu, K.; Zhou, Y.; Sun, H.; Dong, F.; Zhao, L. Spatial Distribution and Determinants of PM2.5 in China’s Cities: Fresh Evidence from IDW and GWR. Environ. Monit Assess 2020, 193, 15. [Google Scholar] [CrossRef]
- Fotheringham, A.S.; Yang, W.; Kang, W. Multiscale Geographically Weighted Regression (MGWR). Ann. Am. Assoc. Geogr. 2017, 107, 1247–1265. [Google Scholar] [CrossRef]
- QGIS Geographic Information System. Available online: https://qgis.org (accessed on 14 February 2024).
- Hair, J.F.; Black, W.C.; Babin, B.J.; Anderson, R.E. Multivariate Data Analysis, 7th ed.; Pearson: Upper Saddle River, NJ, USA, 2009; ISBN 978-0-13-813263-7. [Google Scholar]
- Curto, R.A.; Rubino, I.; Verderosa, A. Investigating Airbnb Evolution in an Urban Tourism Context: The Application of Mathematical Modelling and Spatial Analysis. Curr. Issues Tour. 2022, 25, 1666–1681. [Google Scholar] [CrossRef]
- Fang, L.; Li, H.; Li, M. Does Hotel Location Tell a True Story? Evidence from Geographically Weighted Regression Analysis of Hotels in Hong Kong. Tour. Manag. 2019, 72, 78–91. [Google Scholar] [CrossRef]
- Gutiérrez, J.; García-Palomares, J.C.; Romanillos, G.; Salas-Olmedo, M.H. The Eruption of Airbnb in Tourist Cities: Comparing Spatial Patterns of Hotels and Peer-to-Peer Accommodation in Barcelona. Tour. Manag. 2017, 62, 278–291. [Google Scholar] [CrossRef]
- Jin, C.; Xu, J.; Huang, Z. Spatiotemporal Analysis of Regional Tourism Development: A Semiparametric Geographically Weighted Regression Model Approach. Habitat Int. 2019, 87, 1–10. [Google Scholar] [CrossRef]
- Yang, Y.; Zhang, H. Spatial-Temporal Forecasting of Tourism Demand. Ann. Tour. Res. 2019, 75, 106–119. [Google Scholar] [CrossRef]
- Moran, P.A.P. The Interpretation of Statistical Maps. J. R. Stat. Soc. Ser. B (Methodol.) 1948, 10, 243–251. [Google Scholar] [CrossRef]
- Anselin, L. Local Indicators of Spatial Association—LISA. Geogr. Anal. 1995, 27, 93–115. [Google Scholar] [CrossRef]
- Yu, H.; Fotheringham, A.S.; Li, Z.; Oshan, T.; Kang, W.; Wolf, L.J. Inference in Multiscale Geographically Weighted Regression. Geogr. Anal. 2020, 52, 87–106. [Google Scholar] [CrossRef]
- Crommelin, L.; Troy, L.; Martin, C.; Pettit, C. Is Airbnb a Sharing Economy Superstar? Evidence from Five Global Cities. Urban Policy Res. 2018, 36, 429–444. [Google Scholar] [CrossRef]
- Mody, M.; Suess, C.; Dogru, T. Not in My Backyard? Is the Anti-Airbnb Discourse Truly Warranted? Ann. Tour. Res. 2019, 74, 198–203. [Google Scholar] [CrossRef]
- Miller, S.R. First Principles for Regulating the Sharing Economy. Harv. J. Legis. 2016, 53, 147. [Google Scholar] [CrossRef]
- Wegmann, J.; Jiao, J. Taming Airbnb: Toward Guiding Principles for Local Regulation of Urban Vacation Rentals Based on Empirical Results from Five US Cities. Land Use Policy 2017, 69, 494–501. [Google Scholar] [CrossRef]
- LeSage, J.; Pace, R.K. Introduction to Spatial Econometrics, 1st ed.; Routledge: Boca Raton, FL, USA, 2009; ISBN 978-1-4200-6424-7. [Google Scholar]

| Variables | Notation | Description |
|---|---|---|
| Airbnb density (per 1000 housing units) | D | |
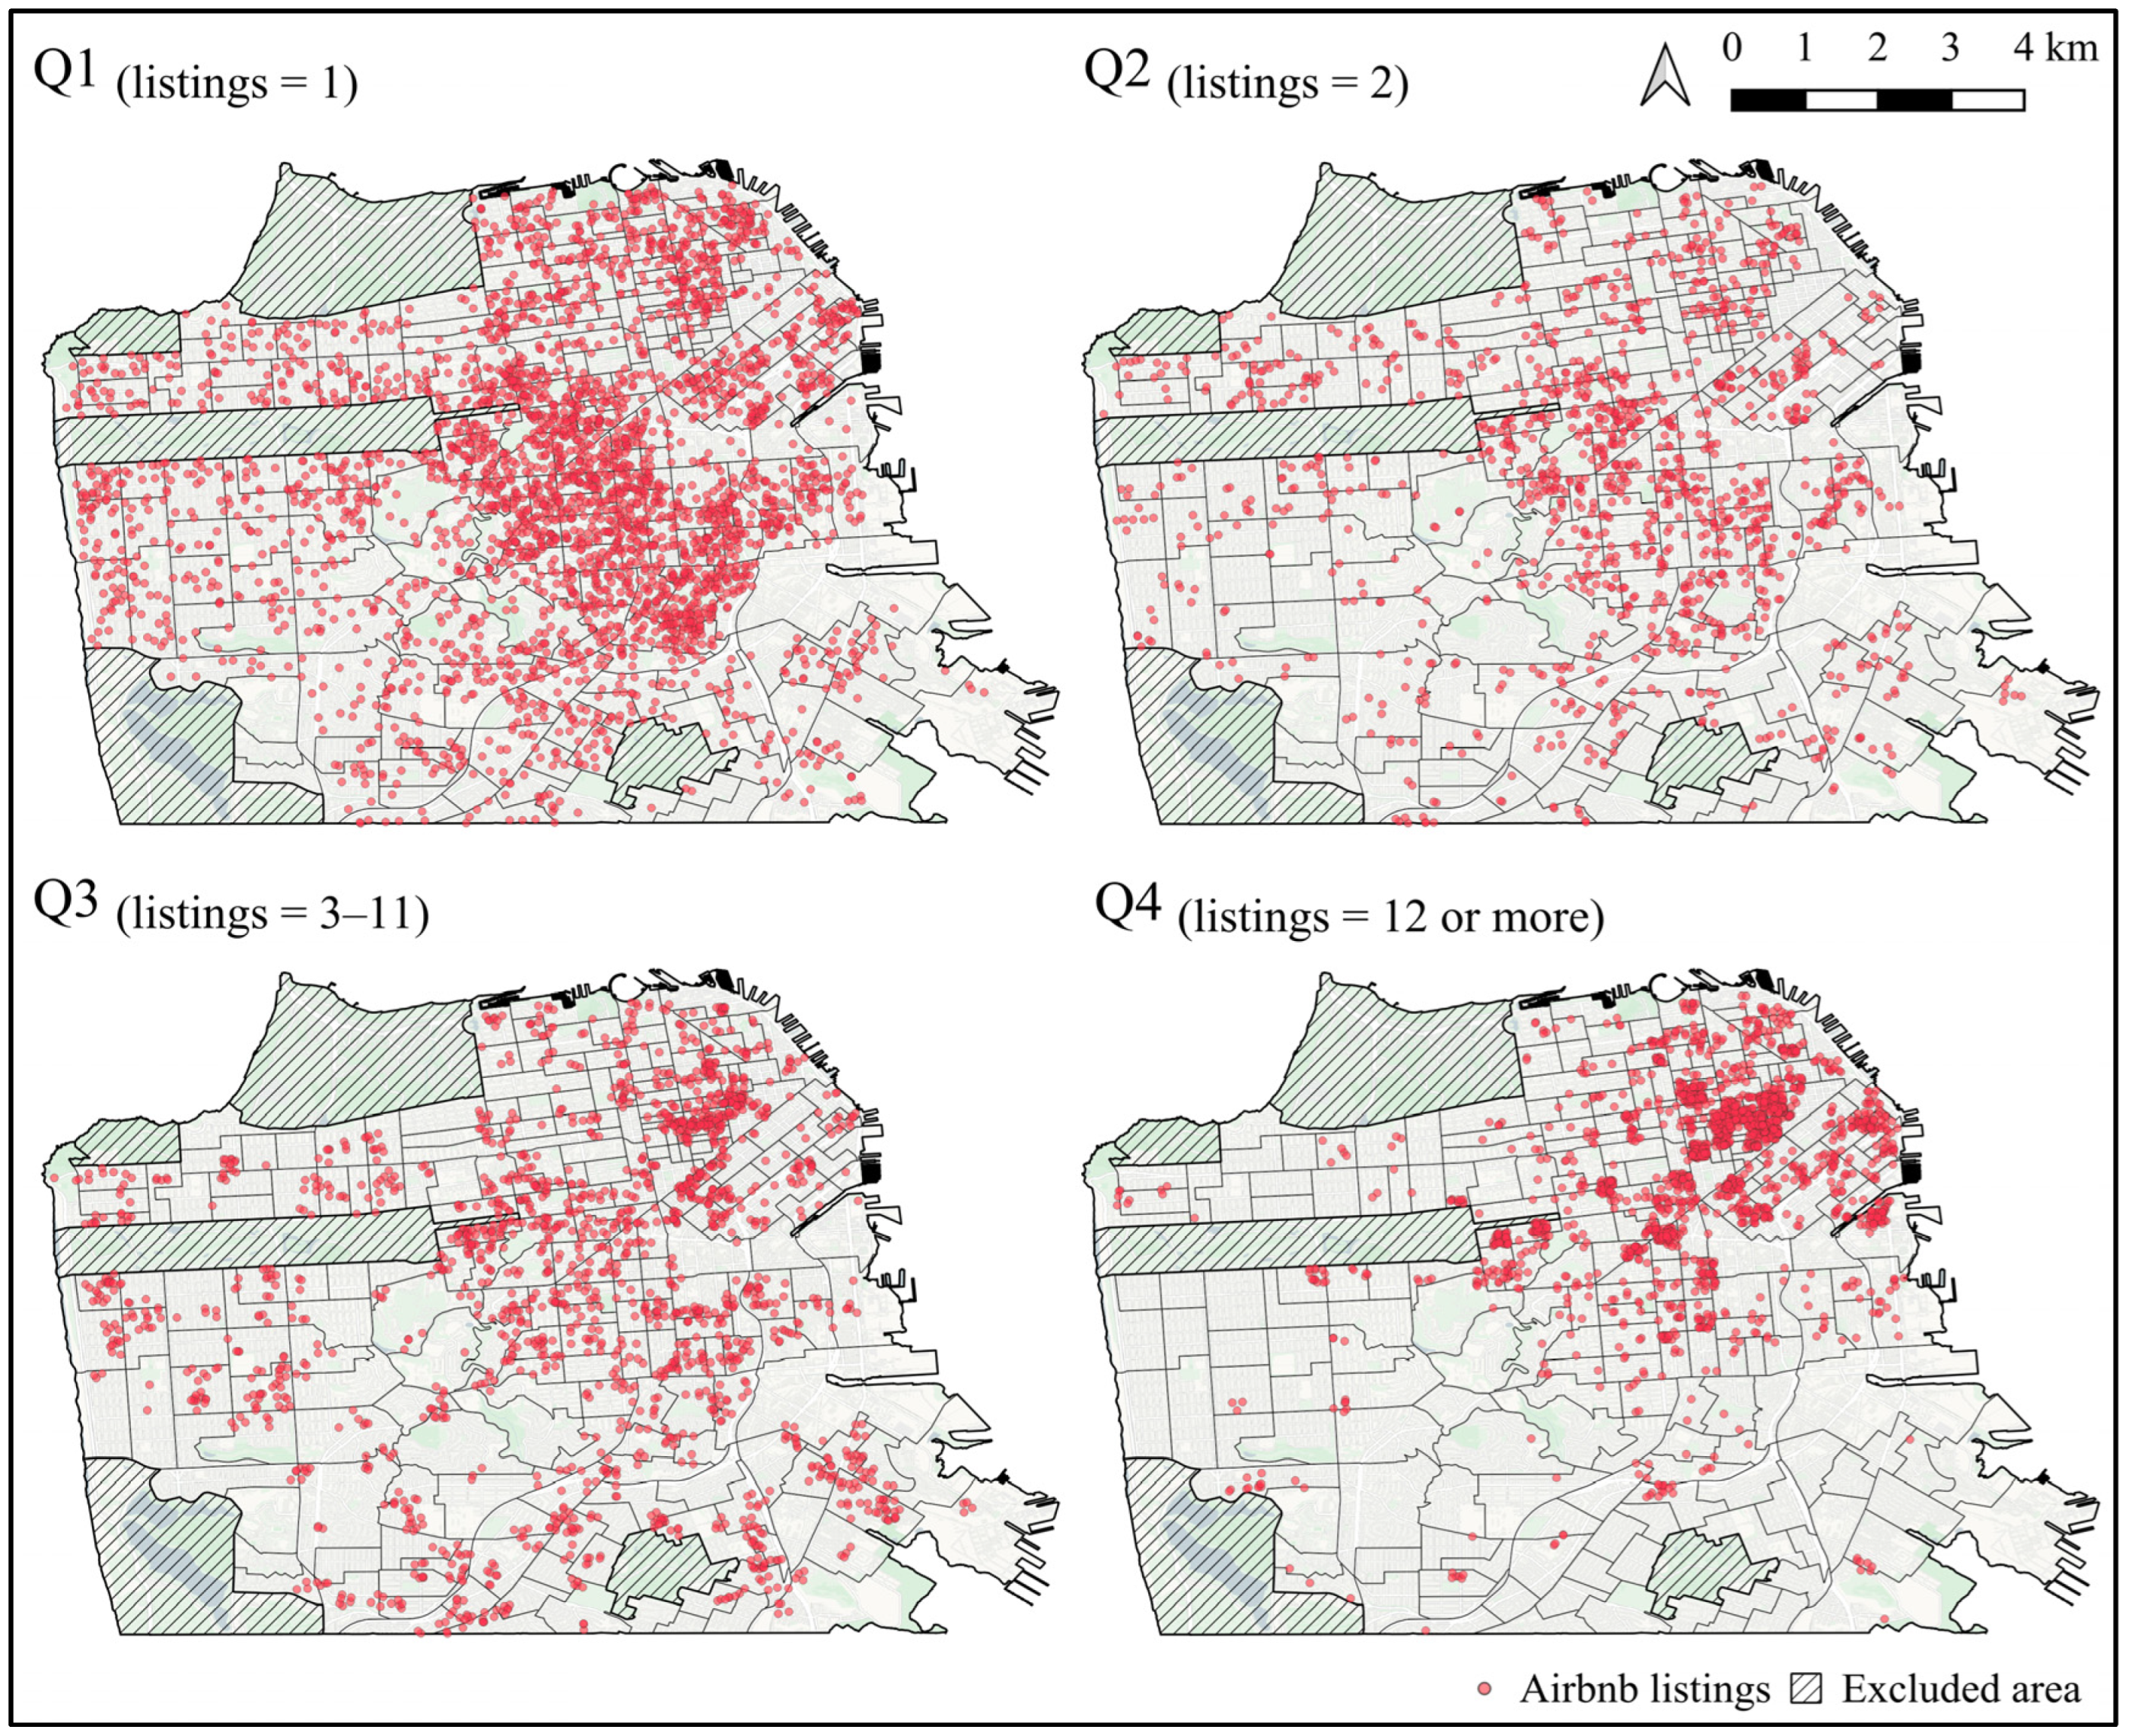
| Q1 (Listings = 1) | DQ1 | |
| Q2 (Listings = 2) | DQ2 | |
| Q3 (Listings = 3–11) | DQ3 | |
| Q4 (Listings = 12 or more) | DQ4 | |
| Owner–occupancy ratio | O | |
| Employment rate (20 to 64 years) | E | |
| Population density | Pp | |
| Ratio of housing units with gross rent greater than 30% of household income in the past 12 months (i = household income) | ||
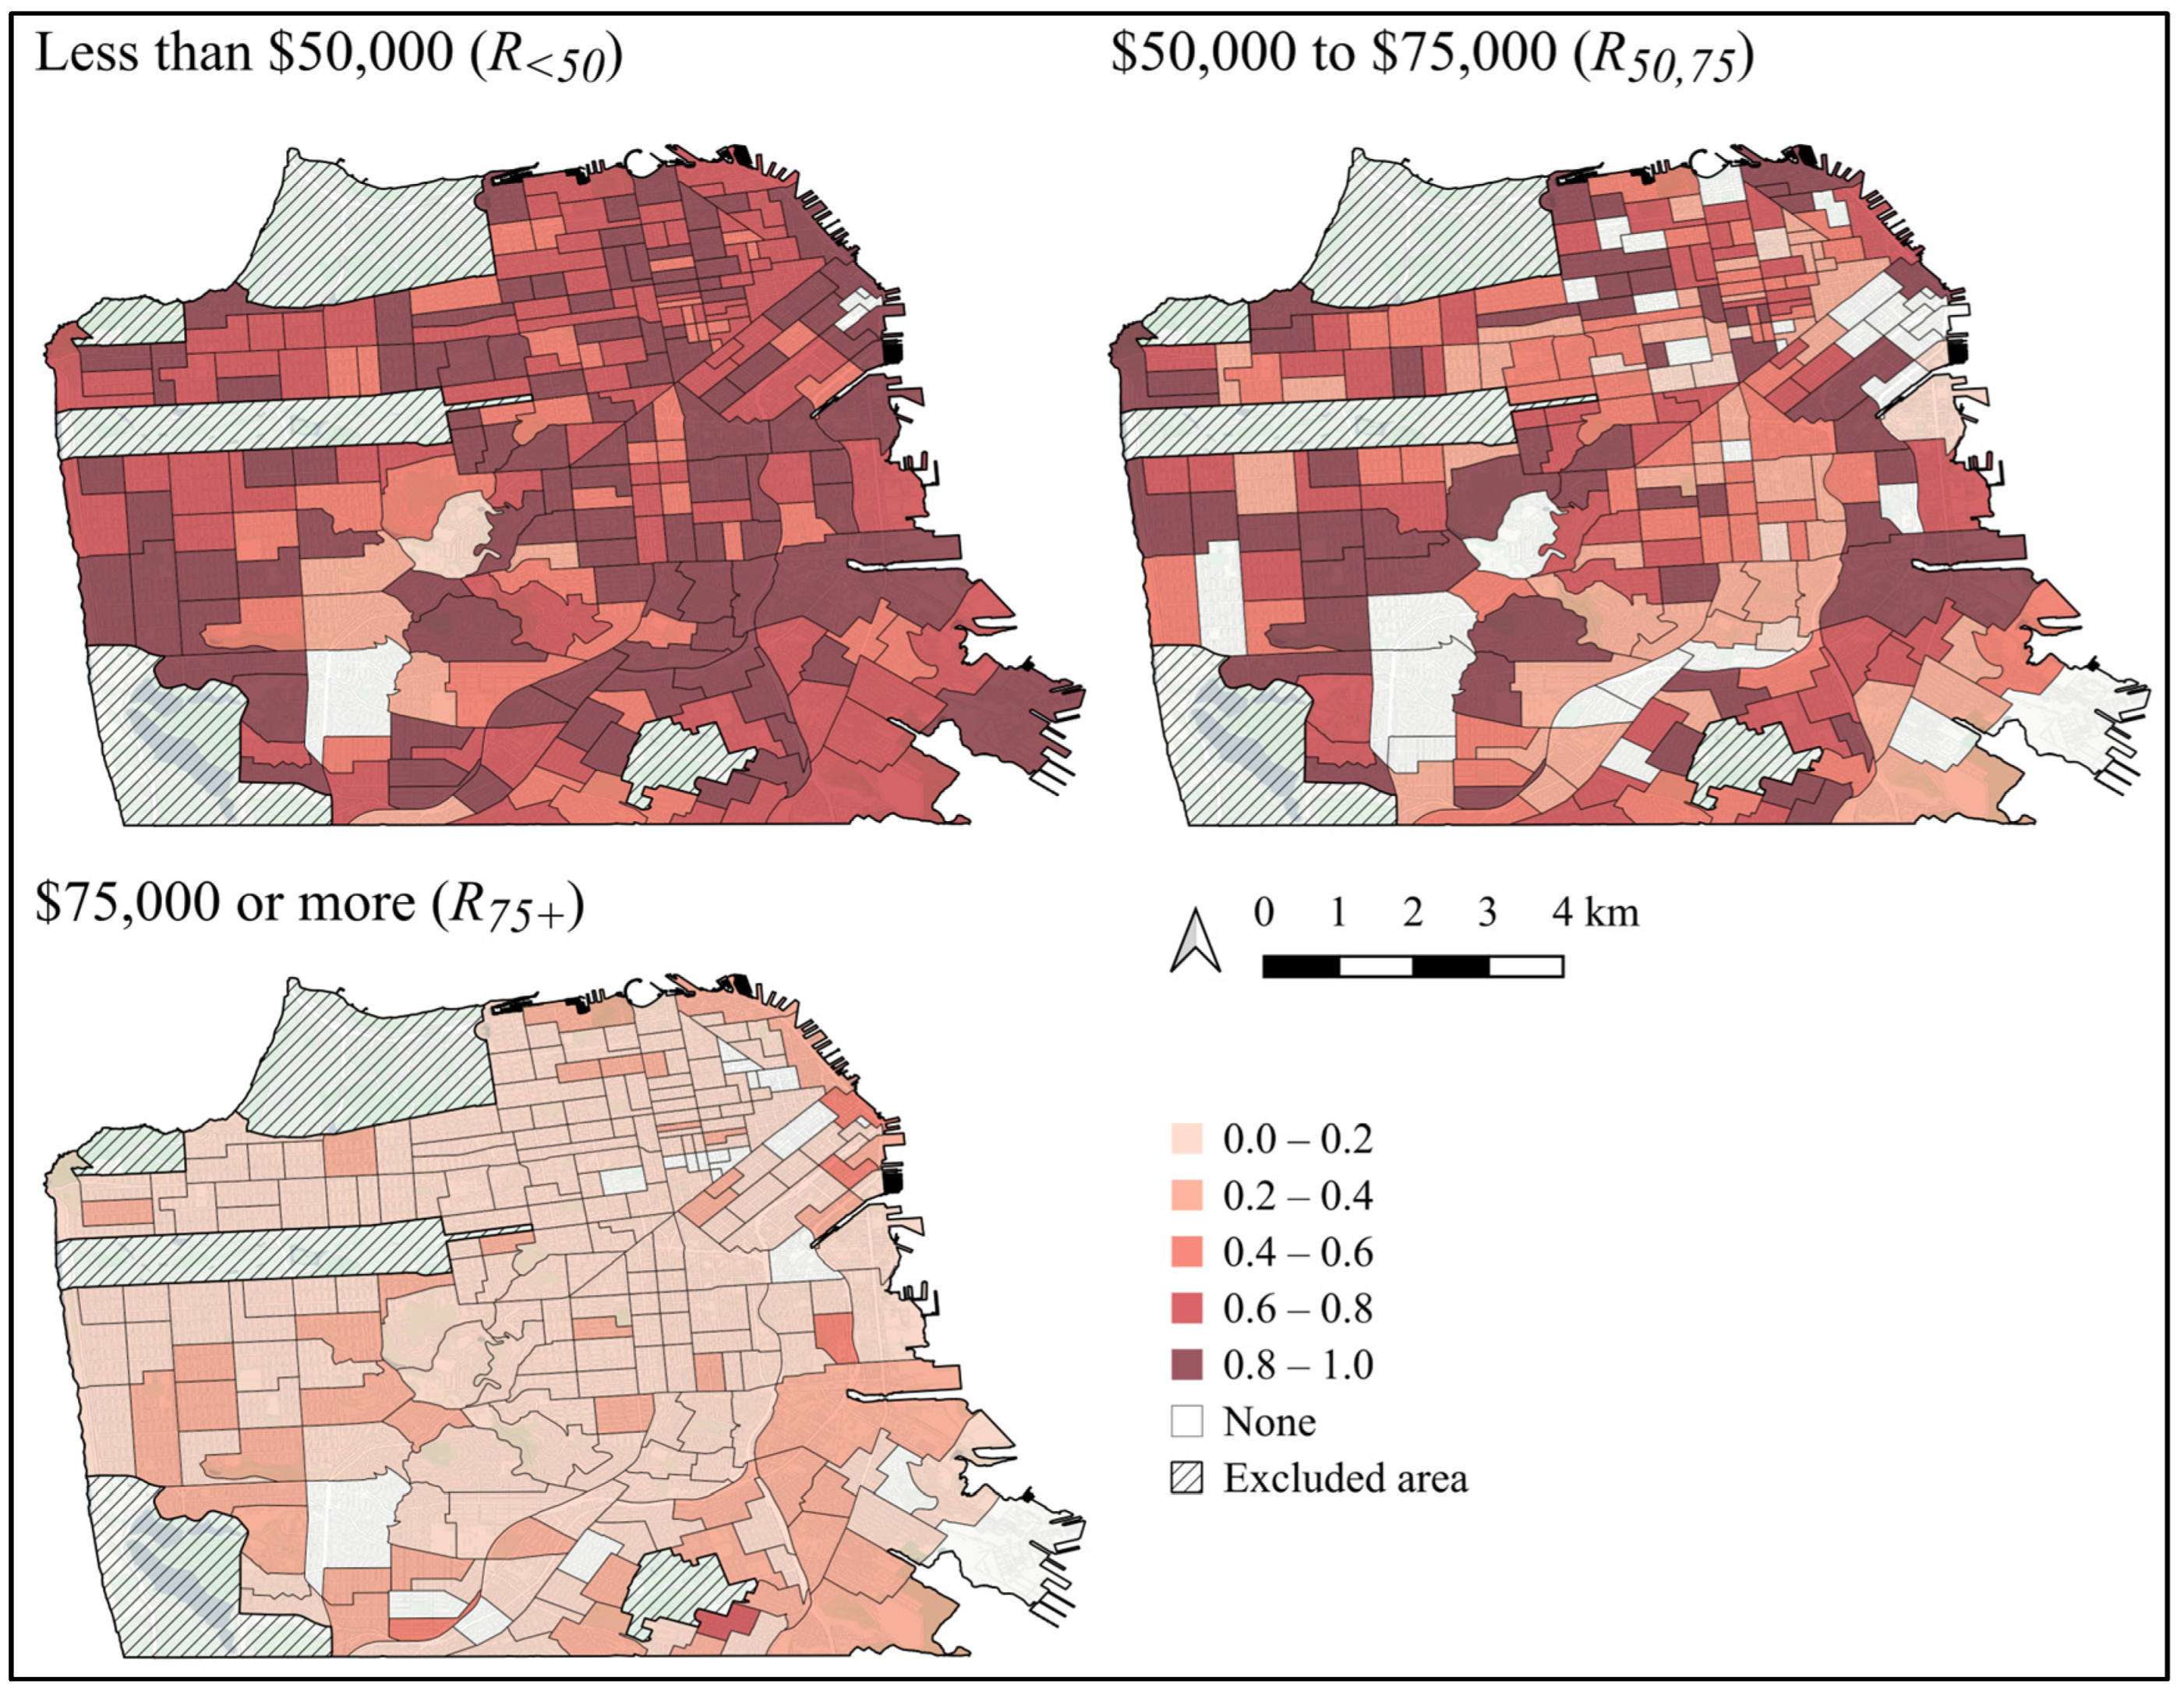
| i < USD 50,000 | R<50 | |
| USD 50,000 ≤ i < USD 75,000 | R50,75 | |
| USD 75,000 ≤ i | R75+ | |
| Mean | SD | Max. | S | K | VIF | Transform | Moran’s I | ||
|---|---|---|---|---|---|---|---|---|---|
| Independent Variables | |||||||||
| DQ1 | 9.14 | 7.12 | 39.68 | 1.41 | 2.70 | 1.96 | - | 0.546 | *** |
| DQ2 | 3.66 | 3.45 | 19.48 | 1.48 | 2.55 | 1.79 | - | 0.294 | *** |
| DQ3 | 5.52 | 5.44 | 43.30 | 2.50 | 11.04 | 1.31 | Square root | 0.188 | *** |
| DQ4 | 6.18 | 14.01 | 173.21 | 7.96 | 87.43 | 1.64 | Square root | 0.533 | *** |
| Control Variables | |||||||||
| O | 0.38 | 0.24 | 0.95 | 0.26 | −0.95 | 1.82 | - | 0.670 | *** |
| E | 0.80 | 0.11 | 1.00 | −3.55 | 22.72 | 1.07 | Square | 0.121 | *** |
| Pp | 2468.06 | 745.28 | 7065.18 | 1.56 | 5.44 | 1.60 | - | 0.631 | *** |
| Dependent Variables | |||||||||
| R<50 | 0.74 | 0.20 | 1.00 | −1.05 | 1.81 | - | - | 0.013 | |
| R50,75 | 0.52 | 0.31 | 1.00 | −0.17 | −0.95 | - | - | 0.078 | * |
| R75+ | 0.13 | 0.10 | 0.61 | 1.29 | 3.03 | - | - | 0.095 | ** |
| R<50 | R50,75 | R75+ | |
|---|---|---|---|
| DQ1 | 0.103 | −0.085 | −0.062 |
| DQ2 | 0.015 | 0.061 | −0.132 |
| DQ3 | 0.080 | 0.154 * | 0.081 |
| DQ4 | 0.031 | −0.177 * | 0.078 |
| O | −0.083 | −0.042 | 0.160 |
| E | −0.028 | −0.063 | −0.019 |
| Pp | 0.138 | −0.036 | 0.162 * |
| ß0 | <0.001 | <0.001 | <0.001 |
| F | 1.321 | 1.241 | 3.095 ** |
| R2 | 0.039 | 0.037 | 0.087 |
| LL | −328.3 | −328.5 | −322.2 |
| AIC | 674.5 | 675.1 | 662.5 |
| BIC | 705.7 | 706.2 | 693.6 |
| Ie | 0.011 | 0.074 * | 0.020 |
| BP | 29.28 *** | 18.42 * | 17.65 * |
| R<50 | R50,75 | R75+ | ||||
|---|---|---|---|---|---|---|
| OLS | MGWR | OLS | MGWR | OLS | MGWR | |
| LL | −328.3 | −311.6 | −328.5 | −291.2 | −322.2 | −314.4 |
| AIC | 674.5 | 671.9 | 675.1 | 642.7 | 662.5 | 661.0 |
| BIC | 705.7 | 756.1 | 706.2 | 747.1 | 693.6 | 716.8 |
| R2 | 0.039 | 0.166 | 0.037 | 0.299 | 0.087 | 0.146 |
| Ie | 0.011 | −0.039 | 0.074 * | −0.046 | 0.020 | 0.014 |
| Sig. β | Mean | Min. | Max. | SD | BW | Adj. T (95%) | |
|---|---|---|---|---|---|---|---|
| DQ1 | n.s. | — | — | — | — | 233 | 2.102 |
| DQ2 | 11 | 0.608 | 0.466 | 0.705 | 0.085 | 55 | 2.854 |
| DQ3 | 95 | 0.189 | 0.175 | 0.199 | 0.005 | 233 | 2.236 |
| DQ4 | n.s. | — | — | — | — | 233 | 2.138 |
| O | n.s. | — | — | — | — | 226 | 2.219 |
| E | n.s. | — | — | — | — | 190 | 2.386 |
| Pp | 13 | −0.605 | −0.745 | −0.347 | 0.123 | 74 | 2.718 |
| ß0 | n.s. | — | — | — | — | 182 | 2.274 |
| R2 | 0.299 | ||||||
| LL | −291.2 | ||||||
| AIC | 642.7 | ||||||
| BIC | 747.1 | ||||||
| Ie | −0.046 |
Disclaimer/Publisher’s Note: The statements, opinions and data contained in all publications are solely those of the individual author(s) and contributor(s) and not of MDPI and/or the editor(s). MDPI and/or the editor(s) disclaim responsibility for any injury to people or property resulting from any ideas, methods, instructions or products referred to in the content. |
© 2024 by the authors. Licensee MDPI, Basel, Switzerland. This article is an open access article distributed under the terms and conditions of the Creative Commons Attribution (CC BY) license (https://creativecommons.org/licenses/by/4.0/).
Share and Cite
Hur, D.; Lee, S.; Kim, H. The Impact of Airbnb on Long-Term Rental Markets in San Francisco: A Geospatial Analysis Using Multiscale Geographically Weighted Regression. ISPRS Int. J. Geo-Inf. 2024, 13, 298. https://doi.org/10.3390/ijgi13090298
Hur D, Lee S, Kim H. The Impact of Airbnb on Long-Term Rental Markets in San Francisco: A Geospatial Analysis Using Multiscale Geographically Weighted Regression. ISPRS International Journal of Geo-Information. 2024; 13(9):298. https://doi.org/10.3390/ijgi13090298
Chicago/Turabian StyleHur, Dongkeun, Seonjin Lee, and Hany Kim. 2024. "The Impact of Airbnb on Long-Term Rental Markets in San Francisco: A Geospatial Analysis Using Multiscale Geographically Weighted Regression" ISPRS International Journal of Geo-Information 13, no. 9: 298. https://doi.org/10.3390/ijgi13090298
APA StyleHur, D., Lee, S., & Kim, H. (2024). The Impact of Airbnb on Long-Term Rental Markets in San Francisco: A Geospatial Analysis Using Multiscale Geographically Weighted Regression. ISPRS International Journal of Geo-Information, 13(9), 298. https://doi.org/10.3390/ijgi13090298