Abstract
Determining the spatiotemporal deployment strategy for dockless shared bicycles in urban blocks has always been a focal point for city managers and planners. Extensive research has delved into the usage patterns in terms of time and space, deduced travel purposes, and scrutinized the relationship between trips and the built environment. The elements of the built environment are significantly correlated with the starting and ending points of dockless shared bicycle trips, leading to a scarcity of shared bicycles in areas that are more frequently used as starting points and an abundance of idle bicycles in areas that serve as endpoints. This paper posits that the idle state of shared bicycles is as important as their usage. Utilizing a case study of Xinjiekou Central District in Nanjing, China, we propose a framework for analyzing the temporal and spatial usage and idleness of shared bicycles. We also discuss the impact of various factors, such as proximity to transit stations, land use, and road accessibility, on the different usage and idle states of dockless shared bicycles. The findings reveal that the public transportation system has a similar influence on both the utilization and idleness of dockless shared bicycles, indicating that areas with a dense concentration of transportation services experience greater demand for shared bicycles as both origins and destinations. The influence of other factors on the usage and idleness of dockless shared bicycles varies significantly, resulting in either a shortage or surplus of these bicycles. Consequently, based on the findings regarding the use and idleness of dockless shared bicycles, we formulate a redistribution and zone-based management strategy for shared bicycles. This paper offers new insights into the spatiotemporal distribution and utilization of shared bicycles under the influence of different built environments, contributing to the further optimization of dockless shared bicycle resource allocation.
1. Introduction
Bicycle-sharing systems were first introduced in Amsterdam in 1965 [1] to make up for the inadequate coverage of urban public transport systems [2]. Over the past few decades, bicycle-sharing systems have been established with different operating modes, including government-led operation, public–private joint management, and private management [3]. These shared facilities can significantly improve resource utilization and promote sustainable urban development [4], Bicycle-sharing systems have helped increase the coverage of urban public transport systems and improved the efficiency of urban travelers by public transport to some extent [5].
The emergence of dockless shared bicycles has further stimulated the expansion and utilization of bicycle-sharing systems. This model, characterized by availability and the freedom to park anywhere, has made shared bicycles one of the most popular modes of transportation in the shared mobility sector [6]. Driven by a surge in market demand, a substantial amount of capital has been invested in bicycle-sharing systems. This has led to a rapid increase in the number of shared bicycles in cities, but it has also resulted in an imbalance in their usage. That is, some areas face a shortage of shared bicycles while others have a significant number of idle bicycles. Redistribution is required to rebalance the deployment distribution of shared bicycles.
A large number of studies have now found that the characteristics of the urban built environment, including sociodemographic features, land use patterns, travel behaviors, and meteorological conditions, significantly impact shared bicycle utilization [7]. For example, in the research conducted by Fu Chen [8], graph convolutional models and spatial regression analysis were applied to thoroughly explore shared bicycle usage patterns and the influencing factors, showcasing the positive impact of integrating subway usage with shared bicycles. Further, Li Shaoying [9] developed a framework based on the gravity model and Bayesian rules to infer the travel purposes of dockless shared bicycle users. It was discovered that the proportion and service capabilities of Point of Interest (POI) activities are crucial to enhancing accuracy in inferring the travel purposes of dockless shared bicycle trips. Additionally, Li Hongwei [10] utilized the complete travel data from the Mobike system to analyze the effects of weather conditions, time, and spatial factors on shared bicycle usage, particularly highlighting the significant decrease in shared bicycle usage under adverse weather conditions, such as rainfall and high temperatures [11]. Moreover, Meng Si’an [12] explored the influence of street design on the usage of dockless shared bicycles through hierarchical regression analysis, finding that street form characteristics, such as the floor area ratio and intersection density, significantly affect the frequency of shared bicycle trips, thereby offering beneficial insights for urban planning and the optimization of shared bicycle services.
There have been studies on strategies for redistributing dockless shared bicycles, considering obvious peak times in morning and evening rush hours on weekdays, during which time periods sharing bicycle usage is significantly higher than other time periods [13]. Conrow and Fischer (2018) [14] applied the coverage model to evaluate the site selection of bicycle stations and the bicycle demand at each bicycle station to address the problem of uneven bicycle station density and bicycle resources. Dilay Çelebi et al. (2018) [15] proposed a comprehensive approach for designing bicycle-sharing systems that accounts for the locations of bicycle stations and capacity allocation. Regarding the effect of other urban elements on bicycle-sharing systems, Faghih-Imani et al. (2014) [16] studied the effect of urban land use on bicycle flow. With regard to the spatial and temporal law of demand for bicycle stations (arrival and departure), Faghh-Imani and Eluru (2016) [17] simulated the changes in demand for shared bicycles based on time and location. Shigemi, K. and Tsumura, K. [18] proposed a distributed stochastic feedback-control law of the incentive, based on the idea of the quantized gossip algorithm to rebalance bicycles at all port stations in a network. Scholars have also investigated bicycle-sharing systems from the perspectives of user experience, travel choice, and challenges.
The method of Geographically Weighted Regression (GWR) considers the spatial heterogeneity of data to understand the relationship between shared bicycle usage and the urban built environment. For instance, by comparing the application of the Ordinary Least Squares (OLS) model with the GWR model in the study of shared bicycle usage, Wu [19] and colleagues demonstrated that the GWR model has a higher fit in analyzing the local relationships between shared bicycle usage and the built environment, thus providing more detailed guidance for urban planning and traffic management. Moreover, Gao [20] employed the GWR model, combined with overhead greenness indicators processed by deep learning techniques, to explore the spatial correlations between dockless shared bicycle usage and urban greening, along with other built environment factors, across different time periods. Ni Ying [21] utilized K-means clustering and spatial lag models to conduct a detailed spatial analysis of the distribution of shared bicycles and taxis around subway stations, thereby identifying the impact of subway stations on surrounding transportation patterns. Similarly, Ji Yanjie [22] used the GWR model to study the dynamic relationship between shared bicycle transfer volume and urban sociodemographic characteristics, travel habits, and built environment factors. The study also employed Moran’s I statistic to test the spatial autocorrelation between variables, revealing a negative correlation between riding distance and transfer demand, particularly pronounced in urban peripheries and underdeveloped areas.
The cycle of shared bicycle usage for patrons includes the process from unlocking at the origin to locking at the destination. Idleness in specific zones occurs when the demand for bicycles as endpoints surpasses that as starting points, indicating that certain urban locales are more frequently embarking points, while others are predominantly concluding points for such journeys. With this premise, our research endeavors to answer the following questions: (1) Are there distinct spatiotemporal patterns and variations in the usage and idleness of shared bicycles? (2) What elements of the built environment impact the spatiotemporal attributes of shared bicycle usage and idleness? (3) Where are shared bicycles more prone to accumulate in an idle state? (4) How can the influence of built environment factors on the usage and idleness of shared bicycles inform the development of rebalancing strategies? In pursuit of these answers, we established two Geographically Weighted Regression models to dissect the built environment factors affecting the spatial distribution of shared bicycle usage volume, rate of utilization, and idleness, conducting our analysis across spatial functionality, capacity, and the influence of transportation factors and proposing corresponding strategies.
The subsequent structure of this paper is as follows: Section 2 delineates the research scope and the methodologies employed for modeling; Section 3 exhibits the spatiotemporal distribution outcomes pertaining to the usage and idleness of shared bicycles; Section 4 scrutinizes the relationship between various built environment factors and the impact on shared bicycles; Section 5 engages in a discussion of the computational findings; Section 6 encapsulates the principal conclusions drawn from the study and discusses its limitations as well as potential avenues for future research.
2. Materials and Methods
2.1. Case Selection
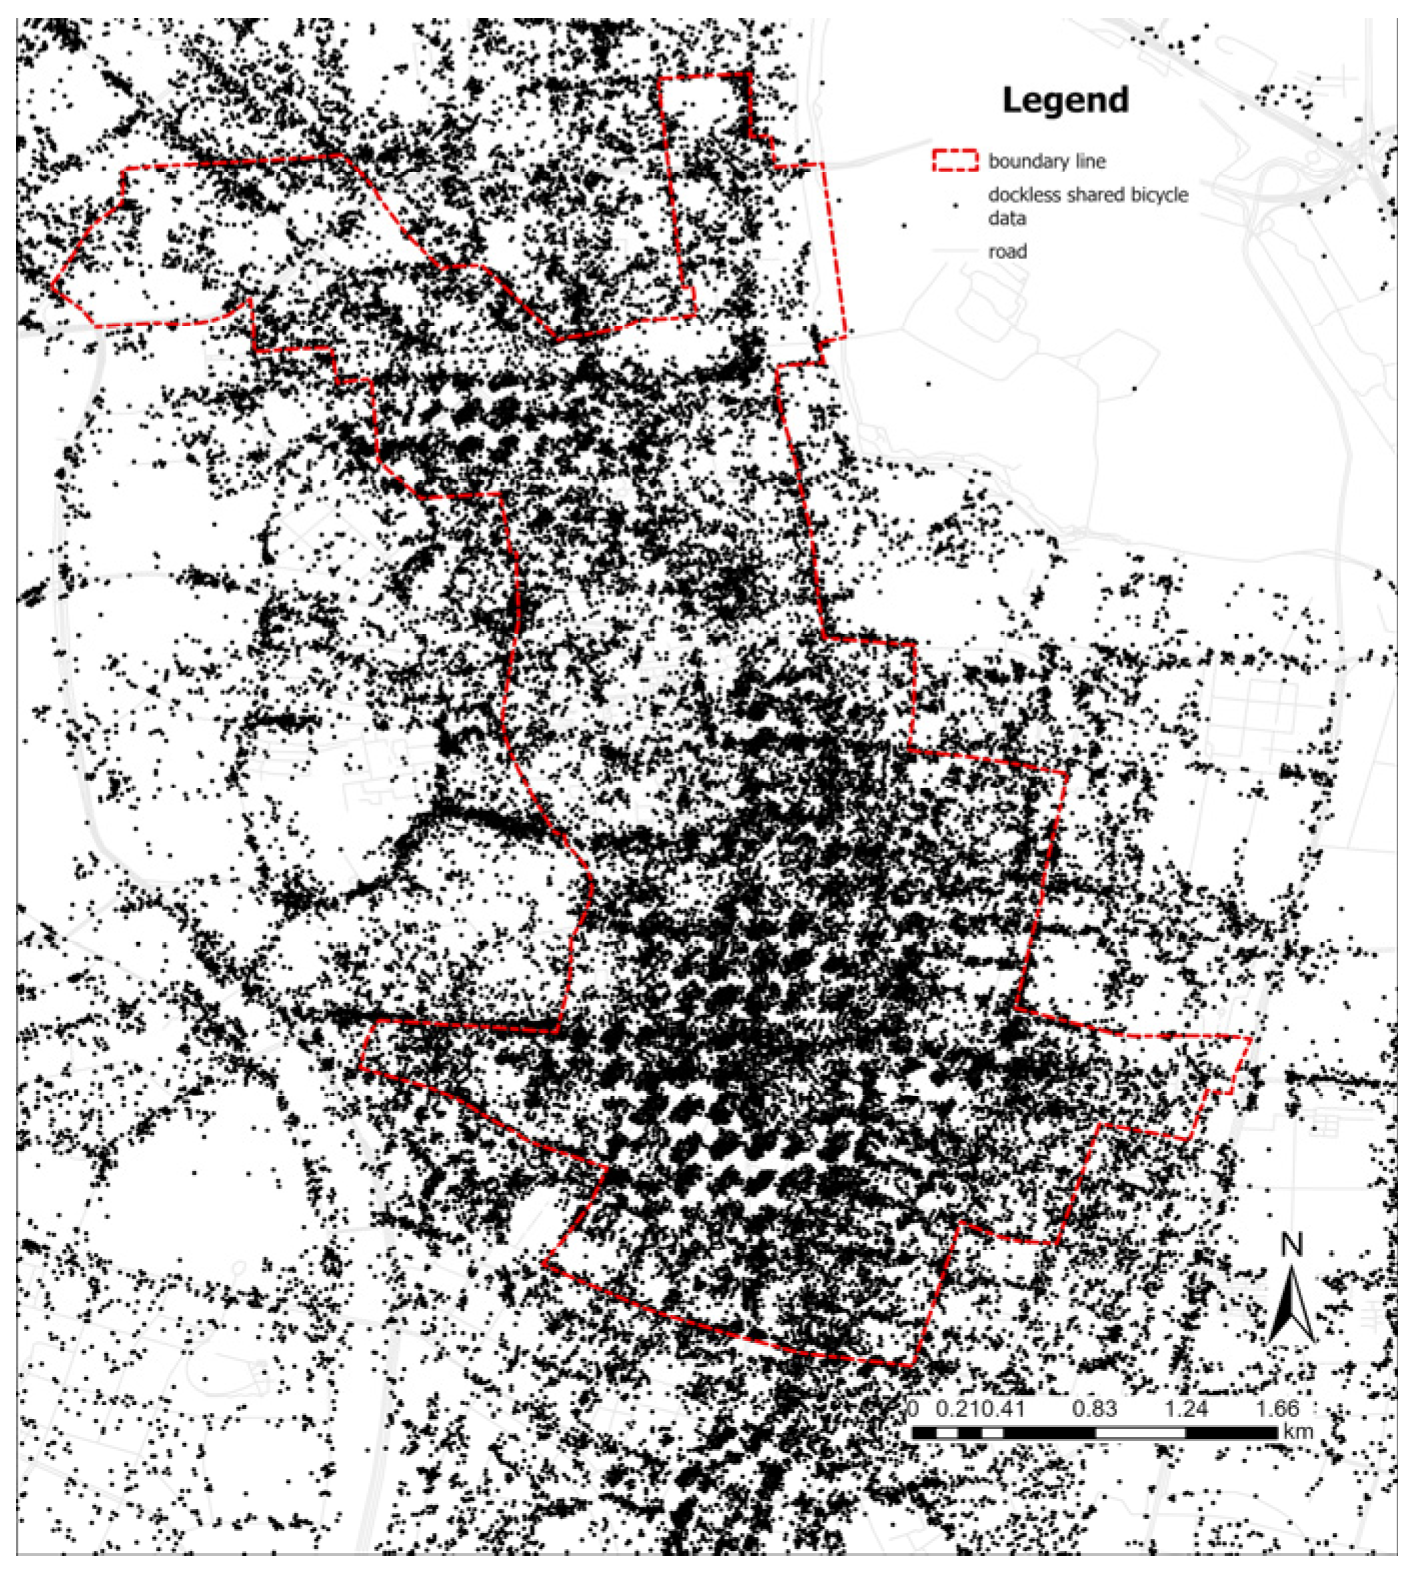
Xinjiekou Central District is the most important urban center in Nanjing. Xinjiekou Central District contains a variety of urban land types and supports various urban activities. In this study, the research area (Figure 1) was defined by using the method proposed by Hu Xinyu and Yang Junyan [23]. Riding data were then collected by using the Python program during working days from 6 a.m. to 10 p.m. with a time interval of five minutes.
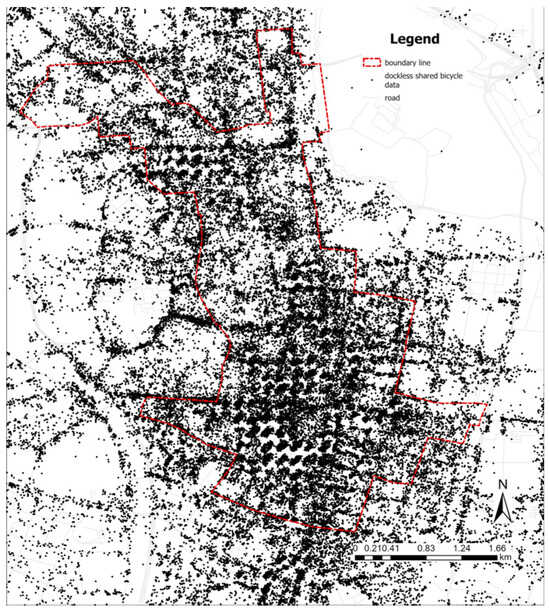
Figure 1.
Map of Xinjiekou Central District.
2.2. Data Acquisition and Processing
Integrating findings from the existing literature, it was discovered that the temporal and spatial use of shared bicycles is significantly influenced by three factors: spatial functionality, public transportation, and spatial capacity [24]. As a result, the acquisition and processing of the following data are required:
- First item: acquisition and processing of shared bicycle riding data. To collect bicycle data, a Python program was created to capture the geographic location information of dockless shared bicycles at different times through the Mobike app. Data were collected in the spring of 2023; finally, the latitude and longitude coordinates of the dockless shared bicycles were imported into ArcGIS Pro 3.3.0. The results are shown in Figure 1 below.The recorded riding data included the time and space coordinates of the shared bicycles. The GPS data, which are transmitted to a server through a mobile terminal in the bicycle when at rest, contain specific space coordinates and the service condition of the shared bicycle at that moment. Here, the spatial coordinates are expressed in latitude and longitude. The time, space, and usage state data can be used to analyze the riding status in the research area.
- Second item: acquisition and processing of spatial functionality data. POI (Point of Interest) data are instrumental in characterizing urban spatial functions due to their accessibility and extensive coverage, making them a prevalent tool in spatial functionality research. In the case of Xinjiekou District in Nanjing City, the POI data for the year 2023 were collected by utilizing the Amap open API (https://lbs.amap.com/, accessed on 21 May 2023), encompassing details such as names, types, addresses, and geographical coordinates. Custom scripts were developed, employing advanced web scraping techniques to query POIs of varying functionalities. The data cleansing process involved the application of algorithms to eliminate duplicate entries, ensuring the uniqueness and accuracy of the POI data set. The data were subsequently standardized to facilitate a cohesive analysis. As illustrated in Table 1, these POIs are categorized into eleven classes, including commercial office services, retail services, catering services, administrative services, cultural and artistic services, research and education services, entertainment and sports services, financial and insurance services, transportation services, accommodation services, and medical and health services [25]. By tallying the number of POIs within each category for every block, the functional factors of different spaces were ascertained.
 Table 1. Integrated classification of service industry formats.
 - Third item: acquisition and processing of public transportation data. Public transportation data were calculated by using bus stop data and subway station location data. The location data of subway stations and bus stops in Xinjiekou District of Nanjing city for the year 2023, including station names and geographical locations, were obtained through the Baidu Maps Open Platform API (https://lbsyun.baidu.com/, accessed on 3 June 2023). There were a total of 138 bus stops and 11 subway stations within the area. Given the larger number of bus stops, kernel density estimation was used to express the distribution density of buses across different blocks, while the distance from each block to the nearest subway station was used as an evaluation metric.
- Forth item: acquisition and processing of spatial capacity data. Spatial capacity determines the carrying capacity for people’s activities and is one of the significant factors affecting the use of shared bicycles. The area of blocks and the area of buildings within Xinjiekou District of Nanjing city for the year 2023 were collected through the Amap Open Platform API (https://lbs.amap.com/, accessed on 20 September 2023). The building data included the base area of buildings, the number of floors, and spatial location.
2.3. Identification of Shared Bicycle Usage and Idle States
The usage and idle states of shared bicycles are determined by comparing continuous location information to assess the mobility of dockless shared bicycles over specific time periods. If the location change of a shared bicycle is less than a set spatial threshold within a certain time threshold, it is considered to be idle during this period, indicating no movement. Conversely, if the location change exceeds this threshold, the bicycle is considered to be in use. There is a substantial body of research that employs clustering algorithms for the identification of stay points [26]. We posited that the distance residents travel by using shared bicycles typically exceeds 100 m, and they tend to engage in rapid movement within a 10 min interval; therefore, the set time threshold was 10 min, and the spatial threshold was 100 m.
Building on this analysis, we further integrated information on stopping points with the usage/idle states of dockless shared bicycles. This data set comprehensively records the start and end times of each trip and the duration of stops for dockless shared bicycles. Through this analysis, we can not only accurately identify stopping points and usage states but also create detailed journey maps for each shared bicycle. These maps describe in detail the start and end locations and times of trips, idle locations, and their duration of stays.
2.4. Calculation of Utilization Rate
The utilization rate of dockless shared bicycles refers to the ratio of shared bicycles used to the shared bicycles available in a certain area. The utilization rate represents the proportion of shared bicycles in service in each area; thus, it can be used to evaluate the reasonableness of the quantity of shared bicycles distributed in a specific area.
The amount of bicycle usage reflects the demand for shared bicycles in a zone, and the utilization rate of shared bicycles can supplement the description of the rationality of shared bicycle distribution in the area. Based on the current situation in each zone, this study attempted to evaluate the reasonableness of the bicycle distribution, for which the utilization rate is proposed as an important criterion. The utilization rate is calculated as follows:
where is the amount of bicycle usage in zone a in a certain period of time and is the total number of bicycles in zone a in a certain period of time. In practice, this is obtained by counting all the shared bicycles whose spatial coordinates have changed.
2.5. Selection of Key Built Environment Factors Based on Exploratory Regression
Prevalent studies have found that built environment factors affect people’s travel behaviors [27,28] and that spatial function plays an important role in dockless shared bicycle trips [29], and it is obvious that catering services tend to serve as a destination for dockless shared bicycle trips during meal times, whereas research and education services will relate to commuting to and from work as the peak of shared bicycle use; therefore, we selected 11 types of POI data to characterize the spatial functional factors in Section 2.1. Meanwhile, dockless shared bicycles are often operated in connection with other public transportation, which is an effective solution for the last mile of public transportation; therefore, two related factors, bus and subway, were selected to be included in this study for consideration. In addition, the capacity of urban space is also one of the considerations affecting dockless shared bicycle trips, when the larger the floor area of the block is, and the larger the population capacity is, the more robust the demand for dockless shared bicycles is; with the increase in the size of the block, there will be a greater probability that the block will solve the demand for short-distance travel through dockless shared bicycle travel. Based on the above conclusions and assumptions, it was observed that the functionality and capacity of space, as well as public transportation conditions, influence the usage of shared bicycles. As shown in Table 2, we selected 15 initial indicators, including transportation services, total construction area, plot area, catering service, etc., which collectively represent factors of the urban built environment. Furthermore, exploratory regression analysis was employed to thoroughly examine all combinations of independent variables. The objective is to identify an Ordinary Least Squares (OLS) model that not only meets the established criteria but also optimally explains the dependent variable of the model.
Table 2.
Classification of urban built environment factors.
Before the urban built environment factors are applied to the GWR model, a multicollinearity test is needed, as if there is multicollinearity between independent variables, it will lead to the instability of the regression coefficients; therefore, we excluded the explanatory variables with a VIF value ≥ 10 or a p-value ≥ 0.05. In addition, the spatial autocorrelation of the variables needs to be tested, and the explanatory variables with a p-value less than 0.05 were selected to be included in the final GWR model, and the final results of the variables are as follows: transportation services, financial and insurance services, total building area, accommodation services, block area, shortest distance to subway, and research and education services.
2.6. Geographically Weighted Regression
In this study, we subdivided the research area into several block units to more precisely explore how built environment factors such as block functionality, public transport connectivity, and spatial capacity affect shared bicycle usage patterns, as well as their role in enhancing system efficiency and promoting equitable spatial distribution. Considering the potential significant spatial heterogeneity of these environment factors and shared bicycle usage patterns, this study employed the Geographically Weighted Regression (GWR) model for analysis. The GWR model adapts to spatial variations by dynamically adjusting model parameters to accurately capture local differences between blocks. Compared with traditional global regression analysis, the GWR model is more suitable, as it not only addresses the regression issues of spatial data but also allows coefficients to vary with geographic location, thereby revealing the specific impacts of the built environment on shared bicycle usage patterns in greater detail [30]. Based on the needs and objectives of this study, we constructed three Geographically Weighted Regression models to analyze the spatial distribution of shared bicycle usage volume, utilization rate, and the level of idleness in three aspects: spatial functionality, spatial capacity, and public transport factors. The model can be represented by the following formula:
In the equation, denotes the three dependent variables of shared bicycle usage within block unit , which are the volume of use, the rate of utilization, and the level of idleness. is the intercept at the geographic location, representing the expected value of the shared bicycles’ volume of use, rate of utilization, and level of idleness in the block unit when all independent variables are zero. denotes the influence strength of the built environment factor (such as spatial functionality, spatial capacity, and public transit factors) at the geographic location on usage volume, utilization rate, and the level of idleness of shared bicycles, illustrating how model parameters dynamically change with geographic location. is the value of the built environment factor within the block unit; is the error term, representing the difference between the model’s predicted value and the actual value within the block unit.
The essence of the GWR model lies in allowing model parameters to vary with geographic location to capture the spatial heterogeneity in the impact of the built environment on shared bicycle usage patterns. This study leverages the characteristic of the GWR model to analyze the specific impacts of built environment factors on shared bicycle usage patterns and how these impacts vary with location, thereby providing a scientific basis for optimizing the spatial layout of shared bicycle systems.
3. Results
3.1. Spatial and Temporal Characteristics of Dockless Shared Bicycle Distributions
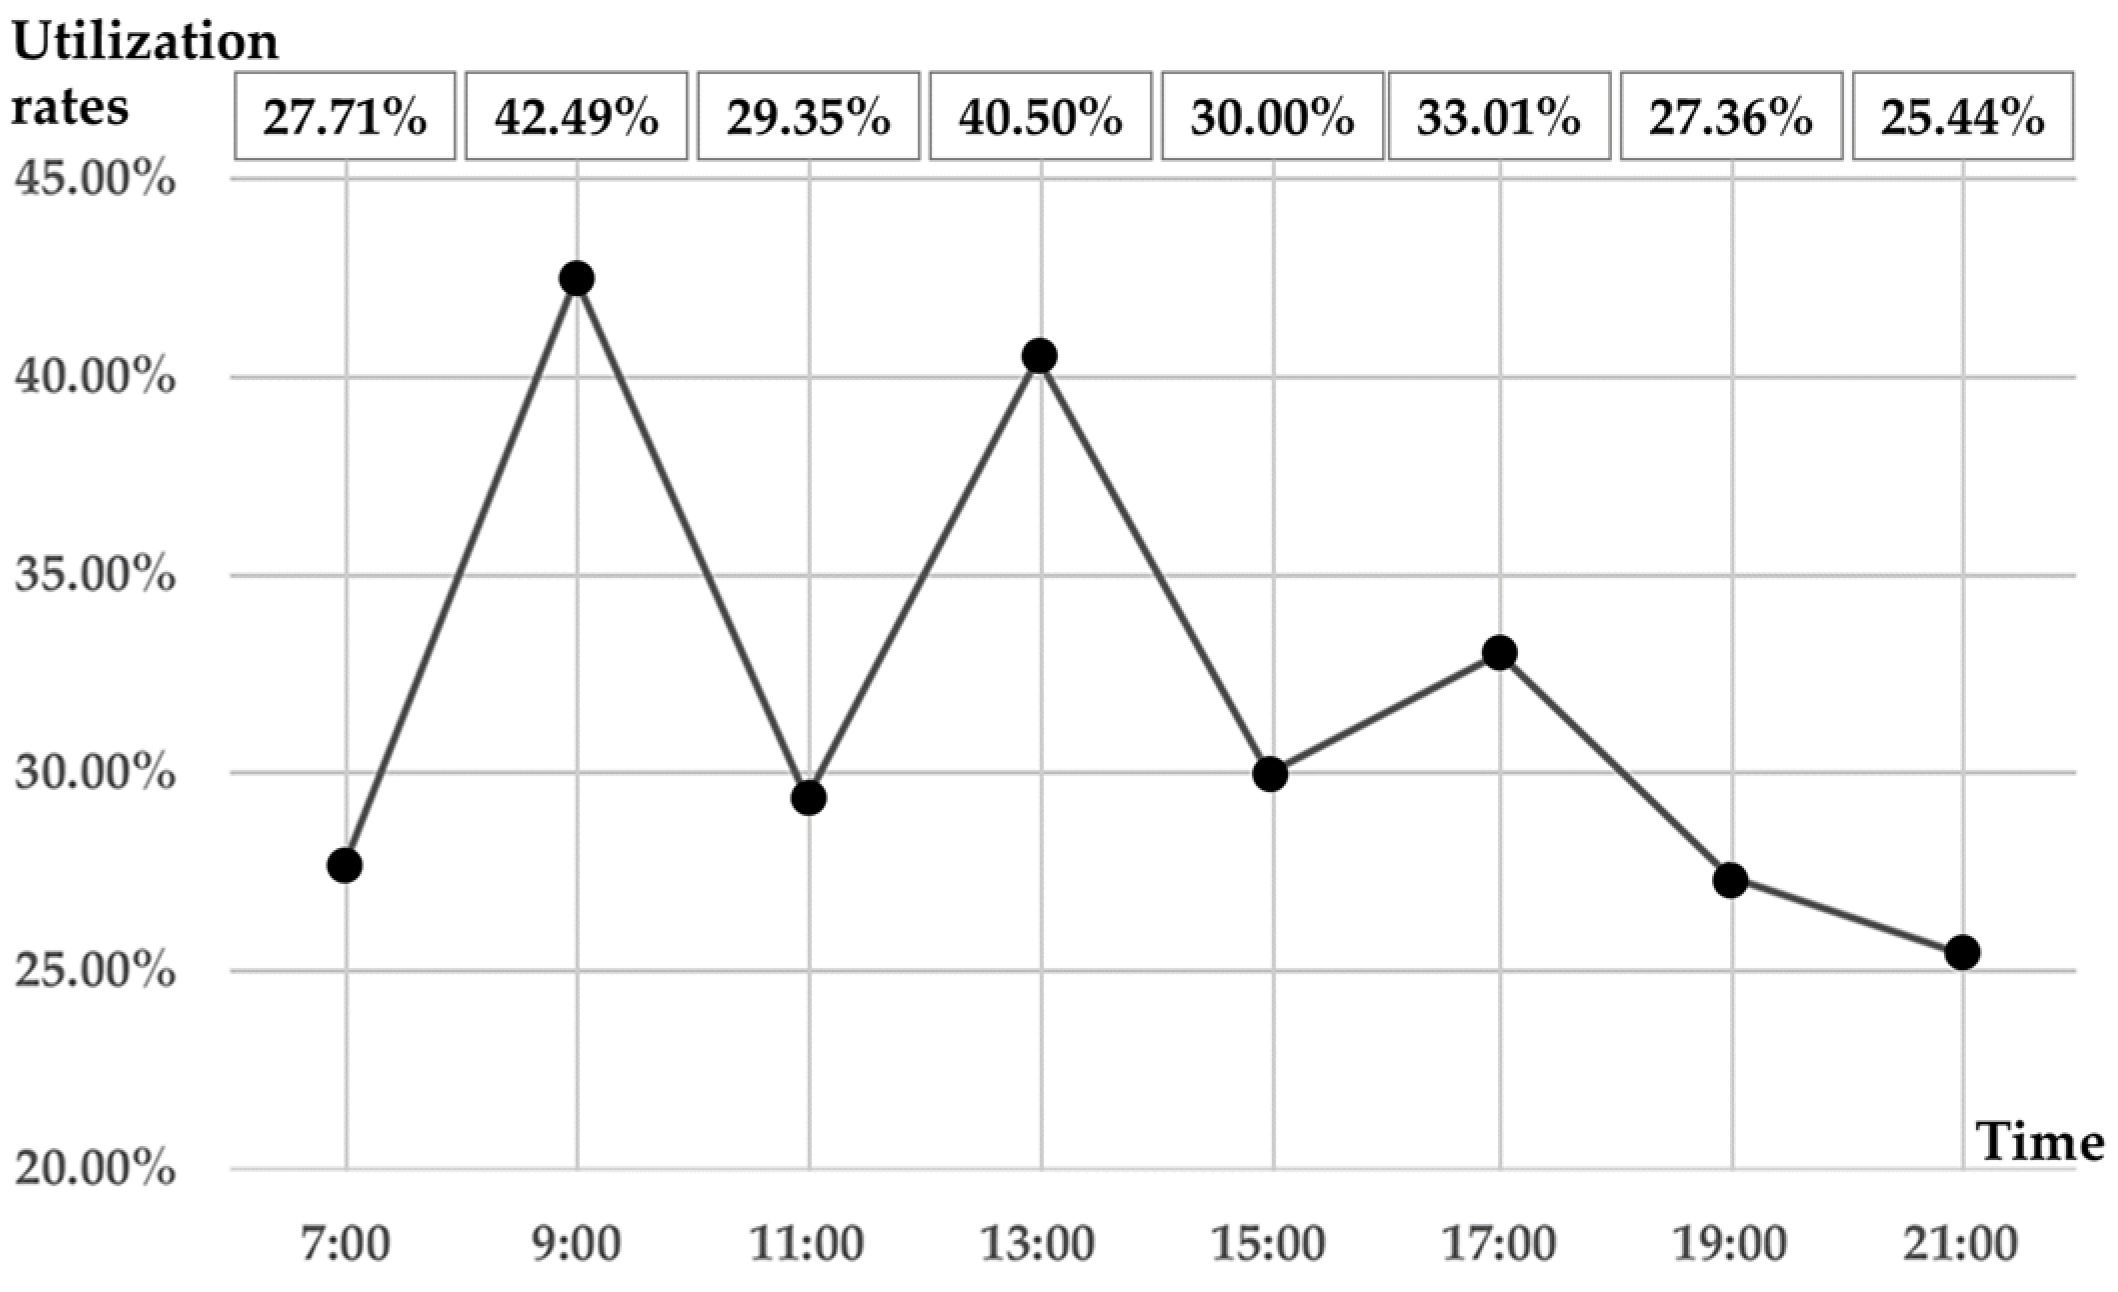
The utilization rate of shared bicycles varies temporally. Figure 2 shows that the utilization rate of dockless shared bicycles in each zone varied markedly, from 0.6% to 68.5%, with an average rate of 31.71%. This utilization rate is considered to be low in overall terms. The utilization rate in each zone changed obviously with the time period, with three peak times being observed in most zones: 9:00–11:00, 13:00–15:00, and 17:00–19:00. In terms of spatial distribution, the utilization rate in each zone was different and needs to be analyzed in further detail.

Figure 2.
Utilization rates at different times in each district of Xinjiekou Central District.
The spatial distribution characteristics of dockless shared bicycle usage and idleness are depicted in Figure 3, where the intensity of color indicates the scale of the total distribution of shared bicycles in use and idle during the observation period. Spatially, there was a distinct difference between the usage and idleness of dockless shared bicycles. The areas of high values of dockless shared bicycle usage were mainly distributed near the entrances and exits of metro stations, while the distribution of idle dockless shared bicycles was much wider, along with a tendency to cluster in commercial areas. This difference is due to the fact that most of the demand for dockless shared bicycle trips is generated around metro stations and ends mainly in urban commercial areas; then, the demand for trips via dockless shared bicycle from commercial areas is greatly reduced, thus generating a large number of idle bicycles. Temporally, usage and idleness of dockless shared bicycles exhibited opposite trends; two peak usage periods occurred from 7:00 to 9:00 and from 17:00 to 19:00, coinciding with two troughs of idleness.
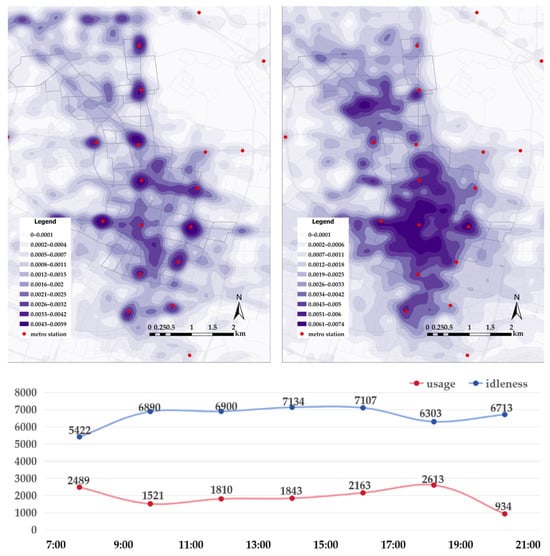
Figure 3.
Upper left: Kernel density map of shared bicycle usage distribution. Upper right: Kernel density map of shared bicycle idleness distribution. Lower: Temporal variation chart of shared bicycle usage and idleness.
The scale of idle dockless shared bicycles increased gradually throughout the day, rising from 5422 to 6713 bicycles. This indicates that the volume of dockless shared bicycle trips terminating in Xinjiekou Central District greatly exceeds those originating from it, and these spatial distribution disparities further exacerbate the idleness of shared bicycles. That is, there is a shortage of dockless shared bicycles around subway stations, while an excess of idle bicycles is found in some commercial areas. Further analysis of the relationship between different built environment factors and their impact on the scale of usage and idleness revealed variations that can inform the redistribution strategies for shared bicycles.
In terms of spatial distribution, despite the three peak periods observed in most zones, each zone had a different bicycle utilization rate that is related to the zone’s land use types. For example, zones with residential land uses had lower utilization rates at midday due to the lack of demand for dining out by bicycle. The same is true for zones with land used for cultural entertainment during the early peak period. To analyze these variations with greater precision, the study area was subdivided based on the road network into a total of 83 distinct regions. This approach was chosen because the road network provides natural geographic demarcations that are closely intertwined with travel patterns, ensuring consistency in traffic flow and shared bicycle usage within each region. The connectivity of the road network directly impacts the accessibility and mobility of shared bicycles, which is crucial for their efficient operation. Furthermore, the layout of the road network often mirrors the planning and historical development of a city, offering a framework for identifying and comprehending the spatial distribution characteristics of shared bicycle usage and idleness within the area.
3.2. Spatial and Temporal Characteristics of Dockless Shared Bicycles Use in Zoning Districts
To precisely analyze the temporal and spatial usage patterns of shared bicycles, the day was divided into seven time slots, 7:00–9:00, 9:00–11:00, 11:00–13:00, 13:00–15:00, 15:00–17:00, 17:00–19:00, and 19:00–21:00, to examine the usage dynamics of each block throughout different periods of the day (see Figure 4). By exploring the cyclical changes in shared bicycle usage within Xinjiekou Central District, this study elucidated the usage patterns of urban shared bicycles.
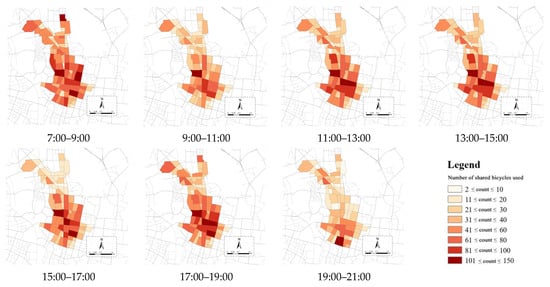
Figure 4.
Spatiotemporal variation chart of bicycle usage.
The spatial analysis of shared bicycle usage in Xinjiekou Central District showed that the southern commercial center, as the activity core of Xinjiekou, exhibited high demand for shared bicycle usage across all time scales. This reflects the key role of shared bicycles in connecting points within the commercial area, satisfying short-distance travel, and meeting the “last mile” commute needs. Conversely, areas primarily residential in the north exhibited lower shared bicycle usage, possibly due to the more uniform travel demand patterns in residential areas, which only require consideration of well-connected public transportation. Additionally, blocks with smaller areas generally show lower shared bicycle usage, possibly because these blocks have fewer users, and the availability and accessibility of shared bicycles may also be lower, affecting convenience for users.
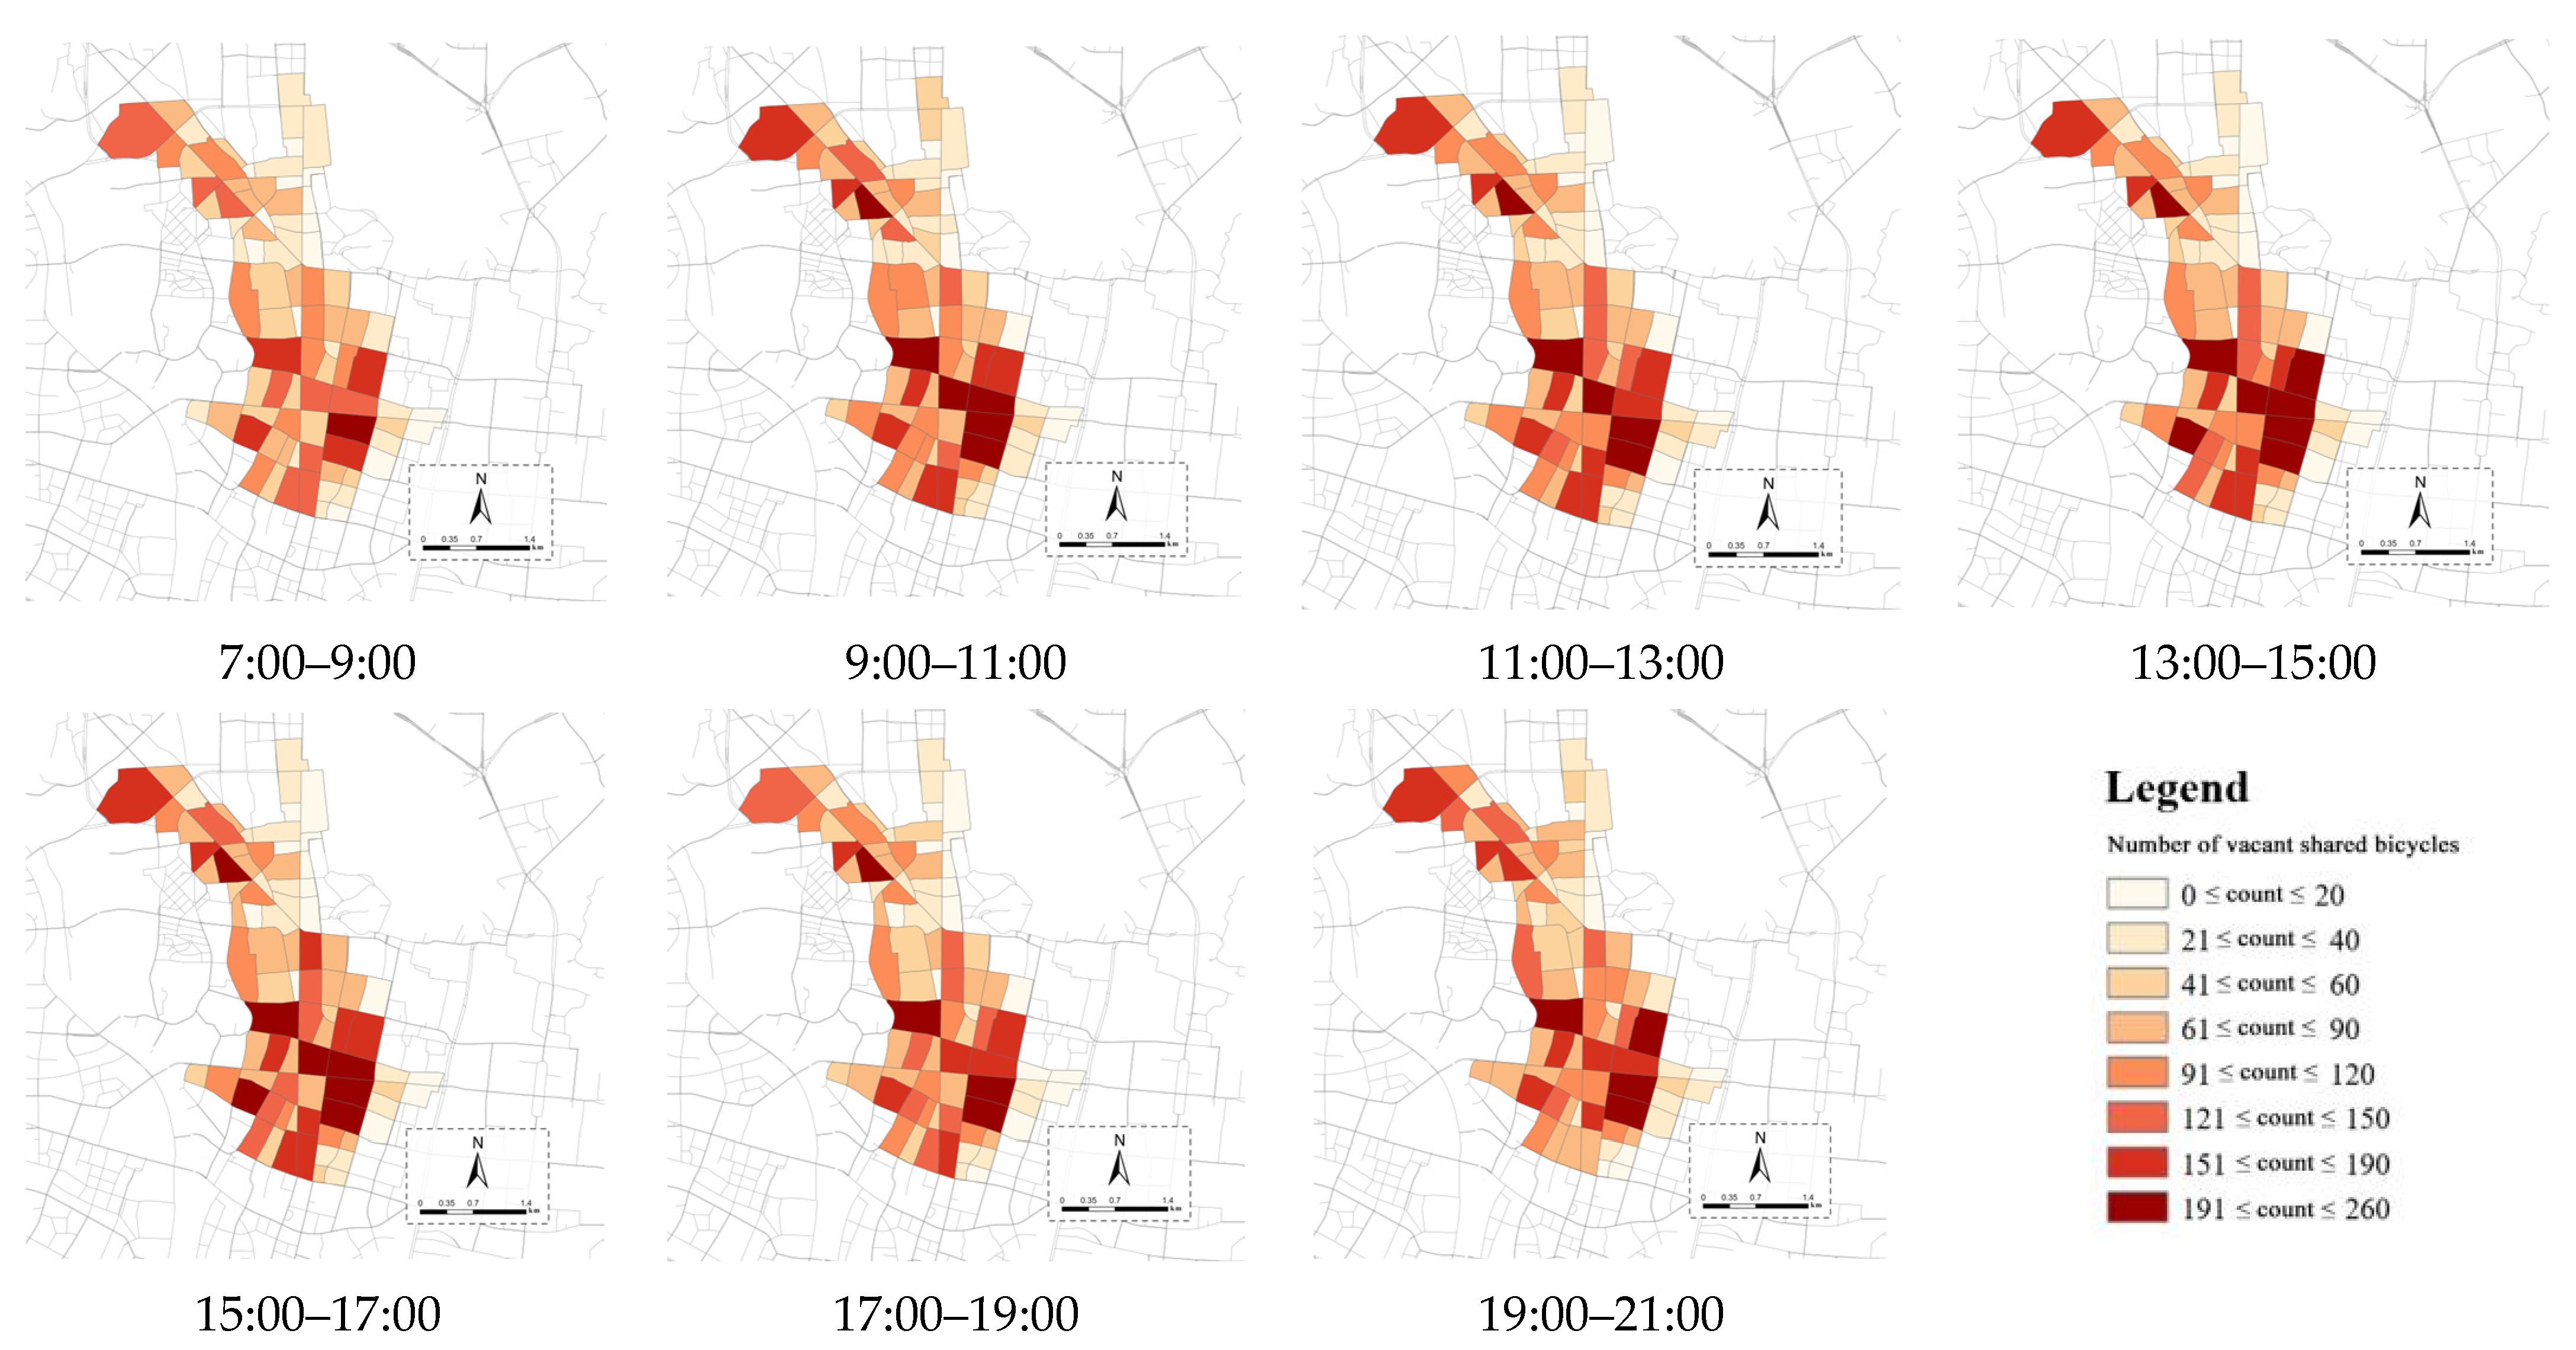
3.3. Spatial and Temporal Characteristics of Dockless Shared Bicycles Idle in Zoning Districts
Beyond usage metrics, we evaluated the dynamic idle states of shared bicycles in Xinjiekou Central District. Unlike usage patterns, the idleness of shared bicycles can indicate whether deployment in that block is reasonable and whether there is a need for precise scheduling during certain periods. By analyzing the cyclical changes in shared bicycle idleness, we lay the foundation for further analyzing the efficiency and scheduling of shared bicycle usage.
The temporal results of shared bicycle idleness in Xinjiekou Central District are inverse to those of usage (see Figure 5), showing the lowest levels of idleness during the morning rush hour (7:00–9:00). A comparison between the morning rush hour and the 9:00–11:00 period revealed a significant clustering of idle shared bicycles towards subway stations and commercial areas, indicating a direct correlation with increased usage. Similarly, the idleness was lower during the lunch period (11:00 to 13:00) and the evening rush hour (17:00 to 19:00), aligning with the characteristics of increased usage. Despite the higher usage in the commercial areas of the south, a large number of shared bicycles also remained idle, indicating an oversupply in this region and highlighting the importance of analyzing shared bicycle idleness. The analysis found that the idleness of shared bicycles around subway stations remains low throughout the day, suggesting efficient usage patterns in these areas.

Figure 5.
Spatiotemporal variation chart of shared bicycle idleness.
Further analysis of the variations in shared bicycle idleness throughout the day in Xinjiekou Central District revealed that over 75% of the blocks experienced a significant increase in the number of idle shared bicycles at various times of the day. The blocks with a notable increase in idleness primarily featured residential functions or were located near commercial clusters. There is a need to further quantify the relationship between shared bicycle idleness and the built environment to provide precise recommendations for the scheduling and deployment of shared bicycles.
4. GWR-Based Analyses on Factors Influencing Bicycle Using
4.1. Relationship between Shared Bicycle Usage and Built Environment
Through Geographically Weighted Regression (GWR) analysis (Table 3), this study established a model with seven built environment factors as independent variables and the usage volume of shared bicycles as the dependent variable. As shown in Table 3, the adjusted R-squared value of the model reaches 0.8509, indicating strong explanatory power. The corrected Akaike Information Criterion (AICc) value of the model is 632.0244, where a lower AICc value signifies less information loss, and the standard error is 50.7646, reflecting the model’s high predictive accuracy. Additionally, the sigma-squared MLE value of 50.7646 and the Theta value of 54.5240 together suggest that the model effectively controls the impact of spatial autocorrelation. These statistical indicators not only demonstrate the overall advantages of the model but also reflect the similarities and differences in the local spatial relationships between shared bicycle usage and built environment factors in terms of correlation and spatial influence. This analysis indicates that the relationship between the use of shared bicycles and various built environment factors exhibits unique spatial variability across different regions.
Table 3.
Shared bicycle usage GWR result indicators.
As depicted in Figure 6, an in-depth analysis of the relationship between various built environment factors and the usage volume of shared bicycles reveals positive correlations with transportation services, block area, financial and insurance services, research and education services, and accommodation services. This suggests that these explanatory variables act as facilitators for the utilization of shared bicycles. Conversely, total building area and the shortest distance to the subway exhibit negative correlations with the usage of shared bicycles, indicating that these factors may suppress their usage.
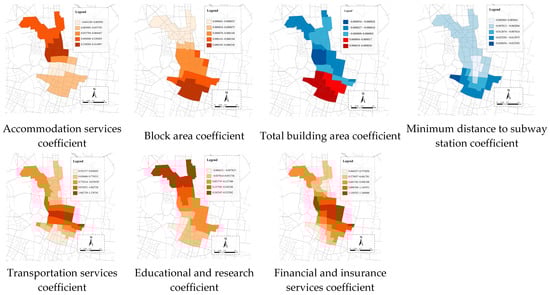
Figure 6.
Geographical Weighted Model results of shared bicycle usage.
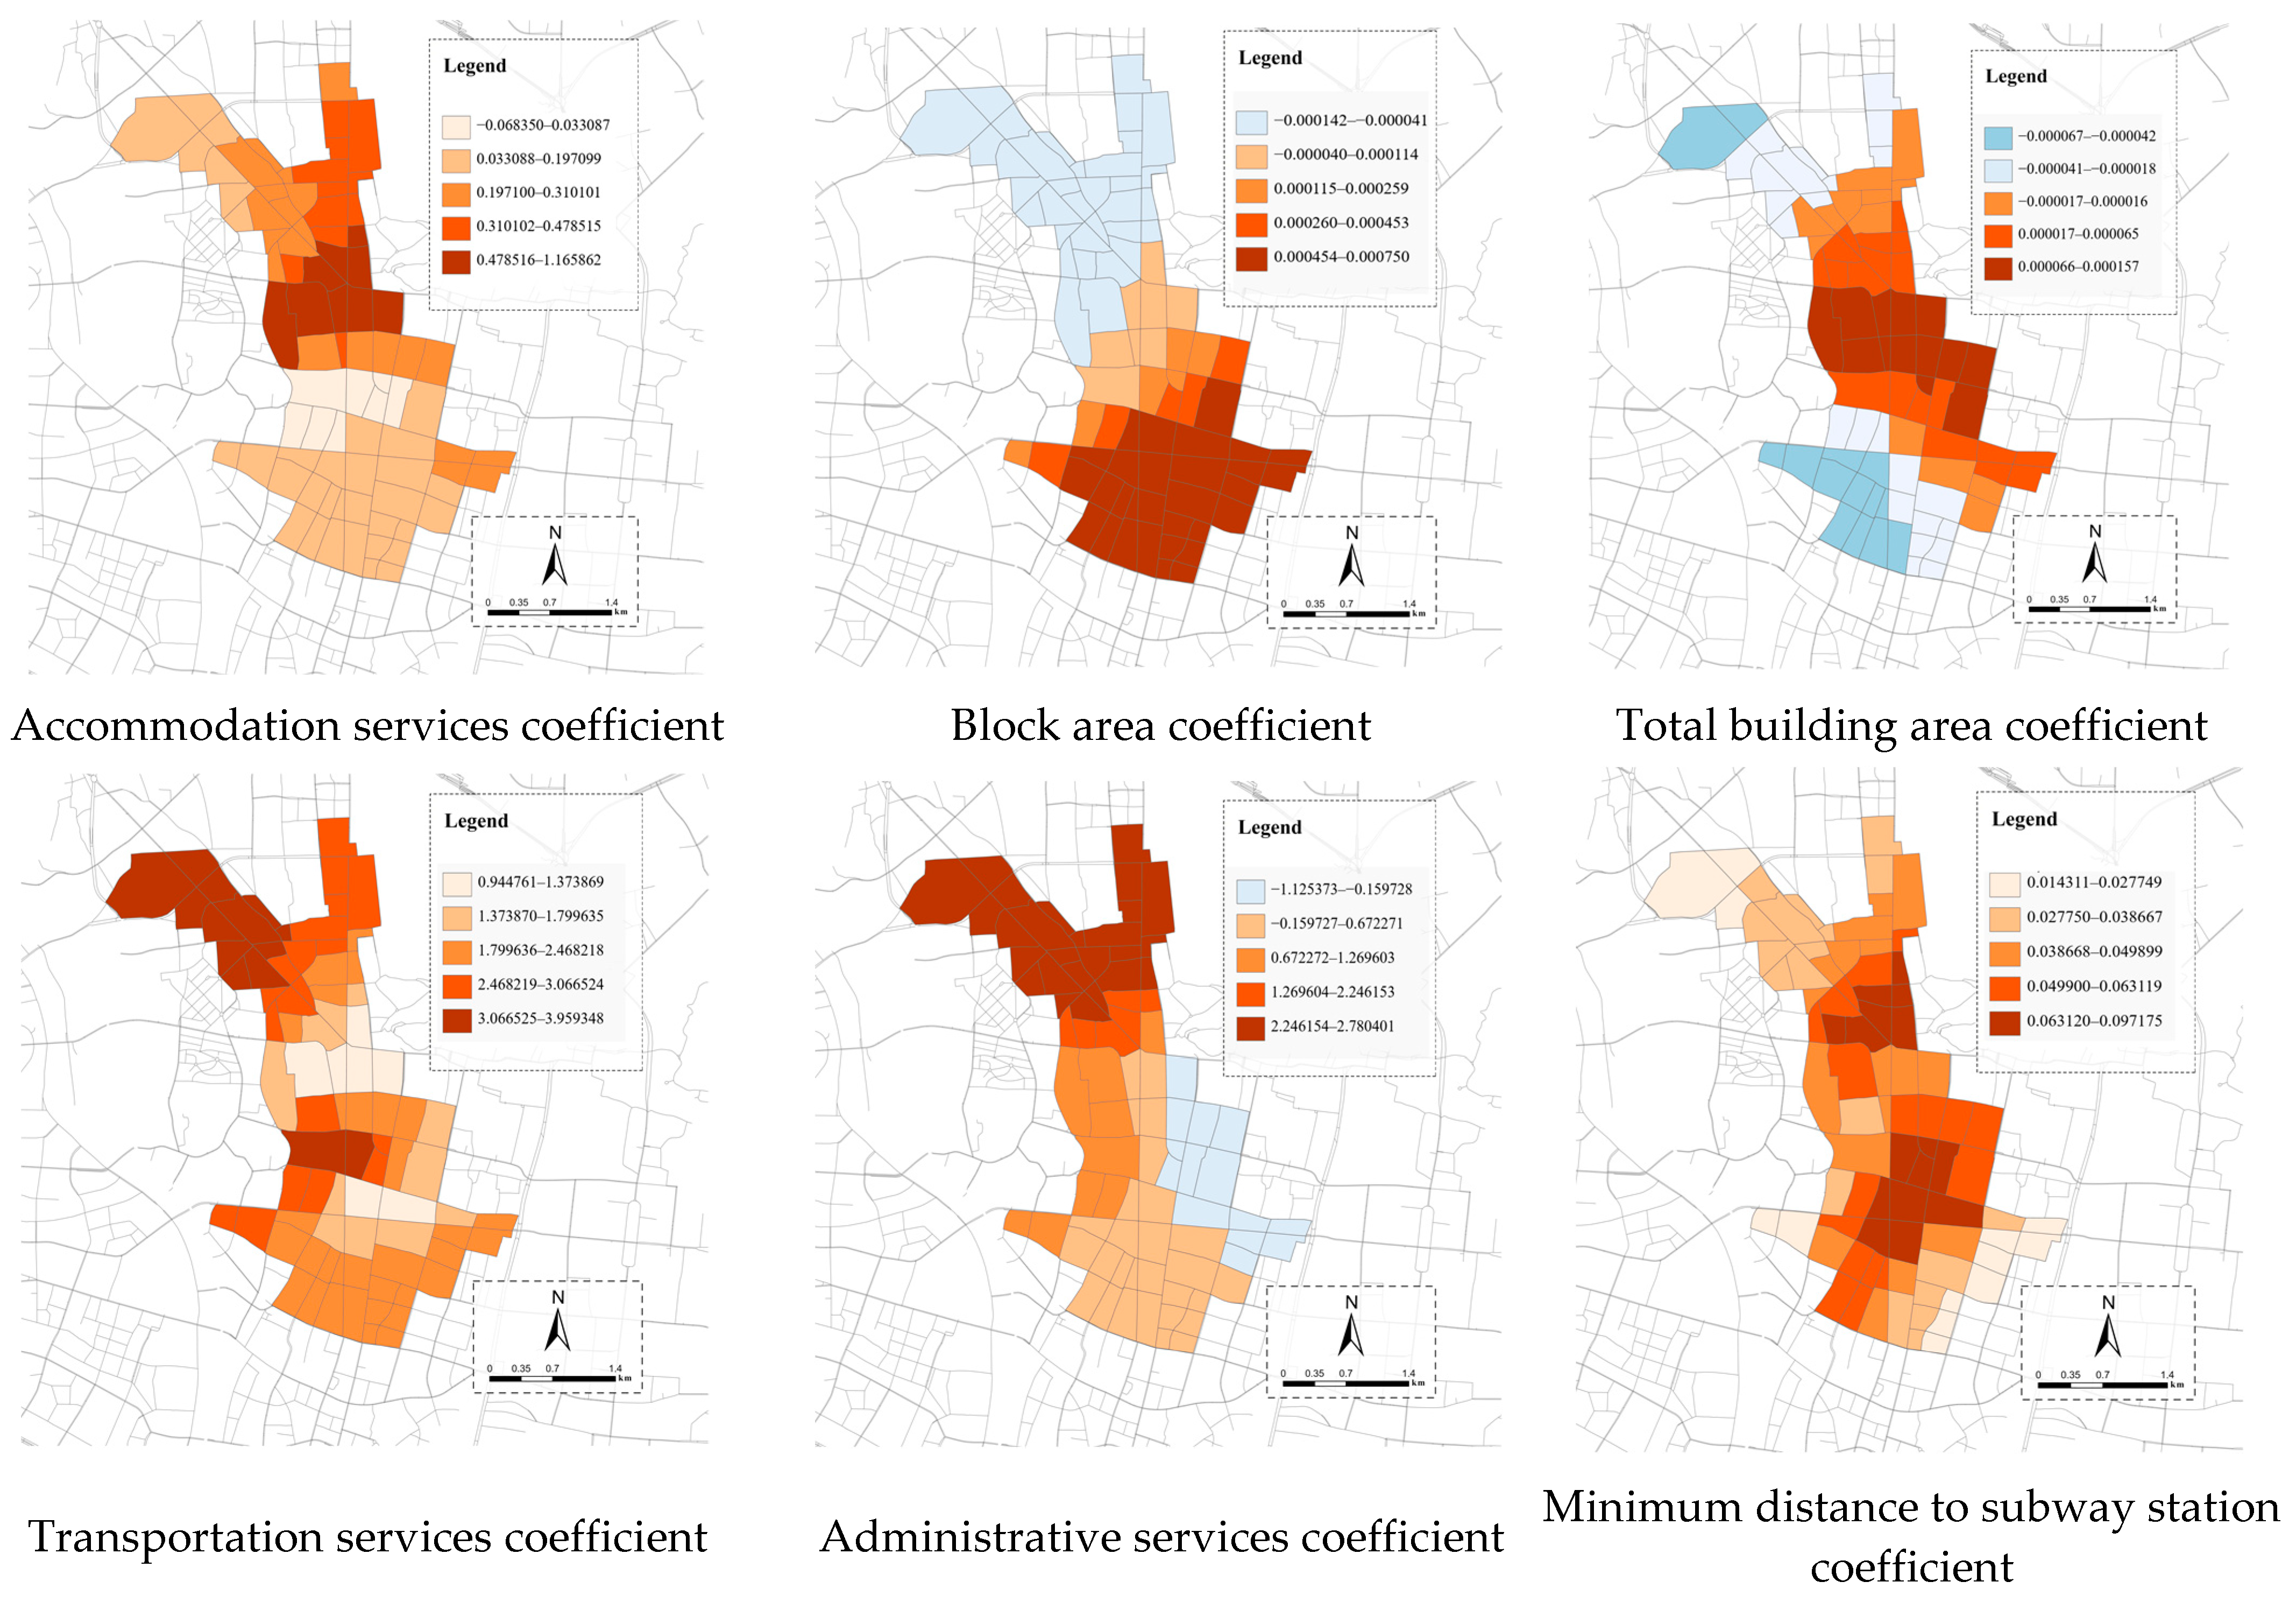
The variable coefficient distribution analysis of the impact of different factors on shared bicycle usage is illustrated in Figure 7. Considering spatial functionality, there is considerable variation in the influence that different functions exert on the use of shared bicycles. The coefficient for transportation services reveals a more pronounced impact in the southern regions relative to the north, where the density of commercial activities and the surge in pedestrian traffic heighten the demand for shared bicycles, underscoring their role as a critical transportation solution. This demand aids in navigating parking limitations and efficiently interconnecting commercial hubs. In the north, however, the reliance on shared bicycles is diminished within residential zones due to the widespread use of private vehicles and accessible public transit systems. The analysis of coefficients for financial and insurance services point to a positive influence on shared bicycle usage in districts densely populated with these services. This indicates that the concentration of the financial and insurance sectors is linked to higher employment rates and workforce mobility, which in turn amplifies the need for efficient and agile short-distance transportation options, consequently boosting the usage rate of shared bicycles. Furthermore, the coefficient for research and education services displays a significantly positive effect in the northern regions when contrasted with the southern regions. This disparity can be credited to the northern regions’ relative abundance of universities and the comparatively elevated demand for shared bicycles among university students as opposed to other demographic segments of students.

Figure 7.
Geographical Weighted Model results of shared bicycle vacancies.
From the perspective of spatial capacity, a positive correlation exists between block area and the usage volume of shared bicycles. This aligns with the premise that expansive block areas rely on shared bicycles to fulfill their internal transportation needs, particularly within commercial aggregation areas where this effect is pronounced. Conversely, the relationship between total building area and shared bicycle usage volume is generally weakly negative. However, within southern commercial clusters, a positive correlation is observed. This discrepancy may be attributed to the fact that in these regions, the scale of construction has already surpassed a specific threshold, implying that an increase in total building area corresponds to a relatively minor increase in the demand for shared bicycles, thus yielding a negative correlation for the total building area coefficient.
From the perspective of public transportation, the distribution of subway stations in Xinjiekou Central District significantly impacts the travel demand for shared bicycles. Areas closer to subway stations see higher usage of shared bicycles, indicating the significant role of shared bicycles as a complement to the subway system for the “last mile”, especially pronounced in the central areas of commercial clusters.
4.2. Relationship between Shared Bicycle Idleness and Built Environment
Building on the analysis of the relationship between shared bicycle usage and the built environment, we further examined the relationship between the idleness of shared bicycles and the built environment, as depicted in Table 4. The adjusted R-squared value of the shared bicycle idleness model reached 0.6410, indicating strong explanatory power. In contrast, the adjusted R-squared value for the shared bicycle usage rate model was 0.2143, demonstrating weaker explanatory power. When conducting exploratory regression analysis with the usage rate as the response variable and multiple built environmental indicators (such as building density, land use type, and transportation accessibility) as explanatory variables, the results indicate that none of the constructed models passed the statistical significance test. This implies that there is no significant fitting relationship between the usage rate and built environmental characteristics.
Table 4.
Shared bicycle idleness and utilization rate GWR result indicators.
In delving into the correlation between the idleness of shared bicycles and various built environment factors, this study found that the factors administrative services, transportation services, the shortest distance to the subway, block area, total building area, and accommodation services demonstrate a significant positive correlation with the idleness rate of shared bicycles. The results indicate a tendency for shared bicycles to be idle more in areas with concentrated administrative services, accommodation services, and transportation services, as well as in locations with larger block area and total building area.
The variable coefficient distribution analysis of the impact of different factors on shared bicycle usage is illustrated in Figure 7. From the perspective of spatial functionality, the influence of different functions on the use of shared bicycles varies significantly. There is an inherent distinction between the transportation demands of residential and commercial areas. Residents in residential areas may prefer to use private cars or other modes of transportation for long-distance commuting, reducing reliance on shared bicycles and leading to relatively higher idleness rates in these areas. In contrast, commercial areas typically concentrate a large short-distance travel demand, where shared bicycles, as a convenient mode of short-distance travel, naturally have a higher frequency of use. Accommodation services have a similar effect. Additionally, due to the centralized layout of government offices in the south, this increases the frequency of use of shared bicycles by government workers and visitors, reducing the number of idle shared bicycles.
From the perspective of spatial capacity, there is a negative correlation between the larger block area in the north and the idleness of shared bicycles, likely due to the lower building density that promotes a higher usage rate of shared bicycles. In contrast, the high demand in the smaller block areas of the south does not reduced idleness; instead, it may lead to a higher idleness rate due to spatial constraints and intensive use, showing a positive correlation with the volume of idleness. The total building area is positively correlated with the usage volume of shared bicycles; in areas with dense construction, the concentration of population and frequent business activities may increase the demand for shared bicycles, but it may also lead to an increase in the number of idle bicycles. In areas with sparser construction, the lower population density may reduce the frequency of shared bicycle usage, thereby decreasing the number of idle bicycles.
From the perspective of public transportation, the layout of subway stations in Xinjiekou Central District significantly shapes the travel demand for shared bicycles. The higher idleness of shared bicycles in areas surrounding subway stations reveals that a large number of users rely on shared bicycles as a convenient means to access subway stations, especially in the centers of commercial clusters, where the aggregation of shared bicycles is more pronounced.
Usage volume indicates the system’s activity level, whereas utilization rate focuses on the system’s efficiency and the balance of supply and demand. Considering the low correlation between utilization rate and built environment factors, we believe that Xinjiekou Central District has not yet achieved a balance between shared bicycle supply and demand, leading to a significant amount of shared bicycle idleness. The oversupply of shared bicycles (i.e., high idleness) results in a non-significant utilization rate, pointing out that in addition to the built environment, the balance between shared bicycle supply and demand must also be considered. Lastly, as a key component in calculating the utilization rate, idleness not only adds complexity to the analysis but also reflects the dynamic balance between supply and demand. The variation in this balance under different built environment settings reveals the necessity of optimizing shared bicycle distribution according to specific built environment and user behavior patterns, emphasizing the importance of considering this dynamic balance when understanding the interaction between shared bicycle usage and the built environment. This outcome is attributed to the distinct relationships between the use and idleness of shared bicycles and the factors of the built environment, with further disparities to be analyzed in Section 5.2 and Section 5.3.
5. Discussion
5.1. Findings of Dockless Shared Bicycle Idleness
Xinjiekou Central District contains a total of 7000 dockless shared bicycles and an average bicycle utilization rate of 31.71% within half an hour. This means that approximately 2200 dockless shared bicycles are in actual service, while the other 4800 are not. Assuming a cost of USD 146.5 per bicycle and an area of 1 m2 occupied by each bicycle, this corresponds to approximately USD 703.2 thousand in wasted urban resources and 4800 m2 in urban space. Even when the utilization rate is at its peak (9:00–11:00 period), 4000 shared bicycles remain idle.
While the distribution density in Xinjiekou Central District varies significantly with time and zone, the utilization rate of dockless shared bicycles is low throughout the study area. The distribution density ranges from 1.63 to 9.05, indicting distinct differences in bicycle distribution. The utilization rate varies between 0.6% and 68.5%, with rates of approximately 30% in most zones. The distribution density of dockless bicycle remains stable over time with dynamic change ranging from 0.61 to 2.83. In terms of spatial distribution, there is a significant difference in the distribution density, where the distribution density is between 1.63 and 9.05. In mixed-use land, commercial land, and transportation hubs, where the flow of people is heavy, high demand for shared bicycles results in a high distribution density. In contrast, in single-use zones and zones containing residential land and heritage sites, the distribution density is lower because of factors such as bicycle restrictions. The temporal pattern of the utilization rate of dockless shared bicycles shows some regularity. Three peak periods in utilization rate are observed each day at 9:00, 13:00, and 17:00. These peaks correspond to commuting times and travel at lunch to dine out. The bicycle utilization rate varies among zones, which is related to the land use types in each zone.
5.2. Differences in Influencing Factors of Dockless Shared Bicycle Usage and Idleness
A comparative analysis of the results from two Geographically Weighted Regression (GWR) models of dockless shared bicycles reveals that different built environmental elements have varying impacts on the usage and idleness of dockless shared bicycles. Firstly, the public transportation system has the most significant influence on the usage of shared bicycles. Transportation services have a substantial effect on both the usage and idleness of shared bicycles, indicating that areas with a dense concentration of transportation services experience greater demand for shared bicycles as both origins and destinations. Secondly, the impact of the shortest distance to subway stations on the usage and idleness of dockless shared bicycles is inversely related; as the distance increases, the usage of dockless shared bicycles decreases, while the idleness increases, suggesting that areas further from subway stations have a higher demand as destinations. Accommodation services and financial and insurance services have a higher significance in influencing the usage volume of dockless shared bicycles compared with their idleness, indicating a greater demand for these areas as starting points for trips. In practical planning, the redistribution of dockless shared bicycles can be further considered based on the aforementioned built environment factors.
5.3. Policy Recommendations
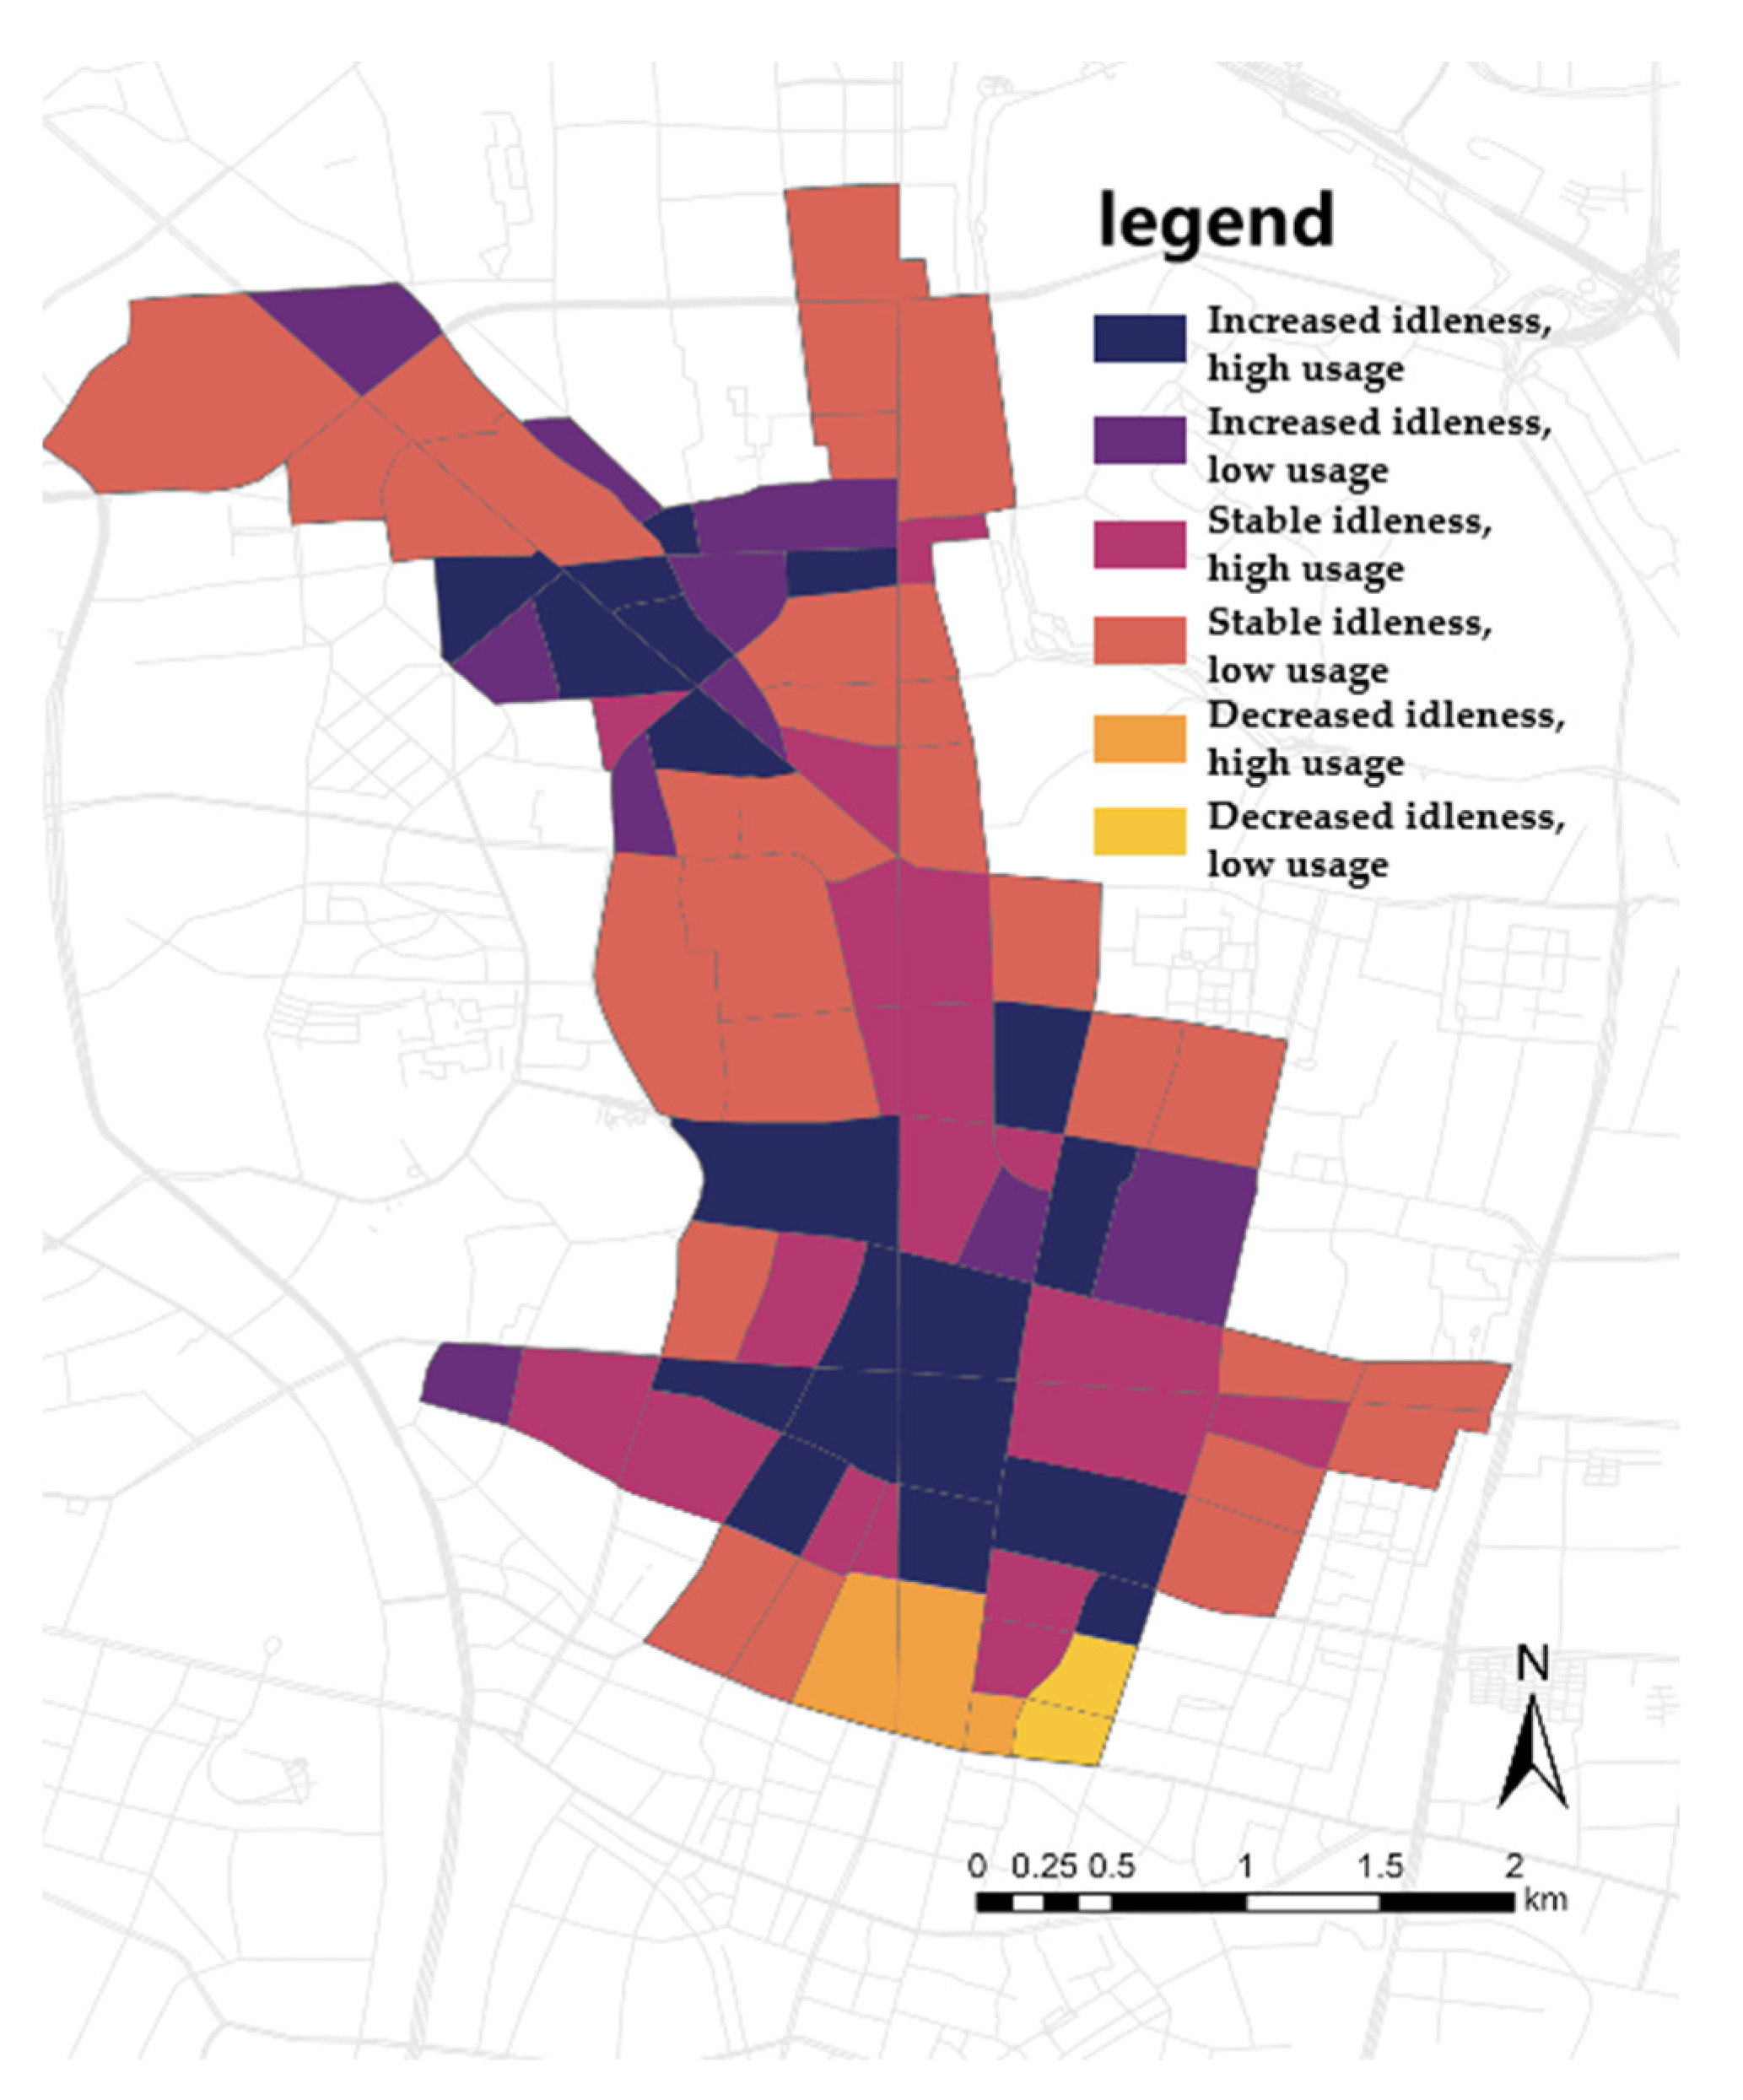
By incorporating the results of dockless shared bicycle usage and idleness, a zone-based management strategy for the redistribution of shared bicycles in Xinjiekou Central District was devised. The district’s plots are categorized into six types based on the usage volume and changes in the idleness of the shared bicycles, as depicted in Figure 8. Type 1 areas, which are primarily commercial zones and some subway station areas, exhibit high levels of both bicycle idleness changes and usage, necessitating more frequent monitoring and redistribution to meet demand while preventing excessive idleness. Type 2 areas, mainly residential, show high idleness changes but low usage, indicating an immediate need for reduced bicycle deployment. Types 3 and 4 areas demonstrate stable bicycle counts; Type 3, typically near subway stations, aligns with stable origin and destination demands, while Type 4, on the district’s periphery, sees minimal changes in usage and idleness, marking them as secondary areas of focus for redistribution. Types 5 and 6 areas are less common due to the overall trend of increasing idleness in the district; Type 5 areas may experience a demand for bicycles that exceeds their idleness, suggesting a need for increased bicycle allocation as appropriate.

Figure 8.
Shared bicycle usage and idleness typology map.
6. Conclusions
This study takes the central area of Nanjing City as an example, analyzing the regional characteristics and their differences affecting the use of dockless shared bicycles from different perspectives of usage and idleness. By employing a Geographically Weighted Regression (GWR) model, the study examines the varying impacts of different built environment factors on the use and idleness of dockless shared bicycles. This work complements the existing literature in three aspects.
Firstly, this study dissects the usage of dockless shared bicycles into usage volume and idleness for analysis, based on the premise that the demand for bicycles as starting points and endpoints in dockless shared bicycle trips is not consistent. This inconsistency leads to a shortage of dockless shared bicycles in some areas and a gradual accumulation of idle ones in others, necessitating redistribution. Secondly, the paper confirms the different impacts of built environment factors on the use and idleness of dockless shared bicycles [31]. Among them, the relationship between the usage of dockless shared bicycles and built environment factors has been mentioned in several studies [32]; for example, there is a significant correlation between the use of dockless shared bicycles and urban metro stations, and we go further to discuss that the idleness of dockless shared bicycles is also spatially correlated with different built environment factors. In contrast, financial and insurance services, administrative services, and research and education services exhibit varying degrees of significance in their impact. Lastly, these findings can further guide the redistribution of dockless shared bicycles. By considering both the usage volume and idleness, different management zones can be delineated, and within these zones, refined redistribution management can be implemented, taking into account the built environment factors. This approach provides new insights for designing more flexible and precise redistribution strategies for dockless shared bicycles.
It is worth noting that this study has the following limitations: Firstly, due to limited access to data, this study only used data from one shared bicycle supplier and cannot fully demonstrate the characteristics of shared bicycle usage and idleness in the central area of Xinjiekou. Secondly, this study focuses on the usage and placement of shared bicycles at the block scale in Xinjiekou Central District. For other urban areas, such as suburban areas, there may be different usage patterns, and specific case studies need to be further conducted to analyze their usage and develop placement strategies. Thirdly, this study only focuses on the behavior of shared bicycles in spring and does not explore further the use of shared bicycles under different weather and season conditions. However, the use of shared bicycles is strongly influenced by factors such as the weather, and further exploration is needed to explore its efficiency. Finally, in this study, it was preliminarily found that the impact of subway stations on shared bicycles is crucial. It is necessary to further consider the travel patterns between subway stations and shared bicycles in order to propose more effective and precise placement strategies.
Author Contributions
Conceptualization, Yi Shi and Zhonghu Zhang; methodology, Yi Shi and Zhonghu Zhang; software, Yi Shi; validation, Chunyu Zhou, Ruxia Bai, and Chen Li; formal analysis, Yi Shi; investigation, Zhonghu Zhang; resources, Yi Shi; data curation, Yi Shi; writing—original draft preparation, Yi Shi and Zhonghu Zhang; writing—review and editing, Yi Shi, Zhonghu Zhang and Chunyu Zhou; visualization, Chunyu Zhou, Ruxia Bai and Chen Li; supervision, Yi Shi; project administration, Yi Shi; funding acquisition, Yi Shi. All authors have read and agreed to the published version of the manuscript.
Funding
This research was funded by National Natural Science Foundation of China, grant number 52378048 and the Fundamental Research Funds for the Central Universities, grant number 2242024K4000.
Data Availability Statement
The data are not publicly available due to their containing information that could compromise the privacy of the research participants.
Conflicts of Interest
The authors declare no conflicts of interest.
References
- Patel, S.J.; Patel, C.R. A stakeholders perspective on improving barriers in implementation of public bicycle sharing system (PBSS). Transp. Res. Part A Policy Pr. 2020, 138, 353–366. [Google Scholar] [CrossRef]
- Yang, X.-H.; Cheng, Z.; Chen, G.; Wang, L.; Ruan, Z.-Y.; Zheng, Y.-J. The impact of a public bicycle-sharing system on urban public transport networks. Transp. Res. Part A Policy Pr. 2018, 107, 246–256. [Google Scholar] [CrossRef]
- Li, Q. The modes of government guidance for public bicycle operation and state-owned company operation: A case study of Hangzhou city in China. In WIT Transactions on The Built Environment; WIT Press: Southampton, UK, 2014. [Google Scholar]
- Wang, L.; Dai, Y.; Han, L.; Xu, Z. Optimizing urban resource efficiency: A scenario analysis of shared sports facilities in fostering sustainable communities in Nanjing, China. J. Clean. Prod. 2024, 468, 143082. [Google Scholar] [CrossRef]
- Yang, X.; Chen, Z. Research on public transport network modeling and its performance with public bicycle sharing system. J. Zhejiang Univ. Technol. 2018, 46, 27–32. (In Chinese) [Google Scholar]
- Axsen, J.; Hardman, S.; Jenn, A. What do we know about zero-emission vehicle mandates? Environ. Sci. Technol. 2022, 56, 7553–7563. [Google Scholar] [CrossRef] [PubMed]
- Chen, P.; Liu, Q.; Sun, F. Bicycle parking security and built environments. Transp. Res. Part D Transp. Environ. 2018, 62, 169–178. [Google Scholar] [CrossRef]
- Fu, C.; Huang, Z.; Scheuer, B.; Lin, J.; Zhang, Y. Integration of dockless bike-sharing and metro: Prediction and explanation at origin-destination level. Sustain. Cities Soc. 2023, 99, 104906. [Google Scholar] [CrossRef]
- Li, S.; Zhuang, C.; Tan, Z.; Gao, F.; Lai, Z.; Wu, Z. Inferring the trip purposes and uncovering spatio-temporal activity patterns from dockless shared bike dataset in Shenzhen, China. J. Transp. Geogr. 2021, 91, 102974. [Google Scholar] [CrossRef]
- Li, H.; Xing, Y.; Zhang, W.; Zhang, X. Investigating the impact of weather conditions and land use on dockless bike-share trips in Shanghai, China. J. Urban Plan. Dev. 2021, 147, 05021031. [Google Scholar] [CrossRef]
- Bachand-Marleau, J.; Lee, B.H.Y.; El-Geneidy, A.M. Better Better understanding of factors influencing likelihood of using shared bicycle systems and frequency of use. Transp. Res. Rec. J. Transp. Res. Board 2012, 2314, 66–71. [Google Scholar] [CrossRef]
- Meng, S.; Zacharias, J. Street morphology and travel by dockless shared bicycles in Beijing, China. Int. J. Sustain. Transp. 2021, 15, 788–798. [Google Scholar] [CrossRef]
- Faghih-Imani, A.; Anowar, S.; Miller, E.J.; Eluru, N. Hail a cab or ride a bike? A travel time comparison of taxi and bicycle-sharing systems in New York City. Transp. Res. Part A Policy Pr. 2017, 101, 11–21. [Google Scholar] [CrossRef]
- Conrow, L.; Murray, A.T.; Fischer, H.A. An optimization approach for equitable bicycle share station siting. J. Transp. Geogr. 2018, 69, 163–170. [Google Scholar] [CrossRef]
- Çelebi, D.; Yörüsün, A.; Işık, H. Bicycle sharing system design with capacity allocations. Transp. Res. Part B Methodol. 2018, 114, 86–98. [Google Scholar] [CrossRef]
- Faghih-Imani, A.; Eluru, N.; El-Geneidy, A.M.; Rabbat, M.; Haq, U. How land-use and urban form impact bicycle flows: Evidence from the bicycle-sharing system (BIXI) in Montreal. J. Transp. Geogr. 2014, 41, 306–314. [Google Scholar] [CrossRef]
- Faghih-Imani, A.; Eluru, N. Incorporating the impact of spatio-temporal interactions on bicycle sharing system demand: A case study of New York Citibicycle system. J. Transp. Geogr. 2016, 54, 218–227. [Google Scholar] [CrossRef]
- Shigemi, K.; Tsumura, K. Distributed Stochastic Control of Incentive for Bike-Sharing Systems. IFAC-PapersOnLine 2022, 55, 260–265. [Google Scholar] [CrossRef]
- Wu, C.; Kim, I.; Chung, H. The effects of built environment spatial variation on bike-sharing usage: A case study of Suzhou, China. Cities 2021, 110, 103063. [Google Scholar] [CrossRef]
- Gao, F.; Li, S.; Tan, Z.; Zhang, X.; Lai, Z.; Tan, Z. How Is Urban Greenness Spatially Associated with Dockless Bike Sharing Usage on Weekdays, Weekends, and Holidays? ISPRS Int. J. Geo-Inf. 2021, 10, 238. [Google Scholar] [CrossRef]
- Ni, Y.; Chen, J. Exploring the effects of the built environment on two transfer modes for metros: Docklessbike sharing and taxi. Transp. Res. Rec. J. Transp. Res. Board 2020, 12, 2034. [Google Scholar] [CrossRef]
- Ji, Y.; Ma, X.; He, M.; Jin, Y.; Yuan, Y. Comparison of usage regularity and its determinants between docked and dockless bike-sharing systems: A case study in Nanjing, China. J. Clean. Prod. 2020, 255, 120110. [Google Scholar] [CrossRef]
- Hu, X.; Yang, J. Quantitative Analysis of the Urban Factors Limiting Central District Plane Form Expansion: Twenty-one Case Studies of Asian Megacities′ Central Districts. J. Asian Arch. Build. Eng. 2018, 17, 345–351. [Google Scholar] [CrossRef]
- Guo, Y.; He, S. Built environment effects on the integration of dockless bike-sharing and the metro. Transp. Res. Part D Transp. Environ. 2020, 83, 102335. [Google Scholar] [CrossRef]
- Hu, X.; Ma, J.; Shi, Y. Research on the mixed characteristics of urban three-dimensional spatial formats based on POI data—Taking the Xidan Central District of Beijing as an example. Mod. Urban Res. 2023, 38, 124–132. [Google Scholar]
- Pérez-Torres, R.; Torres-Huitzil, C.; Galeana-Zapién, H. Full on device stay points detection in smartphones for location based mobile applications. Sensors 2016, 16, 1693. [Google Scholar] [CrossRef]
- Guo, Y.; Yang, L.; Lu, Y.; Zhao, R. Dockless bike-sharing as a feeder mode of metro commute? The role of the feeder-related built environment: Analytical framework and empirical evidence. Sustain. Cities Soc. 2020, 65, 102594. [Google Scholar] [CrossRef]
- Wu, X.; Lu, Y.; Gong, Y.; Kang, Y.; Yang, L.; Gou, Z. The impacts of the built environment on bicycle-metro transfer trips: A new method to delineate metro catchment area based on people’s actual cycling space. J. Transp. Geogr. 2021, 97, 103215. [Google Scholar] [CrossRef]
- Guidon, S.; Becker, H.; Axhausen, K. Avoiding stranded bicycles in free-floating bicycle-sharing systems: Using survival analysis to derive operational rules for rebalancing. In Proceedings of the 2019 IEEE Intelligent Transportation Systems Conference—ITSC, Auckland, New Zealand, 27–30 October 2019. [Google Scholar]
- Borgnat, P.; Abry, P.; Flandrin, P.; Robardet, C.; Rouquier, J.-B.; Fleury, E. Shared bicycles in a city: A signal processing and data analysis perspective. Adv. Complex Syst. 2011, 14, 415–438. [Google Scholar] [CrossRef]
- Zhou, X.; Dong, Q.; Huang, Z.; Yin, G.; Zhou, G.; Liu, Y. The spatially varying effects of built environment characteristics on the integrated usage of dockless bike-sharing and public transport. Sustain. Cities Soc. 2023, 89, 104348. [Google Scholar] [CrossRef]
- Zhang, H.; Cui, Y.; Liu, Y.; Jia, J.; Shi, B.; Yu, X. Exploring Travel Mobility in Integrated Usage of Dockless Bike-Sharing and the Metro Based on Multisource Data. ISPRS Int. J. Geo-Inf. 2024, 13, 108. [Google Scholar] [CrossRef]


Disclaimer/Publisher’s Note: The statements, opinions and data contained in all publications are solely those of the individual author(s) and contributor(s) and not of MDPI and/or the editor(s). MDPI and/or the editor(s) disclaim responsibility for any injury to people or property resulting from any ideas, methods, instructions or products referred to in the content. |
© 2024 by the authors. Licensee MDPI, Basel, Switzerland. This article is an open access article distributed under the terms and conditions of the Creative Commons Attribution (CC BY) license (https://creativecommons.org/licenses/by/4.0/).