Abstract
Vegetation in ecologically sensitive regions has experienced significant alterations due to global climate change. The underlying mechanisms remain somewhat obscure owing to the spatial heterogeneity of influencing factors, particularly in the Tarim River Basin (TRB) in China. Therefore, this study targets the TRB, analyzing the spatial and temporal dynamics of vegetation greenness and its climatic determinants across multiple spatial scales. Utilizing Normalized Difference Vegetation Index (NDVI) data, vegetation greenness trends over the past 23 years were assessed, with future projections based on the Hurst exponent. Partial correlation and multiple linear regression analyses were employed to correlate NDVI with temperature (TMP), precipitation (PRE), and potential evapotranspiration (PET), elucidating NDVI’s response to climatic variations. Results revealed that from 2000 to 2022, 90.1% of the TRB exhibited an increase in NDVI, with a significant overall trend of 0.032/decade (p < 0.01). The difference in NDVI change across sub-basins and vegetation types highlighted the spatial disparity in greening. Notable greening predominantly occurred near rivers at lower elevations and in extensive cropland areas, with projections indicating continued greening in some regions. Conversely, future trends mainly suggested a shift towards browning, particularly in higher-elevation areas with minimal human influence. From 2000 to 2022, the TRB experienced a gradual increase in TMP, PRE, and PET. The latter two factors were significantly correlated with NDVI, indicating their substantial role in greening. However, vegetation sensitivity to climate change varied across sub-basins, vegetation types, and elevations, likely due to differences in plant characteristics, hydrothermal conditions, and human disturbances. Despite climate change influencing vegetation dynamics in 51.5% of the TRB, its impact accounted for only 25% of the total NDVI trend. These findings enhance the understanding of vegetation ecosystems in arid regions and provide a scientific basis for developing ecological protection strategies in the TRB.
1. Introduction
Vegetation significantly influences terrestrial ecosystems [1], particularly in ecologically fragile regions, by delivering critical services such as soil and water conservation, climate regulation, and biodiversity maintenance [2,3,4]. In recent decades, terrestrial vegetation has experienced substantial alterations driven by natural (e.g., climate variability) and anthropogenic (e.g., reforestation and land reclamation) factors [3,5,6], profoundly impacting regional energy cycles [1], biogeochemical cycles [7], and socio-economic development [8]. Analyzing the spatial and temporal changes in vegetation cover and their drivers is essential for comprehending the intricate interactions within terrestrial ecosystems.
The Normalized Difference Vegetation Index (NDVI), derived from satellite data, reliably measures vegetation attributes, including greenness, coverage, and growth status [3,9,10]. Research employing NDVI data have examined the impact of factors such as climate change, human activities, and natural disasters on vegetation greenness, emphasizing the substantial influence of climate change on a large scale [5,11,12]. Tucker et al. [13] observed a rise in vegetation greenness in the Northern Hemisphere’s mid- and high latitudes from 1982 to 1999, correlating closely with global warming. Jin et al. [11] identified a springtime temperature (TMP) increase as the primary climatic factor influencing China’s greening from 1982 to 2015. In contrast, Fensholt et al. [14] attributed vegetation greening in semi-arid regions globally from 1981 to 2007 to variations in precipitation (PRE). Yang et al. [15] noted that while maximum TMP was a determinant of NDVI changes in northwestern Ethiopia, PRE played a critical role in the southeastern region. He et al. [16] demonstrated that potential evapotranspiration (PET) governed NDVI fluctuations in 40.29% of the world’s drylands. Shi et al. [17] reported a predominantly positive correlation between PET and NDVI in the northeastern Loess Plateau, whereas a negative correlation was observed in the southwestern area. Research indicates substantial spatial variability in vegetation’s climatic responses, emphasizing the necessity for analyses at different spatial scales to comprehensively understand the impacts of climate change on vegetation greenness across various regions [12,18,19].
A multitude of methodologies have been utilized to examine the impact of climate change on vegetation dynamics [11,12,20]. Jin et al. [11] employed correlation analysis between NDVI and TMP, as well as PRE, to assess vegetation responses to climatic variations. He et al. [16] utilized partial correlation analysis involving NDVI, TMP, PRE, and PET to identify the drivers of vegetation dynamics. Additionally, quantitative methods, including multiple linear regression models [21], random forest models [10], the geographical detector method [22], and gray relational degree analysis [23], have been applied to evaluate the effects of various factors on vegetation changes. Notably, the multiple linear regression model has demonstrated efficacy in correlating NDVI with climatic variables and quantifying climate change’s influence on vegetation dynamics across diverse spatial and temporal scales [5,17,24].
Situated in Central Asia, the Tarim River, China’s largest inland river, serves as a central element of the Silk Road Economic Belt initiative. The Tarim River Basin (TRB) boasts abundant natural resources yet faces a highly delicate ecological balance [19]. Maintaining robust vegetation cover is vital for the stability of the ecosystem and socio-economic progress in this region. Over recent decades, the TRB has experienced significant changes in vegetation and landscape patterns due to climate change and human activities [25,26]. Despite extensive research on vegetation changes and their drivers in the TRB, the most recent and prospective vegetation dynamics, especially their responses to climate change across different areas, remain ambiguous [19]. This ambiguity arises because the vegetation’s response to climate change varies significantly across different vegetation types, elevations, and climatic conditions [11,20]. Therefore, it is imperative to investigate the driving mechanisms of vegetation dynamics within the TRB at various spatial scales and regions.
Thus, this study aimed to analyze the spatial and temporal dynamics of vegetation greenness and its response to climate change in the TRB, accounting for various spatial scales, vegetation types, and elevations. Vegetation greenness changes from 2000 to 2022 were examined, and future trends were forecasted using NDVI data. Climate change characteristics were then analyzed using TMP, PRE, and PET data. The impact of climate change on NDVI was assessed through partial correlation analysis and multiple linear regression models, with studies conducted at basin-wide, sub-basin, and pixel levels to identify differences across vegetation types and elevations. These results substantially enhance the understanding of TRB’s ecosystem evolution in China and provide a theoretical foundation for ecological and environmental protection strategies in arid regions.
2. Materials and Methods
2.1. Study Area
The TRB, encompassing approximately 1 million km2, is located in northwestern China, bounded by the Tianshan and Kunlun Mountains. This region’s geography features a central area of low elevation, surrounded by high-relief terrain. The TRB is characterized by a unique and fragile ecological environment, acting as a vital ecological barrier in western China. The basin’s average annual temperature is 10.6 °C, with an annual precipitation of about 89.1 mm. The annual surface runoff reaches approximately 39.8 billion m3, primarily originating from glacial snowmelt and precipitation [19]. The TRB encompasses two deserts and nine sub-basins, with predominant coverage by grasslands and croplands (Figure 1b), interspersed with extensive non-vegetated areas such as deserts and snowy mountains. Analysis of the mean annual NDVI from 2000 to 2022 indicated higher vegetation greenness in the basin’s northern regions. This study concentrated on the vegetated zones within nine specific sub-basins: Weigan River Basin (B1), Kaidu River Basin (B2), Mainstream of Tarim River (B3), Qarqan River Basin (B4), Keriya River Basin (B5), Hotan River Basin (B6), Yarkand River Basin (B7), Kaxgar River Basin (B8), and Aksu River Basin (B9).
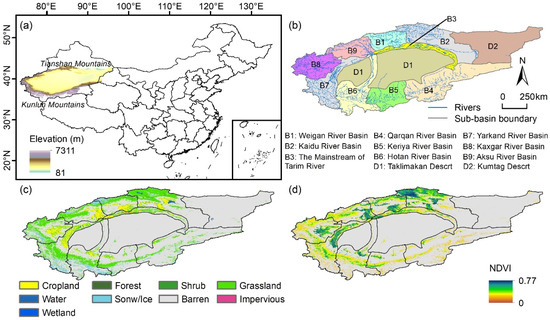
Figure 1.
Geographic location of (a) the Tarim River Basin (TRB) and (b) its sub-basins and spatial distribution of (c) land use types and (d) mean annual growing season NDVI. Gray areas shown in (c,d) indicate the non-vegetated areas, which are not considered in this study.
2.2. Data Sources and Preprocessing
2.2.1. Land Cover Data
To identify vegetated areas and various land cover types, this study employed the 30 m annual land cover dataset for China, developed by Yang and Huang (2021), with an accuracy of 79.31% [27] and extensively utilized in previous research [28,29]. This dataset classified land cover into nine categories: cropland, forest, shrub, grassland, water, snow and ice, barren, impervious surfaces, and wetland. For this analysis, vegetated areas encompassed croplands, grasslands, forests, shrubs, and wetlands during 2000, 2005, 2010, 2015, and 2020. These areas represent approximately 23.5% of the TRB, predominantly situated in the northern, western, and southern regions of this study area (Figure 1b). Within these vegetated areas, croplands, grasslands, and other vegetation types (including forest, shrub, and wetland) constituted 20.7%, 78.4%, and 0.9%, respectively.
2.2.2. Normalized Difference Vegetation Index Data
This research utilized the “China regional 250 m NDVI dataset (2000–2022)” from the National Tibetan Plateau Data Center (http://data.tpdc.ac.cn, accessed on 1 December 2023). This dataset comprises monthly NDVI values with a 250 m resolution. To ensure data integrity, the NDVI dataset was refined to eliminate contaminated pixels and gaps by employing land use and MODIS NDVI products (MOD13Q1). The refinement process involved the initial reconstruction of noise pixels with similar features, the application of the Savitzky-Golay filter for long sequence images, monthly synthesis, and stitching [30]. The growing season NDVI, defined as the mean of monthly NDVI values from May to October, was used to evaluate vegetation greenness in the TRB and its nine sub-basins. This seasonal framework was established following the methodology by Piao et al. [31], with detailed procedures available in Supplementary Materials S1. Furthermore, NDVI variations for croplands and grasslands were examined, given their dominance in this study area. NDVI changes in other vegetation types, covering smaller areas, were excluded due to the coarse spatial resolution of the NDVI data.
2.2.3. Climate Data
Climatic variables, including TMP, PRE, and PET, have been identified as primary drivers of vegetation change in the TRB [16], as determined from climatic characteristics and prior research. PET, calculated using the Penman-Monteith equation, serves as an indicator of maximum evapotranspiration under optimal water conditions [32], incorporating the influences of solar radiation, wind speed, temperature, and humidity on drought conditions and vegetation water demand. Monthly data for these climate variables, spanning from 2000 to 2022 at a 1 km spatial resolution, were obtained from the National Earth System Science Data Center, National Science and Technology Infrastructure of China (http://www.geodata.cn, accessed on 1 December 2023). To maintain consistency with the spatial and temporal scales of the NDVI data, these climatic data were resampled to 250 m, and their growing season mean values were calculated annually.
2.3. Methods
2.3.1. Trend Analysis
The trend rates of the growing season’s NDVI and climate variables from 2000 to 2022 were examined through linear regression, a common analytical approach for NDVI trends [16,19,33]. The formula for determining the NDVI change rate was as follows:
where the slope denoted the rate of NDVI change during the growing season, with NDVIi representing the NDVI value for year i. The duration of this study period, denoted by n, spanned 23 years, and i, ranging from 1 to n, served as the time variable. A positive slope indicated an upward trend in NDVI, signifying a greening trend from 2000 to 2022, while a negative slope indicated a downward trend, reflecting a browning trend.
2.3.2. Hurst Exponent
The Hurst exponent was employed to forecast future NDVI trends in regions exhibiting a significant historical NDVI trend (p < 0.05), utilizing the rescaled range (R/S) analysis method introduced by Hurst in 1951 [34]. This technique has been extensively applied across ecology, hydrology, climatology, and economics [35,36,37], with its formula provided in Supplementary Materials S2 [20]. The Hurst exponent, represented as H and ranging between 0 and 1, serves as a predictor for NDVI trends. An H value of 0.5 indicated an uncertain future NDVI trend. An H value below 0.5 signified a reversal in future NDVI trends compared to past trends, indicating unsustainable changes in NDVI. Conversely, an H value above 0.5 suggested consistent trends between past and future NDVI, reflecting sustainable changes. Future growing season NDVI trends were classified into four categories (Table 1). The “increase-decrease” category indicated an NDVI increase in the past but a projected decrease in the future, while “decrease-increase” represented the opposite trend. The “continuous increase” category denoted a sustained and expected increase in NDVI, whereas “continuous decrease” signified a sustained and expected decline.

Table 1.
Classification of the trends in past and future NDVI.
2.3.3. Partial Correlation Analysis
Partial correlation analysis was employed in this study to isolate and investigate the relationships between growing season NDVI and TMP, PRE, and PET. This method effectively examined the relationship between two variables by controlling for the influence of additional variables [6,24,38]. The calculation formulas were as follows:
where Ryj,ck denoted the partial correlation coefficient between variables y and j, adjusted for variables c and k. Ryj,c represented the partial correlation between y and j, adjusted for c. Similarly, Ryk,c and Rjk,c denoted partial correlations for y and k, and j and k, respectively. Ryj was the correlation coefficient between y and j. Yearly values of y and j were represented by yi and ji, with and being their respective averages over this study period. Ryc and Rjc were akin to Ryj but pertain to variables y and c, and j and c, respectively. A positive Ryj,ck indicated a positive correlation between y and j, whereas a negative Ryj,ck indicated a negative correlation.
The significance of the partial correlation coefficients was tested using a t-test, calculated as follows:
where Ryj,ck were the partial correlation coefficients; n was the sample size, set at 23 for this study; and m was the number of independent variables.
2.3.4. Multiple Linear Regression Analysis
A multiple linear regression model was employed to examine the relationship between the growing season’s NDVI and climatic factors, thereby assessing the cumulative impact of climate change on vegetation greenness [39,40]. This approach is extensively used to quantify the influence of various factors on vegetation dynamics [5,11,40]. Given that PET encompasses temperature, wind, and solar radiation data [16], the model incorporated PRE and PET as independent variables [17,41]. The resulting regression equation was as follows:
where NDVIpre denotes the predicted NDVI value, with its rate of change reflecting the impact of climate change on NDVI. The coefficients a, b, and c represented the model’s parameters, while ε signified the random error. PRE and PET refer to the average precipitation and potential evapotranspiration during the growing season, respectively. The F-test was employed to assess the significance of the regression model, categorizing the significance levels as highly significant (p < 0.01), significant (p < 0.05), and not significant (p ≥ 0.05). The contribution of climate change to NDVI variation was calculated by dividing the predicted NDVI trend by the observed NDVI trend [11,17].
3. Results
3.1. Spatial and Temporal Changes in Vegetation Greenness
3.1.1. Observed Changes in Growing Season NDVI from 2000 to 2022
From 2000 to 2022, the TRB exhibited notable greening at a regional level, with the NDVI increasing at a rate of 0.032/decade (p < 0.01) (Figure 2). Initially, NDVI showed a gradual rise from 2000 to 2008, followed by a sharp increase between 2009 and 2017, before stabilizing post-2017 (Figure 3). Throughout this study period, significant NDVI increases were also observed across the nine sub-basins within the TRB, with trends varying from 0.019/decade in Basin 4 (B4) to 0.045/decade in Basin 1 (B1) (Figure 2). Additionally, cropland and grassland exhibited marked NDVI growth (p < 0.01), with trend rates of 0.049/decade and 0.032/decade, respectively (Figure 3).
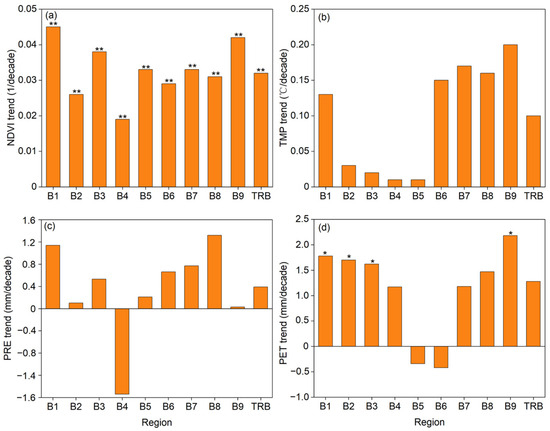
Figure 2.
Change trends of the regional averaged (a) NDVI, (b) temperature (TMP), (c) precipitation (PRE), and (d) potential evapotranspiration (PET) during the growing season across the nine sub-basins of the Tarim River Basin (TRB) from 2000 to 2022. Single and double asterisks indicated that the change trends were significant at the 0.05 and 0.01 levels, respectively. B1–9 denoted sub-basins, with their full names listed in Figure 1.
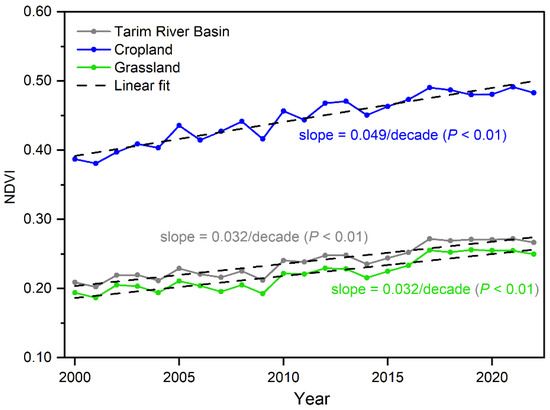
Figure 3.
Interannual variability of the regional averaged NDVI during the growing season in the Tarim River Basin (TRB) and different vegetation types from 2000 to 2022.
At the pixel scale, approximately 90.1% of this study area (Figure 4) exhibited an upward NDVI trend. Notably, 69.7% of the area experienced a significant increase, while only 2.8% showed a decline. Rapid NDVI increases (change rate > 0.04/decade) predominantly occurred in lower-elevation regions near rivers, whereas slower increases (0 < change rate ≤ 0.02/decade) were more prevalent in higher-elevation areas around the basin. NDVI declines were primarily observed in the northern parts of basin B2 and scattered areas within basins B3, B7, and B8.
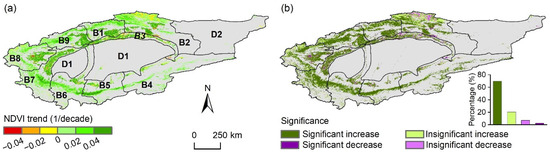
Figure 4.
Spatial distribution of (a) the trend in the growing season NDVI and (b) the corresponding significance levels in the Tarim River Basin (TRB) from 2000 to 2022. The meanings of B1–B9 and D1–D2 are the same as those listed in Figure 1. Gray areas indicate the non-vegetated areas, which are not considered in this study.
3.1.2. Prediction of Growing Seasonal NDVI Changes in the Future
Figure 5a revealed that 36.3% of this study area was expected to maintain the historical NDVI trend, primarily in basins B1, B2, B3, and B8. Conversely, the remaining regions may experience a reversal in the NDVI trend. Specifically, 44.3% of the area, mainly in mountainous regions (Figure 5b), was likely to shift from an increasing to a decreasing NDVI trend. Regions with a continuous increase in NDVI, located in the lower elevation zones of northern TRB, comprised 25.4% of this study area. Less than 3% of the area was anticipated to exhibit either a decrease-increase pattern or a continuous decrease in NDVI, suggesting that future browning trends may surpass greening trends, particularly in the higher-elevation areas surrounding the basin.
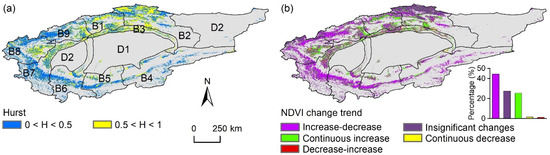
Figure 5.
Spatial distribution of (a) the Hurst exponent of the growing season NDVI time series in the Tarim River Basin (TRB) from 2000 to 2022 and (b) the change trend of NDVI from past to future. The meanings of B1–B9 and D1–D2 were the same as those listed in Figure 1. Gray areas indicate the non-vegetated areas, which are not considered in this study.
3.2. Spatial and Temporal Change in Climatic Factors
Figure 2 illustrates that the growing season TMP, PRE, and PET in the TRB region exhibited a non-significant increasing trend (p ≥ 0.05) during this study period. TMP and PRE changes across all sub-basins were insignificant, with TMP trends ranging from 0.01 °C/decade (B5) to 0.20 °C/decade (B9). Despite B4 showing a decrease in PRE (−1.54 mm/decade), other sub-basins indicated an upward trend. Sub-basins B1, B2, B3, and B9 experienced a significant increase in PET (p < 0.05), whereas other sub-basins showed insignificant changes.
At the pixel level, TMP, PRE, and PET variations during the growing season exhibited substantial spatial heterogeneity within this study area (Figure 6). An increase in TMP was observed in approximately 72.4% of the area, with a significant rise (p < 0.05) in only 12.6%, primarily located in the northwestern and southwestern TRB (Figure 6a,b). In contrast, regions with decreasing TMP trends were mainly in the eastern TRB. Similarly, 70.4% of the area showed an upward trend in PRE, but a significant increase was observed in only 5.3%, chiefly in the southwestern TRB (Figure 6c,d). Additionally, increasing PET trends were noted in 87.8% of this study area, with over half exhibiting significant trends (Figure 6e,f). Overall, the TRB has experienced a general trend of warming and wetting.
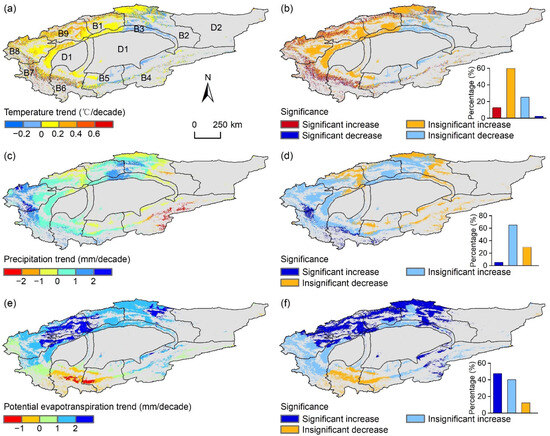
Figure 6.
Spatial distribution of change rates for growing season temperature (TMP), precipitation (PRE), and potential evapotranspiration (PET) (left column), along with their significance levels (right column), in the Tarim River Basin (TRB) from 2000 to 2022. Panels (a,b) depict TMP; panels (c,d) show PRE; and panels (e,f) present PET. The designations B1–B9 and D1–D2 correspond to those in Figure 1. Gray areas indicate the non-vegetated areas, which are not considered in this study.
3.3. Relationships between Vegetation Greenness and Climatic Factors
Figure 7 indicates an insignificant correlation between growing season NDVI and TMP in TRB from 2000 to 2022 (p ≥ 0.05). However, NDVI exhibited a significant positive correlation with both PRE (p < 0.05) and PET (p < 0.05) in TRB. Among the nine sub-basins, NDVI correlations with TMP were significantly negative in B3 and significantly positive in B6 at the 0.05 level, with the remaining sub-basins showing no significant correlation. Positive correlations between NDVI and PRE were observed across all sub-basins, with significant correlations (p < 0.05 or 0.01) in B1, B3, B6, B7, B8, and B9. Additionally, NDVI displayed a significant positive correlation with PET in B1, B2, B3, B8, and B9, while a significant negative correlation was noted in B6. For cropland and grassland, NDVI had an insignificant negative correlation with TMP but showed a significant positive correlation with both PRE and PET.
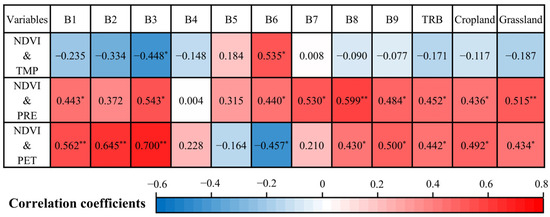
Figure 7.
Partial correlation coefficients between growing season NDVI and temperature (TMP), precipitation (PRE), and potential evapotranspiration (PET) in the Tarim River Basin (TRB), including nine sub-basins and various vegetation types from 2000 to 2022. Single and double asterisks denote significant correlations at the 0.05 and 0.01 levels, respectively. The labels B1–9 correspond to those defined in Figure 1.
Approximately 14.3% of this study area demonstrated a significant negative correlation between NDVI and TMP (p < 0.05), predominantly in the eastern TRB (Figure 8a). Conversely, 22.0% of the area showed a positive correlation between NDVI and TMP, though most correlations were insignificant (p ≥ 0.05). Positive correlations between NDVI and PRE (Figure 8b) and NDVI and PET (Figure 8c) were observed in 82.8% and 66.4% of this study area, respectively. Significant positive correlations between NDVI and PRE, covering 21.2% of the area, were scattered across the region, while those between NDVI and PET, accounting for 19.7%, were mainly concentrated in the northern TRB. These coefficients showed elevation-dependent variations (Figure 8d): correlations between NDVI and PRE increased initially but rapidly decreased with elevation, whereas correlations between NDVI and PET initially decreased and then increased.
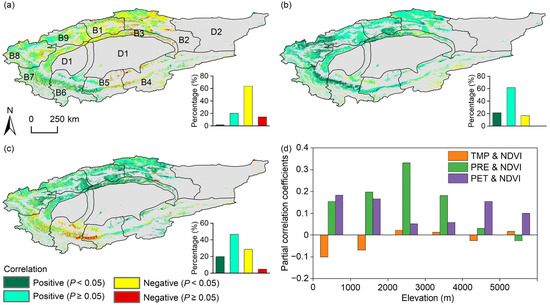
Figure 8.
Spatial distribution of partial correlation coefficients between growing season NDVI and (a) temperature (TMP), (b) precipitation (PRE), and (c) potential evapotranspiration (PET) in the Tarim River Basin (TRB), alongside (d) the average coefficients in different elevation ranges. The sub-basins B1–B9 and D1–D2 correspond to those listed in Figure 1. Gray areas indicate the non-vegetated areas, which are not considered in this study.
3.4. Effects of Climate Change on Vegetation Dynamics
The impact of climate change on the NDVI trend from 2000 to 2022 in TRB was estimated at 0.008/decade, representing 25% of the overall NDVI trend (Table 2). Sub-basin B9 exhibited the highest climate change impact on the NDVI trend (0.017/decade), accounting for 40% of the total trend, while B4 and B5 showed no impact. For cropland and grassland, the effects were 0.017/decade and 0.009/decade, with climatic contributions of 35% and 28%, respectively. Although positive climatic effects on NDVI changes were observed in 80.5% of this study area, they were generally minor (less than 0.01/decade) (Figure 9a). Significant climate-driven NDVI changes affected 51.5% of this study area, predominantly in the southwest TRB (Figure 9b), while nearly half of this study area, mainly in the north TRB, showed insignificant climatic effects on NDVI changes.
Table 2.
Effects of climate change on the trend of the regional averaged NDVI during the growing season in the Tarim River Basin (TRB), nine sub-basins, and different vegetation types from 2000 to 2022.
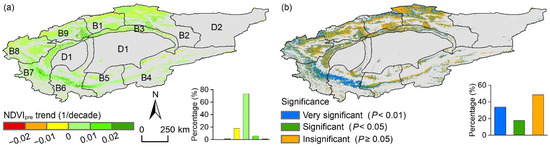
Figure 9.
Spatial distribution of (a) climate change effects on NDVI trends and (b) the significance levels of the multiple linear regression equation between NDVI and climatic factors in the Tarim River Basin from 2000 to 2022. The designations B1–B9 and D1–D2 correspond to those listed in Figure 1. Gray areas indicate the non-vegetated areas, which are not considered in this study.
4. Discussion
This research identified a significant greening trend across most TRB regions from 2000 to 2022 (Figure 4), consistent with previous studies [25,26]. Despite the gradual increase in PRE during this study period, it exhibited a significant positive correlation with NDVI (Figure 2c and Figure 7). This suggests that the increase in PRE has contributed to the observed greening. In the TRB, characterized by a temperate, arid continental climate, limited water resources frequently hinder vegetation growth [19]. PRE is a vital water source in the TRB, with its fluctuations significantly influencing vegetation by altering biophysical and chemical processes [16,42]. For instance, increased PRE enhances water availability for vegetation through infiltration and root uptake [43]. It also affects vegetation by regulating soil nutrition and plant biodiversity [44]. Additionally, increased early-growing season PRE is crucial for vegetation growth in later stages [45]. Pixel-scale partial correlation analysis revealed that NDVI’s sensitivity to PRE varies with elevation, initially increasing and then decreasing (Figure 8d). Croplands, primarily situated in the lower regions of TRB (Figure 1c) and heavily influenced by human activities such as irrigation and fertilization, exhibit reduced sensitivity to PRE. At higher elevations, where vegetation transitions to alpine meadows and steppes [46], the effects of climate change become more pronounced, diminishing the impact of human activities [26]. Additionally, Chen et al. [47] demonstrated that vegetation’s PRE use efficiency initially increases and then decreases with rising elevation, suggesting greater sensitivity to PRE changes at mid-elevations. These observations align with our study on the variation in NDVI sensitivity to PRE with elevation.
PET emerged as a significant factor influencing NDVI changes in the TRB (Figure 7). According to Niu et al. [48], the rise in PET over recent decades is primarily attributed to increased sunshine duration in the TRB. Sunshine duration, a crucial component of solar radiation, provides additional energy for vegetation photosynthesis, thereby enhancing NDVI [49]. Additionally, the sensitivity of NDVI to PET was found to be greater than that of TMP in most TRB sub-basins (Figure 7). Conversely, Yao et al. reported that TMP had a more substantial impact on global dryland vegetation from 2000 to 2014 compared to PET [50]. This discrepancy can be explained by differences in study periods and regions [16], as well as by the fact that PET is a more comprehensive environmental factor, encapsulating drought conditions and vegetation water demand more effectively than TMP.
This research identified no significant impact of TMP changes on NDVI in the TRB, consistent with Liu et al. [33] but diverging from Wang et al. [38]. Wang et al. [38] reported a significant positive correlation between NDVI and TMP from 1982 to 2006 in the TRB, whereas Liu et al. [33] noted a shift from positive to negative correlation during 1982–2015, attributing this to warming’s effect on soil moisture. These discrepancies suggest that differing study periods in the same region can produce varied results due to climatic and environmental changes. At the sub-basin level, B3 exhibited significant negative correlations between NDVI and TMP, while B6 showed significant positive correlations (Figure 7). These specific outcomes can be linked to varying local conditions. B3, characterized by lower elevations, experiences higher temperatures, and is primarily covered by desert steppe and cropland (Figure 1c and Figure S2a). Elevated temperatures may accelerate the formation of soil dry layers and exacerbate water scarcity, negatively impacting vegetation growth in B3 [35,51,52]. In contrast, vegetated regions in B6, predominantly consisting of alpine and sub-alpine meadows and steppes, are located at higher elevations with cooler temperatures (Figure S2a and Figure 1c). Warming in these areas can enhance glacier melt and river runoff [51], as well as promote the release of soil organic matter and nutrients [19], thereby fostering greening in B6. Pixel-scale analyses further corroborated the relationship between temperature and vegetation greenness across varying elevations (Figure 8d), consistent with Liu et al.’s findings on China’s grasslands [37]. Another study in southwest China also observed an elevation-dependence of vegetation sensitivity to TMP [53]. From a plant ecology perspective, this elevation-dependence relates to the gradients of ecosystem properties associated with elevation. For example, at higher elevations, community-level vegetation adapts to harsh environments by enriching foliar nitrogen and enhancing photosynthetic capacity [54].
Climate change has exerted a limited influence on NDVI variations in the TRB (Table 2). Regions with an insignificant climatic effect on the NDVI change were mainly distributed in the north TRB (Figure 9b). Northern TRB regions, exhibiting minimal climatic effects on NDVI changes, have benefited from enhanced ecosystem resilience due to ecological water transfer projects, river management, and natural vegetation conservation efforts [55,56]. Additionally, advancements in agricultural practices have notably impacted cropland vegetation dynamics [11], suggesting that human activities might mitigate climate influence in these areas [57]. In contrast, significant climatic impacts on NDVI changes were predominantly observed in the southwestern TRB (Figure 9b), an area characterized by higher elevations and minimal human interference. This indicates that vegetation’s response to climate change varies across regions, influenced by the spatial distribution of vegetation types, hydrothermal conditions, and human activity levels [18,57,58].
The response of vegetation to climatic factors suggests that the spatial heterogeneity of the geographical environment must be integrated into vegetation ecosystem management. In particular, high-elevation areas where vegetation is sensitive to TMP may face an increased risk of drought stress due to ongoing global warming. The observed increase in NDVI over the past decades in these regions is expected to shift to a declining trend in the future (Figure 5). This prediction is consistent with projections that global warming could heighten vegetation’s drought stress by enhancing surface evapotranspiration [59,60,61,62]. Furthermore, excessive vegetation restoration might reduce runoff and exacerbate soil drying in the TRB, potentially leading to browning in the future [21,62]. Regions anticipated to experience continued NDVI increases are primarily situated in the northern TRB, where croplands dominate (Figure 5b). Human activities, such as agricultural management and ecological protection, in these areas can sustain the soil moisture and nutrients essential for vegetation growth, indicating potential for future greening [55]. Therefore, it is essential to implement appropriate land development and vegetation management strategies, taking into account the demographic, geographic, and climatic characteristics of different regions, as well as future climate change projections.
Water deficits significantly influence vegetation activity in arid regions. This study focused on TMP, PRE, and PET as primary climatic factors to analyze vegetation’s response to climate change in the TRB. However, local vegetation growth may also be affected by other environmental factors, including solar radiation, wind speed, soil moisture, runoff, slope aspect, and snow cover [3,23,49]. Furthermore, vegetation growth responses to climate change often exhibit time lags [5], which were not considered in this study. Incorporating the time-lag effects of climate into the analysis of vegetation variation can enhance the explanatory power of climate factors [24]. However, due to the coarse temporal resolution of some vegetation indices, short lag times might not be detected, as observed in the TRB [57]. Additionally, the methods employed in this study for analyzing change trends and quantifying climatic effects on NDVI trends may contain uncertainties due to the noise in the NDVI series and the non-linear relationships between climate factors and NDVI [16]. Future research should explore the drivers of vegetation variation in the TRB more comprehensively by considering additional influencing factors, including time-lag effects, and utilizing more robust methods such as Theil-Sen, Mann-Kendall, and machine learning.
5. Conclusions
This research analyzed growing season NDVI, TMP, PRE, and PET data from 2000 to 2022 to investigate the spatial and temporal dynamics of vegetation greenness in response to climate change in the TRB across various spatial scales. The TRB exhibited significant greening, with an NDVI change rate of 0.032/decade (p < 0.01). Although significant NDVI increases were observed in the nine selected sub-basins and two vegetation types, considerable regional differences highlighted the varied degrees of greening across the area. Rapid greening predominantly occurred along rivers, characterized by lower elevations and prevalent croplands. Partial correlation analyses indicated that increased PRE is the primary climatic driver of greening in the TRB, while increased TMP generally exerted an insignificant negative effect. At the pixel level, vegetation sensitivity to PRE was notably high in middle-elevation regions. This elevation-dependence of vegetation sensitivity to climate factors may be associated with the distribution of vegetation types, hydrothermal conditions, and human disturbance intensities. While climate change significantly affected vegetation growth in 51.5% of this study area, climatic factors accounted for only 25% of the overall NDVI trend in the TRB. Projections indicate that the TRB will likely experience increased browning in the future, particularly at higher elevations, aligning with predictions of heightened drought risk due to ongoing climate warming. These insights into the evolution of vegetation ecosystems in arid regions can inform future ecological protection and land development strategies in the TRB.
Supplementary Materials
The following supporting information can be downloaded at: https://www.mdpi.com/article/10.3390/ijgi13090304/s1; Figure S1. Seasonal curves in the multi-year averaged monthly normalized difference vegetation index (NDVI) and temperature for the vegetation cover region of the Tarim River Basin from 2000 to 2022; Figure S2: Spatial distribution of the mean annual growing season (a) temperature, (b) precipitation, and (c) potential evapotranspiration in the Tarim River Basin during 2000–2022.
Author Contributions
All authors contributed to this research’s conception and design. Kai Jin and Yansong Jin conducted material preparation, data collection, and analysis. They also drafted the initial manuscript, which Cuijin Li revised. Lin Li handled visualization, data curation, and editing. All authors have read and agreed to the published version of the manuscript.
Funding
This research was funded by the key R&D Project of Xinjiang Uygur Autonomous Region, grant number 2022B03024-2, the Qingdao Agricultural University Horizontal Project, grant number 660/2422724, and the High-level Talents Foundation of Qingdao Agricultural University, grant number 665/1120041.
Data Availability Statement
The datasets generated and analyzed during this study can be obtained from the corresponding author upon reasonable request.
Acknowledgments
We thank the National Tibetan Plateau Data Center for providing the NDVI data, the National Earth System Science Data Center, National Science and Technology Infrastructure of China for providing the climate data, and the three anonymous reviewers for their valuable comments on this study.
Conflicts of Interest
The authors declare no known competing financial interests or personal relationships that could influence the work reported in this paper.
References
- Migliavacca, M.; Musavi, T.; Mahecha, M.D.; Nelson, J.A.; Knauer, J.; Baldocchi, D.D.; Perez-Priego, O.; Christiansen, R.; Peters, J.; Anderson, K.; et al. The three major axes of terrestrial ecosystem function. Nature 2021, 598, 468–472. [Google Scholar] [CrossRef]
- Feyisa, G.L.; Dons, K.; Meilby, H. Efficiency of parks in mitigating urban heat island effect: An example from Addis Ababa. Landsc. Urban Plan. 2014, 123, 87–95. [Google Scholar] [CrossRef]
- Piao, S.; Wang, X.; Park, T.; Chen, C.; Lian, X.; He, Y.; Bjerke, J.W.; Chen, A.; Ciais, P.; Tømmervik, H.; et al. Characteristics, drivers and feedbacks of global greening. Nat. Rev. Earth Environ. 2020, 1, 14–27. [Google Scholar] [CrossRef]
- White, J.G.; Sparrius, J.; Robinson, T.; Hale, S.; Lupone, L.; Healey, T.; Cooke, R.; Rendal, A.R. Can NDVI identify drought refugia for mammals and birds in mesic landscapes? Sci. Total Environ. 2022, 851, 158318. [Google Scholar] [CrossRef]
- Wu, D.; Zhao, X.; Liang, S.; Zhou, T.; Huang, K.; Tang, B.; Zhao, W. Time-lag effects of global vegetation responses to climate change. Glob. Chang. Biol. 2015, 21, 3520–3531. [Google Scholar] [CrossRef]
- Linscheid, N.; Estupinan-Suarez, L.M.; Brenning, A.; Carvalhais, N.; Cremer, F.; Gans, F.; Rammig, A.; Reichstein, M.; Sierra, C.A.; Mahecha, M.D. Towards a global understanding of vegetation-climate dynamics at multiple timescales. Biogeosciences 2020, 17, 945–962. [Google Scholar] [CrossRef]
- Yuan, Z.Y.; Chen, H.Y.H. Decoupling of nitrogen and phosphorus in terrestrial plants associated with global changes. Nat. Clim. Chang. 2015, 5, 465–469. [Google Scholar] [CrossRef]
- Richards, D.R.; Belcher, R.N.; Carrasco, L.R.; Edwards, P.J.; Fatichi, S.; Hamel, P.; Masoudi, M.; McDonnell, M.J.; Peleg, N.; Stanley, M.C. Global variation in contributions to human well-being from urban vegetation ecosystem services. One Earth 2022, 5, 522–533. [Google Scholar] [CrossRef]
- Shen, Q.; Ma, Y. Did water diversion projects lead to sustainable ecological restoration in arid endorheic basins? Lessons from long-term changes of multiple ecosystem indicators in the lower Heihe River Basin. Sci. Total Environ. 2020, 701, 134785. [Google Scholar] [CrossRef]
- Liu, X.; Zhao, W.; Yao, Y.; Pereira, P. The rising human footprint in the Tibetan Plateau threatens the effectiveness of ecological restoration on vegetation growth. J. Environ. Manag. 2024, 351, 119963. [Google Scholar] [CrossRef]
- Jin, K.; Wang, F.; Zong, Q.; Qin, P.; Liu, C.; Wang, S. Spatiotemporal differences in climate change impacts on vegetation cover in China from 1982 to 2015. Environ. Sci. Pollut. Res. 2022, 29, 10263–10276. [Google Scholar] [CrossRef] [PubMed]
- Satti, Z.; Naveed, M.; Shafeeque, M.; Ali, S.; Abdullaev, F.; Ashraf, T.M.; Irshad, M.; Li, L. Effects of climate change on vegetation and snow cover area in Gilgit Baltistan using MODIS data. Environ. Sci. Pollut. Res. 2023, 30, 19149–19166. [Google Scholar] [CrossRef]
- Tucker, C.J.; Slayback, D.A.; Pinzon, J.E.; Los, S.O.; Myneni, R.B.; Taylor, M.G. Higher northern latitude normalized difference vegetation index and growing season trends from 1982 to 1999. Int. J. Biometeorol. 2001, 45, 184–190. [Google Scholar] [CrossRef] [PubMed]
- Fensholt, R.; Langanke, T.; Rasmussen, K.; Reenberg, A.; Prince, S.D.; Tucker, C.; Scholes, R.J.; Le, Q.B.; Bondeau, A.; Eastman, R.; et al. Greenness in semi-arid areas across the globe 1981–2007—An Earth Observing Satellite based analysis of trends and drivers. Remote Sens. Environ. 2012, 121, 144–158. [Google Scholar] [CrossRef]
- Yang, S.; Song, S.; Li, F.; Yu, M.; Yu, G.; Zhang, Q.; Cui, H.; Wang, R.; Wu, Y. Vegetation coverage changes driven by a combination of climate change and human activities in Ethiopia, 2003–2018. Ecol. Inform. 2022, 71, 101776. [Google Scholar] [CrossRef]
- He, L.; Guo, J.; Yang, W.; Jiang, Q.; Chen, L.; Tang, K. Multifaceted responses of vegetation to average and extreme climate change over global drylands. Sci. Total Environ. 2023, 858, 159942. [Google Scholar] [CrossRef]
- Shi, S.; Yu, J.; Wang, F.; Wang, P.; Zhang, Y.; Jin, K. Quantitative contributions of climate change and human activities to vegetation changes over multiple time scales on the Loess Plateau. Sci. Total Environ. 2021, 755, 142419. [Google Scholar] [CrossRef] [PubMed]
- Jiang, P.; Ding, W.; Yuan, Y.; Ye, W.; Mu, Y. Interannual variability of vegetation sensitivity to climate in China. J. Environ. Manag. 2022, 301, 113768. [Google Scholar] [CrossRef]
- Jiang, N.; Zhang, Q.; Zhang, S.; Zhao, X.; Cheng, H. Spatial and temporal evolutions of vegetation coverage in the Tarim River Basin and their responses to phenology. Catena 2022, 217, 106489. [Google Scholar] [CrossRef]
- Wang, B.; Xu, G.; Li, P.; Li, Z.; Zhang, Y.; Cheng, Y.; Jia, L.; Zhang, J. Vegetation dynamics and their relationships with climatic factors in the Qinling Mountains of China. Ecol. Indic. 2020, 108, 105719. [Google Scholar] [CrossRef]
- Ma, M.; Wang, Q.; Liu, R.; Zhao, Y.; Zhang, D. Effects of climate change and human activities on vegetation coverage change in northern China considering extreme climate and time-lag and -accumulation effects. Sci. Total Environ. 2023, 860, 160527. [Google Scholar] [CrossRef]
- Venkatesh, K.; John, R.; Chen, J.; Xiao, J.; Amirkhiz, R.G.; Giannico, V.; Kussainova, M. Optimal ranges of social-environmental drivers and their impacts on vegetation dynamics in Kazakhstan. Sci. Total Environ. 2022, 847, 157562. [Google Scholar] [CrossRef]
- Liu, Y.; Liu, S.; Sun, Y.; Li, M.; An, Y.; Shi, F. Spatial differentiation of the NPP and NDVI and its influencing factors vary with grassland type on the Qinghai-Tibet Plateau. Environ. Monit. Assess. 2021, 193, 48. [Google Scholar] [CrossRef] [PubMed]
- Jin, K.; Jin, Y.; Wang, F.; Zong, Q. Should time-lag and time-accumulation effects of climate be considered in attribution of vegetation dynamics? Case study of China’s temperate grassland region. Int. J. Biometeorol. 2023, 67, 1213–1223. [Google Scholar] [CrossRef]
- Yao, J.; Hu, W.; Chen, Y.; Huo, W.; Zhao, Y.; Mao, W.; Yang, Q. Hydro-climatic changes and their impacts on vegetation in Xinjiang, Central Asia. Sci. Total Environ. 2019, 660, 724–732. [Google Scholar] [CrossRef] [PubMed]
- Wang, L.C.; Han, H.H.; Zhang, J.; Huang, J.; Gu, X.; Chang, L.; Dong, J.; Long, R.; Wang, Q.; Yang, B. Spatio-temporal evolution of land use and human activity intensity in the Tarim River Basin, Xinjiang. Geol. China 2024, 51, 203–220. (In Chinese) [Google Scholar]
- Yang, J.; Huang, X. The 30 m annual land cover dataset and its dynamics in China from 1990 to 2019. Earth Syst. Sci. Data 2021, 13, 3907–3925. [Google Scholar] [CrossRef]
- Zou, Y.; Chen, W.; Li, S.; Wang, T.; Yu, L.; Xu, M.; Singh, R.P.; Liu, C.-Q. Spatio-temporal changes in vegetation in the last two decades (2001–2020) in the Beijing-Tianjin-Hebei region. Remote Sens. 2022, 14, 3958. [Google Scholar] [CrossRef]
- Li, W.; Cui, Y.; Liu, X.; Deng, C.; Zhang, S. Positive impact of urbanization on vegetation growth has been continuously strengthening in arid regions of China. Environ. Res. Lett. 2023, 18, 124011. [Google Scholar] [CrossRef]
- Gao, J.; Shi, Y.; Zhang, H.; Chen, X.; Zhang, W.; Shen, W.; Xiao, T.; Zhang, Y. China Regional 250 m Normalized Difference Vegetation Index Data Set (2000–2022). National Tibetan Plateau/Third Pole Environment Data Center. 2023. Available online: https://data.tpdc.ac.cn/en/data/10535b0b-8502-4465-bc53-78bcf24387b3 (accessed on 1 December 2023).
- Piao, S.; Fang, J.; Zhou, L.; Ciais, P.; Zhu, B. Variations in satellite-derived phenology in China’s temperate vegetation. Glob. Chang. Biol. 2006, 12, 672–685. [Google Scholar] [CrossRef]
- Wang, T.; Zhang, J.; Sun, F.; Liu, W. Pan evaporation paradox and evaporative demand from the past to the future over China: A review. Wiley Interdiscip. Rev. Water 2017, 4, 1207. [Google Scholar] [CrossRef]
- Liu, X.J.; Lu, D.; Zhao, J.; Du, Z.; Zhang, H. Dynamic State of Desert Vegetation Productivity and Its Relationship with Water-Heat Factors in China. Arid Zone Res. 2019, 36, 459–466. (In Chinese) [Google Scholar]
- Hurst, H.E. Long-Term Storage Capacity of Reservoirs. Trans. Am. Soc. Civ. Eng. 1951, 116, 770–808. [Google Scholar] [CrossRef]
- Jiapaer, G.; Liang, S.L.; Yi, Q.X.; Liu, J. Vegetation dynamics and responses to recent climate change in Xinjiang using leaf area index as an indicator. Ecol. Indic. 2015, 58, 64–76. [Google Scholar]
- Tong, S.; Lai, Q.; Zhang, J.; Bao, Y.; Lusi, A.; Ma, Q.; Li, X.; Zhang, F. Spatiotemporal drought variability on the Mongolian Plateau from1980-2014 based on the SPEI-PM, intensity analysis and Hurst exponent. Sci. Total Environ. 2018, 615, 1557–1565. [Google Scholar] [CrossRef]
- Liu, Y.; Zhang, Z.; Tong, L.; Wang, Q.; Zhou, W.; Wang, Z.; Li, J. Spatiotemporal dynamics of China’s grassland NPP and its driving factors. Chin. J. Ecol. 2020, 39, 349–363. (In Chinese) [Google Scholar]
- Wang, Y.; Shen, Y.; Chen, Y.; Guo, Y. Vegetation dynamics and their response to hydroclimatic factors in the Tarim River Basin, China. Ecohydrology 2013, 6, 927–936. [Google Scholar] [CrossRef]
- Evans, J.; Geerken, R. Discrimination between climate and human-induced dryland degradation. J. Arid Environ. 2004, 57, 535–554. [Google Scholar] [CrossRef]
- Wen, Z.; Wu, S.; Chen, J.; Lü, M. NDVI indicated long-term interannual changes in vegetation activities and their responses to climatic and anthropogenic factors in the Three Gorges Reservoir Region, China. Sci. Total Environ. 2017, 574, 947–959. [Google Scholar] [CrossRef] [PubMed]
- Gong, X.; Du, S.; Li, F.; Ding, Y. Study of mesoscale NDVI prediction models in arid and semiarid regions of China under changing environments. Ecol. Indic. 2021, 131, 108198. [Google Scholar] [CrossRef]
- Wang, Z.Q.; Liu, B.Y.; Zhang, Y. Soil moisture of different vegetation types on the Loess Plateau. J. Geogr. Sci. 2009, 19, 707–718. [Google Scholar] [CrossRef]
- Cheng, Y.; Li, X.; Wang, Y.; Zhan, H.; Yang, W.; Jiang, Q. New measures of deep soil water recharge during the vegetation restoration process in semi-arid regions of northern China. Hydrol. Earth Syst. Sci. 2020, 24, 5875–5890. [Google Scholar] [CrossRef]
- Yu, Y.; Peñuelas, J.; Sardans, J.; Pei, J.; Li, G.; Liu, G.; Ye, J. Water addition but not reduction alters plant biomass–diversity relationship. Glob. Chang. Biol. 2024, 30, e17430. [Google Scholar] [CrossRef] [PubMed]
- Correa-Díaz, A.; Romero-Sánchez, M.E.; Villanueva-Díaz, J. The greening effect characterized by the Normalized Difference Vegetation Index was not coupled with phenological trends and tree growth rates in eight protected mountains of central Mexico. For. Ecol. Manag. 2021, 496, 119402. [Google Scholar] [CrossRef]
- Zhang, L.-X.; Yue, X.; Zhou, D.-C.; Fan, J.-W.; Li, Y.-Z. Impacts of Climate Change and Human Activities on Vegetation Restoration in Typical Grasslands of China. Environ. Sci. 2023, 44, 2694–2703. (In Chinese) [Google Scholar]
- Chen, S.; Zhao, W.W.; Han, Y. Spatio-temporal variation of vegetation precipitation use efficiency and influencing factors in arid and semi-arid areas of China. Acta Ecol. Sin. 2023, 43, 10295–10307. (In Chinese) [Google Scholar]
- Niu, J.; Wang, J.; Cheng, Z.; Wu, F.; Jiang, X. Quantitative climate driving on potential evapotranspiration change from 1961 to 2013 in the main stream of Tarim River. Sci. Technol. Eng. 2023, 23, 3655–3661. (In Chinese) [Google Scholar]
- Wang, H.; Liu, D.; Lin, H.; Montenegro, A.; Zhu, X. NDVI and vegetation phenology dynamics under the influence of sunshine duration on the Tibetan plateau. Int. J. Climatol. 2015, 35, 687–698. [Google Scholar] [CrossRef]
- Yao, J.; Liu, H.; Huang, J.; Gao, Z.; Wang, G.; Li, D.; Yu, H.; Chen, X. Accelerated dryland expansion regulates future variability in dryland gross primary production. Nat. Commun. 2020, 11, 1665. [Google Scholar] [CrossRef]
- Yu, H.; Bian, Z.; Mu, S.; Yuan, J.; Chen, F. Effects of Climate Change on Land Cover Change and Vegetation Dynamics in Xinjiang, China. Int. J. Environ. Res. Public Health 2020, 17, 4865. [Google Scholar] [CrossRef]
- Xue, J.; Wang, Y.; Teng, H.; Wang, N.; Li, D.; Peng, J.; Biswas, A.; Shi, Z. Dynamics of Vegetation Greenness and Its Response to Climate Change in Xinjiang over the Past Two Decades. Remote Sens. 2021, 13, 4063. [Google Scholar] [CrossRef]
- Tao, J.; Xu, T.; Dong, J.; Yu, X.; Jiang, Y.; Zhang, Y.; Huang, K.; Zhu, J.; Dong, J.; Xu, Y.; et al. Elevation-dependent effects of climate change on vegetation greenness in the high mountains of southwest China during 1982–2013. Int. J. Climatol. 2018, 38, 2029–2038. [Google Scholar] [CrossRef]
- Zhou, Y.; Fan, J.; Zhong, H.; Zhang, W. Relationships between altitudinal gradient and plant carbon isotope composition of grassland communities on the Qinghai–Tibet Plateau China. Sci. China Earth Sci. 2013, 56, 311–320. [Google Scholar] [CrossRef]
- Fu, A.; Li, W.; Chen, Y.; Wang, Y.; Hao, H.; Li, Y.; Sun, F.; Zhou, H.; Zhu, C.; Hao, X. The effects of ecological rehabilitation projects on the resilience of an extremely drought-prone desert riparian forest ecosystem in the Tarim River Basin, Xinjiang, China. Sci. Rep. 2021, 11, 18485. [Google Scholar] [CrossRef] [PubMed]
- Jiao, K.; Liu, Z.; Wang, W.; Yu, K.; Mcgrath, M.J.; Xu, W. Carbon cycle responses to climate change across China’s terrestrial ecosystem: Sensitivity and driving process. Sci. Total Environ. 2024, 915, 170053. [Google Scholar] [CrossRef]
- Liu, X.; Xin, L. China’s deserts greening and response to climate variability and human activities. PLoS ONE 2021, 16, e0256462. [Google Scholar] [CrossRef]
- Seddon, A.W.R.; Macias-Fauria, M.; Long, P.R.; Benz, D.; Willis, K.J. Sensitivity of global terrestrial ecosystems to climate variability. Nature 2016, 531, 229–232. [Google Scholar] [CrossRef]
- Huang, J.; Yu, H.; Dai, A.; Wei, Y.; Kang, L. Drylands face potential threat under 2 °C global warming target. Nat. Clim. Chang 2017, 7, 417–422. [Google Scholar] [CrossRef]
- Yuan, Y.; Bao, A.; Jiang, P.; Hamdi, R.; Termonia, P.; De Maeyer, P.; Guo, H.; Zheng, G.; Yu, T.; Prishchepov, A.V. Probabilistic assessment of vegetation vulnerability to drought stress in Central Asia. J. Environ. Manag. 2022, 310, 114504. [Google Scholar] [CrossRef]
- Yu, X.; Zhang, L.; Zhou, T.; Zhang, X. Long-term changes in the effect of drought stress on ecosystems across global drylands. Sci. China-Earth Sci. 2023, 66, 146–160. [Google Scholar] [CrossRef]
- Jin, K.; Wang, F.; Zong, Q.; Qin, P.; Liu, C. Impact of variations in vegetation on surface air temperature change over the Chinese Loess Plateau. Sci. Total Environ. 2020, 716, 136967. [Google Scholar] [CrossRef] [PubMed]
Disclaimer/Publisher’s Note: The statements, opinions and data contained in all publications are solely those of the individual author(s) and contributor(s) and not of MDPI and/or the editor(s). MDPI and/or the editor(s) disclaim responsibility for any injury to people or property resulting from any ideas, methods, instructions or products referred to in the content. |
© 2024 by the authors. Licensee MDPI, Basel, Switzerland. This article is an open access article distributed under the terms and conditions of the Creative Commons Attribution (CC BY) license (https://creativecommons.org/licenses/by/4.0/).