


Landslide Recognition Based on Machine Learning Considering Terrain Feature Fusion

Abstract
:1. Introduction
2. Materials and Data
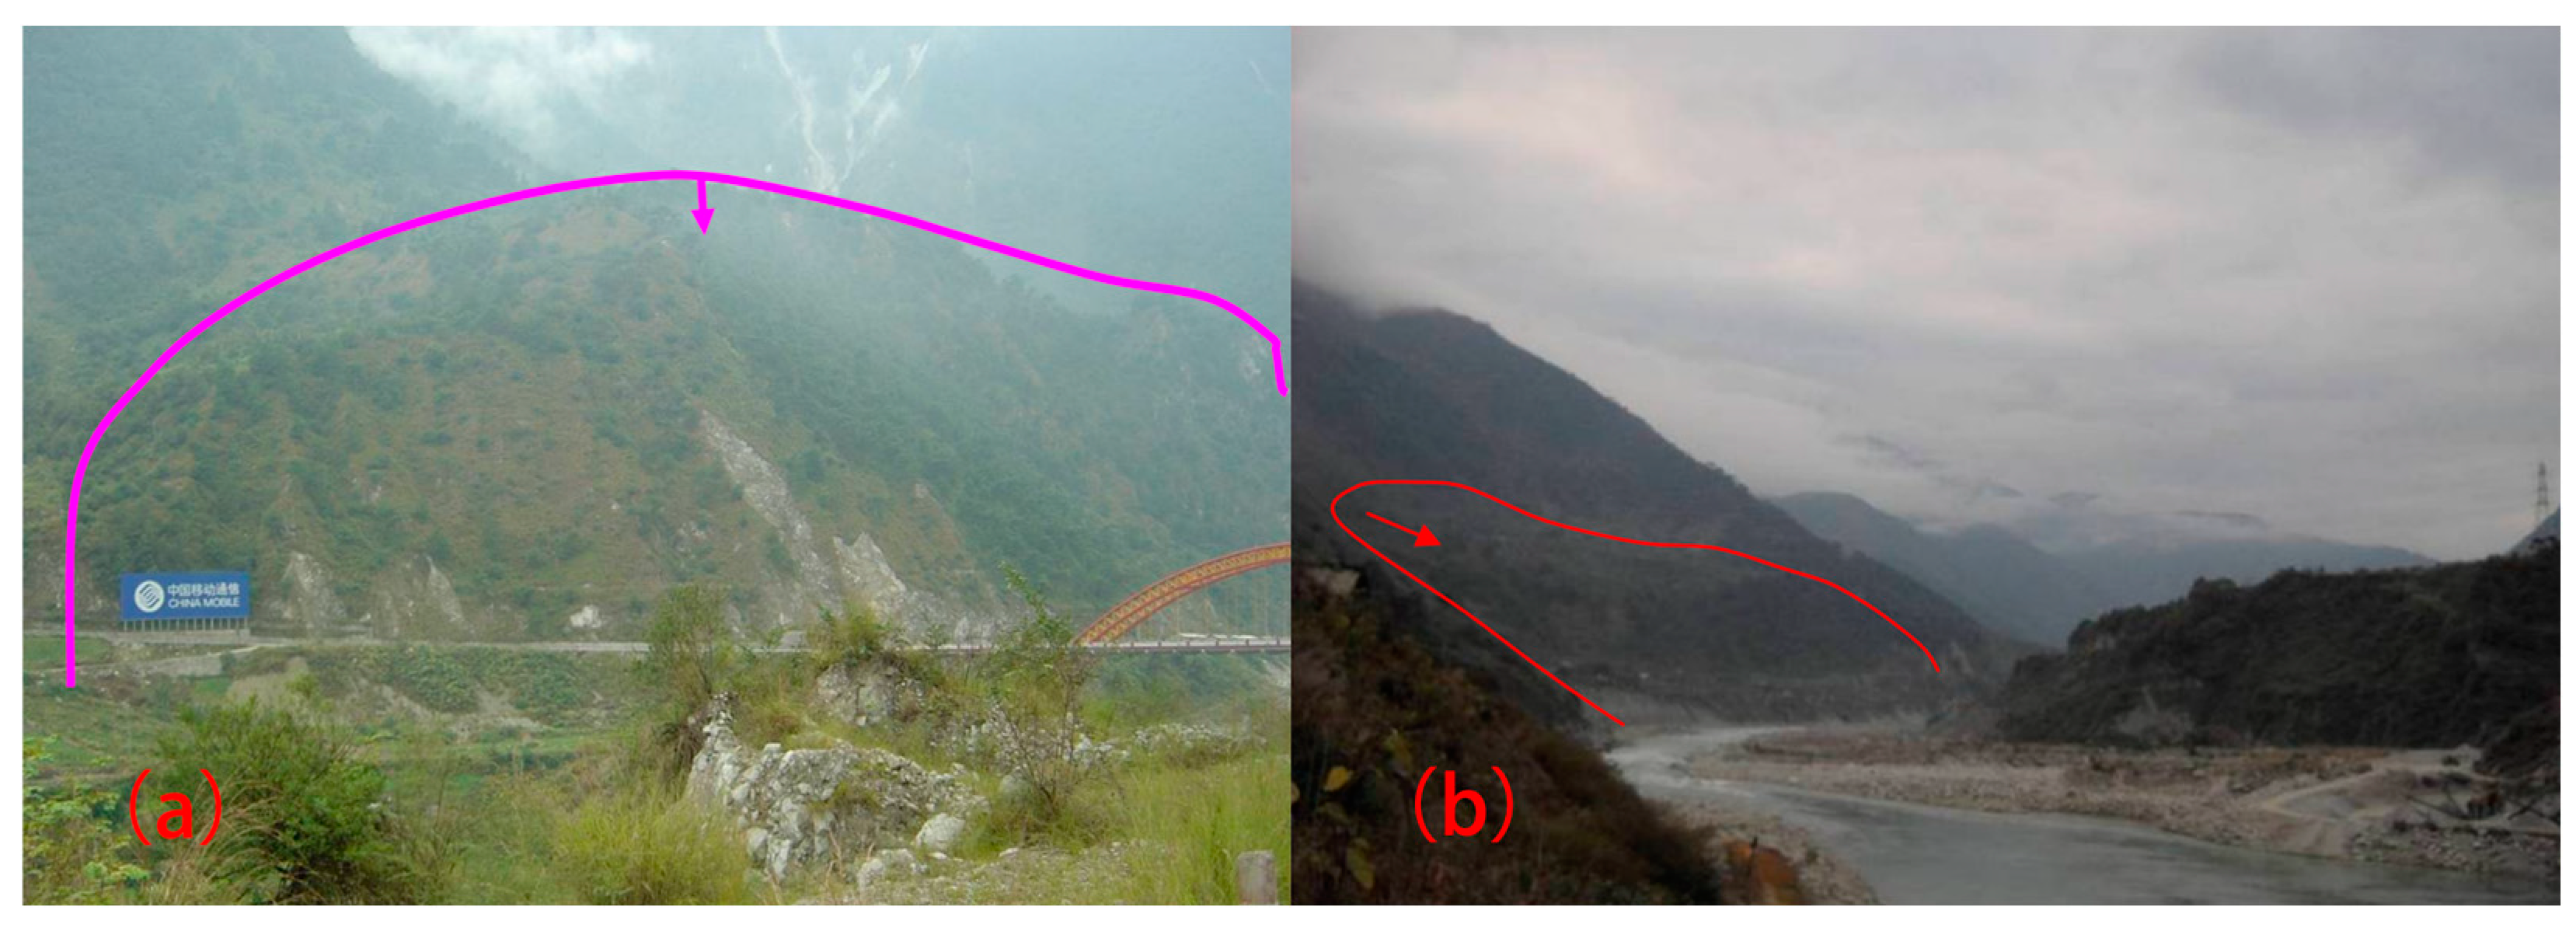
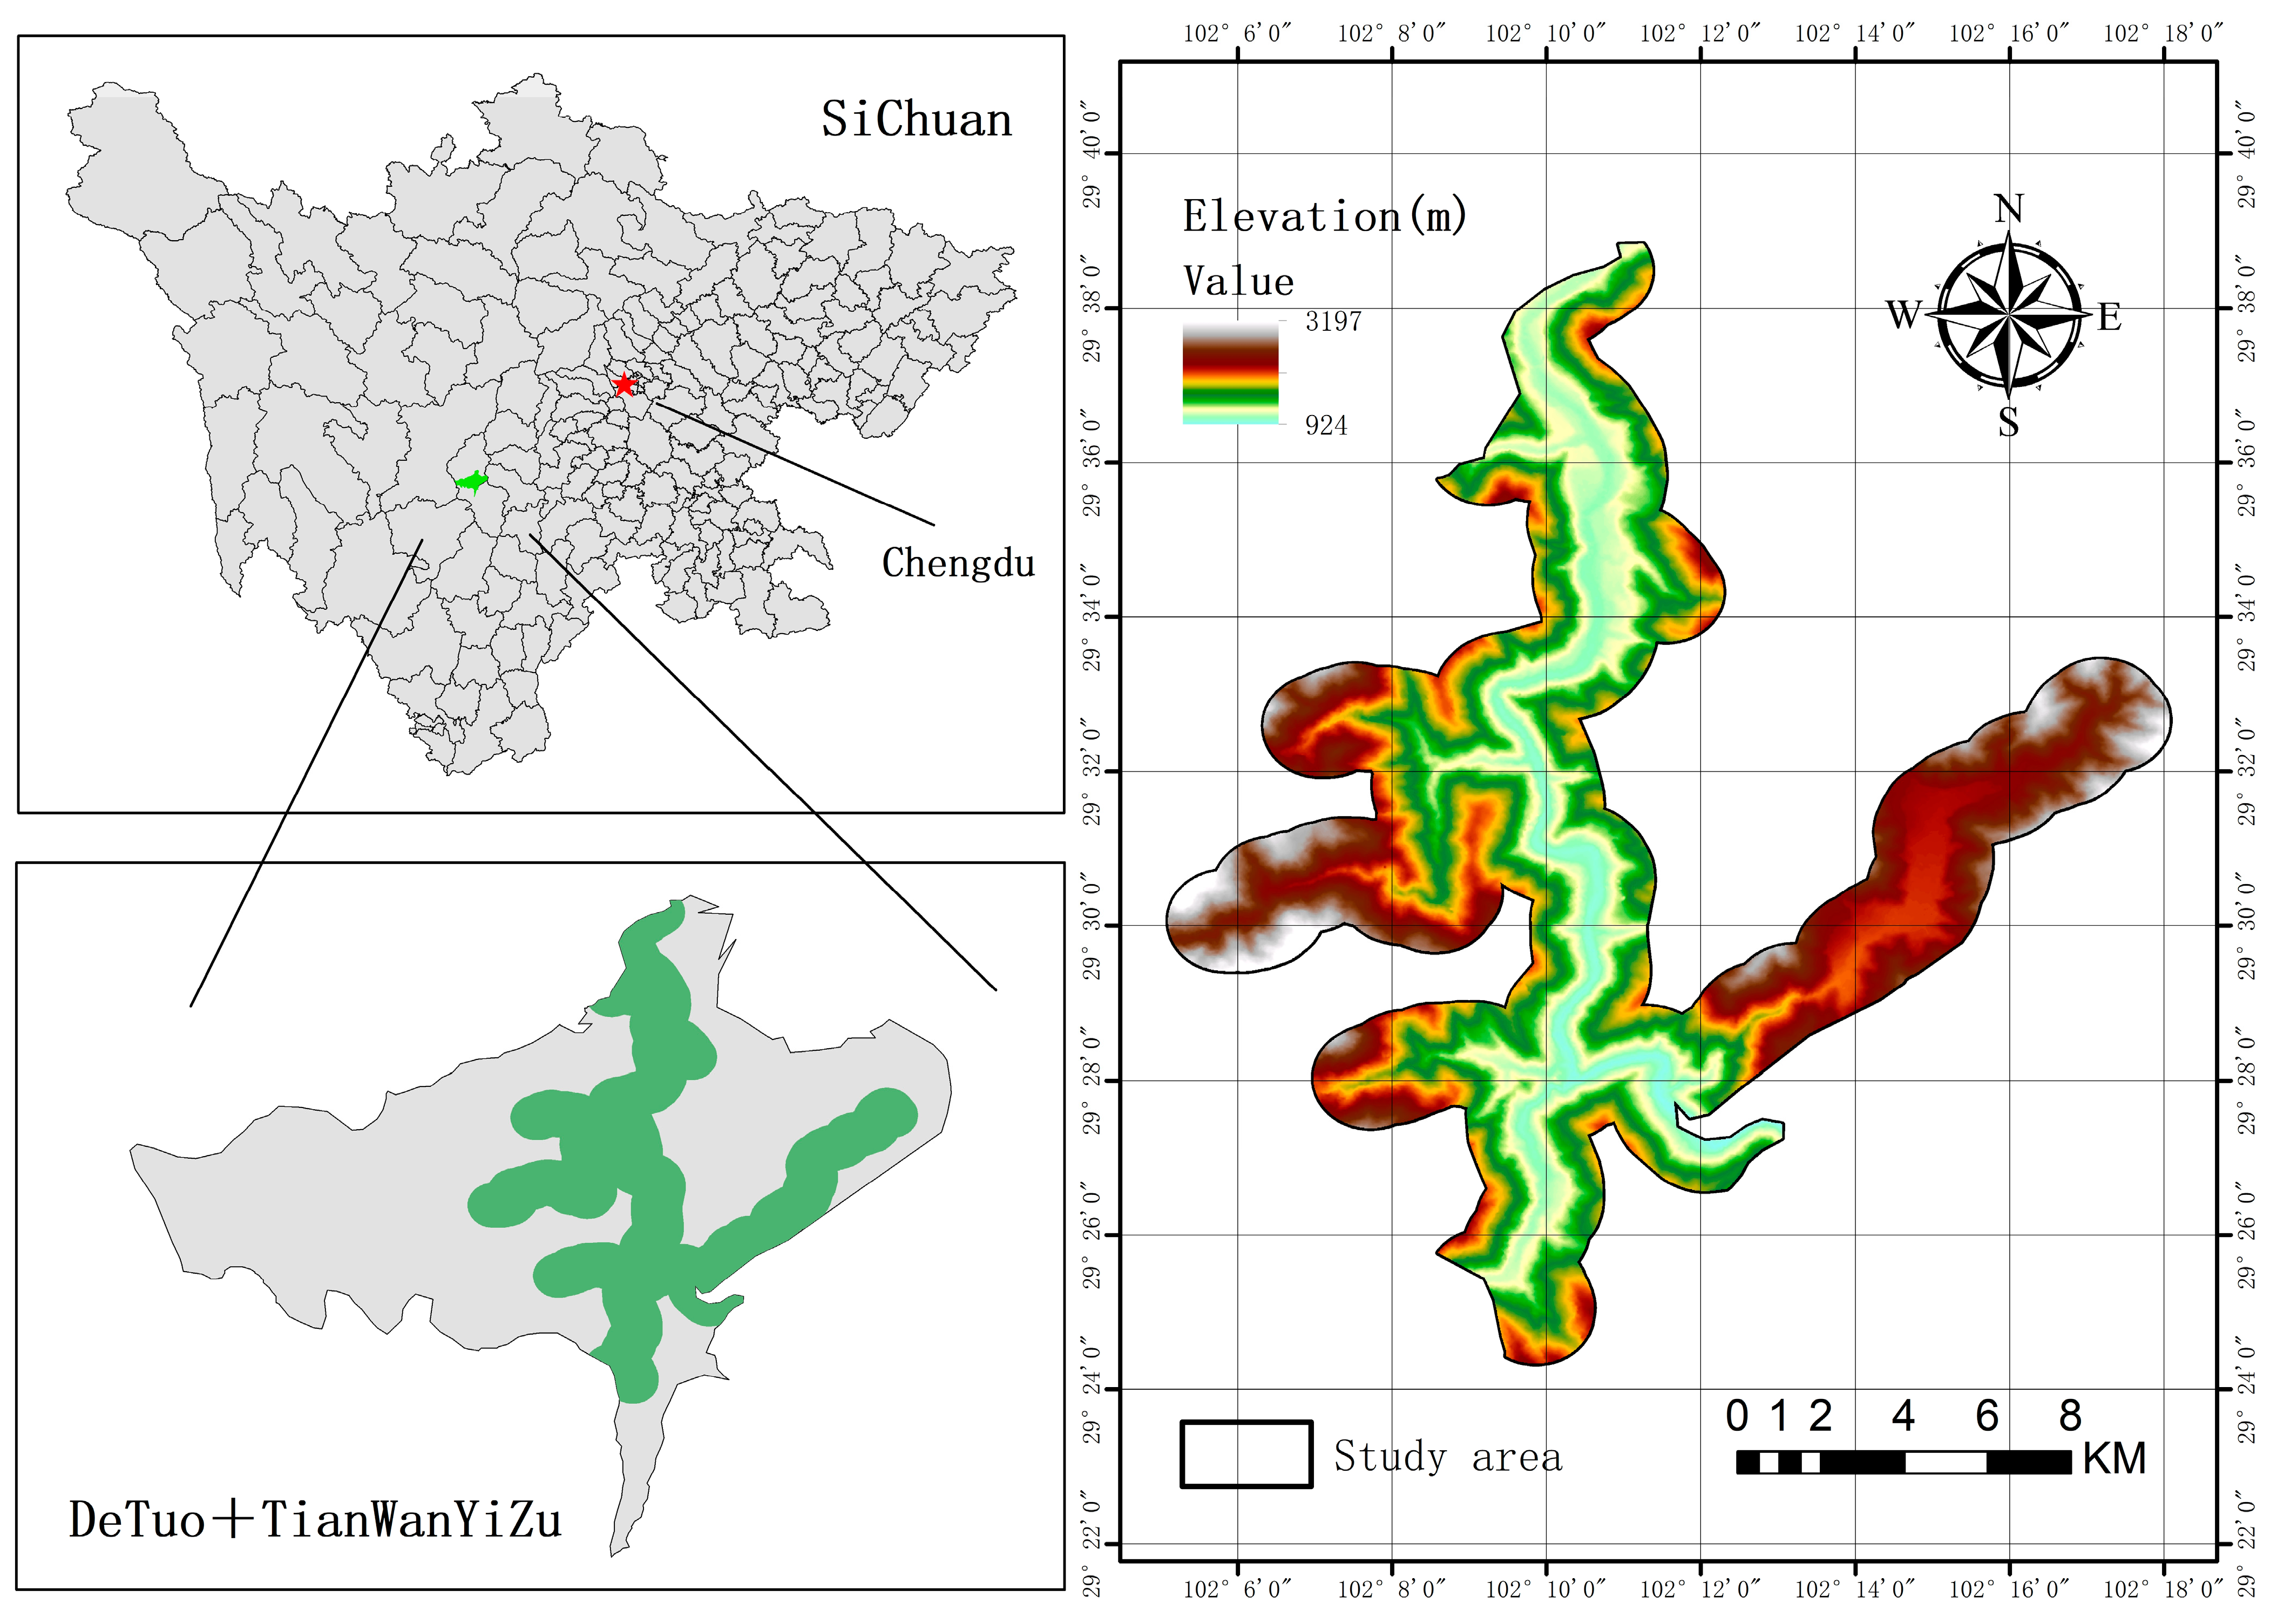
2.1. Overview of the Study Area
2.2. Data
2.2.1. Basic Data
2.2.2. Feature Set Construction
3. Workflow and Methods
3.1. Workflow
- (1)
- Remote sensing feature data, such as spectra, textures, and thematic indices from remote sensing images in the study area, were extracted. Terrain feature data such as elevation, slope, and aspect of the study area were extracted based on DEM. Consequently, a landslide identification feature dataset was constructed.
- (2)
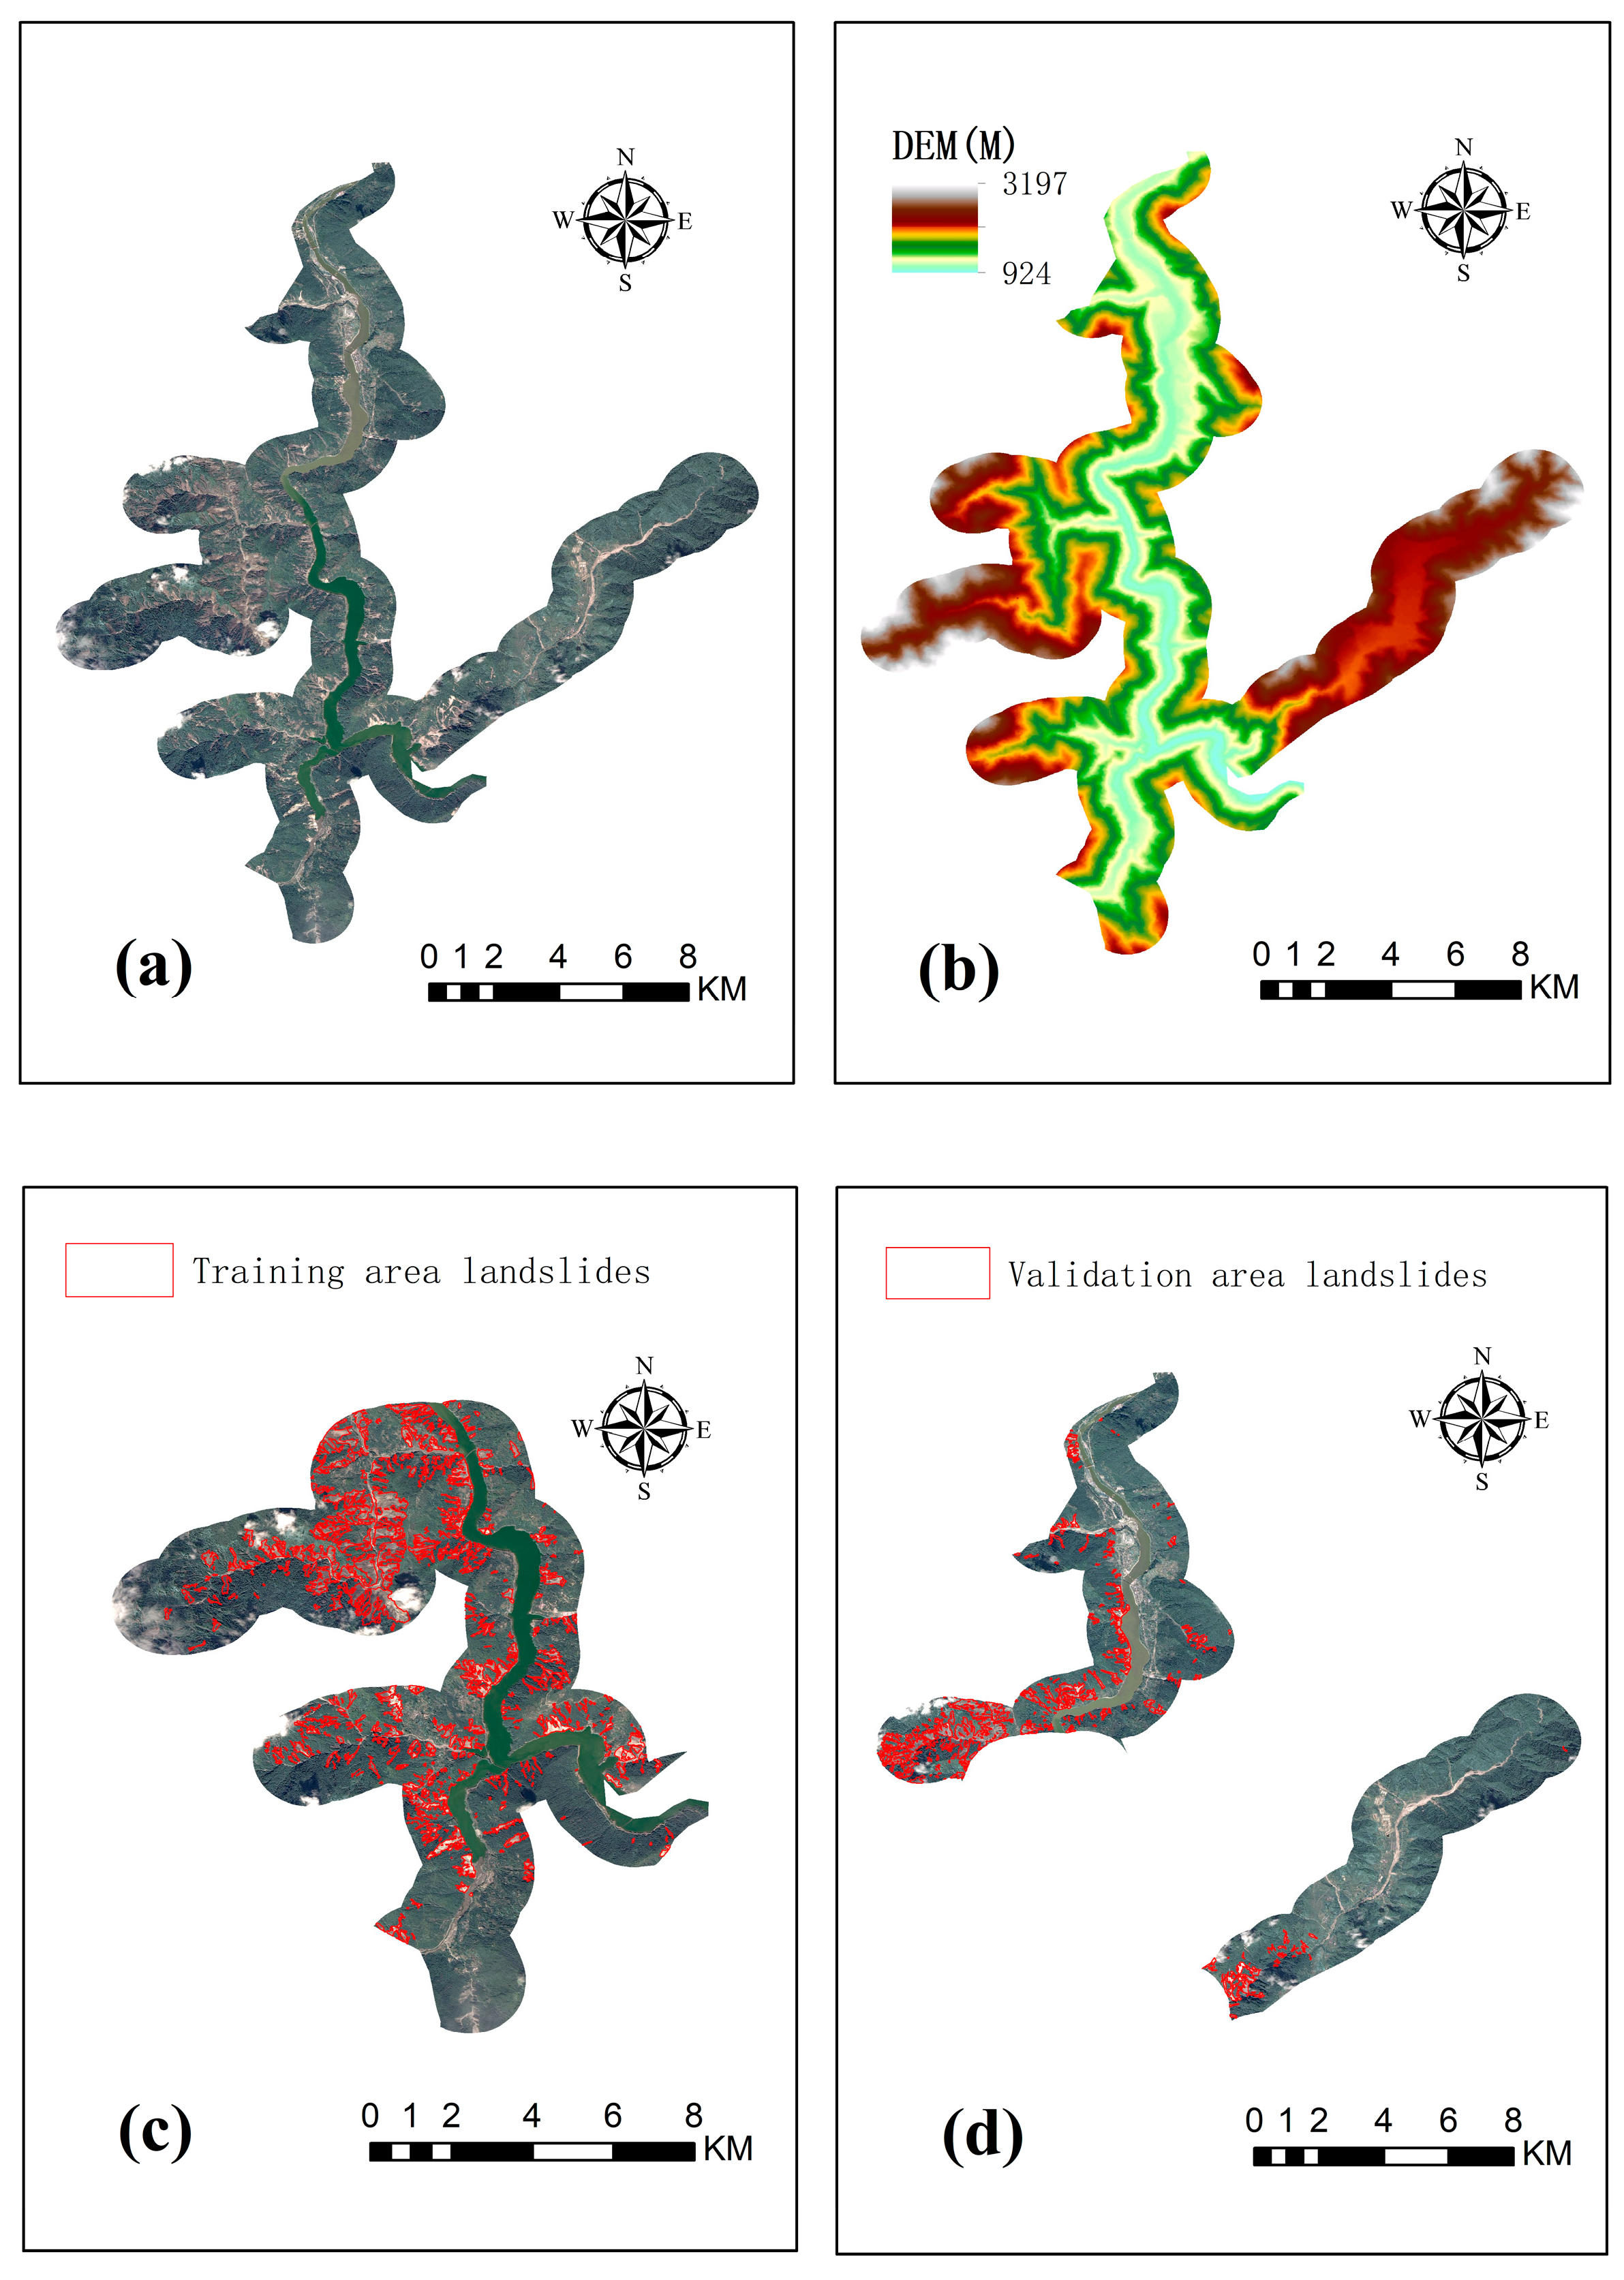
- Based on the results of feature set construction, two different training datasets were designed: (a) containing only remote sensing features and (b) containing both remote sensing features and terrain features. Additionally, various proportions were set for the number of landslide and non-landslide samples in the training dataset, including 1:1, 1:2, 1:3, 1:4, and 1:5, respectively.
- (3)
- XGBoost, AdaBoost, LightGBM, RF, and CNN were used for landslide recognition using various training datasets. The landslide identification performance of different models was evaluated using A, P, R, F1, and IOU.
- (4)
- By evaluating the performance of different models, suitable ML methods and P/N sample ratios for the study area were identified, and accurate and reasonable landslide identification results were obtained for the test area.
- (5)
- Ablation experiments were conducted to evaluate the influence of terrain feature indicators on landslide identification outcomes and offer additional explanations and discussions. Simultaneously, the effects of ML models and P/N sample ratio on the results were assessed.
3.2. Methods
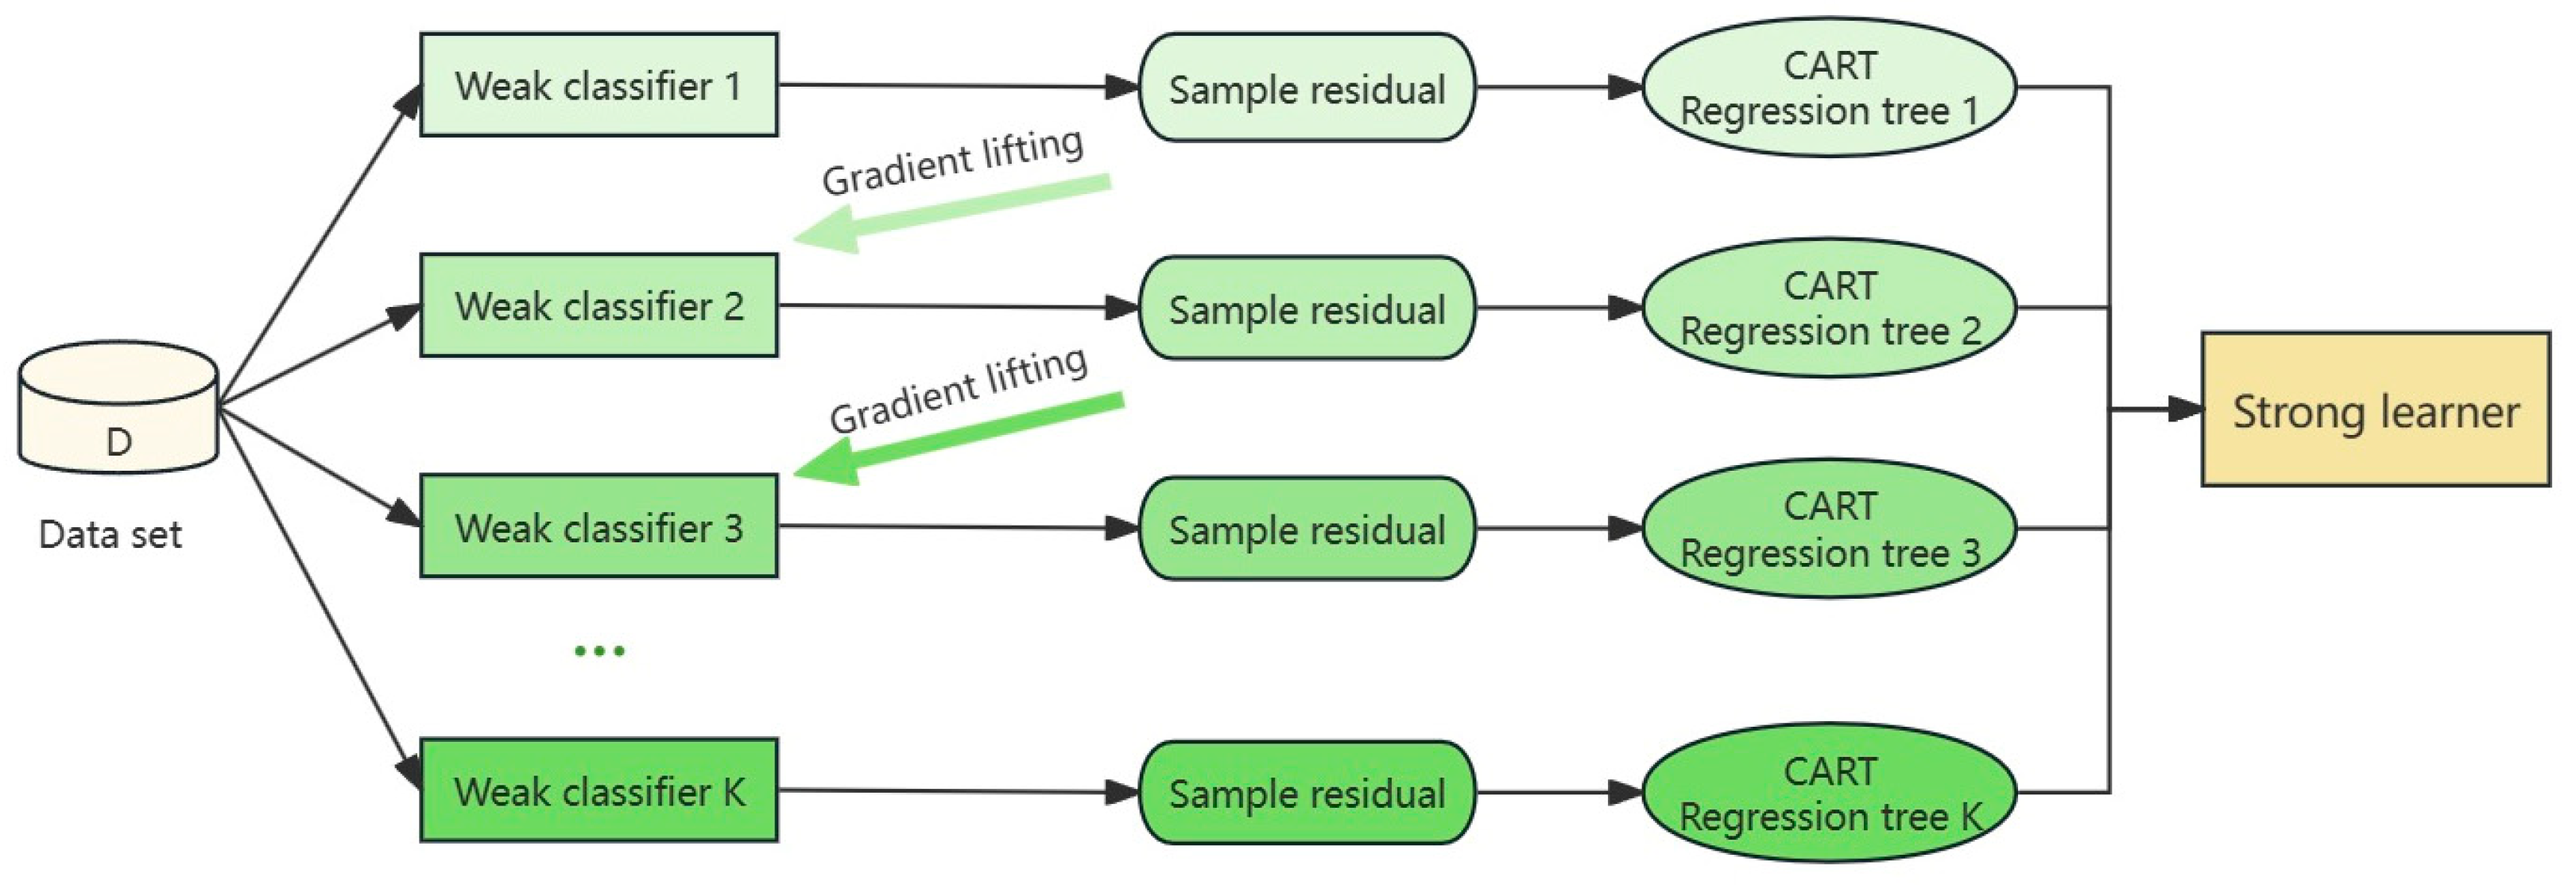
3.2.1. XGBoost
3.2.2. AdaBoost
3.2.3. LightGBM
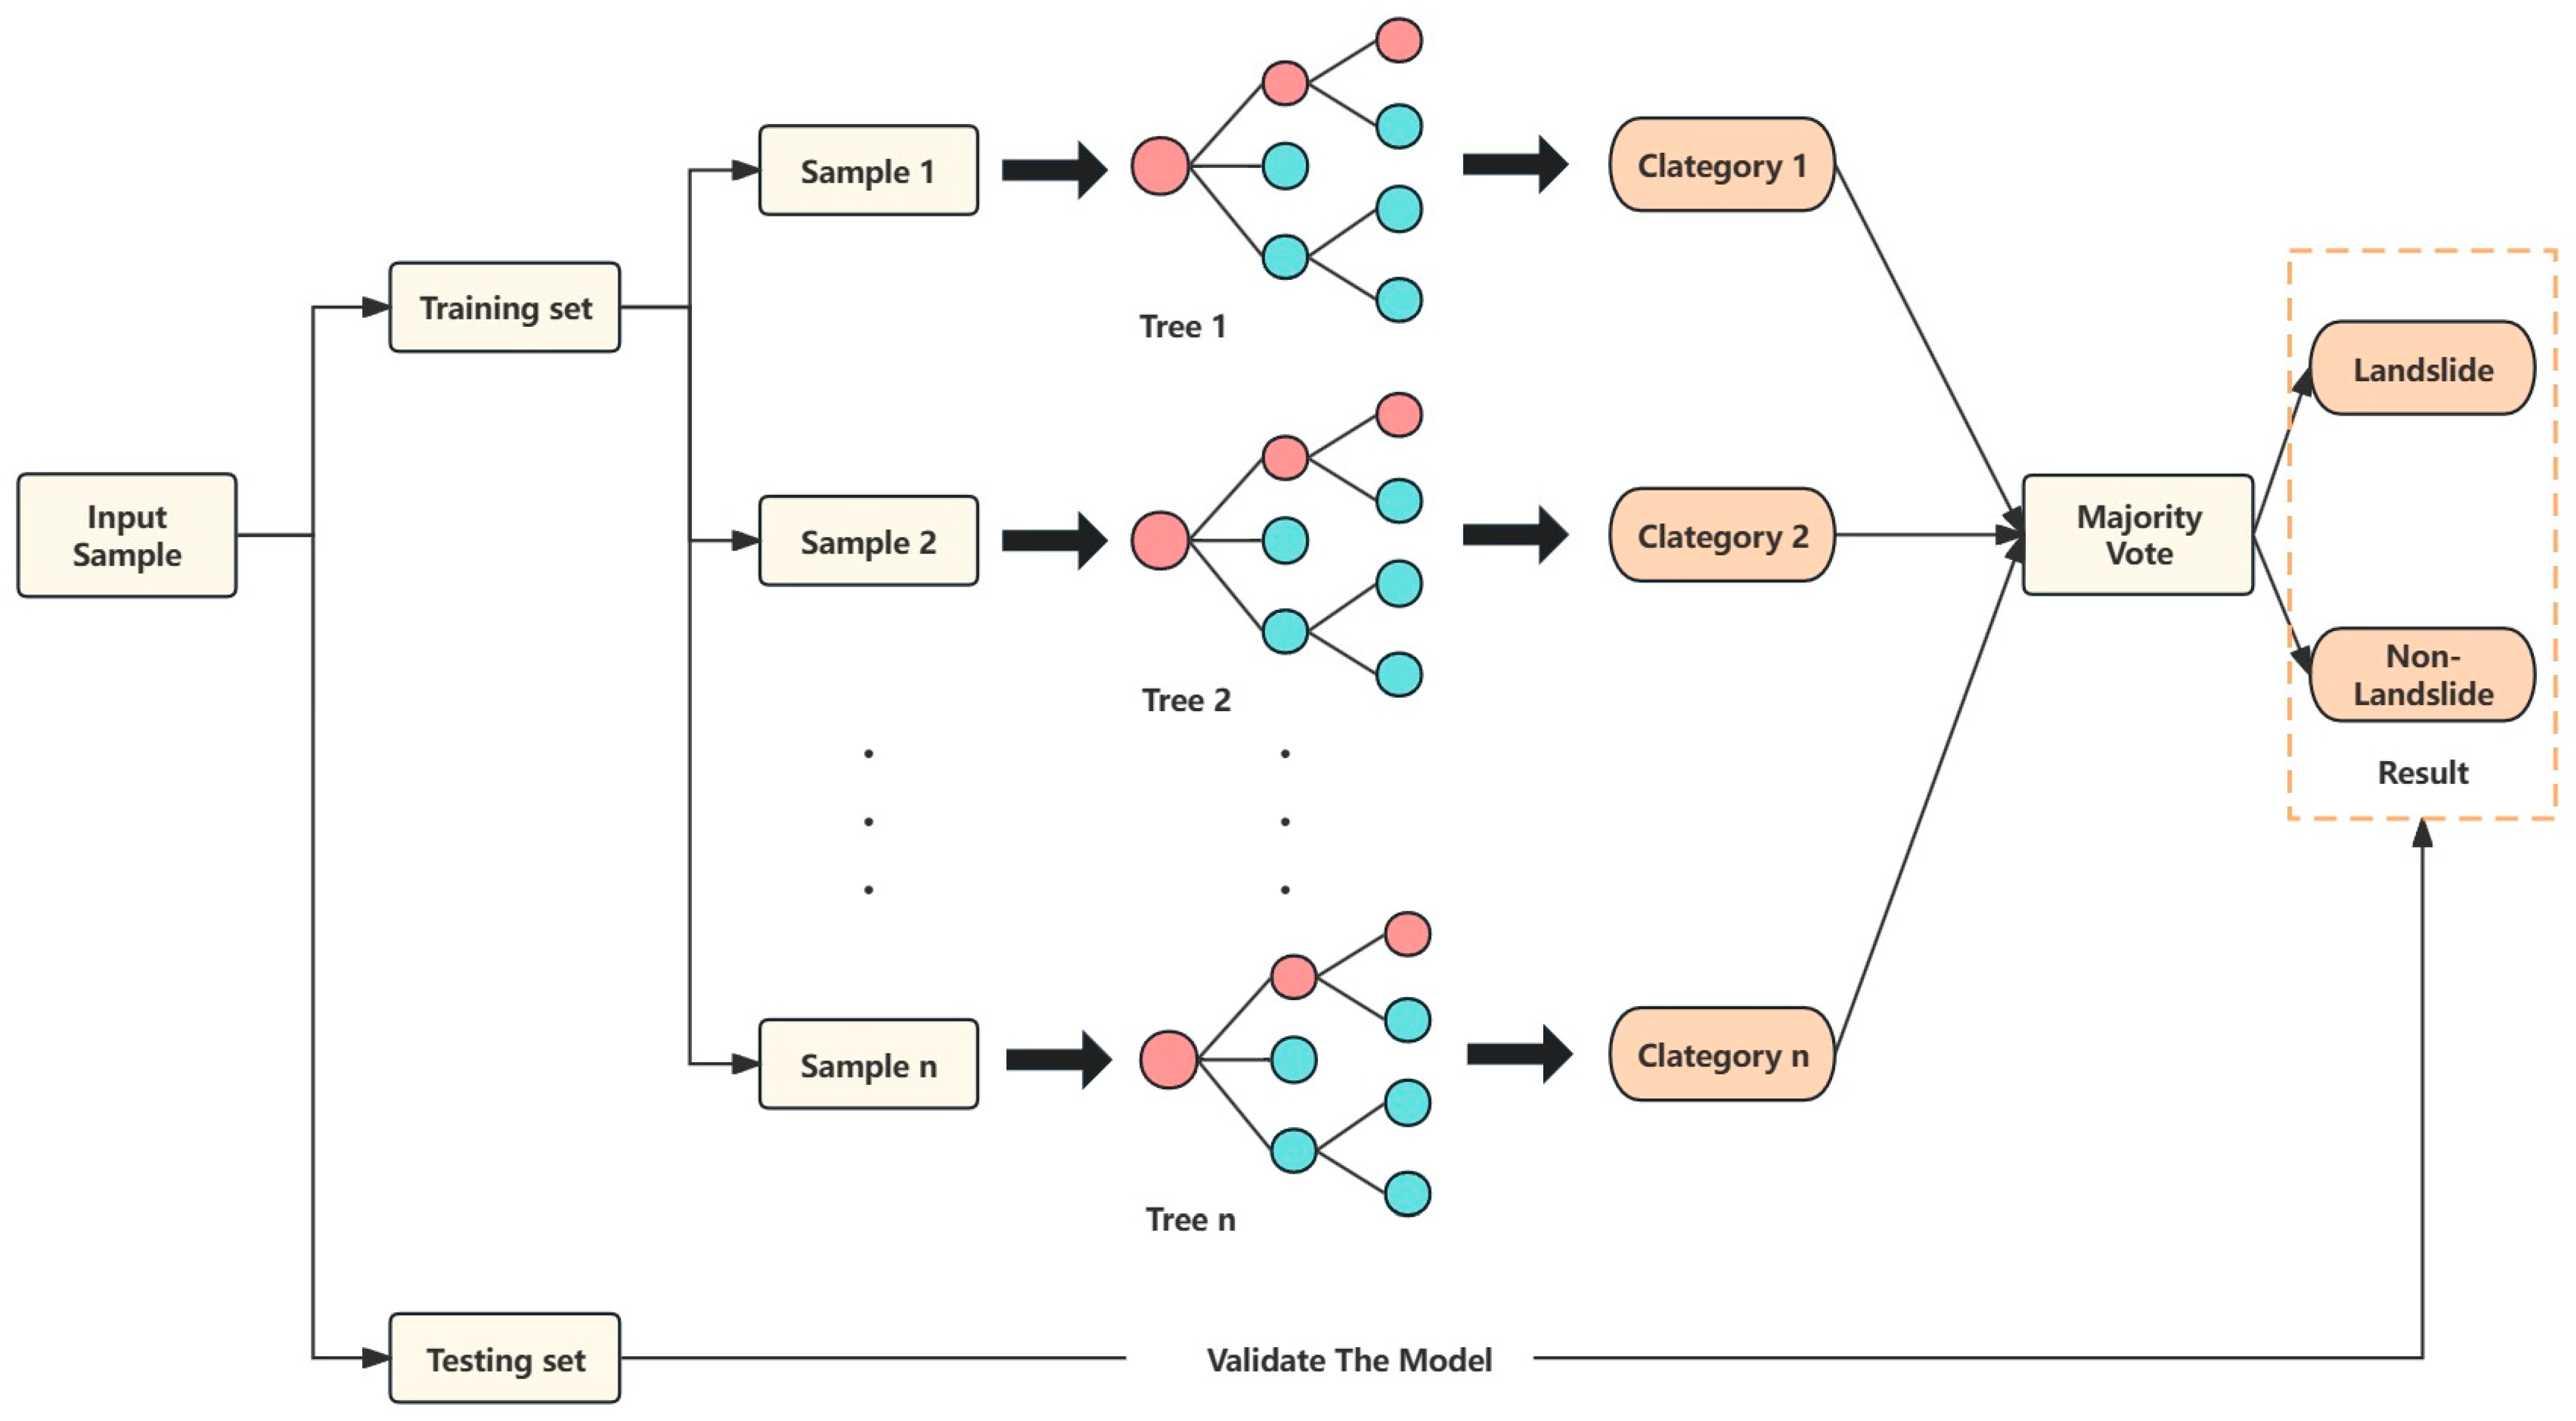
3.2.4. Random Forest
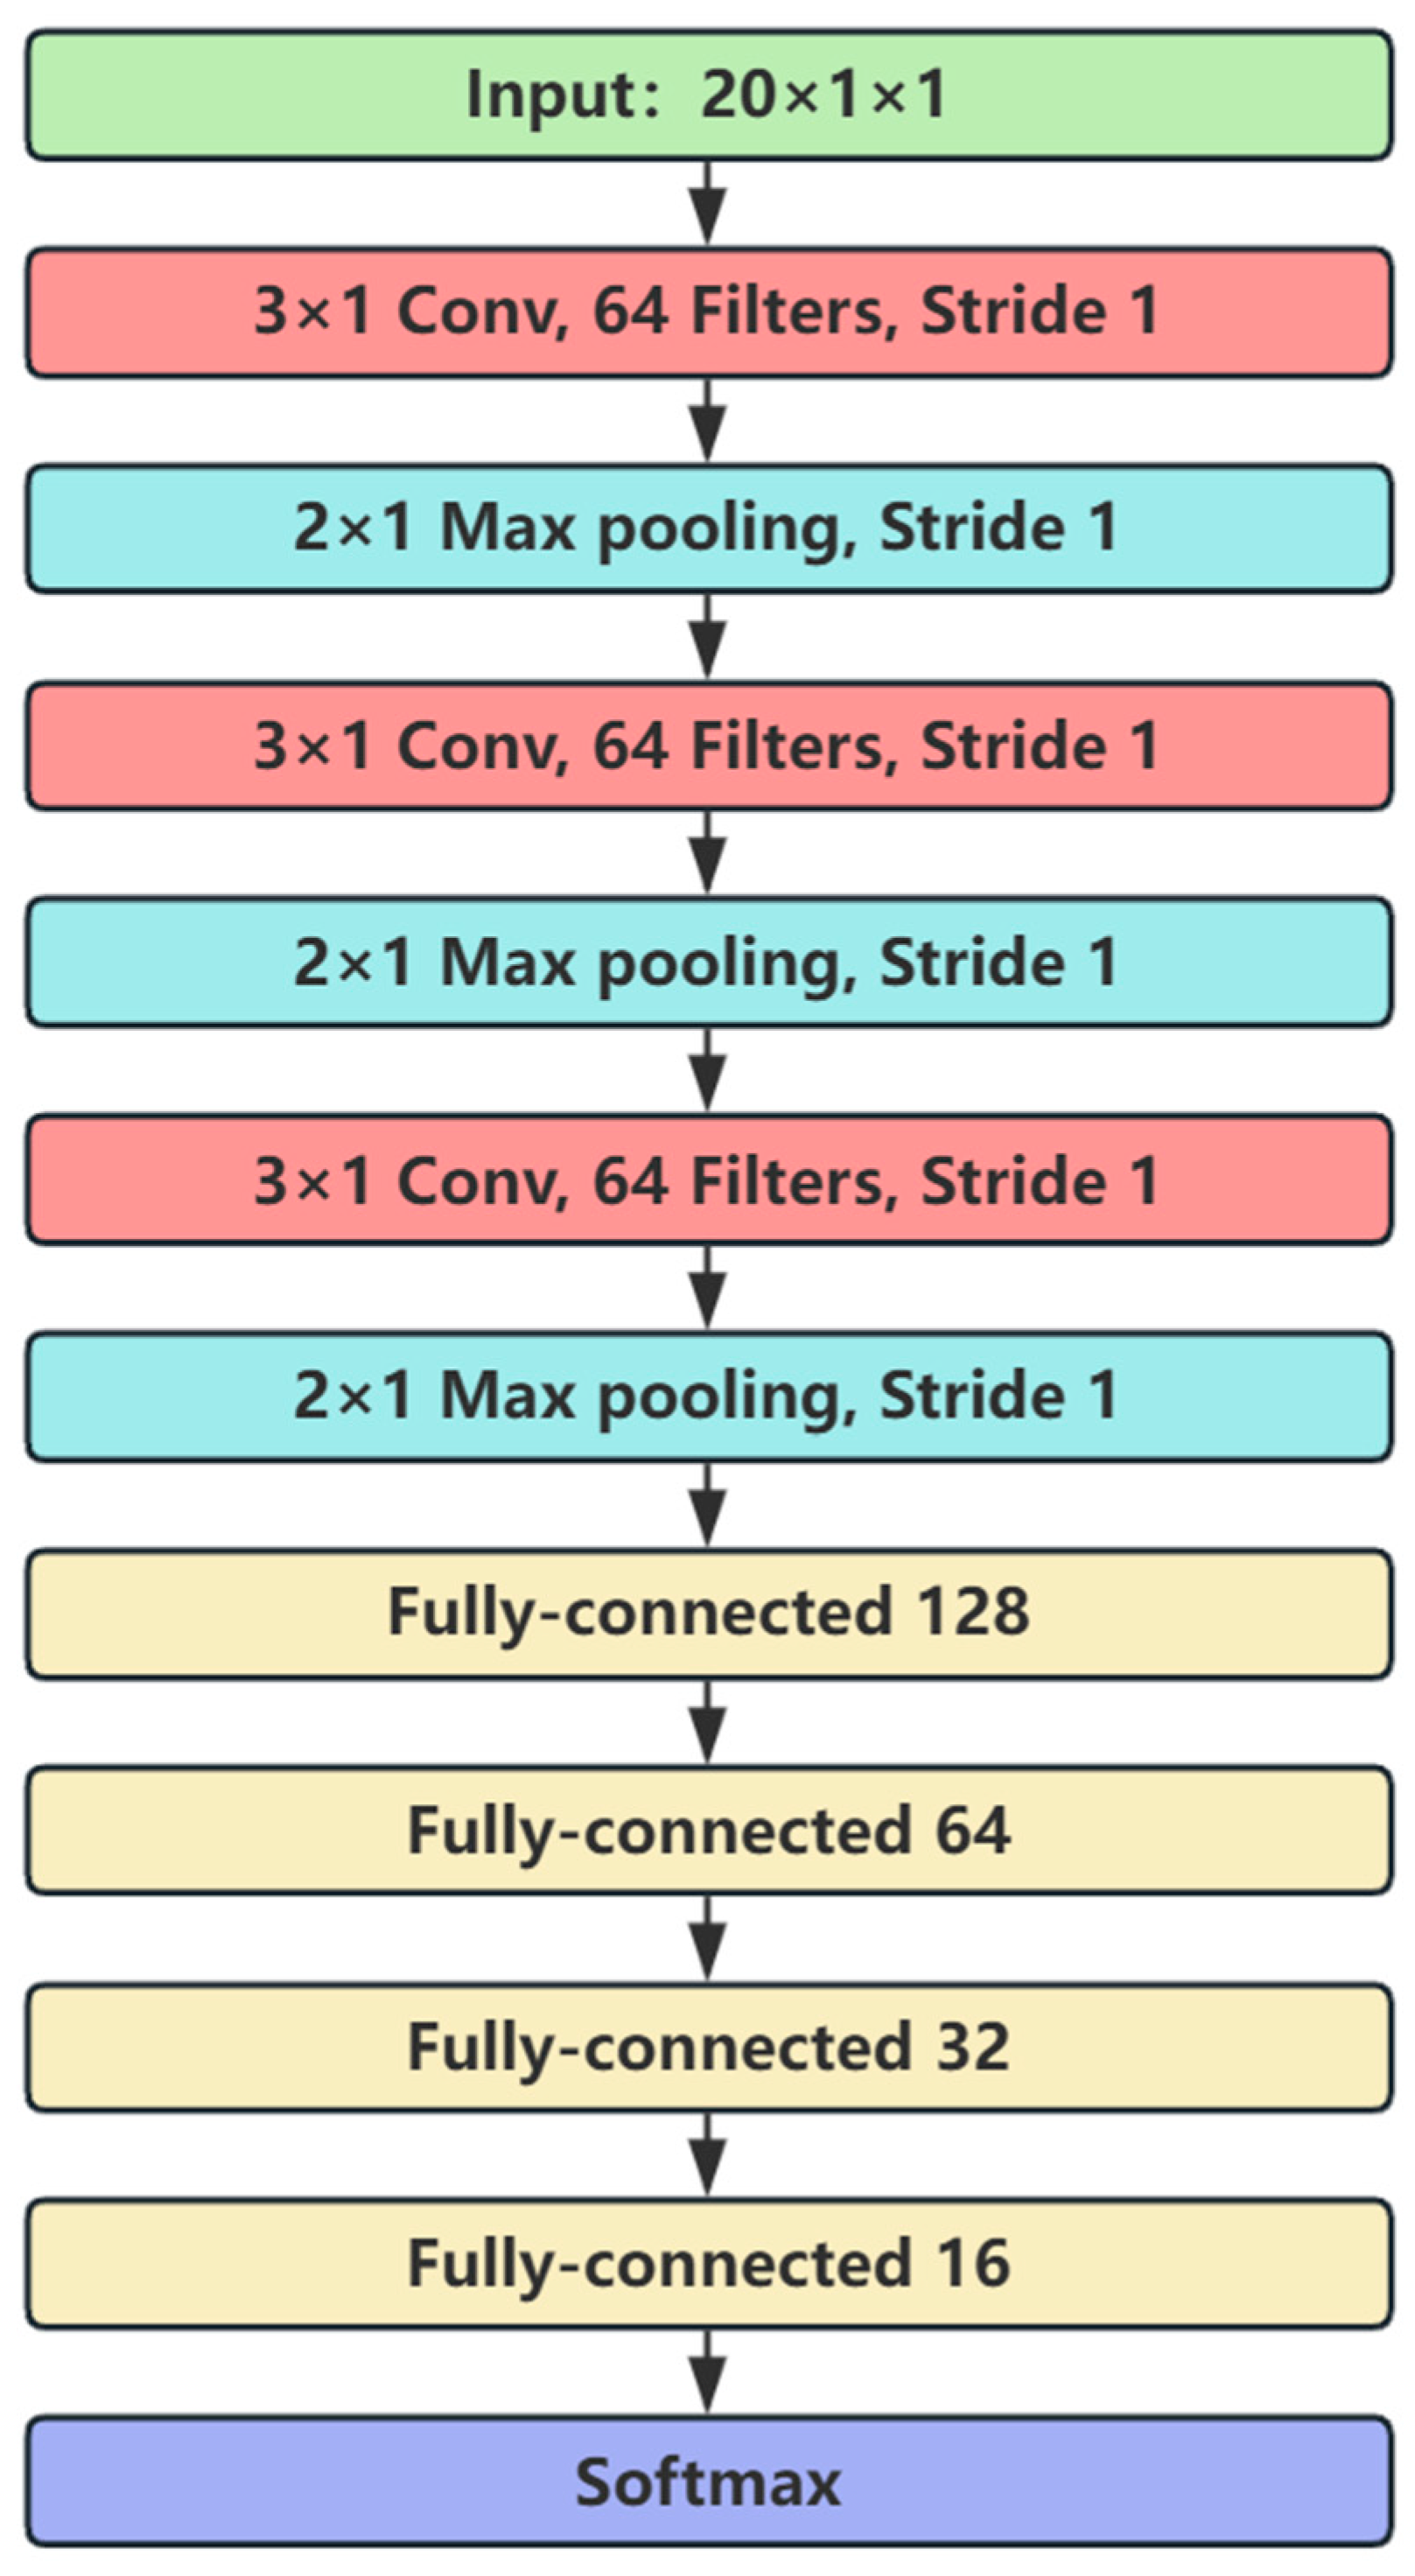
3.2.5. CNN
3.2.6. Model Evaluation
4. Results
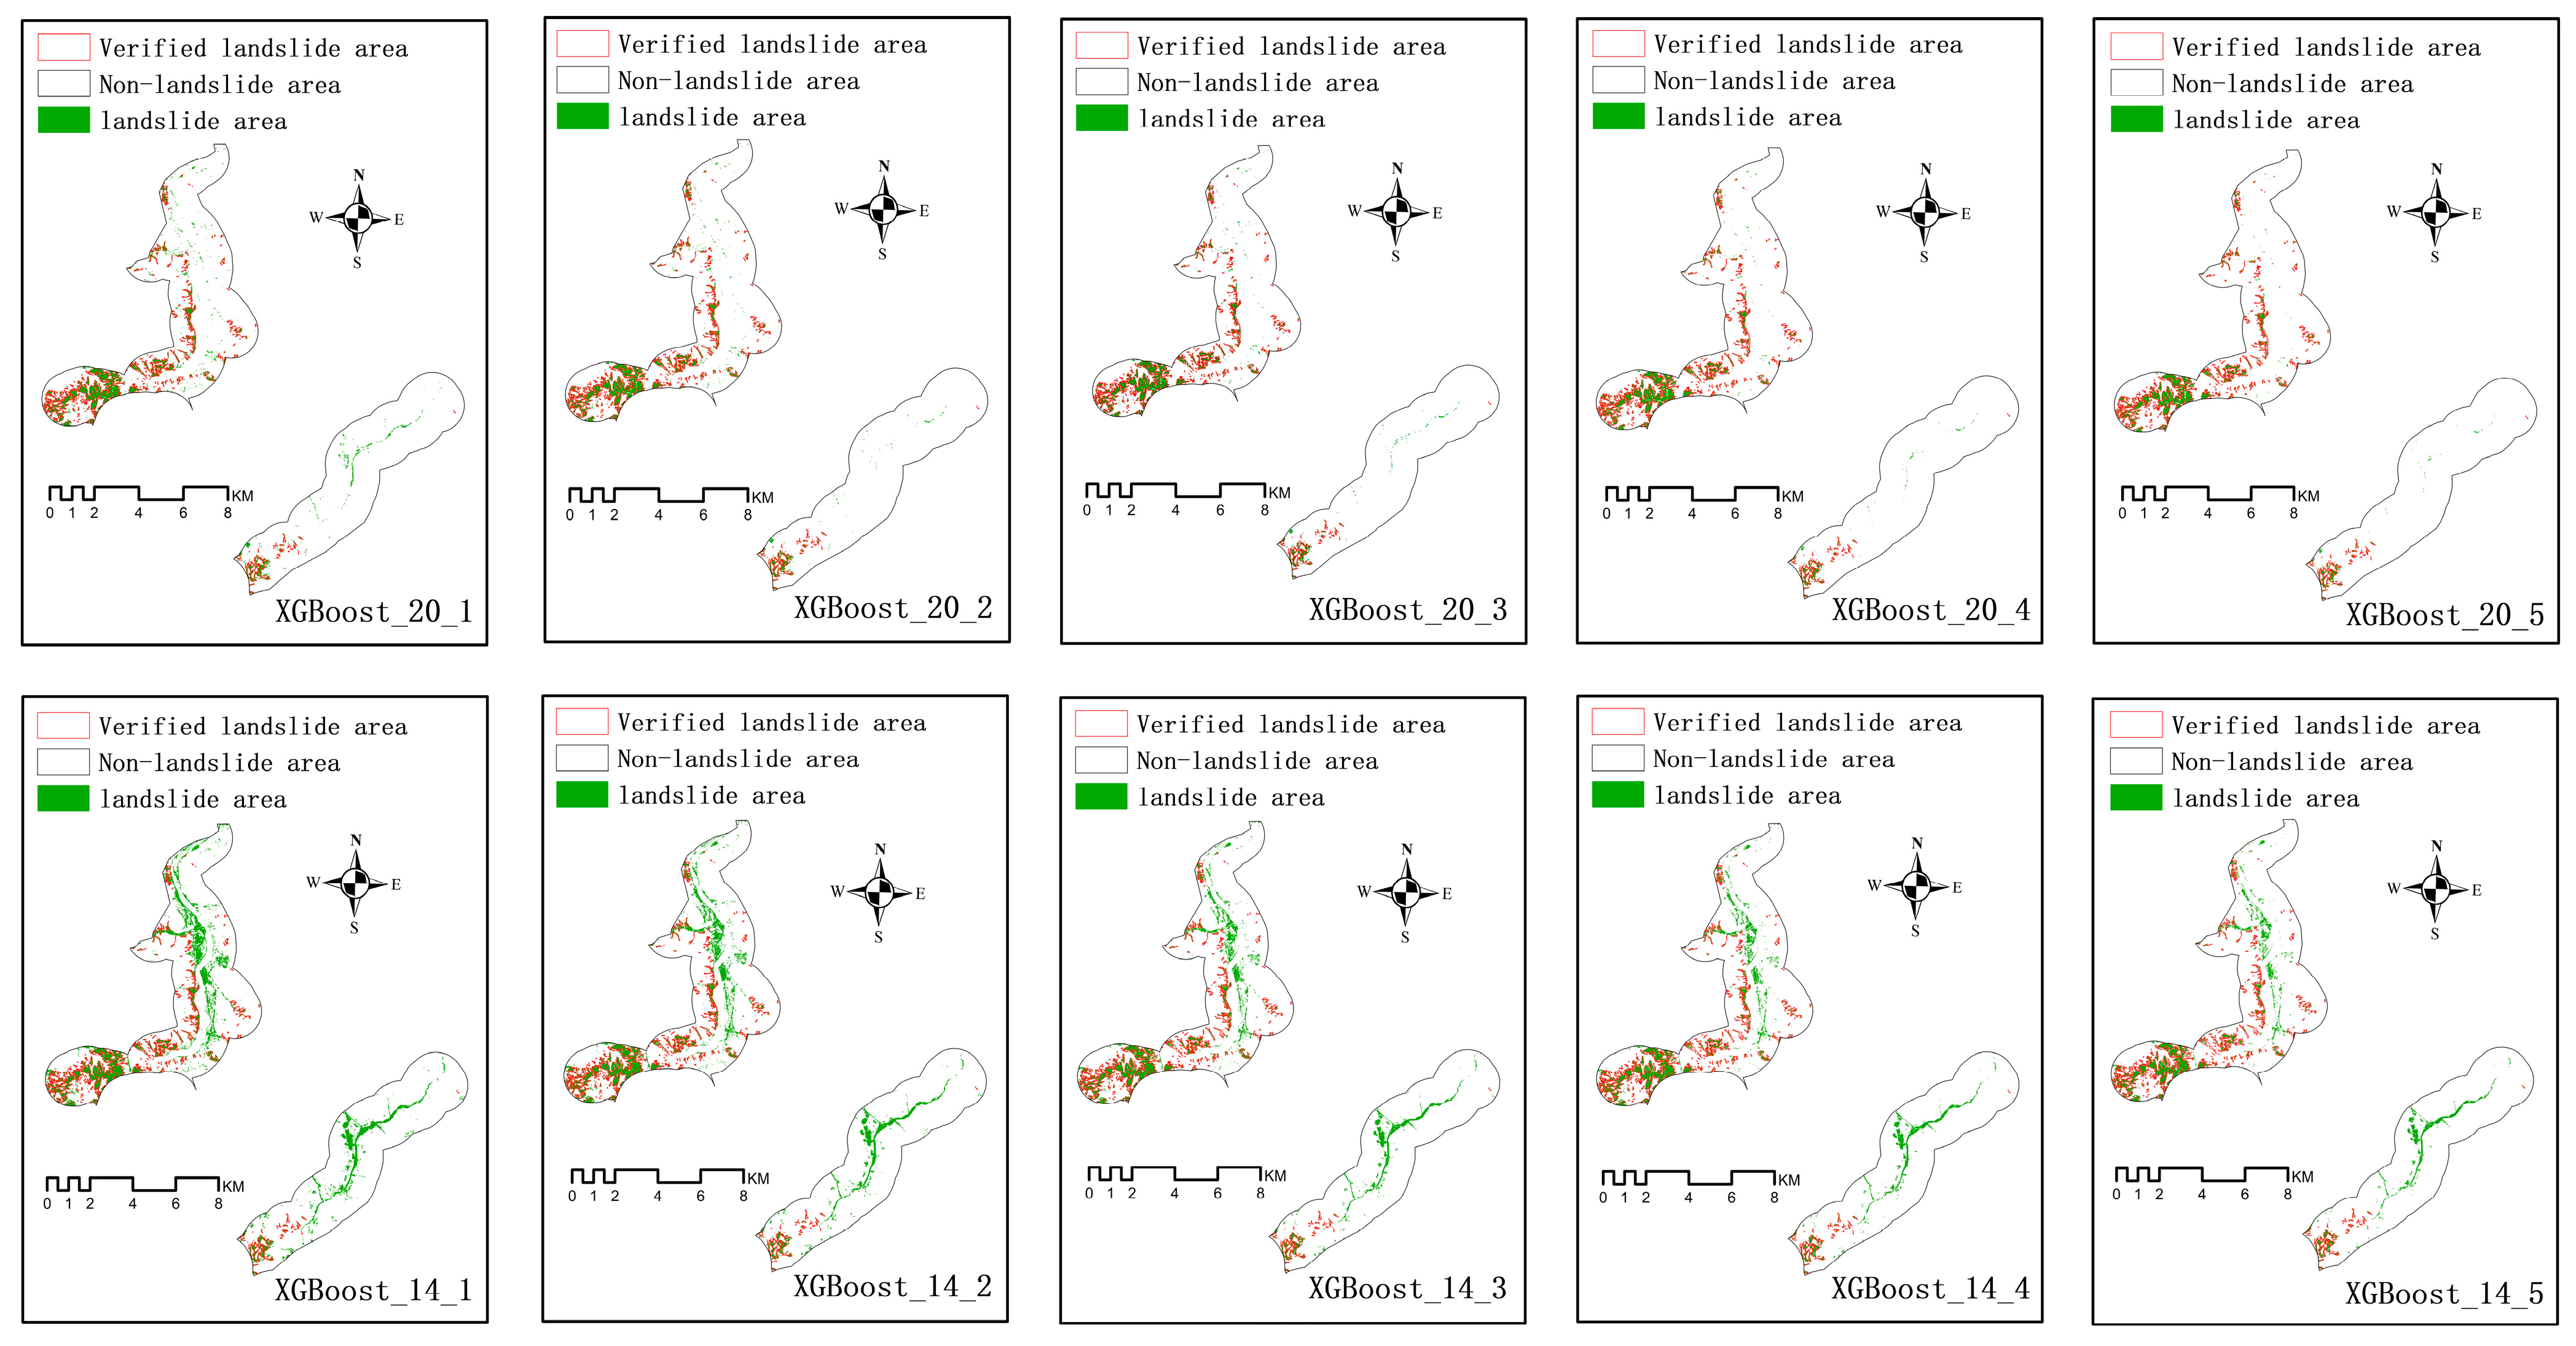
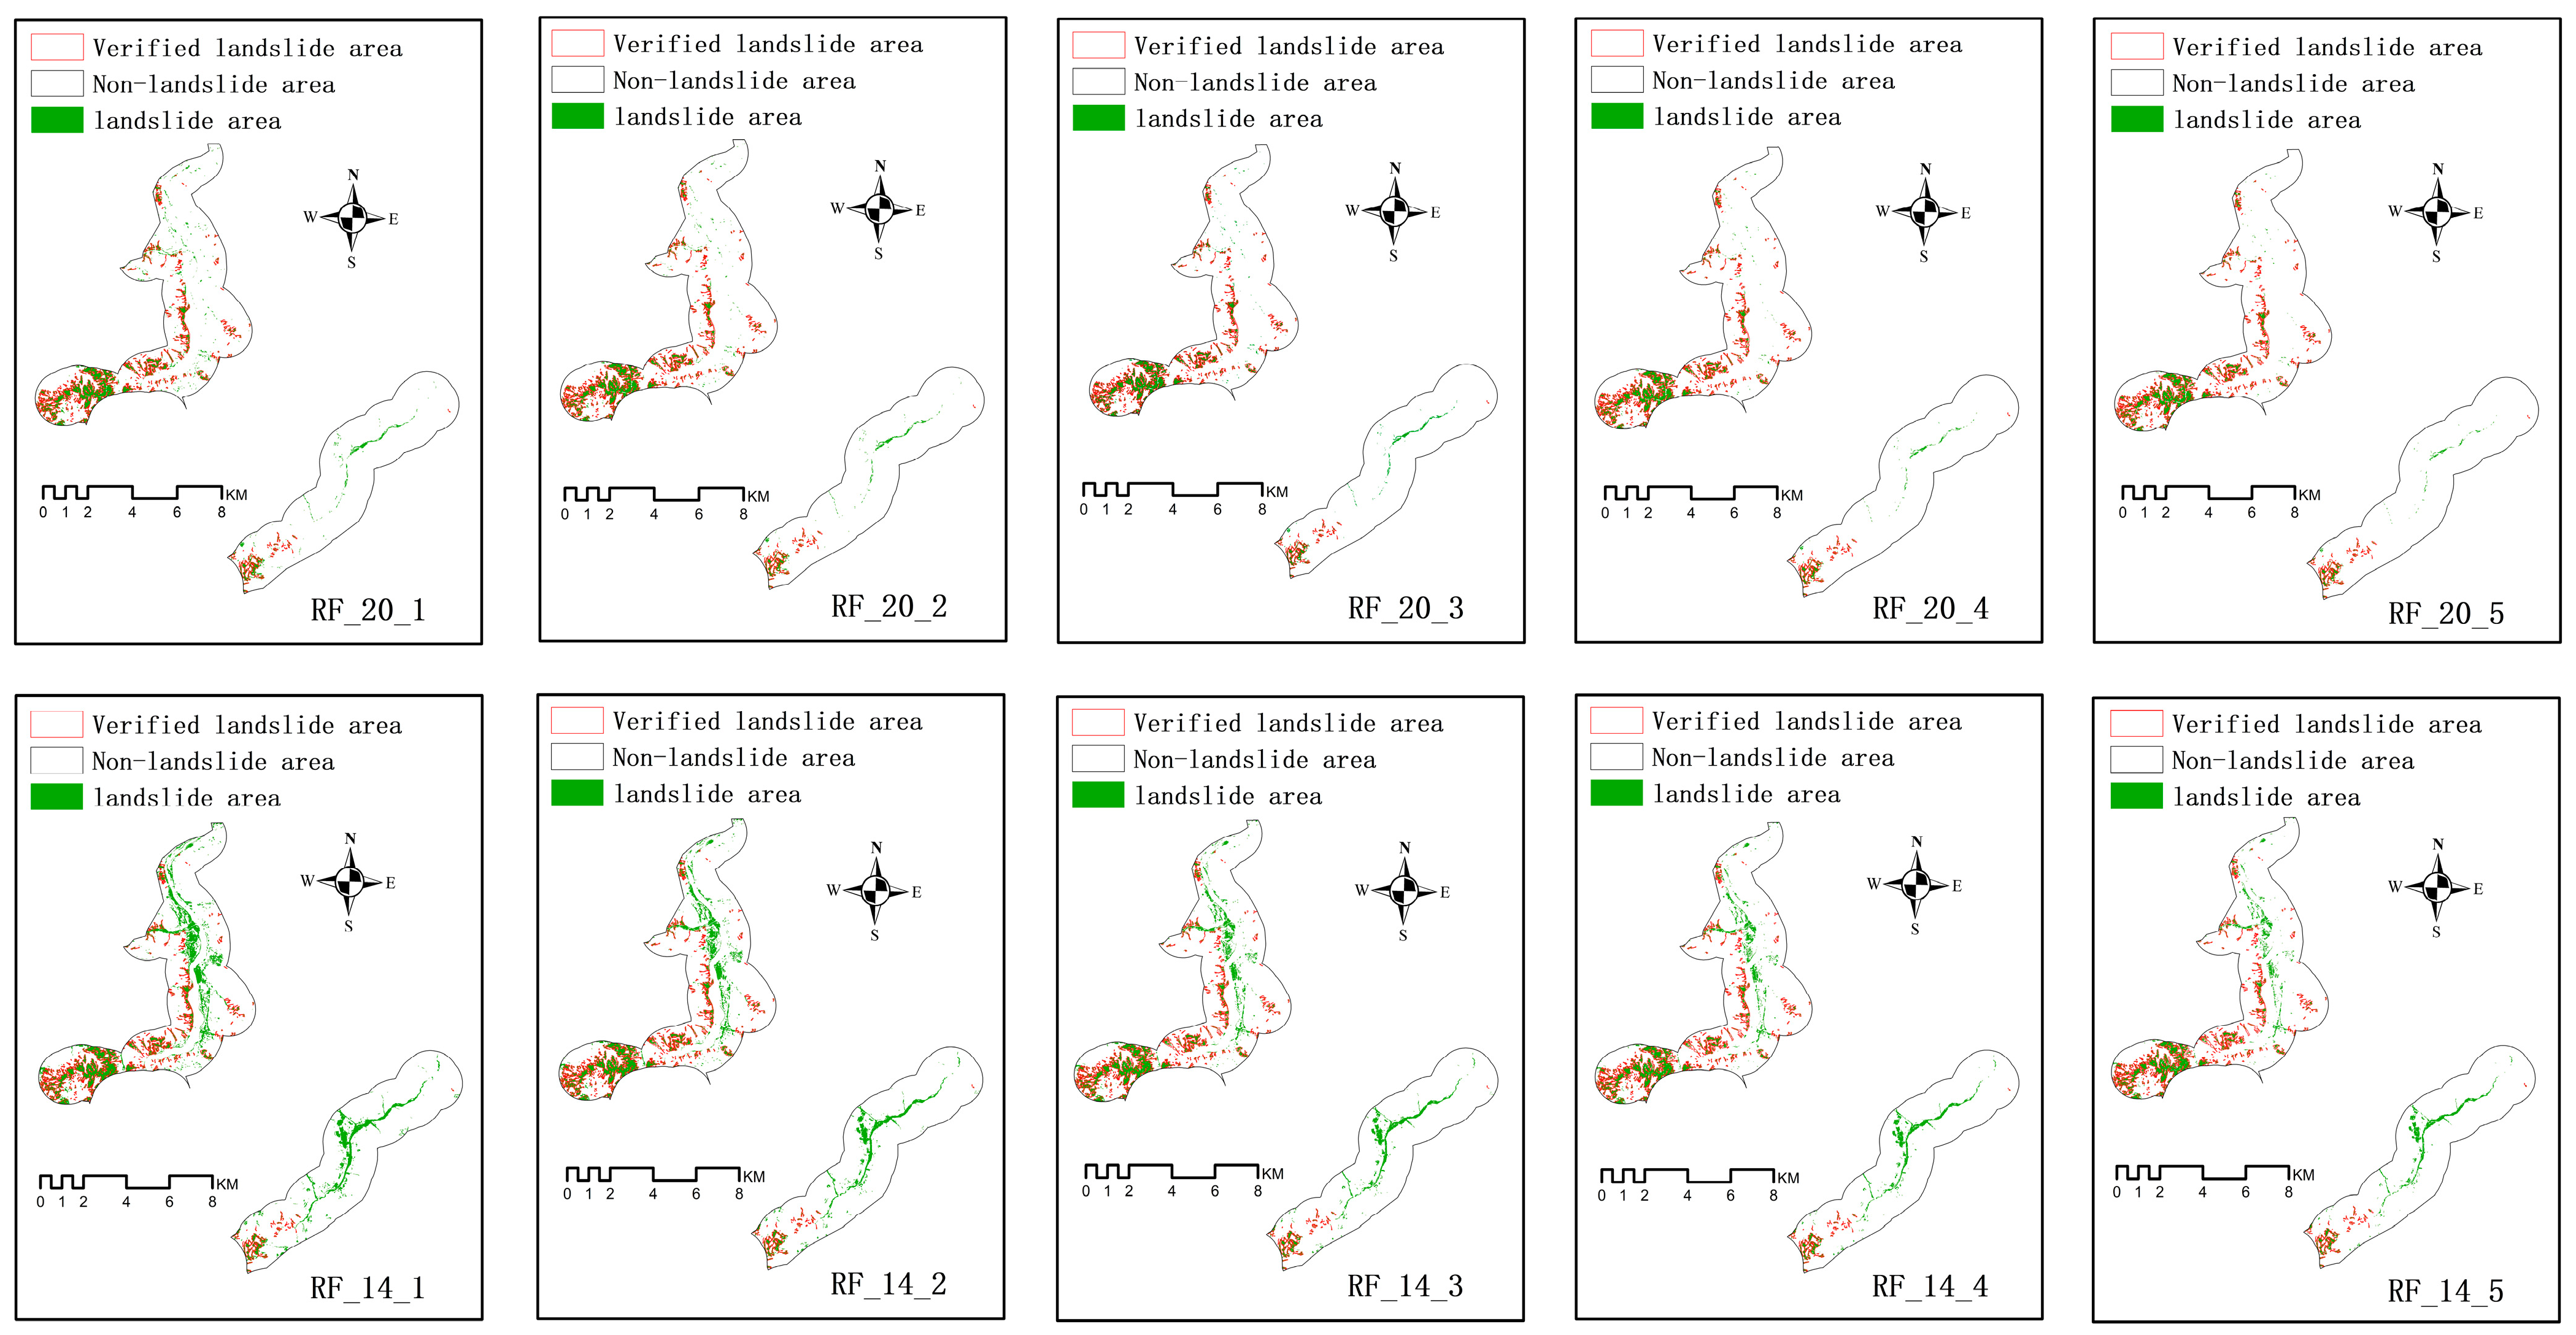
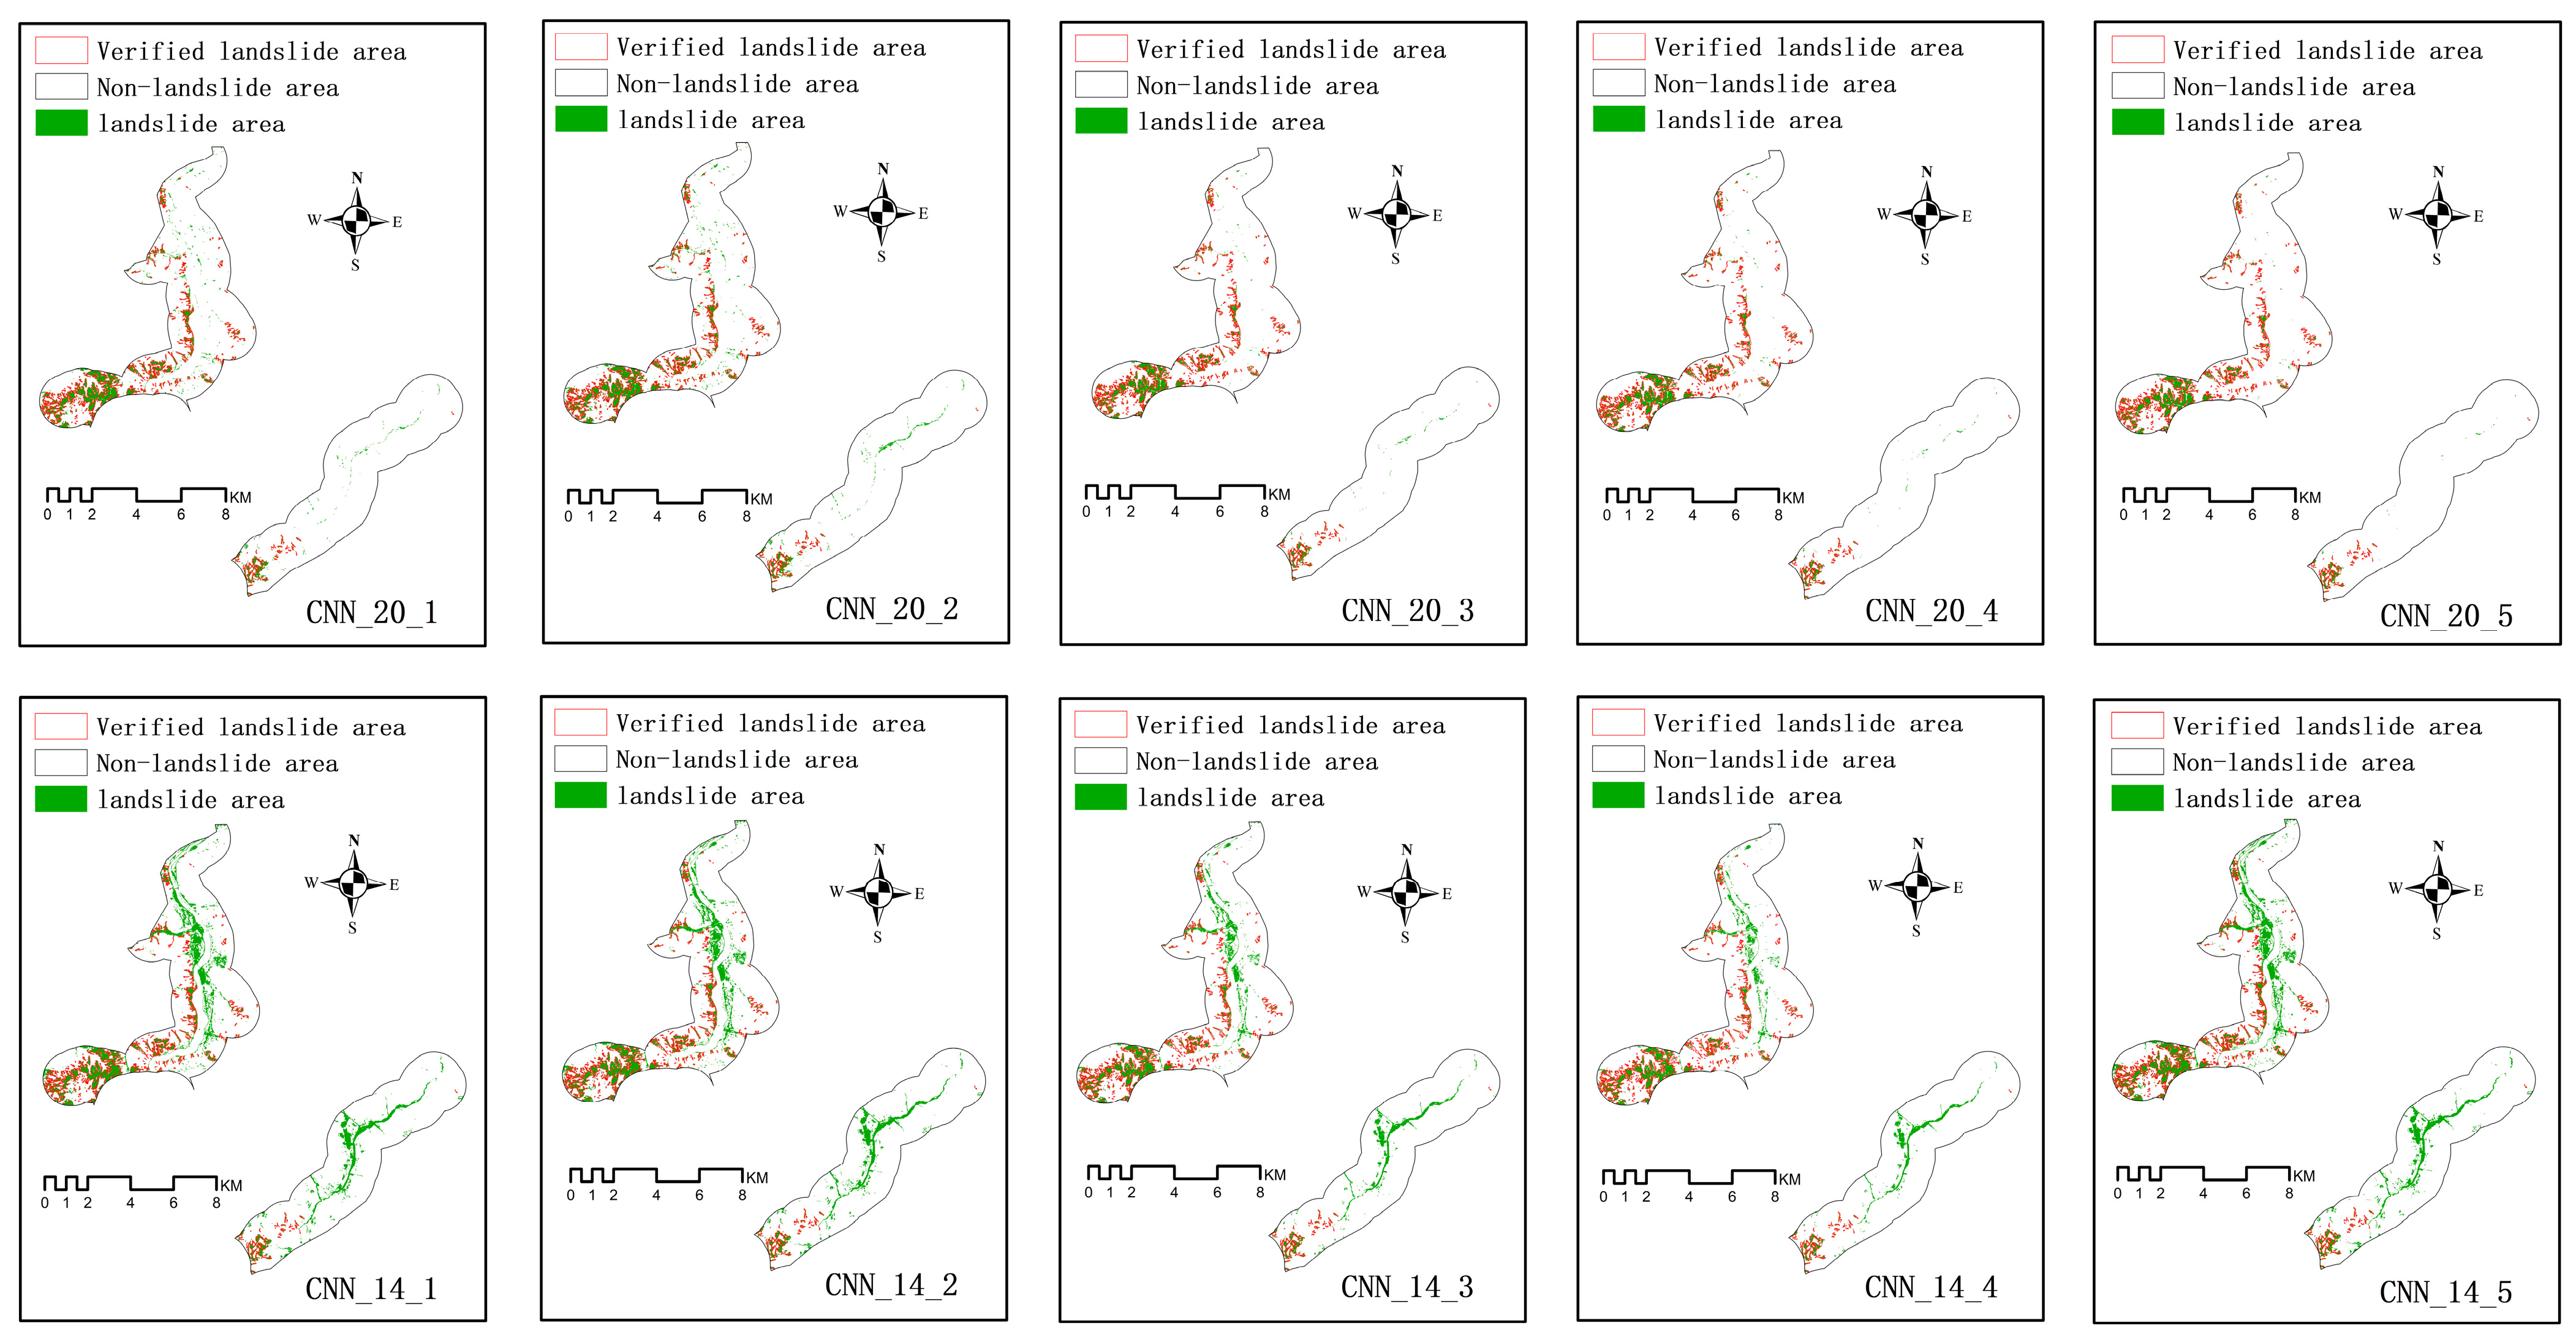
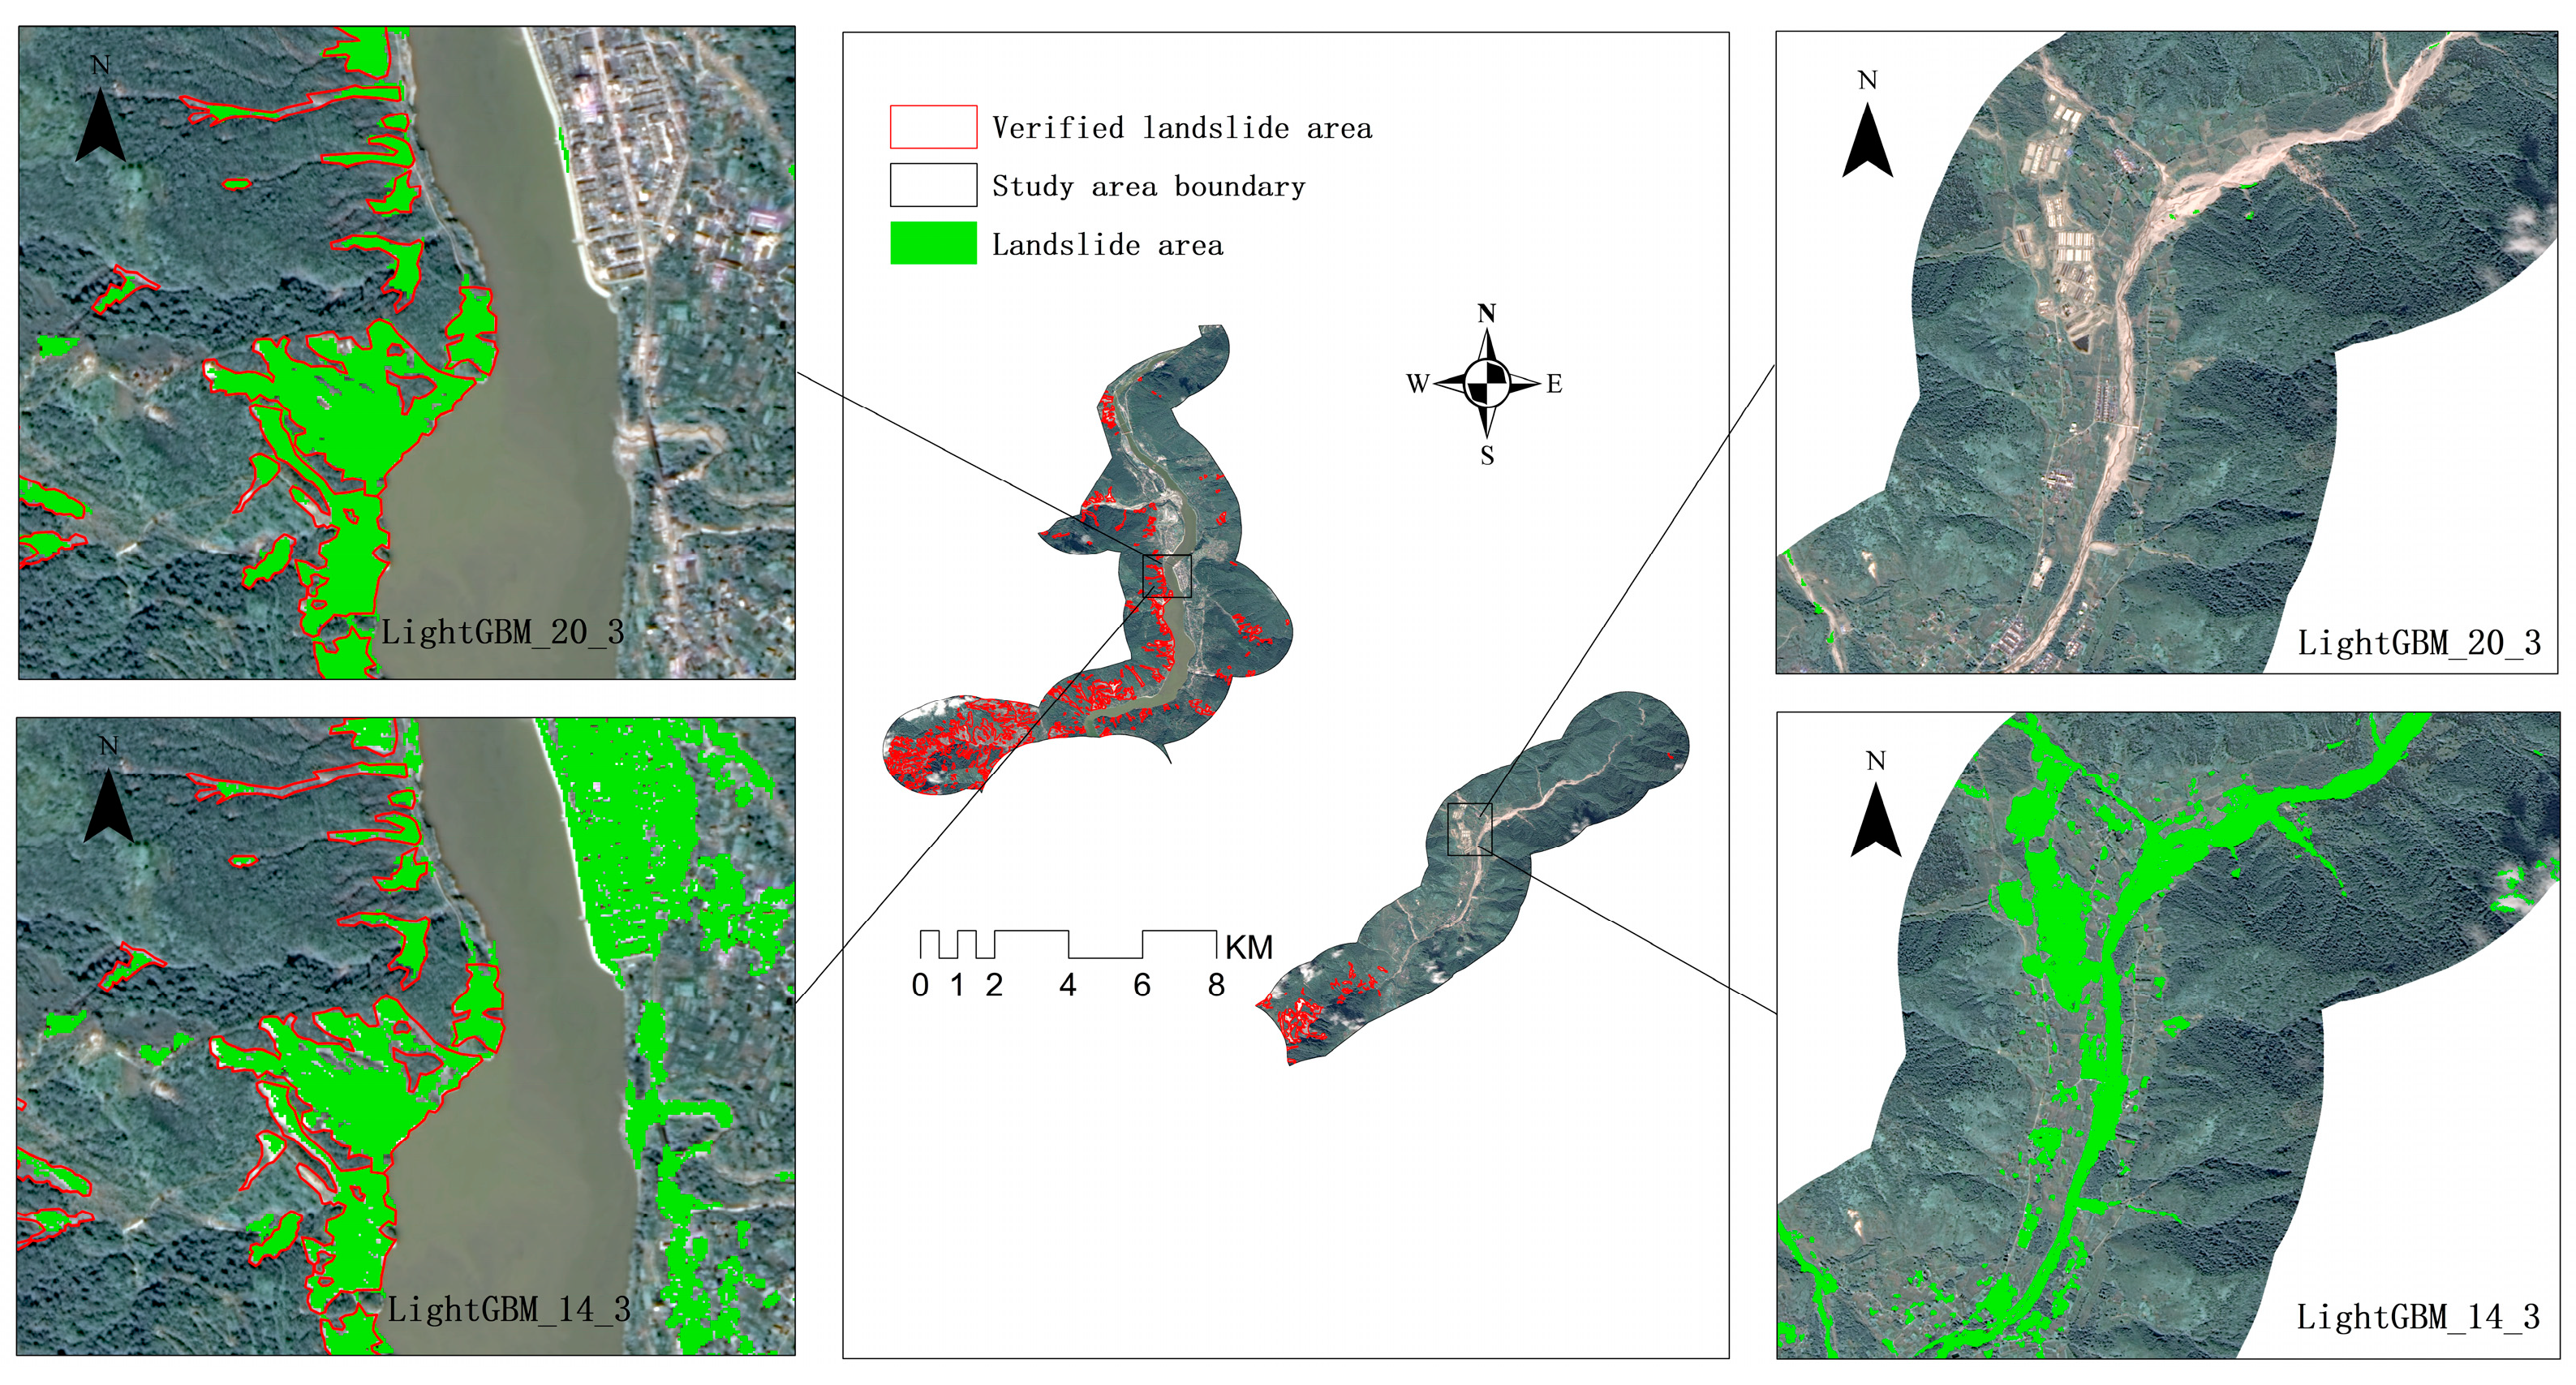
4.1. Landslide Recognition Results Based on ML Models and Ablation Experiments
4.2. Model Performance Evaluation
5. Discussion
5.1. The Effectiveness of Comparing Different ML Methods
5.2. The Influence of Different P/N Sample Ratios on Landslide Identification Results
5.3. The Influence of Terrain Features on Landslide Identification Results
5.4. Comparative Analysis of Similar Studies
6. Conclusions
Author Contributions
Funding
Data Availability Statement
Conflicts of Interest
References
- Wang, Y.; Wu, X.; Chen, Z.; Ren, F.; Feng, L.; Du, Q. Optimizing the Predictive Ability of Machine Learning Methods for Landslide Susceptibility Mapping Using SMOTE for Lishui City in Zhejiang Province, China. Int. J. Environ. Res. Public Health 2019, 16, 368. [Google Scholar] [CrossRef]
- Zhou, X.; Wen, H.; Zhang, Y.; Xu, J.; Zhang, W. Landslide susceptibility mapping using hybrid random forest with GeoDetector and RFE for factor optimization. Geosci. Front. 2021, 12, 101211. [Google Scholar] [CrossRef]
- Wang, Z.; Wang, D.; Guo, Q.; Wang, D. Regional landslide hazard assessment through integrating susceptibility index and rainfall process. Nat. Hazards 2020, 104, 2153–2173. [Google Scholar] [CrossRef]
- Darrow, M.; Nelson, V.; Grilliot, M.; Wartman, J.; Jacobs, A.; Baichtal, J.; Buxton, C. Geomorphology and initiation mechanisms of the 2020 Haines, Alaska landslide. Landslides 2022, 19, 2177–2188. [Google Scholar] [CrossRef]
- Koarai, M.; Sato, H.P.; Une, H.; Kamiya, I. Interpretation of high-resolution satellite images to detect the landform changes and disaster damages: Case study of the northern Pakistan earthquake. In Proceedings of the SPIE Asia-Pacific Remote Sensing, Goa, India, 12 December 2006. [Google Scholar] [CrossRef]
- Danneels, G.; Pirard, E.; Havenith, H. Automatic landslide detection from remote sensing images using supervised classification methods. In Proceedings of the 2007 IEEE International Geoscience and Remote Sensing Symposium, Barcelona, Spain, 23–28 July 2007; pp. 3014–3017. [Google Scholar]
- Chen, T.; Trinder, J.C.; Niu, R. Object-Oriented Landslide Mapping Using ZY-3 Satellite Imagery, Random Forest and Mathematical Morphology, for the Three-Gorges Reservoir, China. Remote Sens. 2017, 9, 333. [Google Scholar] [CrossRef]
- Song, Y.; Hao, L.; Yan, L.; Wang, Y.; Chang, H. Application of Support Vector Machine in Landslide Identification, China. J. Lanzhou Univ. (Nat. Sci. Ed.) 2022, 58, 727–734. [Google Scholar] [CrossRef]
- SS, V.C.; Shaji, E. Landslide identification using machine learning techniques: Review, motivation, and future prospects. Earth Sci. Inform. 2022, 15, 2063–2090. [Google Scholar] [CrossRef]
- Dias, H.C.; Hölbling, D.; Grohmann, C.H. Rainfall-Induced Shallow Landslide Recognition and Transferability Using Object-Based Image Analysis in Brazil. Remote Sens. 2023, 15, 5137. [Google Scholar] [CrossRef]
- Naidu, S.; Sajinkumar, K.S.; Oommen, T.; Anuja, V.J.; Samuel, R.A.; Muraleedharan, C. Early warning system for shallow landslides using rainfall threshold and slope stability analysis. Geosci. Front. 2018, 9, 1871–1882. [Google Scholar] [CrossRef]
- Yin, W.; Niu, C.; Bai, Y.; Zhang, L.; Ma, D.; Zhang, S.; Zhou, X.; Xue, Y. An Adaptive Identification Method for Potential Landslide Hazards Based on Multisource Data. Remote Sens. 2023, 15, 1865. [Google Scholar] [CrossRef]
- Guzzetti, F.; Mondini, A.; Cardinali, M.; Fiorucci, F.; Santangelo, M.; Chang, K. Landslide inventory maps: New tools for an old problem. Earth-Sci. Rev. 2012, 112, 42–66. [Google Scholar] [CrossRef]
- Ghorbanzadeh, O.; Shahabi, H.; Crivellari, A.; Homayouni, S.; Blaschke, T.; Ghamisi, P. Landslide detection using deep learning and object-based image analysis. Landslides 2022, 19, 929–939. [Google Scholar] [CrossRef]
- Xu, C. Preparation of earthquake-triggered landslide inventory maps using remote sensing and GIS technologies: Principles and case studies. Geosci. Front. 2015, 6, 825–836. [Google Scholar] [CrossRef]
- Lu, Z.; Peng, Y.; Li, W.; Yu, J.; Ge, D.; Han, L.; Xiang, W. An Iterative Classification and Semantic Segmentation Network for Old Landslide Detection Using High-Resolution Remote Sensing Images. IEEE Trans. Geosci. Remote Sens. 2023, 61, 4408813. [Google Scholar] [CrossRef]
- Galli, M.; Ardizzone, F.; Cardinali, M.; Guzzetti, F.; Reichenbach, P. Comparing landslide inventory maps. Geomorphology 2008, 94, 268–289. [Google Scholar] [CrossRef]
- Wang, H.; Zhang, L.; Wang, L.; Fan, R.; Zhou, S.; Qiang, Y.; Peng, M. Machine learning powered high-resolution co-seismic landslide detection. Gondwana Res. 2023, 123, 217–237. [Google Scholar] [CrossRef]
- Asadi, A.; Baise, L.G.; Koch, M.; Moaveni, B.; Chatterjee, S.; Aimaiti, Y. Pixel-based classification method for earthquake-induced landslide mapping using remotely sensed imagery, geospatial data and temporal change information. Nat. Hazards 2024, 120, 5163–5200. [Google Scholar] [CrossRef]
- Kavzoglu, T.; Colkesen, I.; Sahin, E.K. Machine Learning Techniques in Landslide Susceptibility Mapping: A Survey and a Case Study. In Landslides: Theory, Practice and Modelling; Pradhan, S., Vishal, V., Singh, T., Eds.; Advances in Natural and Technological Hazards Research; Springer: Cham, Switzerland, 2019; Volume 50. [Google Scholar] [CrossRef]
- Alcántara-Ayala, I.; Sassa, K. Contribution of the International Consortium on Landslides to the implementation of the Sendai Framework for Disaster Risk Reduction: Engraining to the Science and Technology Roadmap. Landslides 2021, 18, 21–29. [Google Scholar] [CrossRef]
- Merghadi, A.; Yunus, A.P.; Dou, J.; Whiteley, J.; ThaiPham, B.; Bui, D.T.; Avtar, R.; Abderrahmane, B. Machine learning methods for landslide susceptibility studies: A comparative overview of algorithm performance. Earth Sci. Rev. 2020, 7, 10325. [Google Scholar] [CrossRef]
- Ju, Y.; Xu, Q.; Jin, S.; Li, W.; Su, Y.; Dong, X.; Guo, Q. Loess Landslide Detection Using Object Detection Algorithms in Northwest China. Remote Sens. 2022, 14, 1182. [Google Scholar] [CrossRef]
- Wang, H.; Zhang, L.; Yin, K.; Luo, H.; Li, J. Landslide identification using machine learning. Geosci. Front. 2021, 12, 351–364. [Google Scholar] [CrossRef]
- Gorsevski, P.; Brown, M.; Panter, K.; Onasch, C.M.; Simic, A.; Snyder, J. Landslide Detection and Susceptibility Mapping Using LiDAR and An Artificial Neural Network Approach: A Case Study in the Cuyahoga Valley National Park, Ohio. Landslides 2016, 13, 467–484. [Google Scholar] [CrossRef]
- Ramos-Bernal, R.N.; Vázquez-Jiménez, R.; Cantú-Ramírez, C.A.; Alarcón-Paredes, A.; Alonso-Silverio, G.A.; Bruzón, A.G.; Arrogante-Funes, F.; Martín-González, F.; Novillo, C.J.; Arrogante-Funes, P. Evaluation of conditioning factors of slope instability and continuous change maps in the generation of landslide inventory maps using machine learning (ml) algorithms. Remote Sens. 2021, 13, 4515. [Google Scholar] [CrossRef]
- Mezaal, M.R.; Pradhan, B.; Rizeei, H.M. Improving landslide detection from airborne laser scanning data using optimized dempster–shafer. Remote Sens. 2018, 10, 1029. [Google Scholar] [CrossRef]
- Chen, S.; Zhou, R. Landslide detection based on color feature model and svm in remote sensing imagery. Spacecr. Recovery Remote Sens. 2020, 40, 89–98. [Google Scholar]
- Tien Bui, D.; Shahabi, H.; Shirzadi, A.; Chapi, K.; Alizadeh, M.; Chen, W.; Mohammadi, A.; Ahmad, B.B.; Panahi, M.; Hong, H.; et al. Landslide detection and susceptibility mapping by airsar data using support vector machine and index of entropy models in cameron highlands, malaysia. Remote Sens. 2018, 10, 1527. [Google Scholar] [CrossRef]
- Li, X.; Cheng, X.; Chen, W.; Chen, G.; Liu, S. Identification of forested landslides using lidar data, object-based image analysis, and machine learning algorithms. Remote Sens. 2015, 7, 9705–9726. [Google Scholar] [CrossRef]
- Chen, X.; Liu, M.; Li, D.; Jia, J.; Yang, A.; Zheng, W.; Yin, L. Conv-trans dual network for landslide detection of multi-channel optical remote sensing images. Front. Earth Sci. 2023, 11, 1182145. [Google Scholar] [CrossRef]
- Sameen, M.I.; Pradhan, B. Landslide detection using residual networks and the fusion of spectral and topographic information. IEEE Access 2019, 7, 114363–114373. [Google Scholar] [CrossRef]
- Ji, S.; Yu, D.; Shen, C.; Li, W.; Xu, Q. Landslide detection from an open satellite imagery and digital elevation model dataset using attention boosted convolutional neural networks. Landslides 2020, 17, 1337–1352. [Google Scholar] [CrossRef]
- Sun, D.; Gu, Q.; Wen, H.; Xu, J.; Zhang, Y.; Shi, S.; Xue, M.; Zhou, X. Assessment of landslide susceptibility along mountain highways based on different machine learning algorithms and mapping units by hybrid factors screening and sample optimization. Gondwana Res. 2023, 123, 89–106. [Google Scholar] [CrossRef]
- Singh, P.; Maurya, V.; Dwivedi, R. Pixel Based Landslide Identification Using Landsat 8 and GEE. In Proceedings of the 2021 IEEE International Geoscience and Remote Sensing Symposium IGARSS, Brussels, Belgium, 11–16 July 2021; pp. 8444–8447. [Google Scholar]
- Hong, H. Assessing landslide susceptibility based on hybrid Best-first decision tree with ensemble learning model. Ecol. Indic. 2023, 147, 109968. [Google Scholar] [CrossRef]
- Zeng, T.; Wu, L.; Peduto, D.; Glade, T.; Hayakawa, Y.S.; Yin, K. Ensemble learning framework for landslide susceptibility mapping: Different basic classifier and ensemble strategy. Geosci. Front. 2023, 14, 101645. [Google Scholar] [CrossRef]
- Yang, C.; Liu, L.-L.; Huang, F.; Huang, L.; Wang, X.-M. Machine learning-based landslide susceptibility assessment with optimized ratio of landslide to non-landslide samples. Gondwana Res. 2023, 123, 198–216. [Google Scholar] [CrossRef]
- Chang, Z.; Huang, J.; Huang, F.; Bhuyan, K.; Meena, S.R.; Catani, F. Uncertainty analysis of non-landslide sample selection in landslide susceptibility prediction using slope unit-based machine learning models. Gondwana Res. 2023, 117, 307–320. [Google Scholar] [CrossRef]
- Liu, Q.; Tang, A.; Huang, D. Exploring the uncertainty of landslide susceptibility assessment caused by the number of non–landslides. Catena 2023, 227, 107109. [Google Scholar] [CrossRef]
- Cruden, D.; Varnes, D. Landslides: Investigation and mitigation. Chapter 3: Landslide types and processes. Transp. Res. Board Spec. Rep. 1966, 247, 36–75. [Google Scholar]
- Imanian, A.; Tangestani, M.H.; Asadi, A. Application of radar and optical satellite imagery data in landslide potential mapping of sheshpeer sub-catchment in iran. Int. Arch. Photogramm. Remote Sens. Spat. Inf. Sci. 2019, 42, 547–552. [Google Scholar] [CrossRef]
- Li, Z.; Shi, W.; Lu, P.; Yan, L.; Wang, Q.; Miao, Z. Landslide mapping from aerial photographs using change detection-based Markov random field. Remote Sens. Environ. 2016, 187, 76–90. [Google Scholar] [CrossRef]
- Li, S.; Li, Y.; An, Y. Automatic identification of landslide disasters based on change detection, China. Remote Sens. Infor-Mation 2010, 1, 27–31. [Google Scholar]
- Han, Y.; Wang, P.; Zheng, Y.; Yasir, M.; Xu, C.; Nazir, S.; Hossain, M.S.; Ullah, S.; Khan, S. Extraction of Landslide Information Based on Object-Oriented Approach and Cause Analysis in Shuicheng, China. Remote Sens. 2022, 14, 502. [Google Scholar] [CrossRef]
- Yang, S.; Wang, Y.; Wang, P.; Mu, J.; Jiao, S.; Zhao, X.; Wang, Z.; Wang, K.; Zhu, Y. Automatic Identification of Landslides Based on Deep Learning. Appl. Sci. 2022, 12, 8153. [Google Scholar] [CrossRef]
- Piralilou, S.T.; Shahabi, H.; Jarihani, B.; Ghorbanzadeh, O.; Blaschke, T.; Gholamnia, K.; Meena, S.R.; Aryal, J. Landslide Detection Using Multi-Scale Image Segmentation and Different Machine Learning Models in the Higher Himalayas. Remote Sens. 2019, 11, 2575. [Google Scholar] [CrossRef]
- Ghorbanzadeh, O.; Blaschke, T.; Gholamnia, K.; Meena, S.R.; Tiede, D.; Aryal, J. Evaluation of Different Machine Learning Methods and Deep-Learning Convolutional Neural Networks for Landslide Detection. Remote Sens. 2019, 11, 196. [Google Scholar] [CrossRef]
- Deng, X. Research on Geological Hazard Risk Assessment of the Dadu River Detuo and Jiajun River Section. Master’s Thesis, Chengdu University of Technology, Chengdu, China, 2011. [Google Scholar]
- Zhuo, L.; Huang, Y.; Zheng, J.; Cao, J.; Guo, D. Landslide Susceptibility Mapping in Guangdong Province, China, Using Random Forest Model and Considering Sample Type and Balance. Sustainability 2023, 15, 9024. [Google Scholar] [CrossRef]
- Moosavi, V.; Niazi, Y. Development of Hybrid Wavelet PacketStatistical Models (WP-SM) for Landslide Susceptibility Mapping. Lanslides. Landslides 2016, 13, 97–114. [Google Scholar] [CrossRef]
- Tehrani, F.S.; Calvello, M.; Liu, Z.; Zhang, L.; Lacasse, S. Machine learning and landslide studies: Recent advances and applications. Nat. Hazards 2022, 114, 1197–1245. [Google Scholar] [CrossRef]
- Chen, T.; Guestrin, C. XGBoost: A Scalable Tree Boosting System. In Proceedings of the 22nd ACM SIGKDD International Conference on Knowledge Discovery and Data Mining, San Francisco, CA, USA, 13–17 August 2016; Association for Computing Machinery: New York, NY, USA, 2016; pp. 785–794. [Google Scholar]
- Freund, Y.; Schapire, R.E. A decision-theoretic generalization of online learning and an application to boosting. J. Comput. Syst. Sci. 1997, 55, 119–139. [Google Scholar] [CrossRef]
- Ke, G.; Meng, Q.; Finley, T.; Wang, T.; Chen, W.; Ma, W.; Ye, Q.; Liu, T. LightGBM: A Highly Efficient Gradient Boosting De-cision Tree. Adv. Neural Inf. Process. Syst. 2017, 30, 3149–3157. [Google Scholar]
- Breiman, L. Random Forests. Mach. Learn. 2001, 45, 5–32. [Google Scholar] [CrossRef]
- Goodfellow, I.; Bengio, Y.; Courville, A. Deep Learning. Genet. Program. Evolvable Mach. 2017, 19, 305–307. [Google Scholar]
- Hong, H. Assessing landslide susceptibility based on hybrid multilayer perceptron with ensemble learning. Bull. Eng. Geol. Environ. 2023, 82, 382. [Google Scholar] [CrossRef]
- An, X.; Mi, C.; Sun, D.; Wen, H. Comparative Study on Landslide Susceptibility in the Three Gorges Reservoir Area Based on Different Evaluation Units: Take Yunyang County in Chongqing as an Example. J. Jilin Univ. (Earth Sci. Ed.) 2023, 53, 1–11. [Google Scholar] [CrossRef]
- Biswas, M.; Pramanik, R.; Sen, S.; Sinitca, A.; Kaplun, D.; Sarkar, R. Microstructural segmentation using a union of attention guided U-Net models with different color transformed images. Sci. Rep. 2023, 13, 5737. [Google Scholar] [CrossRef] [PubMed]
- Yu, H.; Pei, W.; Zhang, J.; Chen, G. Landslide Susceptibility Mapping and Driving Mechanisms in a Vulnerable Region Based on Multiple Machine Learning Models. Remote Sens. 2023, 15, 1886. [Google Scholar] [CrossRef]
- Ng, C.W.W.; Yang, B.; Liu, Z.Q.; Kwan, J.S.H.; Chen, L. Spatiotemporal modelling of rainfall-induced landslides using machine learning. Landslides 2021, 18, 2499–2514. [Google Scholar] [CrossRef]
- Cai, H.; Han, H.; Zhang, Y.; Wang, L. Convolutional neural network landslide identification based on topographic feature fusion. J. Earth Sci. Environ. 2022, 44, 568–579. [Google Scholar]


| Type | Feature Name | Characterization |
|---|---|---|
| Remote sensing features | Red | Red band |
| Green | Green band | |
| Blue | Blue band | |
| Nir | Near-infrared band | |
| Gray level co-occurrence matrix (GLCM) contrast | This reflects the total amount of localized changes in the image. | |
| GLCM correlation | Reflects the length of extension of a specific gray value in a particular direction. | |
| GLCM dissimilarity | Similar to contrast, it is a measure of the amount of local variation in an image. | |
| GLCM entropy | This reflects the complexity of the image. | |
| GLCM homogeneity | The image reflects the local gray uniformity. | |
| GLCM mean | This reflects the uniformity of the gray tone in the image. | |
| GLCM second moment | This reflects the localized homogeneity of the image. | |
| GLCM variance | This reflects the roughness or fineness of the image. | |
| NDVI | Normalized Difference Vegetation Index, which has the formula (Nir − Red)/(Nir + Red). | |
| NDWI | Normalized Difference Water Index, which has the formula (Nir − Green)/(Nir + Green) | |
| Topographic features | DEM | Elevation of a surface or feature in relation to a reference point. |
| Slope | The degree of tilt of the Earth’s surface. | |
| Aspect | The direction in which the Earth’s surface is tilted. | |
| Relief | The degree of undulation on the Earth’s surface. | |
| Planform curvature | The curvature of the terrain surface in the horizontal direction reflects the degree of curvature of contour lines. | |
| Profile curvature | The curvature of the terrain surface perpendicular to the contour line reflects the degree of unevenness of the slope surface. |
| Algorithm Name | Optimal Parameter |
|---|---|
| XGBoost | n_estimators: 400 Learning_rate: 0.1 max_depth: 4 |
| AdaBoost | n_estimators: 2000 Learning_rate: 1 |
| LightGBM | num_boost_round: 700 num_leaves: 50 learning_rate: 0.1 |
| RF | Number of decision trees: 120 |
| CNN | Optimizer: Adam epochs: 10 Learning_rate: 0.001 batch_size: 6000 |
| Model Name | A (%) | P (%) | R (%) | F1 (%) | IOU (%) |
|---|---|---|---|---|---|
| XGBoost_14_1 | 91.04 | 42.97 | 86.51 | 57.42 | 39.76 |
| XGBoost_14_2 | 92.47 | 47.63 | 78.43 | 59.27 | 42.29 |
| XGBoost_14_3 | 93.24 | 51.12 | 71.83 | 59.73 | 43.24 |
| XGBoost_14_4 | 93.63 | 53.56 | 66.64 | 59.39 | 43.11 |
| XGBoost_14_5 | 93.92 | 55.79 | 62.04 | 58.75 | 42.67 |
| XGBoost_20_1 | 96.73 | 71.82 | 87.59 | 78.92 | 65.52 |
| XGBoost_20_2 | 97.32 | 80.29 | 81.77 | 81.02 | 70.36 |
| XGBoost_20_3 | 97.43 | 84.45 | 77.54 | 80.85 | 71.13 |
| XGBoost_20_4 | 97.41 | 86.87 | 74.19 | 80.03 | 70.33 |
| XGBoost_20_5 | 97.36 | 88.53 | 71.40 | 79.05 | 69.15 |
| Model Name | A (%) | P (%) | R (%) | F1 (%) | IOU (%) |
|---|---|---|---|---|---|
| AdaBoost_14_1 | 90.92 | 42.49 | 84.95 | 56.65 | 39.01 |
| AdaBoost_14_2 | 92.28 | 46.78 | 77.03 | 58.21 | 41.15 |
| AdaBoost_14_3 | 92.90 | 49.40 | 70.72 | 58.17 | 41.57 |
| AdaBoost_14_4 | 93.22 | 51.16 | 65.38 | 57.40 | 41.11 |
| AdaBoost_14_5 | 93.45 | 52.68 | 60.93 | 56.50 | 40.42 |
| AdaBoost_20_1 | 96.78 | 72.49 | 86.89 | 79.04 | 65.62 |
| AdaBoost_20_2 | 97.27 | 80.25 | 80.84 | 80.54 | 69.30 |
| AdaBoost_20_3 | 97.32 | 83.82 | 76.42 | 79.95 | 69.29 |
| AdaBoost_20_4 | 97.29 | 86.15 | 72.91 | 78.98 | 68.35 |
| AdaBoost_20_5 | 97.21 | 87.88 | 69.77 | 77.79 | 66.93 |
| Model Name | A (%) | P (%) | R (%) | F1 (%) | IOU (%) |
|---|---|---|---|---|---|
| LightGBM_14_1 | 90.86 | 42.41 | 86.33 | 56.88 | 39.25 |
| LightGBM_14_2 | 92.22 | 46.61 | 78.08 | 58.38 | 41.39 |
| LightGBM_14_3 | 92.96 | 49.74 | 71.54 | 58.68 | 42.12 |
| LightGBM_14_4 | 93.46 | 52.50 | 66.17 | 58.55 | 42.25 |
| LightGBM_14_5 | 93.74 | 54.61 | 61.54 | 57.87 | 41.78 |
| LightGBM_20_1 | 96.76 | 72.25 | 87.13 | 78.99 | 65.66 |
| LightGBM_20_2 | 97.39 | 81.42 | 81.23 | 81.33 | 70.76 |
| LightGBM_20_3 | 97.47 | 85.40 | 76.95 | 80.95 | 71.28 |
| LightGBM_20_4 | 97.44 | 87.75 | 73.61 | 80.06 | 70.40 |
| LightGBM_20_5 | 97.36 | 89.21 | 70.83 | 78.96 | 69.06 |
| Model Name | A (%) | P (%) | R (%) | F1 (%) | IOU (%) |
|---|---|---|---|---|---|
| RF_14_1 | 91.17 | 43.33 | 85.74 | 57.57 | 39.97 |
| RF_14_2 | 92.68 | 48.49 | 77.61 | 59.69 | 41.79 |
| RF_14_3 | 93.44 | 52.24 | 71.25 | 60.28 | 43.84 |
| RF_14_4 | 93.89 | 55.21 | 66.14 | 60.18 | 44.00 |
| RF_14_5 | 94.15 | 57.56 | 61.72 | 59.57 | 43.56 |
| RF_20_1 | 96.65 | 71.97 | 85.14 | 78.01 | 64.84 |
| RF_20_2 | 97.03 | 78.72 | 78.74 | 78.73 | 67.47 |
| RF_20_3 | 97.11 | 82.50 | 74.45 | 78.27 | 67.50 |
| RF_20_4 | 97.10 | 84.98 | 71.08 | 77.41 | 66.73 |
| RF_20_5 | 97.02 | 86.08 | 68.45 | 76.26 | 65.26 |
| Model Name | A (%) | P (%) | R (%) | F1 (%) | IOU (%) |
|---|---|---|---|---|---|
| CNN_14_1 | 90.20 | 40.78 | 87.73 | 55.62 | 37.82 |
| CNN_14_2 | 91.83 | 45.27 | 79.89 | 57.76 | 40.53 |
| CNN_14_3 | 92.91 | 49.50 | 70.98 | 58.30 | 41.67 |
| CNN_14_4 | 93.17 | 50.94 | 66.43 | 57.59 | 41.15 |
| CNN_14_5 | 93.26 | 51.35 | 67.31 | 58.25 | 41.77 |
| CNN_20_1 | 96.79 | 72.65 | 87.07 | 79.13 | 65.86 |
| CNN_20_2 | 97.17 | 80.97 | 78.80 | 79.57 | 68.28 |
| CNN_20_3 | 97.38 | 83.15 | 77.53 | 80.71 | 70.22 |
| CNN_20_4 | 97.35 | 87.15 | 73.02 | 79.30 | 68.93 |
| CNN_20_5 | 97.18 | 89.28 | 68.50 | 77.05 | 66.20 |
| Author | Study Area | A (%) | P (%) | IOU (%) |
|---|---|---|---|---|
| The author of this study | Detuo Township, Sichuan Province, China | 97.47 1 | 85.40 2 | 71.28 3 |
| Ghorbanzadeh, O. et al. (2019) [48] | Rasuwa Region, Nepal | / | 83.31 3 | 78.26 1 |
| Wang, H. et al. (2021) [24] | Lantau Island, Hong Kong, China | 89.32 2 | 92.58 1 | / |
| Cai, J. et al. (2022) [63] | Hongkou Township, Sichuan Province, China | / | 71.66 4 | 71.70 2 |
| Asadi, A. et al. (2024) [19] | Kyushu Island, Japan | 83.6 3 | / | / |
Disclaimer/Publisher’s Note: The statements, opinions and data contained in all publications are solely those of the individual author(s) and contributor(s) and not of MDPI and/or the editor(s). MDPI and/or the editor(s) disclaim responsibility for any injury to people or property resulting from any ideas, methods, instructions or products referred to in the content. |
© 2024 by the authors. Published by MDPI on behalf of the International Society for Photogrammetry and Remote Sensing. Licensee MDPI, Basel, Switzerland. This article is an open access article distributed under the terms and conditions of the Creative Commons Attribution (CC BY) license (https://creativecommons.org/licenses/by/4.0/).
Share and Cite
Wang, J.; Wang, Z.; Peng, L.; Qian, C. Landslide Recognition Based on Machine Learning Considering Terrain Feature Fusion. ISPRS Int. J. Geo-Inf. 2024, 13, 306. https://doi.org/10.3390/ijgi13090306
Wang J, Wang Z, Peng L, Qian C. Landslide Recognition Based on Machine Learning Considering Terrain Feature Fusion. ISPRS International Journal of Geo-Information. 2024; 13(9):306. https://doi.org/10.3390/ijgi13090306
Chicago/Turabian StyleWang, Jincan, Zhiheng Wang, Liyao Peng, and Chenzhihao Qian. 2024. "Landslide Recognition Based on Machine Learning Considering Terrain Feature Fusion" ISPRS International Journal of Geo-Information 13, no. 9: 306. https://doi.org/10.3390/ijgi13090306