Abstract
Autism spectrum disorder (ASD) has become an emerging public health problem. The impact of multiple environmental factors on the prevalence of ASD remains unclear. This study examined the association between the prevalence of ASD and the environmental quality index (EQI), an indicator of cumulative environmental quality in five major domains, including air, water, land, built and sociodemographic variables in the United States. The results from Poisson regression models show that the prevalence of ASD has a positive association with the overall EQI with a risk ratio (RR) of 1.03 and 95% confidence intervals (CI) of 1.01–1.06, indicating that children in counties with poor environmental quality might have a higher risk of ASD. Additionally, the prevalence of ASD has a positive association with the air index (RR = 1.04, 95% CI: 1.01–1.06). These associations varied in different rural–urban groups and different climate regions. This study provided evidence for adverse effects of poor environmental quality, particularly air pollutants, on children’s neurodevelopment.
1. Introduction
Autism spectrum disorder (ASD), also known as autism, is a group of neurodevelopmental disorders that are typically diagnosed in early childhood. The symptoms of ASD often become noticeable at age 2–3, though some signs may appear earlier or later. Children with ASD often have difficulties in social communication and interaction, such as body language and facial expressions, and also have restricted or repetitive behaviors, such as hand-flapping or a rigid adherence to routines [1]. In the recent few decades, the prevalence of ASD has increased rapidly in the United States and globally [2,3]. The latest report from the Centers for Disease Control and Prevention (CDC) estimated that the ASD prevalence was about 1 in 36 children aged 8 years in 2020, which is a drastic increase compared with the prevalence of 1 in 150 children in 2000 in the United States [3]. Additionally, it is estimated that over 5.4 million adults have ASD in the United States [4]. Children with ASD often face a lifetime of adverse consequences, posing significant challenges to individuals and their families. The lifelong nature of ASD often requires ongoing support and intervention, which can impose substantial financial and emotional burdens on families. The economic impact includes costs associated with medical care and special education, as well as indirect costs such as lost productivity and caregiver stress [5,6,7]. As a result, ASD has become an emerging public health problem.
The etiology of ASD is not fully understood. Generally, it is believed that ASD is caused by a combination of genetic and environmental factors [8,9,10]. The contribution of genetic factors to the etiology of ASD has been recognized in several studies, which have shown that the risk of ASD onset is disproportionately increased among first-degree relatives of probands [11,12] and that the onset of ASD highly coincides among monozygotic twins [13,14]. However, genetic risk factors alone cannot explain the role of environmental factors in ASD.
In recent years, a large amount of evidence supports that exposure to environmental factors, including pesticides, phthalates, polychlorinated biphenyls (PCBs), solvents, toxic waste, heavy metals, and air pollution, have significantly contributed to the increase in the risk of autism [9,15,16,17,18,19,20,21,22,23,24,25,26,27,28,29,30,31,32,33,34,35,36,37,38,39]. Among these environmental risk factors, the effects of air pollutants have been widely investigated. However, no single environmental risk factor has been found to play a causal role in the onset of ASD [9,40]. In addition, some environmental factors may have beneficial effects. For example, Wu and Jackson found that greenspace was inversely associated with the risk of childhood autism in California public elementary school districts [41]. A cohort study in Metro Vancouver and Ontario, Canada found that exposure to greenspace during pregnancy was associated with a slight reduction in the likelihood of ASD [42]. The inverse association between greenspace and ASD has also been observed in case-control studies conducted in Shanghai, China and Ontario, Canada [43,44].
Children are likely to be exposed to multiple environmental factors, and different factors may have different effects on children’s neurodevelopment. Therefore, it is necessary to understand the cumulative effects of multiple environmental factors. Although the associations between ASD and some single environmental factors or constructs have been recognized, the combined effects of environmental factors across multiple constructs on ASD are still unknown. To fill this gap, the connection between ASD prevalence and environmental quality index was investigated. The environmental quality index (EQI), developed by the United States Environmental Protection Agency (USEPA), represents the information across five environmental domains, facilitating a comprehensive evaluation of environmental quality based on over 100 variables and enhancing our comprehension of how environmental quality influences health outcomes [45,46,47]. Although the EQI has been used to study various health outcomes [48,49,50,51,52], its application to ASD has been limited. Understanding the association between environmental quality and ASD is important for several reasons. First, it can inform public health strategies to reduce exposure to harmful conditions and improving overall environmental quality. Additionally, it can guide the development of effective and focused interventions for at-risk communities.
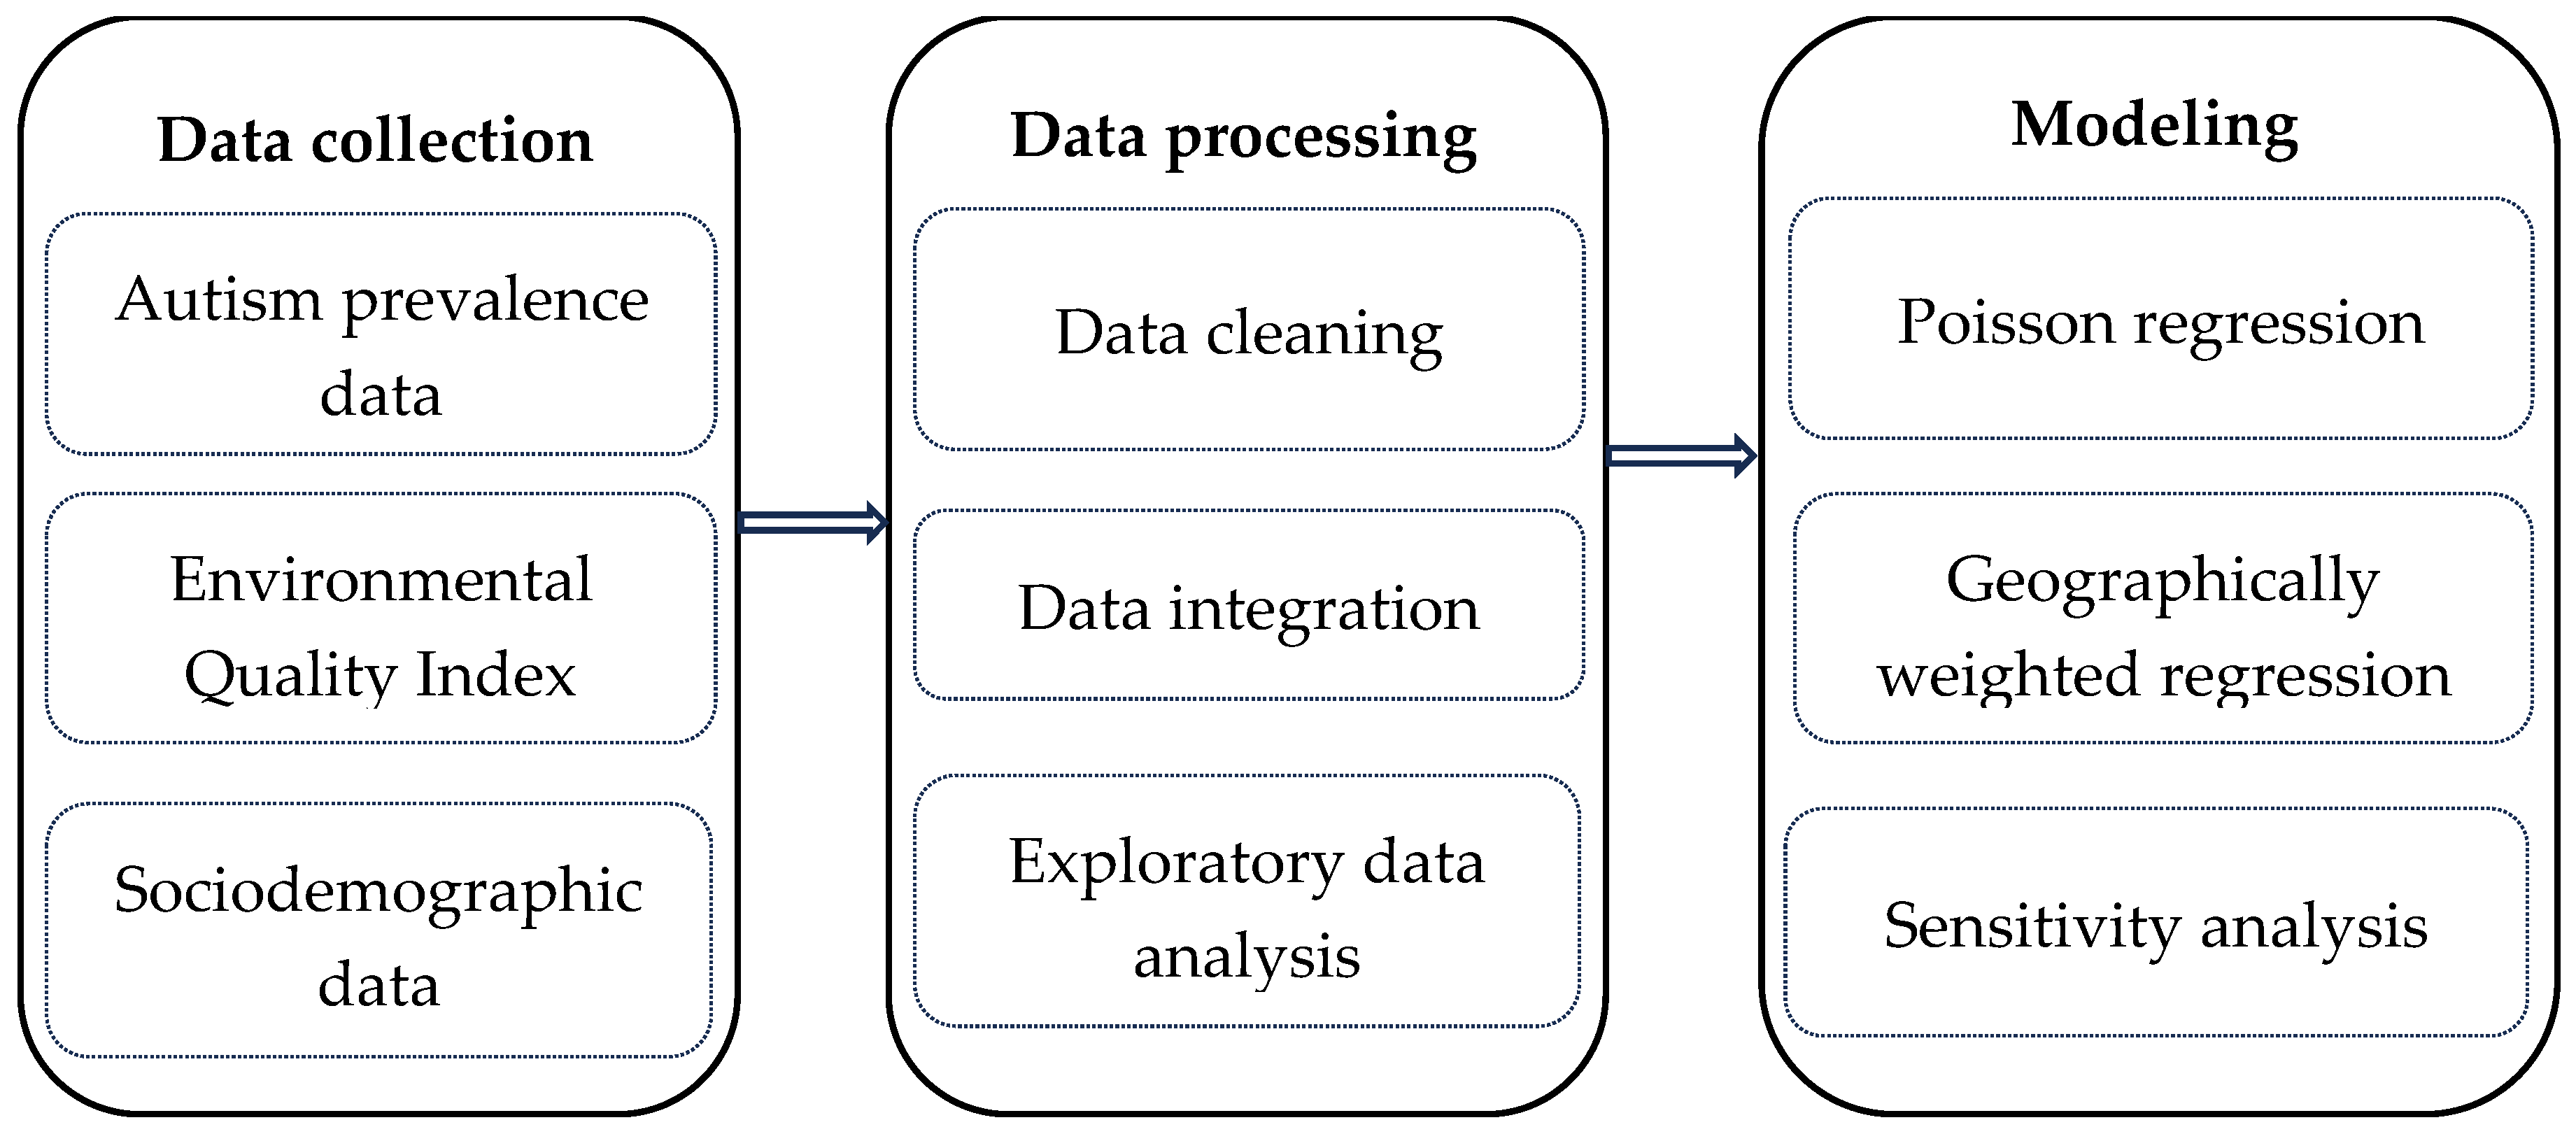
The objective of this study is to examine the association between ASD and environmental quality in the US. First, the study examined the associations of ASD prevalence with the overall environmental quality index (EQI) and the domain-specific indices using Poisson regression models. Then the spatial variations in the associations were examined by stratification of urbanicity and climate regions. Furthermore, the local variations in the associations were determined by geographically weighted regression (GWR) models. Finally, sensitivity analyses examined whether urbanicity or climate had an impact on the associations between ASD and EQI. The flowchart of the method is shown in Figure 1. The findings from this study provide insight into understanding the combined effects of environmental factors on the risk of ASD, thus helping to find approaches to reducing its risk.
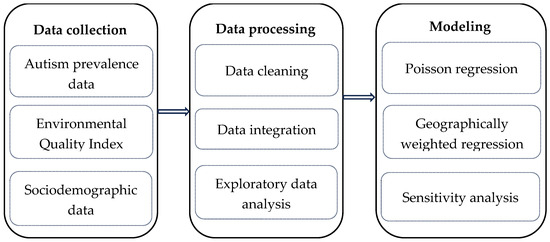
Figure 1.
The flowchart of the methodology of this study.
2. Materials and Methods
2.1. ASD Prevalence Data
The prevalence of ASD at the county level in the United States was determined with the 2016–2018 National Survey of Children’s Health (NSCH). The survey involves a sampling approach that selects an equal number of households from each state. Within these households, a child is randomly chosen, with a higher selection probability (80%) for those with special needs. The survey, managed by the US Census Bureau, was conducted via landline and cellular phones across all states and the District of Columbia, with responses collected from parents or guardians. The county-level prevalence of ASD was estimated from 70,913 children aged 5–17, using a model-based spatial small area estimation approach [53].
2.2. Environmental Quality Index
The EQI dataset, representing the ambient environmental quality in all counties in the United States during 2006–2010, was obtained from the USEPA (https://www.epa.gov/healthresearch/environmental-quality-index-eqi, accessed on 28 July 2024). The method to create the EQI was described elsewhere [45,46]. Briefly, 139 variables in different domains were collected and reduced to an overall EQI and five domain-specific EQIs, namely, air, water, land, built, and sociodemographics, using principal component analysis (PCA). The air domain includes data from monitoring, emissions, and modeled estimates to evaluate criteria and hazardous air pollutants. The water domain covers a range of data types—modeled, monitoring, reported, survey/study, and miscellaneous—to address water quality, contamination, domestic use, and other water-related factors. The land domain focuses on agriculture, pesticides, contaminants, facilities, and radon, reflecting land use and environmental contamination. The built environment domain assesses factors such as traffic, transit access, pedestrian safety, and access to essential services, including food, recreation, health care, education, and the presence of subsidized housing. Lastly, the sociodemographic domain evaluates crime and socioeconomic conditions to understand their impact on overall environmental quality and quality of life. A detailed list of these variables and the descriptive statistics are available in the EQI technical report [47].
2.3. Covariates
Considering environmental quality is different between urban and rural areas, we stratified the EQI into four groups based on the Rural–Urban Continuum codes (RUCC), including metropolitan urbanized (RUCC1), nonmetropolitan urbanized (RUCC2), less urbanized (RUCC3), and thinly populated (RUCC4) areas. The RUCC was developed by the US Department of Agriculture. Originally, it had 9 categories, but these were condensed into four categories in several studies [49,50,52].
To understand whether climate influences the association between ASD prevalence and EQI, we divided all counties into six climate regions following a previous study [50], including humid subtropical; Mediterranean; and three warm summer continental regions, dry continental, hot summer continental, and dry. These groups were derived from the original eighteen regions based on their monthly and annual average of precipitation and temperature.
We also collected additional sociodemographic data from the American Community Survey 5-year estimates (2016–2020) from the US Census Bureau. The variables include the total population; the percentages of white, black, and Asian; male and female; Hispanic-or-Latino and non-Hispanic-or-Latino; and under 5 years old and 5–17 years old, along with mean household income.
2.4. Statistical Analysis
All the datasets were merged using ArcGIS Pro 3.2 software (ERSI, Redlands, CA, USA) based on each county’s Federal Information Processing System (FIPS) code. A total of 3143 counties were included in the dataset. Before building regression models, we conducted exploratory analysis. We made histograms to show the distribution of each variable and conducted Pearson correlation analysis to obtain the preliminary relationship between these variables.
The Poisson regression model was used to examine the relationship between ASD prevalence and EQI. We chose the Poisson model because it is a well-established method for analyzing count data and rate-based outcomes, such as ASD prevalence. This model is particularly effective when the dependent variable represents the number of occurrences per unit of population. We examined the mean and variance of ASD prevalence and did not find evidence for over-dispersion of this variable. The model can be expressed as follows:
where i is the index of a county and is the expected ASD prevalence in county i. is the intercept, are the regression coefficients, are predictors, and is the error term. The link function is the natural logarithm.
Initially, each model only included one explanatory variable to obtain its unadjusted association with ASD prevalence. Then, each model included one EQI variable (overall EQI or domain-specific indices) and several covariates. The final model was adjusted for three covariates: race (the percentage of the black population), age (the percentage of the population aged 5–17 years), and population density. These three variables were included in the model for the following reasons. (1) The selection of race, age, and population density as covariates is based on in their significant potential to influence ASD prevalence and their ability to impact the relationship between environmental quality and ASD [54]. It has been shown that there are variations in ASD prevalence across different racial and ethnic groups. The adjustment for age ensures that the prevalence of ASD is not impacted due to variations in age distribution across counties. Population density can affect both the likelihood of ASD diagnosis and exposure to environmental factors. (2) They did not cause multicollinearity based on Pearson correlation analysis. (3) Finally, the model had a smaller Akaike information criterion (AIC) score compared with models with other variables. To determine the impacts of urbanicity and climate on the association between ASD prevalence and EQI, the models were stratified by each RUCC group and climate region, respectively. For all models, the EQI variables and other covariates were standardized (mean = 0, standard deviation = 1) to facilitate model interpretation. The association was indicated by risk ratio (RR) corresponding to a 1 standard deviation increase in explanatory variables. The association was assumed to be positive if RR is larger than 1, and negative if RR is less than 1. The significance level was set at 0.05. The analysis was conducted with SAS 9.4 (SAS Inc., Cary, NC, USA).
To determine if the ASD and EQI association varies by county, a geographically weighted regression (GWR) model was used. The GWR model was built on the above Poisson regression model. However, the regression coefficients for the Poisson model are fixed for all counties, while in the GWR model, regression coefficients were allowed to vary by county. The GWR model was chosen because it allows for the examination of spatial variations in the relationship between environmental factors and ASD prevalence. This model provides localized estimates of how the impact of environmental variables on ASD prevalence varies across different regions. This spatially explicit approach offers more precise insights into the environmental influences on ASD and supports specific interventions based on local conditions. A general GWR model can be written as below:
where, is the ASD prevalence at county i, is the intercept for county i, are the regression coefficients for county i, are predictors, and is the error term.
In GWR, the regression coefficients are estimated locally for each county i, reflecting how the relationship between ASD prevalence and EQI changes across space. This spatial variability is captured by weighting observed data based on their distance from the location of interest using a Gaussian kernel function. This approach allows the GWR model to account for spatial heterogeneity by giving more weight to nearby observations and less to those farther away. The GWR model was run on ArcGIS Pro 3.2 (ERSI, Redlands, CA, USA).
2.5. Sensitivity Analysis
Because the prevalence of ASD was estimated based on the sampling data, there is uncertainty in their values. To incorporate this uncertainty, we randomly simulated the ASD prevalence of each county 1000 times based on its point estimate and 95% confidence interval (95% CI), then ran the same Poisson regression model 1000 times using the simulated ASD prevalence as the response variable. Additionally, to examine whether the change in predictors affects the association between ASD prevalence and EQI, we included a gender variable (the percentage of the female population) in the Poisson regression model. Therefore, the model was adjusted for four variables.
3. Results
The descriptive statistics of ASD prevalence and related explanatory variables are shown in Table 1. The county-level average prevalence of ASD is 2.56% among children aged 5–17. The overall EQI and the five domain-specific indices had a mean of 0 and a standard deviation of 1. The correlation between ASD prevalence and those explanatory variables is shown in Table 2. ASD prevalence was positively correlated with the EQI’s overall, air, and built indices, but negatively correlated with land and sociodemographic indices. Additionally, ASD prevalence had positive correlations with population density, percentages of total population, black population, Asian population, and non-Hispanic or Latino population, but had negative correlations with the percentages of white population, Hispanic or Latino population. No significant correlation was observed between ASD prevalence and the mean household income.

Table 1.
Descriptive statistics of the response variable and explanatory variables.
Table 2.
Pearson correlation between ASD prevalence and explanatory variables.
The unadjusted Poisson regression model showed that ASD prevalence had significant positive associations with the EQI’s overall, air, and built indices, population density, and the percentages of black, Asian, and female, but had significant negative associations with the EQI’s land and sociodemographic indices, and the percentages of white, male, and children under 5 as well as aged 5–17. No significant associations were found with the mean household income and the two ethnic groups (Hispanic or Latino population and non-Hispanic or Latino population) (Table S1).
After adjusting for age, race, and population density, ASD prevalence still had significant positive associations with the EQI’s overall (RR = 1.03, 95% CI = 1.01–1.06), and air (RR = 1.04, 95% CI = 1.01–1.06) indices, but a negative association with the sociodemographic index (RR = 0.96, 95% CI = 0.94–0.98). There were no significant associations with the built, land, and water indices. The results from the multivariate models with all five domain-specific indices closely align with those obtained from the analyses with individual indices (Table 3).
Table 3.
Association between ASD prevalence and EQI from Poisson regression models adjusted for race, age and population density.
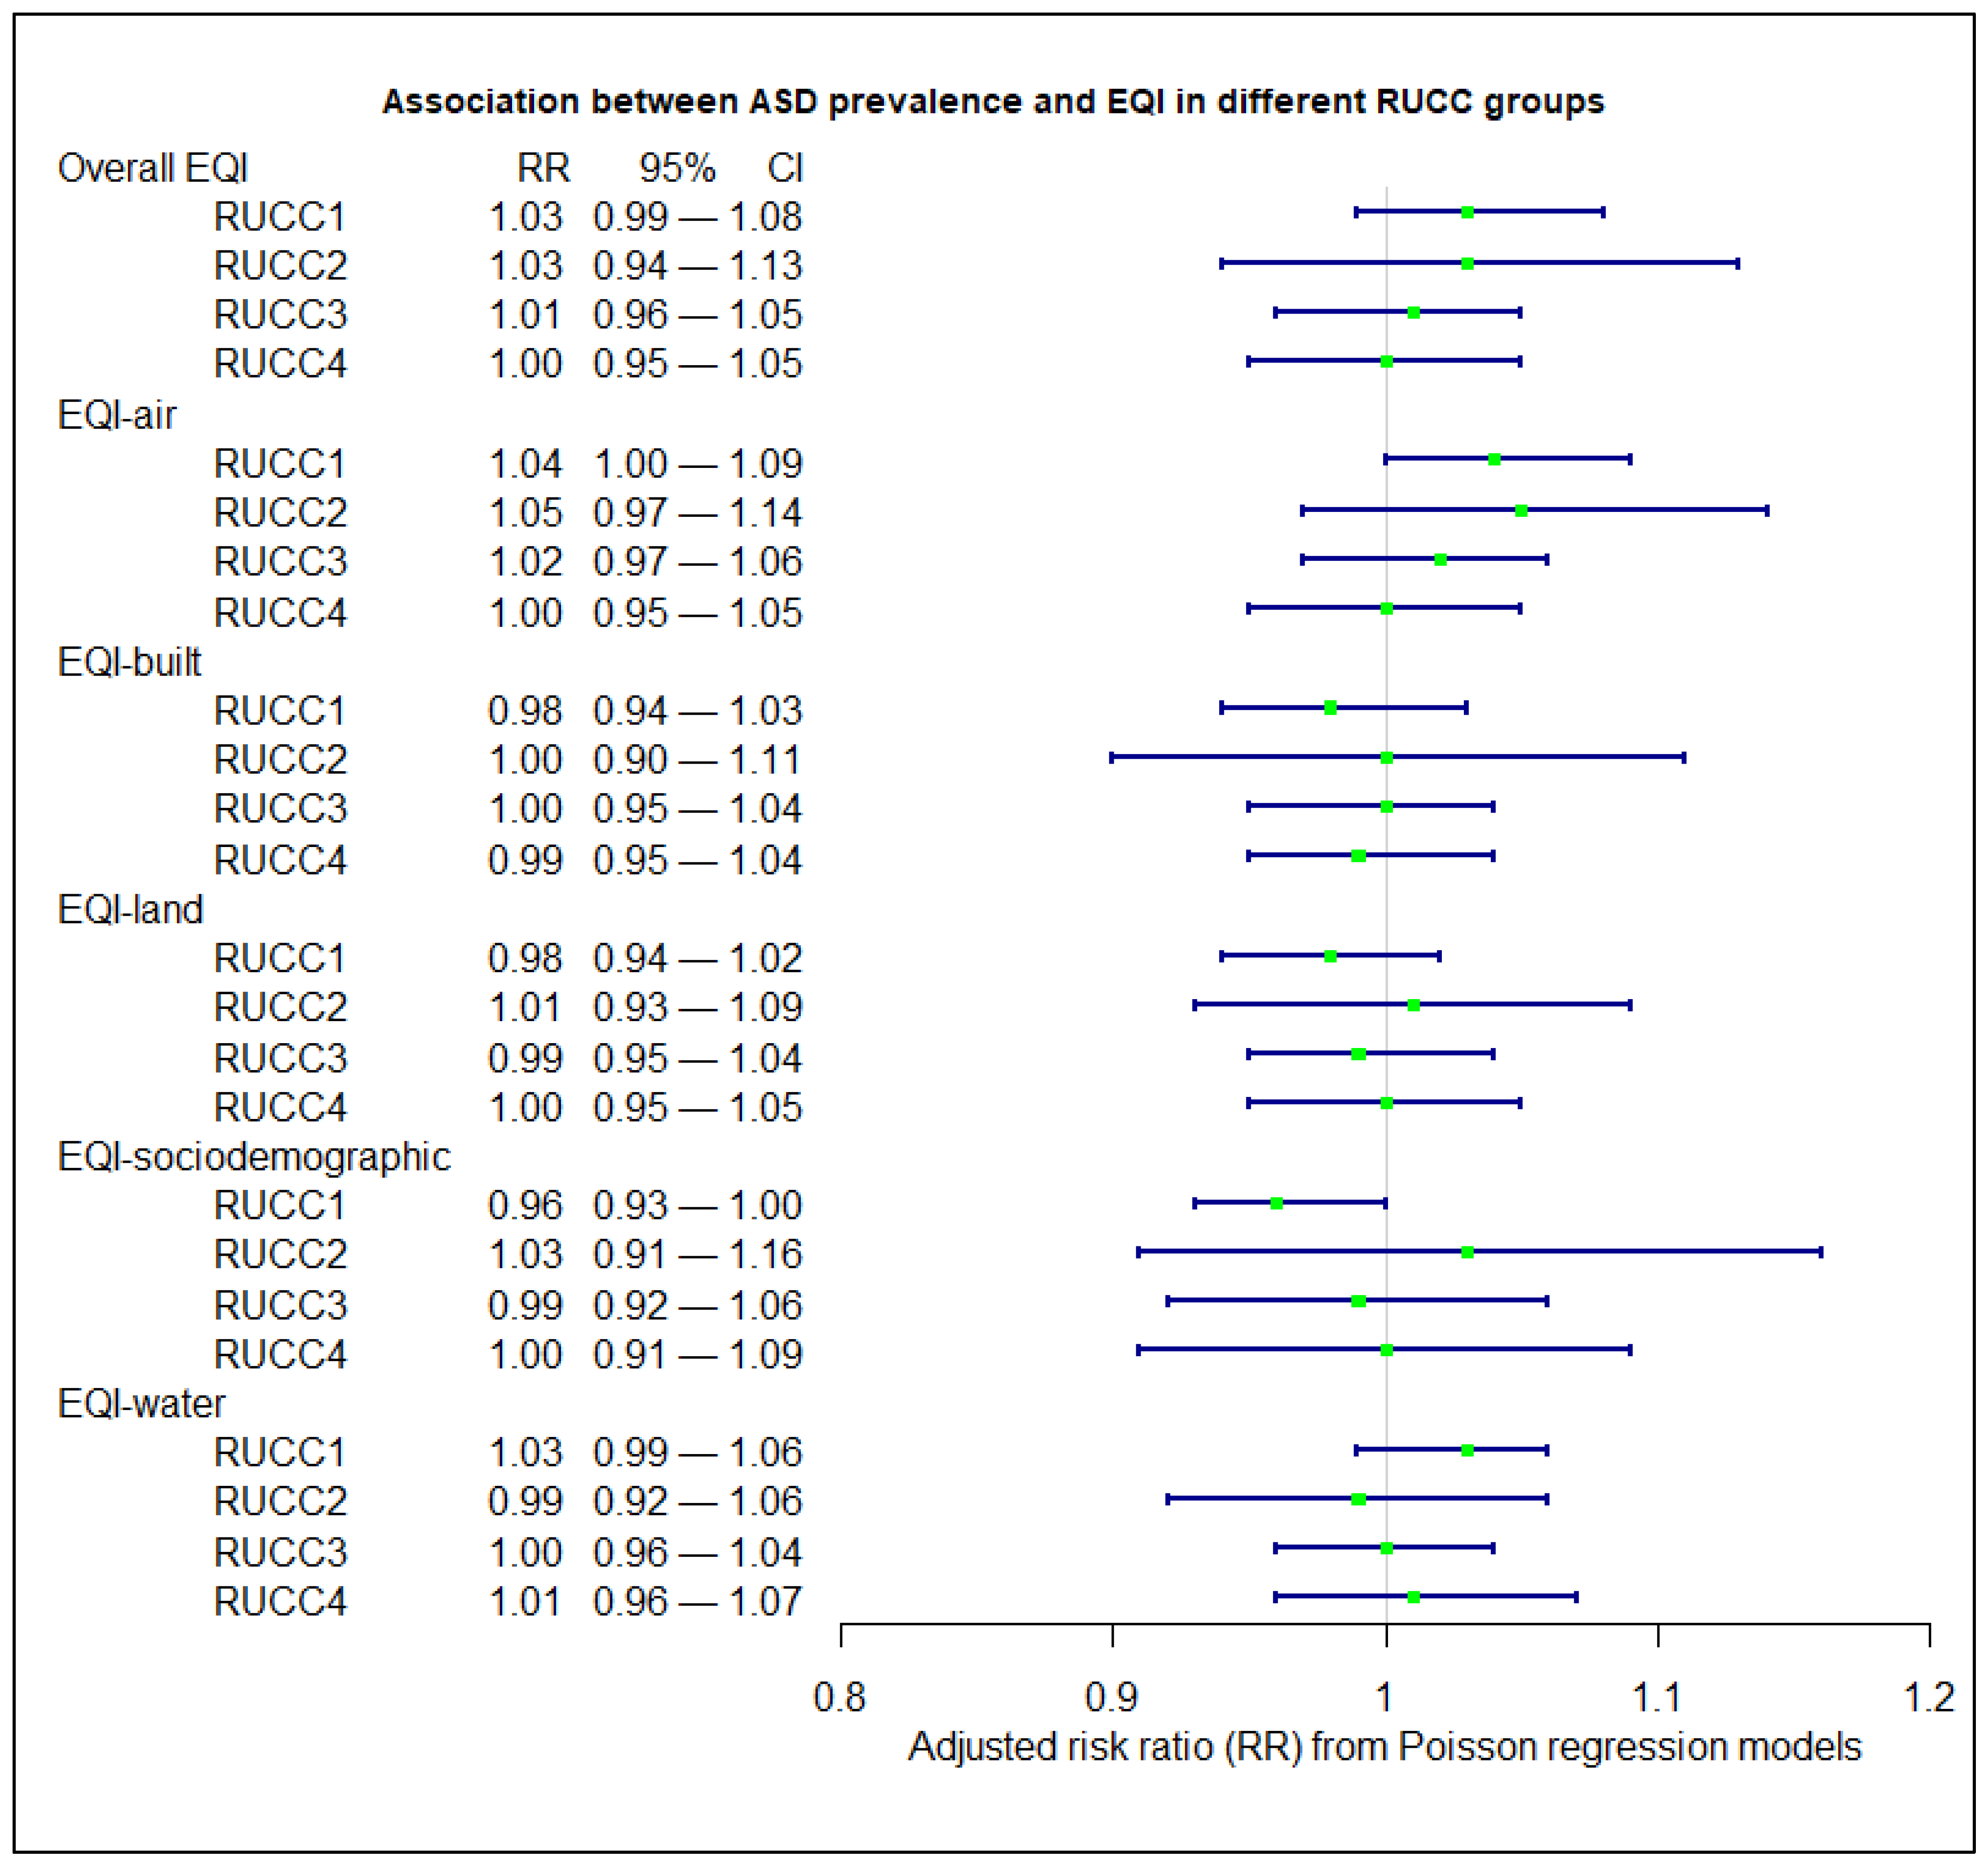
Figure 2 illustrates the associations from adjusted Poisson regression models stratified by RUCC. Significant associations were only observed in the RUCC1 group, metropolitan urbanized areas, where ASD prevalence was positively associated with the air index (RR = 1.04, 95% CI: 1.00–1.09) but negatively associated with the sociodemographic index (RR = 0.96, 95% CI: 0.94–1.00). No significant associations were observed for the other indices in other areas.
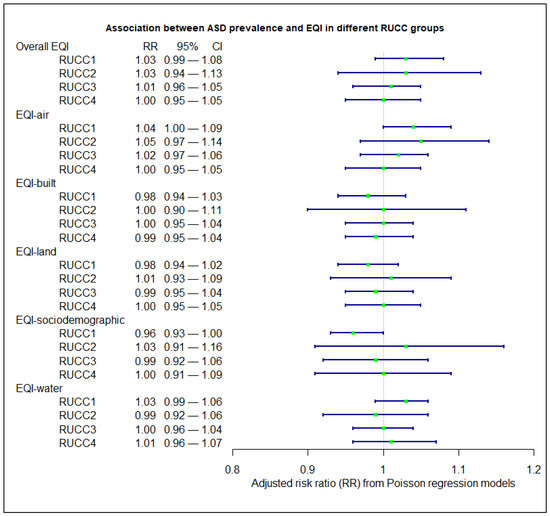
Figure 2.
Association between ASD prevalence and EQI in different RUCC groups from Poisson regression models adjusted for race, age, and population density.
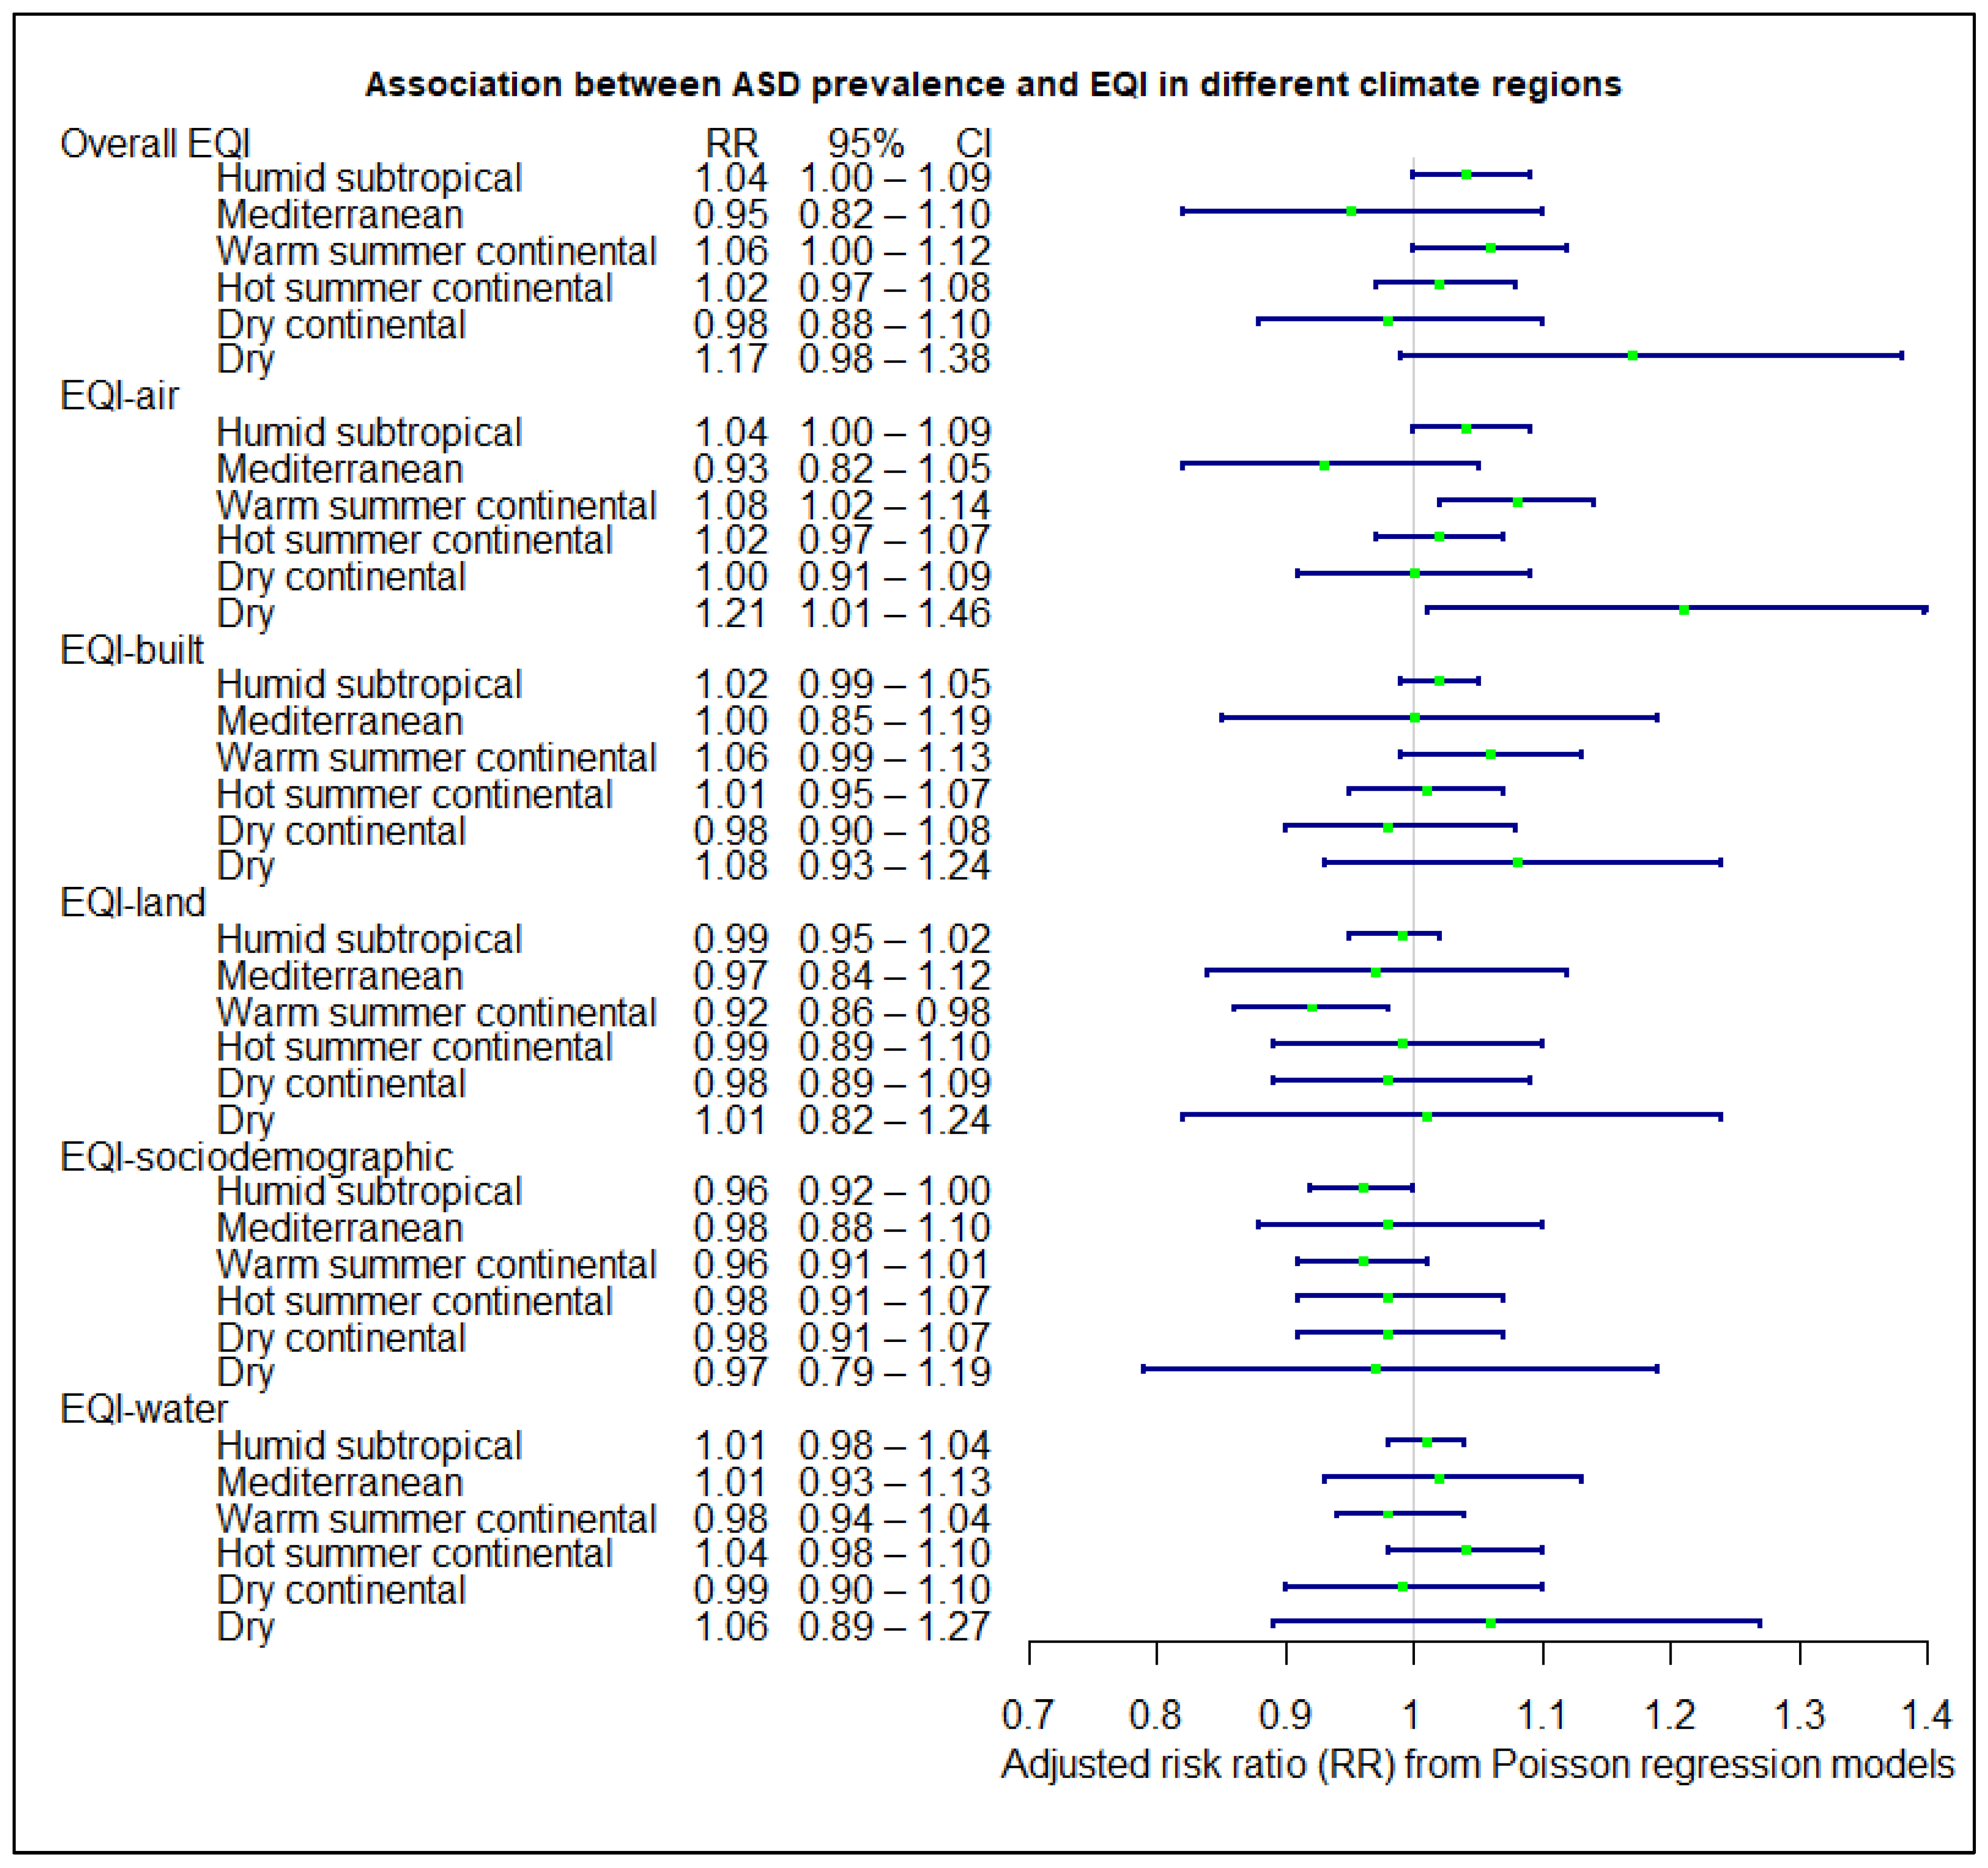
Figure 3 shows the associations stratified by climate regions. For the overall EQI, the associations were significant in the humid subtropical (RR = 1.04, 95% CI = 1.00–1.09) and warm summer continental (RR = 1.06, 95% CI = 1.00–1.12) regions. For domain-specific indices, the air index had positive associations with ASD prevalence in the humid subtropical (RR = 1.04, 95% CI = 1.00–1.09), warm summer continental (RR = 1.08, 95% CI = 1.02–1.14), and dry (RR = 1.21, 95% CI = 1.01–1.46) regions. The land index was negatively associated with ASD prevalence in warm summer continental (RR = 0.92, 95% CI = 0.86–0.96) regions. The sociodemographic index had a negative association in humid subtropical (RR = 0.96, 95% CI = 0.92–1.00). No significant associations were found with the built and water indices in any climate regions.
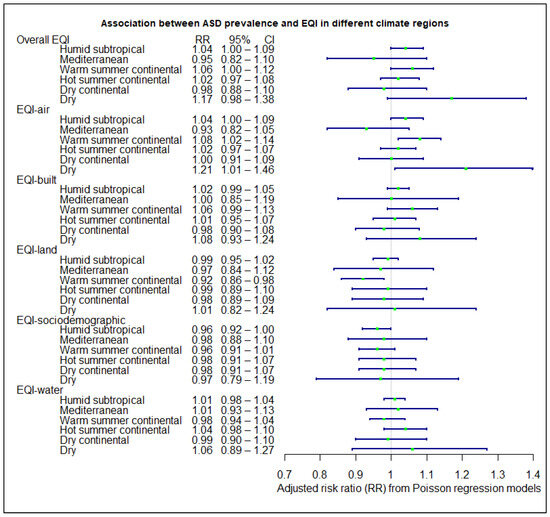
Figure 3.
Association between ASD prevalence and EQI in different climate regions from Poisson regression models adjusted for race, age, and population density.
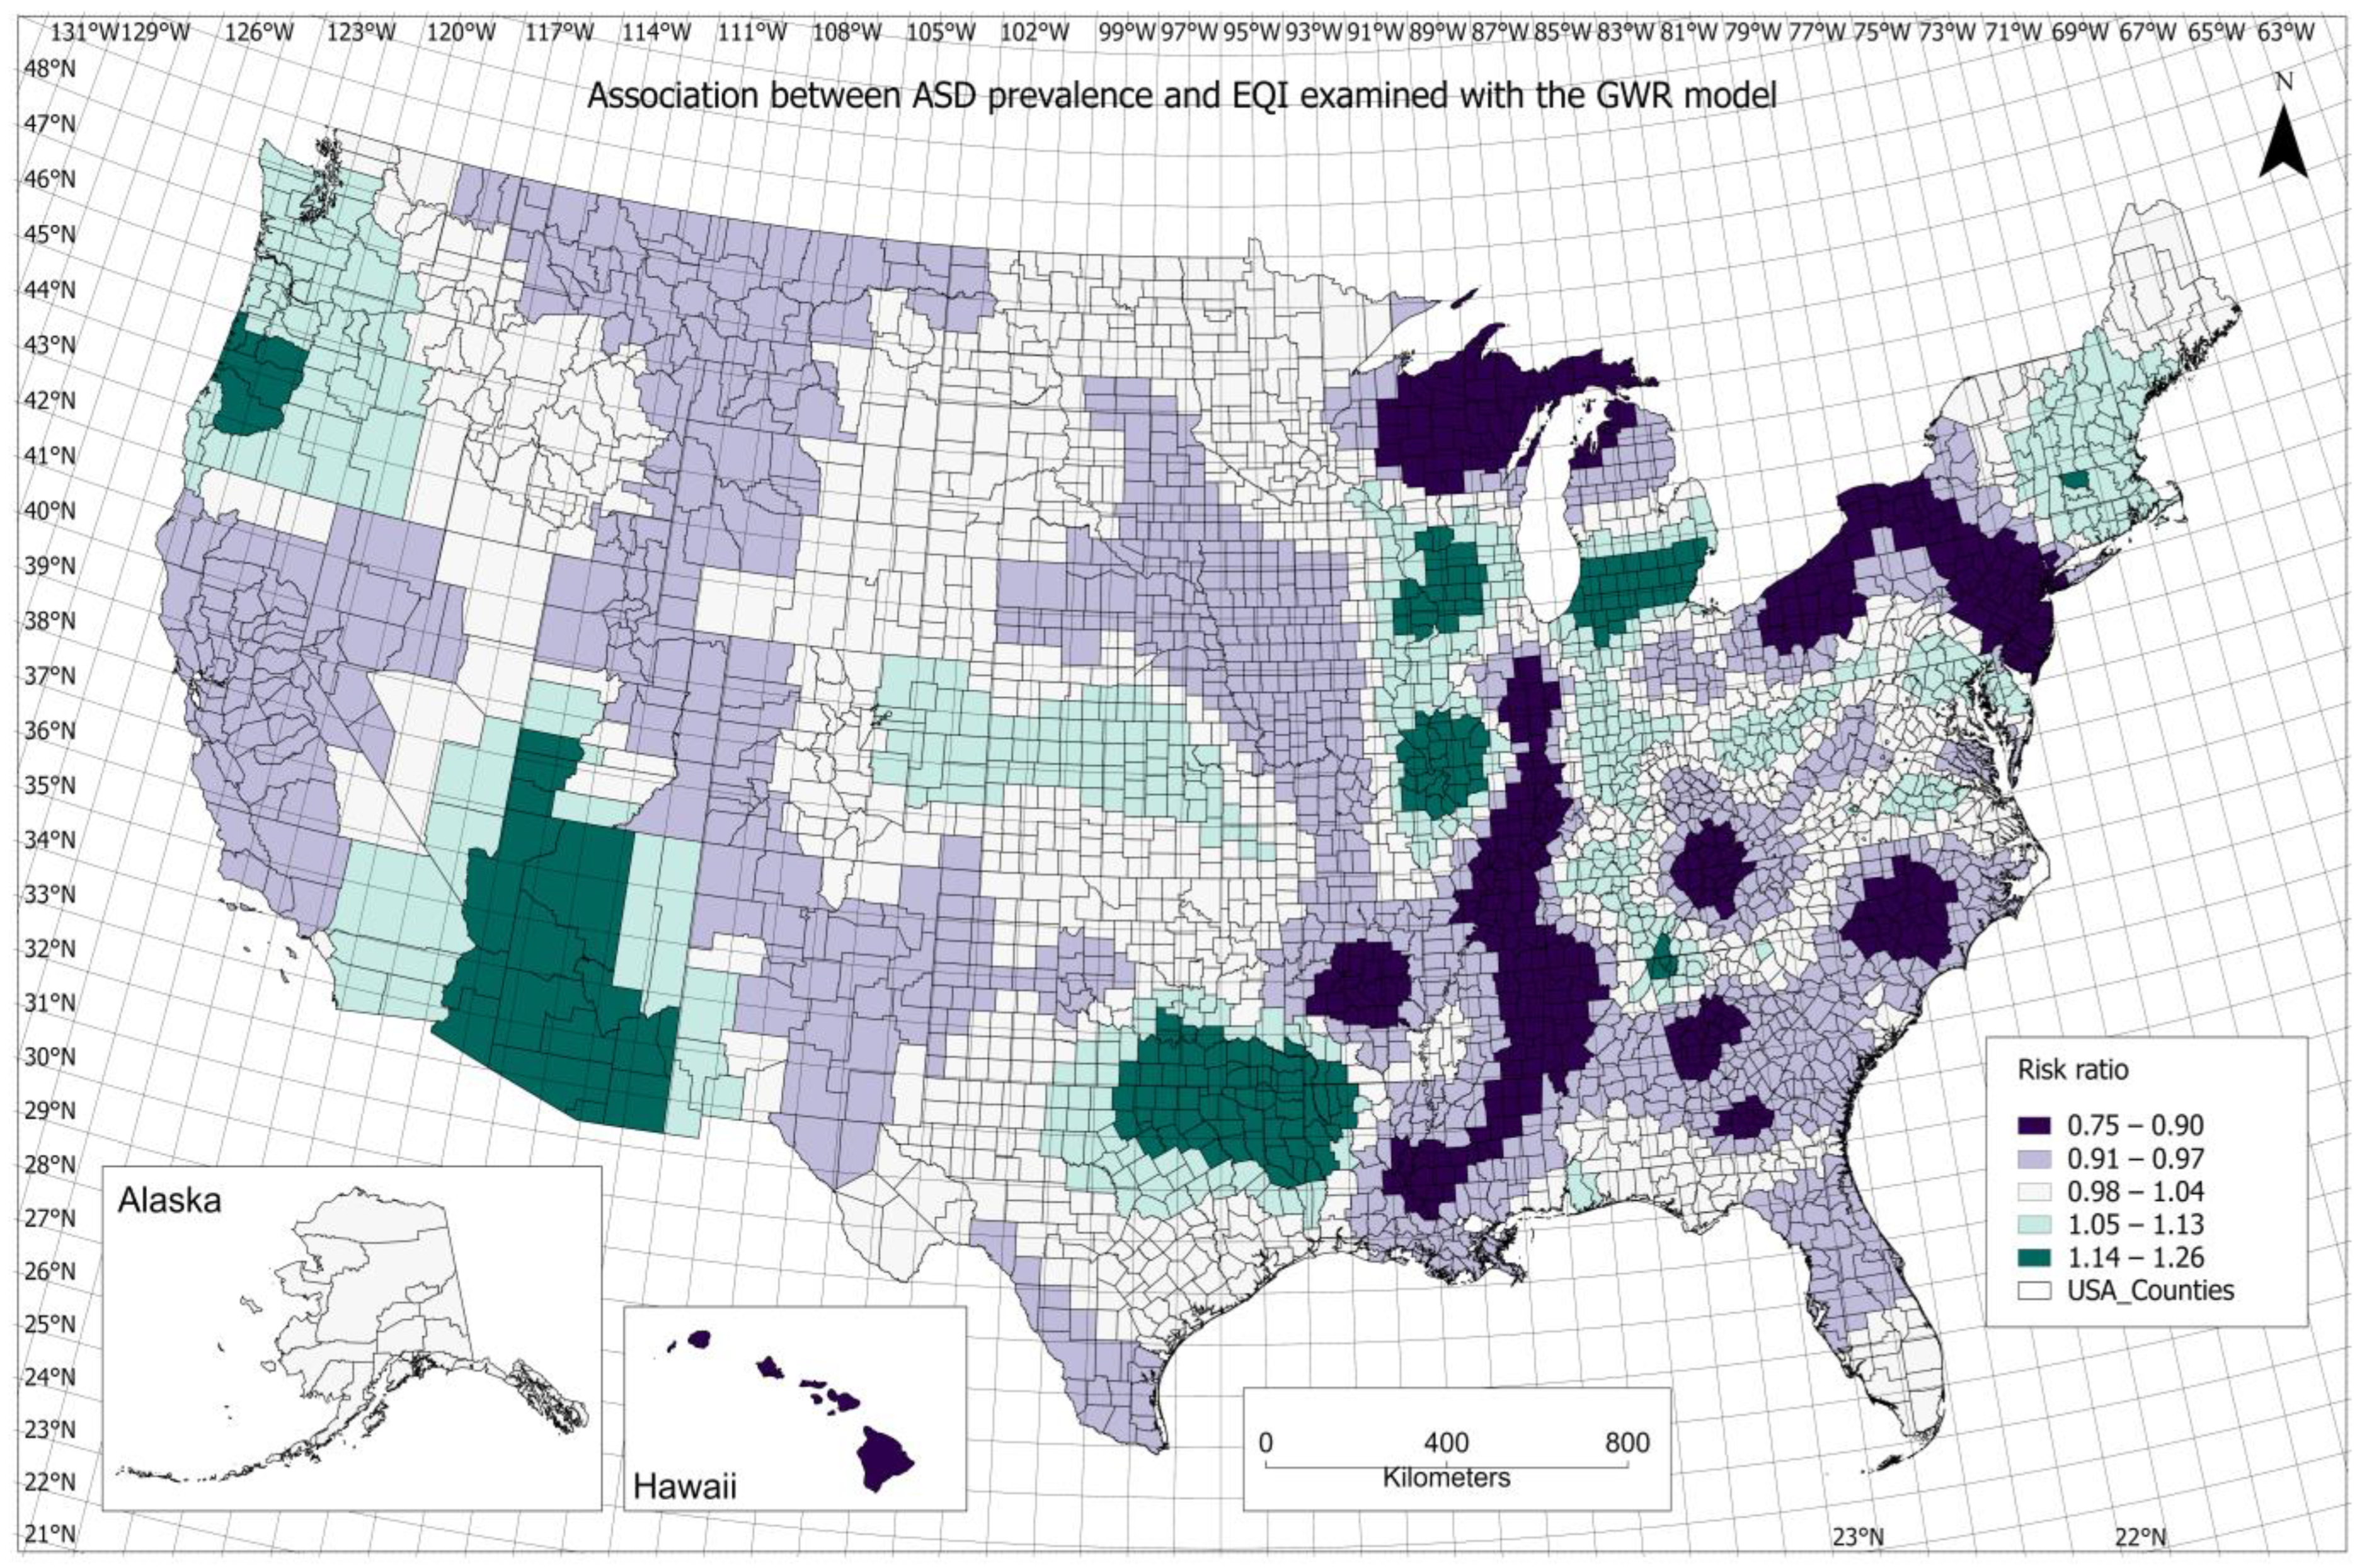
Figure 4 illustrates the county-specific association between ASD prevalence and overall EQI, demonstrating how the association varied across the US. Several counties in Arizona, Texas, Illinois, and Michigan had a relatively higher positive association. For domain-specific indices, the spatial pattern of the air index association resembled that for the overall EQI (Figure S1). For the built index, a higher positive association was observed in Texas, southern California, and Wisconsin (Figure S2). The spatial patterns of the associations are similar for the land and sociodemographic indices, of which a higher positive association was found in the central region of the United States, e.g., some counties in Kansas, Missouri, and Indiana (Figures S3 and S4). For the water index, a higher positive association was concentrated in Florida and adjacent counties in Alabama and Georgia (Figure S5).
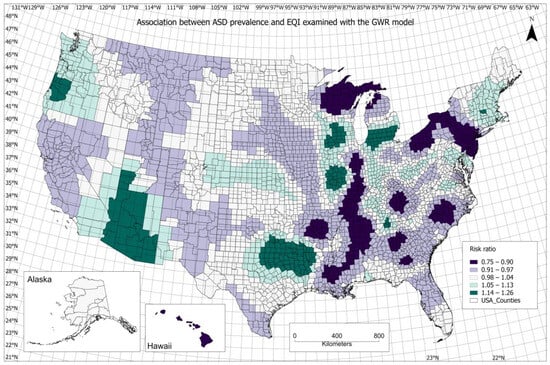
Figure 4.
Association between ASD prevalence and the overall EQI from the geographically weighted regression model.
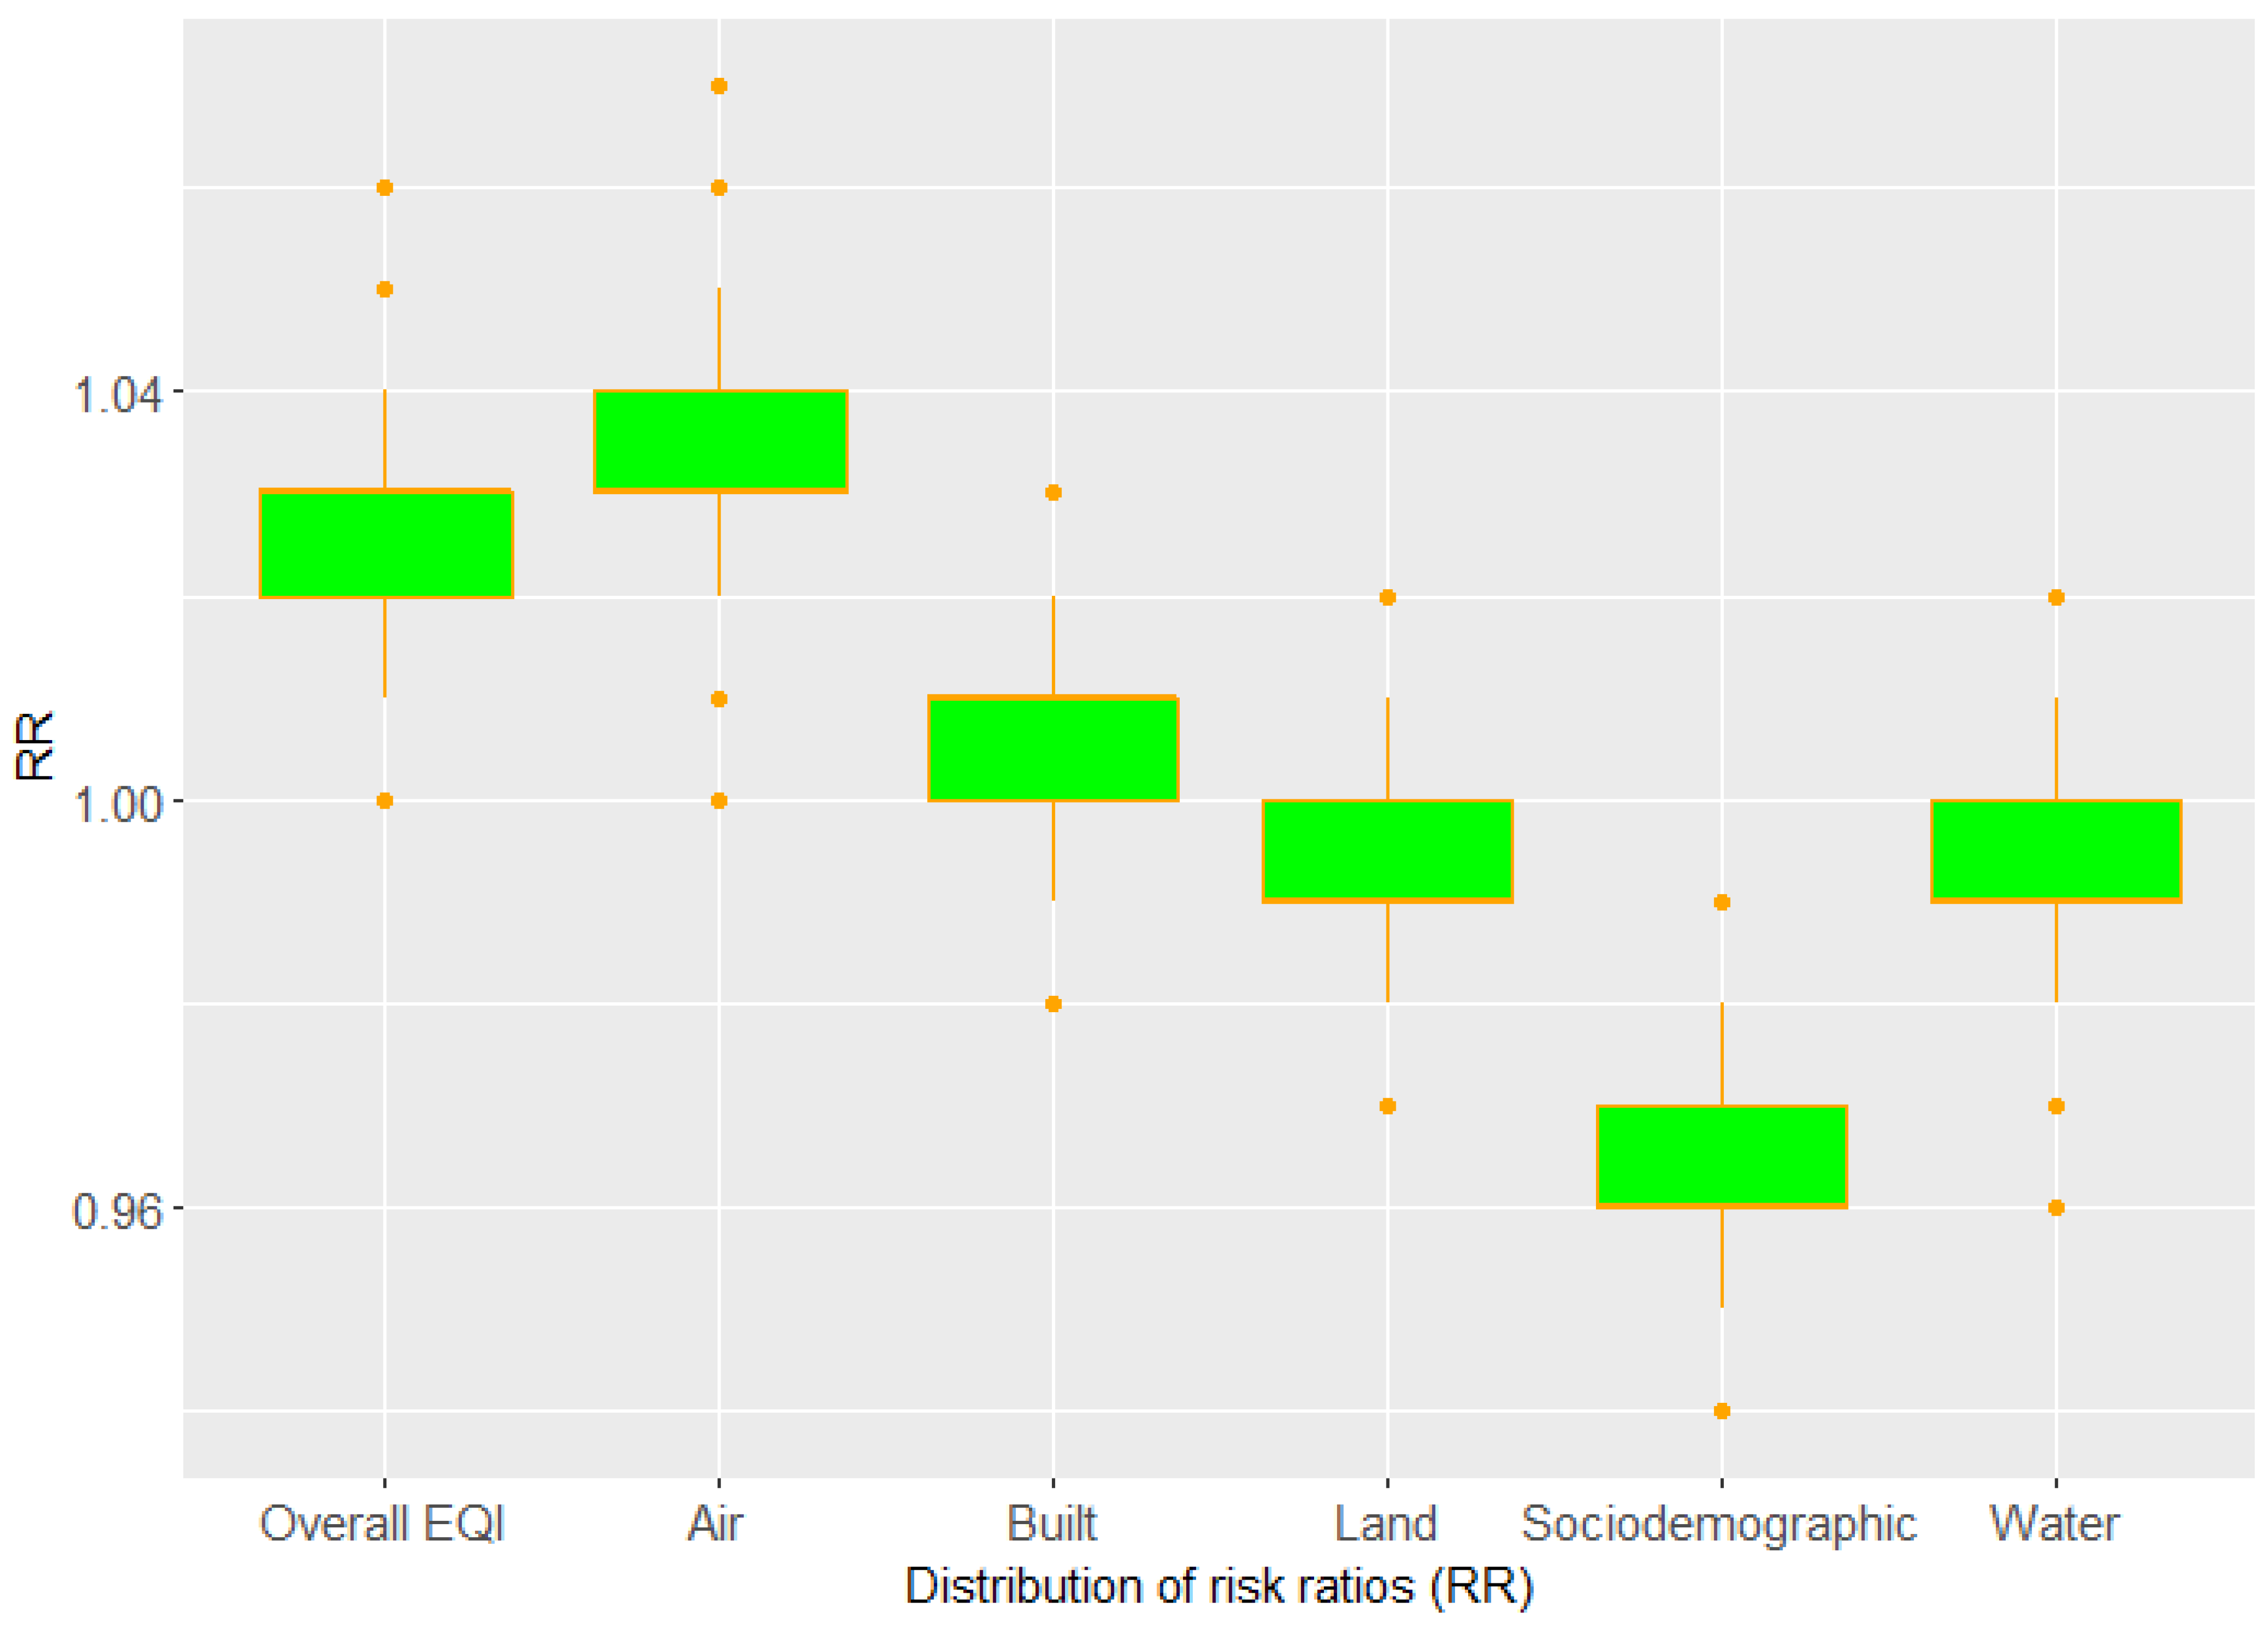
Sensitivity analysis showed that the association between ASD and EQI remained consistent with the simulated ASD prevalence, or when adjusted for the percentage of female. Figure 5 shows the distribution of risk ratio obtained from the model with simulated ASD prevalence. The overall EQI and air index were positively associated with ASD prevalence; the risk ratios were above 1.00 and the mean of the risk ratios were 1.03 and 1.04, respectively. The sociodemographic index was negatively associated with ASD prevalence; all the risk ratios were below 1.00 and the mean of the risk ratios was 0.96. The additional adjustment for the percentage of female had a marginal impact on the results (Table S2).
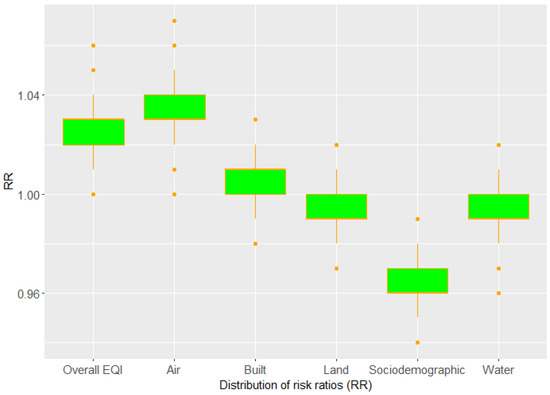
Figure 5.
Distribution of risk ratios (RR) obtained from Poisson regression models with simulated ASD prevalence.
4. Discussion
We found that ASD prevalence had significant positive associations with the overall EQI and the air index, of which the risk ratios were 1.03 and 1.04, respectively, indicating the autism prevalence might increase by 3% and 4% per 1 standard deviation increase in the overall EQI and the air index, respectively. Meanwhile, a significant negative association was observed for the sociodemographic index with the risk ratio of 0.94, indicating the autism prevalence might decrease by 6% per 1-standard deviation increase in sociodemographic index. In addition, there were regional and local variations in these associations. The sensitivity analysis indicated that the results were robust. To date, the environmental contribution to the cause of ASD is still unclear; we are not aware of any studies that examined the cumulative and combined effects of environmental factors. Therefore, the study provided new insights into the relationship between ASD prevalence and environmental factors.
In this study, the results suggested that poor air quality was associated with increased ASD prevalence in metropolitan urbanized areas, which is consistent with previous reports on the associations between autism risk and individual air pollutants [15,16,17,21,23,24,26,27,28,55,56,57]. In metropolitan areas, traffic-related air pollution is a major source of air pollutants, particularly fine particulate matter (PM2.5). Among many types of air pollutants, more evidence supports the conclusion that there are significant associations between PM2.5 and ASD [21,55]. The evidence for the association between ASD risk and other air pollutants such as ozone, SO2, and NO2 is relatively limited. Exposure to air pollutants, such as particulate matter, may lead to inflammation and oxidative stress in the body, which may affect the developing brain, potentially leading to changes in neural development and function, thus increasing the risk of ASD [58,59,60]. A positive association between ASD and the air index underscores the need for strict air quality regulations and targeted interventions to reduce exposure to pollutants, particularly in areas with high pollution levels. It also points to the necessity of further research to understand the mechanisms behind this association and the potential benefits of improving air quality on reducing ASD risk.
We observed the negative association between sociodemographic index and ASD prevalence, suggesting poor sociodemographic quality was associated with a low risk of ASD. The result seems counterintuitive because it is commonly believed that poor socioeconomic status is often associated with poor health outcomes. The counterintuitive result was also observed in the associations with other health outcomes, e.g., adult asthma [48] and mortality caused by heart diseases [50], which might be attributed to the space scale used in the model. However, in terms of ASD, the negative association might not be a surprise since previous studies have linked a higher socioeconomic quality to a higher prevalence of ASD in the US [61,62]. The results also highlight the complexities in the relationship between environmental exposures and the prevalence of ASD.
The association between ASD prevalence and environmental quality was affected by climate regions. There were more significant associations in the humid subtropical and warm summer continental regions. According to the Köppen climate classification [63], a humid subtropical climate is characterized by relatively high temperatures, high humidity levels, and distinct seasons. A warm summer continental climate is characterized by distinct seasons, with warm to hot summers and cold winters. The results suggest that extreme weather events might promote the effects of environmental factors on ASD. However, the potential mechanisms need to be further investigated.
With the GWR model, we illustrated the associations in individual counties. Compared with traditional non-spatial models used in many epidemiological studies, the GWR model has several advantages. It addresses spatial autocorrelation issues in the data, thus improving model accuracy. More importantly, it captures the local effects of environmental exposure on health outcomes, thus helping policymakers and planners make more informed decisions by considering specific risk factors in local areas. For example, the results from the GWR model showed the air index had a positive association with ASD prevalence in Maricopa County, Arizona, which informs us that air pollution may cause multiple adverse effects on human health in this area, where air pollutants were associated with higher risk of mortality previously [64]. In addition, no significant association was found for the water index from the Poisson regression model. However, positive associations were found in most counties in Florida and adjacent counties in other states. Since water bodies in Florida are often affected by cyanobacterial blooms [65,66], whether cyanobacterial blooms are linked to ASD is an interesting research topic and needs further investigation.
This finding of study highlights several key Sustainable Development Goals (SDGs). First, it underscores the importance of SDG 3 (Good Health and Well-Being), as improved environmental quality can significantly promote child health and neurodevelopment. It also aligns with SDG 11 (Sustainable Cities and Communities) by advocating for better urban planning and environmental management to reduce pollution. By examining disparities in environmental quality across different sociodemographic groups, the study relates to SDG 10 (Reduced Inequalities). Overall, the findings support integrating environmental health into public policy to advance these SDGs and ensure a healthier future for all.
Most previous studies focused on single or individual environmental exposures on the risk of ASD. Since the environmental effect in the development of ASD is very complicated, it is necessary to investigate the cumulative or simultaneous effects of multiple environmental exposures. In contrast, our study examined the cumulative effects of combined air pollutants rather than focusing on individual pollutants. This study is the first to capture the multifactorial effects of environmental factors on ASD prevalence. The study is also the first to examine the associations between ASD and environmental factors at the national scale and the impact of urbanicity and climate. The large-scale study allows us to explore the spatial patterns in the associations across the US.
The study has a few limitations. First, the ecological nature of this study showed the effects of environmental factors on ASD at the population level, but not at the individual level. The associations do not suggest a cause–effect relationship. Second, because of the difficulties in collecting data on such a large scale, the environmental exposure data were collected over multiple years. There are likely temporal variations in these data. Therefore, we are unable to build temporal relationship between environmental exposure and the development of autism. Since the environmental exposure data were collected a few years earlier than the estimate of ASD prevalence, the association reflects the effects of early exposure to these environmental factors among children.
5. Conclusions
This study reveals significant associations between ASD prevalence and poor environmental quality, particularly air pollution. Our analysis shows that EQI higher values and elevated air index levels are linked to increased ASD risk, underscoring the critical impact of environmental factors on neurodevelopment. Notably, these associations are more pronounced in metropolitan urban areas and regions with humid subtropical and warm summer continental climates, suggesting that both urbanicity and climate play significant roles in amplifying the effects of environmental pollutants.
As the first comprehensive examination of the cumulative effects of environmental factors on ASD prevalence, this study provides crucial insights into how environmental quality, especially air quality, contributes to ASD risk. The findings advocate for targeted public health interventions and urban planning strategies to address environmental risks, particularly in vulnerable regions and populations. Future research will build on these results by exploring specific environmental influences on ASD within diverse locations, aiming to refine strategies for mitigating environmental impacts on neurodevelopment.
Supplementary Materials
The following supporting information can be downloaded at: https://www.mdpi.com/article/10.3390/ijgi13090308/s1, Table S1. The unadjusted association between ASD prevalence and explanatory variables from univariate Poisson regression models; Table S2. Association between ASD prevalence and environmental quality adjusted for rage, gender, age and population density; Figure S1. Association between ASD prevalence and the air index from the geographically weighted regression model; Figure S2. Association between ASD prevalence and the built index from the geographically weighted regression model; Figure S3. Association between ASD prevalence and the land index from the geographically weighted regression model; Figure S4. Association between ASD prevalence and the sociodemographic index from the geographically weighted regression model; Figure S5. Association between ASD prevalence and the water index from the geographically weighted regression model.
Author Contributions
Jianyong Wu conceived and designed the study, conducted data analysis and drafted the manuscript. Data acquisition: Jianyong Wu and Alexander C. McLain. Review & editing: Jianyong Wu, Alexander C. McLain, Paul Rosile and Darryl B. Hood. All authors have read and agreed to the published version of the manuscript.
Funding
J.W. is supported by the startup fund from the College of Public Health, The Ohio State University.
Data Availability Statement
The data of this study are available from the corresponding author upon reasonable request.
Acknowledgments
We would like to thank Yanni Cao for her assistance with GIS mapping.
Conflicts of Interest
The authors declare no conflicts of interest.
References
- American Psychiatric Association. Diagnostic and Statistical Manual of Mental Disorders (DSM-5®); American Psychiatric Pub: Washington, DC, USA, 2013. [Google Scholar]
- Kang, L.; Liu, J.; Liu, Y.; Liang, W.; Yang, F.; Liu, M. Global, regional, and national disease burden of autism spectrum disorder among children under 5 years from 1990 to 2019: An analysis for the Global Burden of Disease 2019 Study. Asian J. Psychiatry 2023, 79, 103359. [Google Scholar] [CrossRef] [PubMed]
- Maenner, M.J.; Warren, Z.; Williams, A.R.; Amoakohene, E.; Bakian, A.V.; Bilder, D.A.; Durkin, M.S.; Fitzgerald, R.T.; Furnier, S.M.; Hughes, M.M. Prevalence and characteristics of autism spectrum disorder among children aged 8 years—Autism and Developmental Disabilities Monitoring Network, 11 sites, United States, 2020. MMWR Surveill. Summ. 2023, 72, 1. [Google Scholar] [CrossRef] [PubMed]
- Dietz, P.M.; Rose, C.E.; McArthur, D.; Maenner, M. National and state estimates of adults with autism spectrum disorder. J. Autism Dev. Disord. 2020, 50, 4258–4266. [Google Scholar] [CrossRef]
- Buescher, A.V.S.; Cidav, Z.; Knapp, M.; Mandell, D.S. Costs of Autism Spectrum Disorders in the United Kingdom and the United States. JAMA Pediatr. 2014, 168, 721–728. [Google Scholar] [CrossRef] [PubMed]
- Leigh, J.P.; Du, J. Brief Report: Forecasting the Economic Burden of Autism in 2015 and 2025 in the United States. J. Autism Dev. Disord. 2015, 45, 4135–4139. [Google Scholar] [CrossRef]
- Newschaffer, C.J.; Croen, L.A.; Daniels, J.; Giarelli, E.; Grether, J.K.; Levy, S.E.; Mandell, D.S.; Miller, L.A.; Pinto-Martin, J.; Reaven, J.; et al. The epidemiology of autism spectrum disorders. Annu. Rev. Publ. Health 2007, 28, 235–258. [Google Scholar] [CrossRef]
- Chaste, P.; Leboyer, M. Autism risk factors: Genes, environment, and gene-environment interactions. Dialogues Clin. Neurosci. 2012, 14, 281–292. [Google Scholar] [CrossRef]
- Pugsley, K.; Scherer, S.W.; Bellgrove, M.A.; Hawi, Z. Environmental exposures associated with elevated risk for autism spectrum disorder may augment the burden of deleterious de novo mutations among probands. Mol. Psychiatry 2022, 27, 710–730. [Google Scholar] [CrossRef]
- Imamura, A.; Morimoto, Y.; Ono, S.; Kurotaki, N.; Kanegae, S.; Yamamoto, N.; Kinoshita, H.; Tsujita, T.; Okazaki, Y.; Ozawa, H. Genetic and environmental factors of schizophrenia and autism spectrum disorder: Insights from twin studies. J. Neural Transm. 2020, 127, 1501–1515. [Google Scholar] [CrossRef]
- Hansen, S.N.; Schendel, D.E.; Francis, R.W.; Windham, G.C.; Bresnahan, M.; Levine, S.Z.; Reichenberg, A.; Gissler, M.; Kodesh, A.; Bai, D. Recurrence risk of autism in siblings and cousins: A multinational, population-based study. J. Am. Acad. Child. Adolesc. Psychiatry 2019, 58, 866–875. [Google Scholar] [CrossRef]
- Sandin, S.; Lichtenstein, P.; Kuja-Halkola, R.; Larsson, H.; Hultman, C.M.; Reichenberg, A. The familial risk of autism. JAMA 2014, 311, 1770–1777. [Google Scholar] [CrossRef] [PubMed]
- Castelbaum, L.; Sylvester, C.M.; Zhang, Y.; Yu, Q.; Constantino, J.N. On the nature of monozygotic twin concordance and discordance for autistic trait severity: A quantitative analysis. Behav. Genet. 2020, 50, 263–272. [Google Scholar] [CrossRef] [PubMed]
- Tick, B.; Bolton, P.; Happé, F.; Rutter, M.; Rijsdijk, F. Heritability of autism spectrum disorders: A meta-analysis of twin studies. J. Child. Psychol. Psychiatry 2016, 57, 585–595. [Google Scholar] [CrossRef]
- Weisskopf, M.G.; Kioumourtzoglou, M.-A.; Roberts, A.L. Air pollution and autism spectrum disorders: Causal or confounded? Curr. Environ. Health Rep. 2015, 2, 430–439. [Google Scholar] [CrossRef]
- Kalkbrenner, A.E.; Daniels, J.L.; Chen, J.C.; Poole, C.; Emch, M.; Morrissey, J. Perinatal exposure to hazardous air pollutants and autism spectrum disorders at age 8. Epidemiology 2010, 21, 631–641. [Google Scholar] [CrossRef]
- Raz, R.; Roberts, A.L.; Lyall, K.; Hart, J.E.; Just, A.C.; Laden, F.; Weisskopf, M.G. Autism Spectrum Disorder and Particulate Matter Air Pollution before, during, and after Pregnancy: A Nested Case-Control Analysis within the Nurses’ Health Study II Cohort. Environ. Health Perspect. 2015, 123, 264–270. [Google Scholar] [CrossRef] [PubMed]
- Roberts, E.M.; English, P.B.; Grether, J.K.; Windharn, G.C.; Somberg, L.; Wolff, C. Maternal residence near agricultural pesticide applications and autism spectrum disorders among children in the California Central Valley. Environ. Health Perspect. 2007, 115, 1482–1489. [Google Scholar] [CrossRef] [PubMed]
- Volk, H.E.; Lurmann, F.; Penfold, B.; Hertz-Picciotto, I.; McConnell, R. Traffic-Related Air Pollution, Particulate Matter, and Autism. JAMA Psychiatry 2013, 70, 71–77. [Google Scholar] [CrossRef]
- Modabbernia, A.; Velthorst, E.; Reichenberg, A. Environmental risk factors for autism: An evidence-based review of systematic reviews and meta-analyses. Mol. Autism 2017, 8, 1–16. [Google Scholar] [CrossRef]
- Talbott, E.O.; Arena, V.C.; Rager, J.R.; Clougherty, J.E.; Michanowicz, D.R.; Sharma, R.K.; Stacy, S.L. Fine particulate matter and the risk of autism spectrum disorder. Environ. Res. 2015, 140, 414–420. [Google Scholar] [CrossRef]
- Li, Y.; Xie, T.; Melo, R.D.C.; de Vries, M.; Lakerveld, J.; Zijlema, W.; Hartman, C.A. Longitudinal effects of environmental noise and air pollution exposure on autism spectrum disorder and attention-deficit/hyperactivity disorder during adolescence and early adulthood: The TRAILS study. Environ. Res. 2023, 227, 115704. [Google Scholar] [CrossRef] [PubMed]
- Pagalan, L.; Bickford, C.; Weikum, W.; Lanphear, B.; Brauer, M.; Lanphear, N.; Hanley, G.E.; Oberlander, T.F.; Winters, M. Association of prenatal exposure to air pollution with autism spectrum disorder. JAMA Pediatr. 2019, 173, 86–92. [Google Scholar] [CrossRef]
- McGuinn, L.A.; Windham, G.C.; Kalkbrenner, A.E.; Bradley, C.; Di, Q.; Croen, L.A.; Fallin, M.D.; Hoffman, K.; Ladd-Acosta, C.; Schwartz, J. Early life exposure to air pollution and autism spectrum disorder: Findings from a multisite case–control study. Epidemiol. Camb. Mass. 2020, 31, 103. [Google Scholar] [CrossRef] [PubMed]
- Carter, S.A.; Rahman, M.M.; Lin, J.C.; Shu, Y.-H.; Chow, T.; Yu, X.; Martinez, M.P.; Eckel, S.P.; Chen, J.-C.; Chen, Z. In utero exposure to near-roadway air pollution and autism spectrum disorder in children. Environ. Int. 2022, 158, 106898. [Google Scholar] [CrossRef]
- Yu, X.; Rahman, M.M.; Carter, S.A.; Lin, J.C.; Zhuang, Z.; Chow, T.; Lurmann, F.W.; Kleeman, M.J.; Martinez, M.P.; van Donkelaar, A. Prenatal air pollution, maternal immune activation, and autism spectrum disorder. Environ. Int. 2023, 179, 108148. [Google Scholar] [CrossRef]
- Oudin, A.; Frondelius, K.; Haglund, N.; Källén, K.; Forsberg, B.; Gustafsson, P.; Malmqvist, E. Prenatal exposure to air pollution as a potential risk factor for autism and ADHD. Environ. Int. 2019, 133, 105149. [Google Scholar] [CrossRef] [PubMed]
- Rahman, M.M.; Shu, Y.-H.; Chow, T.; Lurmann, F.W.; Yu, X.; Martinez, M.P.; Carter, S.A.; Eckel, S.P.; Chen, J.-C.; Chen, Z. Prenatal exposure to air pollution and autism spectrum disorder: Sensitive windows of exposure and sex differences. Environ. Health Perspect. 2022, 130, 017008. [Google Scholar] [CrossRef]
- Carter, C.J.; Blizard, R. Autism genes are selectively targeted by environmental pollutants including pesticides, heavy metals, bisphenol A, phthalates and many others in food, cosmetics or household products. Neurochem. Int. 2016, 101, 83–109. [Google Scholar] [CrossRef]
- Hertz-Picciotto, I.; Schmidt, R.J.; Krakowiak, P. Understanding environmental contributions to autism: Causal concepts and the state of science. Autism Res. 2018, 11, 554–586. [Google Scholar] [CrossRef]
- Ye, B.S.; Leung, A.O.W.; Wong, M.H. The association of environmental toxicants and autism spectrum disorders in children. Environ. Pollut. 2017, 227, 234–242. [Google Scholar] [CrossRef]
- Becerra, T.A.; Wilhelm, M.; Olsen, J.; Cockburn, M.; Ritz, B. Ambient air pollution and autism in Los Angeles county, California. Env. Health Perspect. 2013, 121, 380–386. [Google Scholar] [CrossRef]
- Liew, Z.; Meng, Q.; Yan, Q.; Schullehner, J.; Hansen, B.; Kristiansen, S.M.; Voutchkova, D.D.; Olsen, J.; Ersbøll, A.K.; Ketzel, M. Association between estimated geocoded residential maternal exposure to lithium in drinking water and risk for autism spectrum disorder in offspring in Denmark. JAMA Pediatr. 2023, 177, 617–624. [Google Scholar] [CrossRef] [PubMed]
- Awadh, S.M.; Yaseen, Z.M.; Al-Suwaiyan, M.S. The role of environmental trace element toxicants on autism: A medical biogeochemistry perspective. Ecotoxicol. Environ. Saf. 2023, 251, 114561. [Google Scholar] [CrossRef] [PubMed]
- Dou, J.F.; Schmidt, R.J.; Volk, H.E.; Nitta, M.M.; Feinberg, J.I.; Newschaffer, C.J.; Croen, L.A.; Hertz-Picciotto, I.; Fallin, M.D.; Bakulski, K.M. Exposure to heavy metals in utero and autism spectrum disorder at age 3: A meta-analysis of two longitudinal cohorts of siblings of children with autism. Environ. Health 2024, 23, 62. [Google Scholar] [CrossRef] [PubMed]
- Kang, N.; Sargsyan, S.; Chough, I.; Petrick, L.; Liao, J.; Chen, W.; Pavlovic, N.; Lurmann, F.W.; Martinez, M.P.; McConnell, R. Dysregulated Metabolic Pathways Associated with Air Pollution Exposure and the Risk of Autism: Evidence from Epidemiological Studies. Environ. Pollut. 2024, 361, 124729. [Google Scholar] [CrossRef] [PubMed]
- Moschetti, A.; Giangreco, M.; Ronfani, L.; Cervellera, S.; Ruffilli, M.P.; Nume, C.; Barbi, E.; Servidio, A.G. An ecological study shows increased prevalence of autism spectrum disorder in children living in a heavily polluted area. Sci. Rep. 2024, 14, 17159. [Google Scholar] [CrossRef]
- O’Sharkey, K.; Meng, Q.; Mitra, S.; Paik, S.-a.; Liu, J.; Shen, J.; Thompson, L.K.; Chow, T.; Su, J.; Cockburn, M. Associations between brake and tire wear-related PM2. 5 metal components, particulate oxidative stress potential, and autism spectrum disorder in Southern California. Environ. Int. 2024, 185, 108573. [Google Scholar] [CrossRef]
- Román, P.; Ruiz-González, C.; Rueda-Ruzafa, L.; Cardona, D.; Requena, M.; Alarcón, R. Exposure to Environmental Pesticides and the Risk of Autism Spectrum Disorders: A Population-Based Case-Control Study. Medicina 2024, 60, 479. [Google Scholar] [CrossRef]
- Dietert, R.R.; Dietert, J.M.; DeWitt, J.C. Environmental risk factors for autism. Emerg. Health Threat. J. 2011, 4, 7111. [Google Scholar] [CrossRef]
- Wu, J.; Jackson, L. Inverse relationship between urban green space and childhood autism in California elementary school districts. Environ. Int. 2017, 107, 140–146. [Google Scholar] [CrossRef]
- Pagalan, L.; Oberlander, T.F.; Hanley, G.E.; Rosella, L.C.; Bickford, C.; Weikum, W.; Lanphear, N.; Lanphear, B.; Brauer, M.; van den Bosch, M. The association between prenatal greenspace exposure and Autism spectrum disorder, and the potentially mediating role of air pollution reduction: A population-based birth cohort study. Environ. Int. 2022, 167, 107445. [Google Scholar] [CrossRef] [PubMed]
- Chen, Y.; Chen, G.; Liu, Y.; Dong, G.-H.; Yang, B.-Y.; Li, S.; Huang, H.; Jin, Z.; Guo, Y. Exposure to greenness during pregnancy and the first three years after birth and autism spectrum disorder: A matched case-control study in shanghai, China. Environ. Pollut. 2024, 340, 122677. [Google Scholar] [CrossRef] [PubMed]
- Lavigne, É.; Abdulaziz, K.E.; Murphy, M.S.; Stanescu, C.; Dingwall-Harvey, A.L.; Stieb, D.M.; Walker, M.C.; Wen, S.W.; Shin, H.H. Associations of neighborhood greenspace, and active living environments with autism spectrum disorders: A matched case-control study in Ontario, Canada. Environ. Res. 2024, 252, 118828. [Google Scholar] [CrossRef]
- Lobdell, D.T.; Jagai, J.S.; Rappazzo, K.; Messer, L.C. Data sources for an environmental quality index: Availability, quality, and utility. Am. J. Public. Health 2011, 101, S277–S285. [Google Scholar] [CrossRef]
- Messer, L.C.; Jagai, J.S.; Rappazzo, K.M.; Lobdell, D.T. Construction of an environmental quality index for public health re-search. Environ. Health 2014, 13, 39. [Google Scholar] [CrossRef]
- USEPA. Environmental Quality Index—Technical Report, 2006–2010; U.S. Environmental Protection Agency: Washington, DC, USA, 2020; EPA/600/R-20/367. [Google Scholar]
- Gray, C.L.; Lobdell, D.T.; Rappazzo, K.M.; Jian, Y.; Jagai, J.S.; Messer, L.C.; Patel, A.P.; DeFlorio-Barker, S.A.; Lyttle, C.; Solway, J. Associations between environmental quality and adult asthma prevalence in medical claims data. Environ. Res. 2018, 166, 529–536. [Google Scholar] [CrossRef] [PubMed]
- Jagai, J.S.; Krajewski, A.K.; Shaikh, S.; Lobdell, D.T.; Sargis, R.M. Association between environmental quality and diabetes in the USA. J. Diabetes Investig. 2020, 11, 315–324. [Google Scholar] [CrossRef]
- Jian, Y.; Messer, L.C.; Jagai, J.S.; Rappazzo, K.M.; Gray, C.L.; Grabich, S.C.; Lobdell, D.T. Associations between environmental quality and mortality in the contiguous United States, 2000–2005. Environ. Health Perspect. 2017, 125, 355–362. [Google Scholar] [CrossRef]
- Krajewski, A.K.; Rappazzo, K.M.; Langlois, P.H.; Messer, L.C.; Lobdell, D.T. Associations between cumulative environmental quality and ten selected birth defects in Texas. Birth Defects Res. 2021, 113, 161–172. [Google Scholar] [CrossRef]
- Jagai, J.S.; Messer, L.C.; Rappazzo, K.M.; Gray, C.L.; Grabich, S.C.; Lobdell, D.T. County-level cumulative environmental quality associated with cancer incidence. Cancer 2017, 123, 2901–2908. [Google Scholar] [CrossRef]
- Roman-Urrestarazu, A.; Yang, J.C.; van Kessel, R.; Warrier, V.; Dumas, G.; Jongsma, H.; Gatica-Bahamonde, G.; Allison, C.; Matthews, F.E.; Baron-Cohen, S. Autism incidence and spatial analysis in more than 7 million pupils in English schools: A retrospective, longitudinal, school registry study. Lancet Child. Adolesc. Health 2022, 6, 857–868. [Google Scholar] [CrossRef] [PubMed]
- Bradshaw, J.; Eberth, J.M.; Zgodic, A.; Federico, A.; Flory, K.; McLain, A.C. County-Level Prevalence Estimates of Autism Spectrum Disorder in Children in the United States. J. Autism Dev. Disord. 2023, 54, 2710–2718. [Google Scholar] [CrossRef] [PubMed]
- Dutheil, F.; Comptour, A.; Morlon, R.; Mermillod, M.; Pereira, B.; Baker, J.S.; Charkhabi, M.; Clinchamps, M.; Bourdel, N. Autism spectrum disorder and air pollution: A systematic review and meta-analysis. Environ. Pollut. 2021, 278, 116856. [Google Scholar] [CrossRef] [PubMed]
- Lam, J.; Sutton, P.; Kalkbrenner, A.; Windham, G.; Halladay, A.; Koustas, E.; Lawler, C.; Davidson, L.; Daniels, N.; Newschaffer, C.; et al. A Systematic Review and Meta-Analysis of Multiple Airborne Pollutants and Autism Spectrum Disorder. PLoS ONE 2016, 11, e0161851. [Google Scholar] [CrossRef]
- Volk, H.E.; Hertz-Picciotto, I.; Delwiche, L.; Lurmann, F.; McConnell, R. Residential Proximity to Freeways and Autism in the CHARGE Study. Environ. Health Perspect. 2011, 119, 873–877. [Google Scholar] [CrossRef]
- Chauhan, A.; Chauhan, V. Oxidative stress in autism. Pathophysiology 2006, 13, 171–181. [Google Scholar] [CrossRef]
- Frye, R.E.; Cakir, J.; Rose, S.; Palmer, R.F.; Austin, C.; Curtin, P. Physiological mediators of prenatal environmental influences in autism spectrum disorder. Bioessays 2021, 43, 2000307. [Google Scholar] [CrossRef]
- Rossignol, D.A.; Frye, R.E. Evidence linking oxidative stress, mitochondrial dysfunction, and inflammation in the brain of individuals with autism. Front. Physiol. 2014, 5, 150. [Google Scholar] [CrossRef]
- Durkin, M.S.; Maenner, M.J.; Meaney, F.J.; Levy, S.E.; DiGuiseppi, C.; Nicholas, J.S.; Kirby, R.S.; Pinto-Martin, J.A.; Schieve, L.A. Socioeconomic inequality in the prevalence of autism spectrum disorder: Evidence from a U.S. cross-sectional study. PLoS ONE 2010, 5, e11551. [Google Scholar] [CrossRef]
- Thomas, P.; Zahorodny, W.; Peng, B.; Kim, S.; Jani, N.; Halperin, W.; Brimacombe, M. The association of autism diagnosis with socioeconomic status. Autism 2012, 16, 201–213. [Google Scholar] [CrossRef]
- Kottek, M.; Grieser, J.; Beck, C.; Rudolf, B.; Rubel, F. World map of the Koppen-Geiger climate classification updated. Meteorol. Z. 2006, 15, 259–263. [Google Scholar] [CrossRef] [PubMed]
- Moolgavkar, S.H. Air pollution and daily mortality in three US counties. Environ. Health Perspect. 2000, 108, 777–784. [Google Scholar] [CrossRef] [PubMed]
- Burns, J. Toxic cyanobacteria in Florida waters. In Cyanobacterial Harmful Algal Blooms: State of the Science and Research Needs; Springer: Berlin/Heidelberg, Germany, 2008; pp. 127–137. [Google Scholar]
- Glibert, P.M.; Heil, C.A.; Rudnick, D.T.; Madden, C.J.; Boyer, J.N.; Kelly, S.P. Florida Bay: Water quality status and trends, historic and emerging algal bloom problems. Contrib. Mar. Sci. 2009, 38, 5–17. [Google Scholar]
Disclaimer/Publisher’s Note: The statements, opinions and data contained in all publications are solely those of the individual author(s) and contributor(s) and not of MDPI and/or the editor(s). MDPI and/or the editor(s) disclaim responsibility for any injury to people or property resulting from any ideas, methods, instructions or products referred to in the content. |
© 2024 by the authors. Published by MDPI on behalf of the International Society for Photogrammetry and Remote Sensing. Licensee MDPI, Basel, Switzerland. This article is an open access article distributed under the terms and conditions of the Creative Commons Attribution (CC BY) license (https://creativecommons.org/licenses/by/4.0/).