Abstract
Most high-mountain regions worldwide are susceptible to snow avalanches during the winter or all year round. In this study, a Universal Snow Avalanche Modeling Index is developed, suitable for determining avalanche hazard in mountain regions. The first step in the research is the collection of data in the field and their processing in geographic information systems and remote sensing. In the period 2023–2024, avalanches were mapped in the field, and later, avalanches as points in geographic information systems (GIS) were overlapped with the dominant natural conditions in the study area. The second step involves determining the main criteria (snow cover, terrain slope, and land use) and evaluating the values to obtain the Snow Avalanche Formation Index (SAFI). Thresholds obtained through field research and the formation of avalanche inventory were used to develop the SAFI index. The index is applied with the aim of identifying locations susceptible to avalanche formation (source areas). The values used for the calculation include Normalized Difference Snow Index (NDSI > 0.6), terrain slope (20–60°) and land use (pastures, meadows). The third step presents the analysis of SAFI locations with meteorological conditions (winter precipitation and winter air temperature). The fourth step is the modeling of the propagation (simulation) of other parts of the snow avalanche in the Flow-R software 2.0. The results show that 282.9 km2 of the study area (Šar Mountains, Serbia) is susceptible to snow avalanches, with the thickness of the potentially triggered layer being 50 cm. With a 5 m thick snowpack, 299.9 km2 would be susceptible. The validation using the ROC-AUC method confirms a very high predictive power (0.94). The SAFI–Flow-R approach offers snow avalanche modeling for which no avalanche inventory is available, representing an advance for all mountain areas where historical data do not exist. The results of the study can be used for land use planning, zoning vulnerable areas, and adopting adequate environmental protection measures.
1. Introduction
Snow avalanches are one of the most frequent natural disasters in high mountain regions [1,2,3]. They are defined as a phenomenon caused by the release, transition, and accumulation of snow material, often containing rocks, soil, and plants. It is a complex process resulting from the interaction of geomorphological conditions, snowpack, and other meteorological factors [4]. Medium or large-scale snow avalanches threaten human lives, housing, communication and transportation, existing ecosystems, and landscapes [5,6,7,8]. According to the European Avalanche Warning Services [EAWS], over 2200 people have died in Europe due to snow avalanches in the last 20 years [9]. This figure is undoubtedly higher as there is no data on the area of southeastern and eastern Europe. In order to reduce the damage caused by snow avalanches, the first step is to create maps of the spatial distribution of avalanches and an inventory of snow avalanches [10]. In addition to Europe, snow avalanches are also being actively studied in other regions and countries: China, India, Afghanistan, Pakistan, Tajikistan, Canada, USA etc. [2,7,10,11,12,13]. In Serbia, research on snow avalanches and their distribution is a relatively new phenomenon. Although many ski resorts (Kopaonik, Tornik, Brezovica, Stara Planina) host hundreds of thousands of tourists anually, there is no cartographic data on the avalanche hazard. Some research has been done on the influence of geological surroundings on earthquake-induced snow avalanche-prone areas in the Kopaonik region [14].
The Šar Mountains are the most susceptible mountain massif when it comes to snow avalanches, and therefore the number of studies dealing with this hazard has been increasing in recent years [15,16,17].
Predicting the spatial distribution of snow avalanches is a complex process requiring field research and cabinet work. Field research involves the analysis of snow layers within the snowpack, snow stability tests, manual shear tests, determination of types of snow avalanches, and analysis of geomorphological, meteorological, and biogeographical conditions [18]. As snow layers vary according to snow depth, temperature, and water quantity, field research is necessary to identify of persistent weak layers, which are the main causes of snow avalanche [13]. Persistent weak layers can be numerous, depending on the size of the snow grains (surface hoar, depth hoar, faceted crystals). When a snow avalanche is identified in a certain area, it is preferable to determine its type. Slab avalanches cause the most environmental problems, and often, the trigger of such avalanches is human [7,19,20]. In addition to slab avalanches, the following avalanche types can be distinguished: loose snow avalanches, powder avalanches, ice avalanches, slush avalanches, and gliding avalanches [13]. The emergence of all these types depends on land use, microrelief (terrain’s slope, roughness), and microclimate conditions in a particular area. Deforestation and climate change significantly influence avalanche flow modeling, while terrain slope is the most important morphometric parameter [21,22].
Nowadays, modeling assessing susceptibility of territories to various natural hazards and data visualization are widely made using geographic information systems (GIS) [10,23,24,25,26,27]. With remote sensing and high-resolution data, GIS provides relevant secondary data on phenomena and processes in remote areas [28,29]. However, the application of snow avalanche modeling methods depends on the available data.
If there is historical data on the spatial distribution of avalanches, researchers generally base their studies on statistical methods, machine learning, or numerical modeling. Kumar et al. (2016) used a fuzzy–frequency ratio model for the region of Himachal Pradesh (Indian Himalaya) [30]. In the study, 292 locations of snow avalanches were documented and mapped. Varol (2022) investigated the spatial distribution of avalanches in the Uzungol area (Turkey) using the frequency ratio model [31]. In the same territory, hybrid and ensemble machine learning techniques (J48, random tree, random forest) were applied [21]. Bian et al. (2022) integrated statistical models and machine learning (EBF-LR, CF-LR, EBF-MLP, CF-MLP) for terrain vulnerability assessment in the central Shaluli Mountain (China) [4]. Choubin et al. (2019) used support vector machine (SVM) and multi-variate discriminant analysis (MDA) model snow avalanches in the territory of Karaj watershed (Iran) [22]. Iban and Bilgilioglu (2023) studied the susceptibility of the province of Sondrio (Italy) to the occurrence of snow avalanches using tree-based machine learning algorithms (XGBoost, NGBoost, and LightGBM) [32]. Yariyan et al. (2020) combined two statistical models (belief function and probability density) and two learning models (multi-layer perceptron and logistic regression) to predict avalanche susceptibility for the Sirvan watershed area (Iran) [33]. Košova et al. (2022) applied the two-dimensional numerical simulation model RAMMS for analyzing the vulnerability of the Kráľova Hoľa area in the Low Tatra Mountains (Slovakia) [34]. Martini et al. (2023) compared 2-D numerical models (RAMMS and FLO-2D) for the distribution of snow avalanches in the province of Bolzano–Bozen (Italy) [35].
When there is no data on past avalanches, the authors usually resort to multi-criteria decision-making (MCDM). Kumar et al. (2018) used the Analytic Hierarchy Process (AHP) for geospatial modeling of snow avalanches in the Jammu and Kashmir region (India) [36]. Nasery and Kalkan (2021) mapped avalanche susceptibility in Van province (Turkey) using AHP [20]. This method was also used in northern Pakistan, Medog County (China), and the Šar Mountains (Serbia) for the prediction of snow avalanches [10,15,37].
This study presents a unique Universal Snow Avalanche Susceptibility Index, which can be applied to mountain regions worldwide. The innovative approach is based on the integrated application of GIS, multi-criteria analysis, remote sensing, and propagation modeling in order to determine the geospatial distribution of snow avalanches as precisely as possible. The case study is the Šar Mountains, where avalanches have caused great human and material losses for decades [15].
The primary goal of the research is to identify locations within the study area that are susceptible to snow avalanches. A secondary goal is to develop a universal index that can be used in other susceptible mountain regions where there is insufficient data on snow avalanches. The study provides answers to research questions, such as the study area, spatiotemporal frame and field research, data availability, methodology innovation, and the significance of the final results.
The results can be useful for decision-makers and mountain rescue services in land use planning, avoiding avalanche-prone terrain, and adopting protective measures for residential buildings and infrastructure located in hazard zones.
2. Materials and Methods
2.1. Study Area
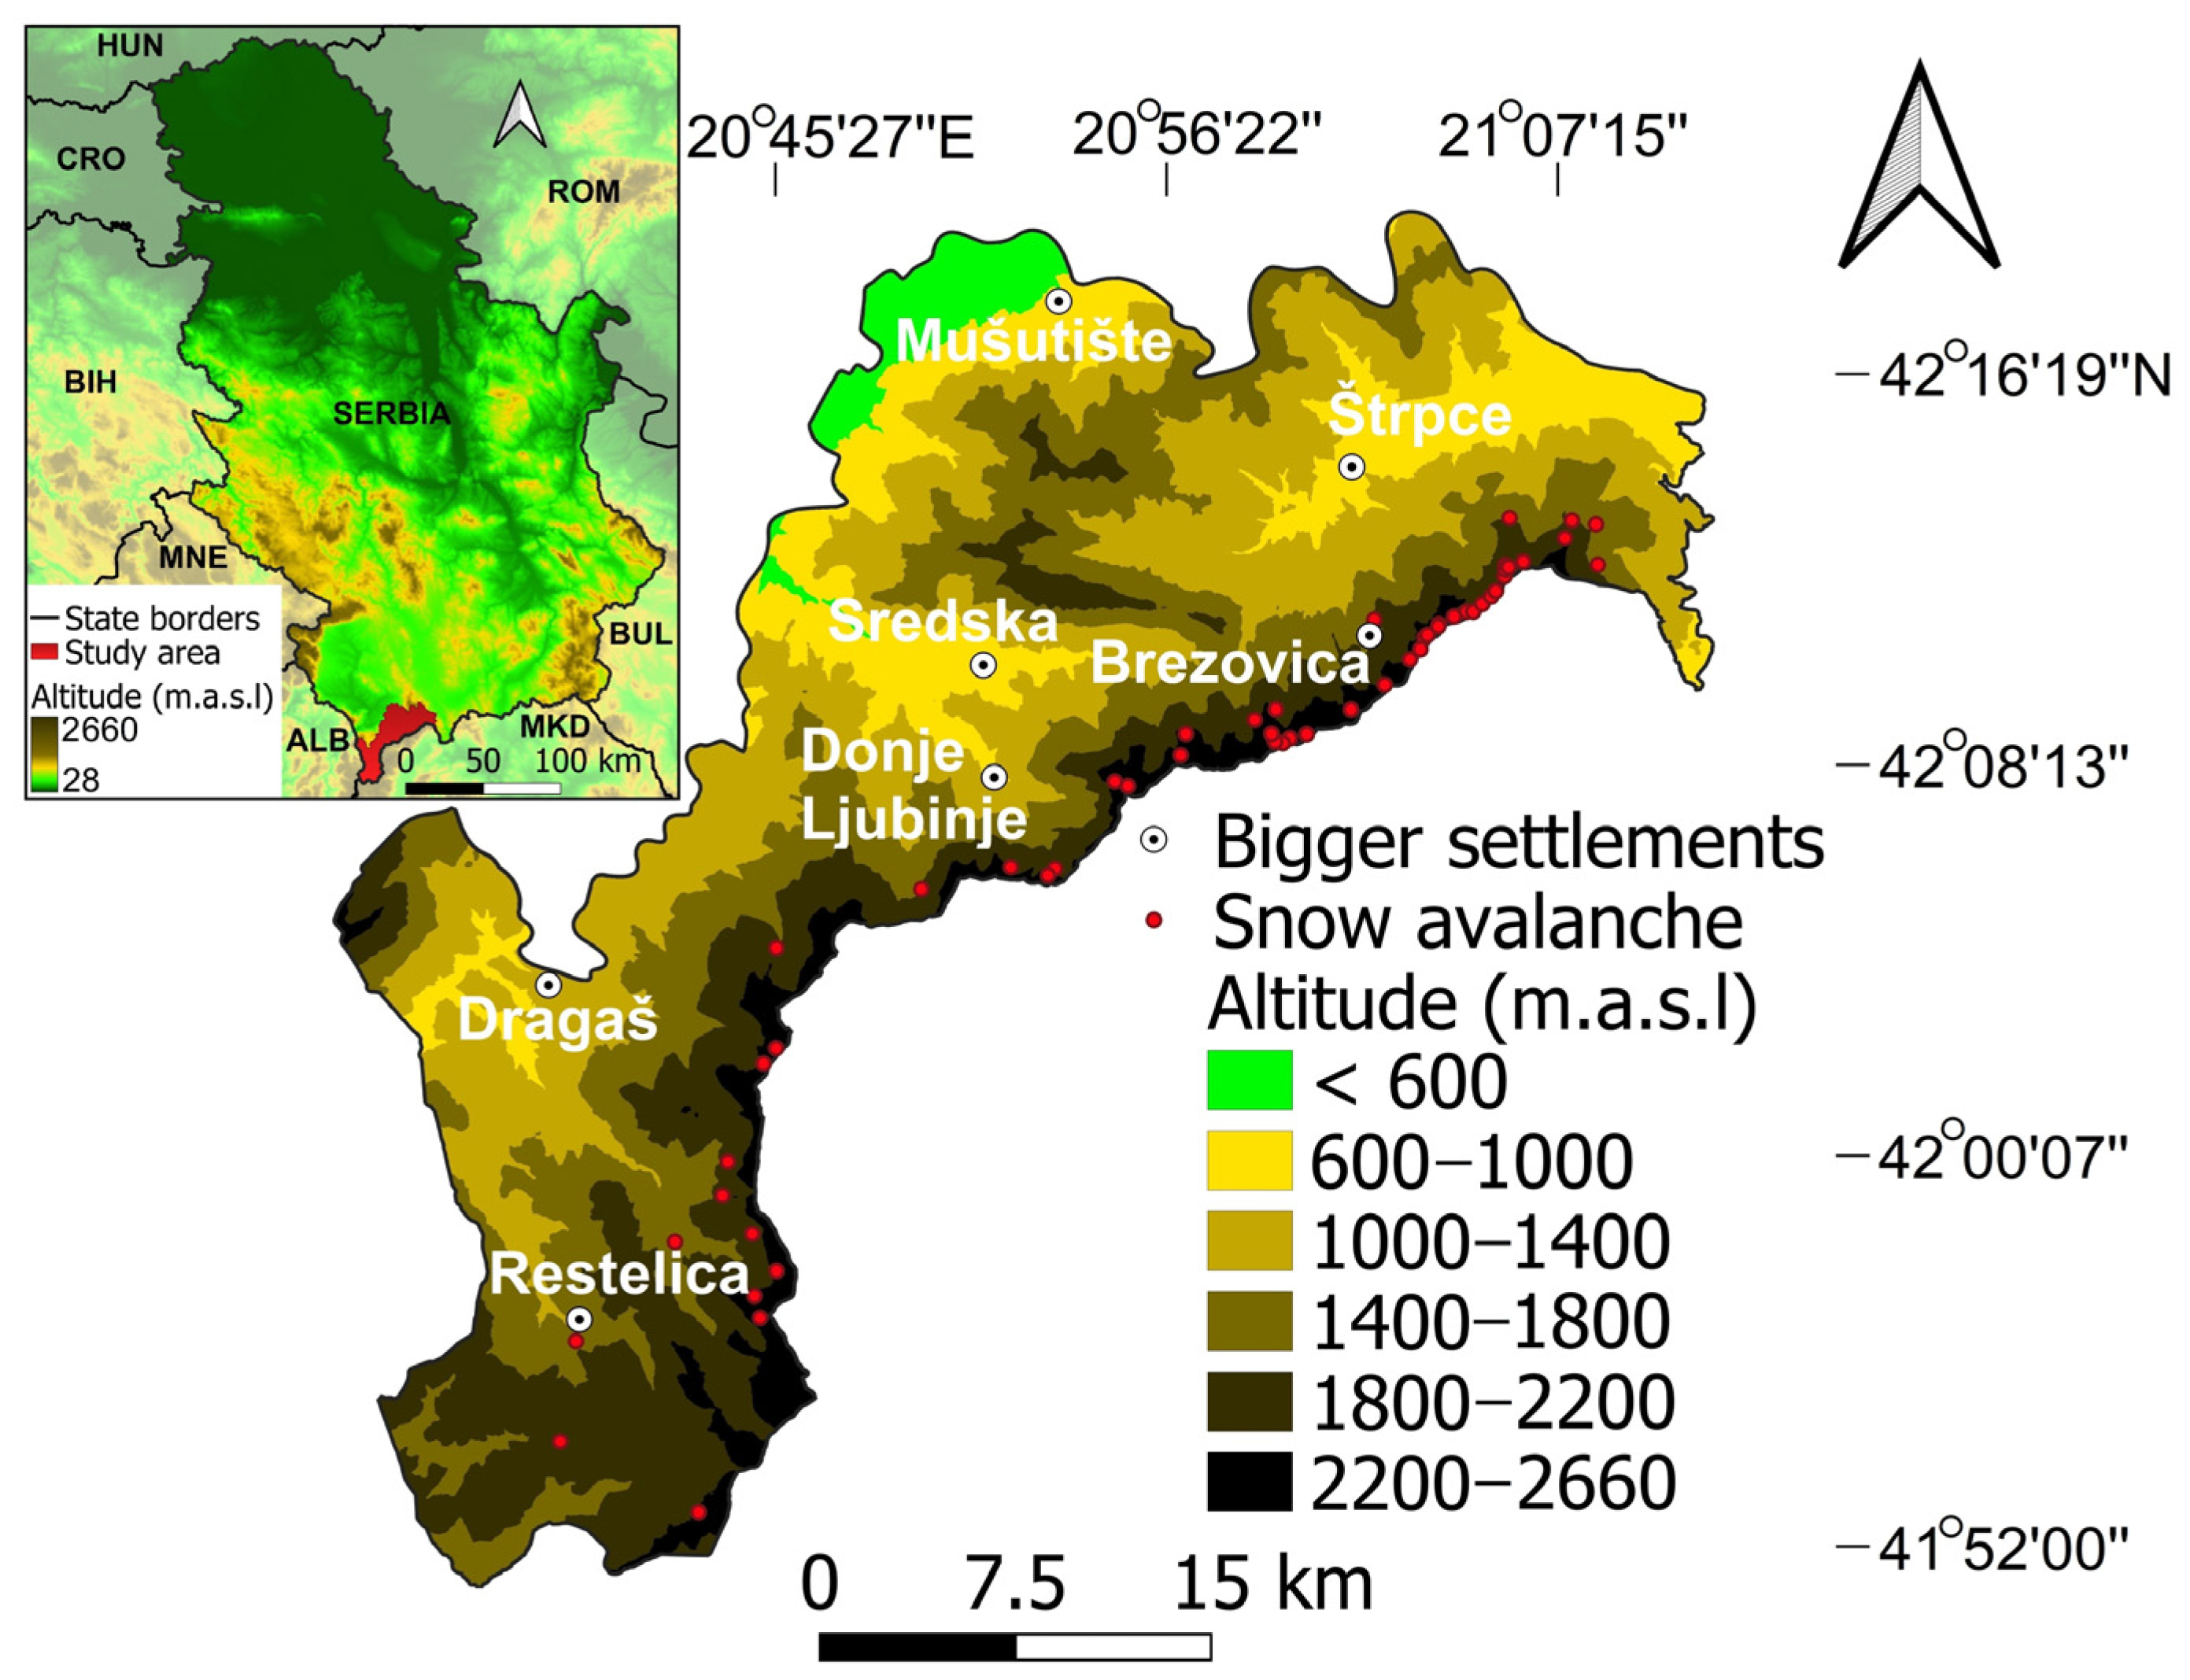
In the southern part of Serbia, on the border with North Macedonia and Albania, lies the Šar Mountains (Figure 1). The study area covers the planned boundary of the Šar Mountains National Park, with an area of 970 km2. The point with the lowest altitude is 387 m, while the highest point, which is also the highest peak in Serbia reaches Velika Rudoka (2660 m) [16]. The average altitude is 1421 m, and the average slope of the terrain is 18°.

Figure 1.
Geographical position of the Šar Mountains.
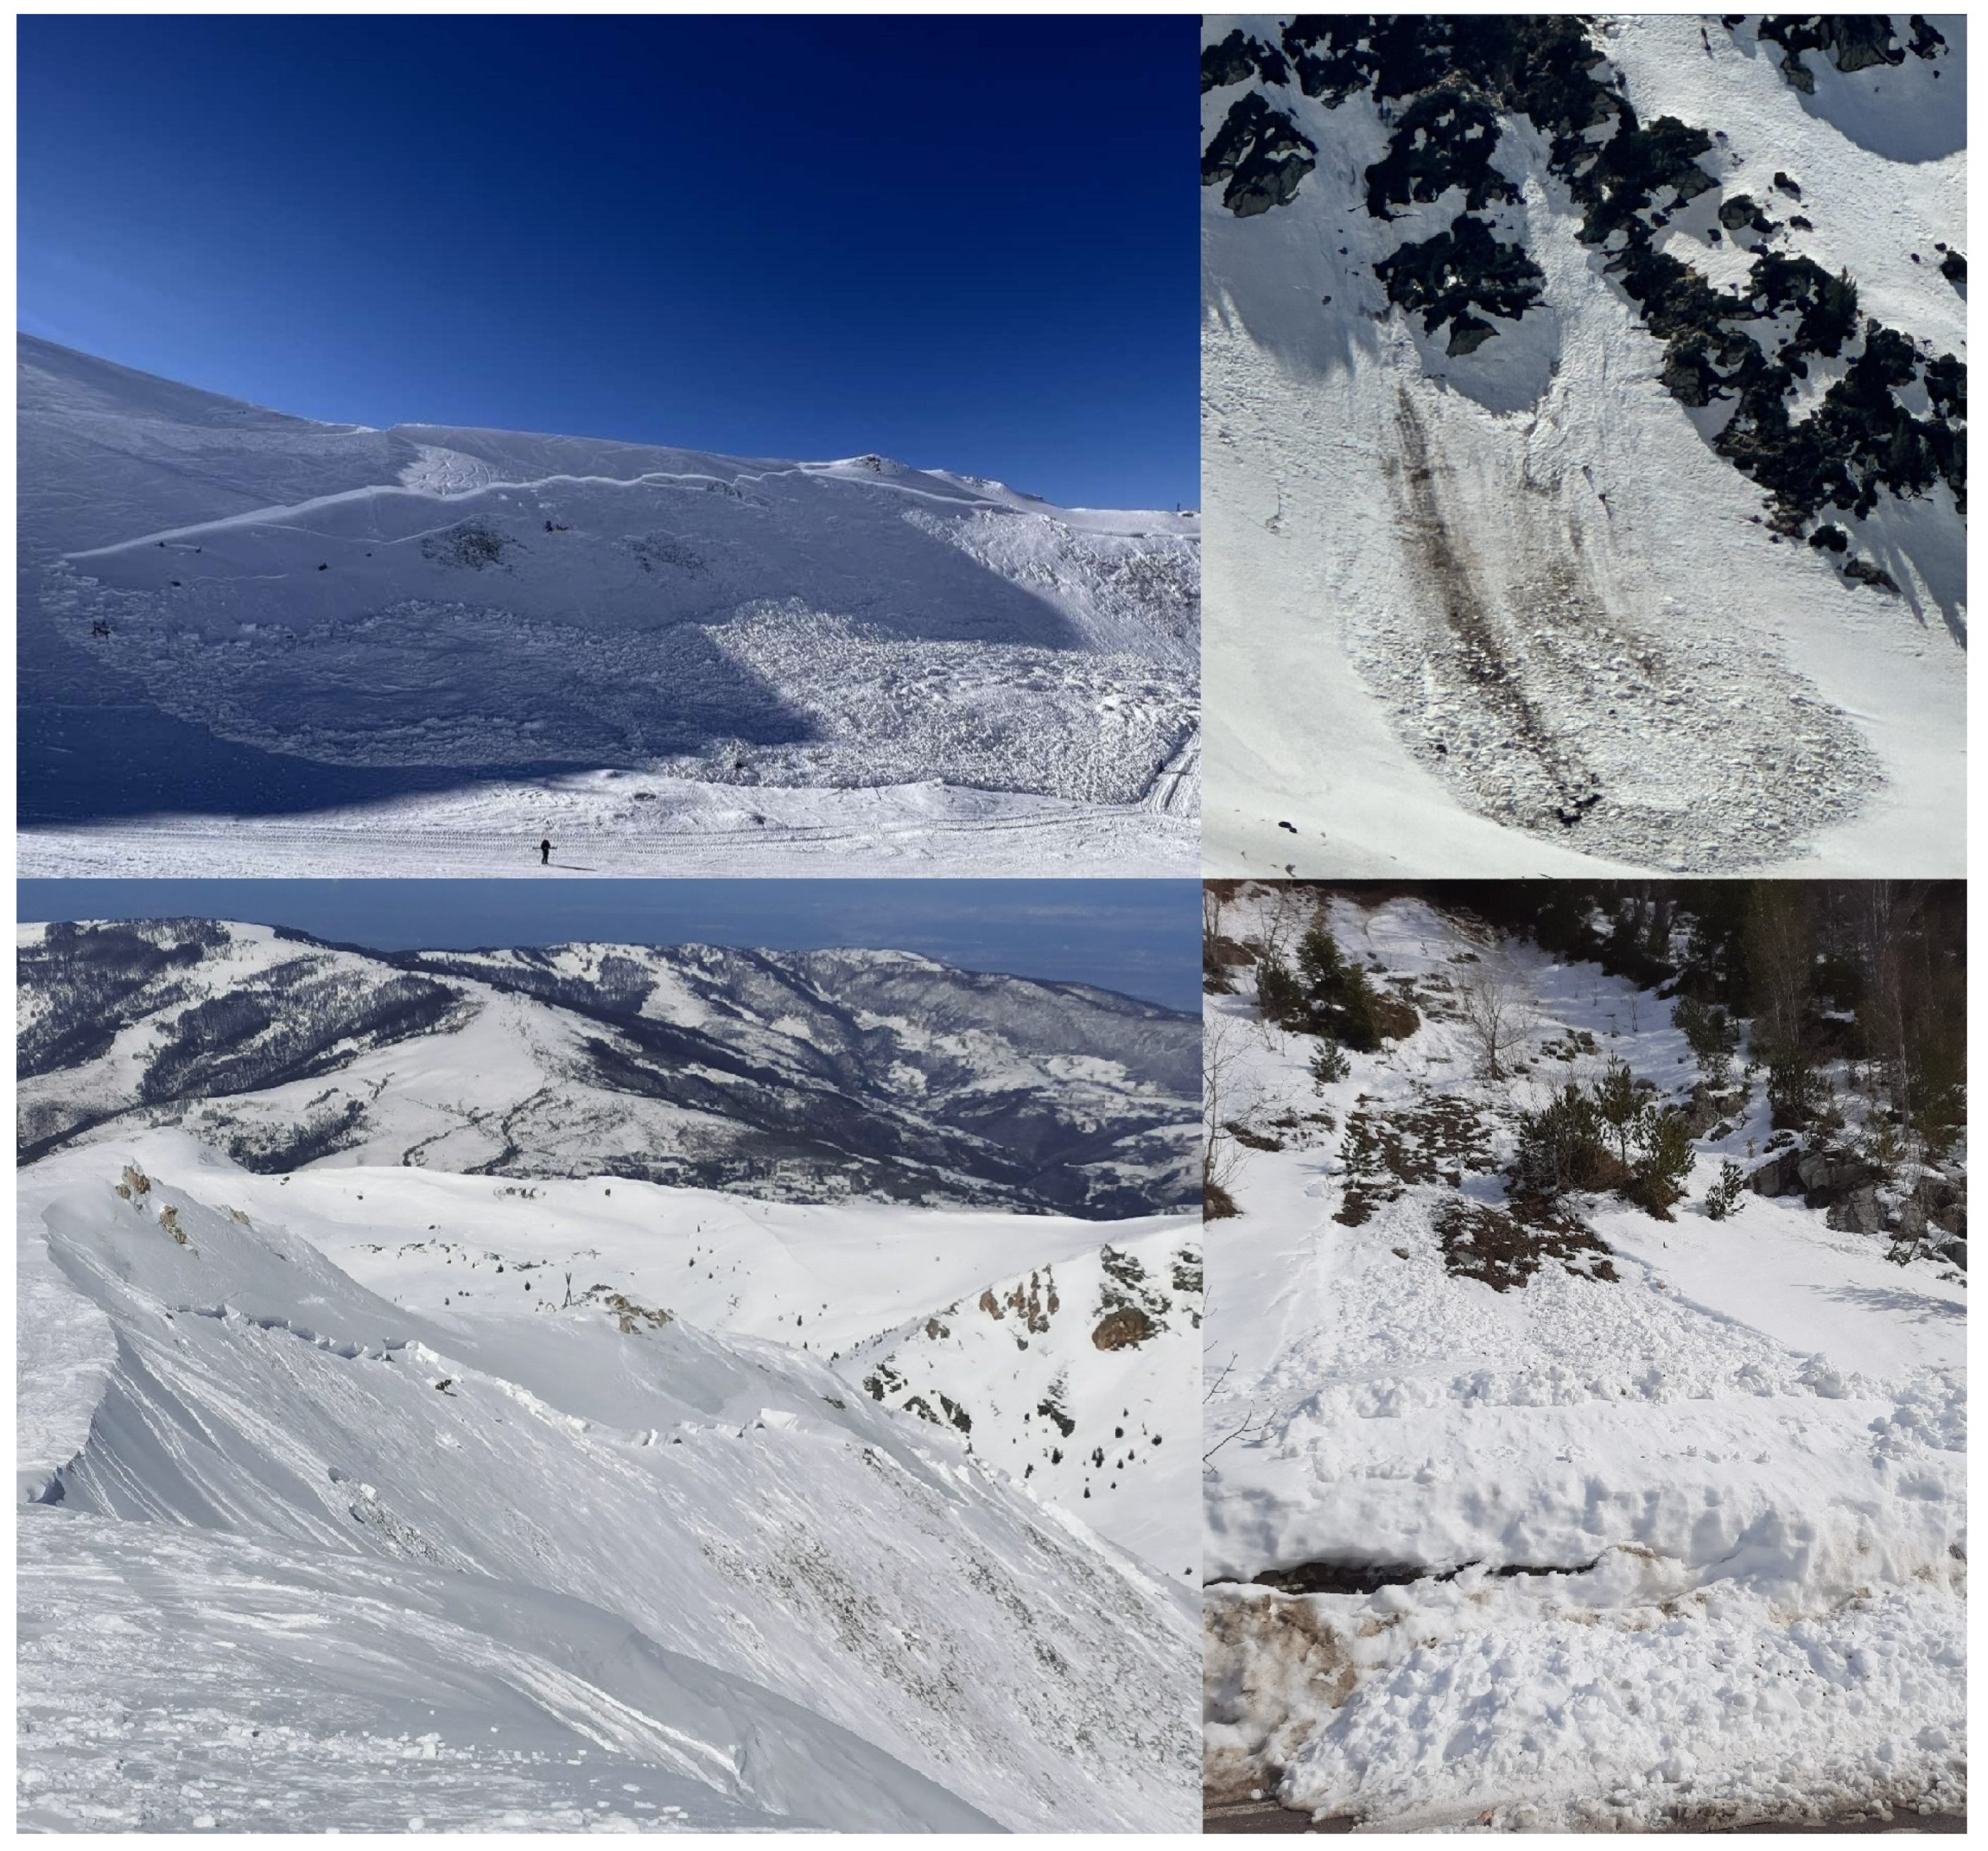
During the Pleistocene, the Šar Mountains were covered by glacial ice, so that today there are numerous glacial forms in the relief (cirques, glacial valleys, moraines). Large amounts of snow are still characteristic of this area. A considerable amount of snow remains in January and February, when the most snow avalanches form (Figure 2).
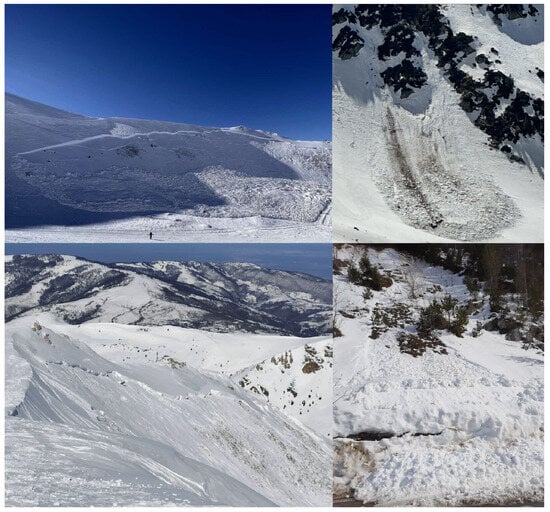
Figure 2.
Snow avalanches on the Šar Mountains (photo by Stanišić, M., 2023/24).
Weather conditions are extremely variable during the winter months and locally isolated. It often happened that at the same time in one part of the Šar Mountains (Brezovica) a large amount of snow fell, while in another part (Restelica) it was sunny and without precipitation. Such differences are caused by different climatic influences and numerous geomorphological “barriers” within the study area. The structure and water saturation of snow also depend on climatic factors. Due to low temperatures and low relative air humidity, there is mostly dry snow on the mountains in January and February. With the spring months and the rise in air temperature, the amount of water in the snow increases significantly. Regardless of the change in the mechanical properties of the snow, the susceptibility of snow avalanches is at a high level in many parts of the Šar Mountains from January to March.
The northern parts of the Šar Mountains are suitable for winter tourism, therefore the Brezovica ski center was built in the eastern part of the study area, which hosts tens of thousands of tourists annually [17]. Although there are groomed ski slopes, tourists often ski off the marked slopes in locations highly prone to avalanches.
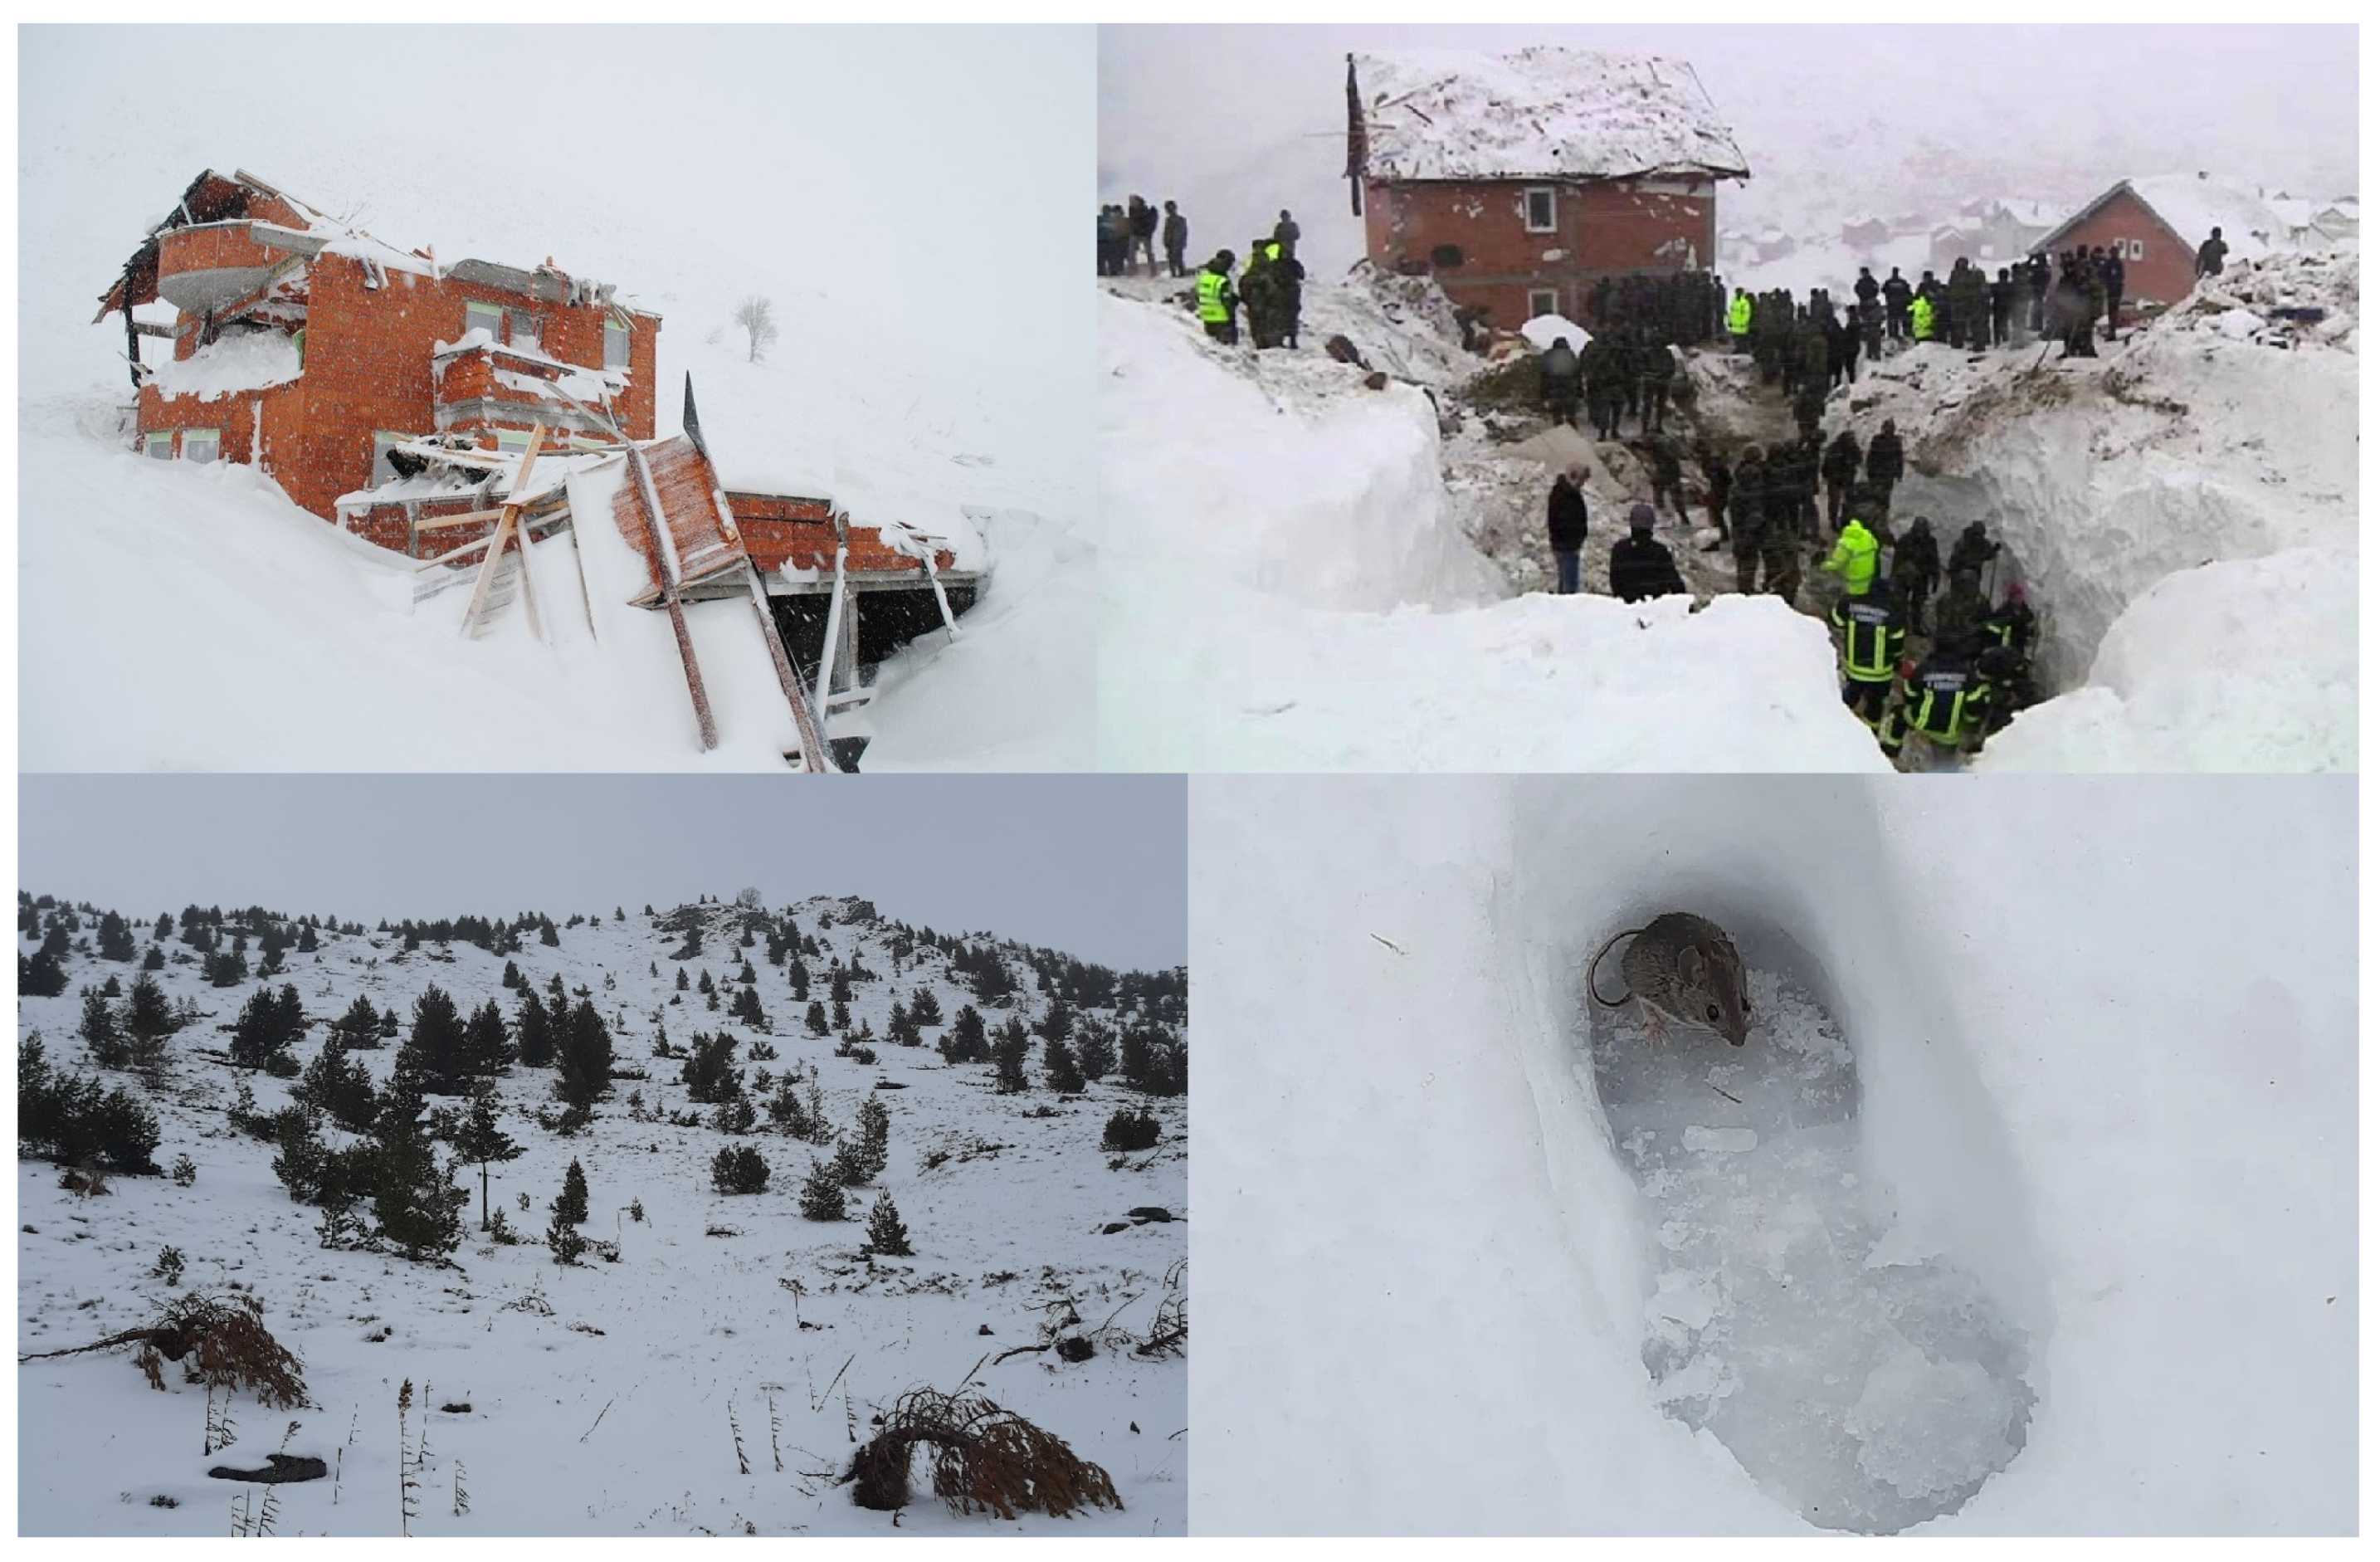
During the last 200 years, more than 100 people have lost their lives in the Šar Mountains due to snow avalanches [16]. In addition, the destructive force of snow avalanches often causes damage to houses, roads, and vegetation (Figure 3). From the fauna and flora aspect, avalanches significantly endanger animal species (Rupicapra rupicapra, Ursus arctos, Dinaromys bogdanovi) and high mountain bushy vegetation (Pinus mugo). To protect the environment, it is necessary to use modern methods to determine the locations susceptible to snow avalanches.
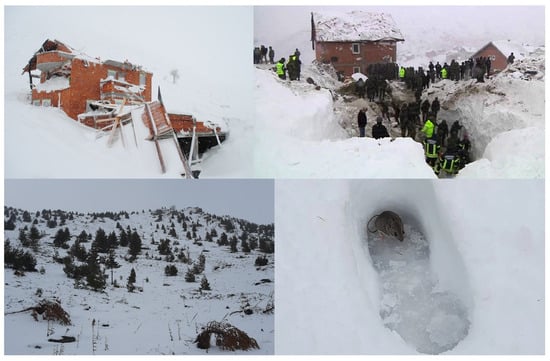
Figure 3.
The impact of snow avalanches on the environment of the Šar Mountains.
2.2. Methodology
2.2.1. Snow Avalanche Formation Index (SAFI)
Multi-criteria decision-making (MCDM) methods are widely used in predicting natural hazards [38,39]. Snow avalanches represent a complex type of natural hazard that is affected by different microrelief conditions depending on the anatomy of the avalanche. Avalanches have a starting, transition zone (track), and a deposition (run-out) zone. In order to model snow avalanches correctly, it is necessary to pay particular attention on the potential triggering zones. For this purpose, the snow avalanche formation index (SAFI) was developed, which analyzes the main natural conditions for avalanche formation: snowpack, terrain slope, and land use.
Snowpack—in most mountainous regions worldwide, there are no constant measurements or data on the depth of the snow cover. Remote sensing provided a relevant methods for identifying the snow cover in a given area. In this article, the Normalized Difference Snow Index (NDSI), derived from satellite images of the Sentinel-2 mission, was used to assess the presence of snow cover [40]. Data were analyzed for five consecutive years (January 2020–February 2024) were analyzed, within which ten different scenes were processed, with a pixel spatial resolution of 10 m [41]. Cloud cover in the analyzed satellite images is less than 1%. NDSI is calculated by the formula [40]:
where: Green—green spectral channel; SWIR—short-wave infrared spectral channel.
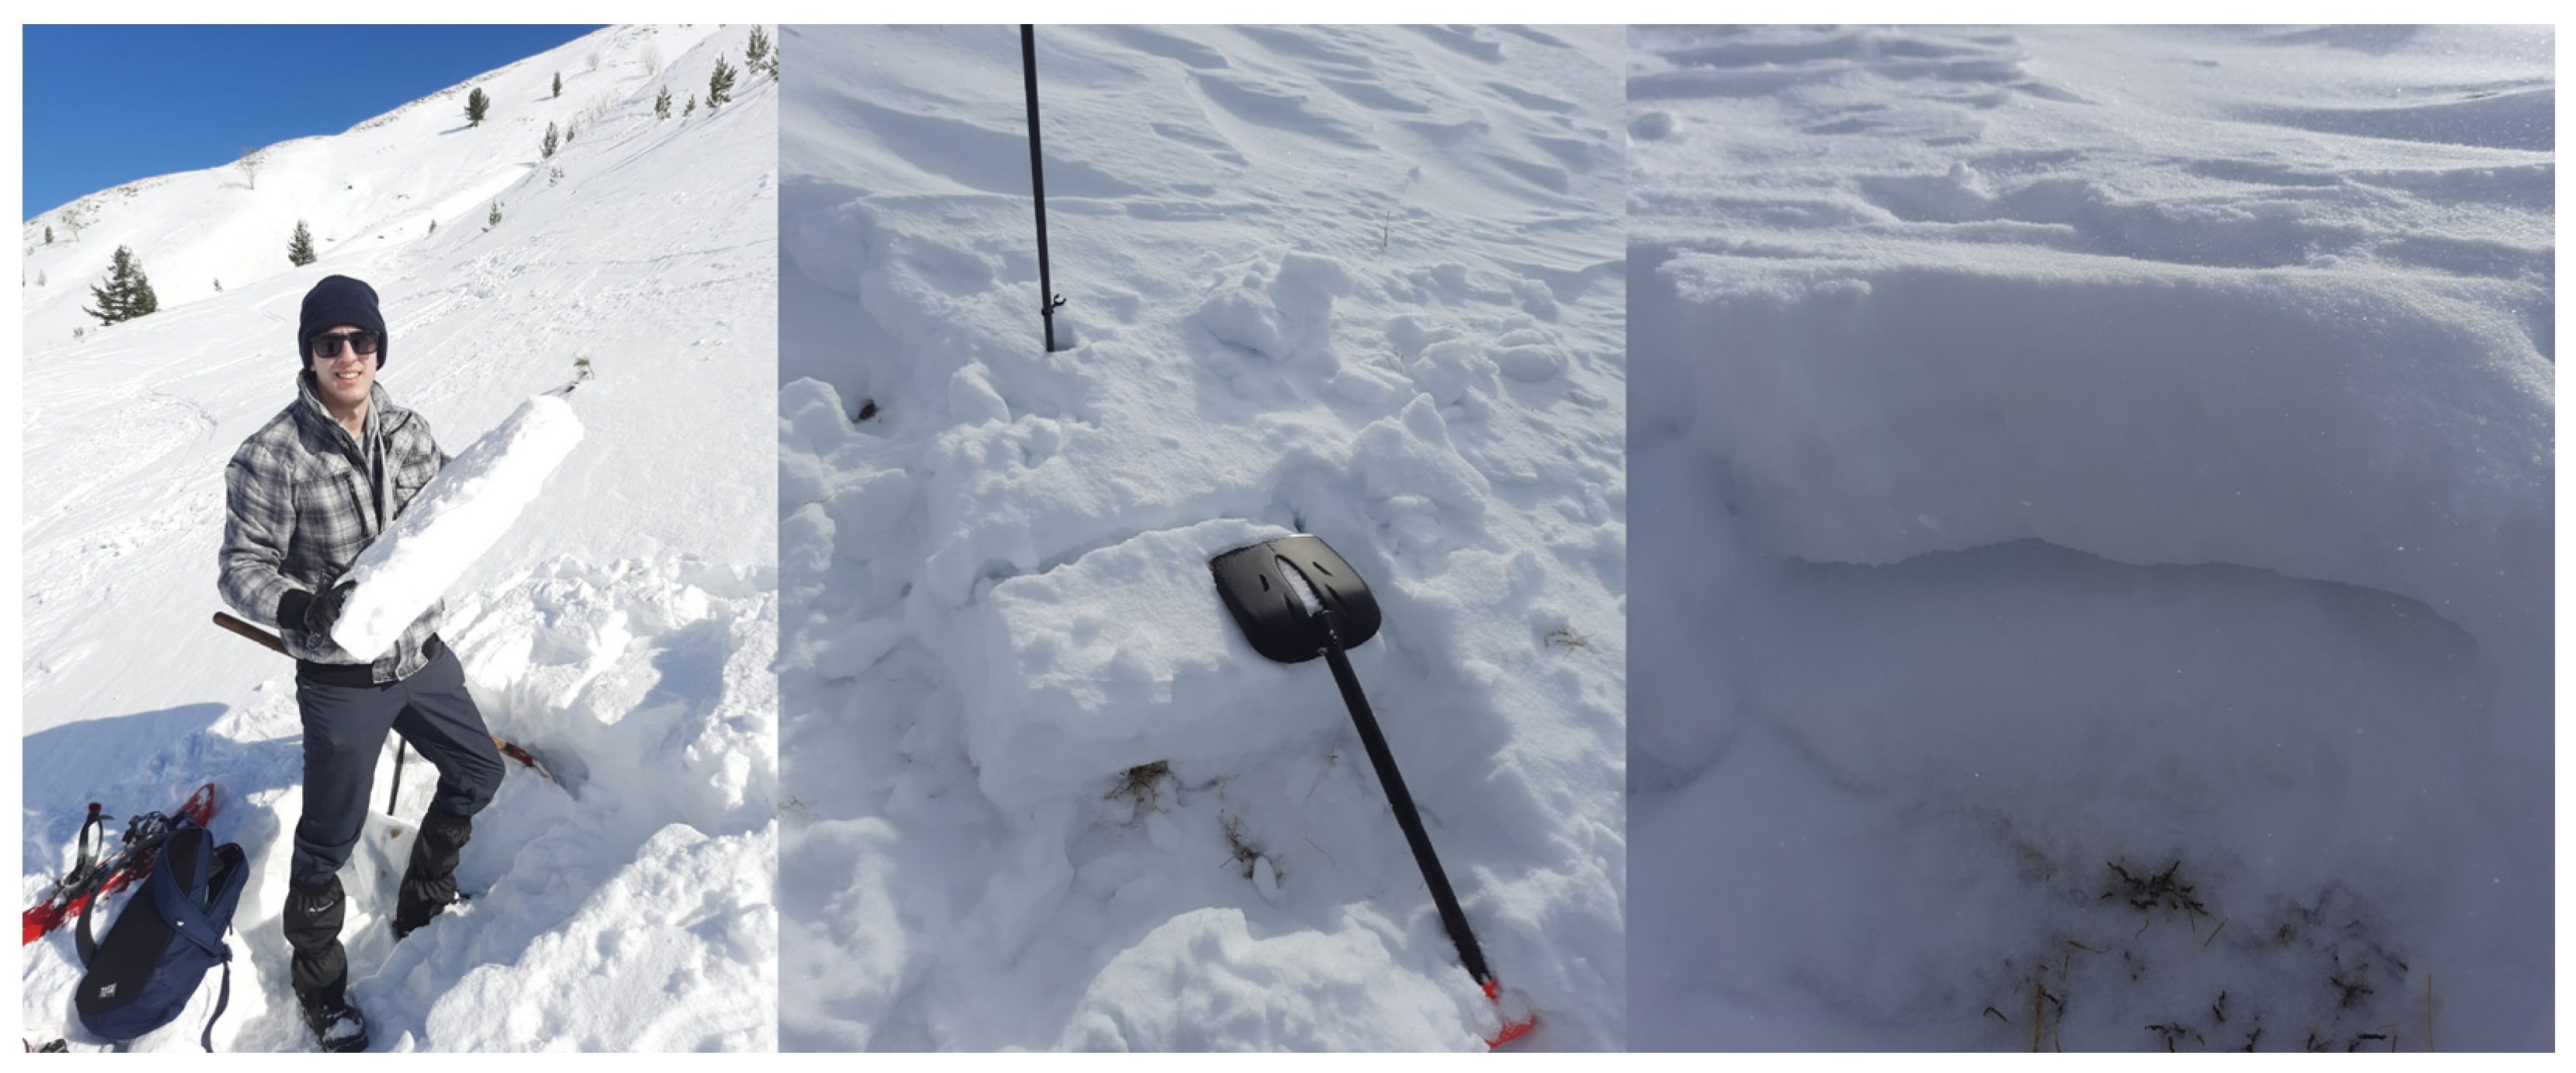
NDSI values range from −1 to +1. Values greater than 0.4 indicate the presence of snow cover [40,42]. The maximum NDSI value can be 1, indicating complete snow dominance and significant depth of snow cover. During the field research on the Šar Mountains in February 2024, the location that has a value of 0.64 on the NDSI image, the snow thickness on the ground was 103 cm. On the other hand, in the area where the snow depth of 30 cm was recorded, its NDSI pixel value was 0.56. These values indicate significant differences at the local level of snow distribution. Thresholds for NDSI values for the territory of the Šar Mountains where the avalanches were mapped are above 0.6. Also, by analyzing avalanche flows in the Rocky Mountains (Utah, USA), it was also observed that the NDSI thresholds for avalanche formation are above 0.6 [43]. In addition to the mapping, an extended column test (ECT), a hand shear test, the identification of snow grains, and the measurement of the snow cover temperature were carried out (Figure 4).

Figure 4.
Field research on the Šar Mountains.
The results confirmed the existence of many snow layers in places where the snow depth exceeded one meter. The snow temperature on the windward sides was significantly lower (−10.6 °C) compared to the leeward sides (−4.5 °C). Due to the persistent weak layers, buried surface hoar is very common. The maximum depth of the snow cover in the ravines below the highest peaks of the Šar Mountains during the winter months is 5–6 m [17]. Field research was carried out in 2023 and 2024 and 53 snow avalanches of different typologies were mapped.
Field research included hiking below the ridge, analyzing snowpack, and mapping snow avalanches. The mapping was done through the GIS mobile application QField [44]. Inside the application created a project in which all recorded avalanches were assigned a geographical position: latitude, longitude, and altitude (Table 1). After that, the data was exported to QGIS software, where NDSI values and terrain slope were identified for the digitized points (snow avalanches).

Table 1.
Geospatial data on mapped avalanches.
Terrain slope—the most essential geomorphological condition for the occurrence of snow avalanches [45]. In most cases, the slope of the terrain is the highest during the formation of the avalanche and decreases with the process of avalanche deceleration and snow accumulation. According to data and standards of the Utah Avalanche Center, snow avalanches form on terrain slopes of 20–60° [46]. Data on the slope of the terrain were obtained through a digital elevation model (DEM) with a spatial resolution of 12.5 m [47].
Land use—a biogeographic factor that affects the transition of avalanche material. Bare areas (stone fields) and territories with low vegetation (meadows, pastures) represent ideal locations for the formation of an avalanche. On the other hand, dense forests prevent the formation of slab avalanches and represent a significant natural barrier during avalanche movement [48]. Data on land use were taken from the ESRI geospatial database formed on Sentinel-2 satellite images with a spatial resolution of 10 m [49].
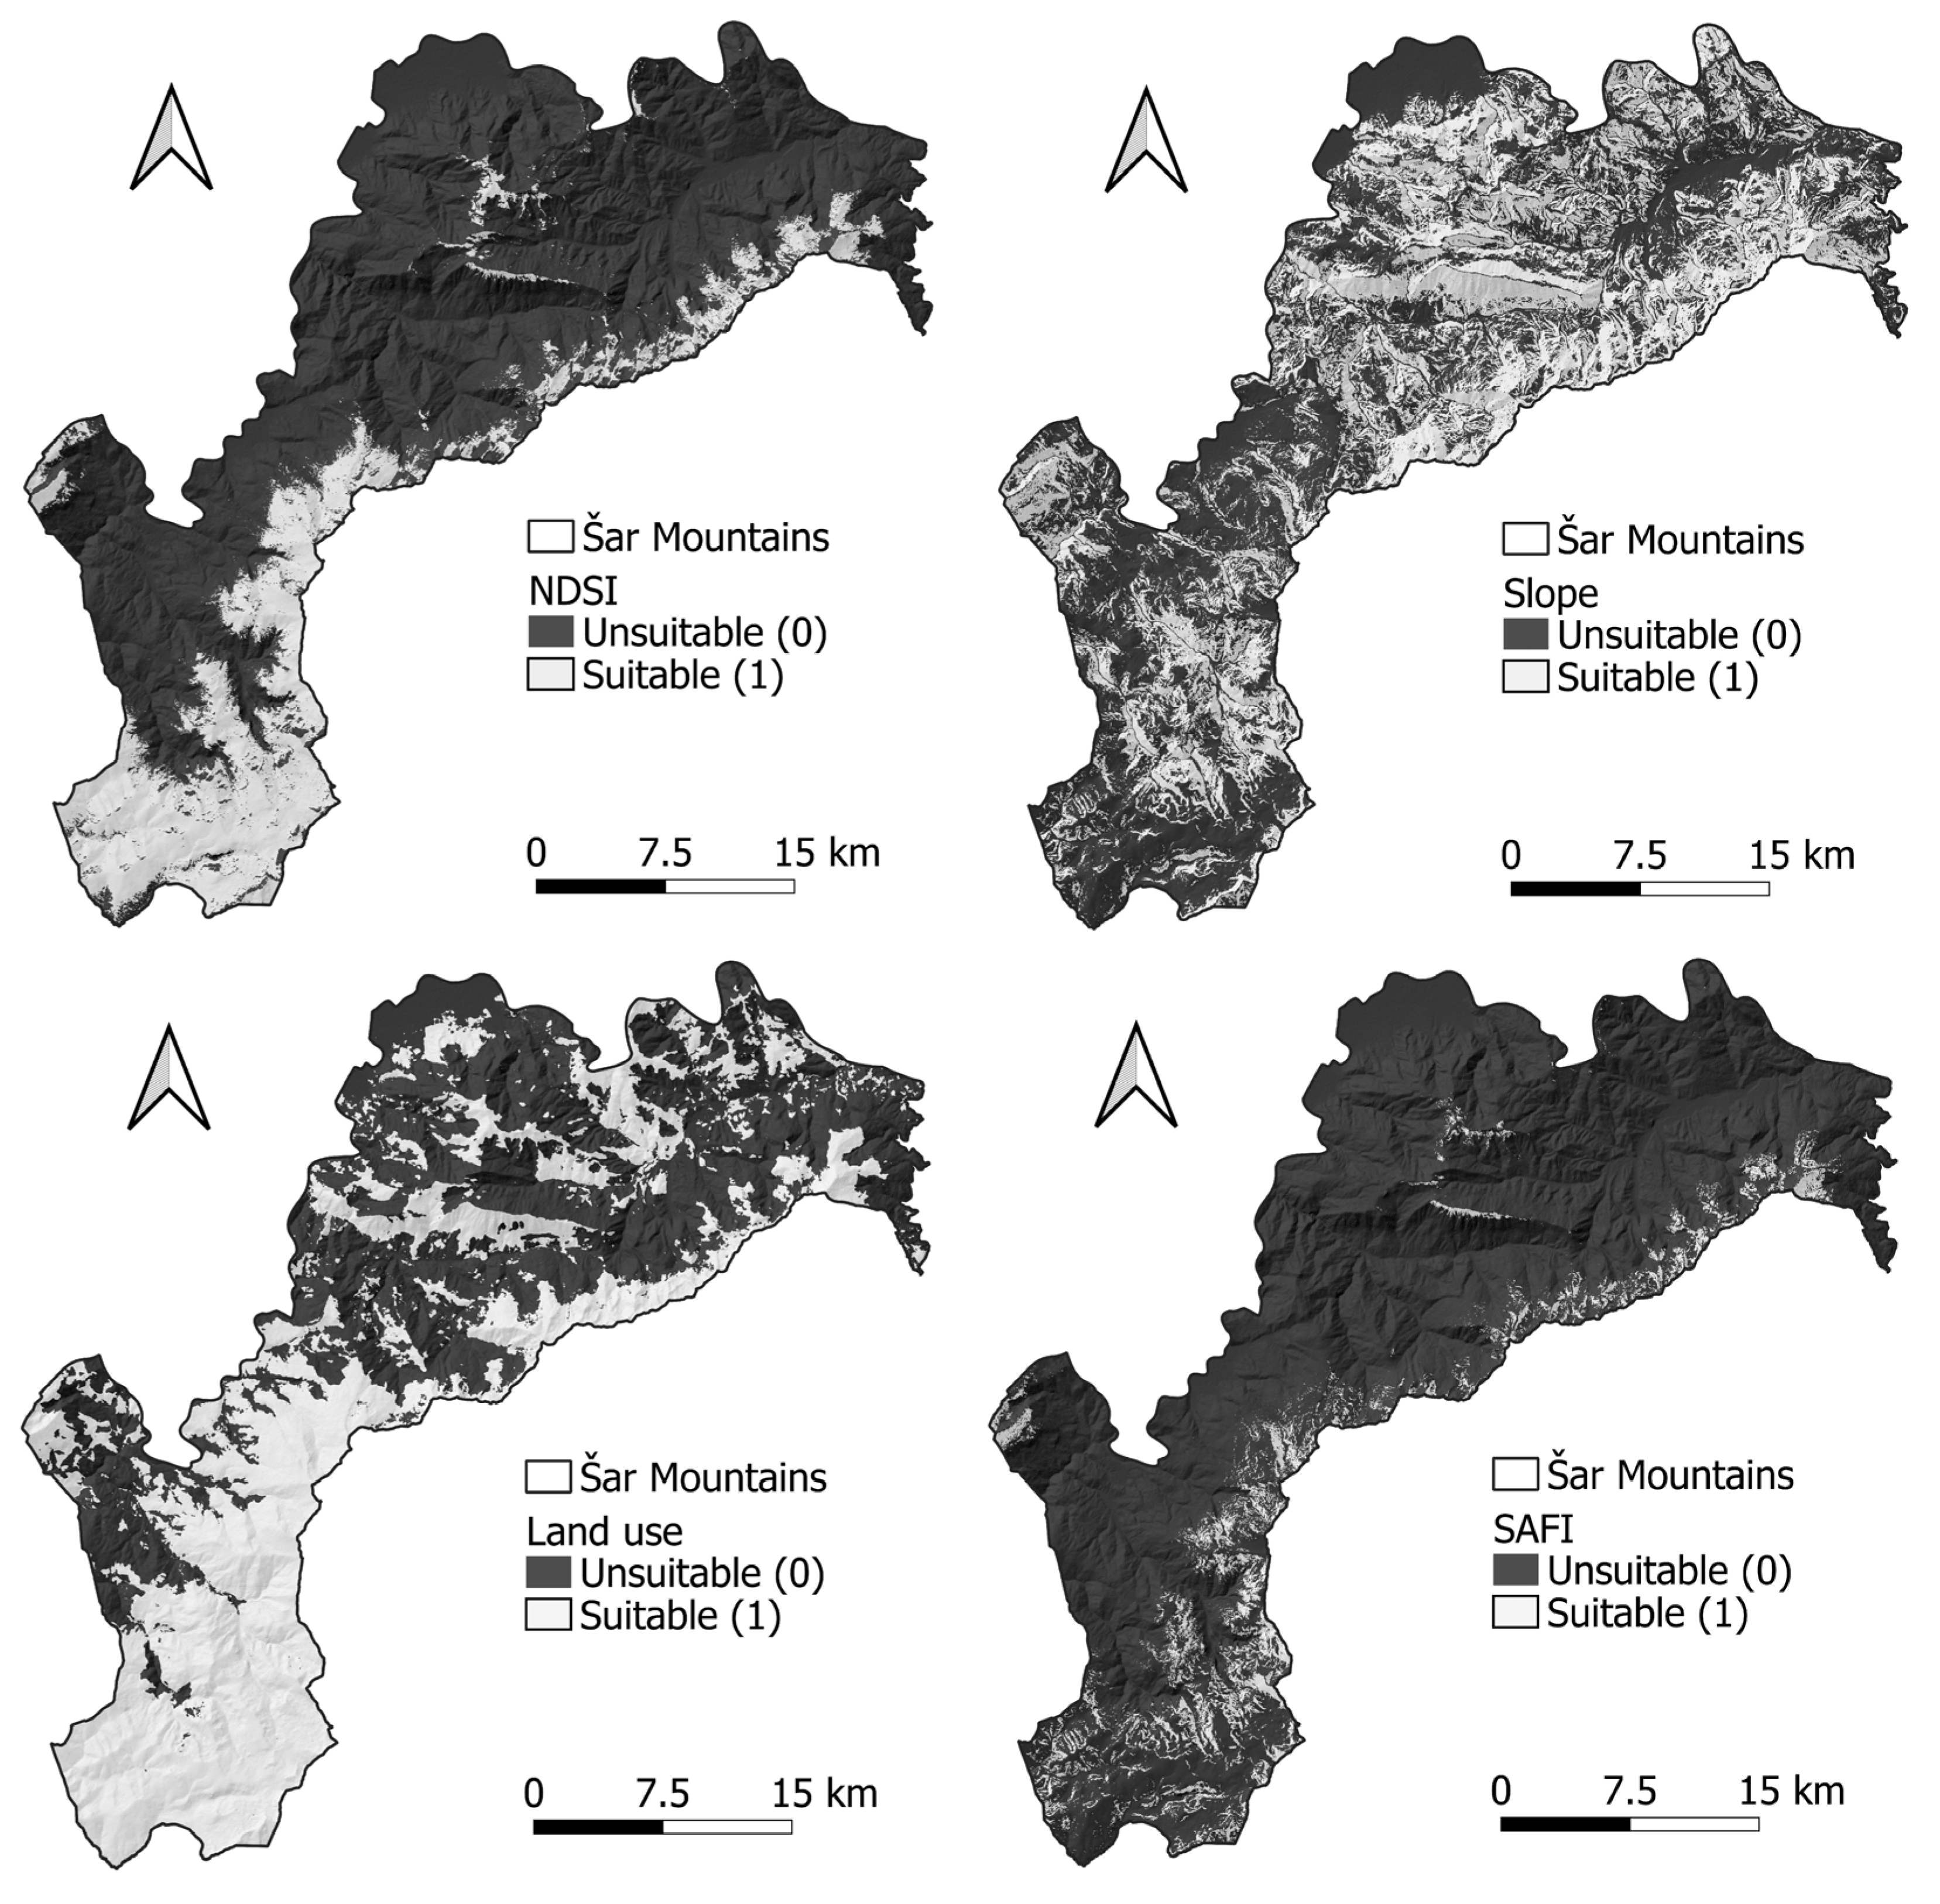
The possible values of the SAFI index are marked with 0 and 1. The value 0 shows conditions unsuitable for avalanche formation, while the value 1 indicates suitable intervals for forming an avalanche (Table 2). After assigning and reclassifying values, the formula is accessed:
where: SAFI—Snow avalanche formation index; SC—snow cover; S—Slope terrain; LU—Land use. After calculating the SAFI index, territories with a value of 1 represent ideal locations for avalanches to form (Figure 5). From the database aspect, SAFI is a product of field research (avalanche mapping), GIS analysis (DEM) and remote sensing (Sentinel-2 data). The area where avalanches can form is 67.6 km2.
SAFI = SC · S · LU,
Table 2.
Parameters for the calculation of the SAFI index.

Figure 5.
Maps of natural conditions and snow avalanche formation index (SAFI).
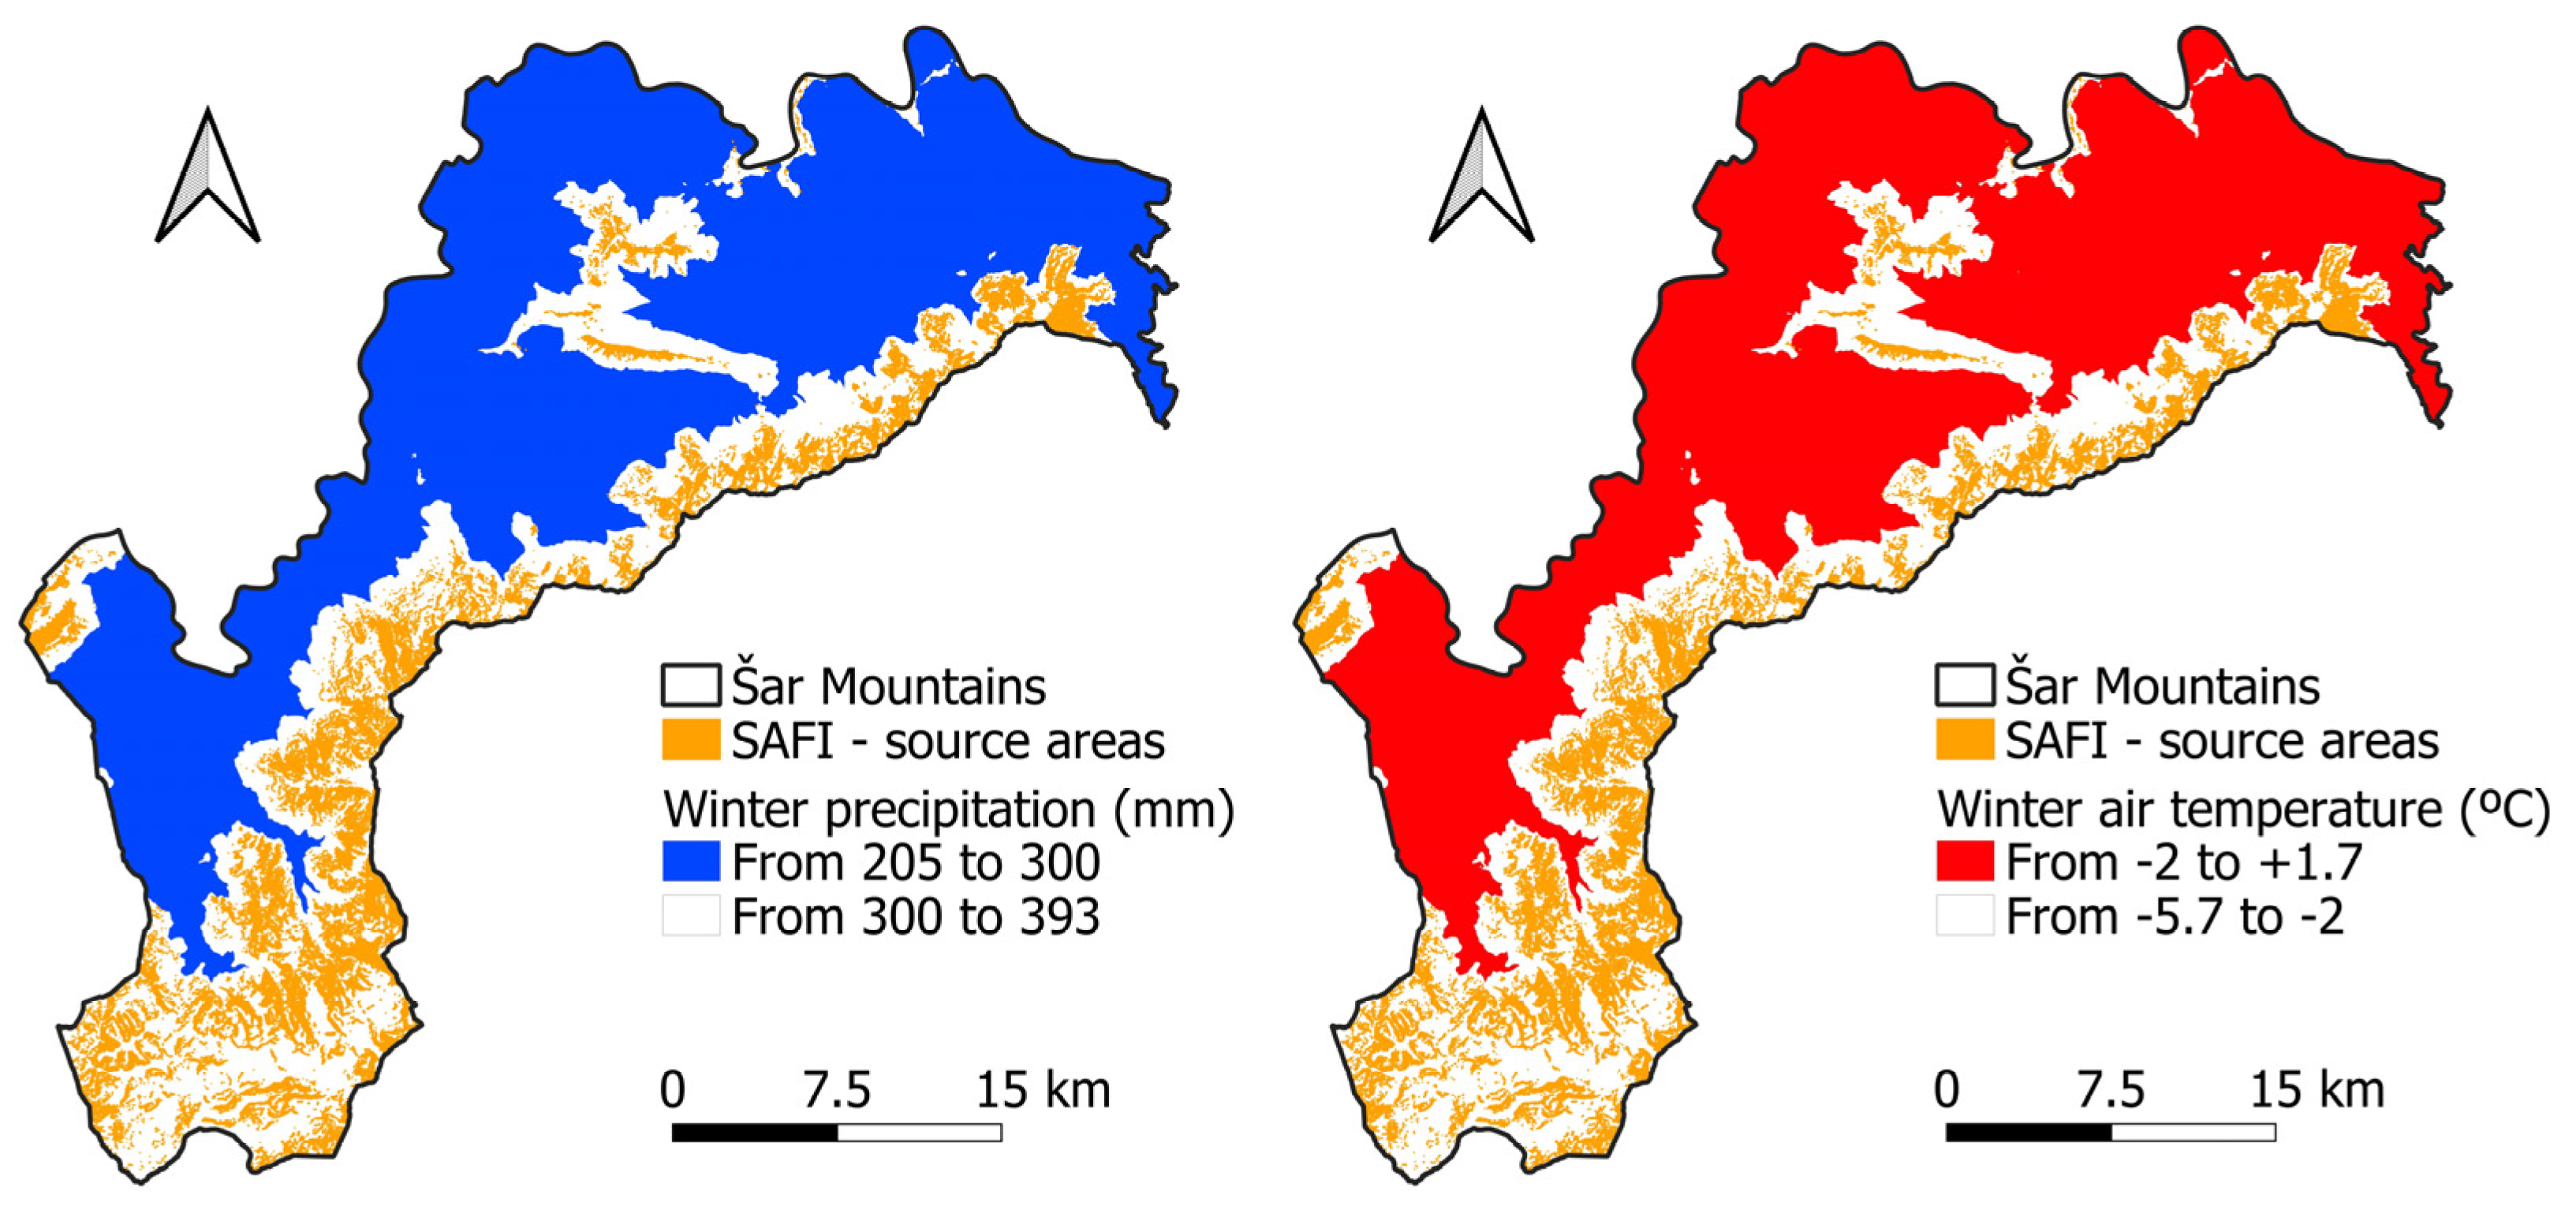
Once the SAFI index is obtained, the empirical analysis of source areas with climatic conditions (winter precipitation and winter air temperature) is approached. The average winter precipitation was obtained by linear regression of data from five meteorological stations: Rečane (580 m), Štrpce (860 m), Jažince (950 m), Zaplužje (1160 m) and Restelica (1550 m) for the observed period 1960–1985 [50,51]. In order to obtain values for the entire study area, the formula was used:
where: DEM—digital elevation model.
0.0858 × DEM + 169.29,
Values from 205 to 393 mm were obtained for the average winter precipitation. In geographic information systems, the SAFI locations overlap with the amount of precipitation, and the conclusion is that all locations where avalanches can form receive more than 300 mm of precipitation (Figure 6). This means that if all the precipitation during December, January, and February were new snow, the potential snow depth would be 3 m. In the lower areas of the Šar Mountains, rain often alternates with snow during the winter, while at higher altitudes, snow is the dominant type of precipitation.
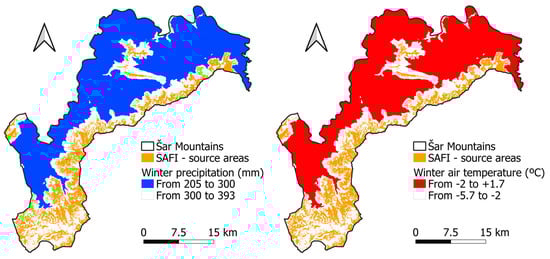
Figure 6.
Overlap of SAFI sites with winter precipitation and winter air temperatures.
The average winter air temperature was also obtained by linear regression of data from three meteorological stations: Prizren (402 m), Brezovica (911 m), and Dragaš (1060 m), for the observed period 1960–1988 [50,51]. In order to calculate the values for the entire territory of the Šar Mountains, the following formula was used:
where: DEM—digital elevation model.
−0.0034 × DEM + 3.1576,
The average winter temperature varies from −5.7 to +1.7 °C. When overlapping the SAFI locations with the average winter temperature on the Šar Mountains, the air temperature in all locations where avalanches are formed is below −2 °C (Figure 6). Since a negative temperature regime prevails at higher altitudes, a large amount of snow easily accumulates and forms different layers depending on the number of snowfalls.
The GIS software QGIS 3.28.10. was used to analyze and process data and maps [52,53]. The obtained results are exported to the Flow-R software, which performs propagation modeling of the other parts of the avalanche: the track, and the deposition zone [54].
2.2.2. Flow-R Software
The Flow-R software is developed to process GIS-based regional susceptibility assessments of gravitational hazards [54]. Initially, it was developed for debris flows. Lately, it has been used for shallow landslides, rock avalanches, rockfalls, and snow avalanches [55]. It enables the associated extent of propagation. The program can recognize the source area of instabilities using available input factors and defines the run-out distance of the process based on frictional laws and propagation probability principles [53,56].
The model comprises two primary components: automatic identification of source areas and spread estimation. Initially, it takes into account conditional factors influencing the formation and progression of the process, such as digital elevation models (DEM), flow accumulation, terrain slope, and various other factors [57,58].
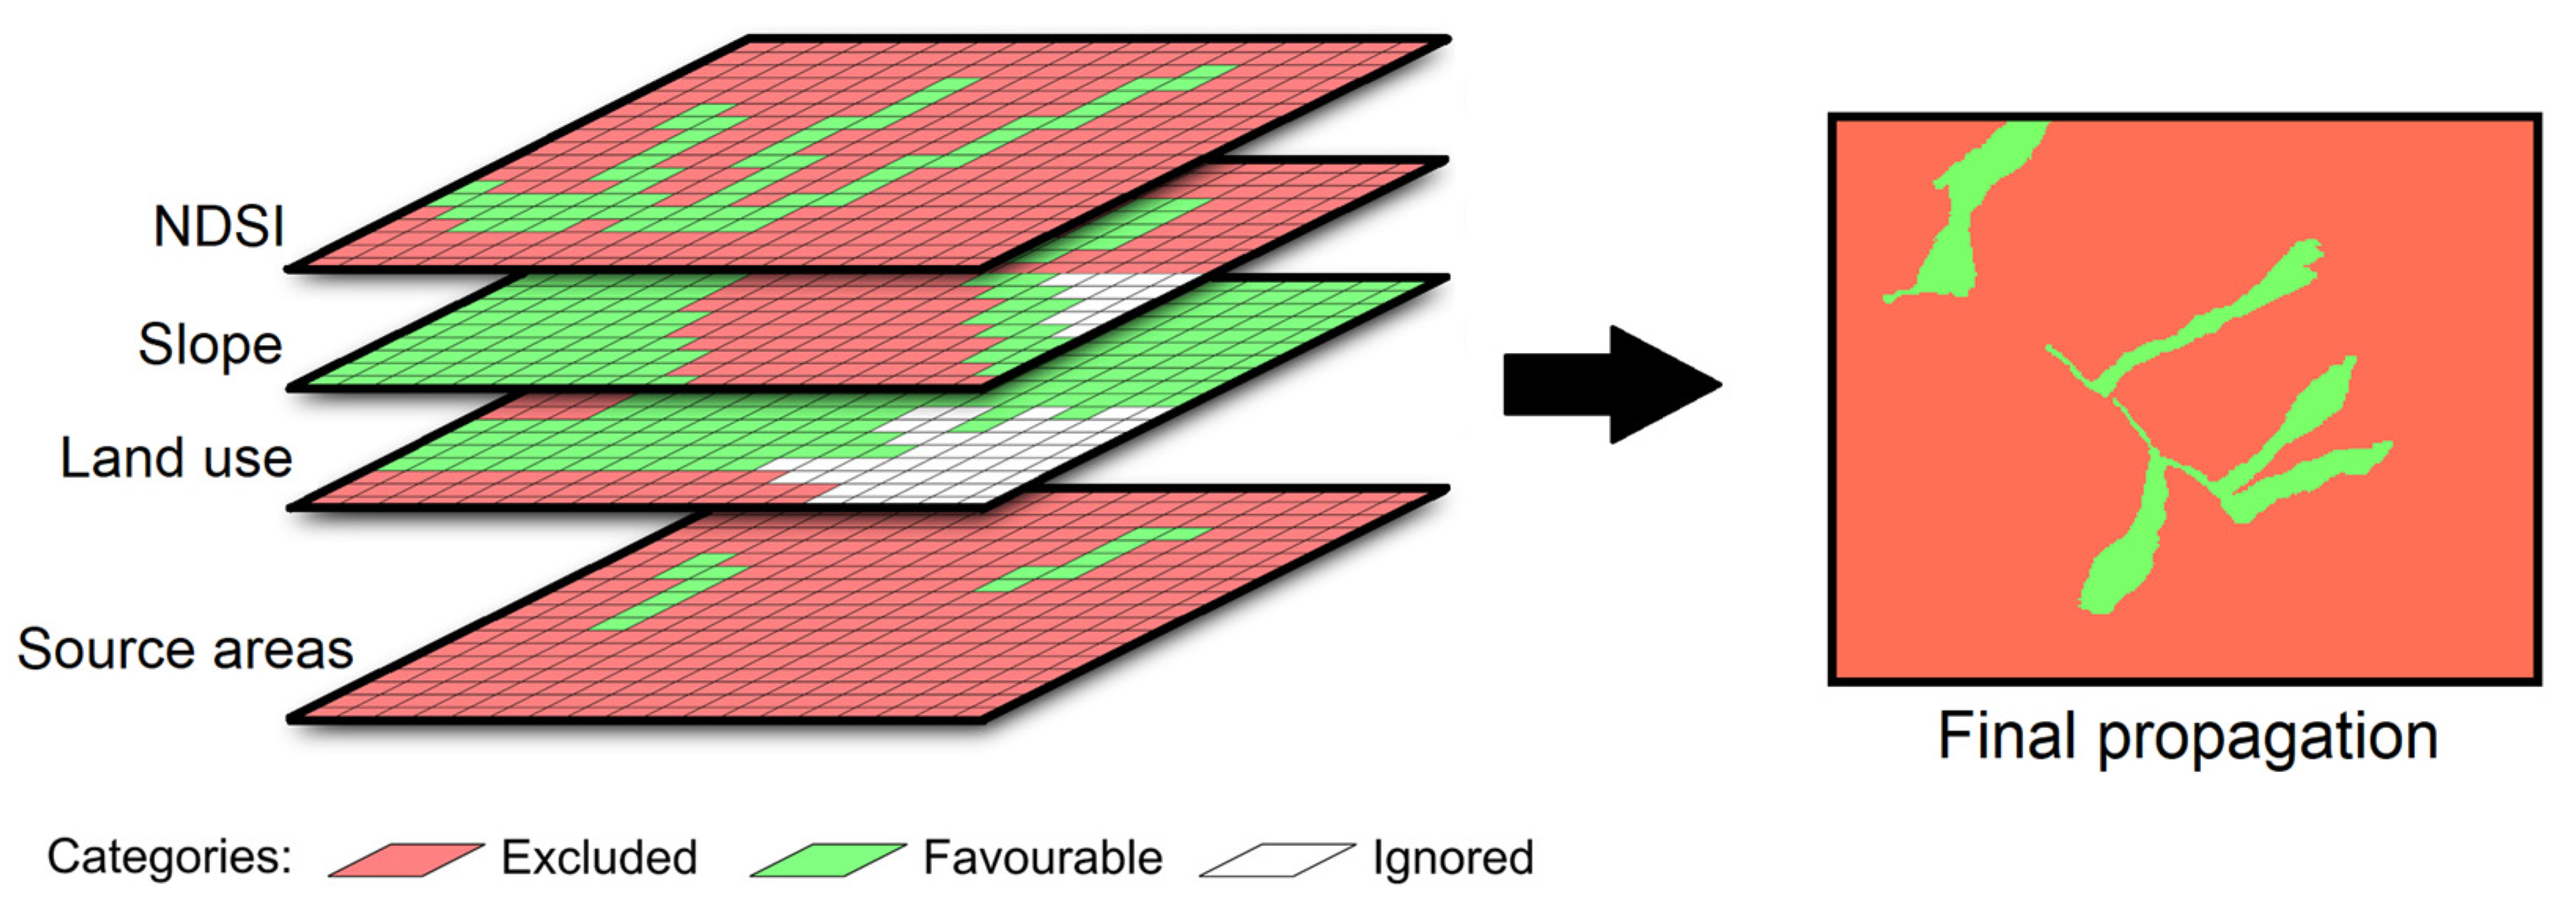
Identification criteria of input factors are labeled ‘favorable’ when snow avalanche initiation is possible, ‘excluded’ when initiation is improbable, and ‘ignored’ when a decision on this parameter cannot be made (Figure 7). Table 2 shows specific conditions. Favorable intervals are marked with a score of 1, excluded intervals with a score of 0, and ignored pixels represent territories outside the study area. By processing the input data (snow cover, terrain slope, and land use) the source area (SAFI) was obtained.
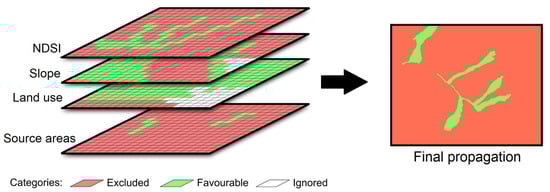
Figure 7.
Combination of various datasets for the assessment of the source areas [51].
Afterward, the probability of avalanche flow hazard is computed utilizing flow direction algorithms and persistence functions, as described by Formulas (5)–(7), while simple frictional principles are applied to determine the run-out distance of the snow avalanches. Subsequently, maps depicting the distribution of energy and hazard probability are generated. Since the source mass remains unknown, the energy balance is unified, as outlined by Formula (8) [56,59]:
In the context of calculating hazard proportions, it is necessary to break down the components of the formula: i and j represent different flow directions; is the hazard proportion in direction i; is the slope gradient between the central cell and the cell in direction i and x is a variable exponent. As x increases, divergence decreases, eventually resulting in a single flow direction when x approaches infinity; is the proportion of flow in direction i according to the persistence function; is the angle between the previous direction and the direction from the central cell to cell i; pi is the hazard value in direction i, and is the previously determined hazard value of the central cell. is the kinetic energy of the cell in direction i, is the kinetic energy of the central cell. is the change in potential energy for the cell in direction i, is the energy lost due to friction in the cell in direction i. This equation integrates various factors such as slope gradient, flow direction, persistence function, kinetic energy, potential energy change, and energy lost due to friction to determine hazard proportions for debris flows in different directions from a central cell.
The friction model described by Perla et al. [60] was originally designed for analyzing avalanches. This model relies on a non-linear friction law, which is derived as the solution to the equation of movement governing the flow dynamics. Specifically, this law provides the velocity of the flow at the termination of segment , as outlined by Perla et al. [60]:
where: µ is the friction parameter, is the mass-to-drag ratio, originally expressed as M/D [60], is the slope angle of the segment, is the velocity at the beginning of the segment, is the length of the segment, and the acceleration due to gravity. All the mentioned computational processes are embedded in the Flow-R software.
For snow avalanche propagation, the parameters are set as follows: a model with friction parameter mu = 0.3 and mass-to-drag ratio m/d = 2500; Holmgren modified direction algorithm with exponent x = 4 and height modification dh = 0.5, 1, 3, and 5 m. Persistence algorithm with default weights were used [54,60].
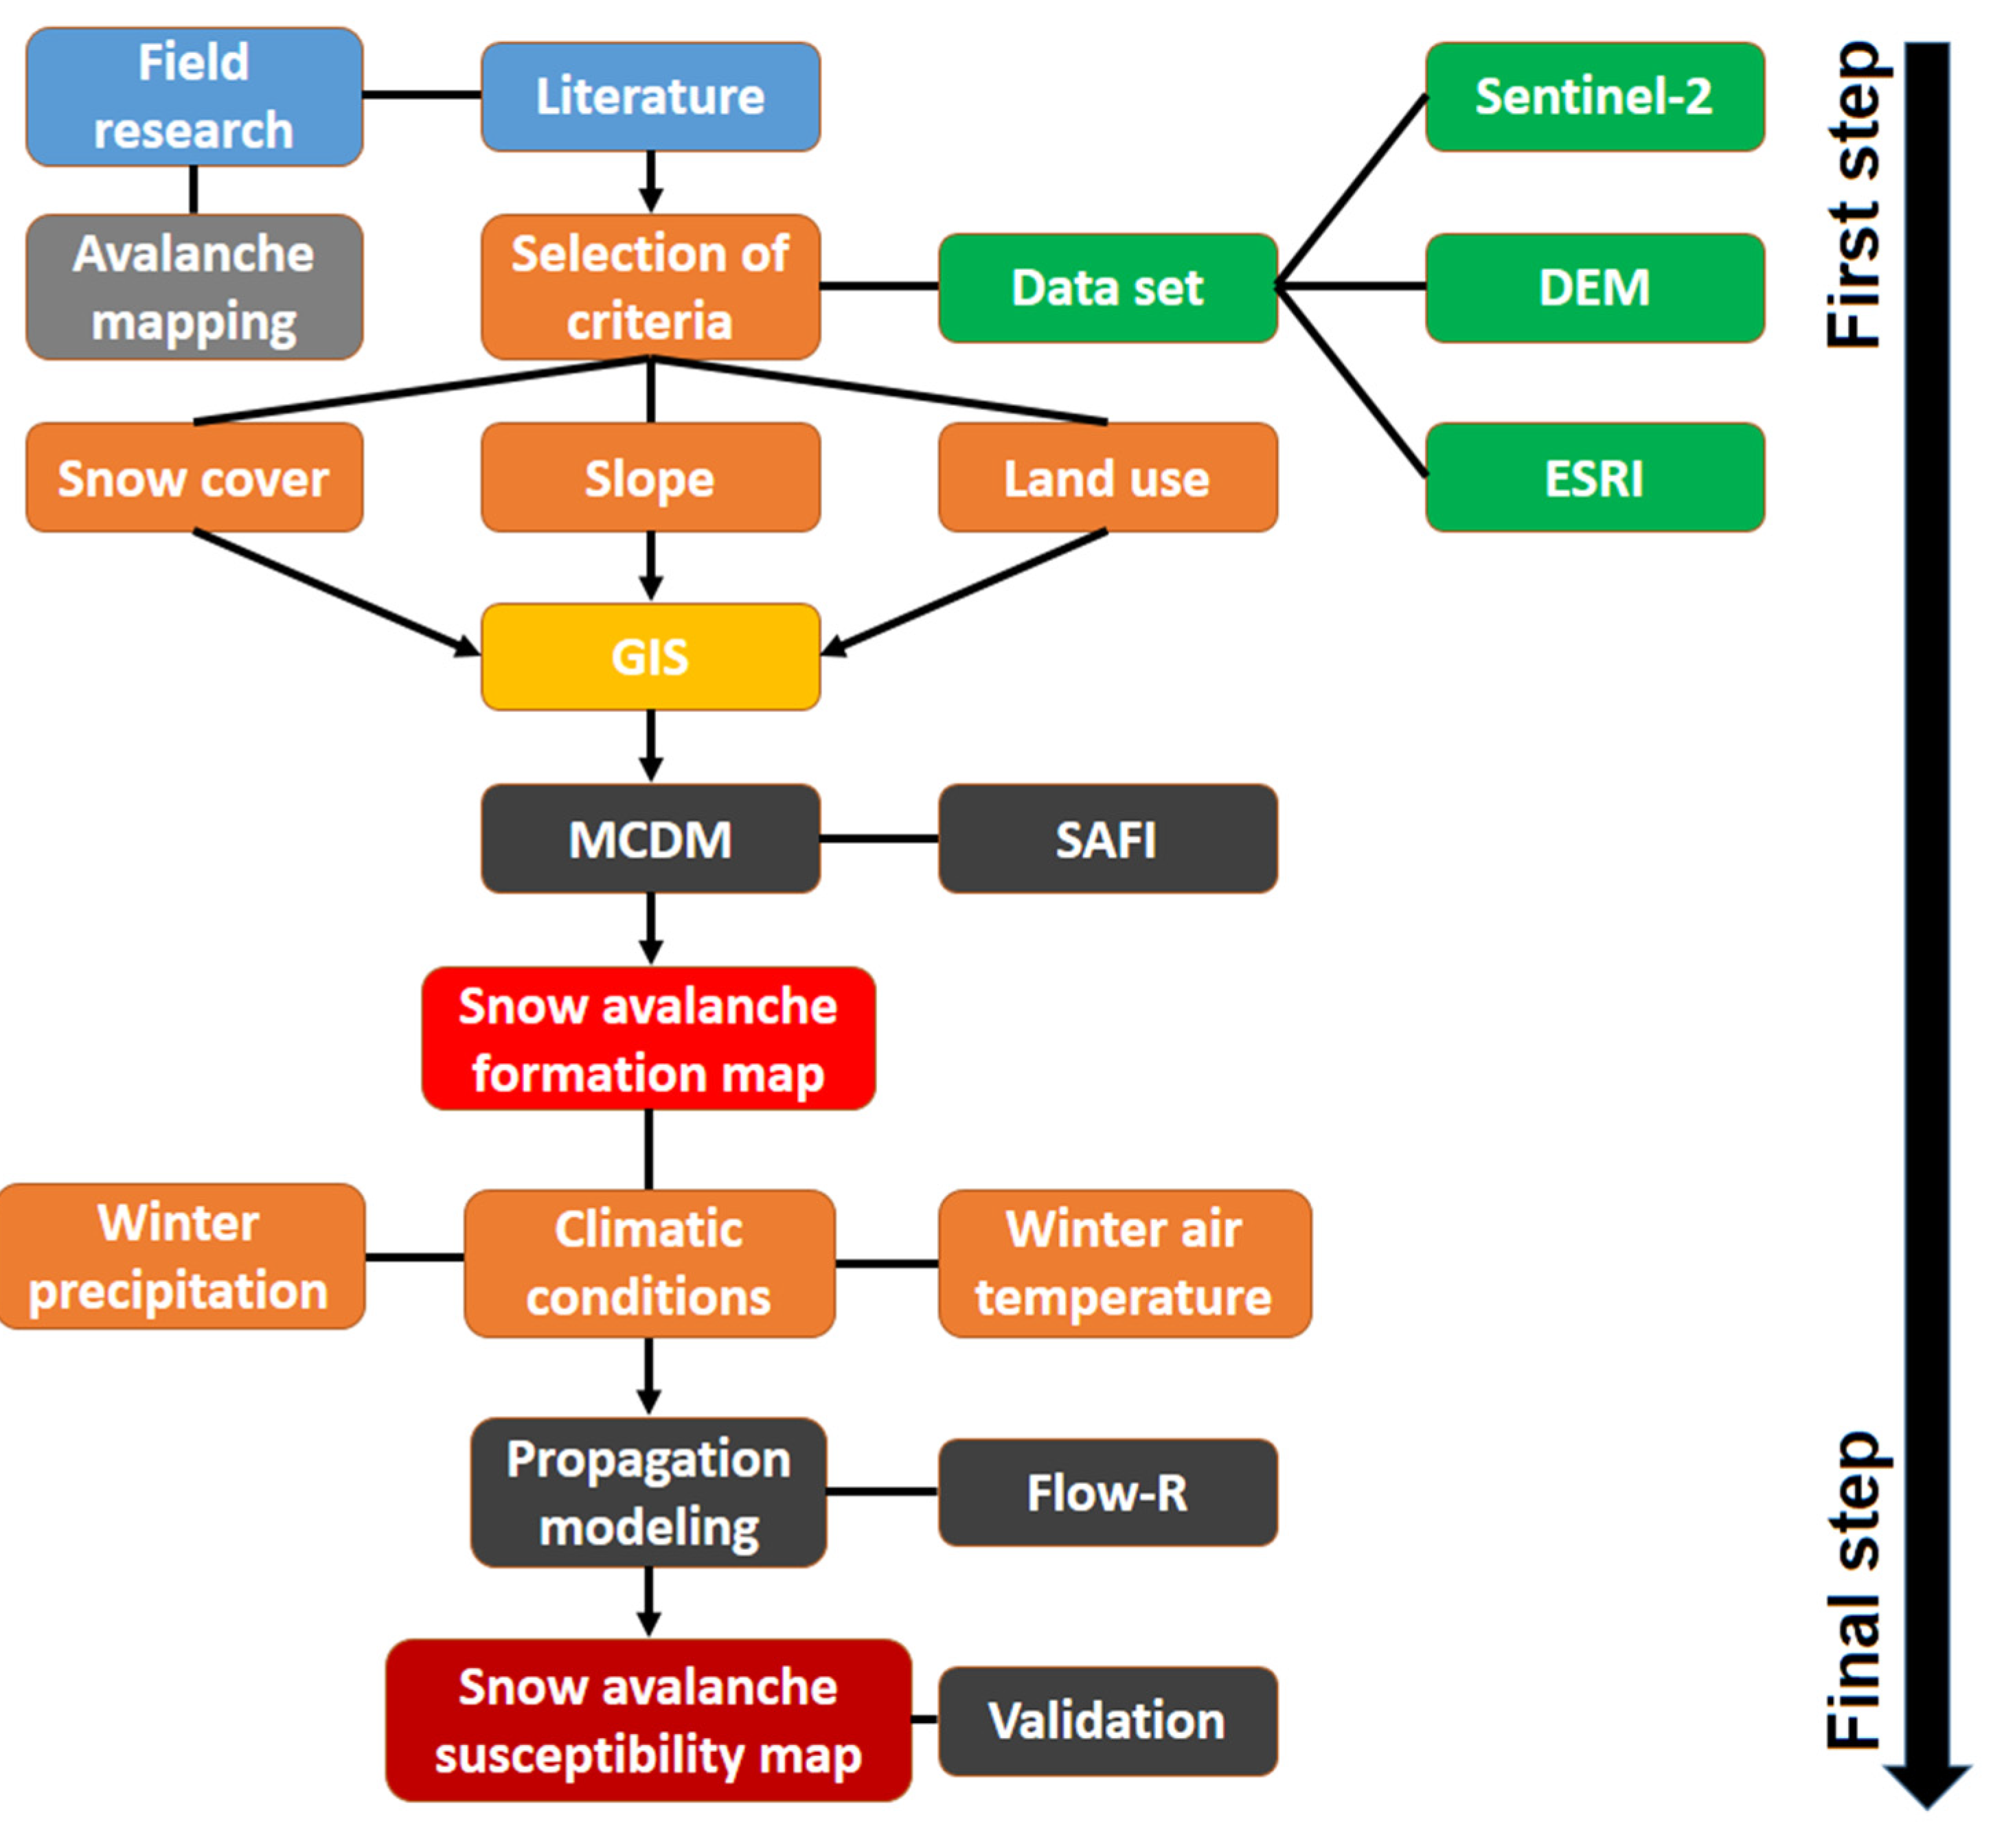
All procedures and approaches used for the purpose of this research are presented in the flow chart (Figure 8).
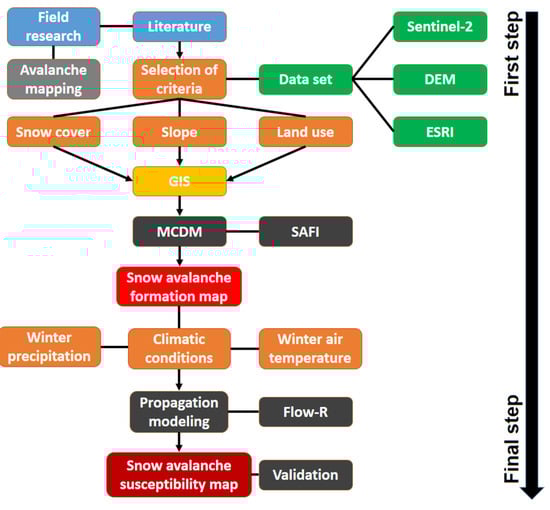
Figure 8.
Flow chart with all the procedures and methods used in this research.
3. Results
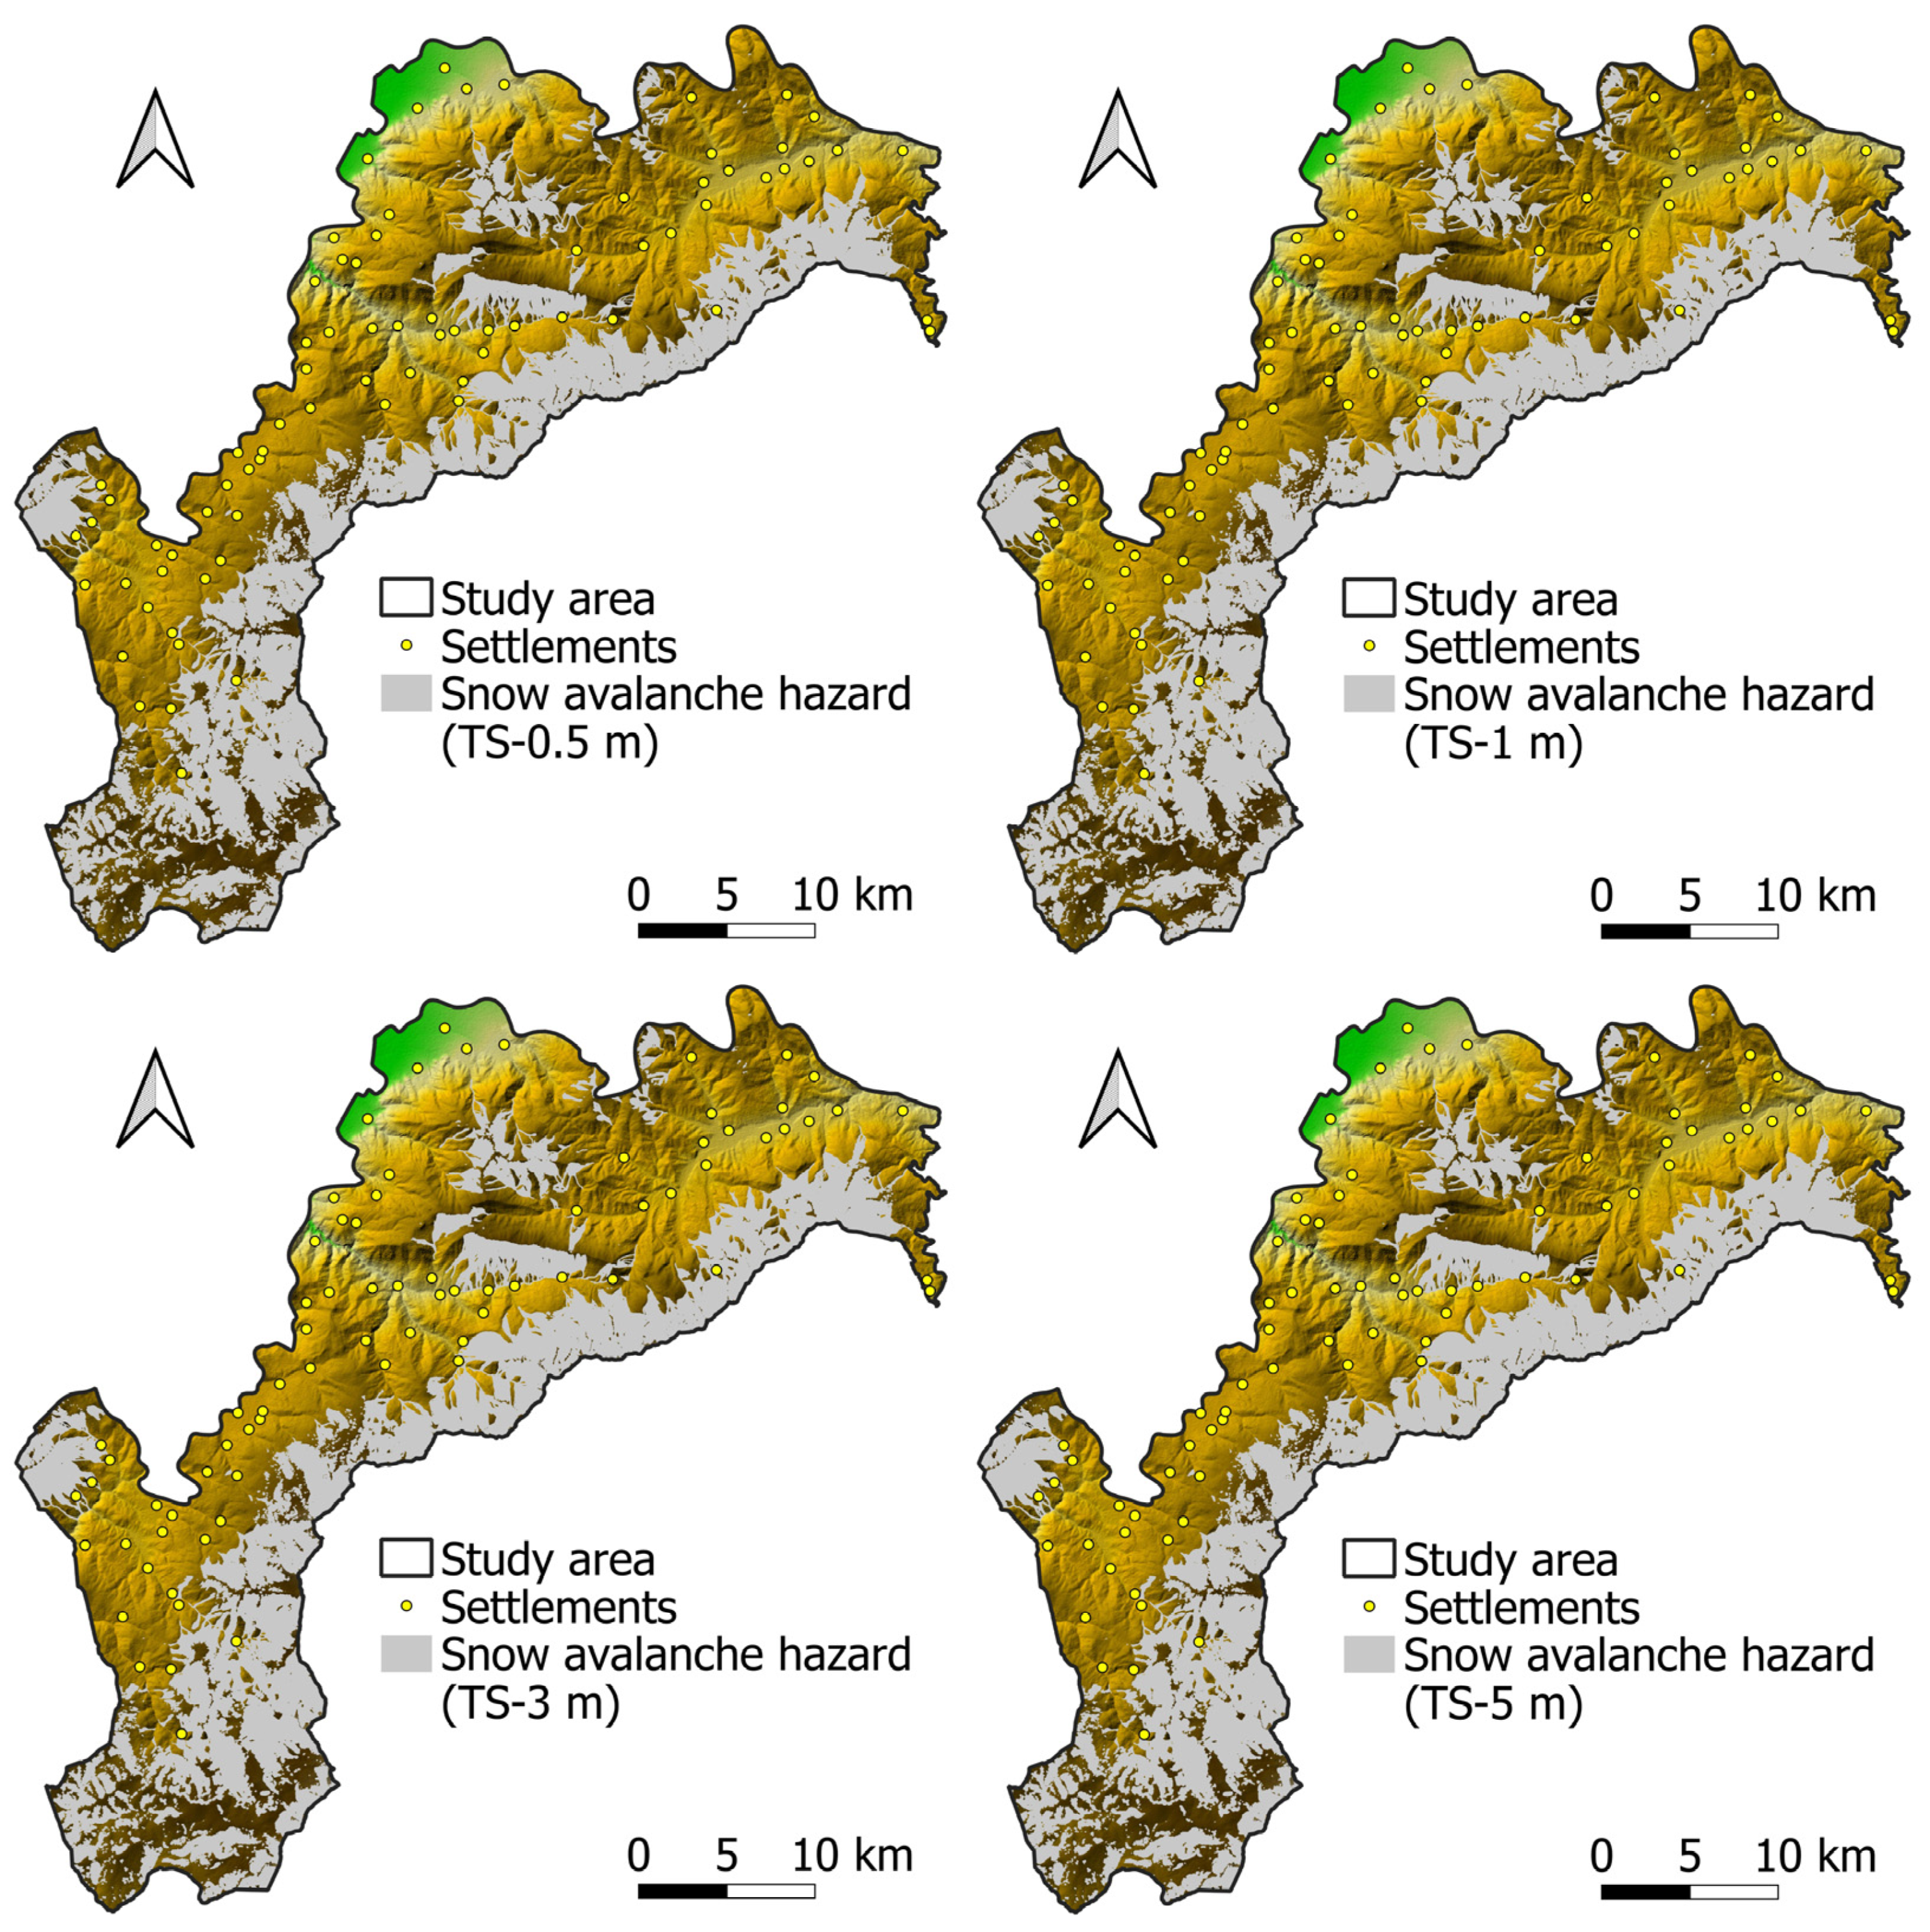
By processing natural conditions (snowpack, terrain slope, and land use) in GIS and propagating the SAFI results in Flow-R software, maps of the spatial vulnerability of the Šar Mountains to snow avalanches were obtained. For the study area, four scenarios were designed: snow avalanches with a thickness of 0.5 m, 1 m, 3 m, and 5 m (Figure 9). In the Flow-R software, numerical values are individually assigned to each of the four scenarios in the direction algorithm section. Then, the final results are obtained, i.e., propagation (distribution) maps of snow avalanche hazard.
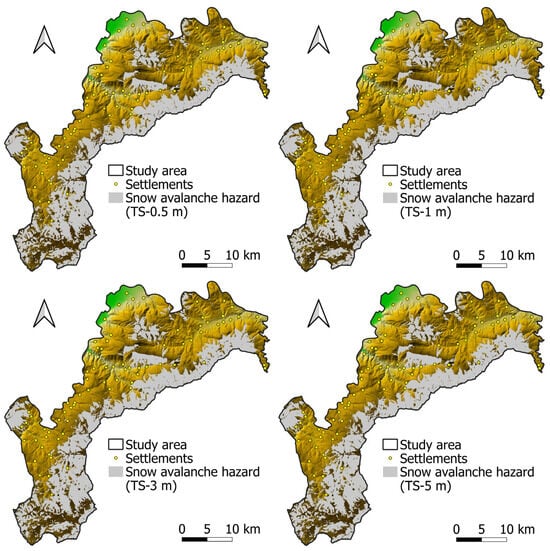
Figure 9.
The SAFI–Flow-R geospatial modeling of snow avalanches (thickness of triggered snow 0.5 m, 1 m, 3 m and 5 m).
The area of susceptible terrain varies from the thickness of the potentially triggered snow (TS), so it ranges from 282.9 km2 (with a layer of 0.5 m thickness) to 299.9 km2 (with a layer of 5 m thickness) (Table 3). The results indicate a regional representation of vulnerability related to simple events because snow thickness and its stability vary spatially and temporally at the local level.
Table 3.
Snow avalanche hazard, spatial susceptibility.
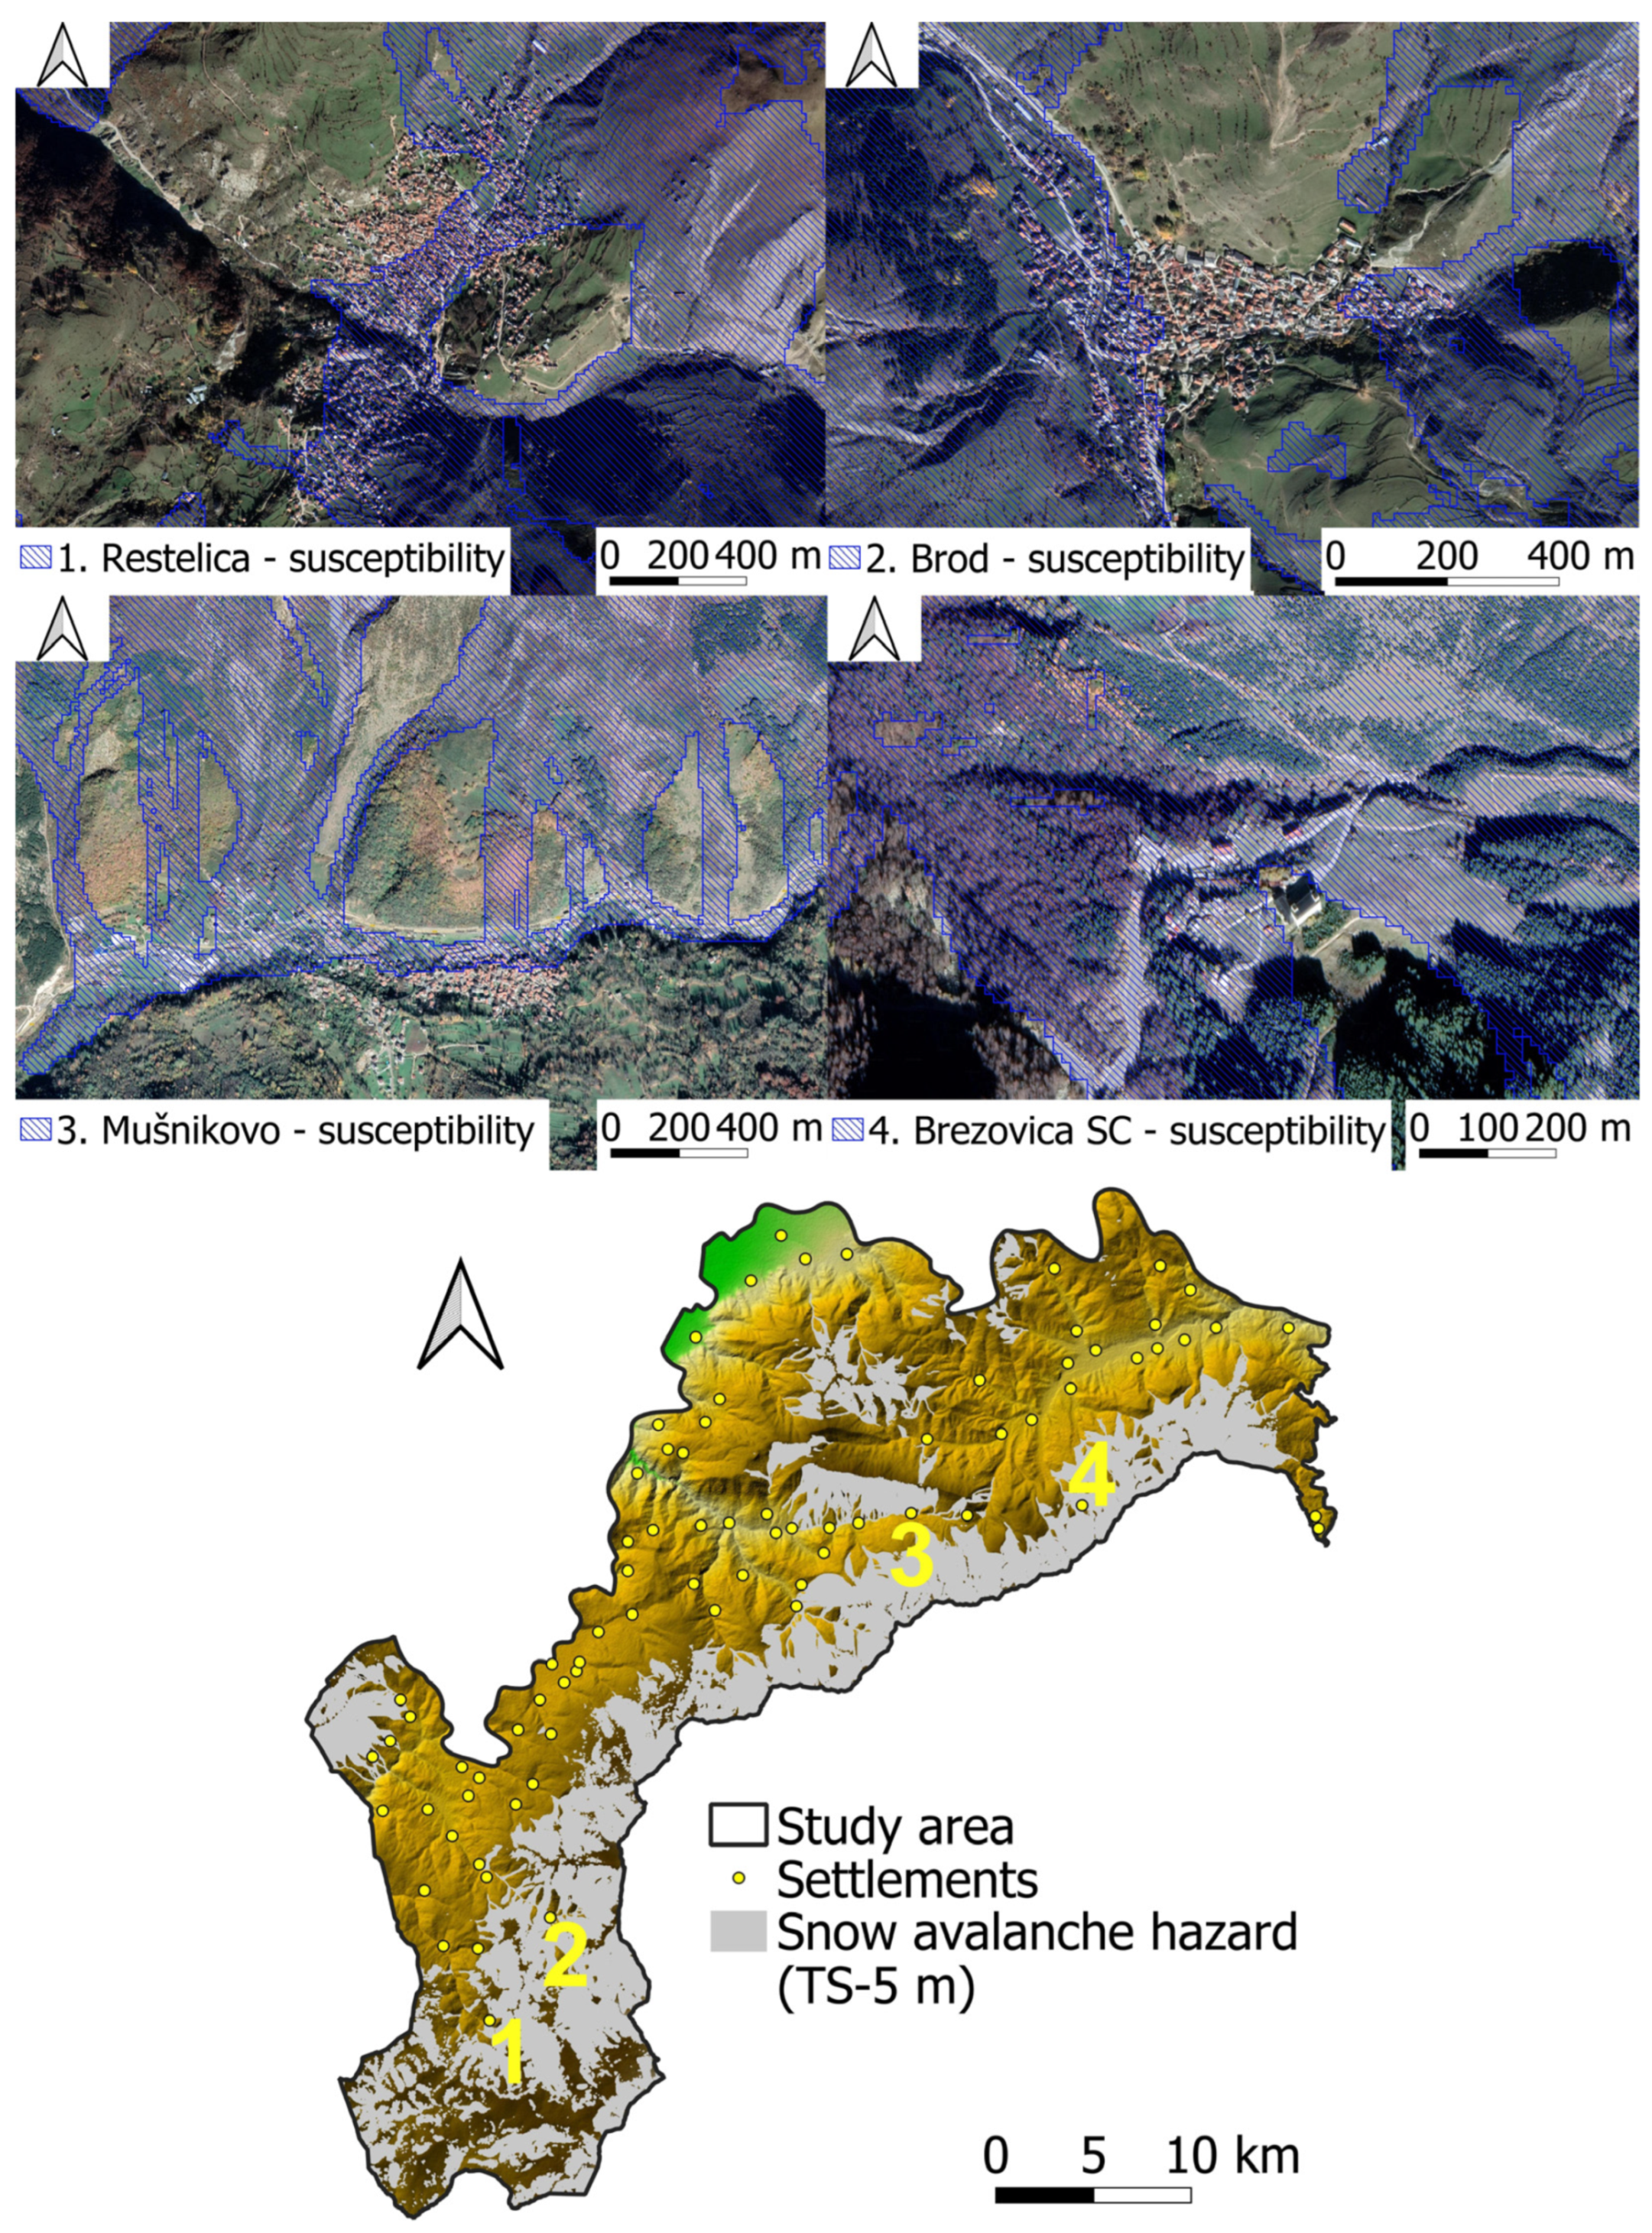
By visual analysis of the results and their processing in GIS, settlements that were entirely or partially susceptible to snow avalanches were identified: Restelica, Brod, Mušnikovo, and the ski center Brezovica. A slope between 20–60°, the retention of a large amount of snow during winter, and the low vegetation characterize vulnerable areas.
Restelica is the southernmost settlement in Serbia and has long been known for snow avalanches. In February 2012, a snow avalanche killed ten people and buried 11 houses in the southwestern part of the settlement [17]. The results of the study match the location of the avalanche. Another vulnerable settlement is Brod, which is located close to Restelica. The western part of the settlement is characterized by ravines and bare land with a greater slope. Special attention should be directed to the ski center south of Brod, where the hotel complex is susceptible to avalanche flow. The third vulnerable settlement is Mušnikovo, located at the foot of Mountain Ošljak (2212 m). A high terrain slope and sparse vegetation characterize the southern part of Ošljak. Therefore, the snow deposition zone in the event of a major avalanche would damage the houses in the northern part of Mušnikovo and the regional road Uroševac-Prizren.
The fourth susceptible settlement is the ski center of Brezovica (Figure 10). Due to the large number of tourists who often ski outside the marked trails, slab avalanches kill many individuals every year.
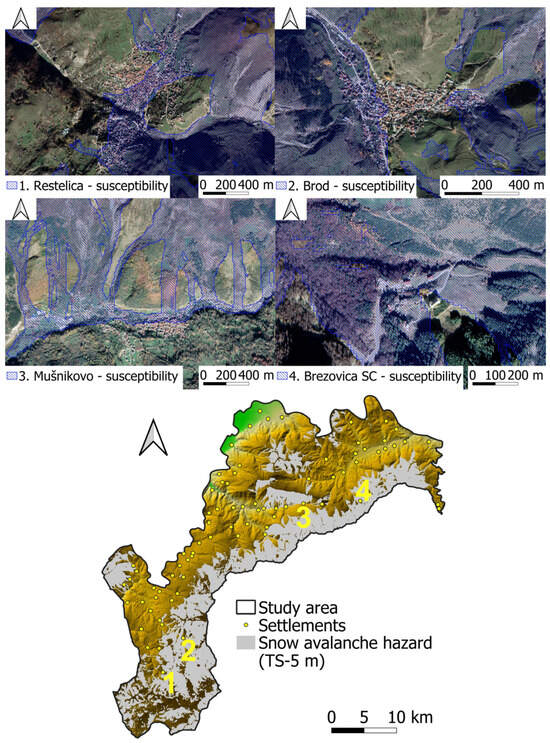
Figure 10.
Settlements that are susceptible by snow avalanches.
If the results of previous (two) studies for the Šar Mountains are compared, significant differences can be observed. When the Best-Worst method (BWM) was used, nine criteria with different weight coefficients were used. The synthetic map indicated that the following areas are susceptible: the settlements of Restelica, Kruševo, Prevalac, and the ski center of Brezovica [17]. Later, field research determined that Prevalac and Kruševo are not vulnerable areas. The second study used the AHP method with 14 natural and anthropogenic criteria for the same study area. The results showed that as many as 15 settlements are medium or highly susceptible to snow avalanches: Leštane, Globočica, Kruševo, Zlipotok, Restelica, Brod, Radeša, Plajnik, Zrze, Kukovce, Brodosavce, Stružje, Nebregošte, Prevalac, and Brezovica ski center [16]. When applying exclusively MCDM and criteria evaluation, it is possible to determine the starting zone of the avalanche. However, the zone of transition and run-out remains to be discovered due to the impossibility of simulation of propagation.
4. Discussion
Many studies worldwide today use a large number of readily available data and criteria to model avalanches. A large number of used criteria does not mean more accurate final results. It is necessary to eliminate all secondary criteria and those whose importance has yet to be sufficiently investigated. Secondary criteria can include characteristics: lithology, aspect, curvature, air temperature, and distance from rivers. The criteria that are used more and more frequently because they are processed in GIS and their significance for avalanche modeling has not been investigated in detail are: wind exposition index (WEI), terrain roughness index (TRI), topographic wetness index (TWI), length-slope factor (LS), relative slope position (RSP), etc.
Observed in different regions, Varol [31] uses five criteria to determine the vulnerability of the Uzungol area (Turkey) to snow avalanches. With the AHP method, the slope of the terrain was given the greatest importance, whereas the vegetation density was assigned the least. The results are classified into five vulnerability classes: very low, low, moderate, high, and very high. Bühler et al. [61] apply automated potential release area (PRA) detection to identify vulnerable areas by analyzing DEM factors: slope angle, aspect, curvature, roughness, and fold. Like SAFI, PRA binary classifies the presence/absence of forest cover. Limitations of PRA methods are reflected in applying exclusively morphometric conditions without including climatic conditions. Rafique et al. [10] modeled the northern part of Pakistan with snow avalanches using the AHP method. In this case, six criteria were used, where an enormously small weighting (3%) was assigned to land use. The results are classified into four susceptibility classes: very low, low, high, and very high. Both studies favor convex sides of the curvature and northern exposures.
On the other hand, Vontobel et al. (2013) stated that avalanches are most often activated on the concave sides of the relief because on concave slopes, the snow stays longer [62,63]. Regarding exposures, there are also contradictions in the studies. A large number of studies initially determined the northern aspect as the most vulnerable, although gliding, ice, and wet slab avalanches often occur on southern exposures [13]. Because of these differences, it is necessary to look at avalanches as a whole, i.e., to include all types of avalanches in the analysis.
Machine learning has been one of the most widely applied methods for predicting natural hazards for years. In snow avalanche modeling, Bian et al. [4] combine statistical methods and machine learning models (EBF-LR, CF-LR, EBF-MLP, CF-MLP) for Shaluli Mountain (China). In the study, 14 criteria were used, and the final results were classified as follows: very low, low, medium, high, and very high. Choubin et al. [22] also use machine learning models (SVM and MDA) for avalanche prediction in the Karaj watershed (Iran). Fourteen criteria were processed, and the results were classified into three classes: low, moderate, and high. None of these studies report what types of avalanches were identified in the field, although snow avalanche inventories exist. In addition, applying machine learning models and numerous statistical methods is practically impossible in mountainous areas with no historical data or mapped avalanches. Most studies in the literature review classify vulnerability into four or five classes (very low, low, medium, high, and very high). This represents a major challenge for decision-makers and mountain rescue services when zoning moderately and poorly susceptible areas. Very little is discussed about these classes, and there is a possibility that there will be a transition and accumulation of avalanches on these terrains under the influence of specific meteorological conditions.
Therefore, the SAFI–Flow-R approach was developed in this study. The first method (SAFI) is intended to identify the terrain where all types of avalanches can be triggered.
The NDSI index shows the same snow cover values regardless of meteorological conditions and snowpack characteristics in different regions [42]. The advantage of the NDSI index is that the values are clearly different when the snow is present inside the forest (<0.1) and on bare slopes or grasslands. Also, NDSI can be used to determine terrains safe from avalanches. Locations with an NDSI value of less than 0.4 in the study are not susceptible to retaining a larger amount of snow [42]. In addition to the snow cover interval, a wide terrain slope interval (20–60°) was used. The width of the slope interval is large enough to be applied in different mountain regions. In this case, the interval proved to be successful on the example of the Rocky Mountains and the Šar Mountains. Pastures and meadows are the most common surfaces for creating an ava-lanche, which has been confirmed by field research. Determining the land use and their analysis with final results can contribute to adequate land use planning for banning the construction of buildings or agricultural activities in susceptible areas. The mountain rescue service will use synthetic maps to better zone susceptible areas around the Brezovica ski center and other settlements. Meteorological factors, such as winter precipitation and air temperature, give adequate insight into the potential for snowfall and snow cover accumulation.
Another method, Flow-R, was applied to avalanche propagation (transition and deposition zone) to model the complete anatomy of a snow avalanche. The final results clearly show the susceptible slopes and the territory that is not susceptible.
The main advantages of the SAFI–Flow-R approach can be mentioned:
- −
- Universality of the model. Due to the application of only the main natural conditions, avalanche modeling SAFI–Flow-R approach enables spatial modeling of avalanches in different mountain regions around the world (Šar Mountains, Alps, Andes, Himalayas, Rocky Mountains, Caucasus, etc.);
- −
- Identification of vulnerable areas at the regional level. In a relatively short period, results on the propagation of avalanches can be obtained for territories with an area of more than 1000 km2;
- −
- Compact modeling of snow avalanches from the starting zone to the run-out zone;
- −
- Avalanche spatial modeling is possible with or without a snow avalanche inventory. Unlike many statistical methods and machine learning models, SAFI–Flow-R can offer relevant results without historical data, which significantly facilitates the work of researchers in parts of mountain regions where there is no avalanche inventory;
- −
- Simple application and data processing. All data (snow cover, terrain slope, and land use) are open data that can be processed using GIS tools and processing of satellite images.
Like every model, the Flow-R also has certain limitations. Due to the concept of a non-hydraulic model, the potential of Flow-R in modeling single snow avalanches is limited. With the Flow-R software, it is possible to determine the propagation of a snow avalanche, but due to the model’s inability to account for avalanche mass, the calculations of process velocity (m/s) and energy (J/kg) should be considered indicative [57]. Due to the compulsory non-volumetric definition of magnitudes, the modeling results are biased for different flow strengths [58]. If the modeling is reduced from the regional scale to the local level, it is necessary to combine Flow-R with 2-D hydraulic models (RAMMS or FLO-2D). However, the numerical simulation models differ greatly in terms of velocities. The maximum differences between the RAMMS and FLO-2D models for the two avalanches investigated in Italy are 31–36 m/s [35]. Any modeling requires high-resolution data. In Slovenia, researchers have determined the distribution of snow avalanches using very precise DEM data (0.5 m), a multi-criteria analysis and the North Atlantic Oscillation [64,65,66,67].
Using the Šar Mountains as an example, the final results are at a spatial resolution of 12.5 m. In some studies, data from a passive microwave radiometer (PMW) were used to measure snow depth. Singh et al. (2024) determined snow depth in the western Hima layas using PMW sensors [68]. However, this method has two primary limitations. First, the spatial resolution of the images is very coarse (500 × 500 m in this case), which significantly generalizes the actual snow depth. Under the influence of wind and other meteorological and geomorphological factors, snow depth varies greatly over distances of several meters, so this approach does not provide reliable data. Another limitation is that PMW products are unreliable when the snow depth exceeds one meter [69]. This is a significant limitation considering that snow avalanches usually occur when the snow depth exceeds one meter [16]. For these reasons, the NDSI based on Sentinel-2 scenes was used. It shows significant differences in values between areas with greater snow depth (ravines without vegetation), snow in forests and areas without snow at high resolution (12.5 m) [17].
Future research should use very high-resolution data obtained by imaging the area with a drone and remote sensing (e.g., Light Detection and Ranging—LiDAR). Under such conditions, digital terrain models can be created with a spatial resolution of less than 1 m, which enables much more precise results and a much longer period of time for their processing. However, such methods require significant financial support, making open data the first and often only option for researchers in developing countries.
5. Validation of Model
Numerous approaches based on proportions, statistical criteria, etc., validate results and assess accuracy. The ROC (receiver operating characteristic)-AUC (area under the curve) approach is a widely used statistical method used in this study to determine the predictive ability of the SAFI–Flow-R model. The ROC curve is a graph that is generated from the true positive value (sensitivity) on the X-axis and the false positive on the Y-axis at different thresholds (or cut-off points) [33]. With increasing sensitivity, there is also an increase in false positive results. Anywhere on the curve, the ROC curve compares the true positive and false positive values of the (1– characteristic), while the AUC shows the overall accuracy of the model’s performance [70,71,72]
The ROC-AUC measures the classifier’s ability to distinguish between positive and negative examples and ranges from 0 to 1, with a value of 1 indicating a perfect classifier, while a value less than 0.5 indicates a random acceptance [36,45]. The AUC value obtained in this study is 0.94, so the validation results showed that the prediction accuracy is 94%, within acceptable limits (Figure 11). Validation was done by analyzing the final results (synthetic maps) with previously mapped avalanches (53) in geographic information systems. Due to the difficulty of identifying the thickness of the triggered snow and climate extremes, several scenarios must be modeled to obtain a complete picture of the susceptibility (from 0.5 to 5 m) [73].
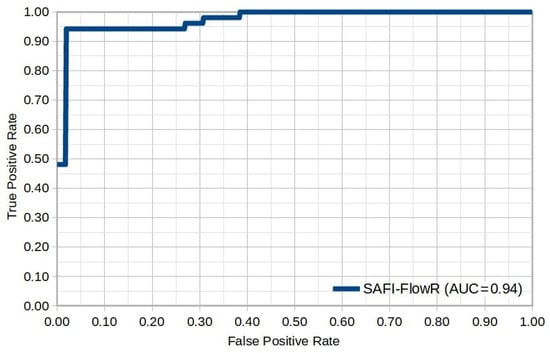
Figure 11.
Validation of Snow Avalanche Modeling using ROC-AUC.
6. Conclusions
Research into snow avalanches in high mountain regions is increasingly becoming the focus of researchers due to the threat to the environment. Regions whose economy is based on winter tourism in the mountains, such as the Šar Mountains, are particularly important. The first step towards effective disaster management is to susceptible areas at risk in order to prevent and mitigate avalanche damage. The most important natural conditions for triggering snow avalanches were analyzed: snow cover, terrain slope and land use, with a spatial resolution of the cells of 12.5 m. During the field research, 53 avalanches with different characteristics were identified and mapped: dry snow slab, wet snow slab, loose snow and gliding.
In this study, open data, GIS and remote sensing were used to create maps of the susceptibility of the Šar Mountains in relation to snow depth. A universal index was developed based on a combination of two methods: SAFI and Flow-R. SAFI was used to determine locations where avalanches can be triggered (trigger areas), while the Flow-R software is intended for the propagation, i.e., the simulation of the track and deposition of the avalanche flow. Input data such as NDSI, terrain slope and land use were used to calculate the SAFI index. The relationship between climatic conditions (winter precipitation and winter air temperature) and the locations classified as avalanches-prone was then analyzed. Although an inventory of avalanches was obtained from field surveys in this study, the SAFI–Flow-R approach can also model avalanches without an inventory or historical data. Using the Šar Mountains as an example, the settlements susceptible to potential avalanche triggering were identified at a snow depth of 0.5 m: Restelica, Mušnikovo, Brod and the Brezovica ski center. The areas at risk with a snow depth of 0.5 m are 282.9 km2 in size, while 299.9 km2 are potentially at risk from avalanches with a depth of 5 m. In these settlements, one of the main tasks is to install meteorological stations to monitor climatic elements, especially snowfall (frequency and intensity) and wind (direction and speed). Depending on the type of precipitation (rain or snow), monitoring the change in the microstructural accumulation of snow must also be monitored. Such an analysis would help to adequately identify persistent weak layers.
The validation of the results is based on the ROC-AUC approach, where a predictive power of the model of 94% was found. Due to the small number of essential and unchanging criteria in all parts of the world, the universal index is available for broad application. By combining GIS, remote sensing and Flow-R approaches, maps can be produced that serve as a basis for predicting avalanche hazard in many high mountain regions. Avalanche hazard maps are an elementary basis for the adoption of environmental protection measures: afforestation of bare and steep areas, artificial triggering of avalanches, prohibition of construction in endangered areas, installation of snow nets, snow fences, etc. At the local level, it is necessary to integrate adaptation and mitigation strategies as well as scientific literature on the vulnerability of the terrain to snow avalanches. The results of the study form the starting point for the development of a strategy to reduce the risk of avalanches. Decision-makers, civil protection, mountain rescue services and national park staff should coordinate all activities related to avalanche forecasting and protection measures. Snow avalanches are a complex natural phenomenon that requires multidisciplinarity on a scientific, technical and administrative level.
Author Contributions
Conceptualization, Uroš Durlević; software, Jelka Krušić and Uroš Durlević; validation, Aleksandar Valjarević; formal analysis, Ivan Novković; investigation, Filip Vujović and Uroš Durlević; resources, Milan Radojković and Sudhir Kumar Singh; data curation, Marko Ivanović and Tatjana Djekić; writing—original draft preparation, Uroš Durlević; writing—review and editing, Ivan Novković; Aleksandar Valjarević and Blaž Komac; visualization, Uroš Durlević and Nemanja Josifov; supervision, Filip Vujović and Goran Jović; project administration, Uroš Durlević and Blaž Komac. All authors have read and agreed to the published version of the manuscript.
Funding
The study was funded by the Ministry of Science, Technological Development and Innovation of the Republic of Serbia (Contract number 451/03/65/2024–03/200091).
Data Availability Statement
To obtain the data for this study, please contact the authors via email.
Acknowledgments
Blaž Komac acknowledges the financial support from the Slovenian Research Agency (P6-0101). We are grateful to the members of the Mountain Rescue Service on the Šar Mountains for their support and assistance in conducting field research in the period 2023–2024. The authors are grateful to the anonymous reviewers whose comments and suggestions greatly improved the manuscript.
Conflicts of Interest
The authors declare no conflict of interest.
References
- Hao, J.; Mind’je, R.; Liu, Y.; Huang, F.; Zhou, H.; Li, L. Characteristics and hazards of different snow avalanche types in a continental snow climate region in the Central Tianshan Mountains. J. Arid Land 2021, 13, 317–331. [Google Scholar] [CrossRef]
- Wen, H.; Wu, X.; Liao, X.; Wang, D.; Huang, K.; Wünnemann, B. Application of machine learning methods for snow avalanche susceptibility mapping in the Parlung Tsangpo catchment, southeastern Qinghai-Tibet Plateau. Cold Reg. Sci. Technol. 2022, 198, 103535. [Google Scholar] [CrossRef]
- Favier, P.; Eckert, N.; Faug, T.; Bertrand, D.; Ousset, I.; Candia, G.; Llera, J.C.D.L. A framework to account for structural damage, functional efficiency and reparation costs within the optimal design of countermeasures: Application to snow avalanche risk mitigation. Cold Reg. Sci. Technol. 2022, 199, 103559. [Google Scholar] [CrossRef]
- Bian, R.; Huang, K.; Liao, X.; Ling, S.; Wen, H.; Wu, X. Snow avalanche susceptibility assessment based on ensemble machine learning model in the central Shaluli Mountain. Front. Earth Sci. 2022, 10, 880711. [Google Scholar] [CrossRef]
- Valero, C.V.; Wever, N.; Bühler, Y.; Stoffel, L.; Margreth, S.; Bartelt, P. Modelling wet snow avalanche runout to assess road safety at a high-altitude mine in the central Andes. Nat. Hazards Earth Syst. Sci. 2016, 16, 2303–2323. [Google Scholar] [CrossRef]
- McClung, D.M. Avalanche character and fatalities in the high mountains of Asia. Ann. Glaciol. 2016, 57, 114–118. [Google Scholar] [CrossRef]
- Kumar, S.; Srivastava, K.P.; Snehmani; Bhatiya, S. Geospatial probabilistic modelling for release area mapping of snow avalanches. Cold Reg. Sci. Technol. 2019, 165, 102813. [Google Scholar] [CrossRef]
- Yang, J.; Li, C.; Li, L.; Ding, J.; Zhang, R.; Han, T.; Liu, Y. Automatic Detection of Regional Snow Avalanches with Scattering and Interference of C-band SAR Data. Remote Sens. 2020, 12, 2781. [Google Scholar] [CrossRef]
- European Avalanche Warning Services [EAWS]. Fatalities. Available online: https://www.avalanches.org/fatalities/ (accessed on 16 March 2024).
- Rafique, A.; Dasti, M.Y.S.; Ullah, B.; Awwad, F.A.; Ismail, E.A.A.; Saqib, Z.A. Snow Avalanche Hazard Mapping Using a GIS-Based AHP Approach: A Case of Glaciers in Northern Pakistan from 2012 to 2022. Remote Sens. 2023, 15, 5375. [Google Scholar] [CrossRef]
- Germain, D.; Filion, L.; Hétu, B. Snow avalanche regime and climatic conditions in the Chic-Choc Range, eastern Canada. Clim. Chang. 2009, 92, 141–167. [Google Scholar] [CrossRef]
- Bair, E.H.; Rittger, K.; Ahmad, J.A.; Chabot, D. Comparison of modeled snow properties in Afghanistan, Pakistan, and Tajikistan. Cryosphere 2020, 14, 331–347. [Google Scholar] [CrossRef]
- Tremper, B. Staying Alive in Avalanche Terrain, 3rd ed.; Mountaineers Books: Seattle, WA, USA, 2018; pp. 1–352. [Google Scholar]
- Bulajić, Ð.B.; Bajić, S.; Stojnić, N. The effects of geological surroundings on earthquake-induced snow avalanche prone areas in the Kopaonik region. Cold Reg. Sci. Technol. 2018, 149, 29–45. [Google Scholar] [CrossRef]
- Durlević, U.; Novković, I.; Lukić, T.; Valjarević, A.; Samardžić, I.; Krstić, F.; Batoćanin, N.; Mijatov, M.; Ćurić, V. Multihazard susceptibility assessment: A case study – Municipality of Štrpce (Southern Serbia). Open Geosci. 2021, 13, 1414–1431. [Google Scholar] [CrossRef]
- Durlević, U.; Valjarević, A.; Novković, I.; Ćurčić, N.B.; Smiljić, M.; Morar, C.; Stoica, A.; Barišić, D.; Lukić, T. GIS-Based Spatial Modeling of Snow Avalanches Using Analytic Hierarchy Process. A Case Study of the Šar Mountains, Serbia. Atmosphere 2022, 13, 1229. [Google Scholar] [CrossRef]
- Durlević, U.; Novković, I.; Bajić, S.; Milinčić, M.; Valjarević, A.; Čegar, N.; Lukić, T. Snow Avalanche Hazard Prediction Using the Best-Worst Method—Case Study: The Šar Mountains, Serbia. In Advances in Best-Worst Method; Rezaei, J., Brunelli, M., Mohammadi, M., Eds.; Springer: Cham, Switzerland, 2023; pp. 211–216. [Google Scholar] [CrossRef]
- Simenhois, R.; Birkeland, K. The Extended Column Test: Test effectiveness, spatial variability, and comparison with the Propagation Saw Test. Cold Reg. Sci. Technol. 2009, 59, 210–216. [Google Scholar] [CrossRef]
- Veitinger, J.; Purves, S.R.; Sovilla, B. Potential slab avalanche release area identification from estimated winter terrain: A multi-scale, fuzzy logic approach. Nat. Hazards Earth Syst. Sci. 2016, 16, 2211–2225. [Google Scholar] [CrossRef]
- Nasery, S.; Kalkan, K. Snow avalanche risk mapping using GIS-based multi-criteria decision analysis: The case of Van, Turkey. Arab. J. Geosci. 2021, 14, 782. [Google Scholar] [CrossRef]
- Akay, H. Spatial modeling of snow avalanche susceptibility using hybrid and ensemble machine learning techniques. Catena 2021, 206, 105524. [Google Scholar] [CrossRef]
- Choubin, B.; Borji, M.; Mosavi, A.; Hosseini, S.F.; Singh, P.V.; Shamshirband, S. Snow avalanche hazard prediction using machine learning methods. J. Hydrol. 2019, 577, 123929. [Google Scholar] [CrossRef]
- Konurhan, Z.; Yücesan, M.; Gul, M. Avalanche Risk Analysis by a Combined Geographic Information System and Bayesian Best-Worst Method. In Advances in Best-Worst Method; Rezaei, J., Brunelli, M., Mohammadi, M., Eds.; Springer: Cham, Switzerland, 2023; pp. 193–210. [Google Scholar] [CrossRef]
- Srejić, T.; Manojlović, S.; Sibinović, M.; Bajat, B.; Novković, I.; Milošević, M.V.; Carević, I.; Todosijević, M.; Sedlak, M.G. Agricultural Land Use Changes as a Driving Force of Soil Erosion in the Velika Morava River Basin, Serbia. Agriculture 2023, 13, 778. [Google Scholar] [CrossRef]
- Novkovic, I.; Markovic, G.B.; Lukic, D.; Dragicevic, S.; Milosevic, M.; Djurdjic, S.; Samardzic, I.; Lezaic, T.; Tadic, M. GIS-Based Forest Fire Susceptibility Zonation with IoT Sensor Network Support, Case Study—Nature Park Golija, Serbia. Sensors 2021, 21, 6520. [Google Scholar] [CrossRef] [PubMed]
- Micić Ponjiger, T.; Lukić, T.; Wilby, R.L.; Marković, S.B.; Valjarević, A.; Dragićević, S.; Gavrilov, M.B.; Ponjiger, I.; Durlević, U.; Milanović, M.M.; et al. Evaluation of Rainfall Erosivity in the Western Balkans by Mapping and Clustering ERA5 Reanalysis Data. Atmosphere 2023, 14, 104. [Google Scholar] [CrossRef]
- Durlević, U. Assessment of torrential flood and landslide susceptibility of terrain: Case study—Mlava River Basin (Serbia). Bull. Serb. Geogr. Soc. 2021, 101, 49–75. [Google Scholar] [CrossRef]
- Valjarević, A.; Morar, C.; Živković, J.; Niemets, L.; Kićović, D.; Golijanin, J.; Gocić, M.; Bursać, N.M.; Stričević, L.; Žiberna, I.; et al. Long Term Monitoring and Connection between Topography and Cloud Cover Distribution in Serbia. Atmosphere 2021, 12, 964. [Google Scholar] [CrossRef]
- Durlević, U.; Novković, I.; Carević, I.; Valjarević, D.; Marjanović, A.; Batoćanin, N.; Krstić, F.; Stojanović, L.; Valjarević, A. Sanitary landfill site selection using GIS-based on a fuzzy multi-criteria evaluation technique: A case study of the City of Kraljevo, Serbia. Environ. Sci. Pollut. Res. 2023, 30, 37961–37980. [Google Scholar] [CrossRef]
- Kumar, S.; Snehmani; Srivastava, P.K.; Gore, A.; Singh, M.K. Fuzzy–frequency ratio model for avalanche susceptibility mapping. Int. J. Digit. Earth 2016, 9, 1168–1184. [Google Scholar] [CrossRef]
- Varol, N. Avalanche susceptibility mapping with the use of frequency ratio, fuzzy and classical analytical hierarchy process for Uzungol area, Turkey. Cold Reg. Sci. Technol. 2021, 194, 103439. [Google Scholar] [CrossRef]
- Iban, M.C.; Bilgilioglu, S.S. Snow avalanche susceptibility mapping using novel tree-based machine learning algorithms (XGBoost, NGBoost, and LightGBM) with eXplainable Artificial Intelligence (XAI) approach. Stoch. Environ. Res. Risk Assess. 2023, 37, 2243–2270. [Google Scholar] [CrossRef]
- Yariyan, P.; Avand, M.; Abbaspour, A.R.; Karami, M.; Tiefenbacher, P.J. GIS-based spatial modeling of snow avalanches using four novel ensemble models. Sci. Total Environ. 2020, 745, 141008. [Google Scholar] [CrossRef]
- Košová, V.; Molokáč, M.; Čech, V.; Jesenský, M. Avalanche Hazard Modelling within the Kráľova Hoľa Area in the Low Tatra Mountains in Slovakia. Land 2022, 11, 766. [Google Scholar] [CrossRef]
- Martini, M.; Baggio, T.; D’Agostino, V. Comparison of two 2-D numerical models for snow avalanche simulation. Sci. Total Environ. 2023, 896, 165221. [Google Scholar] [CrossRef] [PubMed]
- Kumar, S.; Srivastava, P.K.; Snehmani. Geospatial modelling and mapping of snow avalanche susceptibility. J. Indian Soc. Remote Sens. 2018, 46, 109–119. [Google Scholar] [CrossRef]
- Xi, N.; Mei, G. Avalanche Susceptibility Mapping by Investigating Spatiotemporal Characteristics of Snow Cover Based on Remote Sensing Imagery along the Pemo Highway—A Critical Transportation Road in Tibet, China. Water 2023, 15, 2743. [Google Scholar] [CrossRef]
- Ćurić, V.; Durlević, U.; Ristić, N.; Novković, I.; Čegar, N. GIS application in analysis of threat of forest fires and landslides in the Svrljiški Timok Basin (Serbia). Bull. Serb. Geogr. Soc. 2022, 102, 107–130. [Google Scholar] [CrossRef]
- Nikolić, G.; Vujović, F.; Golijanin, J.; Šiljeg, A.; Valjarević, A. Modelling of Wildfire Susceptibility in Different Climate Zones in Montenegro Using GIS-MCDA. Atmosphere 2023, 14, 929. [Google Scholar] [CrossRef]
- Hall, D.K.; Riggs, G.A.; Salomonson, V.V. Development of methods for mapping global snow cover using moderate resolution imaging spectroradiometer data. Remote Sens. Environ. 1995, 54, 127–140. [Google Scholar] [CrossRef]
- Copernicus Open Access Hub. Copernicus Data Space Ecosystem. Available online: https://dataspace.copernicus.eu/ (accessed on 29 February 2024).
- Stojković, S.; Marković, D.; Durlević, U. Snow Cover Estimation Using Sentinel-2 High Spatial Resolution Data. A Case Study: National Park Šar Planina (Serbia). In Advanced Technologies, Systems, and Applications VII; Ademović, N., Mujčić, E., Mulić, M., Kevrić, J., Akšamija, Z., Eds.; Springer: Cham, Switzerland, 2023; pp. 507–519. [Google Scholar] [CrossRef]
- Utah Geospatial Resource Center. Utah Avalanche Paths. Available online: https://gis.utah.gov/products/sgid/geoscience/avalanche-paths/ (accessed on 27 February 2024).
- QField Ecosystem Documentation. Available online: https://docs.qfield.org/get-started/ (accessed on 12 February 2024).
- Bhat, I.A.; Bhat, W.A.; Ashan, S.; Shafiq, M.U.; Ahmed, P. Snow avalanche susceptibility along Mughal Road, North-western Himalaya using geospatial techniques. Arab. J. Geosci. 2024, 17, 41. [Google Scholar] [CrossRef]
- Utah Avalanche Center. Blog: Steepness. Available online: https://utahavalanchecenter.org/blog/16386 (accessed on 22 February 2024).
- Alaska Satellite Facility. ALOS PALSAR. Available online: https://search.asf.alaska.edu/#/ (accessed on 10 February 2024).
- Sykes, J.; Toft, H.; Haegeli, P.; Statham, G. Automated Avalanche Terrain Exposure Scale (ATES) mapping—Local validation and optimization in western Canada. Nat. Hazards Earth Syst. Sci. 2024, 24, 947–971. [Google Scholar] [CrossRef]
- ESRI. Sentinel-2 Land Cover Explorer. Available online: https://livingatlas.arcgis.com/landcoverexplorer/#mapCenter=21.076%2C42.197%2C13&mode=step&timeExtent=2017%2C2023&year=2023 (accessed on 12 February 2024).
- Dinić, J. Commune Štrpce, Sirinićka Župa. Trait of Natural Environment; Geographical Institute “Jovan Cvijić” SASA: Belgrade, Serbia, 1990. [Google Scholar]
- Lazarević, R. Šara Mountain Župas: Gora, Opolje and Sredska. Train of Natural Environment; Geographical Institute “Jovan Cvijić” SASA: Belgrade, Serbia, 1994. [Google Scholar]
- QGIS Development Team. QGIS Geographic Information System v3.28.10 with GRASS. Open Source Geospatial Foundation Project. Available online: http://qgis.osgeo.org (accessed on 18 June 2023).
- Vujović, F.; Ćulafić, G.; Valjarević, A.; Brđanin, E.; Durlević, U. Comparative Geomorphometric Analysis of Drainage Basin Using AW3D30 Model in ArcGIS and QGIS Environment: Case Study of the Ibar River Drainage Basin, Montenegro. Agric. For. 2024, 70, 217–230. [Google Scholar] [CrossRef]
- Horton, P.; Jaboyedoff, M.; Rudaz, B.; Zimmermann, M. Flow-R, a model for susceptibility mapping of debris flows and other gravitational hazards at a regional scale. Nat. Hazards Earth Syst. Sci. 2013, 13, 869–885. [Google Scholar] [CrossRef]
- Jaboyedoff, M.; Choffet, M.; Derron, M.H.; Horton, P.; Loye, A.; Longchamp, C.; Mazotti, B.; Michoud, C.; Pedrazzini, A. Preliminary Slope Mass Movement Susceptibility Mapping Using DEM and LiDAR DEM. In Terrigenous Mass Movements; Pradhan, B., Buchroithner, M., Eds.; Springer: Berlin/Heidelberg, Germany, 2012; pp. 109–170. [Google Scholar] [CrossRef]
- Nie, Y.; Li, X.; Zhou, W.; Xu, R. Dynamic hazard assessment of group-occurring debris flows based on a coupled model. Nat. Hazards 2021, 106, 2635–2661. [Google Scholar] [CrossRef]
- Fischer, V.F.; Keiler, M.; Zimmermann, M. Modelling of individual debris flows using Flow-R: A case study in four Swiss torrents. In 13th Congress Interpraevent; Koboltschnig, G., Ed.; International Research Society: Lucerne, Switzerland, 2016; pp. 257–264. Available online: https://interpraevent2016.ch/ (accessed on 22 February 2024).
- Noël, F.; Nordang, S.F.; Jaboyedoff, M.; Digout, M.; Guerin, A.; Locat, J.; Matasci, B. Comparing Flow-R, Rockyfor3D and RAMMS to Rockfalls from the Mel de la Niva Mountain: A Benchmarking Exercise. Geosciences 2023, 13, 200. [Google Scholar] [CrossRef]
- Holmgren, P. Multiple flow direction algorithms for runoff modelling in grid based elevation models: An empirical evaluation. Hydrol. Process. 1994, 8, 327–334. [Google Scholar] [CrossRef]
- Perla, R.; Cheng, T.T.; McClung, D.M. A two-parameter model of snow-avalanche motion. J. Glaciol. 1980, 26, 197–207. [Google Scholar] [CrossRef]
- Bühler, Y.; Kumar, S.; Veitinger, J.; Christen, M.; Stoffel, A.; Snehmani. Automated identification of potential snow avalanche release areas based on digital elevation models. Nat. Hazards Earth Syst. Sci. 2013, 13, 1321–1335. [Google Scholar] [CrossRef]
- Vontobel, I.; Harvey, S.; Purves, R. Terrain analysis of skier-triggered avalanche starting zones. In International Snow Science Workshop Proceedings; Naaim-Bouvet, F., Durand, Y., Lambert, R., Eds.; Anena: Grenoble, France, 2013; pp. 371–375. Available online: https://www.dora.lib4ri.ch/wsl/islandora/object/wsl:17009 (accessed on 22 June 2024).
- Manap, M.A.; Nampak, H.; Pradhan, B. Application of probabilistic-based frequency ratio model in groundwater potential mapping using remote sensing data and GIS. Arab. J. Geosci. 2014, 7, 711–724. [Google Scholar] [CrossRef]
- Bahun, V.M.; Hrvatin, M.; Komac, B. Determining potential snow avalanche release areas by relief analysis. In Preteklost in Prihodnost; Ciglič, R., Čonč, Š., Geršič, M., Perko, D., Valjavec, B.M., Zorn, M., Eds.; Založba ZRC: Ljubljana, Slovenia, 2022; pp. 95–107. [Google Scholar] [CrossRef]
- Komac, B.; Ciglič, R.; Hrvatin, M.; Bahun, V.M.; Štaut, L.; Zorn, M. The Geographical Atlas of Natural Disasters in Slovenia. Geogr. Vestn. 2023, 95, 119–151. [Google Scholar] [CrossRef]
- Komac, B.; Zorn, M. Impact of climate change on snowpack and avalanches in Slovenia: The Soča Valley case study. Geogr. Pol. 2023, 96, 29–51. [Google Scholar] [CrossRef]
- Pavšek, M. Snow Avalanches in Slovenia—Geographical Features and Prevention; Anton Melik Geographical Institute: Ljubljana, Slovenia, 2002; pp. 1–209. (In Slovenian) [Google Scholar] [CrossRef]
- Singh, D.K.; Tanniru, S.; Singh, K.K.; Negi, H.S.; Ramsankaran, R. Passive microwave remote-sensing-based high-resolution snow depth mapping for Western Himalayan zones using multifactor modeling approach. Cryosphere 2024, 18, 451–474. [Google Scholar] [CrossRef]
- Tanniru, S.; Ramsankaran, R. Passive Microwave Remote Sensing of Snow Depth: Techniques, Challenges and Future Directions. Remote Sens. 2023, 15, 1052. [Google Scholar] [CrossRef]
- Krušić, J.; Marjanović, M.; Samardžić-Petrović, M.; Abolmasov, B.; Andrejev, K.; Miladinović, A. Comparison of expert, deterministic and Machine Learning approach for landslide susceptibility assessment in Ljubovija Municipality, Serbia. Geofizika 2017, 34, 251–273. [Google Scholar] [CrossRef]
- Phong, V.T.; Phan, T.T.; Prakash, I.; Singh, S.K.; Shirzadi, A.; Chapi, K.; Ly, H.-B.; Ho, L.S.; Quoc, N.K.; Pham, B.T. Landslide susceptibility modeling using different artificial intelligence methods: A case study at Muong Lay district, Vietnam. Geocarto Int. 2019, 36, 1685–1708. [Google Scholar] [CrossRef]
- Rahmati, O.; Ghorbanzadeh, O.; Teimurian, T.; Mohammadi, F.; Tiefenbacher, J.P.; Falah, F.; Pirasteh, S.; Ngo, P.-T.T.; Bui, D.T. Spatial Modeling of Snow Avalanche Using Machine Learning Models and Geo-Environmental Factors: Comparison of Effectiveness in Two Mountain Regions. Remote Sens. 2019, 11, 2995. [Google Scholar] [CrossRef]
- Čegar, N.; Durlević, U.; Dobrić, M.; Vukašinović, S. A statistical analysis of temperature and precipitation in Belgrade, Serbia (1961–2020). Forum Geogr. 2023, 22, 5–15. [Google Scholar] [CrossRef]

Disclaimer/Publisher’s Note: The statements, opinions and data contained in all publications are solely those of the individual author(s) and contributor(s) and not of MDPI and/or the editor(s). MDPI and/or the editor(s) disclaim responsibility for any injury to people or property resulting from any ideas, methods, instructions or products referred to in the content. |
© 2024 by the authors. Published by MDPI on behalf of the International Society for Photogrammetry and Remote Sensing. Licensee MDPI, Basel, Switzerland. This article is an open access article distributed under the terms and conditions of the Creative Commons Attribution (CC BY) license (https://creativecommons.org/licenses/by/4.0/).