Article

GIS-Based Analytical Hierarchy Process for Identifying Groundwater Potential Zones in Punjab, Pakistan

1
Field Wing of Punjab Agricultural Department, Agriculture House, Lahore 05467, Pakistan
2
Department of Agricultural Engineering, Bahauddin Zakariya University, Multan 60000, Pakistan
3
Division of Environmental Science and Infrastructure Engineering, Graduate School of Science and Engineering, Saitama University, Saitama 338-8570, Japan
4
School of Engineering, University of Basilicata, 85100 Potenza, Italy
5
Agricultural Mechanization Research Institute, Multan 60000, Pakistan
6
Department of Mechanical Engineering, Bahauddin Zakariya University, Multan 60000, Pakistan
*
Author to whom correspondence should be addressed.
ISPRS Int. J. Geo-Inf. 2024, 13(9), 317; https://doi.org/10.3390/ijgi13090317
Submission received: 9 June 2024 / Revised: 24 August 2024 / Accepted: 27 August 2024 / Published: 3 September 2024

Abstract

:
The quality and level of groundwater tables have rapidly declined because of intensive pumping in Punjab (Pakistan). For sustainable groundwater supplies, there is a need for better management practices. So, the identification of potential groundwater recharge zones is crucial for developing effective management systems. The current research is based on integrating seven contributing factors, including geology, soil map, land cover/land use, lineament density, drainage density, slope, and rainfall to categorize the area into various groundwater recharge potential zones using remote sensing, geographic information system (GIS), and analytical hierarchical process (AHP) for Punjab, Pakistan. The weights (for various thematic layers) and rating values (for sub-classes) in the overlay analysis were assigned for thematic layers and then modified and normalized using the AHP. The result indicates that about 17.88% of the area falls under the category of very high groundwater potential zones (GWPZs). It was found that only 12.27% of the area falls under the category of very low GWPZs. The results showed that spatial technologies like remote sensing and geographic information system (GIS), when combined with AHP technique, provide a robust platform for studying GWPZs. This will help the public and government sectors to understand the potential zone for sustainable groundwater management.

1. Introduction

Water is an essential resource that improves the quality of life in all living societies. The demand for this precious freshwater resource is continuously increasing because of the increasing population and industrialization. Fresh water resources are often associated with volume and quality, and these are adversely affected particularly in low-income nations. Fresh water supplies are also depleted, owing to climate change. The increase in the scarcity of adequate freshwater is due to the strong link between water, food, and energy. The scarcity has an effect on communities and world economies; therefore, water scarcity is considered a worldwide concern [1]. Like other countries, Pakistan is also suffering from severe water scarcity. According to the Asian Development Bank (ADB), Pakistan is rapidly approaching water shortage, and its access to water for everyone has already surpassed a thousand cubic meters annually. In Pakistan, access to freshwater reserves has also declined. According to research, the water availability in Pakistan was 5100 m3 per person in 1951, but it has since dropped to 1000 m3 per person in 2010 and is expected to decline to 600 cubic meters per inhabitant by 2050 [2]. To meet the high demand of freshwater resources, GW is seen as a benefit to emerging regions, seeing as it is a valuable and important natural resource. Therefore, the exploitation of regional groundwater (GW) resources has been increased [3,4]. The input of groundwater to the total irrigated agricultural water supply in Pakistan accelerated from 8 to 60% between 1960 and 2010 because of the rapid expansion of cultivated lands. Thus, groundwater depletion is occurring at a rapid pace in most of the world’s major aquifers located in the arid and semi-arid zones of the world. As a result, a 2–3 m annual declining trend in the GW level has been observed and it is due to the incessant pumping of GW resources to fulfill intensive agricultural and urban water requirements [5,6]. There is essentially “free” groundwater for everyone: landowners with the means to drill wells typically have unrestricted access to groundwater. Certain nations subsidize the cost of electricity for GW pumping to achieve higher agricultural productivity, which is leading to a decline in aquifer levels (increase in GW table) [7].
GW is critical to global food security and human capital growth as it contributes to the recovery of around 30% of all freshwater losses worldwide. GW accounts for nearly half of all irrigation water [8]. GW is also a primary source of freshwater for over 2.1 billion people worldwide. The pumping of water from the zone of saturation in the confined and unconfined aquifer is referred to as discharge, and the concurrent flow from the ground surface to the saturated zone is referred to as GW recharge [9]. Research and the effective management of GW resources are critical for establishing appropriate groundwater monitoring systems, recharge locations, and to understand the actual condition of groundwater resources in almost any locality. Various climatic and geomorphological attributes influence the course of groundwater and assist in retrieving GWPZs, including sedimentological structures, primary and secondary porosity, slope length, lithological natural features, land use/land cover (LULC), hydraulic properties, rainfall patterns, and drainage density [10].
GW is a widely disseminated resource and capital on the planet, but unlike most natural reserves, it is recharged periodically by precipitation [11]. It is essential to determine the prospective zone of GW where artificial recharge procedures may be employed to improve the degree of recharge to maintain a sufficient amount of recharge [12,13]. Conventional methods have been employed for identifying and delineating GWPZs [14]. Modeling of the GW level and quality are mostly based on field observations, which employ geophysical, geotechnical, and geomorphological techniques [15]. These techniques are often costly and time-consuming [16,17]. Spatial tools create and simulate important data from a wide variety of scientific fields in a timely and cost-effective manner [18,19]. Multiple studies have employed diverse criteria for identifying GW vulnerability, such as incorporating geological datasets with GIS data, the use of lithological and hydro-geomorphology-based methods, and the utilization of satellite data to detect lithological processes and shear zones [20,21]. Many factors influence the occurrence and transport of water, including landform, drains, geomorphology, structures, and hydrology [22]. This emphasizes the necessity for an interdisciplinary framework for hydrogeological assessment based on remote sensing techniques [15,23].
Remote sensing (RS) is an innovative and effective method for gathering spatial data over large regions in a short period [3,11,20,24]. The ability of GIS and RS to acquire and interpret information at enormous scales in a short time makes them useful tools for differentiating, evaluating, and managing GW supplies [25]. With these features, various datasets may be interconnected to develop conceptual frameworks for spotting GW potential in a particular region [26]. In order to determine possible GW storage regions, the AHP technique needs the inclusion of many elements [10,27]. AHP provides a convenient, moderate, and simply understood response for complex decision-making processes. The model’s reliance on specialized knowledge seems to be the primary cause of uncertainty. The use of the AHP in combination with GIS and spatial satellite imagery in GWPZs mapping has shown high efficiency and predictability [28]. However, before the application of these techniques for the assessment of GWPZs, there is a strong need to evaluate and validate these techniques for specified regions. Then, these techniques may be used for the development of GWPZs and topographic maps with allocated importance in a geographical domain, such as soil type, drainage patterns, infiltration capacity, precipitation, gradient (slope), sediment, land-use, and land-cover (LULC) maps [29,30]. Therefore, the current study was conducted to build a GIS-based method combined with an analytical hierarchical process as an effective decision support tool for identifying GWPZs in the province of Punjab, Pakistan.

2. Materials and Methods

2.1. Site Description

The study region is Punjab, second largest province of Pakistan. It occupies about 205,344 km2, which is 25.8% of the total area of Pakistan. Its location is between latitudes 28° N to 38° N and longitudes 70° E to 75° E (Figure 1). The elevation of Punjab varies from 2271 m in the north to 46 m in the south. The average temperature and annual precipitation in this area are 33 °C and 59 cm, respectively, with a changing tendency in both. This area is traversed by River Indus and its five principal tributaries: Chenab, Jhelum, Sutlej, Ravi, and Bias. To irrigate the agricultural land, numerous surface water systems were built, including main canals, link canals, and their tributaries. Groundwater (GW) recharging is significantly added by seepage from agricultural fields and water channels.
Over 80% of the GW resources in the country are found in Punjab, Pakistan. The Punjab province consists of the most productive land with abundant GW resources. However, due to the rapid development of the agricultural area, extensive implantation of private tube-wells, and escalating population growth, the pace of GW depletion is considerable. According to estimates, about 69% of GW is utilized to irrigate crops, either by itself or in combination with canal water. GW abstraction climbed from 10 BCM (Billion Cubic Meters) per year in 1951 to 68 BCM per year in 2022. The private tubewells accounted for 80% of the total abstraction between 1956 and 2022. In Punjab’s alluvial aquifer systems, silt and sand are present up to a depth of about 300 m. The fine sand, clay, silt, and gravel make up the subsurface lithology of the alluvial plain. In general, an alluvial aquifer is thought to be unconfined in nature. Tubewells in this area have a specific capacity of 0.62 to 1.42 m3 per minute per m.

2.2. Data Collection and Processing

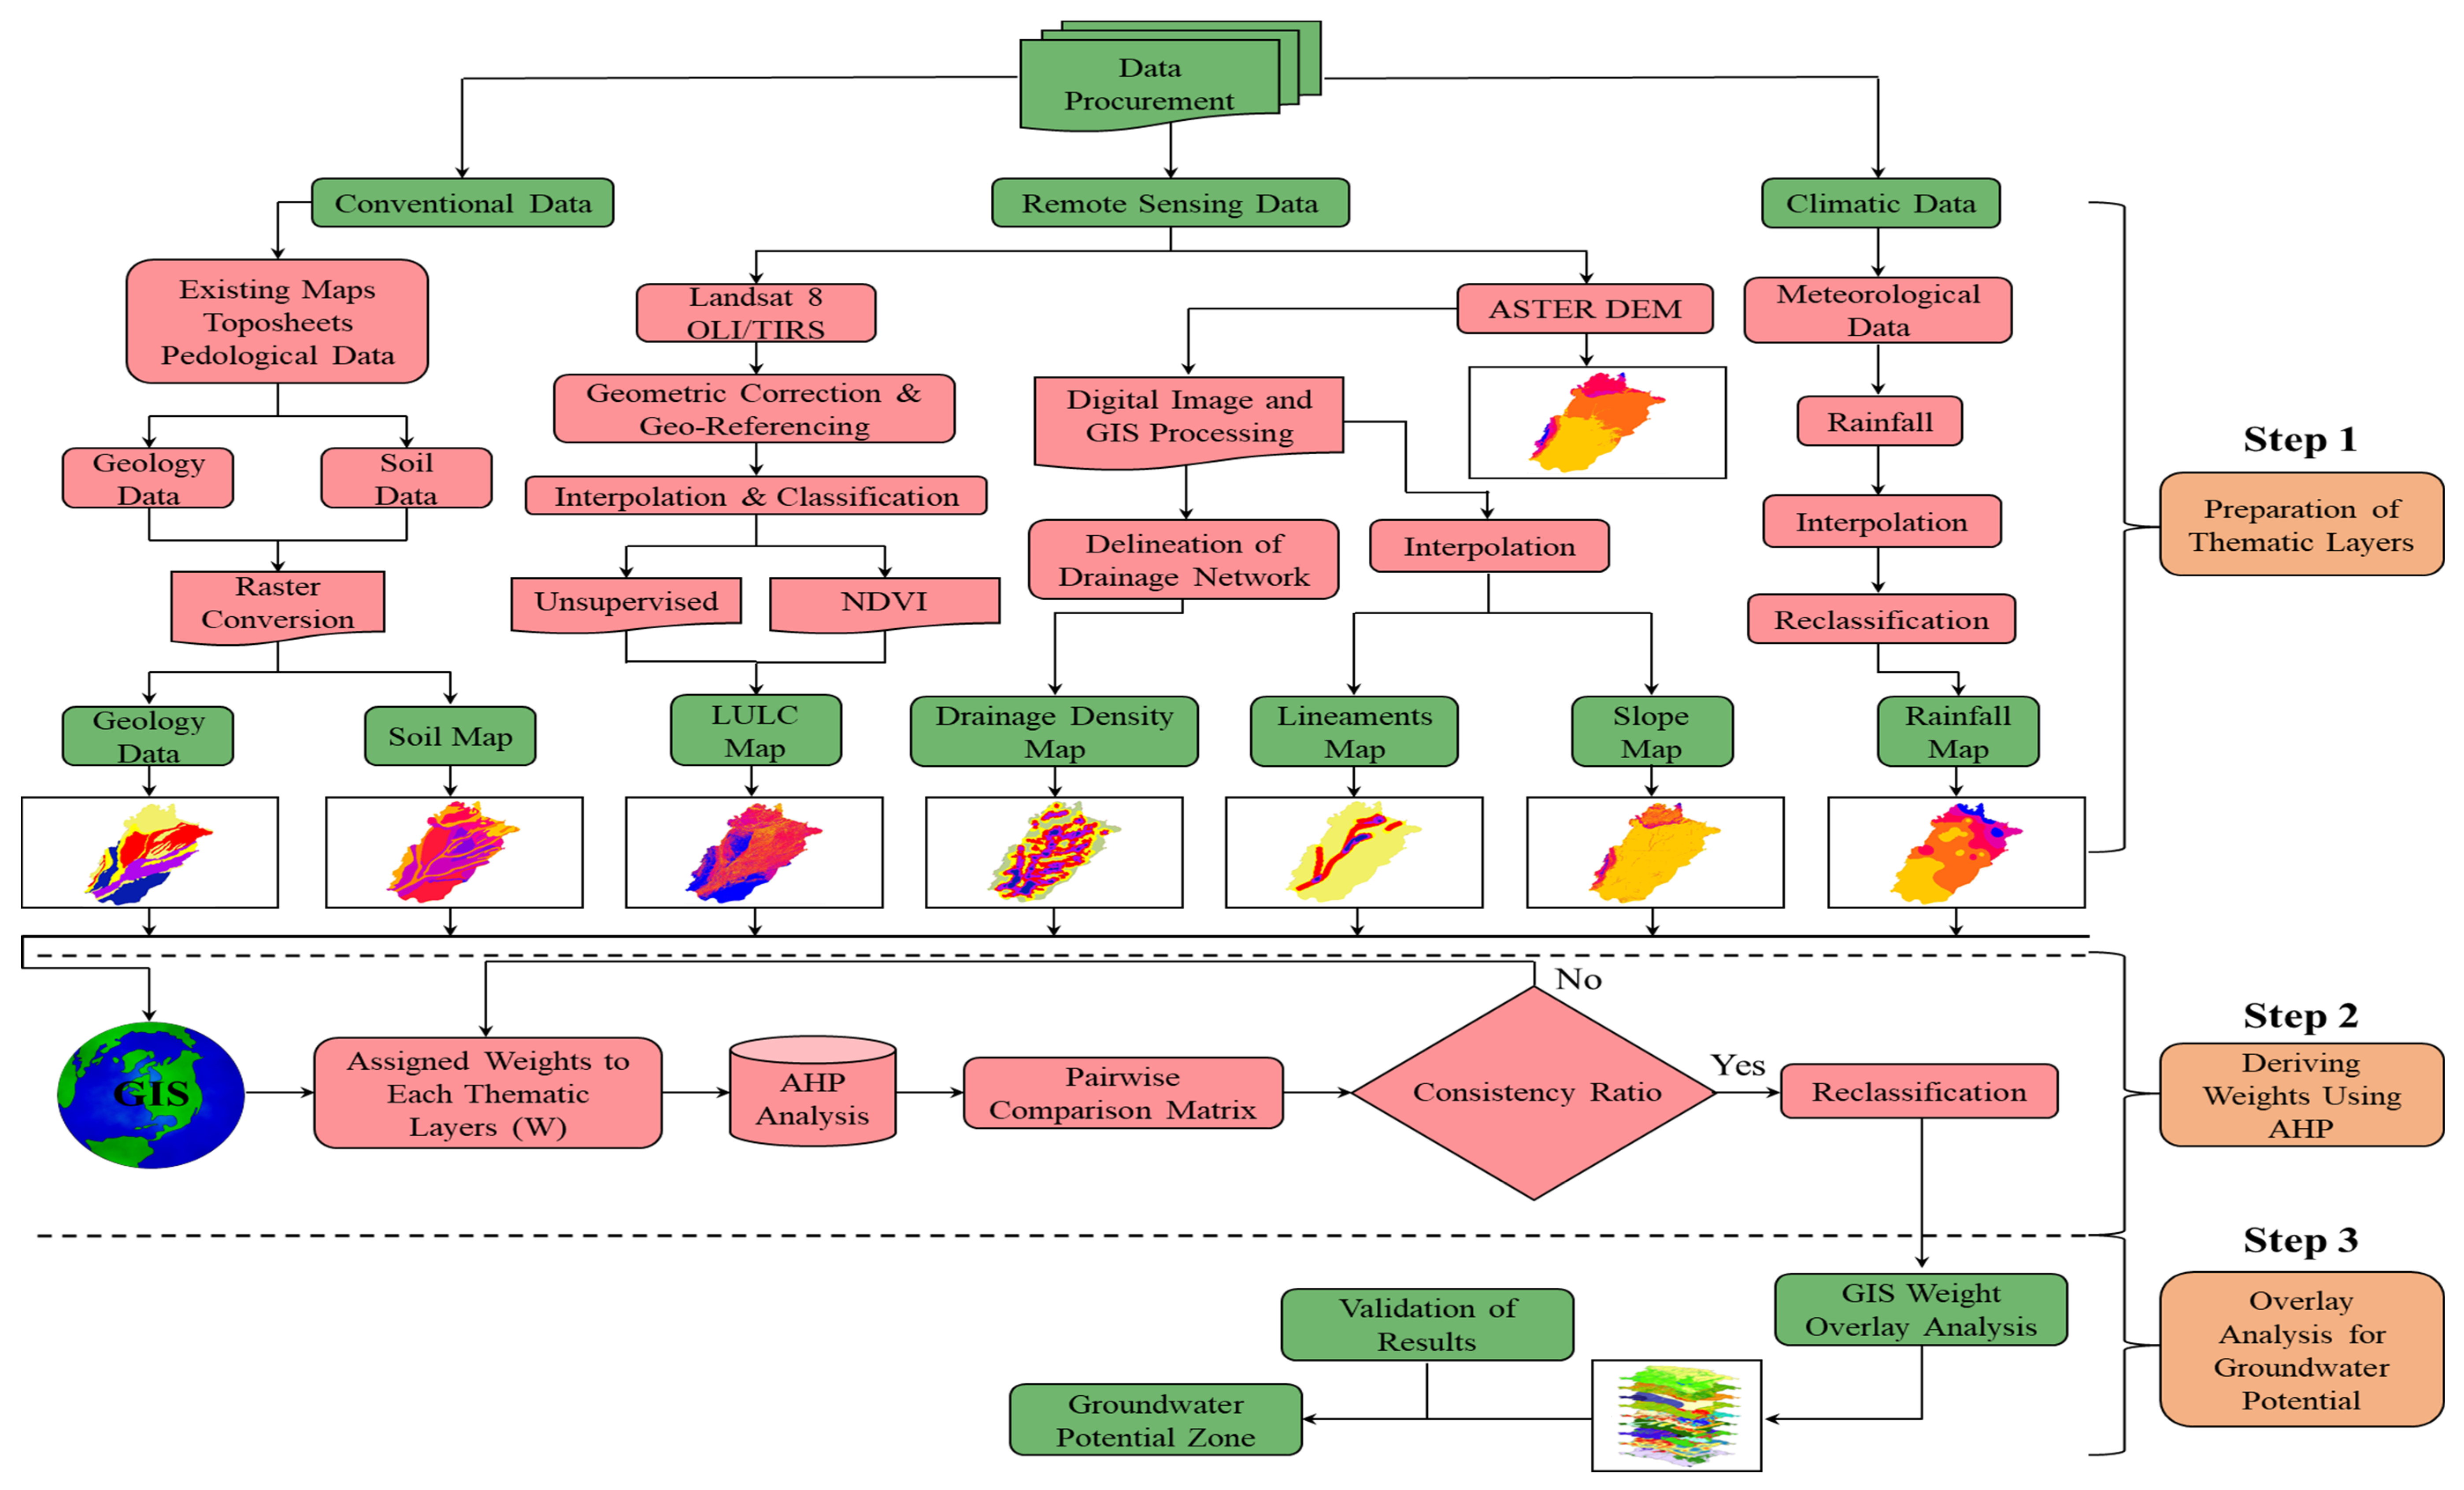
The study area’s LANDSAT OLI images were used because these are free of cost and easily available. These imageries were downloaded from the USGS site (http://edc.usgs.gov, accessed on 1 August 2024) with less than 10% cloud cover, and detail about the Landsat data collection is given in Table 1. The quantitative examination of geomorphic indices taken from the Digital Elevation Map is the foundation for the current work (30 m resolution). With the use of software, ArcGIS vs 10.7.1, all the geographical maps and satellite imageries were geo-referenced and mosaicked. The data were corrected and projected on the Universal Mercator (UTM) WGS 1984, Zone 42 and 43 North, after being geo-referenced. The seven thematic layers that control GW potential recharge, land use and land cover (LULC), soil texture, drainage density, lineament density, rainfall, slope, and geology were created using a variety of datasets, including traditional maps, satellite pictures, and climatic information. Thematic maps were created to delineate the GWPZs in the study region. All thematic maps were continuously digitalized in vector format, and they were all transformed into raster format using the Arc Map/GIS program. By rearranging the soil types according to their geological, hydrological, and environmental properties, a thematic soil map was created for the research area. The final thematic maps also contain the ground truth information gathered for this project. Figure 2 explains the thorough technique and data analysis flow diagram. The various datasets, their pre-processing, and creation of thematic images for addressing GWPZs and susceptible zones are described in this part.
The study area’s elevation map was created using DEM data. The spatial resolution of DEM is 30 m and operates in 14 bands, from ultraviolet to infrared. Using some pre-processing tools for data normalization, DEM and Landsat data were rectified for data inaccuracies and distortion. DEM was used to build a subset raster for representing the area of interest of the study [31]. In ArcGIS, the line density analysis tool was used to generate the drainage density map for the research region, and the natural breaks technique was used to classify it. This classification has the advantage of locating actual classes in the data. The most important determining factor for GW recharge is rainfall. The Pakistan Metrological Department (PMD) collected annual rainfall data from several gauge stations, and an ArcGIS map of average annual rainfall was created using the standard Kriging interpolation method [32]. Based on information about soil types obtained from the Food and Agriculture Organization (FAO) (available at http://www.fao.org/soils-portal/soil-survey/soil-maps-and-databases/en/ accessed on 1 August 2024), the soil texture map was generated. The soil texture map has five primary classes: loamy sandy, sandy, rocky outcrops, and loamy clay. Permeability and porosity of the soil media are directly correlated with the potentiality of GW recharge, higher the permeability of soil, higher the potential for GW recharge. The Punjab soil map, (available at http://citypulse.com.pk/pakistangis/soil-map-of-punjab-pakistan/, accessed on 1 August 2024) was used to evaluate and prepare the geological features of the research region. The sources from which the data were acquired and used in this study are given in Table 2.

2.3. Description of Thematic Layer

GW movement and presence are influenced by several variables, including a region’s hydrological conditions, soil, land use, rainfall, slope, drainage pattern, and geological structure. These variables also interact with one another. To define GW potential recharge zones in the research area, seven different physical characteristics or influencing factors, including land use/land cover (LU/LC), slope (SL), lineament density (LD), drainage density (DD), rainfall (RF), geology (GG), and soil (SO) have been identified. These parameters paly the significant role in influencing the geological, morphological and hydrological conditions of an area [33]. Combined analysis of these parameters can provide a comprehensive assessment of area’s groundwater potential. For the creation of LULC maps, remotely sensed images were downloaded for the specified path/row (Table 1). These images were processed using the Erdas Imagine 15. Preprocessing tools (layer stacking, mosaicking, image subset) were applied to prepare the image for classification. After preprocessing of satellite images, the multiband raw image was classified using the unsupervised classification and NDVI methods. The Normalized difference Vegetation Index (NDVI) was used to improve the ability to differentiate healthy vegetation from other land cover types. Higher NDVI values indicated healthy and strong vegetation, whereas low NDVI values showed unhealthy vegetation or absence of vegetation. The k-means algorithm was used for unsupervised classification technique. The vegetated land use class was assigned to the LULC class with the higher NDVI values. The Kappa coefficient (K) was calculated to evaluate accuracy of classified map. The 87% value of K was found which showed the strong agreement between the classified map and ground truth values. To create the base and drainage maps, 1:50,000 SOI topographical sheets were used. Topographical sheets have been used in GIS contexts to create slope, drainage, and density maps. A thematic map is a type of map that portrays the geographic pattern of a particular subject matter (theme) in a geographic area. The geological survey has created geology, soil, and lineament maps using GIS. To determine the GWPZs, all the thematic layers intersect together in ArcGIS. The flow diagram of the conducted study is displayed in Figure 2.
Figure 3 showed the relationship between the most influential parameters of GW potential zone. The continuous lines between the two parameters in Figure 3 show that one parameter has a major and direct effect on the other parameter. The discontinuous line between the two parameters indicates that one parameter has a minor and indirect effect on the other parameter. To calculate both types of effect, one (1) point is attributed to a major effect and half a point (1/2 = 0.5) is attributed to the minor one. By adding major(A) and minor(B) effect values, the proposed relative rates for each parameter were determined. The rate factor was determined by the summation of the points attributed to the effects of each factor. The last column was determined by dividing the relative rate of each parameter to the sum rate of all the parameters. The effect on proposed weights and rates of each class are given in Table 3.

2.4. The Infrastructure of the Groundwater Potential Model

GIS and remote sensing require less time for identifying GWPZs, while hydrogeological surveys and electrical soundings require more time for detecting GWPZs [10]. Table 2 lists the various data kinds, together with their characteristics and the sources from which they came.

2.5. Spatial Database

The major objective was to compile all relevant data and other auxiliary data into a GIS database. The digital representation of all the spatial data was compiled. All the maps and supporting data were digitized, then transformed and converted from raster to vector; gridding, buffer analysis, interpolation, and other GIS processes were carried out.

2.6. Spatial Data Analysis

The lineament, geology, slope, and drainage patterns, along with the soil maps in the research region, were integrated to create the GW potential map. To extract the spatial elements that are important to GW zones, the complete input was analyzed. Analyses including polygon classification and weight calculation were used in this process. Each polygon of the theme levels received the appropriate weights. The weight depends on how much GW was recharged, and storage has an impact.

2.7. Data Integration

The GWPZs of the study area were identified using thematic maps of geology, lineament density, drainage density, LULC, soil, and slope. A new map was created by combining two thematic maps by placing each theme over another theme to discover the intersection polygons. Up until the creation of the final composite map, the process continued. To delineate the GWPZs, which were divided into low, moderate, and high GWPZs, the weightage of each polygon was allocated using a basic mathematics model to prepare the final map [25].

2.8. Weighted Index Overlay Analysis (WIOA)

The GWPZs were created using weighted overlay analysis of all the thematic maps including geology, rainfall, lineament density, drainage density, soil, slope, and LULC using the spatial analysis tool in ArcGIS. One of the most popular methods for overlay analysis is the weighted overlay that is used to address multi-criteria issues including suitability of models and site selection. A straightforward and easy way for combining analysis of multiclass maps is Weighted Index Overlay Analysis [25]. The method has the benefit of allowing for the integration of human judgment into this study. The comparative relevance of a parameter and the objective were represented by a weight. When using a straightforward weighted overlay method, there is no set scale. For this rationale, analytical guidelines have been established, and each parameter is given the weight as it deserves.
The ranks for each parameter of each thematic image have been given during the weighted overlay analysis, and the weight is assigned based on the impacts of the numerous parameters. The works produced by researchers like have been taken into consideration while determining the weights and rankings [5,8,34]. For present study, thematic maps were converted to raster format and combined using the weighted overlay technique (ranking and weightage of thematic images through GIS). The geology, LULC, soil, drainage density, and slope were given identical weights. The geomorphology and lineament density were given higher weights. Instead of individual lineaments, lineament density is more consistently correlated with GW potential. Higher lineaments zones indicate higher groundwater potential [14]. Individual ranks were provided for each sub variable after allocating the weights to each parameter. Lineament density, geology, slope, and drainage density from the GIS layer were thoroughly examined in this process, and ranks were given to each variable [21].

2.9. Analytical Hierarchy Process (AHP)

The combination of classic AHP and analytical hierarchy led to the development of the AHP methodology. The AHP effectively resolves the multi-criteria decision-making challenges. Numerous studies have attempted to identify the best alternative for alternative selection using multi-criteria decision-making with the AHP technique [6]. Numerous researchers later refined the strategy, which is currently often applied to a variety of decision-making issues [4,14]. Table 4 provides the scale that was used for the AHP technique. It was also known as the pairwise comparisons scale. Numerous models have been recognized for mapping GWRP based on literature reviews [28]. All the criteria in the hierarchy system’s extents were used to build pairwise comparison matrices. Saaty’s scale of relative importance was used to create a pairwise comparison matrix as given in Table 4 and Table 5 [35]. The relative important values were calculated by using Saaty’s 1–9 scale, where a score of 1 indicates that the two themes are equally important and a score of 9 denotes that one theme is extremely important in relation to the other. Using Saaty’s relevance scale and thematic maps utilized for the definition of GW potential, a pairwise comparison matrix was created [36]. The major eigenvalue and the consistency index in the AHP represent the notion of judgmental uncertainty. Using the following Equation (1), Saaty provided a consistency index (CI) as a deviation of consistency:
CI = λ max n n 1
where n is the number of classes and λmax is greatest eigenvalue of the comparison matrix. Consistency ratio (CR), a metric for the consistency of a comparison matrix, is provided by Equation (2).
CR = CI RI
RI stands for ratio index, and if the CR value is less than or equal to 0.1, the consistency is acceptable. The subjective assessment needs to be revised if the CR is higher than 10%. The consistency index (CI) of the designated weights was estimated using the method outlined by Saaty (1980, 1992), and the consistency ratio, which calculates the likelihood that the matrix ratings were randomly generated. The random consistency index (RI) for random matrices is the average value of CI using Saaty’s scale.
It should be noted that consistent weights require a CR value of less than 0.10; otherwise, associated weights must be reviewed and revised to prevent inconsistency (Saaty 1990). The calculated CR for this study was 0.02, which was significantly less than the threshold value of 0.10. To further illustrate the relative significance of various themes to GW availability, Saaty’s scale of assignment was used to assign weights to each of the thematic maps in the range of 1 to 9 (Table 4 and Table 5). The local priority vectors are inserted into the appropriate columns of the super matrix during construction to acquire the relative priorities of the various classes with interdependent influences. Super matrices are partitioned matrices in which each segment denotes a connection between two clusters. Each column in the super matrix was multiplied by the relevant weights to create the weighted super matrix, which is then normalized. The weighted super matrix is raised to powers by multiplying by itself to create the limit super matrix, which then determines the final relative priority. The limit super matrix was attained when each row in the super matrix equals itself.

2.10. Assessment of Groundwater Potential Zones (GWPZs)

The estimation of GW recharge potential zones in the location was aided by the non -dimensional quantity known as the GW prospective index (GWPI) [4]. GW prospective zones were identified using the weighted linear combination technique. Using the comparison matrix between the parameters and the data on the ranking of the criteria, AHP provides an overall ranking of the results. Total Scores (TS) were obtained by summing the products of all attributes and multiplying the weights of the features in each thematic layer by weights of the thematic layers.
TS =   W × R
Here, the overall rating is Total Scores (TS). W stands for the thematic layers’ weights. The thematic layer’s feature weights are represented by R. The groundwater potential index (GWPI) is a layer that is integrated and created, considering all the following elements and themes.
GWPI = Gg + Ld + Sl + So + Rf + Dd + LULC
where GWPI represents groundwater potential index, Gg represents geology, Ld represents lineament density, Sl represents slope, So represents soil, Dd represents drainage density, Rf represents rainfall, and LULC represents land use and land cover.

3. Results

3.1. Delineation of Groundwater Potential Zones (GWPZs)

Table 6 showed the basis of categorization for the seven selected parameters for the delineation of GWPZs. The basis of categorization for drainage and lineament were drainage density and lineament density, respectively. In the case of geology, the basis of characterizations was rock type, joints, fractures, and weathering character. The land cover status, areal extent, condition, and associated vegetation were considered for LULC, and texture, porosity, permeability were selected for soil type. The amalgamation of thematic layers (influencing factor) such as drainage, rainfall, lineament, geology, soil, and subsurface characteristics were identified as the influencing factors for defining GWPZs. The results also indicated that with the aid of different influencing factors, including drainage density, geology, rainfall, LULC, soil, slope, and lineament density, the GWPZ for a certain location was determined. The classification of the factors influencing the GWP zone map is given in Table 6.
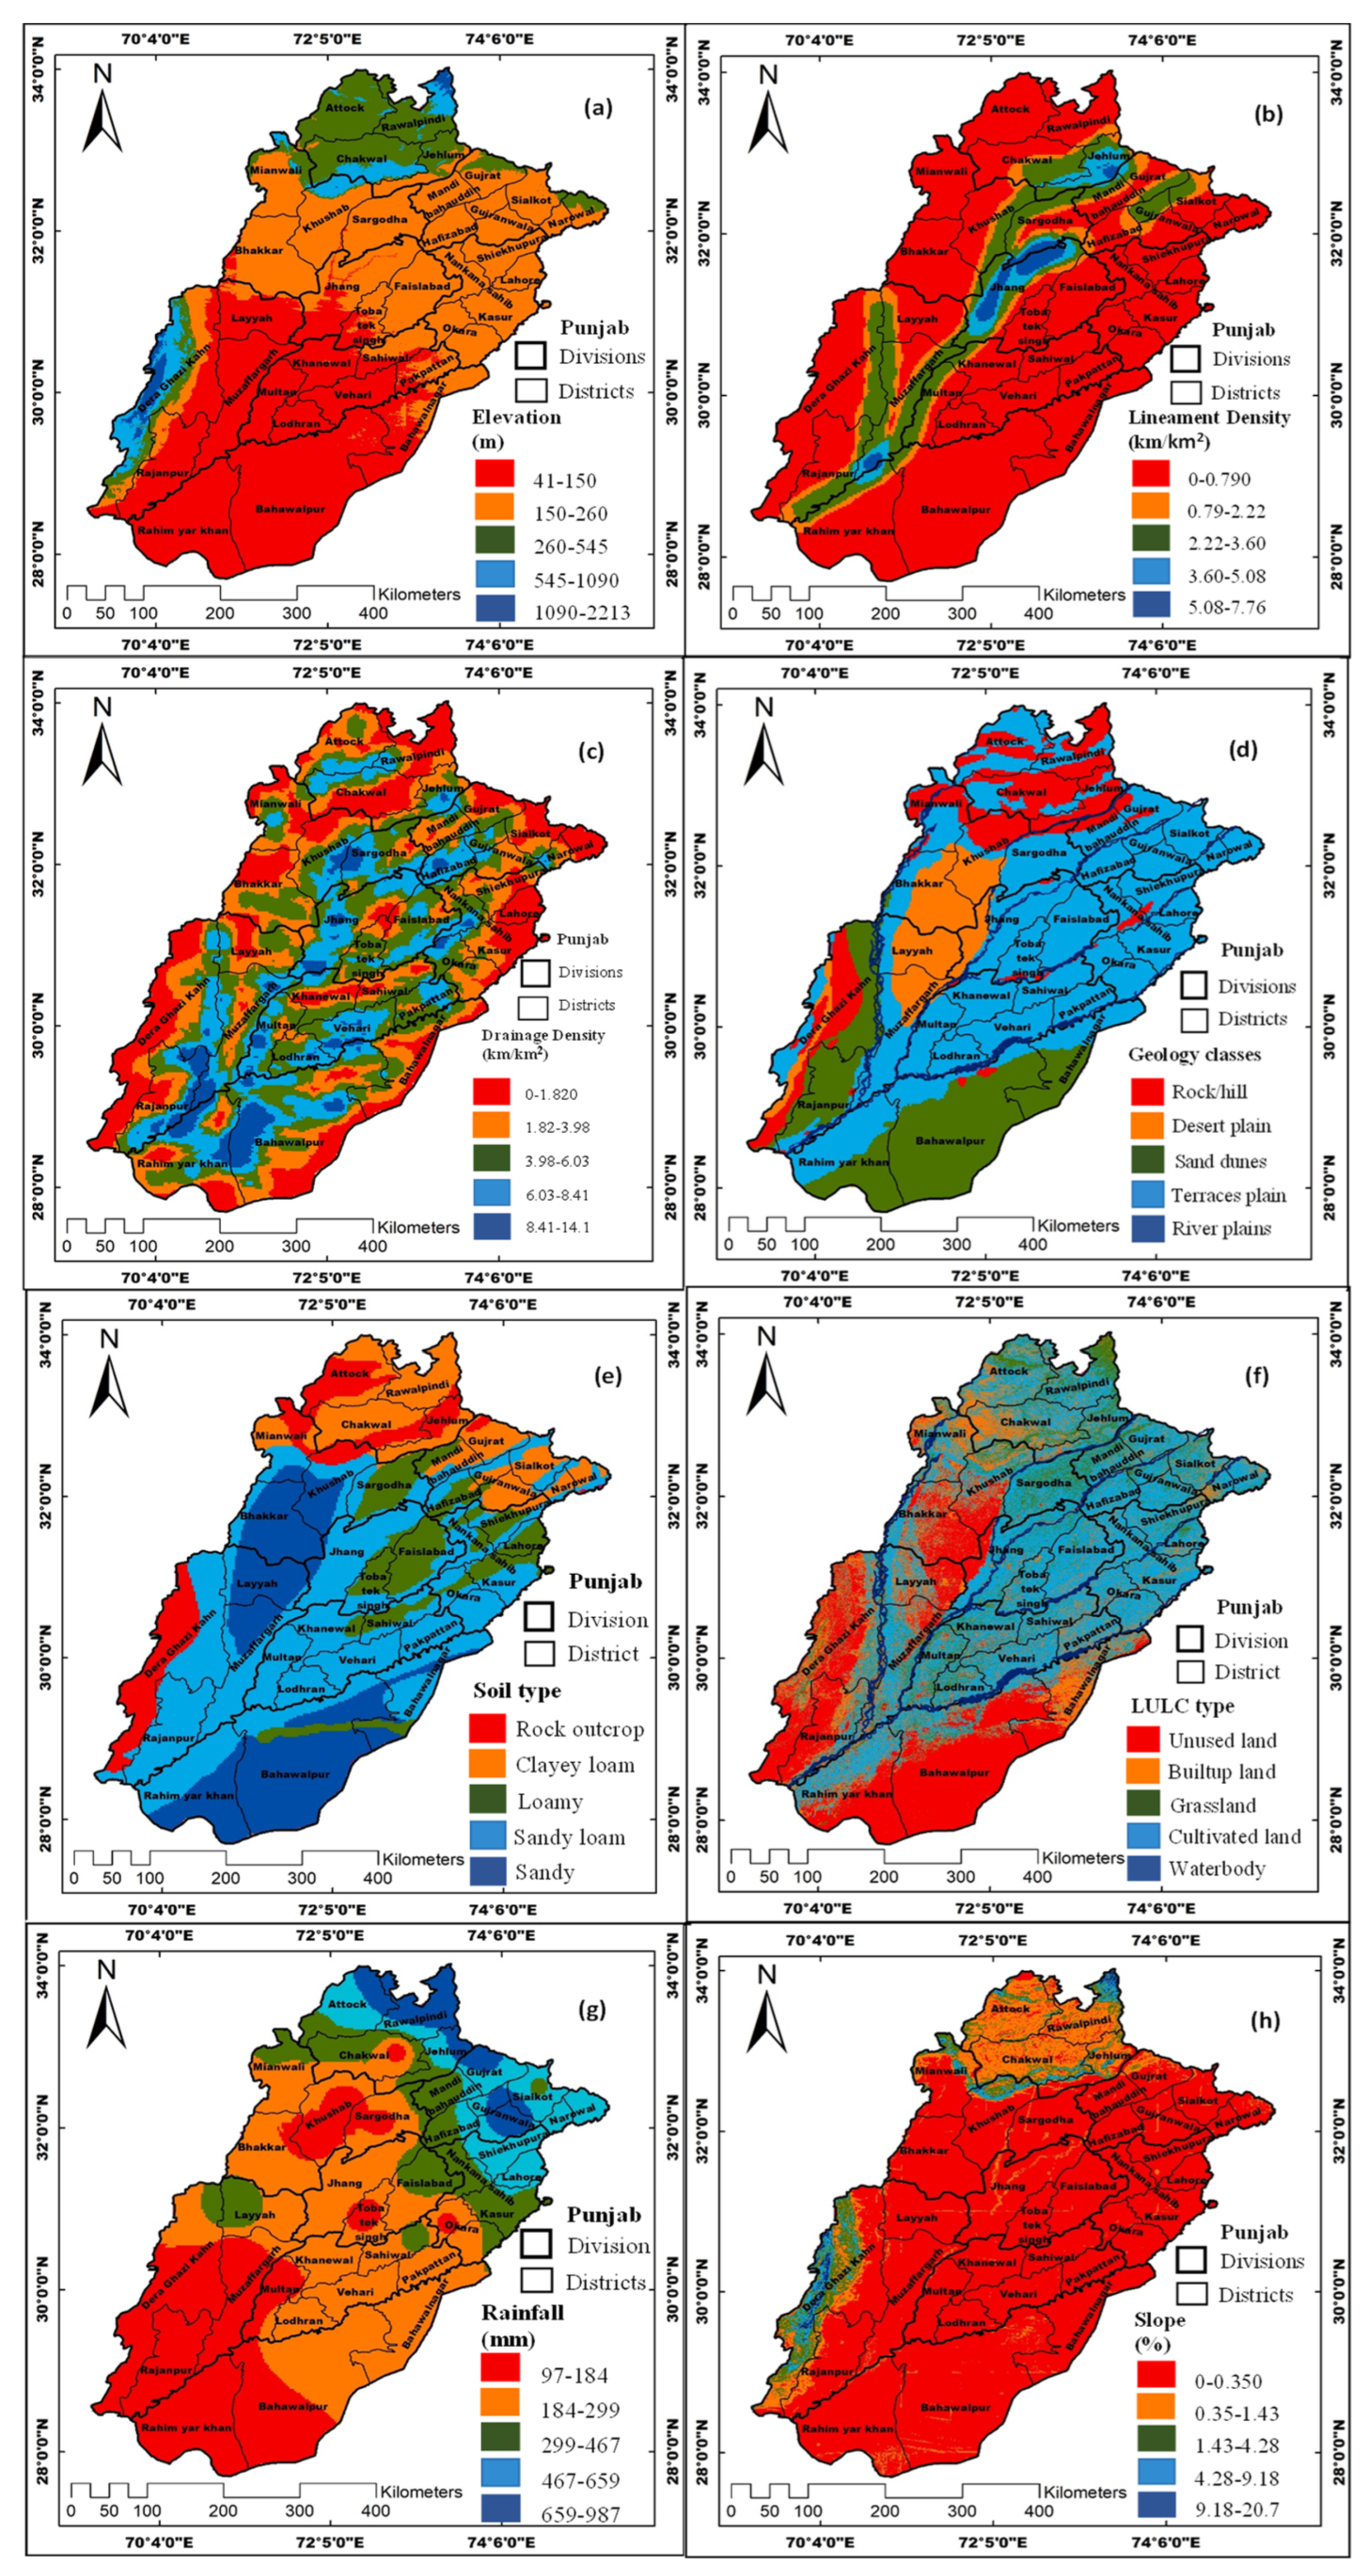
A digital elevation model DEM is a computerized demonstration of a certain topography. One of the important influencing factors that has a big impact on a region’s capacity for GW is the elevation or height of that area. Typically, a high altitude and a flat or moderately sloping location favorably encourages the activity of surface water infiltration, which increases subsurface water retrieval. It goes without saying that an area with steep slopes boosts rainfall surface run-off with little or no penetration into the earth, as shown in Figure 4a–h. It is evident that areas with a flat or sloping topography are predicted to have the greatest GW potential. Flatter topography will increase the likelihood of GW recharge or accumulation in a particular area. Typically, areas with flat topographical features allow water to move slowly, enhancing its infiltration rate into soil. Based on the topographic conditions of Punjab, the elevation ranges from 41 to 2213 m, obtained from the Digital Elevation Map, which is divided into five classes for further use in the weighted overlay technique. In the study region, as shown in Figure 4a, the topography was divided into five major classes (41–150 m, 150–260 m, 260–545 m, 545–1090 m, and 1090–2213 m. A change in the topography generally defines the land surface features, which significantly influences surface runoff and seepage.
The first and most important process that directly or indirectly discloses information about the tectonic activity of the studied area is lineament mapping [37]. Lineaments were cut in accordance with the pattern of the vegetation, the plain of weakness, and the river’s straightness. The highest lineament is straight to vegetation and surface moisture contents. The presence of high moisture contents is an initial indicator of the presence of groundwater. Lineament and faults are the only factors affecting the streams’ direction. Compared to lineaments, faults are of much lesser magnitude, and they can be regarded as simply side effects of the interplay between lineaments. They are tangible, concrete pieces of evidence and are much more reliable than lineaments. However, both can be considered the same. Numerous main (macro) and minor (micro) lineaments were identified from the satellite imagery, confirmed by ground truthing and delineated at a scale of 1:50,000 on the map [21]. Lineament density was found into five groups with identical intervals for this study ranging from 0–0.790 km/km2 to 7.76 km/km2: very high, high, medium, low, and very low (Figure 4b). The northwest to southeast side of the province has the highest lineament density (5.08–7.76 km/km2). In the middle section of the study region, the lineament density was recorded as 0.79–2.22 km/km2. Furthermore,
In the study area, as shown in Figure 4c, seepage from these waterways leads to subsurface recharge and an increase in GWP. The drainage density of surface water channels was a frequently used metric for assessing GWPZs. Therefore, a greater possibility for GW recharge is associated with a larger channel density. The study area’s drainage density map was divided into five primary categories: 0 to 1.820, 1.82 to 3.98, 3.98 to 6.03, 6.03 to 8.41, and 8.41 to 14.1 km/km2. With the presence of a substantial irrigation network, a lower drainage density was discovered in the Bahawalpur and Rawalpindi regions and a higher drainage density was identified in Sargodha, Faisalabad, and Lahore. These results were in good agreement [5]. Lower drainage density areas indicate low infiltration rates and runoff, whereas higher drainage density areas indicate high infiltration rates and runoff [38].
A thorough understanding of geomorphology is crucial for raising awareness on issues such as GW regions, slopes, relief, weathering depths, types of deposited materials, thickness of material deposition, and combinations of various landforms [6]. The plain terraces in the research area include floodplain and irrigated sections with strong aquifer recharge capacities. Large portions of the lower southeast region (Bahawalpur) are covered in sand dunes, as shown in Figure 4d. The upper north area is mountainous and is divided into rock plains and piedmonts. Bahawalpur and Sargodha often have higher permeability values due to the presence of sand and sandy loam particles.
According to the likelihood of having GW resources, loam and sandy loam are classified as moderate to good. The presence of sandy clay and loamy sands indicates that GW storage is in good condition [13]. The infiltration rate, hydraulic conductivity, and soil permeability are all typically influenced by soil texture, which in turn has a significant impact on recharge potential. Compared to clay soil, coarse sandy soil has a higher rate of infiltration. The soil texture map’s five primary classes include loamy clay, sandy, loamy, sandy loamy, and rocky outcrops, as shown in Figure 4e. The properties of the soil medium affect how quickly pollutants descend due to water seepage. When compared to clay-based soil, sand-based soil can transfer toxins more quickly to the GW table. The results of soil type in the study area are in good agreement [5].
The upcoming biggest threat to the ecosystem and the perception of underground water is the shift in land use and land cover. The term “land cover” refers to a type of specific characteristic that is spread across the surface of the earth, such as “Forest”, whereas the term “land use” refers to the human activity that is related to a particular piece of land, such as “Built up land”. One of the important uses of RS techniques is mapping LULC since it has a substantial impact on and enhances GW status [36]. A detailed description of LULC classes used is given in Table 7.
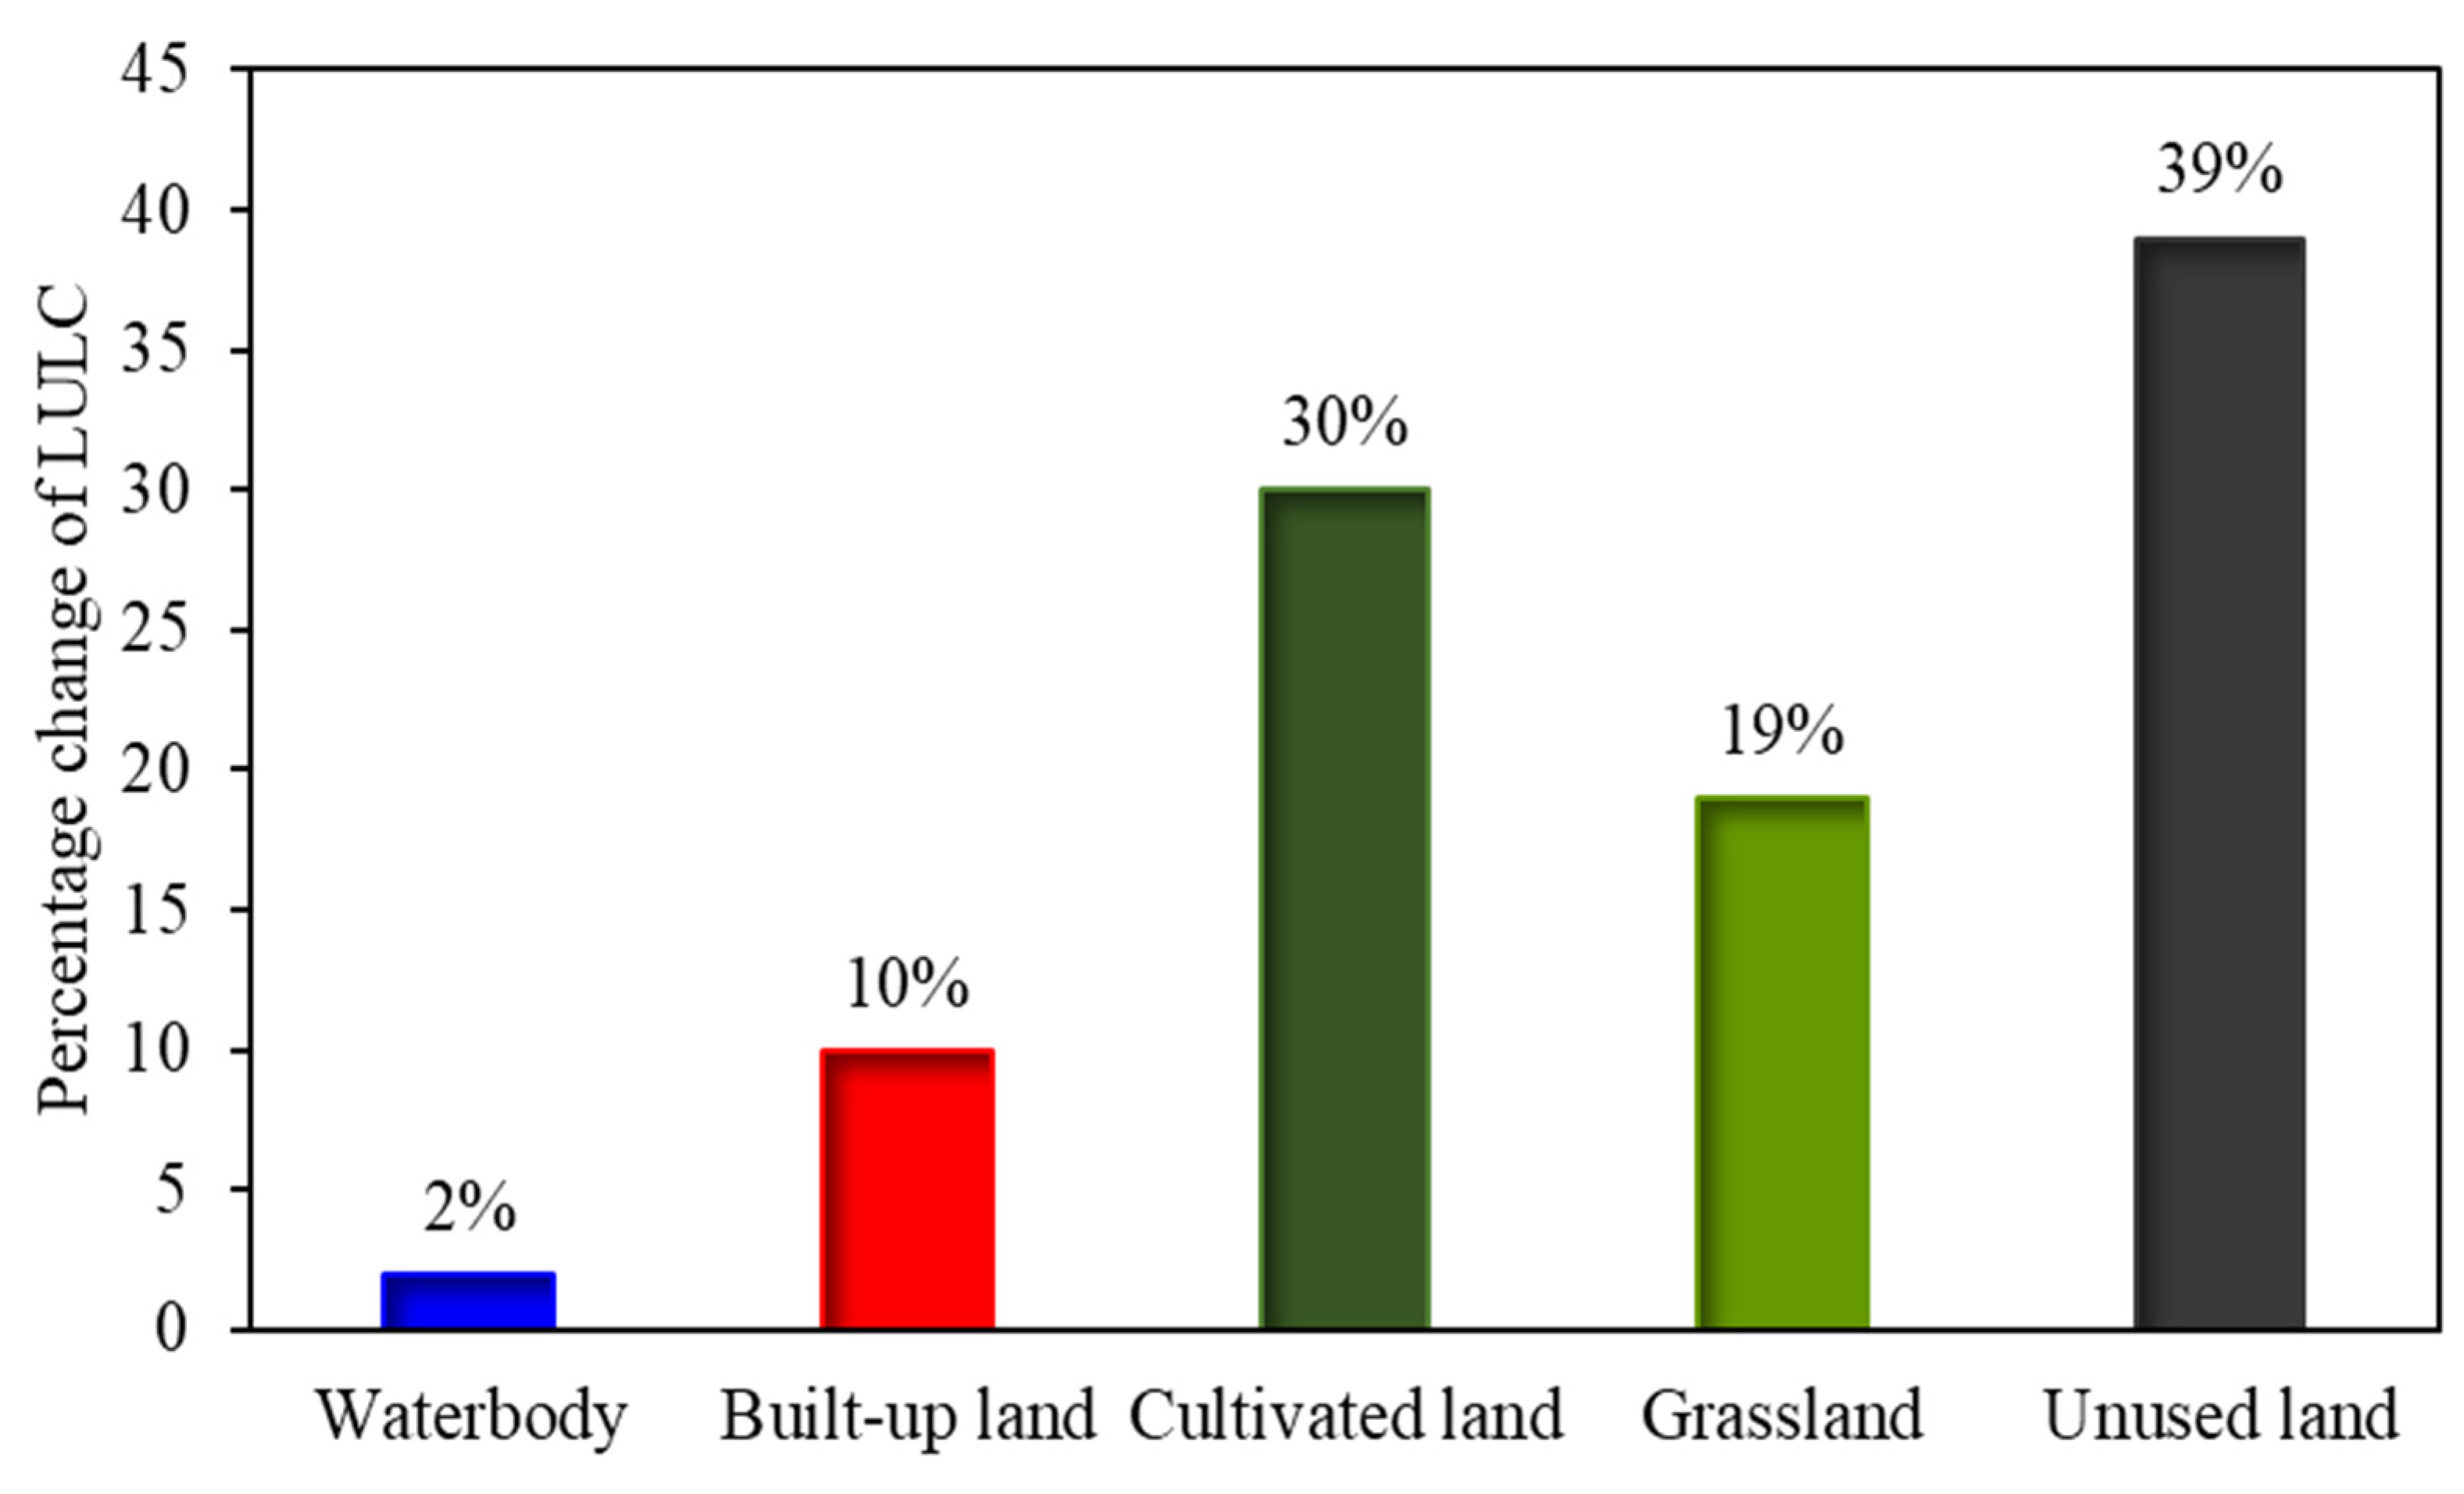
Figure 5 shows the data on the percentage change in LULC in the study region. The research area’s LULC map is divided into six main categories: agriculture, wetlands, forests, settlements, sparse vegetation, and bare regions. A total of 30% of the research area is made up of cultivated land, 19% is covered with scant vegetation or grassland, 39% is unused land, and 10% is built-up land, while only 2% is covered with water body (Figure 5). Figure 4f show the qualitative and quantitative ranking of LULC influencing GW recharge within the thematic map. The pattern of land use on any given terrain is one of the most important parameters for geo-hydrological study since it provides insight into the intricate physical processes. With classifications among itself, land-use and land-cover features manage and regulate the storage of subsurface water and the responsible factors for infiltration for groundwater recharging. Land use and land cover have a significant impact on how water behaves on surfaces, either by reducing runoff, facilitating, or blocking water. Agriculture, bodies of water, and dry land are thought to exhibit a moderate to good GW viewpoint. Due to the lack of any infiltration surfaces, settlements, rocky outcrops, and scrubland displayed moderate to extremely low probabilities of GW occurrence.
In the study region, as shown in Figure 4g, the rainfall has the greatest influence on the potential for GW recharge. Naturally, GW recharge rises as precipitation levels do. Due to natural recharge, areas with significant rainfall have a higher GW potential than those with low rainfall [39]. The study area experiences annual rainfall ranging from 97 to 987 mm and greater amounts are frequently recorded in the northern cities of Rawalpindi and Gujranwala. Ref. [5] reported that the rainfall in Rawalpindi and Gujranwala ranges from 82 to 847 mm/year. Furthermore, One important terrain element, slope, articulates the gradient from the surface of the ground and provides a crucial parameter for understanding the natural characteristics of geologic and geodynamic processes, particularly those that operate at the regional scale [40]. The slope of a given area is calculated from an elevation map in raster format made from a DEM by calculating the maximum rate of range variation between each cell and its related surrounding cells. While, a lower range of slope values mimics the flatter terrain or surface of a particular place, a higher range of slope values denotes steeper terrain. The slope of the ground surface, or change in height over a predetermined distance, is represented by the topographical parameter (T). The topography affects how pollutants are transported, such as through surface runoff or infiltration into the soil. Higher sloped areas offer greater potential for runoff and less capacity for pollution infiltration [41]. The gentle slope indicates higher groundwater potential [42]. The study area’s slope, as shown in Figure 4h, was divided into five primary classes, ranging from 0 to 0.35, 0.35 to 1.43, 1.43 to 4.28, 4.28 to 9.18, and 9.18 to 20.7% rise, which are in good agreement.

3.2. Groundwater Potential Zones (GWPZs) Assessment

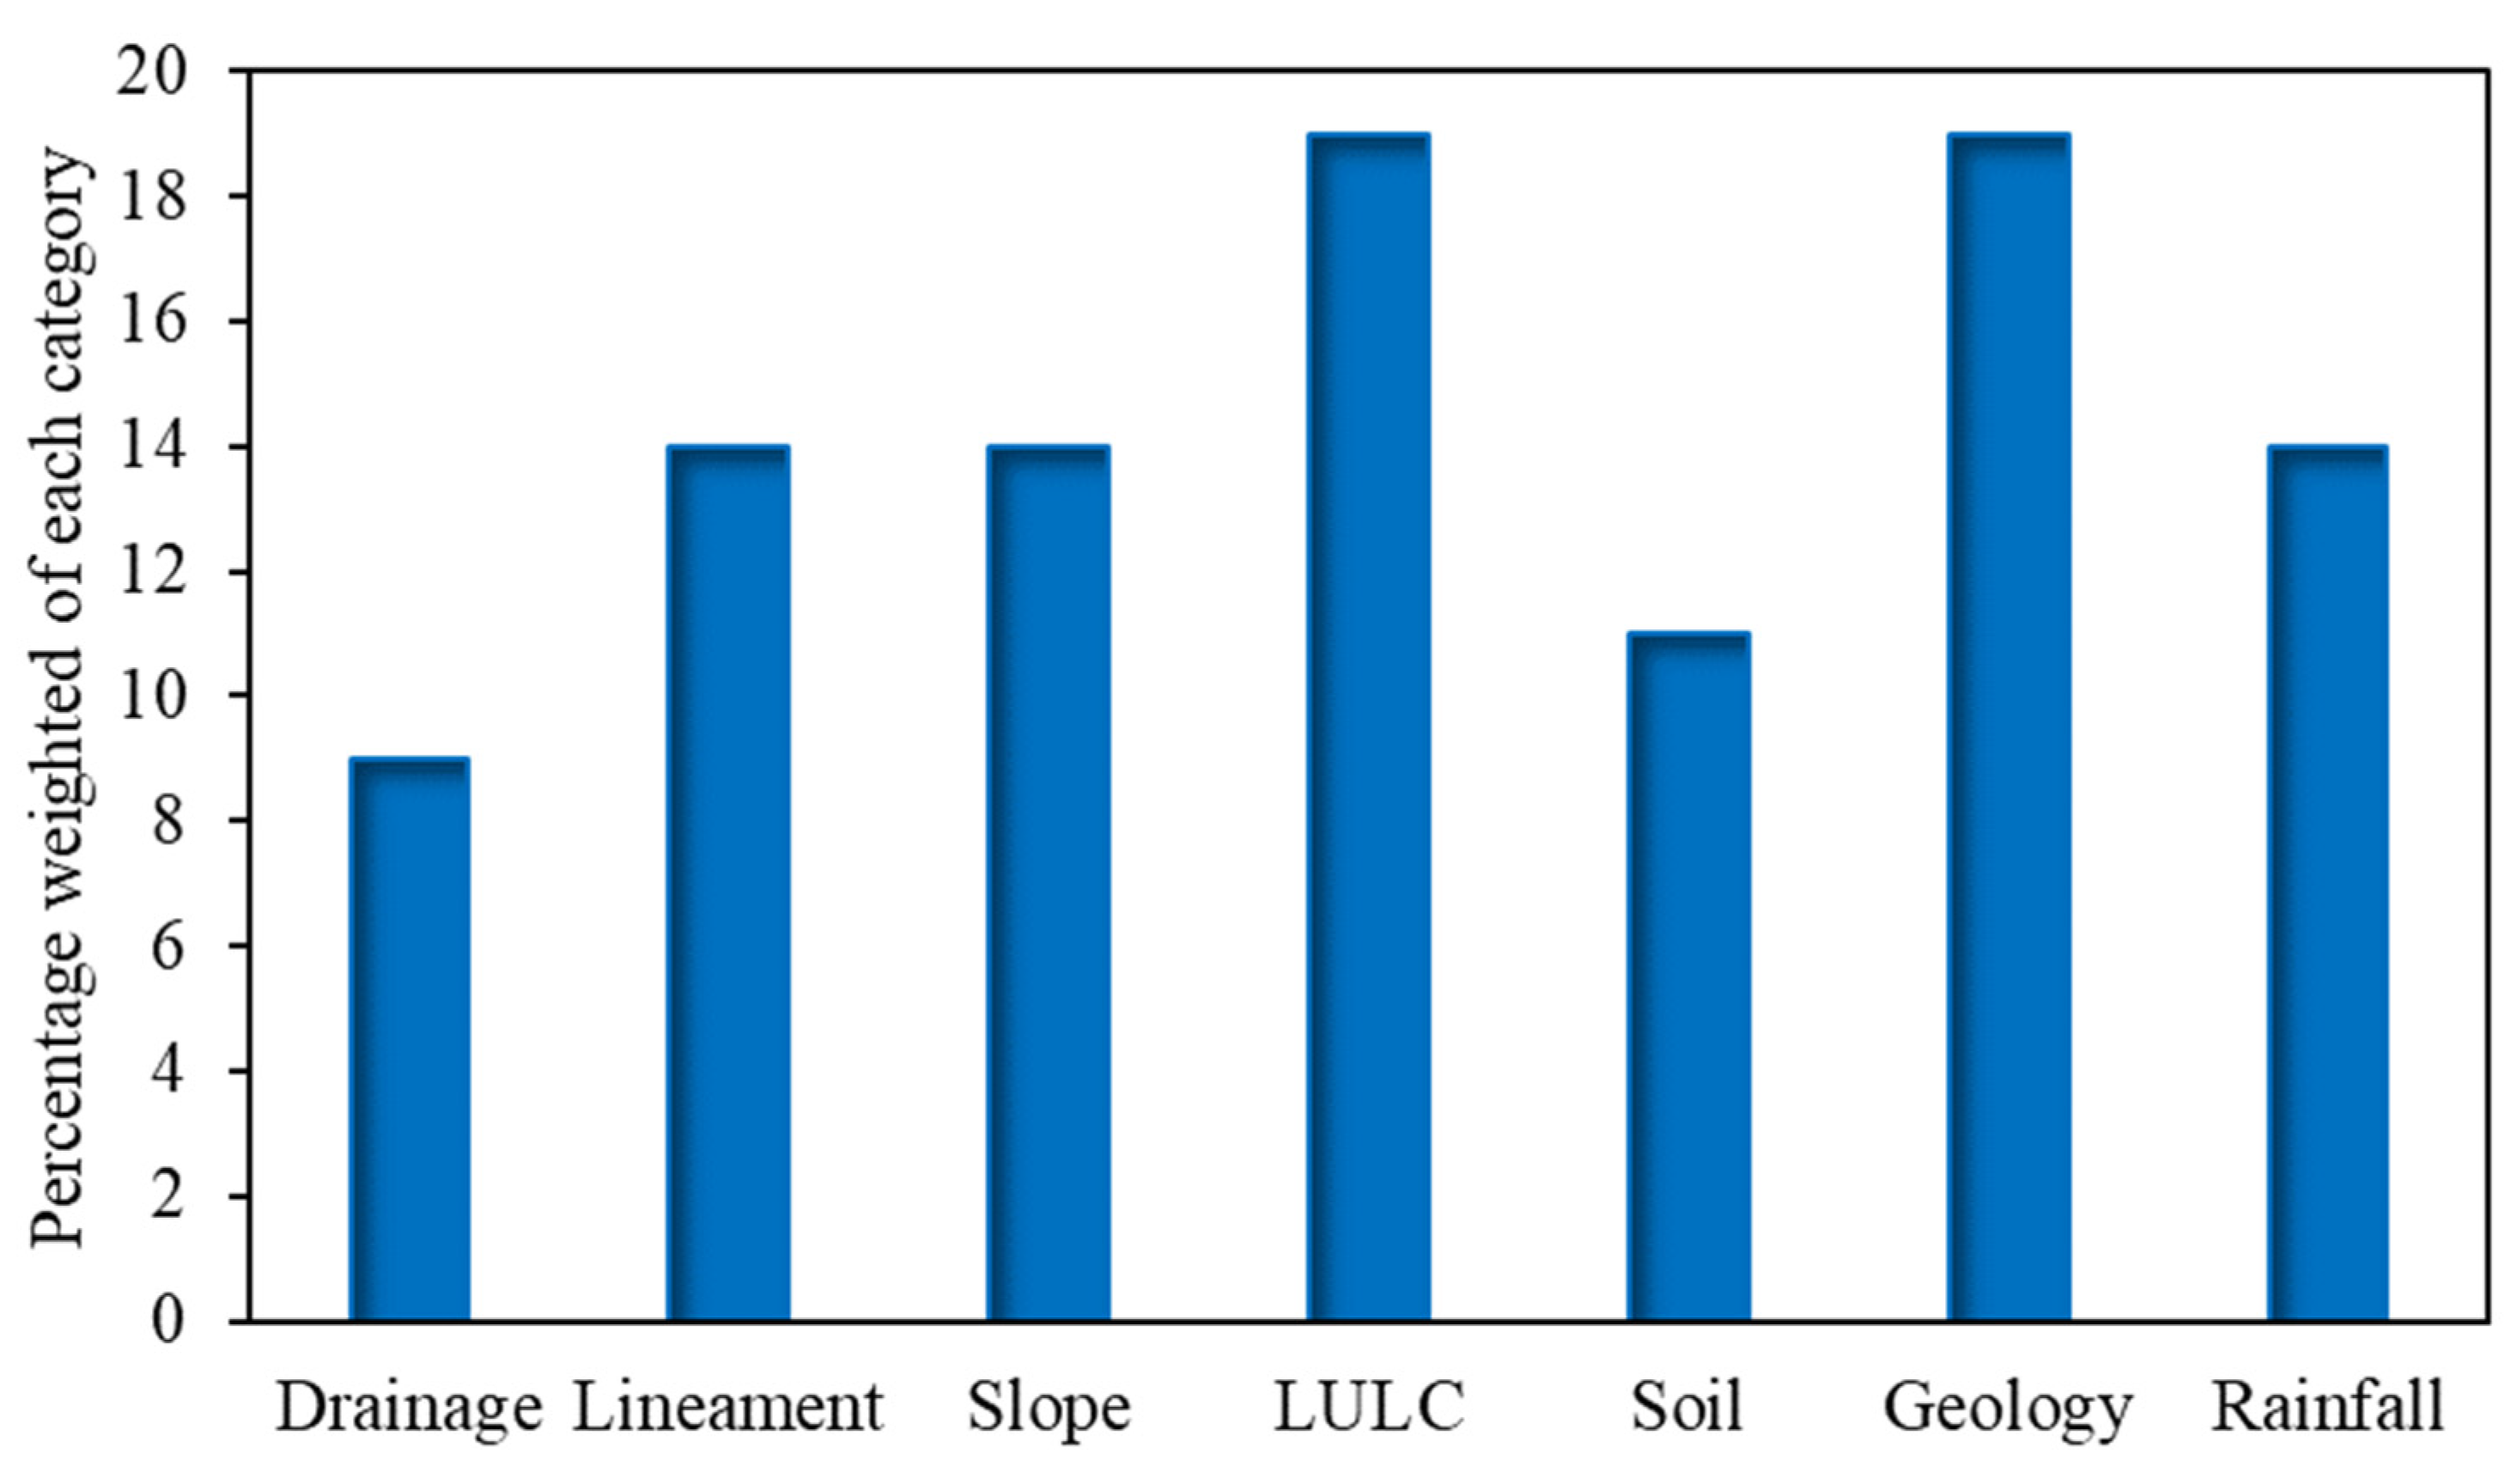
To create GW potential index values, the ArcGIS platform’s weighted overlay analysis tool was utilized. Table 8 provides the weight for the various layers and the ranks that were allocated. It was found that a maximum normalized weight of 0.194 was found for LULC and geology, while a minimum normalized weight (0.084) was observed for drainage density. The subsurface formation such as soil types, rocks, and pore spaces may affect the geology of the area; therefore, geology was categorized as the leading factor based on the normalized weight value of 0.194, while the proximity to LULC was also ranked as the highest accounted factor, with a normalized weight of 0.194 for GW existence (Table 8). The weighted overlay analysis, available in the spatial analysis tool on the platform of ArcGIS, and the zonation map (classification) of the prospective GW was successfully performed and prepared. Furthermore, Table 9 shows the qualitative and quantitative ranking of the slope influencing GW recharge within the thematic map.
GWPZs were divided into five categories based on their output: very low, low, moderate, high, and very high. The classification based on the ranking order showed that lower numbers in the ranking order will represent the high potential zones, while higher numbers will show the low potential zones. The importance of each theme is based on how closely it relates to identifying GWPZs. Finally, the GW potential index (GWPI), as shown in Table 10, was created by integrating seven different thematic maps. Figure 6 shows the percentage weighted of each category selected for preparing thematic maps of GW recharge zones. The maximum percentage weight was selected as 19% for geology and LULC.
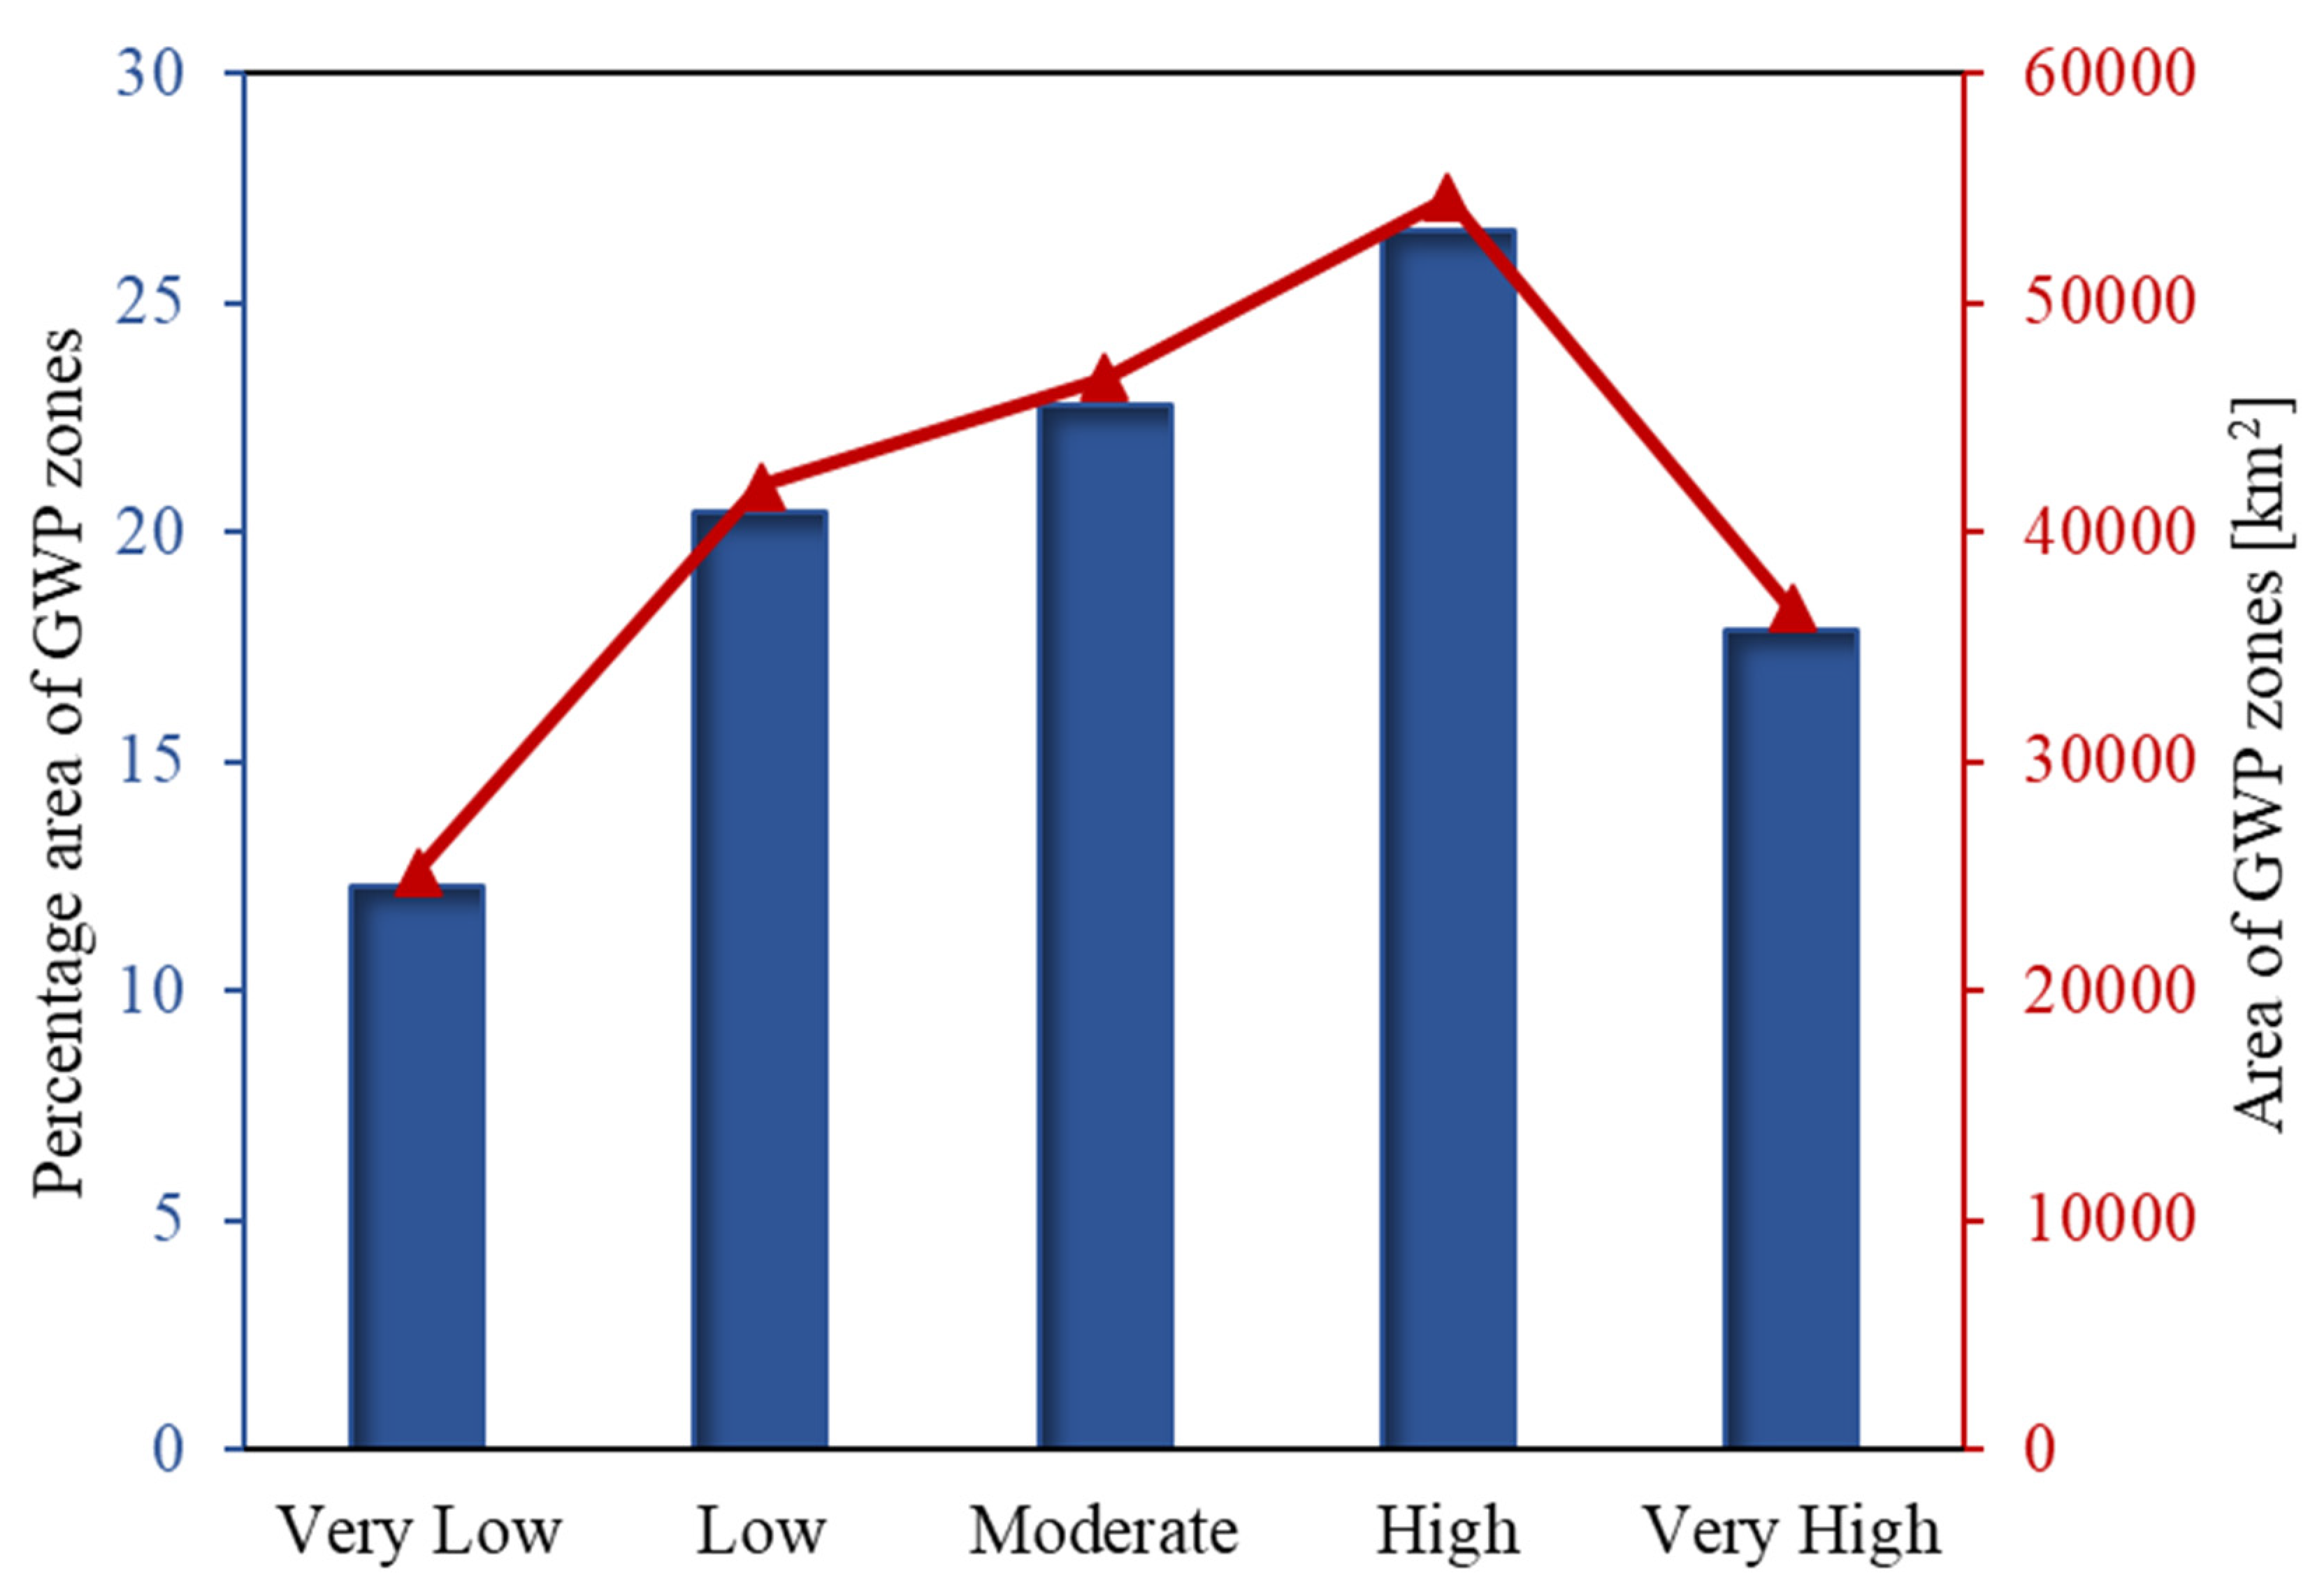
The study has attempted knowledge-based ranking for each subsection class for each thematic layer through the proposed weighted overlay analysis course, along with weightage for all the factors influencing thematic layers. In the study region, five different GWPZs, very high, high, moderate, low and very low, were found. It was given based on their significant contribution towards the subsurface water potentiality or development in a particular domain. Figure 7 displays a map of the study area’s GW prospective zone. According to the GWPZs, very high GW potential zones covered about (36,720 km2), high GWPZs covered about (54,610 km2), moderate GW potential zones covered about (46,751 km2), low GW potential zones covered about (42,060 km2), and very low GW potential zones covered about (25,203 km2), as depicted in Figure 7. Finally, Figure 8 shows potential GW recharge zones in percentage area and actual area in km2 of Punjab province. The spatial analysis indicated that very high groundwater potential with GWPI values of 0.25–0.31 was observed in the central part of the study. The low and very low GWPI values were observed in the southeastern part of the study. It was observed that a low GWPZ was observed in the southern part (Bahawalpur, DG Kan, Rajanpur, Bhakhar and Layyah) of the area. Furthermore, very low groundwater potential was found in the highland of the of Rajinpur and DG Khan. The lower groundwater potential in that area is due to the higher slope as it has a higher runoff potential and lower infiltration capacity. Overall, the results showed that most of the area of province Punjab (Pakistan) has good groundwater potential.
The percentage area of GW potential recharge zones falls in the category of very low (12.27%), low (20.48%), moderate (22.77%), high (26.59%), and very high (17.88%). In addition, the area in km2 falls in the category of very low (25,203 km2), low (42,060 km2), moderate (46,751 km2), high (54,610 km2), and very high (36,720 km2). In the literature, ref. [21] investigated GW potential zones in Lower Dir District by employing GIS and RS techniques with multi-criteria analysis. The potential GW zones were categorized from very high to poor. The results disclosed that areas of 113.10 km2, 659.38 km2, 674.68 km2, and 124.17 km2 fall in the category of very high, high, good, and poor potential GW zones, respectively. The results of the present study agree with the findings reported in the literature. Ref. [3] investigated GWPZs by using GIS and RS techniques for Arkavathi sub-watershed, Karnataka, India. The GWPZs were made by categorizing five classes from very poor to moderate. Their results showed that very poor GWPZs contain 12.24% of the area and poor GWPZs contain 23.86% of the area. On the other hand, 8.614% of the area has very high GWP and 23.872% of the area has high GWP, whereas 31.40% of the area has moderate GWP. Ref. [43] explored GW potential zones using GIS and RS techniques in Karha river basin, Maharashtra, India. The results of GWPZs were reclassified into four categories, such as excellent, good, moderate, and poor, which showed 21.96% (285.43 km2), 28.82% (374.49 km2), 10.81% (140.46 km2), respectively. Thus, delineated GWPZs can be considered as potential pockets for the storage of freshwater (rainfall and canal water) resources into the groundwater for later use or during a drought period.

4. Discussion

The research region has a significant number of both major (macro level) and small (micro level) lineaments. Complex lineament density areas facilitate GW penetration, recharge, and have favorable prospects for GWPZs. From the satellite data, the lineaments of the research region have been traced. Before individual lineaments, lineament density has a stronger scientific relationship with GW productivity. The relationship of drainage density to surface water runoff and drainage density to permeability leads to its interpretation as the proximity or spacing of river channel or stream networks. It is thought to be an inversely linked function of the subsurface permeability of water [19]. The drainage features of the basin control have an impact on the hydrological condition of any specific area below ground, which ultimately results in the formation of a desired GW condition. Due to the stream’s close ties to above-ground runoff and permeability, it may be possible to indirectly infer the favorable GW potential. Rainfall would infiltrate less deeply into the rock if it were more permeable, but this would result in more surface run-off. When there is dense vegetation, weak or impermeable subsurface material, and low relief, there is typically less drainage density present. Conversely, there is typically greater drainage density present where there is sparse vegetation, weak or impermeable subsurface material, and steep relief [44]. Because most of the water during rainfall is quickly discharged as surface runoff with little to no penetration into the earth, the location where there is a dense cluster of streams is typically considered to have poor GW prospects [31].
A geological formation’s porosity and permeability determine its suitability as an aquifer. Sedimentary rocks are produced when naturally occurring material on the surface of the earth is compacted over time by several geomorphological processes. Due to soil erosion, these sedimentary rocks are thought to have an extremely higher porosity than crystalline igneous rocks, which have a porosity of less than 3% [31]. However, fracturing in hard rocks, such as igneous rock, can act as aquifers, greatly enhancing the capacity for storing water below the surface. These aquifers become pointers of secondary permeability and porosity, which are most commonly sought when prospecting for underground water in such types of terrains [31]. One of the most important factors is geomorphological study that helps researchers to determine the status of the surface and the accessibility of GW [38]. The process of geomorphological mapping includes the identification and classification of numerous landforms and structural elements that are conducive to the appearance of GW. To determine whether permeable or porous zones exist, research linking the formation of landforms and geology has proven extremely important. Precise classifications of the geomorphological terrain that lead to accurate hydro-morphological demarcation and take into account both morphological and lithological elements are necessary for the efficient evaluation of subsurface water resources [45].
The soil is a large naturally occurring resource that is a key factor in determining the prospective location for GW. It also plays a crucial role in determining the subsurface water recharge, and the soil meets the basic requirements of all agricultural activities. The characteristics of the topsoil not only control how quickly surface water percolates into the subsurface water system, but they are also closely related to how quickly water percolates, or whether it is permeable, which directly influences how much water can percolate and be held. The potential zone is indicated by the permeability and wetness of the soil. Clayey loam and loamy clay are thought to have a moderate effect for GW potential, while clay soils act poorly in support of storing the subsurface water [46].
LULC oversees controlling a variety of hydro-geological processes, particularly those that affect the water cycle, such as evapotranspiration, infiltration, surface runoff, and many others. Different types of surface land cover make the surface rougher, which lowers discharge and increases infiltration, which increases the amount of groundwater available [45]. However, in urban built-up land-use areas, the rate of water infiltration may be slower due to concrete surfaces that hinder rainwater from absorbing into the ground [46]. In forest land cover areas, the water penetration would be greater due to reduced runoff. Rainfall is the main factor that determines whether a region has good groundwater resources. The amount of rainfall that occurred in a particular region has a significant impact on the amount of water that would be accessible to infiltrate into the earth to generate GW [47]. It is an undeniable fact that a region’s rainfall is the primary source for the materials needed for the hydrologic cycle, which is also essential to the natural water cycle. Rainfall plays a crucial role in hydrologic cycle, controlling, regulating, and managing the GW perspective of a certain region. Therefore, it has been established that, while analyzing the detection of potential GW in any location, areas with very high rainfall should be given a higher weighted status than areas with little rainfall.
The actual GW condition of any specific location is clearly reflected in the GW table level during the pre-monsoon season and after the monsoon season. A higher GW fluctuation reveals superior recharging capacity, which in turn represents the good potentiality section of GW, whereas a lower GW fluctuation exposes low recharge capacity, which denotes a bad GW prospective region. Diverse natural and man-made variables affect the level of GW. The distribution of GW affects natural factors such as the quantity and rate of annual precipitation, timing of the rain, temperature, percentage of evaporation, drought stress, slope of the land, porosity and non-permeability of rocks, land cover, and water-absorbing properties of soil, among others. The level of GW is influenced by artificial variables such as land use, dominant and dense population, dispersion of settlement, cultivation pattern, degree of education, etc. The GW level of the study region is suffering greatly from both natural and artificial variables, which are given below. The primary determining factor for GW potential zoning is geomorphology. It develops from land features on the surface, such as mountains, plateaus, plains, valleys, etc. The geomorphology of the area affects GW recharge, transmission, and discharge. The reduced elevation of the surface increases the water percolation capacity. Water percolation and the concentration of GW levels are improved when the surface water is held back or flows courteously over the plain area. Land use patterns describe the varied ways that land is used for different situations. It serves both agricultural and non-agricultural applications, including covering vegetation, grazing, etc. The vegetation area benefits the level of the GW. Thus, water can simply percolate to the land’s surface thanks to the tree roots’ assistance in loosening the rock and soil. Additionally, trees prevent water from directly evaporating through the soil. One of the important factors directly influenced by the distribution and change in the GW level is the population. The natural resource of a country is its population, yet the biggest issue is overpopulation. According to a 2010 WHO report, the average person uses 20 L of water each day. So, as the population grows, so does the demand for surface water and GW. One of the most important necessities for humans is shelter. Settlements are defined as buildings, dwellings, groups of houses, abodes, habitations, etc. Settlement, like population, is forceful and regulates GW levels by heavily utilizing GW for domestic reasons. Primary, secondary, tertiary, quaternary, economic activities are included in the occupational hierarchy, which affects the groundwater level of the region. Out of these, the primary and secondary economic sectors utilize water. Secondary activities include manufacturing and processing industries, home industries, building, etc., while primary activities include farming, fishing, hunting, mining, raising animals, etc. The process of social development is accelerated by education, which also helps individuals acquire specific skills and occupational competence. Education is the instrument for socioeconomic change and transformation. It makes people more aware of social and economic issues and aids in changing and modifying attitudes toward social responsibility. Therefore, both the rise and fall of GW levels is significantly influenced by education.

5. Conclusions

The Punjab (Pakistan) region’s groundwater (GW) supplies have been badly overused due to the growing population of the province and growth of agricultural land use. Sustainable GW supplies require better management techniques and artificial recharge. The results of the present study demonstrated that the AHP technique works in a GIS framework to estimate groundwater (GW) potential zones. This study examined the combined use of an RS- and GIS-based AHP approach to identify and forecast probable GWPZs. The results indicated that with the aid of different influencing factors, including drainage density, geology, rainfall, LULC, soil, slope, and lineament density, the GWPZs for a certain location can be determined. The results showed that Punjab comprises more than 26.59%, 22.77%, and 17.88% (total = 67.24%) of the area and falls within the moderate, high, and very high GWPZs. Only 12.27% of the land in Punjab falls under the very low GW potential zone. The spatial analysis indicated that very high groundwater potential with GWPI values of 0.25–0.31 was observed in the central part of the study. The low and very low GWPI values were observed in the southeastern part of the study. The results also demonstrated that the AHP is an effective tool for interpreting GW potential zones for appropriate GW management in various hydro-geological environments. Maps of GW potential zones are useful for the planning and management of GW resources in the study region. The integrated mapping may be helpful for identifying priority locations for the execution of government and private water conservation schemes and programs and for the sustainable development of GW.

Author Contributions

Conceptualization, Maira Naeem, Hafiz Umar Farid, Raffaele Albano, and Muhammad Azhar Inam; methodology, Maira Naeem and Muhammad Arbaz Madni; software, Maira Naeem, Raffaele Albano and Muhammad Shoaib 1; formal analysis, Maira Naeem, Muhammad Shoaib 2, Hafiz Umar Farid and Muhammad Azhar Inam; data curation, Tehmena Rashid, Aqsa Dilshad and Akhlaq Ahmad; writing—original draft preparation, Maira Naeem and Hafiz Umar Farid; writing—review and editing, Muhammad Azhar Inam, Muhammad Arbaz Madni, Raffaele Albano, Muhammad Shoaib 1, Aqsa Dilshad, Tehmena Rashid and Akhlaq Ahmad; funding acquisition, Raffaele Albano. All authors have read and agreed to the published version of the manuscript.

Funding

This research received no external funding.

Data Availability Statement

Data will be made available from the corresponding author on reasonable request.

Acknowledgments

Firstly, we would like to express our sincere gratitude to Department of Agricultural Engineering, Bahauddin Zakariya University, Multan, Pakistan, for the constant support during this research. The study is possible due to availability of free satellite data by the United State Geological Survey (USGS). The authors are grateful to their authority.

Conflicts of Interest

The authors declare no conflicts of interest.

References

  1. Owolabi, S.T.; Madi, K.; Kalumba, A.M.; Orimoloye, I.R. A groundwater potential zone mapping approach for semi-arid environments using remote sensing (RS), geographic information system (GIS), and analytical hierarchical process (AHP) techniques: A case study of Buffalo catchment, Eastern Cape, South Africa. Arab. J. Geosci. 2020, 13, 1–17. [Google Scholar] [CrossRef]
  2. Rakhshanda, S.; Gohar, A.M. Isma Younes Appraisal of Ground Water Potential through Remote Sensing in River Basin, Pakistan. Int. J. Econ. Environ. Geol. 2018, 9, 25–32. [Google Scholar]
  3. Saravanan, S.; Saranya, T.; Abijith, D.; Jacinth, J.J.; Singh, L. Delineation of groundwater potential zones for Arkavathi sub-watershed, Karnataka, India using remote sensing and GIS. Environ. Chall. 2021, 5, 100380. [Google Scholar] [CrossRef]
  4. Tamiru, H.; Wagari, M. Evaluation of data-driven model and GIS technique performance for identification of Groundwater Potential Zones: A case of Fincha Catchment, Abay Basin, Ethiopia. J. Hydrol. Reg. Stud. 2021, 37, 100902. [Google Scholar] [CrossRef]
  5. Arshad, A.; Zhang, Z.; Zhang, W.; Dilawar, A. Mapping favorable groundwater potential recharge zones using a GIS-based analytical hierarchical process and probability frequency ratio model: A case study from an agro-urban region of Pakistan. Geosci. Front. 2020, 11, 1805–1819. [Google Scholar] [CrossRef]
  6. Nasir, M.J.; Khan, S.; Zahid, H.; Khan, A. Delineation of groundwater potential zones using GIS and multi influence factor (MIF) techniques: A study of district Swat, Khyber Pakhtunkhwa, Pakistan. Environ. Earth Sci. 2018, 77, 1–11. [Google Scholar] [CrossRef]
  7. Famiglietti, J.S. The global groundwater crisis. Nat. Clim. Chang. 2014, 4, 945–948. [Google Scholar] [CrossRef]
  8. Achu, A.L.; Thomas, J.; Reghunath, R. Multi-criteria decision analysis for delineation of groundwater potential zones in a tropical river basin using remote sensing, GIS and analytical hierarchy process (AHP). Groundw. Sustain. Dev. 2020, 10, 100365. [Google Scholar] [CrossRef]
  9. Yeh, H.F.; Lee, C.H.; Hsu, K.C.; Chang, P.H. GIS for the assessment of the groundwater recharge potential zone. Environ. Geol. 2009, 58, 185–195. [Google Scholar] [CrossRef]
  10. Abdelouhed, F.; Ahmed, A.; Abdellah, A.; Yassine, B.; Mohammed, I. Using GIS and remote sensing for the mapping of potential groundwater zones in fractured environments in the CHAOUIA-Morocco area. Remote Sens. Appl. Soc. Environ. 2021, 23, 100571. [Google Scholar] [CrossRef]
  11. Andualem, T.G.; Demeke, G.G. Groundwater potential assessment using GIS and remote sensing: A case study of Guna tana landscape, upper blue Nile Basin, Ethiopia. J. Hydrol. Reg. Stud. 2019, 24, 100610. [Google Scholar] [CrossRef]
  12. Duguma, T.A. RS and GIS analysis of the groundwater potential zones in the Upper Blue Nile River Basin, Ethiopia. J. Hydrol. Reg. Stud. 2023, 46, 101344. [Google Scholar] [CrossRef]
  13. Saranya, T.; Saravanan, S. Groundwater potential zone mapping using analytical hierarchy process (AHP) and GIS for Kancheepuram District, Tamilnadu, India. Model. Earth Syst. Environ. 2020, 6, 1105–1122. [Google Scholar] [CrossRef]
  14. De Filippis, G.; Pouliaris, C.; Kahuda, D.; Vasile, T.A.; Manea, V.A.; Zaun, F.; Panteleit, B.; Dadaser-Celik, F.; Positano, P.; Nannucci, M.S. Spatial data management and numerical modelling: Demonstrating the application of the QGIS-integrated FREEWAT platform at 13 case studies for tackling groundwater resource management. Water 2019, 12, 41. [Google Scholar] [CrossRef]
  15. Behroozmand, A.A.; Auken, E.; Knight, R. Assessment of Managed Aquifer Recharge Sites Using a New Geophysical Imaging Method. Vadose Zo. J. 2019, 18, 1–13. [Google Scholar] [CrossRef]
  16. Arulbalaji, P.; Padmalal, D.; Sreelash, K. GIS and AHP Techniques Based Delineation of Groundwater Potential Zones: A case study from Southern Western Ghats, India. Sci. Rep. 2019, 9, 2082. [Google Scholar] [CrossRef] [PubMed]
  17. Fashae, O.A.; Tijani, M.N.; Talabi, A.O.; Adedeji, O.I. Delineation of groundwater potential zones in the crystalline basement terrain of SW-Nigeria: An integrated GIS and remote sensing approach. Appl. Water Sci. 2014, 4, 19–38. [Google Scholar] [CrossRef]
  18. Albano, R.; Mancusi, L.; Adamowski, J.; Cantisani, A.; Sole, A. A GIS tool for mapping dam-break flood hazards in Italy. ISPRS Int. J. Geo-Inf. 2019, 8, 250. [Google Scholar] [CrossRef]
  19. Gnanachandrasamy, G.; Zhou, Y.; Bagyaraj, M.; Venkatramanan, S.; Ramkumar, T.; Wang, S. Remote Sensing and GIS Based Groundwater Potential Zone Mapping in Ariyalur District, Tamil Nadu. J. Geol. Soc. India 2018, 92, 484–490. [Google Scholar] [CrossRef]
  20. Khan, U.; Faheem, H.; Jiang, Z.; Wajid, M.; Younas, M.; Zhang, B. Integrating a GIS-Based Multi-Influence Factors Model with Hydro-Geophysical Exploration for Groundwater Potential and Hydrogeological Assessment: A Case Study in the Karak Watershed, Northern Pakistan. Water 2021, 13, 1255. [Google Scholar] [CrossRef]
  21. Sarwar, A.; Ahmad, S.R.; Rehmani, M.I.A.; Asif Javid, M.; Gulzar, S.; Shehzad, M.A.; Dar, J.S.; Baazeem, A.; Iqbal, M.A.; Rahman, M.H.U.; et al. Mapping groundwater potential for irrigation, by geographical information system and remote sensing techniques: A case study of district lower dir, pakistan. Atmosphere 2021, 12, 669. [Google Scholar] [CrossRef]
  22. Rasool, U.; Chen, J.; Muhammad, S.; Siddique, J.; Venkatramanan, S.; Sabarathinam, C.; Siddique, M.A.; Rasool, M.A. Geoinformatics and geophysical survey-based estimation of best groundwater potential sites through surface and subsurface indicators. Arab. J. Geosci. 2020, 13, 1–17. [Google Scholar] [CrossRef]
  23. Nag, S.K.; Ghosh, P. Delineation of groundwater potential zone in Chhatna Block, Bankura District, West Bengal, India using remote sensing and GIS techniques. Environ. Earth Sci. 2013, 70, 2115–2127. [Google Scholar] [CrossRef]
  24. Kaur, L.; Rishi, M.S.; Singh, G.; Nath Thakur, S. Groundwater potential assessment of an alluvial aquifer in Yamuna sub-basin (Panipat region) using remote sensing and GIS techniques in conjunction with analytical hierarchy process (AHP) and catastrophe theory (CT). Ecol. Indic. 2020, 110, 105850. [Google Scholar] [CrossRef]
  25. Zhu, Q.; Abdelkareem, M. Mapping groundwater potential zones using a knowledge-driven approach and GIS analysis. Water 2021, 13, 579. [Google Scholar] [CrossRef]
  26. Allafta, H.; Opp, C.; Patra, S. Identification of groundwater potential zones using remote sensing and GIS techniques: A case study of the shatt Al-Arab Basin. Remote Sens. 2021, 13, 112. [Google Scholar] [CrossRef]
  27. Agarwal, E.; Agarwal, R.; Garg, R.D.; Garg, P.K. Delineation of groundwater potential zone: An AHP/ANP approach. J. Earth Syst. Sci. 2013, 122, 887–898. [Google Scholar] [CrossRef]
  28. Elvis, B.W.W.; Arsène, M.; Théophile, N.M.; Bruno, K.M.E.; Olivier, O.A. Integration of shannon entropy (SE), frequency ratio (FR) and analytical hierarchy process (AHP) in GIS for suitable groundwater potential zones targeting in the Yoyo river basin, Méiganga area, Adamawa Cameroon. J. Hydrol. Reg. Stud. 2022, 39, 100997. [Google Scholar] [CrossRef]
  29. Sole, A.; Giosa, L.; Albano, R.; Cantisani, A. The laser scan data as a key element in the hydraulic flood modelling in urban areas. Int. Arch. Photogramm. Remote Sens. Spat. Inf. Sci. 2013, 40, 65–70. [Google Scholar] [CrossRef]
  30. Magesh, N.S.; Chandrasekar, N.; Soundranayagam, J.P. Delineation of groundwater potential zones in Theni district, Tamil Nadu, using remote sensing, GIS and MIF techniques. Geosci. Front. 2012, 3, 189–196. [Google Scholar] [CrossRef]
  31. Dekongmen, B.W.; Anornu, G.K.; Kabo-Bah, A.T.; Larbi, I.; Sunkari, E.D.; Dile, Y.T.; Agyare, A.; Gyamfi, C. Groundwater recharge estimation and potential recharge mapping in the Afram Plains of Ghana using SWAT and remote sensing techniques. Groundw. Sustain. Dev. 2022, 17, 100741. [Google Scholar] [CrossRef]
  32. El-Hadidy, S.M.; Morsy, S.M. Expected spatio-temporal variation of groundwater deficit by integrating groundwater modeling, remote sensing, and GIS techniques. Egypt. J. Remote Sens. Sp. Sci. 2022, 25, 97–111. [Google Scholar] [CrossRef]
  33. Githinji, T.W.; Dindi, E.W.; Kuria, Z.N.; Olago, D.O. Application of analytical hierarchy process and integrated fuzzy-analytical hierarchy process for mapping potential groundwater recharge zone using GIS in the arid areas of Ewaso Ng’iro—Lagh Dera Basin, Kenya. HydroResearch 2022, 5, 22–34. [Google Scholar] [CrossRef]
  34. Abdo, H.G.; Vishwakarma, D.K.; Alsafadi, K.; Bindajam, A.A.; Mallick, J.; Mallick, S.K.; Kumar, K.C.A.; Albanai, J.A.; Kuriqi, A.; Hysa, A. GIS-based multi-criteria decision making for delineation of potential groundwater recharge zones for sustainable resource management in the Eastern Mediterranean: A case study. Appl. Water Sci. 2024, 14, 160. [Google Scholar] [CrossRef]
  35. Saaty, T.L. The analytic hierarchy process mcgraw hill, New York. Agric. Econ. Rev. 1980, 70, 10–21236. [Google Scholar]
  36. Tafila, O.; Ranganai, R.T.; Moalafhi, D.B.; Moreri, K.K.; Maphanyane, J.G. Investigating groundwater recharge potential of Notwane catchment in Botswana using geophysical and geospatial tools. J. Hydrol. Reg. Stud. 2022, 40, 101011. [Google Scholar] [CrossRef]
  37. Ahirwar, S.; Malik, M.S.; Ahirwar, R.; Shukla, J.P. Application of Remote Sensing and GIS for Groundwater Recharge Potential Zone Mapping in Upper Betwa Watershed. J. Geol. Soc. India 2020, 95, 308–314. [Google Scholar] [CrossRef]
  38. Avinash, K.; Deepika, B.; Jayappa, K.S. Basin geomorphology and drainage morphometry parameters used as indicators for groundwater prospect: Insight from geographical information system (GIS) technique. J. Earth Sci. 2014, 25, 1018–1032. [Google Scholar] [CrossRef]
  39. Das, S.; Pardeshi, S.D. Integration of different influencing factors in GIS to delineate groundwater potential areas using IF and FR techniques: A study of Pravara basin, Maharashtra, India. Appl. Water Sci. 2018, 8, 197. [Google Scholar] [CrossRef]
  40. Abrams, W.; Ghoneim, E.; Shew, R.; LaMaskin, T.; Al-Bloushi, K.; Hussein, S.; AbuBakr, M.; Al-Mulla, E.; Al-Awar, M.; El-Baz, F. Delineation of groundwater potential (GWP) in the northern United Arab Emirates and Oman using geospatial technologies in conjunction with Simple Additive Weight (SAW), Analytical Hierarchy Process (AHP), and Probabilistic Frequency Ratio (PFR) techniques. J. Arid Environ. 2018, 157, 77–96. [Google Scholar] [CrossRef]
  41. Mogaji, K.A.; Omosuyi, G.O.; Adelusi, A.O.; Lim, H.S. Application of GIS-Based Evidential Belief Function Model to Regional Groundwater Recharge Potential Zones Mapping in Hardrock Geologic Terrain. Environ. Process. 2016, 3, 93–123. [Google Scholar] [CrossRef]
  42. Razavi-Termeh, S.V.; Sadeghi-Niaraki, A.; Choi, S.-M. Groundwater Potential Mapping Using an Integrated Ensemble of Three Bivariate Statistical Models with Random Forest and Logistic Model Tree Models. Water 2019, 11, 1596. [Google Scholar] [CrossRef]
  43. Verma, N.; Patel, R.K. Delineation of groundwater potential zones in lower Rihand River Basin, India using geospatial techniques and AHP. Egypt. J. Remote Sens. Sp. Sci. 2021, 24, 559–570. [Google Scholar]
  44. Khan, A.D.; Ashraf, M.; Ghumman, A.R.; Iqbal, N. Groundwater Resource of Indus Plain Aquifer of Pakistan Investigations, Evaluation and Management. Int. J. Water Resour. Arid Environ. 2018, 7, 52–69. [Google Scholar]
  45. Etikala, B.; Golla, V.; Li, P.; Renati, S. Deciphering groundwater potential zones using MIF technique and GIS: A study from Tirupati area, Chittoor District, Andhra Pradesh, India. HydroResearch 2019, 1, 1–7. [Google Scholar] [CrossRef]
  46. Jat, M.K.; Khare, D.; Garg, P.K. Urbanization and its impact on groundwater: A remote sensing and GIS-based assessment approach. Environmentalist 2009, 29, 17–32. [Google Scholar] [CrossRef]
  47. Usman, M.; Liedl, R.; Kavousi, A. Estimation of distributed seasonal net recharge by modern satellite data in irrigated agricultural regions of Pakistan. Environ. Earth Sci. 2015, 74, 1463–1486. [Google Scholar]
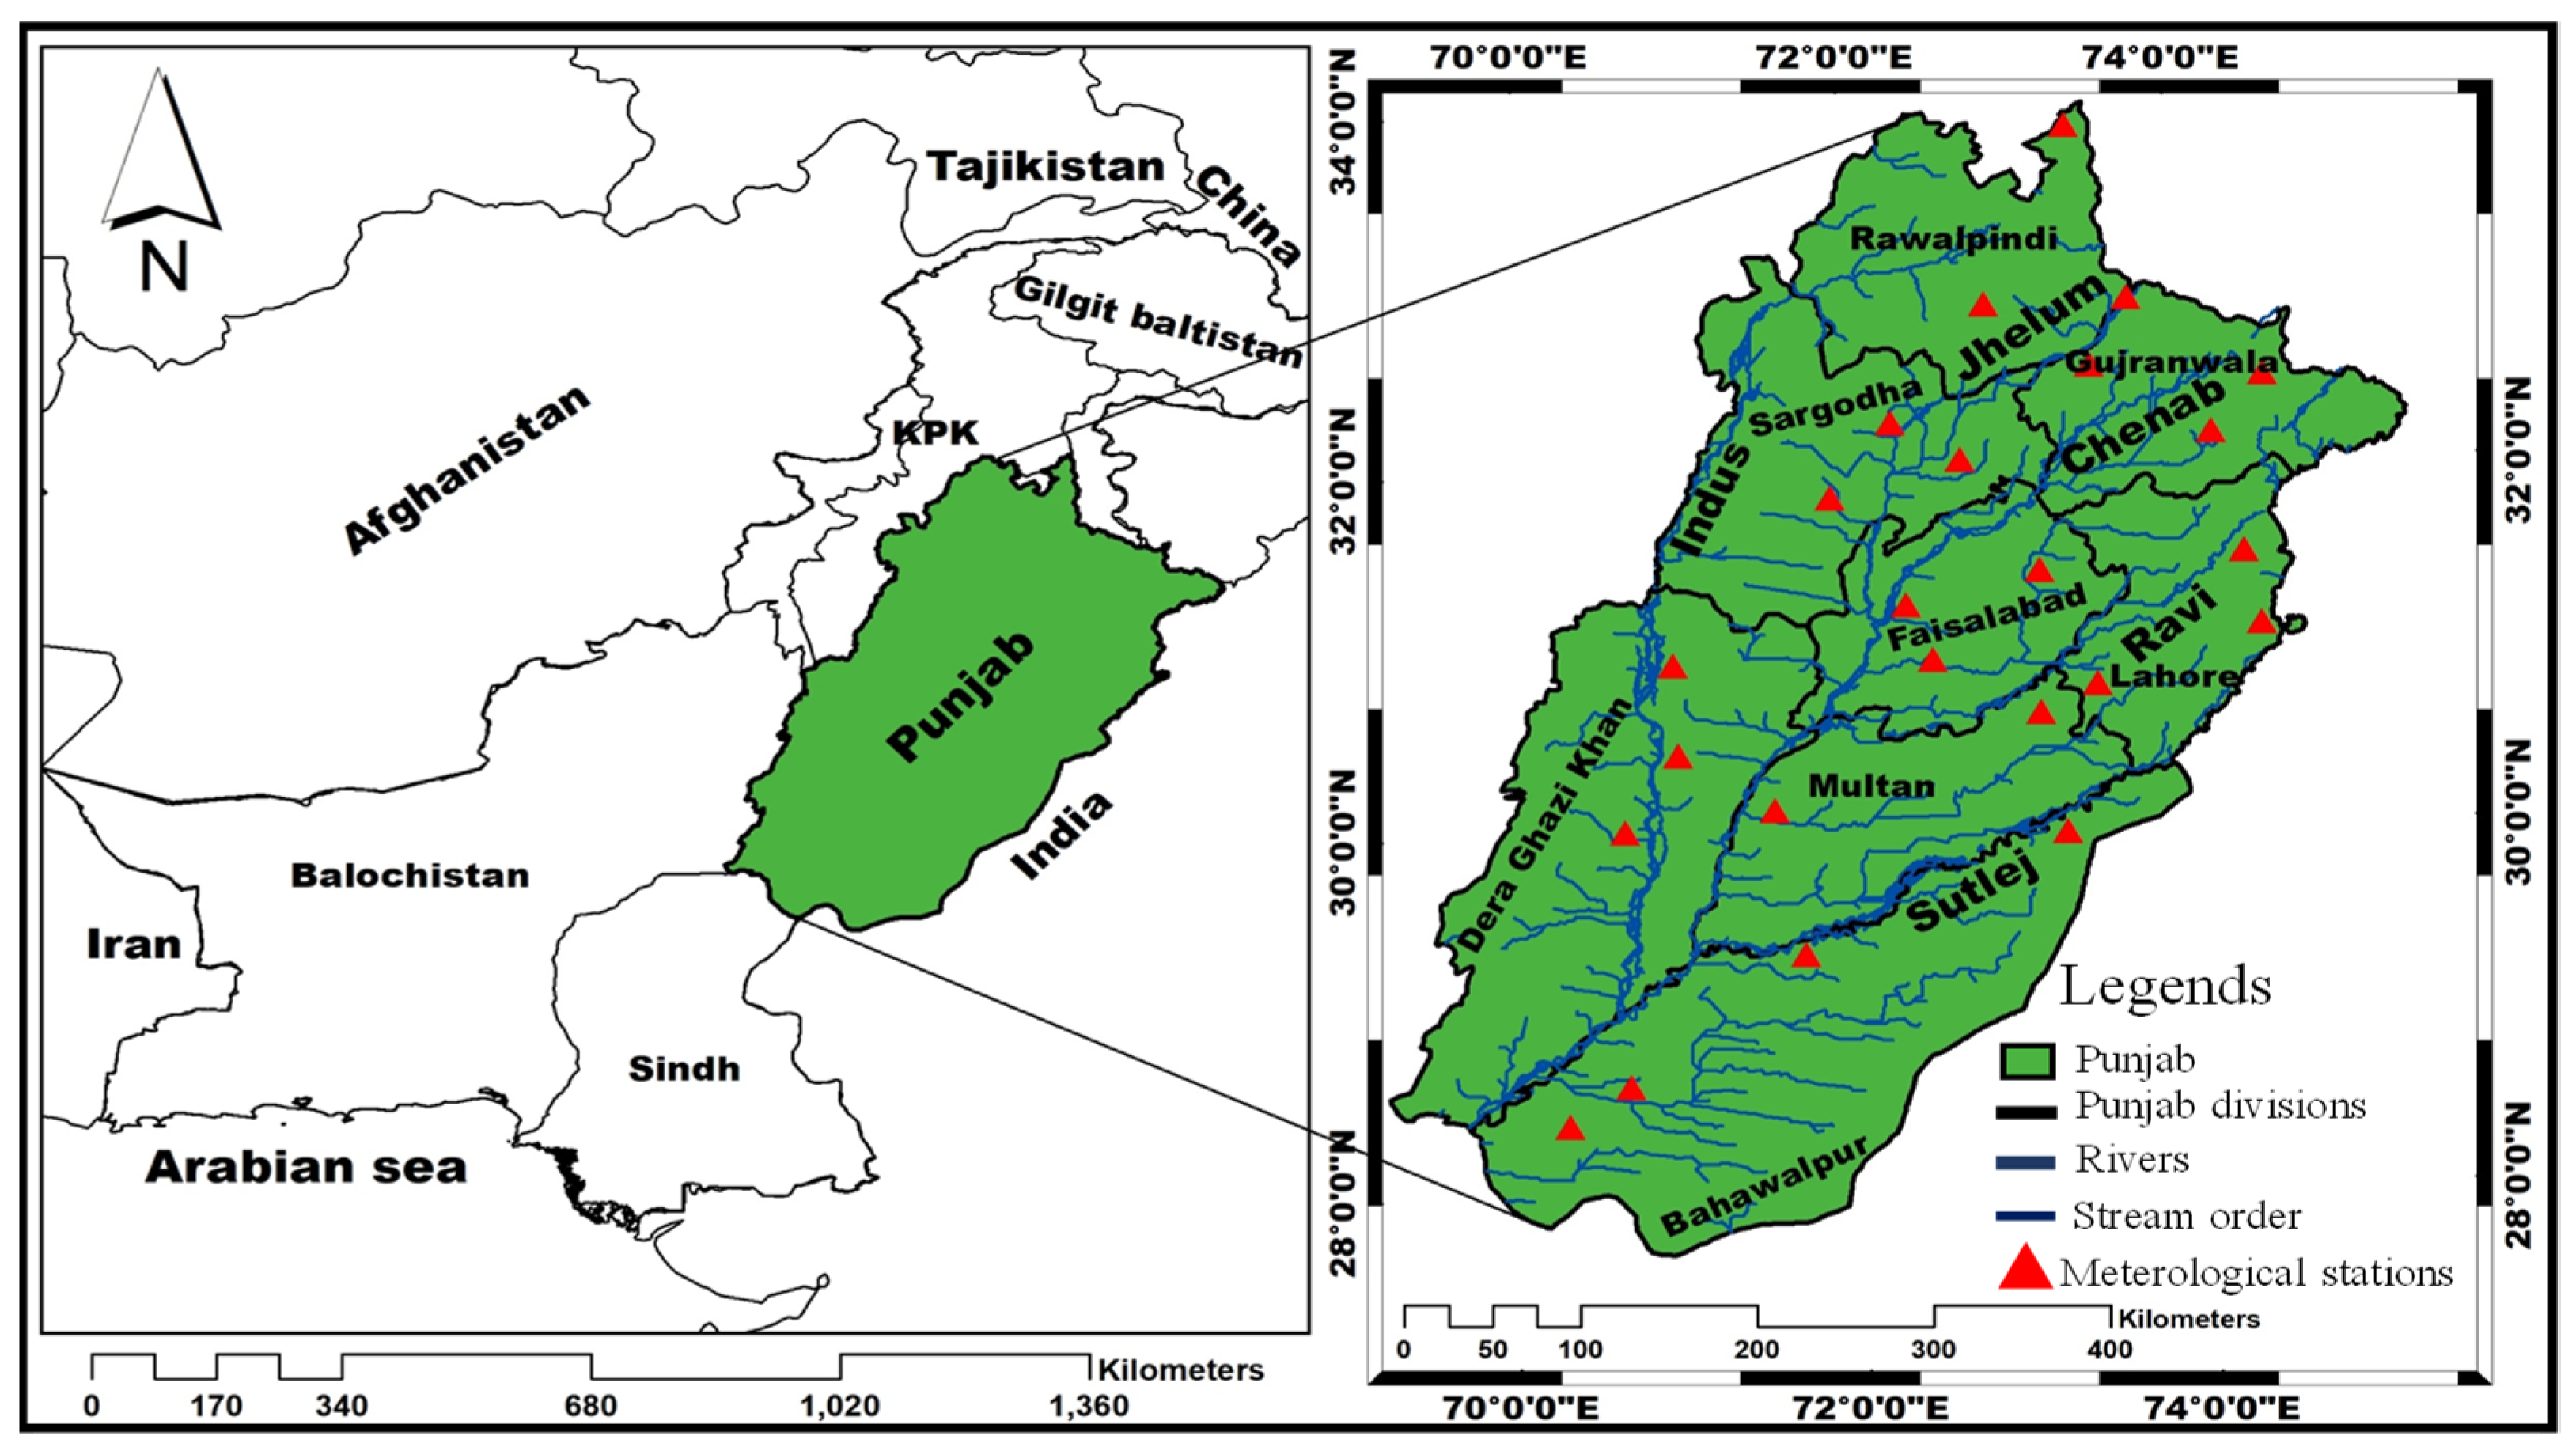
Figure 1. Location of the study area.
Ijgi 13 00317 g001
Figure 2. Flow diagram of the detailed methodology (dotted line differentiate the methodological steps).
Ijgi 13 00317 g002
Figure 3. Relationship between the most influential parameters of GW potential zone.
Ijgi 13 00317 g003
Figure 4. Study area maps of (a) elevation; (b) lineament density; (c) drainage density; (d) geology; (e) soil type; (f) LULC type; (g) rainfall; and (h) slope.
Ijgi 13 00317 g004
Figure 5. Percentage change in land use/land cover (LULC) in the study region.
Ijgi 13 00317 g005
Figure 6. Percentage weighted of each category selected for preparing thematic maps of groundwater recharge zones.
Ijgi 13 00317 g006
Figure 7. Groundwater potential zones (GWPZs) map.
Ijgi 13 00317 g007
Figure 8. Potential groundwater recharge zones in percentage area and actual area in km2 of Punjab province.
Ijgi 13 00317 g008
Table 1. Details of satellite imageries used for the study area.
Sr. No.Acquisition DateRowPathCloud CoverSun AzimuthSun Elevation
125 November 2021148380.5158.9334.57
216 November 2021149377.5159.4335.38
316 November 2021149380.01158.7436.63
416 November 2021149397158.0237.88
516 November 2021149408.23157.2739.11
623 November 2021150364.45160.2332.48
723 November 2021150370.94159.5933.74
823 November 2021150380.1158.9334.99
923 November 2021150390.03158.2536.24
1023 November 2021150400.04157.5537.48
1123 November 2021150410.1156.8138.72
1230 November 2021151378.5159.4832.35
1330 November 2021151380.08158.8433.60
1430 November 2021151390158.1934.85
1530 November 2021151402.6157.5136.09
1630 November 2021151417.13156.8037.33
Table 2. Description of data source used for preparation of thematic layers.
Sr. No.Thematic LayerData SourceData TypeProcessing
1Base mapSurvey of PakistanPolygonSlope in percentage
2DrainageDEM (USGS Website)RasterUsing spatial analyst tool
3LineamentDEM (USGS Website)RasterUsing line density from spatial analyst tool
4SlopeDEM (USGS Website)RasterDigital Elevation Model (DEM)
5LULCLandsat 8 OLIRasterUnsupervised classification
6SoilSoil Survey of PakistanPolygonGeo-referenced and converted into raster data
7GeologyGeological Survey of PakistanPolygonGeo-referenced and converted into raster data
8RainfallPakistan Meteorological Department (PDM)NumberInterpolation of rainfall data using IDW technique
Table 3. Effects of influencing factors proposed relative rates and weights of each influence class.
Sr. No.ParameterMajor Effect
(A)
Minor Effect
(B)
Proposed Relative
Rates (A + B)
Proposed Weight of Each
Influencing Parameter
1Drainage10.51.58.3
2Lineament1 + 10.52.513.9
3Slope1 + 10.52.513.9
4LULC1 + 10.5 + 0.5 + 0.53.519.4
5Soil10.5 + 0.5211.1
6Geology1 + 1 + 10.53.519.4
7Rainfall1 + 10.52.513.9
Total13518100
Table 4. Pairwise comparisons using Saaty’s scale.
Intensity of ImportanceDefinitions
1Equal importance
2Equal to moderate importance
3Moderate importance
4Moderate to strong importance
5Strong importance
6Strong to very strong importance
7Very strong importance
8Very to extremely strong importance
9Extreme importance
Table 5. Degree of Preferences for preparation of thematic layers.
ScaleDegree of PreferencesDescription
1Equally importantThe influence of two factors is equal to the objective
3Slightly importantJudgment and experiences slightly favor a certain factor
5Moderately importantJudgment and experiences moderately favor a certain factor
7Strongly importantJudgment and experiences strongly favor a certain factor
9Extremely importantJudgment and experiences extremely favor a certain factor with sufficient evidence
2, 4, 6, 8Intermediate valuesIn between two adjacent judgments
Table 6. Classification criteria of factors influencing GW potential.
Sr. No.ParameterBasis of Categorization
1DrainageDrainage density value
2LineamentLineament density value
3SlopePercentage slope
4LULCLand cover status, areal extent, condition, associated vegetation
5SoilTexture, porosity, and permeability
6GeologyRock type, joints, fractures, weathering character
7RainfallAverage annual rainfall
Table 7. Description of LULC classes.
LULCDescription
WaterbodyArea accumulates open water bodies, perennial canals rivers, and man-made structures including reservoirs and dams
Built-up landLand categorized by different settlements including residential, commercial, industrial, and man-made infra-structures
Cultivated landLand capable of plowing, sowing and growing crops
GrasslandA biome, a land where vegetation is dominated by grasses.
Unused landA vacant area of land without vegetation, public utilities, buildings, etc.
Table 8. Pairwise comparison matrices and normalized weights for all the factors.
Variable LayersLULCGeologyLineamentSlopeRainfallSoilDrainageNormalized Weight
LULC11/71/51/21/31/41/90.194
Geology713651/320.194
Lineament51/314321/60.139
Slope21/61/411/21/350.139
Rainfall31/51/3211/21/40.139
Soil431/23211/30.111
Drainage91/261/54310.084
315.3411.2816.715.837.428.861
Table 9. Qualitative and quantitative ranking of sub-categories influencing GW recharge within thematic map.
Thematic MapProposed WeightSub-Class FeaturesClasses RankingGW Prospect (Qualitative Rank)GW Prospect (Quantitative
Rank)
0–1.82Very low valueVery good9
1.82–3.98Low valueGood7
Drainage93.98–6.03Moderate valueModerate5
6.03–8.41High valuePoor3
8.41–14.11Very high valueVery poor1
0–0.79Very low valueVery poor1
0.79–2.22Low valuePoor3
Lineament142.22–3.60Moderate valueModerate5
3.60–5.08High valueGood7
5.08–7.76Very high valueVery good9
0–0.35Nearly levelVery good9
0.35–1.43Very gently slopingGood7
Slope (%)141.43–4.28Gently slopingModerate5
4.28–9.18Moderately slopingPoor3
9.18–20.72Strong slopingVery poor1
Unused landVery low infiltrationVery poor1
Built-up landLow infiltrationPoor3
LULC19GrasslandModerate infiltrationModerate5
Cultivated landHigh infiltrationGood7
WaterbodyVery high infiltrationVery good9
Rock outcropVery low infiltrationVery poor1
Clayey loamLow infiltrationPoor3
Soil11LoamyModerate infiltrationModerate5
Sandy loamHigh infiltrationGood7
SandyVery high infiltrationVery good9
Rock/hill predominant plainVery low infiltrationVery poor1
Desert plainLow infiltrationPoor3
Geology19Sand dunesModerate infiltrationModerate5
Terraces plainHigh infiltrationGood7
River plainsVery high infiltrationVery good9
97–184Very lowVery poor1
184–299LowPoor3
Rainfall14299–467ModerateModerate5
467–659HighGood7
659–987Very highVery good9
Table 10. GWPZs classification.
Sr. No.GWPIGW ProspectArea (km2)Percentage Area (%)
10.11–0.16Very Low25,20312.27
20.16–0.19Low42,06020.48
30.19–0.22Moderate46,75122.77
40.22–0.25High54,61026.59
50.25–0.31Very High36,72017.88
Disclaimer/Publisher’s Note: The statements, opinions and data contained in all publications are solely those of the individual author(s) and contributor(s) and not of MDPI and/or the editor(s). MDPI and/or the editor(s) disclaim responsibility for any injury to people or property resulting from any ideas, methods, instructions or products referred to in the content.