Article

Identification and Analysis of Ecological Corridors in the Central Urban Area of Xuchang Based on Multi-Source Geospatial Data

1
School of Architecture and Urban Planning, Lanzhou Jiaotong University, Lanzhou 730070, China
2
State Key Laboratory of Remote Sensing Science, Aerospace Information Research Institute, Chinese Academy of Sciences, Beijing 100094, China
3
University of Chinese Academy of Sciences, Beijing 100049, China
4
Faculty of Geomatics, Lanzhou Jiaotong University, Lanzhou 730070, China
5
School of Information Systems and Technology, Claremont Graduate University, Claremont, CA 91711, USA
6
Norwich Business School, University of East Anglia, Norwich NR4 7TJ, UK
7
Academy of Forestry Inventory and Planning, National Forestry and Grassland Administration of Republic of China, Beijing 100010, China
*
Author to whom correspondence should be addressed.
ISPRS Int. J. Geo-Inf. 2024, 13(9), 322; https://doi.org/10.3390/ijgi13090322
Submission received: 23 July 2024 / Revised: 27 August 2024 / Accepted: 3 September 2024 / Published: 6 September 2024

Abstract

:
With the development of ecological civilization construction, urban planning and development in China have entered a phase in which optimizing and constructing ecological spaces is required. As a national livable city, Xuchang has experienced rapid economic development in recent years, leading to significant urban expansion that has impacted the layout of ecological space networks in the central urban area and its surroundings. Therefore, identifying and optimizing the spatial layout of ecological corridors in Xuchang City are crucial for ecological development and park city construction. This study utilizes multisource geospatial data to identify and extract ecological corridors in the central urban area of Xuchang City. Ecological resistance and gravity models are employed to identify and verify that the primary ecological corridor pattern in Xuchang City is situated in Weidu District, which is a central urban area. Finally, 11 main ecological corridors in the central urban area are delineated. In response to the identification of ecological corridors, this study integrates spatial analysis methods and text analysis methods to evaluate the characteristics of urban ecological corridors. The results indicate that Xudu Park extends outward, serving as the hub of the ecological network, and that West Lake Park and Luming Lake Park form the core of the urban park system. Finally, based on the spatial relationships, ecological benefits, and citizen experience of each ecological corridor and the green parks it traverses, strategies for optimizing the layout of urban ecological corridors are proposed.

1. Introduction

With the increase in park city constructions, research on the identification of urban ecological corridors and citizens’ perceptions of these corridors is gaining prominence for urban management and development [1]. A park city refers to a city where parks serve as the core of the city, aiming to achieve a harmonious coexistence of humans and nature through the planning and construction of urban parks [2]. The construction of a park city enhances the environmental quality of the city and improves residents’ quality of life. The significance of constructing urban parks lies in their ability to provide green spaces, improve air quality, mitigate the urban heat island effect, offer recreational areas for residents, and foster social interaction and healthy lifestyles [3]. Therefore, deepening the study and promotion of the park city concept and urban park construction is essential for understanding and addressing environmental and social issues in urban development. The formation of multiple parks within a city creates ecological patches, and multiple urban ecological plates connect to each other, forming urban ecological corridors. These corridors, in turn, form an urban ecological network, which serves as a crucial physical space for the urban ecological system, emphasizing the importance of studying urban parks and ecological corridors for urban ecosystem development [4].
Current research on urban ecological corridors primarily focuses on direct or indirect identification studies using remotely sensed data from satellite imagery or geospatial and socio-economic data. However, the majority of these studies rely on mathematical models to analyze objective geographical data or social survey data, resulting in findings that are confined to the level of images and numbers [5]. This limitation has prevented deeper investigation into urban citizens’ experiences with and the utilization of urban ecological corridors and urban ecosystems. Consequently, there is a significant gap in public participation in the construction and governance of urban ecological corridors. Therefore, this study advances beyond the mere identification of urban ecological corridors to delve into a more thorough analysis and optimization study of these corridors.
The rapid urbanization of Xuchang City in Henan Province has adversely impacted the city’s ecological network layout. Specifically, the urban population and economic growth have reduced urban green space, posing threats to the overall connectivity of green spaces and the stability of the ecological network. Urban industrialization and expanded traffic infrastructure contribute to air pollution, compromising the quality and health of the urban ecosystem and green space network. Additionally, the poor connectivity of green spaces has resulted in citizens’ leisure and ecological needs not being met [6]. Improper urban planning and land-use decisions in recent years have exacerbated urban environmental problems, including the fragmentation of the ecological network and water pollution [7]. Therefore, it is imperative to identify the ecological space corridor in Xuchang’s central urban area and optimize its layout [8]. Urban Points of Interest (POI) data, as an informational resource to depict urban construction environments, record the spatial locations and attributes of urban public facilities [9]. Amid rapid urbanization, unlike observations of suburban or rural settings, remote sensing satellite observations of urban ecological environments often encounter complexities and blurring due to building occlusions. Conversely, urban POI data, with spatial distribution characteristics and textual descriptions, offer a clearer perspective for identifying urban ecological environments [10]. The Internet, along with public evaluation data, such as the data available on Dianping (a Chinese online platform for scenic spot and business reviews), can enable city managers to understand citizens’ experiences and evaluations of urban ecological construction rapidly and in a more direct manner due to the openness and universality of online platforms. Therefore, this study focuses on the central urban area of Xuchang City, utilizing POI data to identify the distribution patterns of urban ecological corridors through various model-based methods [11]. In conjunction with the rating and review data from Dianping, this study leverages public interactive feedback and employs sentiment analysis techniques to unveil the issues related to ecological corridors from multiple dimensions. Building on this, the present study proposes optimization strategies to address existing problems and enhance the design and functionality of the urban ecological network.
In the second section of this study, we introduce previous scholars’ related research. In the third section, we describe the general situation of the study area. In the fourth section, we present the technical methods, experimental process, and results of this study. In the fifth section, we analyze the recognition results. In the sixth section, we discuss and propose strategies. Finally, in the seventh section, we draw conclusions.

2. Related Work

With the rapid advancement of urbanization, how to coordinate human activities with the natural environment to ensure the integrity and sustainability of the ecosystem has become a major challenge in urban planning and construction [12]. Against this background, the park city concept has emerged, aligning with contemporary needs. It aims to promote green development and achieve the optimization of urban ecological geospatial systems and the environment by constructing ecological corridors and utilizing geospatial big data. Additionally, sentiment analysis offers a novel perspective on human perceptions of urban parks within urban ecological spaces. Scholars’ efforts have not only advanced theoretical research on park cities and ecological networks, but also introduced new technological and methodological solutions for urban planning [13].

2.1. Urban Planning and Construction of Park Cities

In the realm of urban planning and the development of park cities, scholars have extensively explored the application, challenges, and strategies for implementing the park city concept from various perspectives [14].
Regarding the exploration and guidance of the park city concept, Li and Tang [15] conducted a thorough analysis of the term “park city”. Their research underscored that park cities prioritize not only ecological construction and the optimization of green geospatial systems, but also the integration of these green spaces into urban planning. This integration is geared toward maximizing their ecological benefits and recreational functions, thereby enhancing urban residents’ quality of life. Regarding the planning efforts of park cities, Semenzato et al. [16] substantiated the necessity and efficacy of employing multiple indicators comprehensively. They achieved this by applying various accessibility measurement techniques to urban parks in Northeast Italy. Regarding ecological concerns and solution strategies in the establishment of park cities, Huang et al. [17] directed their attention toward the issue of green space fragmentation amidst the urbanization process, proposing relevant remedies. Through case studies, they analyzed the impact of urban expansion on natural ecosystems, particularly focusing on methods to alleviate the negative impacts of urbanization on the natural environment. This involves optimizing urban planning and reconfiguring the green space network to preserve ecological connectivity.

2.2. Identification and Analysis of Ecological Networks and Corridors

In identifying and analyzing urban ecological networks and corridors, several scholars have contributed valuable insights and solutions to the fields of current urban planning and ecological protection [18].
Regarding the importance of ecological networks and corridors, Peng et al. [19] and Wu et al. [20] underscored in their research that urban ecological corridors not only serve to connect ecological fragments, but also have cultural significance and play a significant role in balancing ecological functions. In their study focusing on ecological corridor identification, Zhang et al. [21] introduced a model based on ecological adaptability cycles for extracting ecological sources. They emphasized the crucial nature of accurately identifying and classifying ecological sources and corridors, particularly in the context of fragmentation and rapid vegetation recovery. In their research on the construction and optimization of ecological networks, Lumia et al. [22] identified ecologically sensitive areas and established and optimized ecological networks, developing a strategy against landscape fragmentation and biodiversity loss. Regarding ecological network planning aimed at addressing challenges posed by urbanization, Wang and Zhao [23] focused on countering ecological degradation resulting from rapid urbanization, utilizing the Jiangnan water network as a case study. They conducted a comprehensive analysis of ecological services, connectivity, and sensitivity, and applied circuit theory to determine optimal paths and strategies for ecological corridors. Katie R. Kirsch et al. [24] proposed a suitability analysis method incorporating a pollution hazard index for urban garden siting, utilizing the case of Houston city. This method aims to improve community garden siting and decrease environmental pollution risks.

2.3. Urban Network Analysis Research Based on Geospatial Big Data

In contemporary urban planning and research, geospatial big data, including remote sensing data and POI data, have become indispensable tools. These data are applied extensively in identifying urban functional areas, optimizing networks, constructing ecological corridors, and precisely locating urban centers, underscoring their importance in supporting multidisciplinary and multi-scale regional studies [25].
Regarding the application of geospatial big data for identifying and analyzing urban functional areas, Zhang [26] and Cao et al. [27] highlighted the efficacy of utilizing POI data for urban research, validating its applicability in identifying urban functional areas. Su et al. [28] proposed a multimodal fusion framework to integrate remote sensing images, POI, and building footprint data, highlighting the potential of geospatial big data in achieving higher precision mapping of urban functional areas and their characteristics. Li et al. [29] reviewed the current state, trends, and future directions of GIS software architecture, including integration with big data and artificial intelligence, offering new insights for geospatial big data in the identification and analysis of urban functional areas. In the realm of constructing ecological corridors and ecological safety patterns using geospatial big data, Nygren et al. [30] developed a Python-based automated flood impact analysis and visualization model that improved disaster impact mitigation through the utilization of global geospatial datasets. This is particularly beneficial for regions in the Global South. Using multisource geospatial big data and geographic weighted principal component analysis (GWPCA), Foroutan et al. [31] explored the spatiotemporal heterogeneity of heat vulnerability and its impact on adaptation strategies. Their work underscored the importance of protecting and restoring ecological networks in urban development. In their research concerning the optimization of urban emergency service network systems using geospatial big data, Peixoto [32] and colleagues employed geographic information datasets to assess the quantity and distribution of critical urban infrastructure, such as hospitals, police stations, fire departments, and public transport stations. This evaluation serves as a basis for optimizing cities’ emergency service network systems. In the field of research combining geospatial big data and deep learning for urban network applications, Zhong [33] engaged in an interdisciplinary investigation bridging cartography and neuroscience to delve into the connotations of deep mapping, underscoring its pivotal role in disclosing the neuroscientific mechanisms associated with maps. Zhang et al. [34] introduced an approach grounded in Graph Convolutional Networks (GCN) that tackled both the computational efficiency and quality of solutions concerning the Coverage Location Problem (CLP). Zhong et al. [35] produced ReCovNet, a novel methodology leveraging deep reinforcement learning to resolve the intricate Maximum Coverage Billboard Location Problem (MCBLP). Meanwhile, Liang et al. [36] put forth SpoNet, a unified framework amalgamating geographical location features with deep learning, aimed at bolstering the efficiency and precision of decision analysis in urban network spaces. These studies collectively furnish fresh insights into the amalgamation of urban networks and artificial intelligence.

2.4. Multi-Scenario Sentiment Analysis Research Based on Internet Comment Data

In recent years, sentiment analysis has emerged as a significant research direction in the field of natural language processing (NLP), particularly with the abundance and authenticity of Internet comment data, which has become a valuable resource for sentiment analysis [37].
In the development of sentiment classification technology, Hosgurmath et al. [38] focused on the sentiment classification of tweets by integrating NLP technology and the bag-of-words model. They emphasized the importance of lemmatization technology in enhancing classification accuracy. Strąk and Tuszyński [39] demonstrated the effective retrieval of semantically similar documents using BERT embeddings combined with cosine similarity, showcasing potential for enhancing the efficiency of specific search tasks, such as those used by tax advisors. Additionally, Chen et al. [40] proposed a zero-shot learning method that outperformed existing deep learning models on the COVID-19 tweet dataset by effectively classifying social media data through knowledge graphs. Regarding emotion spread and sentiment entity recognition, Chmiel et al. [41] delved into the collective dynamics of sentiment spread in online communities, offering deep insights into user behavior on social networks. Marulli et al. [42] investigated the challenges posed by malicious attacks on NLP systems, particularly focusing on named entity recognition. They examined the impact of word embedding contamination on deep neural networks and proposed strategies to mitigate it, which is crucial for safeguarding sentiment analysis models against such attacks. In studies on the practical value of sentiment analysis, Lu et al. [43] devised a machine learning-based sentiment early warning model that effectively monitors and comprehends consumer experiences and emotions in the realm of big data. Banerjee [44] presented a range of methods for detecting fake news and harmful content across multiple platforms. This research underscored the application value of sentiment analysis in social media monitoring and content review. Yan et al. [45] proposed the concept of micro maps as a complement to traditional maps in the self-media era. These micro maps allow users to assist each other on public platforms in an Internet-savvy manner, being compact, quick, and flexible to meet the needs of the general public. Additionally, they provide a foundational dataset for sentiment analysis.
To summarize, we can see that the construction of park cities, the identification of ecological corridors, urban planning based on geospatial big data, and multi-scenario emotional analysis research in the context of the Internet have injected strong impetus for interdisciplinary integration into the field of urban sustainable development. These studies offer multidimensional perspectives for understanding and shaping urban ecosystems. Moreover, they propose innovative solutions to challenges encountered in the process of modern urbanization. However, upon reviewing previous studies, it becomes evident that few scholars have analyzed the layout of urban ecological corridors from the perspective of combining spatial patterns with public evaluation.

3. Research Area Overview

Xuchang City, situated in the central part of Henan Province, China, has been awarded titles such as National Ecological Garden City, National Green City, and National Forest City, ranking first in Henan Province’s livable city rankings for several consecutive years. Additionally, the city’s ancient relics, cultural landscapes, modern facilities, and natural scenery enrich the research connotations and citizens’ experiences of the urban ecological corridor. The Weidu District, situated in the city center and serving as the political, economic, and cultural hub of the city, showcases a rich array of cultural landscapes and historical relics, such as Wenfeng Tower and Baling Bridge Park. These locations not only carry the city’s historical evolution, but also attract a large number of tourists and history enthusiasts. Meanwhile, the commercial prosperity and modern urban construction in the Weidu District provide a diverse range of shopping, entertainment, and leisure options. Most importantly, the Weidu District boasts extensive green spaces and parks like Xudu Park and Central Park, which feature beautiful natural environments. These offer residents delightful summer retreats. The area comprehensively promotes urban greening and ecological protection, aiming to enhance urban ecological quality and residents’ quality of life. The city’s development aligns with the design concepts of a park city. Hence, this study selects Xuchang City and its central urban area, the Weidu District, as the subject of research. This study examines the sustainable development of Xuchang City, poising that it will increasingly attract tourists, researchers, and investors, thereby further promoting its prosperity. The location of the area as depicted in Figure 1.

4. Methodology

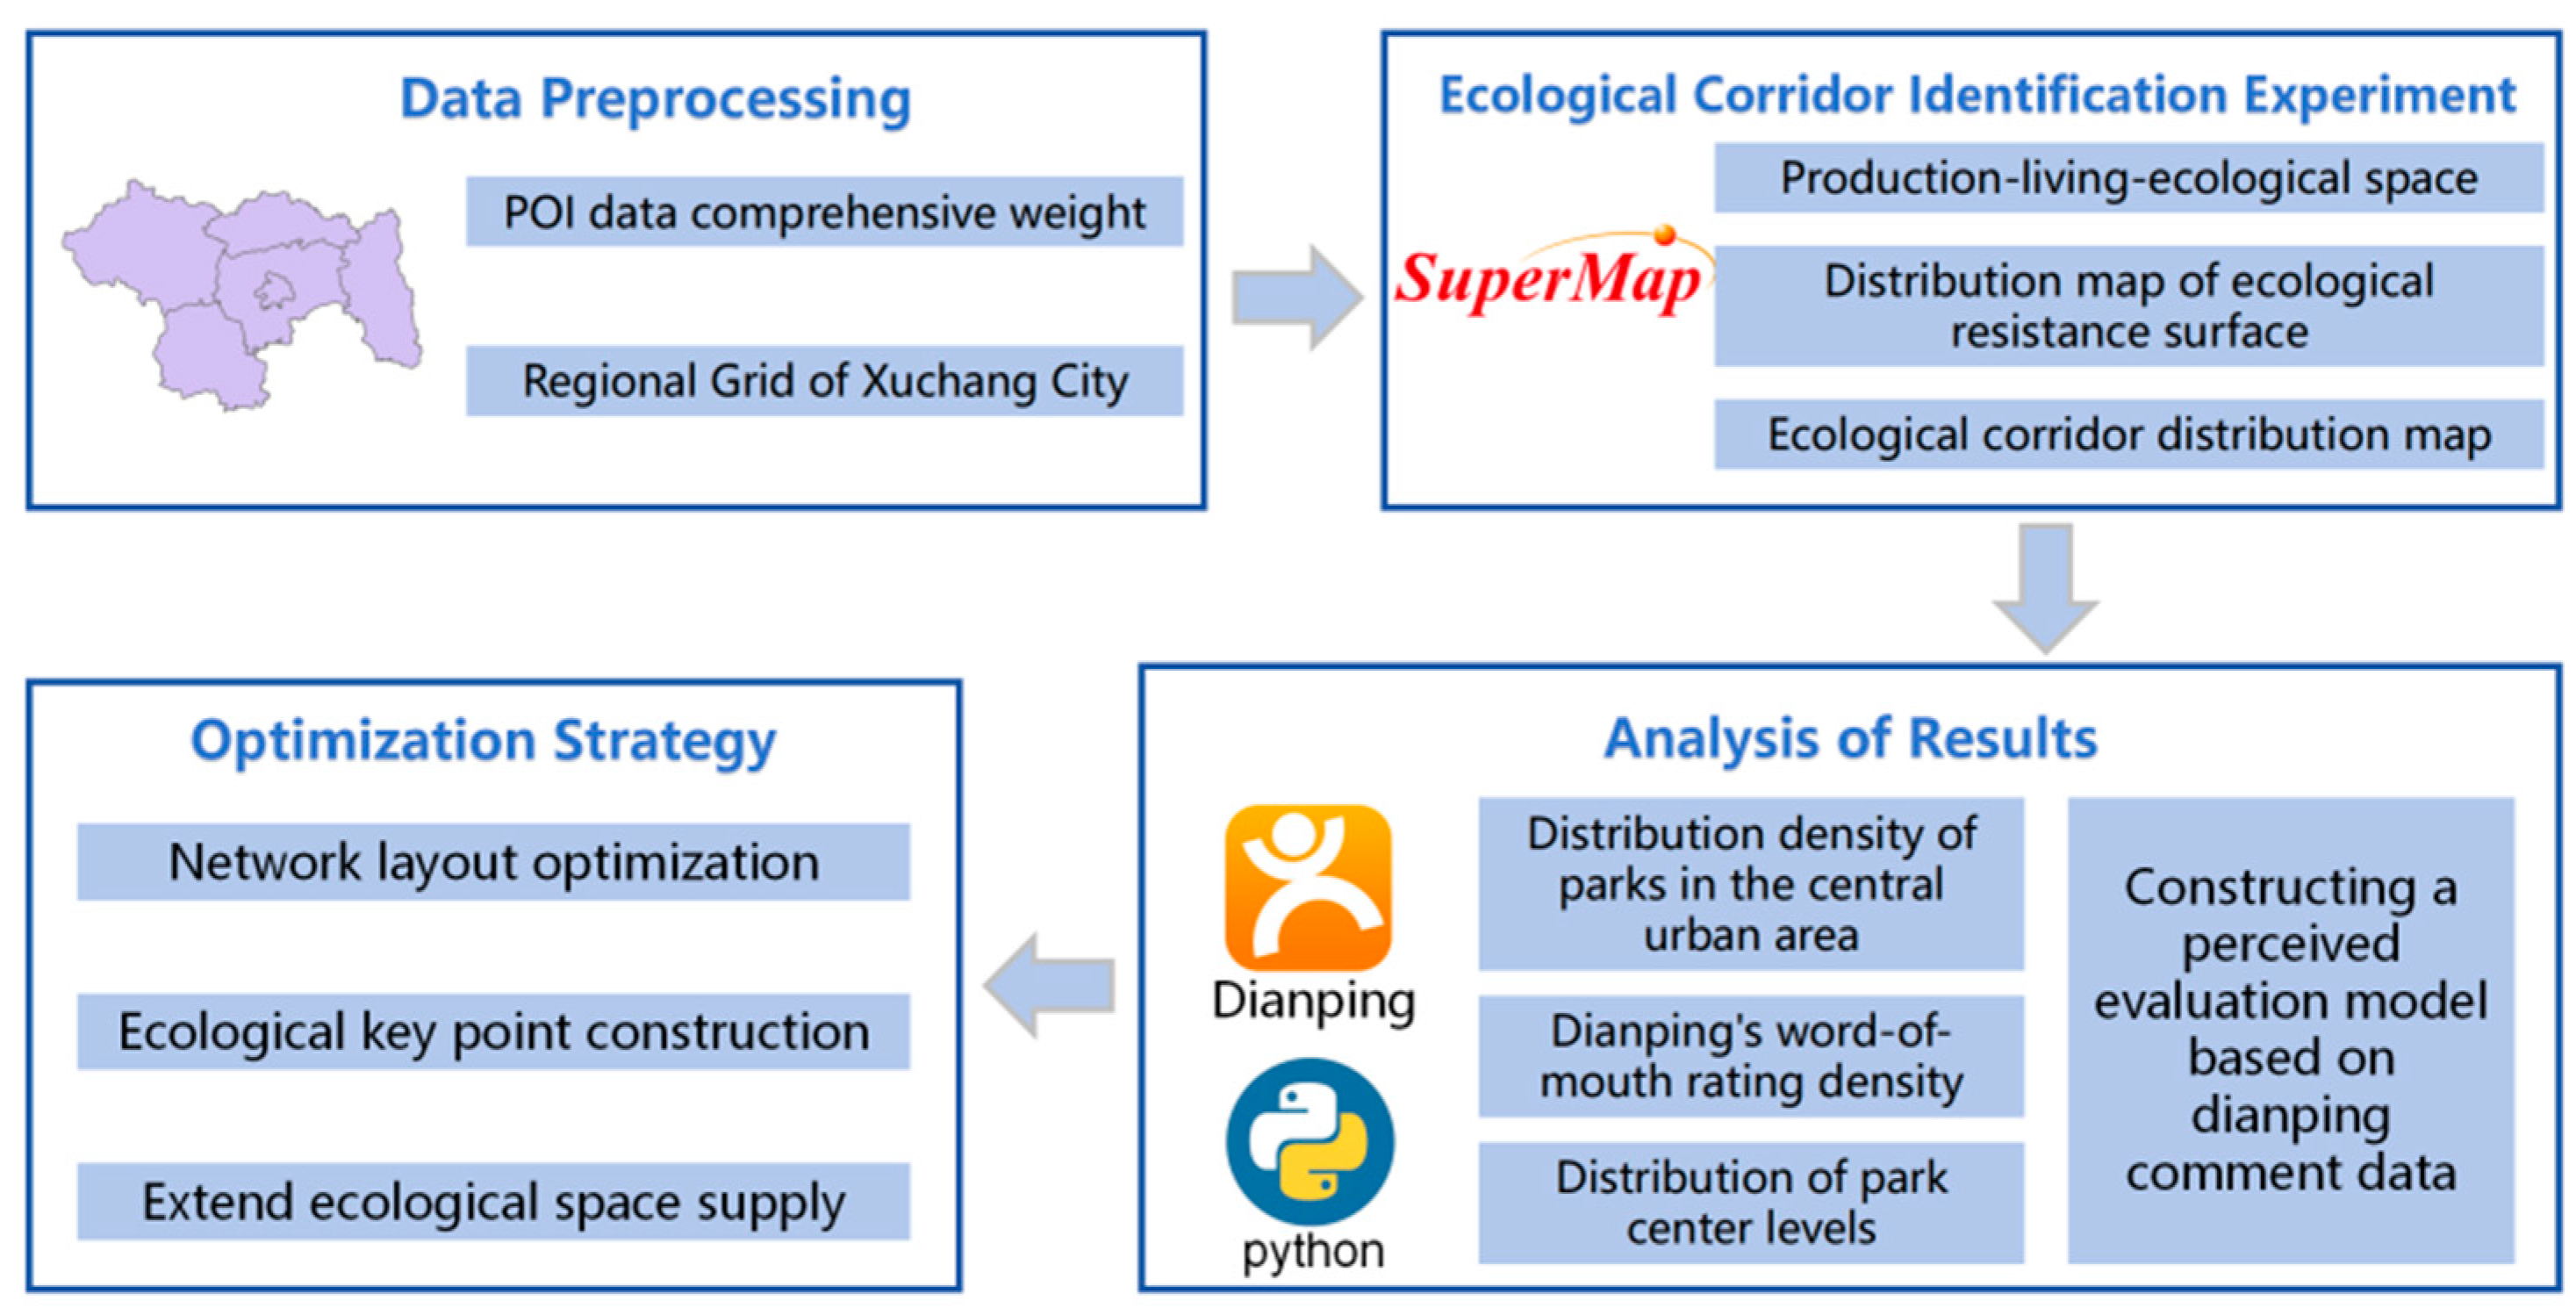
The research framework of this study is divided into four stages: data preprocessing, an ecological corridor identification experiment, results analysis, and an optimization strategy, as shown in Figure 2. Initially, the study establishes a comprehensive POI data weight table based on POI data using the Analytic Hierarchy Process (AHP). Subsequently, it utilizes the minimum cumulative resistance model and the gravity model to successively obtain the spatial distribution maps of three types of habitats, an ecological resistance surface distribution map, and an ecological corridor distribution map. Following this, spatial distribution kernel density analysis, public opinion score kernel density analysis, and center level distribution analysis were conducted on the green parks that were identified in ecological corridors in the central urban area. Based on Dianping review data, a perceptual evaluation model was constructed for urban parks passing through ecological corridors and sentiment analysis was conducted. Finally, the study proposes optimization strategies based on the analysis results.

4.1. Data Sources

This study uses POI data from the Amap data platform to gather information on various aspects of Xuchang City for the year 2023, including catering services, scenic spots, factories, companies, parks, shopping services, transportation facilities, finance, insurance, education, culture, life services, sports, leisure, logistics, healthcare, government agencies, accommodation services, and residential areas. Each POI entry includes details such as name, type, address, latitude, and longitude.
To calculate the comprehensive weight of POIs, auxiliary data from the 2018 vector dataset on Xuchang urban construction land classification were employed. The validity of these data extends over the subsequent decade. This dataset provides information on primary land type, secondary land type, longitude, latitude, footprint, and other attributes [46].
Data, including the public opinion ratings of major green parks in the central urban area of Xuchang and 320 comments on six key parks, were sourced from the popular online platform Dianping in order to analyze the identification results of ecological space corridors in the central urban area of Xuchang. The time validity of the data was up until October 2023.

4.2. Data Processing and Analysis Methods

This study primarily employs four main data processing and analysis methodologies: the Analytic Hierarchy Process (AHP), the MCR model, the gravity model, and NLP sentiment analysis. Also, it innovatively integrates spatial analysis methods with textual analysis techniques for the evaluation of urban ecological corridors. This approach not only ensures the scientific rigor of spatial analysis, but also highlights the advantages of public participation.

4.2.1. Analytic Hierarchy Process

Hierarchical analysis is a multi-criterion decision-making approach designed to assist decision-makers in selecting the most suitable option by evaluating and comparing the relative importance of various factors. This method decomposes complex decision problems into multiple levels through the establishment of a hierarchical structure. Subsequently, a standardized set of comparison criteria, informed by expert judgment and experience, is employed to determine the weight of each factor, facilitating comprehensive decision-making [47]. In this study, hierarchical analysis was conducted using the SPSS Pro online tool.

4.2.2. MCR Model

The minimum cumulative resistance (MCR) model is utilized to simulate the effort required to overcome resistance encountered by organisms moving between various landscape units. This model calculates the cumulative resistance faced by species during their movement from a source to a destination, considering source characteristics, distance, and landscape unit properties. It has applications in ecological source expansion, ecological security pattern construction, and ecological network development.
The MCR model can be expressed as follows:
M C R = m i n j = n i = m ( D i j × R i )
In Equation (1), MCR denotes the minimum cumulative resistance value of ecological flow between ecological patches. D i j denotes the spatial distance between patches i and j , with m and n representing two different landscape patches in the central city. R i signifies the ecological resistance value of the i-th basic unit [48].

4.2.3. Gravity Model

The gravity model serves as a tool for analyzing the strength of spatial interaction relations, commonly applied to assess the level of interaction between different sites. In ecology, gravity models are frequently utilized to evaluate the interaction forces between ecological sources, determining the significance of ecological corridors by quantifying these forces. Enhanced interaction forces at both ends of an ecological corridor correspond to greater urban ecological benefits. By employing the gravity model, we can generate an interaction force matrix between different ecological sources, enabling the identification of crucial ecological corridors through the screening of corridor spaces where the force exceeds a specified threshold.
The formula of the gravity model is expressed as follows:
F c d = M c × M d D c d 2
In Formula (2), the interaction force is between patch c and patch d ; M c and M d denote the gravity values of patch c and patch d , respectively, representing the ratio of ecological elements and the ecological patch area; and D c d signifies the corridor distance between patch c and patch d .

4.2.4. NLP Sentiment Analysis

Affective analysis, also known as sentiment analysis, stands as a pivotal application of NLP technology. Its primary aim is to discern and identify subjective information within text data, including the author’s emotional inclination, emotional state, or evaluative attitude. This technique is geared toward determining whether the text conveys a positive, negative, or neutral sentiment [49]. Given that the comments on the online platform Dianping comprehensively reflect the public’s feelings about the construction of urban parks, in this study, based on NLP technology, we conducted sentiment analysis on the public’s word-of-mouth evaluation of Xuchang City parks that passed through the ecological corridor identification on the Dianping platform. This allowed us to obtain results related to the public’s satisfaction with the construction of ecological corridors in Xuchang City, which can be used to provide optimization strategies for urban ecological corridor construction.

4.3. Ecological Corridor Identification Experiment

4.3.1. Data Preprocessing

When defining the comprehensive weights of 16 types of POI data, these types were categorized into 3 spatial types based on their characteristics. The production space type includes companies, finance, insurance, government entities, factories, logistics, and transportation. The living space type encompasses catering services, shopping, healthcare, life services, science, education, culture, sports and leisure, accommodation services, and residential areas. The ecological space type encompasses scenic spots and parks.
To facilitate the use of hierarchical analysis tools for defining these POI data, the 16 types were further grouped based on common characteristics. Within the production space category, business, financial insurance, and government are defined as insubstantial; factories and logistics are defined as substance; and transportation is classified as one type. In the living space category, catering services, shopping, and healthcare are essential. Life services, science and education, culture, and sports and leisure are deemed nonessential. Accommodation services and residential district are related to habitancy. In the ecological space, famous scenery and parks are categorized as green areas.
First, each POI datapoint is scored based on criteria that consider the relation between the POI type and the urban ecological space environment, as well as the extent to which the POI type promotes the development of urban ecological space. This scoring process involves assessing the pros and cons of each POI type. Next, the relevance of each POI datapoint is determined using hierarchical analysis. The model is tested and debugged consistently using the SPSS Pro tool. Subsequently, 2018 Xuchang City urban construction land classification SuperMap data are utilized [50]. The land area corresponding to various types of POI data in the vector dataset is divided by the number of respective POI types in the Xuchang POI dataset for 2022. This calculation yields the relative land area of various types of POIs. Finally, the relevance and relative land area are multiplied to derive the comprehensive weight for each type of POI [51].
Upon obtaining the comprehensive weight of various POIs, the results are tabulated (Table 1). After acquiring the comprehensive weights of the POI data, the creating fishing net tool within SuperMap (iDesktopX 11i) is utilized to generate Xuchang grid data with dimensions of 200 m × 200 m through cropping.

4.3.2. Production–Living–Ecological Space Identification and Ecological Patch Generation

After obtaining the production–living–ecological spatial comprehensive weights of each POI datapoint in SuperMap [52], a summation of the cumulative comprehensive weights for living space, ecological space, production space, and production–living–ecological space is conducted for each basic grid unit. Three new fields, production proportion, ecological proportion, and living proportion, are added to the new attribute table. By dividing the cumulative comprehensive weight by the cumulative comprehensive weight of the basic unit of the three generations of each grid, the specific value of each grid can be obtained in each new field.
Subsequently, the production–living–ecological spaces associated with each basic grid unit are identified. Basic grid units with an ecological proportion greater than 50% are defined as ecological spaces. After obtaining the identification results for production space and living space in the same way, basic grid units with an ecological proportion greater than 33.3% and less than 50% are defined as ecological mixed spaces [53].
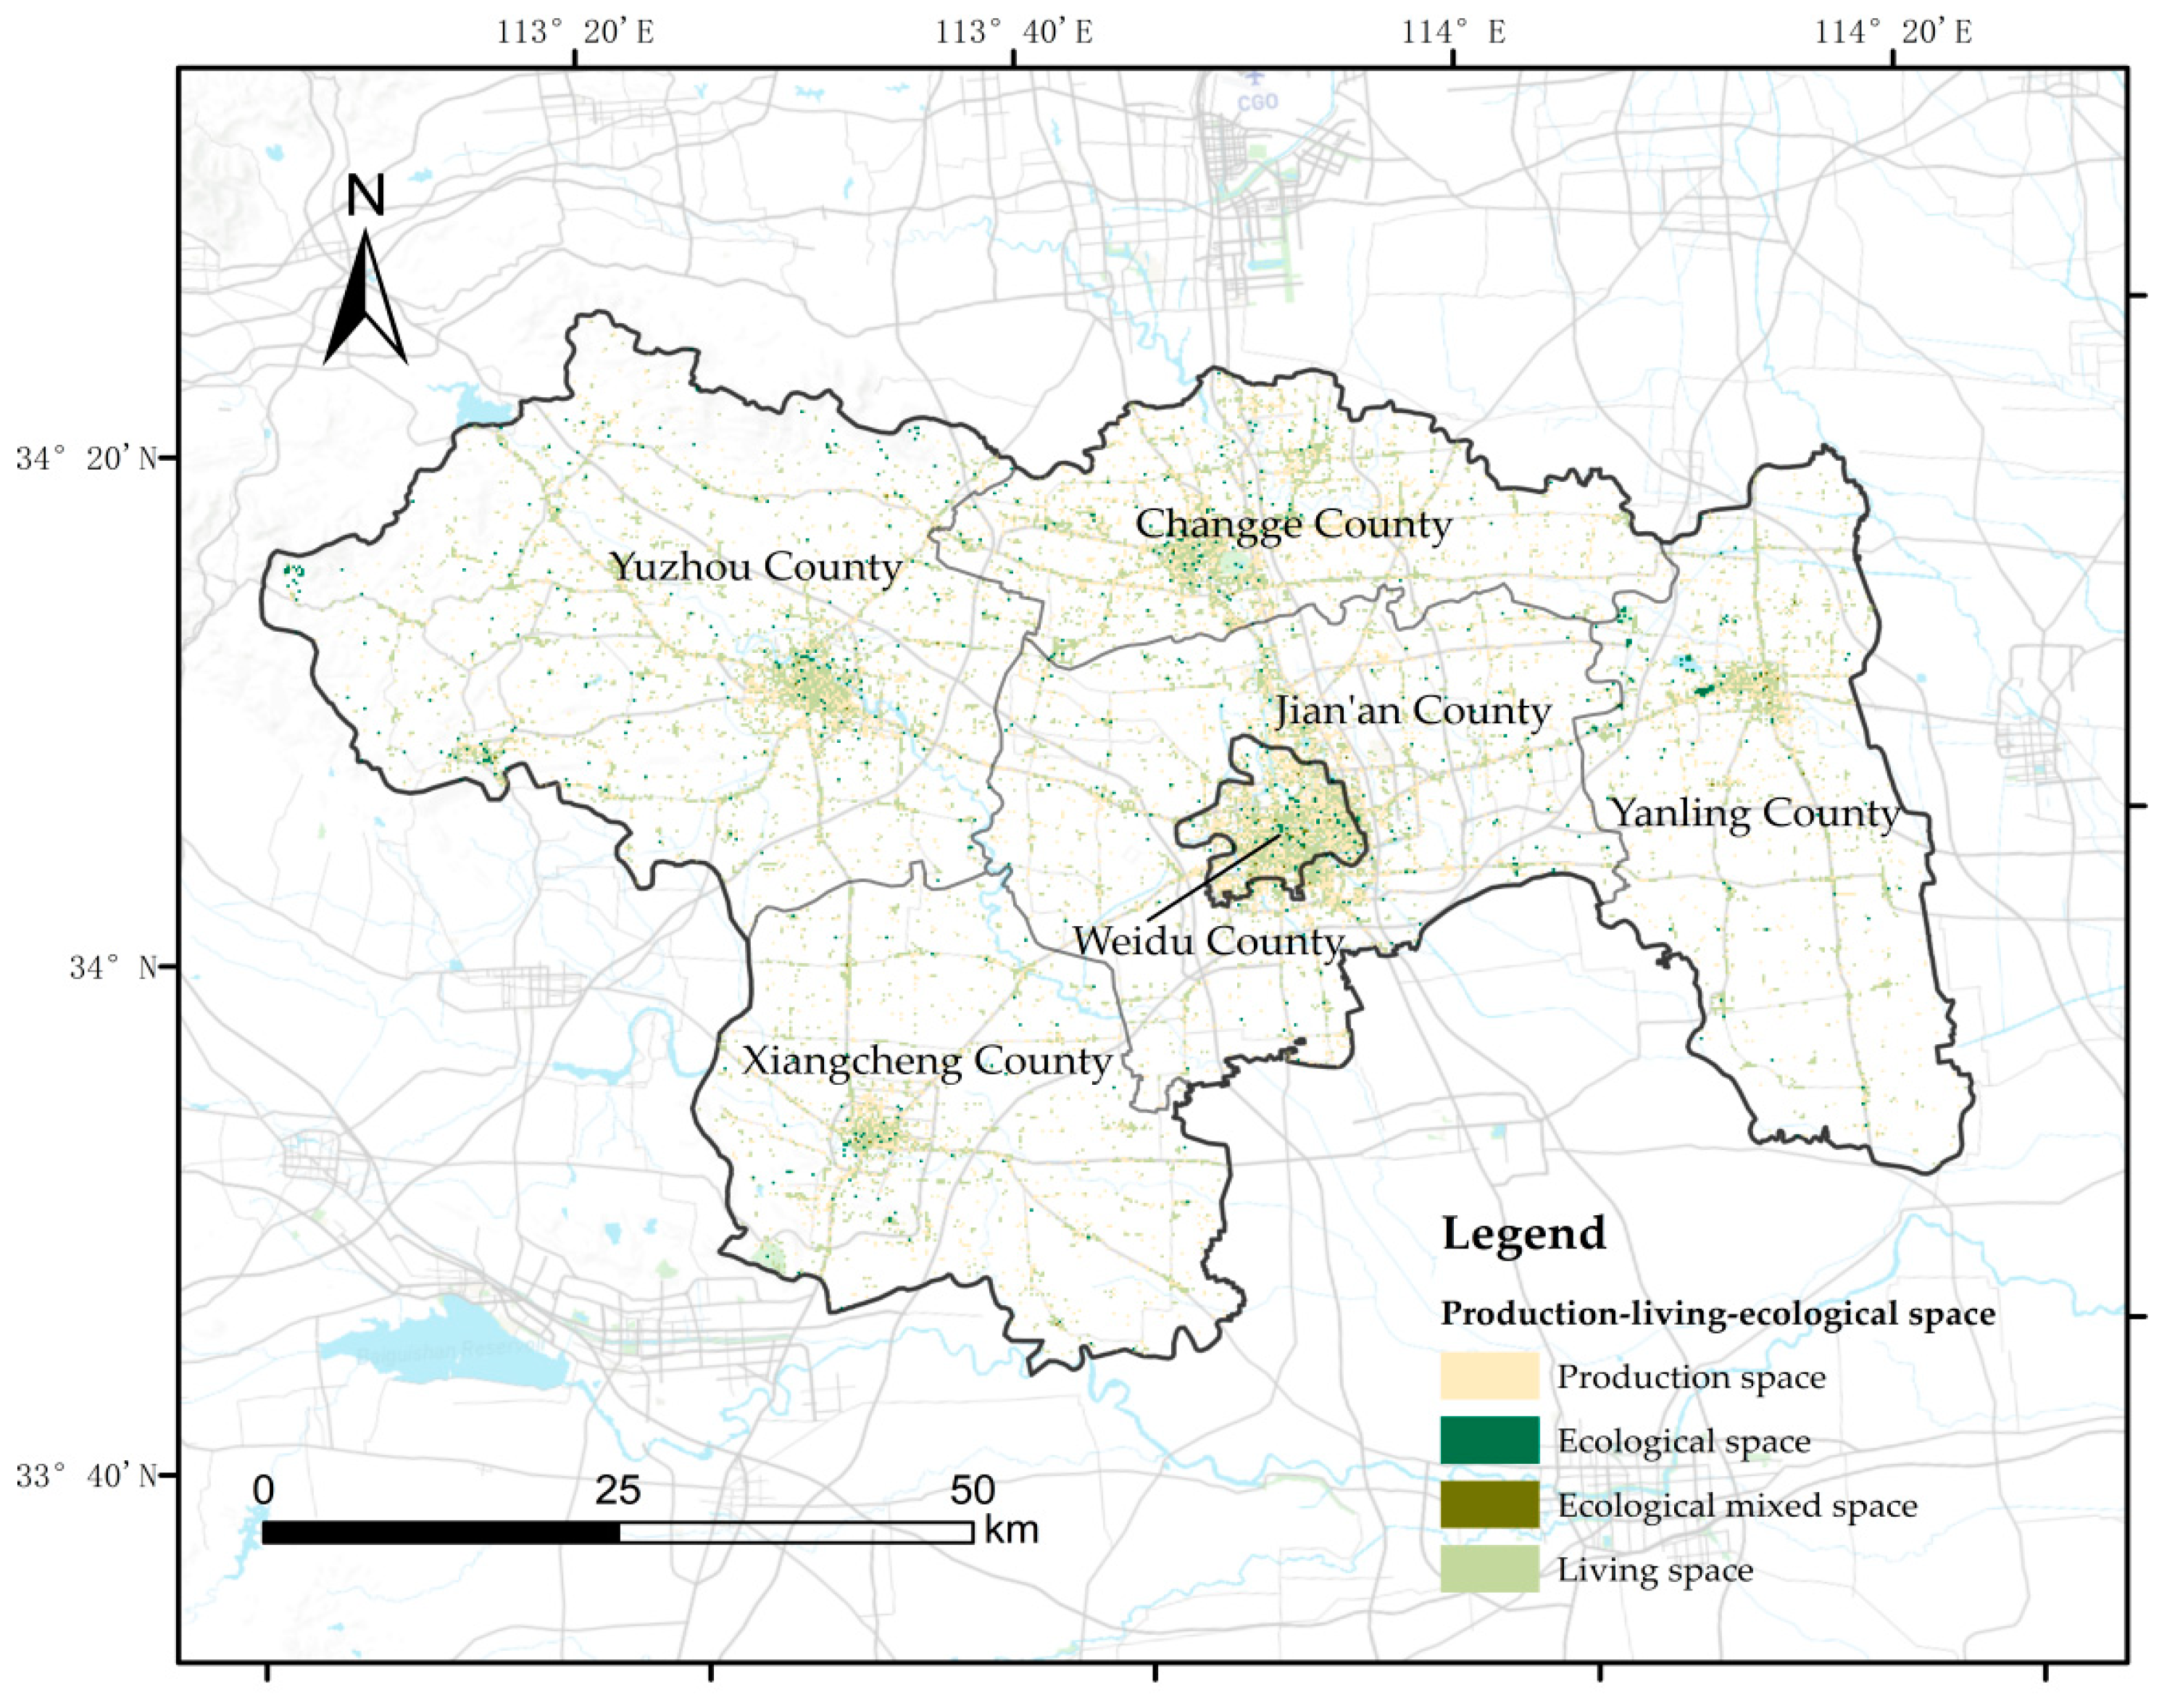
After obtaining the spatial identification results for production–living–ecological spaces, connecting various types of data in SuperMap, and adjusting the display effect in the layer attributes, the spatial distribution map of production–living–ecological space in Xuchang City is obtained, as depicted in Figure 3.

4.3.3. Ecological Resistance Surface Identification

The ecological resistance value increases as the space becomes less favorable for the development of urban ecological space. Therefore, we assigned scores to ecological resistance based on the characteristics of various POI types. Subsequently, we derived the relative resistance values to overcome resistance in the city by using the principles of hierarchical analysis, as depicted in Table 2.
After obtaining the ecological resistance value data for all types of POIs, the field of ecological resistance value is added to the POI type summary data. Subsequently, the Xuchang POI data are connected with the POI type summary data and the grid ID summary data. The cumulative resistance value of each basic grid unit is calculated using Equation (3), as follows:
R i = a = 1 t = 16 r a × k a
In Equation (3), R i denotes the ecological resistance value of the i-th basic unit; r a denotes the ecological resistance value of the a-th POI element; k a denotes the proportion of the a-th POI element to the total comprehensive weight of the basic unit; and t denotes the POI data of t subclasses in the i-th basic unit [54].
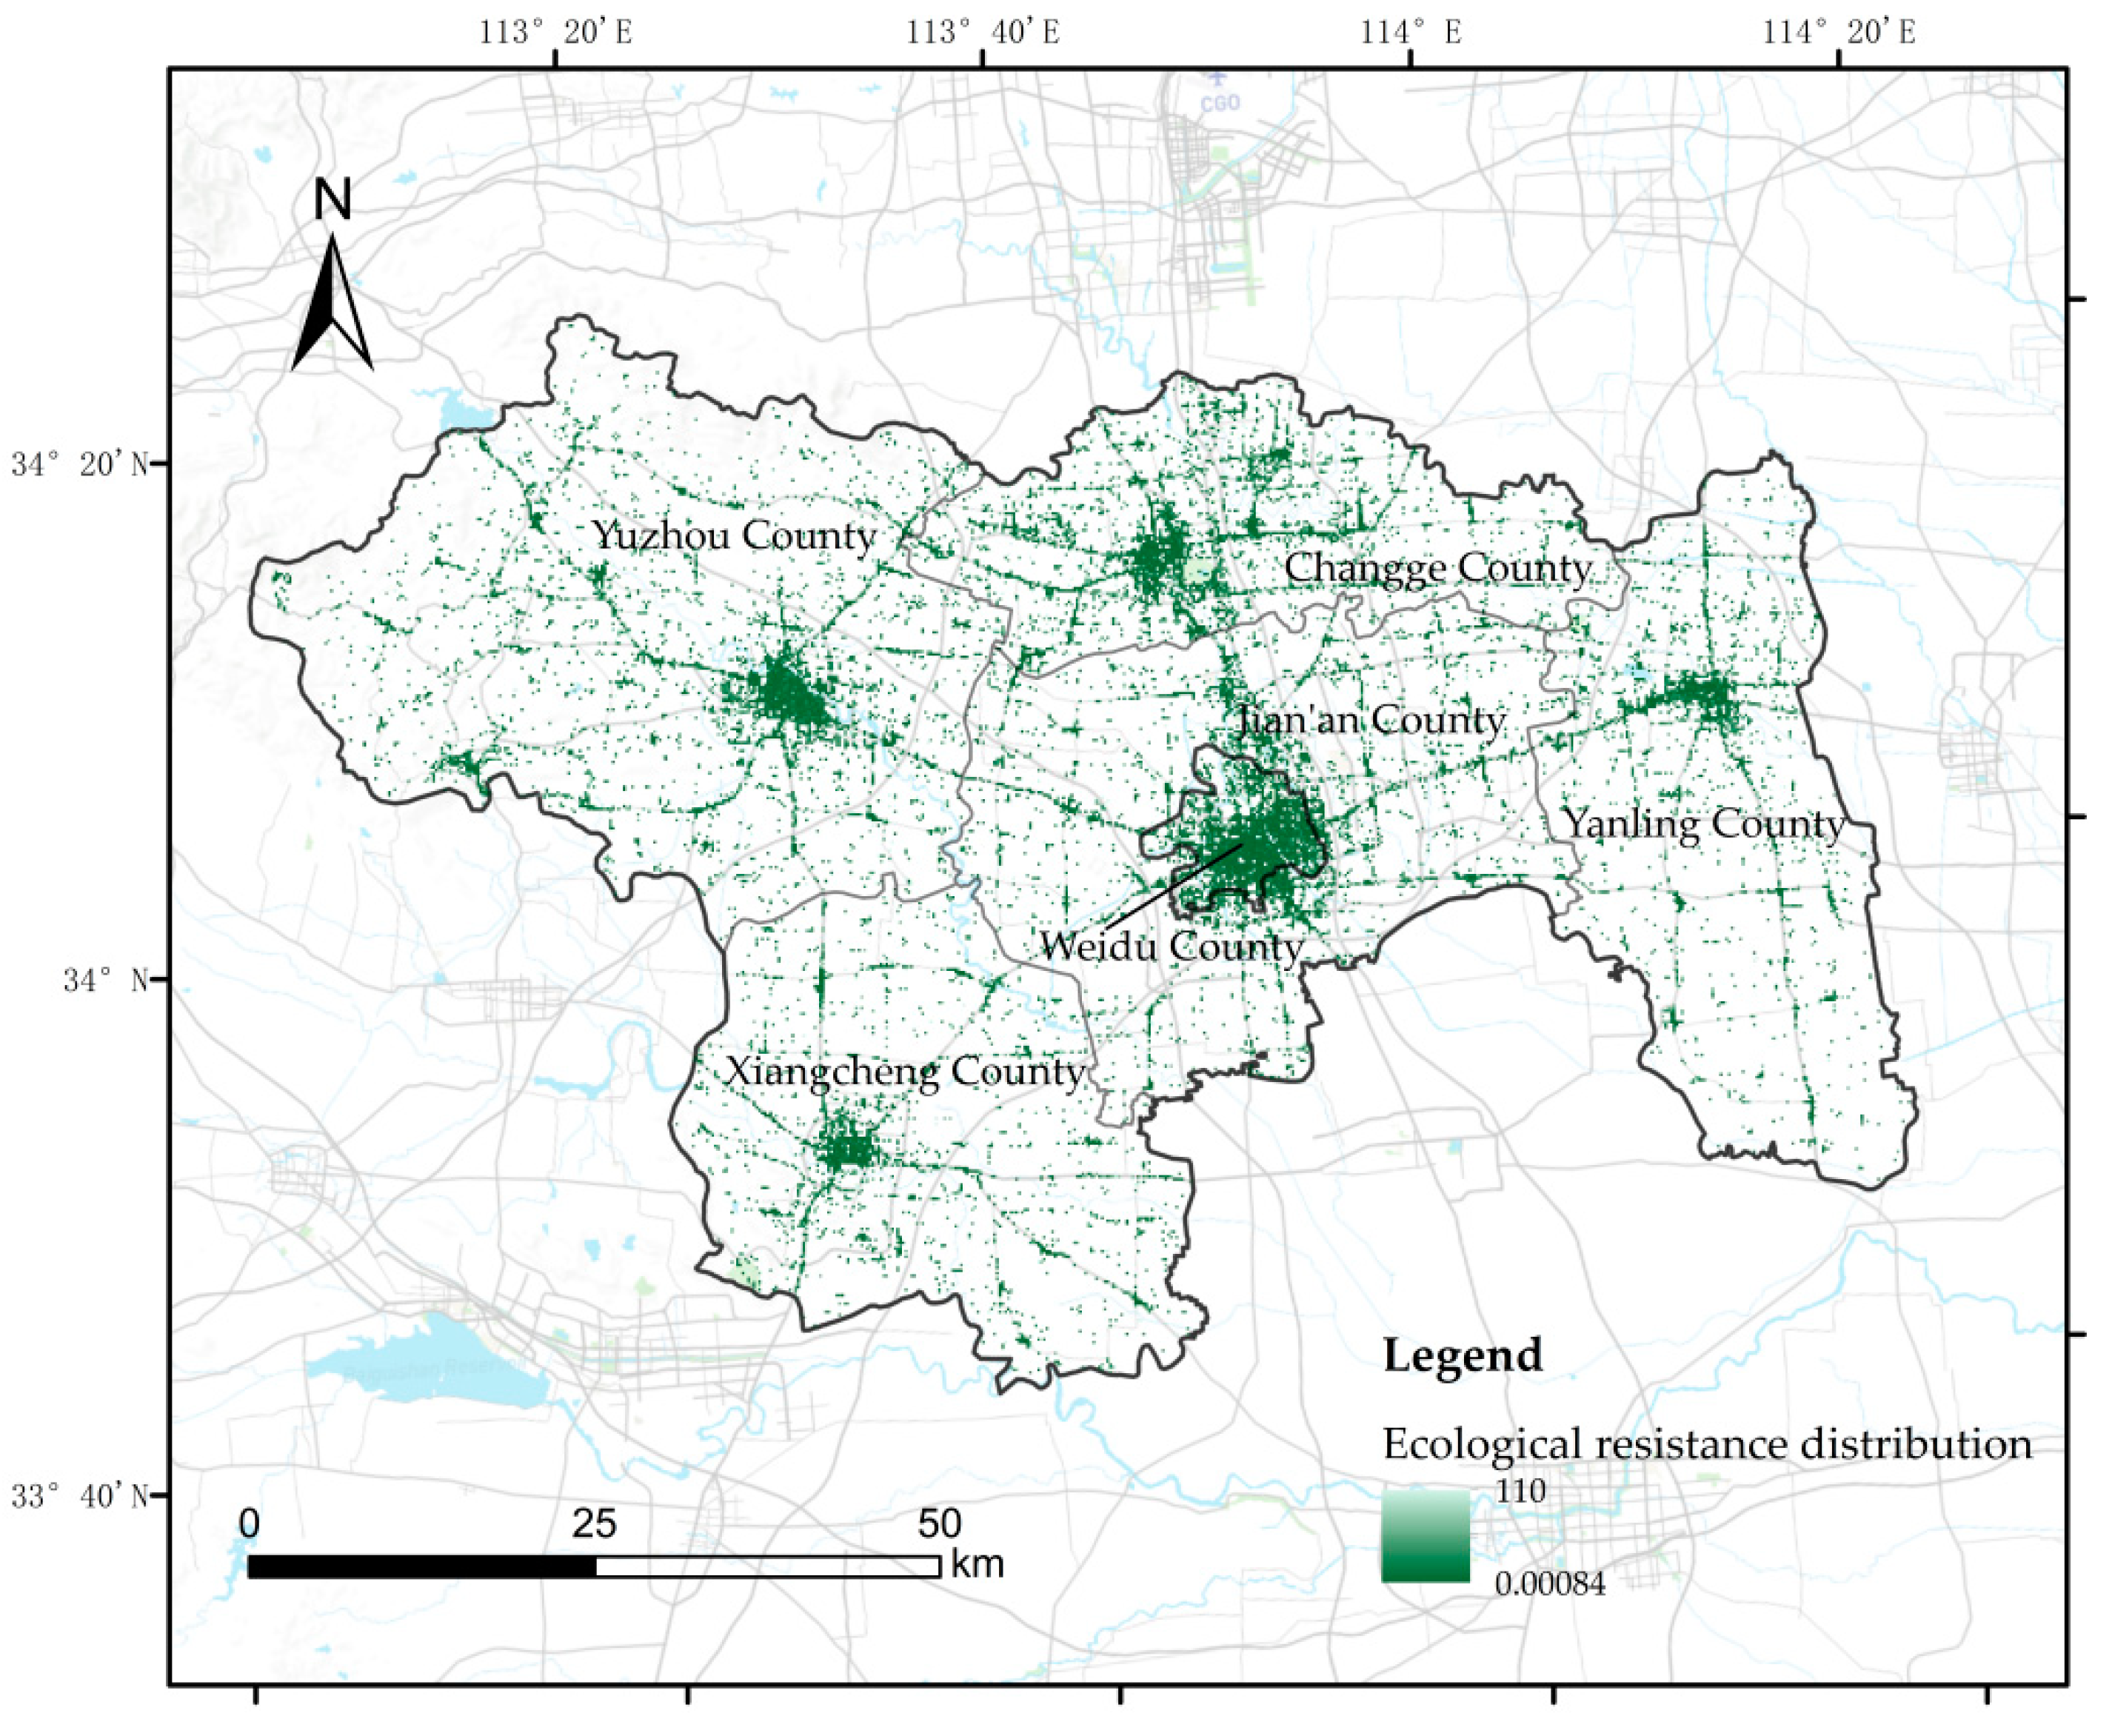
To complete this operation, we first calculate the resistance value of each point in the POI data. Then, based on the grid ID, summarize and sum up each point to obtain a summary of the grid’s resistance values. This will provide us with the cumulative ecological resistance value for each basic unit within the grid. The distribution map of ecological resistance surface in Xuchang City can be obtained, as shown in Figure 4.

4.3.4. Ecological Space Corridor Identification

Once both the ecological plaque data and ecological resistance surface data are prepared, these datasets are utilized to generate ecological corridors.
Initially, the 25 largest patches are selected in descending sequence based on the ecological plaque area size for subsequent analysis. Then, utilizing the cost connectivity tool in SuperMap, the ecological plaque data are inputted as cost grid data along with the ecological resistance surface data. By generating the lowest-cost connectivity network, we obtain the distribution of ecological corridors. Observation indicates that the ecological corridors are predominantly concentrated in the Weidu District. To some extent, this pattern reflects the focal development and outward expansion of urban parks and the urban ecological network in Xuchang City, centering around the Weidu District as the core hub. This also underscores the status of Weidu District as the central urban area of Xuchang City, as depicted in Figure 5.

4.3.5. Screening of Ecological Corridors Based on the Gravity Model

To screen the ecological corridors and ensure suitability for planning and design, the gravity model is employed. This is because some ecological corridors outside the central urban areas are too long, or the ecological patches have an insufficient area. To calculate the ecological patch gravity value, the ecological proportion of each patch is calculated by dividing the ecological weight of each patch by the total weight of that patch. Multiplying the ecological proportion of each patch by the area of that patch yields the gravity value of each patch [55]. Then, the gravity model formula is applied to obtain the interaction force between patches at each endpoint of the ecological corridors. After conducting many experiments, it was observed that ecological corridors with interaction forces exceeding a value of 41 could distinctly delineate the primary distribution of ecological corridor networks within the central urban area of Xuchang City. Consequently, ecological corridors with interaction forces below 41 were eliminated, leaving only 11 corridors within the central urban region of Xuchang that exhibited strong connectivity and high clarity, as depicted in Figure 4.

5. Analysis of Results

5.1. Statistics and Analysis of the Identification Results of Ecological Space Corridors in the Central City Area of Xuchang City

The experimental results indicate that the central urban area of Xuchang comprises 11 ecological corridors: Xudu Park–Central Park, Shuanglong Lake Garden–Baling Bridge Scenic Area, Xudu Park–Pingan Square, Central Park–Luming Lake, West Lake Park–Baling Bridge Scenic Area, Xianghe Garden–West Lake Park, Xudu Park–Zhongyue Sanguan Temple, West Lake Park–Xudu Park, Shuanglong Lake Garden–Xianghe Garden, Baling Bridge Scenic Area–West Lake Park, and Pingan Square–Baling Bridge Scenic Area. The statistical results for the ecological corridor are presented in Table 3.
Combining the overall trend and density distribution of the ecological corridors in Xuchang with the distribution of the selected ecological corridors in the central urban area, it is evident that Baling Bridge Scenic Area, Luming Lake Park, and Pingan Square are crucial ecological nodes. These nodes play a significant role in connecting the ecological corridor from the central urban area of Xuchang to the outer city of Xuchang.

5.2. Analysis of Urban Parks Based on the Word-of-Mouth Score Data from Dianping

To further support the identification results of the ecological corridors in the central urban area and propose corresponding optimization strategies, this study employs public reviews from the Internet to obtain scoring data for all parks in Weidu District. These scores were correlated with the spatial distribution of the parks [56]. Next, we conduct distribution kernel density analysis and Dianping word-of-mouth scores distribution kernel density analysis on the urban parks through which the urban ecological corridors pass. Finally, based on the above analysis results, a distribution analysis of the central grades of the urban parks is conducted.

5.2.1. Analysis of Kernel Density of the Distribution of Green Parks in the Central City of Xuchang

The kernel density analysis of the spatial distribution of the parks in Weidu District was conducted in SuperMap software (iDesktopX 11i) [57] with a search radius set to 1000 m. This analysis provides the kernel density distribution of parks in the central city of Xuchang. As depicted in Figure 6, the kernel density around Xudu Park is the highest, consistent with the results of ecological corridor identification in the central city of Xuchang. Given that Xudu Park is the common intersection point of four ecological corridors, it can be viewed as the optimal location for extending the ecological network in the central city of Xuchang. Additionally, it serves as the center of the urban park system in Weidu District.

5.2.2. Analysis of Kernel Density Based on the Distribution of Word-of-Mouth Score Data from Dianping on Green Parks in the Central City of Xuchang

Based on the word-of-mouth scores and corresponding rankings of Xuchang parks on Dianping, we generated a curve chart in SPSS Pro software depicting the rankings of parks (Figure 7). From the data of a few parks with high word-of-mouth scores, it is evident that only a few green parks in Xuchang meet the high standards of the public, with the majority of Xuchang green parks scoring in the middle-to-low range.
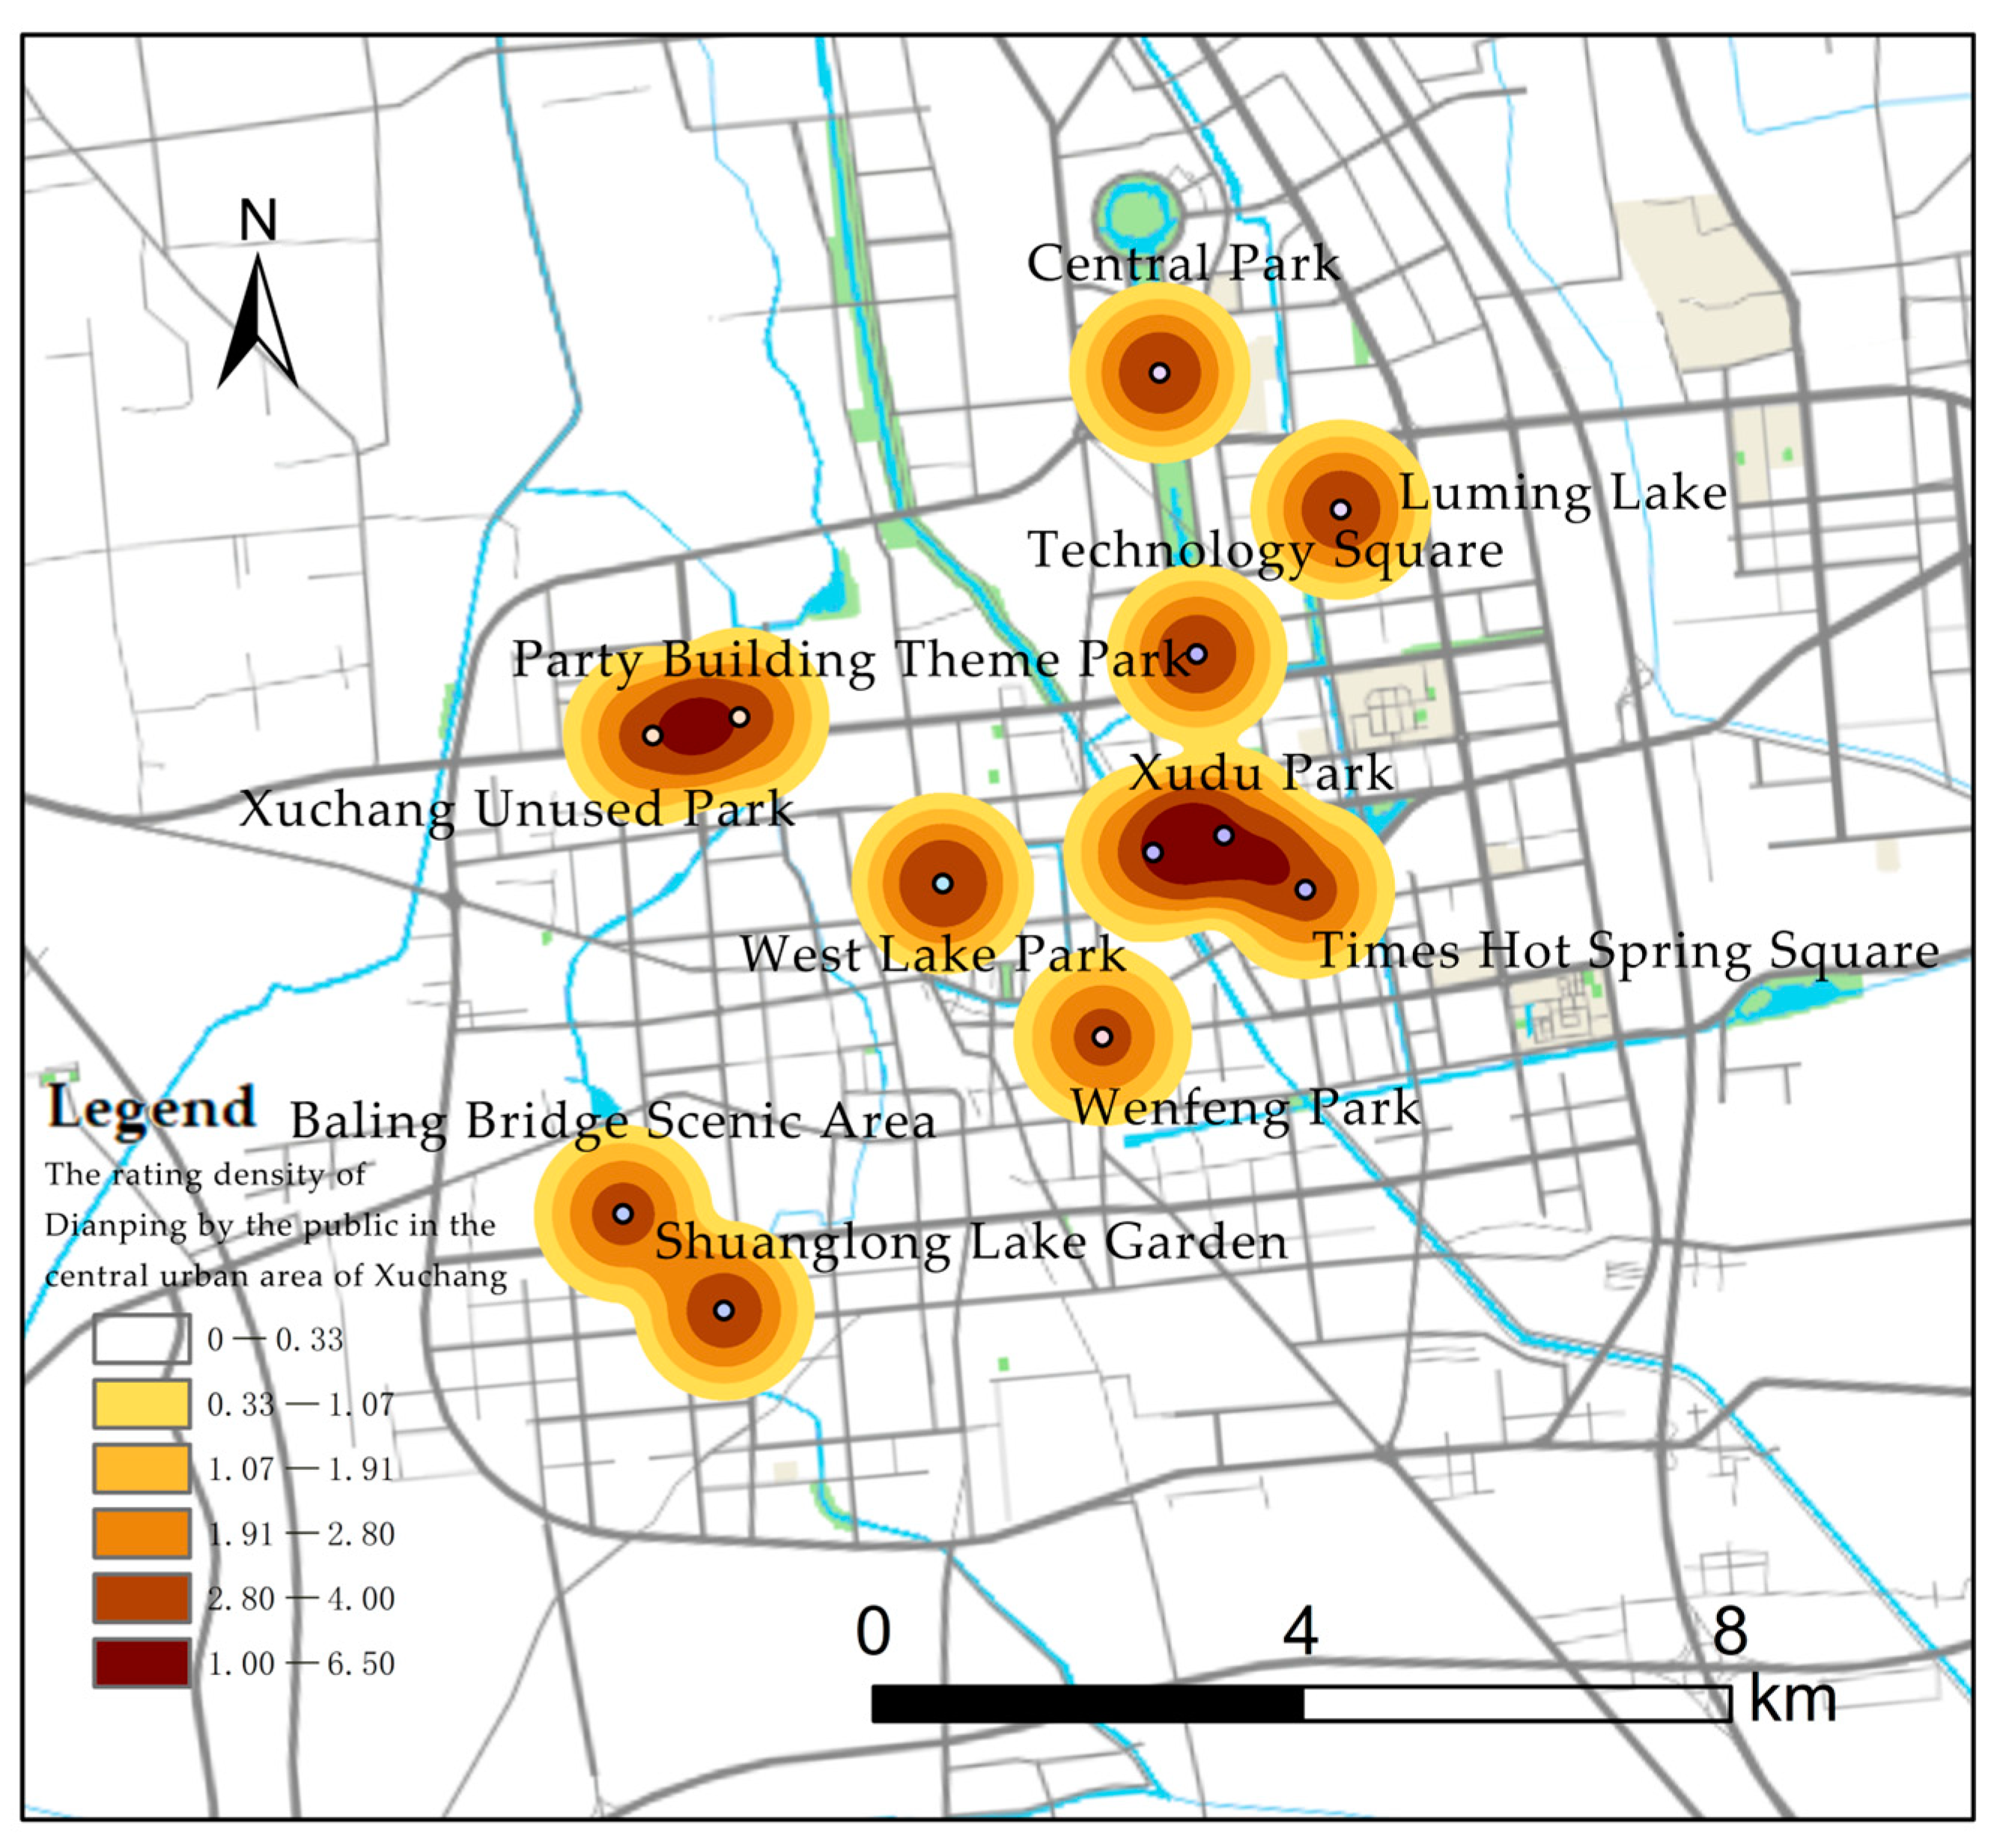
Utilizing park scores as a calculation condition and setting the search radius to 1000 m, we obtained the kernel density of the Dianping score for the central urban area of Xuchang. This simulation represents the spatial distribution of green parks in the central urban area of Xuchang. Figure 8 illustrates that the green parks surrounding Xudu Park have the highest visitor scores. Therefore, it is more likely that Xudu Park, as the core of urban ecological network development, will obtain recognition from citizens in the future.

5.2.3. Grade Distribution Analysis of Park Centers in Xuchang City

POI data on public facilities sourced from the Internet often depend on the urban construction environment and the level of urbanization. More developed construction environments and higher levels of urbanization yield richer POI data for public facilities. There exists a mutual relationship between urbanization levels and the degree of commercial development. Consequently, when evaluating the grade of an urban park center, it is possible to analyze the business district to which city parks belong as the basic unit for determining their service area. In SuperMap, each park is classified according to the business district it belongs to as indicated on Dianping, with this classification field being established accordingly. Based on the POI data of green parks, the average center of each business district is determined. Subsequently, using the Voronoi polygon tool to divide the park service area based on the average center of each business district, it was found that areas with denser average centers had smaller park service areas, while areas with sparser average centers had larger park service areas.
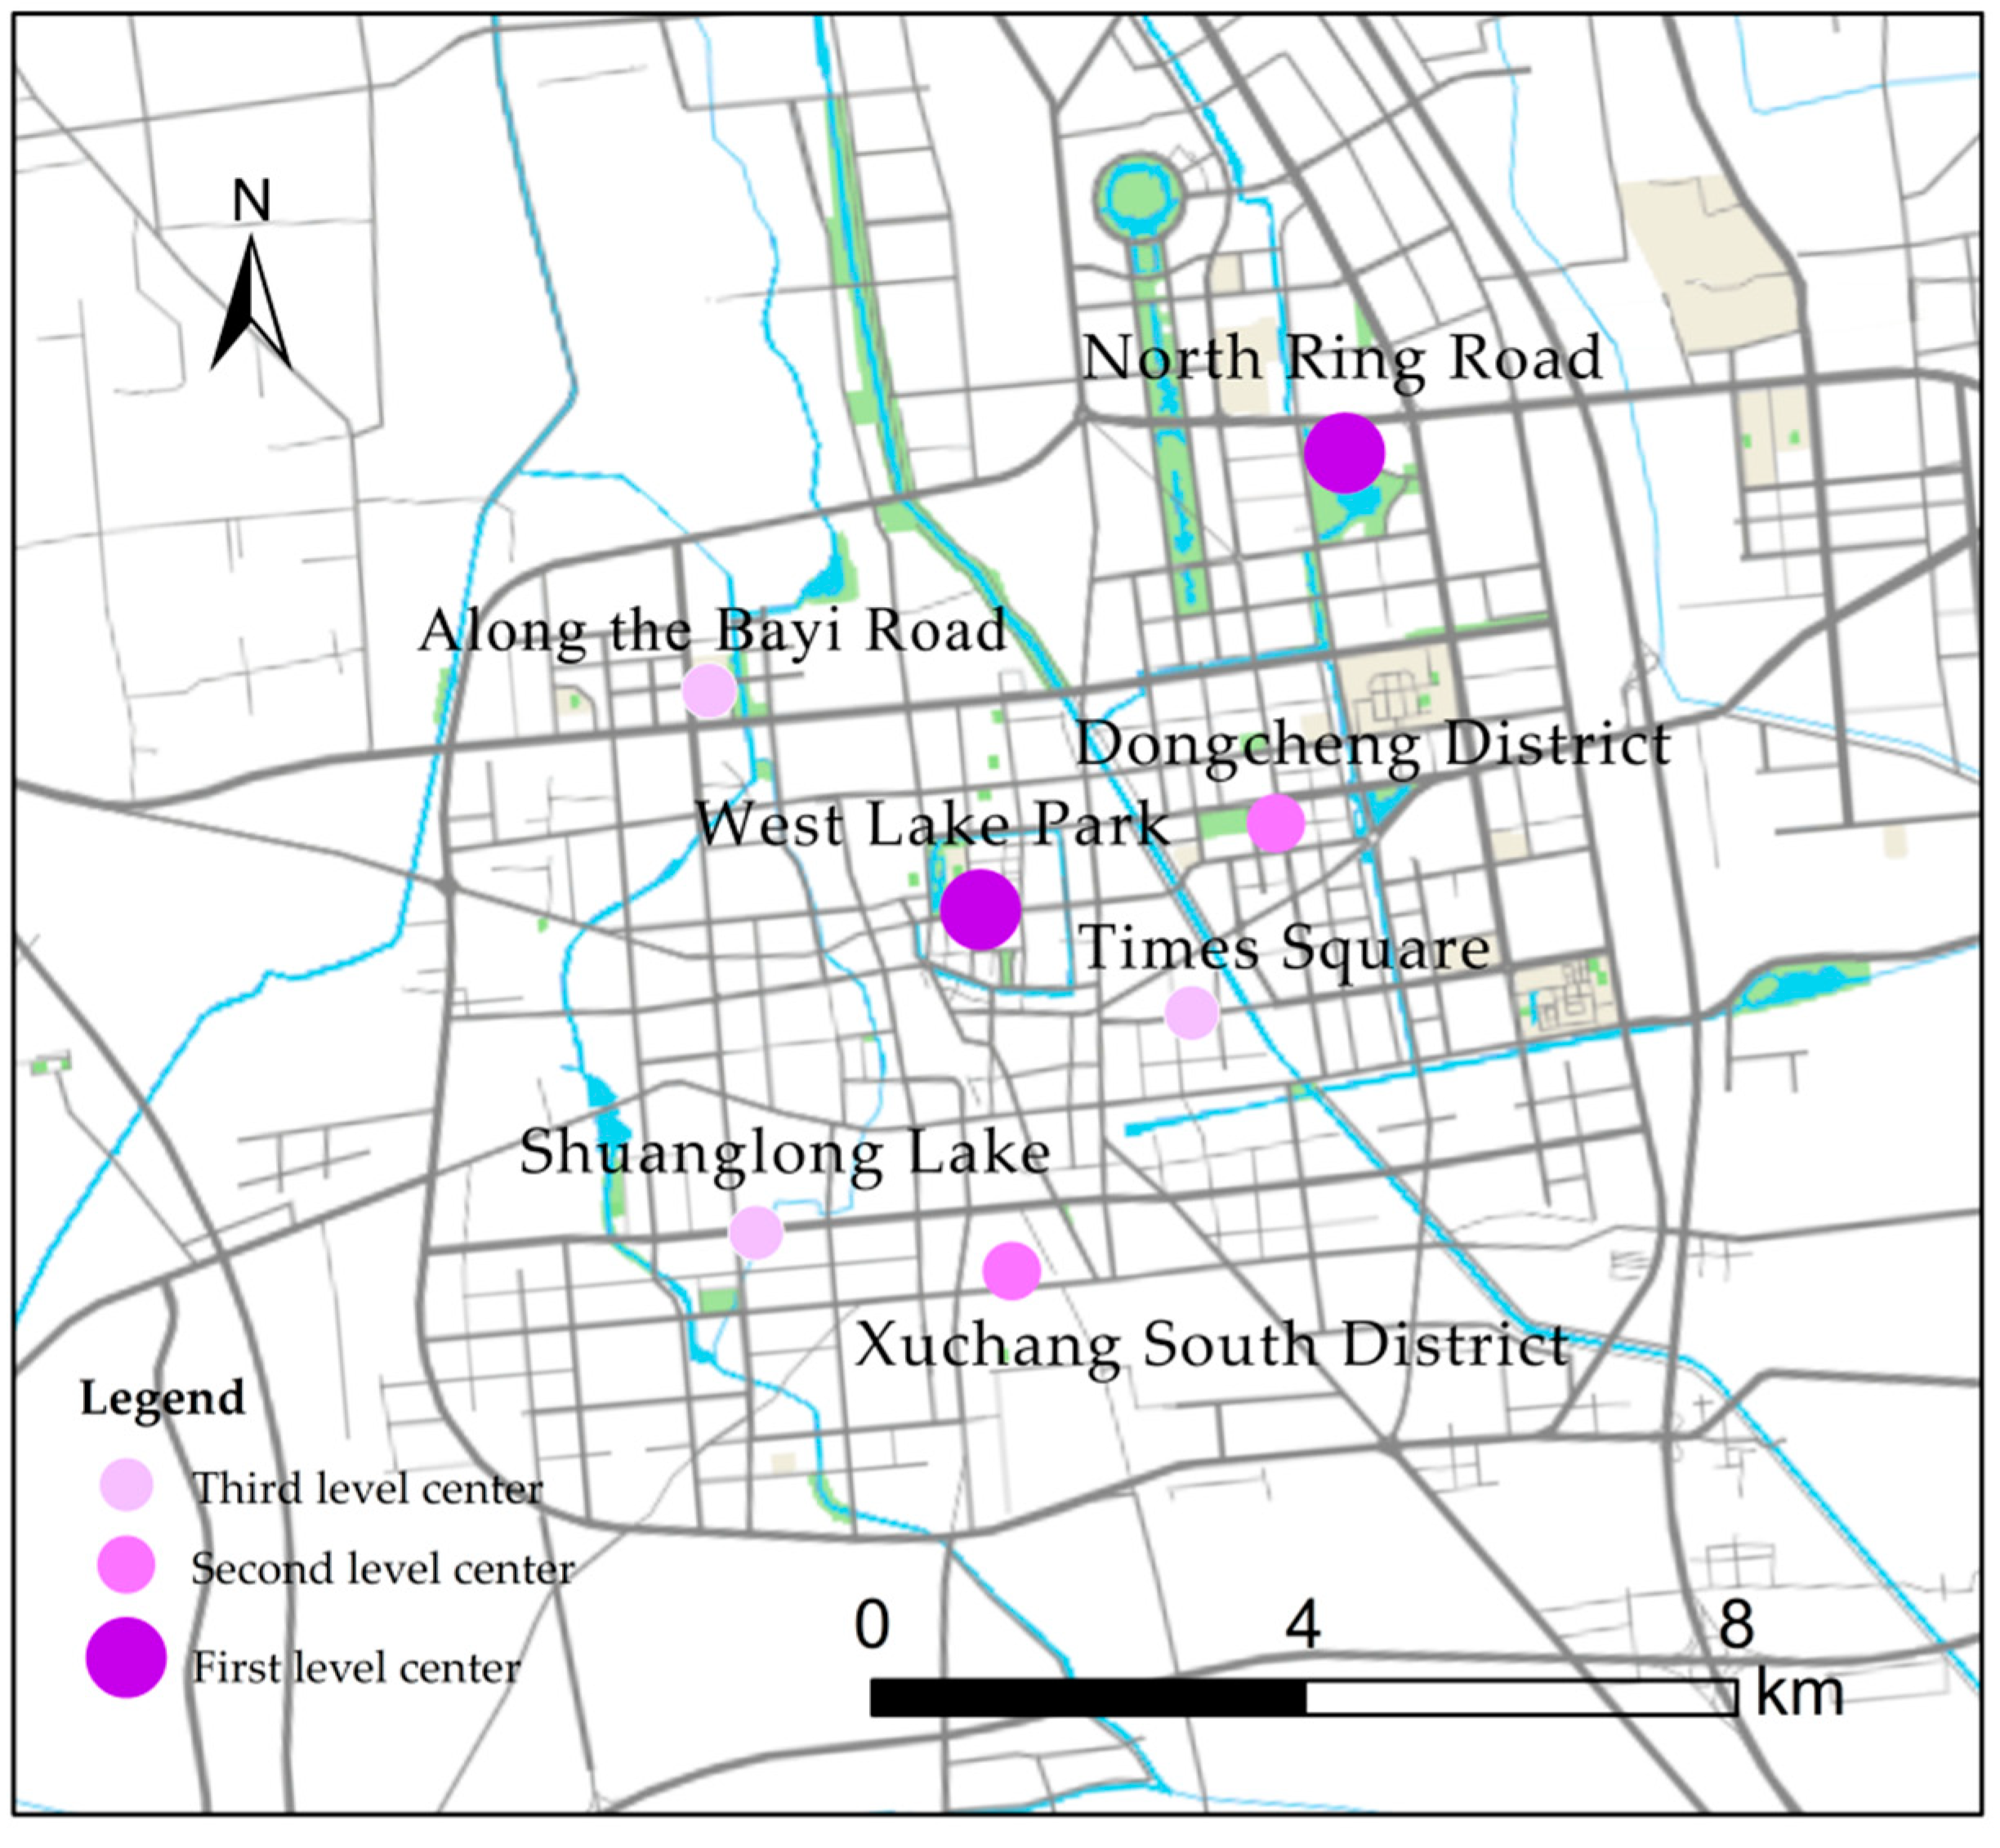
Following this, level values are assigned to central urban green space parks using the distribution kernel density results of these parks and the kernel density results of the public ratings from Dianping. By averaging the sum of the highest-level values for distribution kernel density and rating kernel density in each business district, the hierarchical distribution system of urban parks in the central area of Xuchang City is established. As depicted in Figure 9, a “2, 2, 3” structure emerges, and West Lake Park in the West Lake Park business district and Luming Lake Park in the North Ring business district serve as cores of the urban park system. Additionally, Xudu Park in the Dongcheng District business district and Xianghe Garden in the Xuchang South District business district are subcenters of the urban park system. The green space parks surrounding the Times Square, Shuanglong Lake, and Bayi Road business districts serve as secondary centers.

5.3. Sentiment Analysis of Urban Parks Based on Dianping Review Data

To better understand the specific experience and needs of citizens in the parks along the urban ecological corridor for subsequent optimization of the ecological space network layout, several representative green parks along the ecological corridor were selected for citizen evaluation and analysis. Since six parks (led by Xudu Park) had the largest construction scales in Weidu District, and these parks had more comments from tourists on the Dianping platform, other parks in the study area were not suitable for analysis due to their small size or having too few comments. Therefore, Xudu Park, West Lake Park, Luming Lake Park, Baling Bridge Scenic Area, Central Park, and Shuanglong Lake Park were selected for the sentiment analysis of citizen evaluation text data.

5.3.1. Build a Thesaurus of Perceptual Elements

We gathered all tourist review data entered for six park attractions, including Xudu Park, on the Dianping platform, totaling 320 entries. Initially, the comment data were subjected to cleaning to eliminate empty content such as empty lines and emoticons. Subsequently, the comment data were processed and filtered using the Jieba database in Python. Following this, word frequency statistics were conducted on the comment data after removing stop words, resulting in the extraction of high-frequency feature vocabulary from the text and the creation of a vocabulary frequency table.
Next, meaningful perceptual elements were identified from words appearing more than twice, and a word bank of perceptual elements was compiled from three dimensions: the user dimension, the traffic process dimension, and the park dimension. Given that the urban ecosystem comprises natural, economic, and social systems, the vocabulary of the perceived elements was classified and summarized based on the characteristics of natural, economic, and cultural elements in urban parks, as illustrated in Table 4.

5.3.2. Text Segmentation and Emotion Classification

The content of each social media text datapoint encompasses multiple sensory perception dimensions that comprehensively reflect the perception of the sample park. Therefore, it is essential to segment and parse each text datapoint to optimize the correspondence between park elements and perceptual elements in each text datapoint.
Subsequently, the Tencent Cloud API sentiment analysis interface tool is employed to identify the emotion polarity of the text-segmented comment data. The identification results are output as positive or negative probabilities. The proportion of comment text for each index is then obtained based on the results of the sentiment analysis and the thesaurus of perceptual elements, as depicted in Table 5.
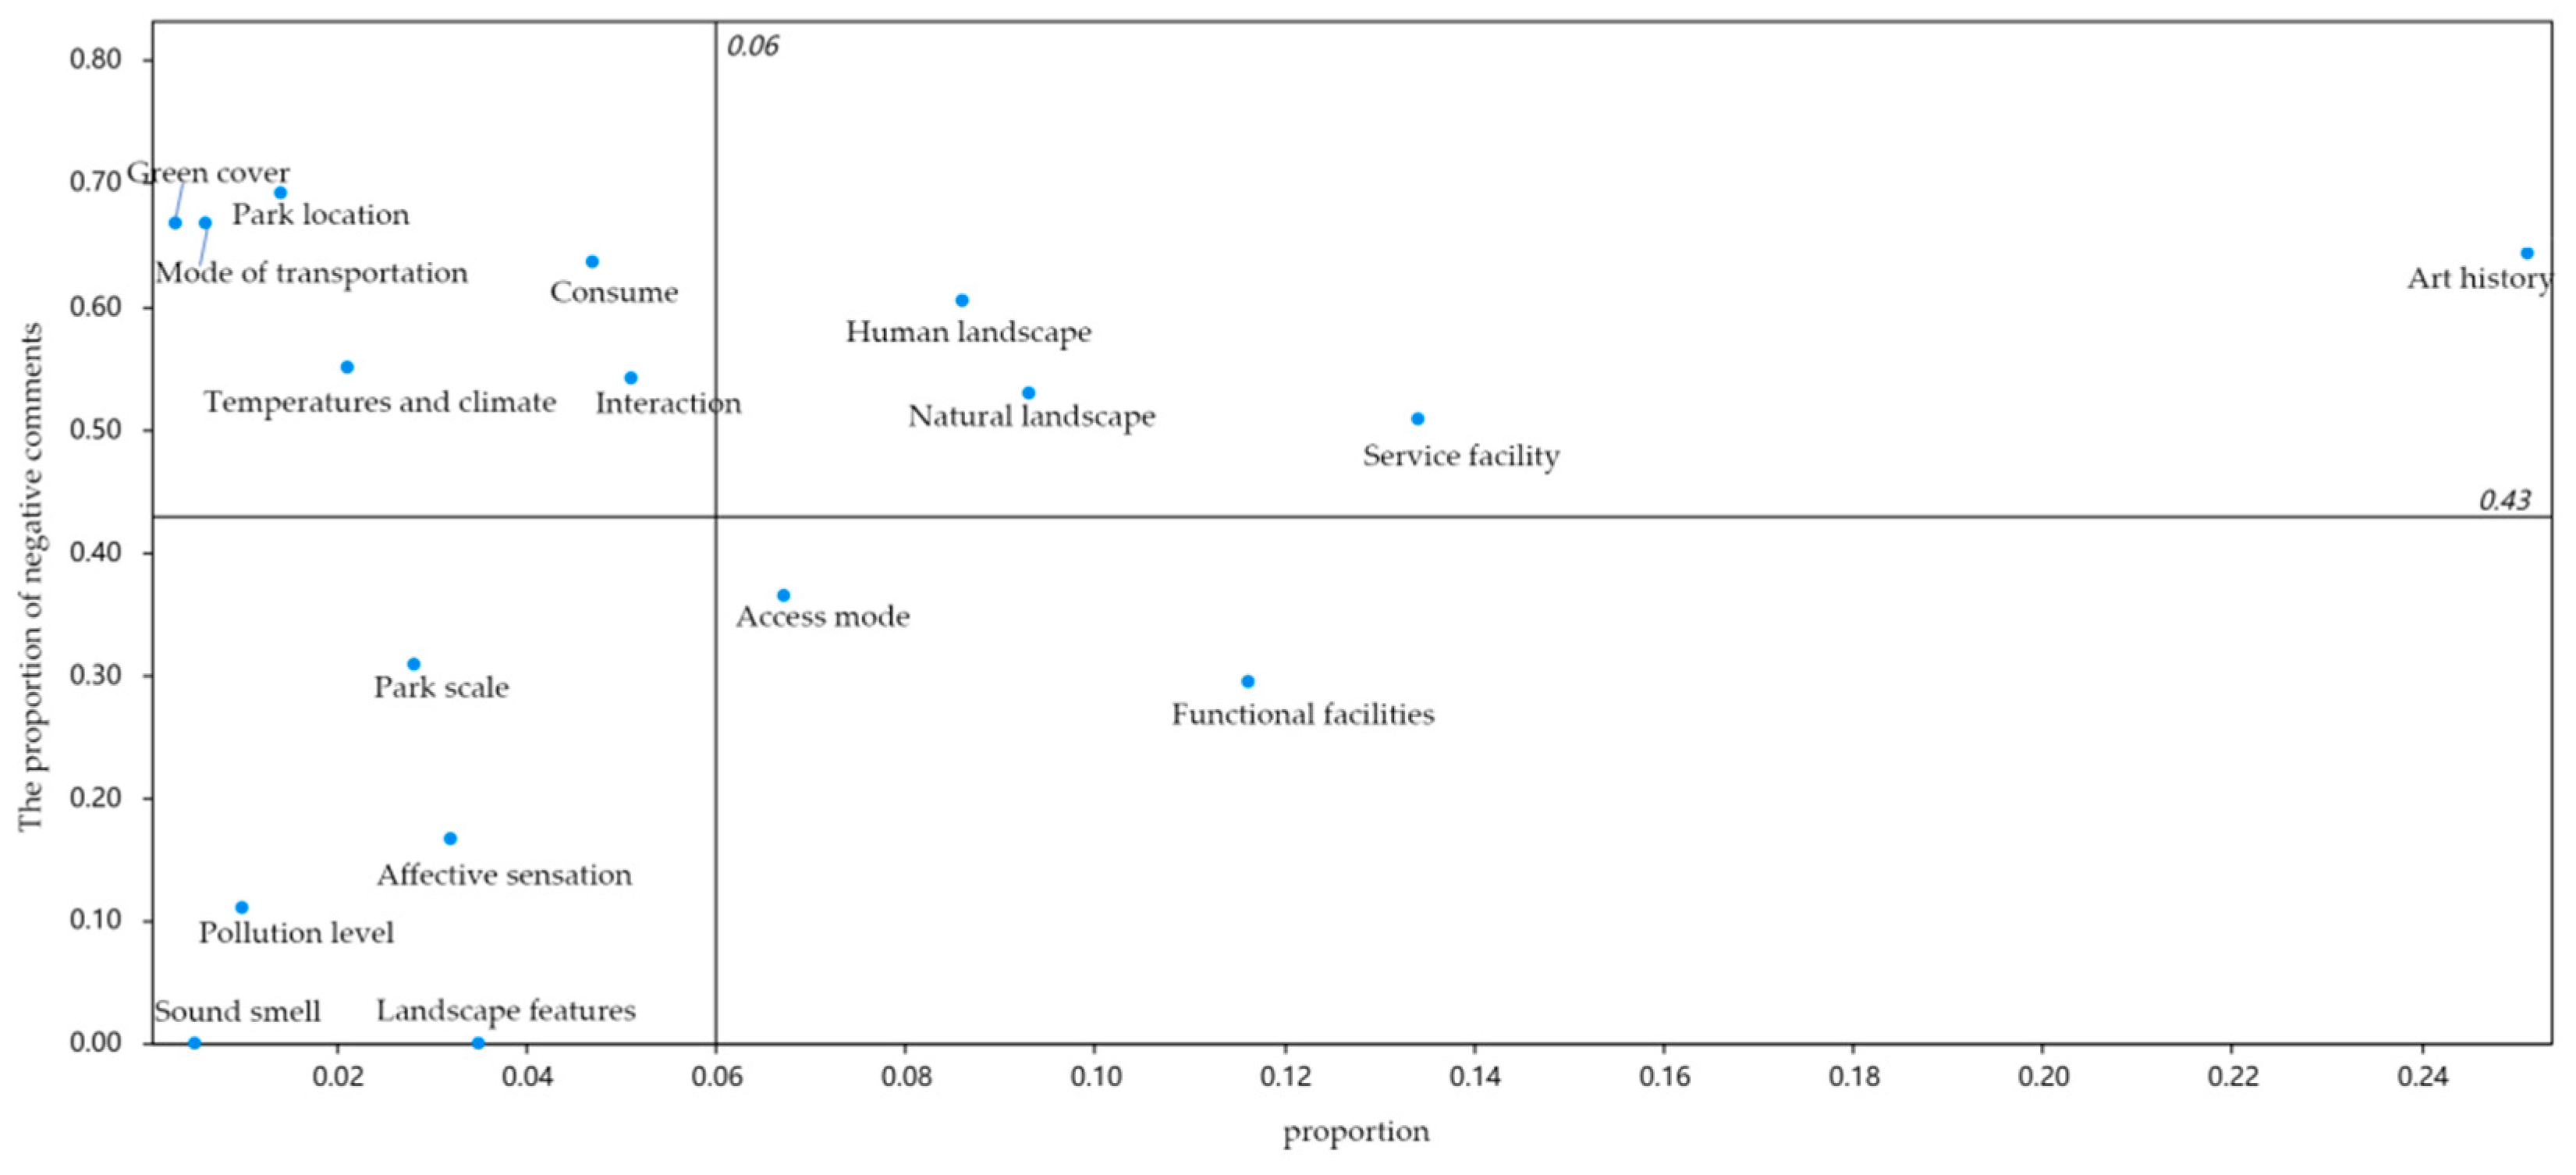
Classifying comments based on the number of comments and the proportion of negative comments, the results of the perception evaluation model of the central city park system can be obtained, as depicted in Figure 10 and Figure 11.
Based on the sentiment analysis, the proportion of comments pertaining to the category of human history is the highest, indicating that citizens are more prone to evaluating urban parks’ cultural and historical environments. Negative comments regarding city park service facilities, park location, interaction, transportation, greening, temperature, cultural landscape, cultural history, consumption, and natural landscape collectively constitute more than 50% of the total number of comments. Among these, the top three categories with the highest proportion of negative comments are park location, green coverage, and modes of transport. Optimization strategies can be formulated by considering the specific content of related comments.

6. Discussion

Based on the identification results of ecological corridors within the central urban area and the outcomes of the spatial analysis and sentiment analysis conducted on Dianping data, this study carries out a comprehensive comparison and discussion. From the distribution of ecological corridors within the central urban area to those outside, combined with spatial analysis and textual analysis, we derived three strategies for optimizing the ecological layout of Xuchang’s central urban area [58].

6.1. Central City Geospatial Optimization

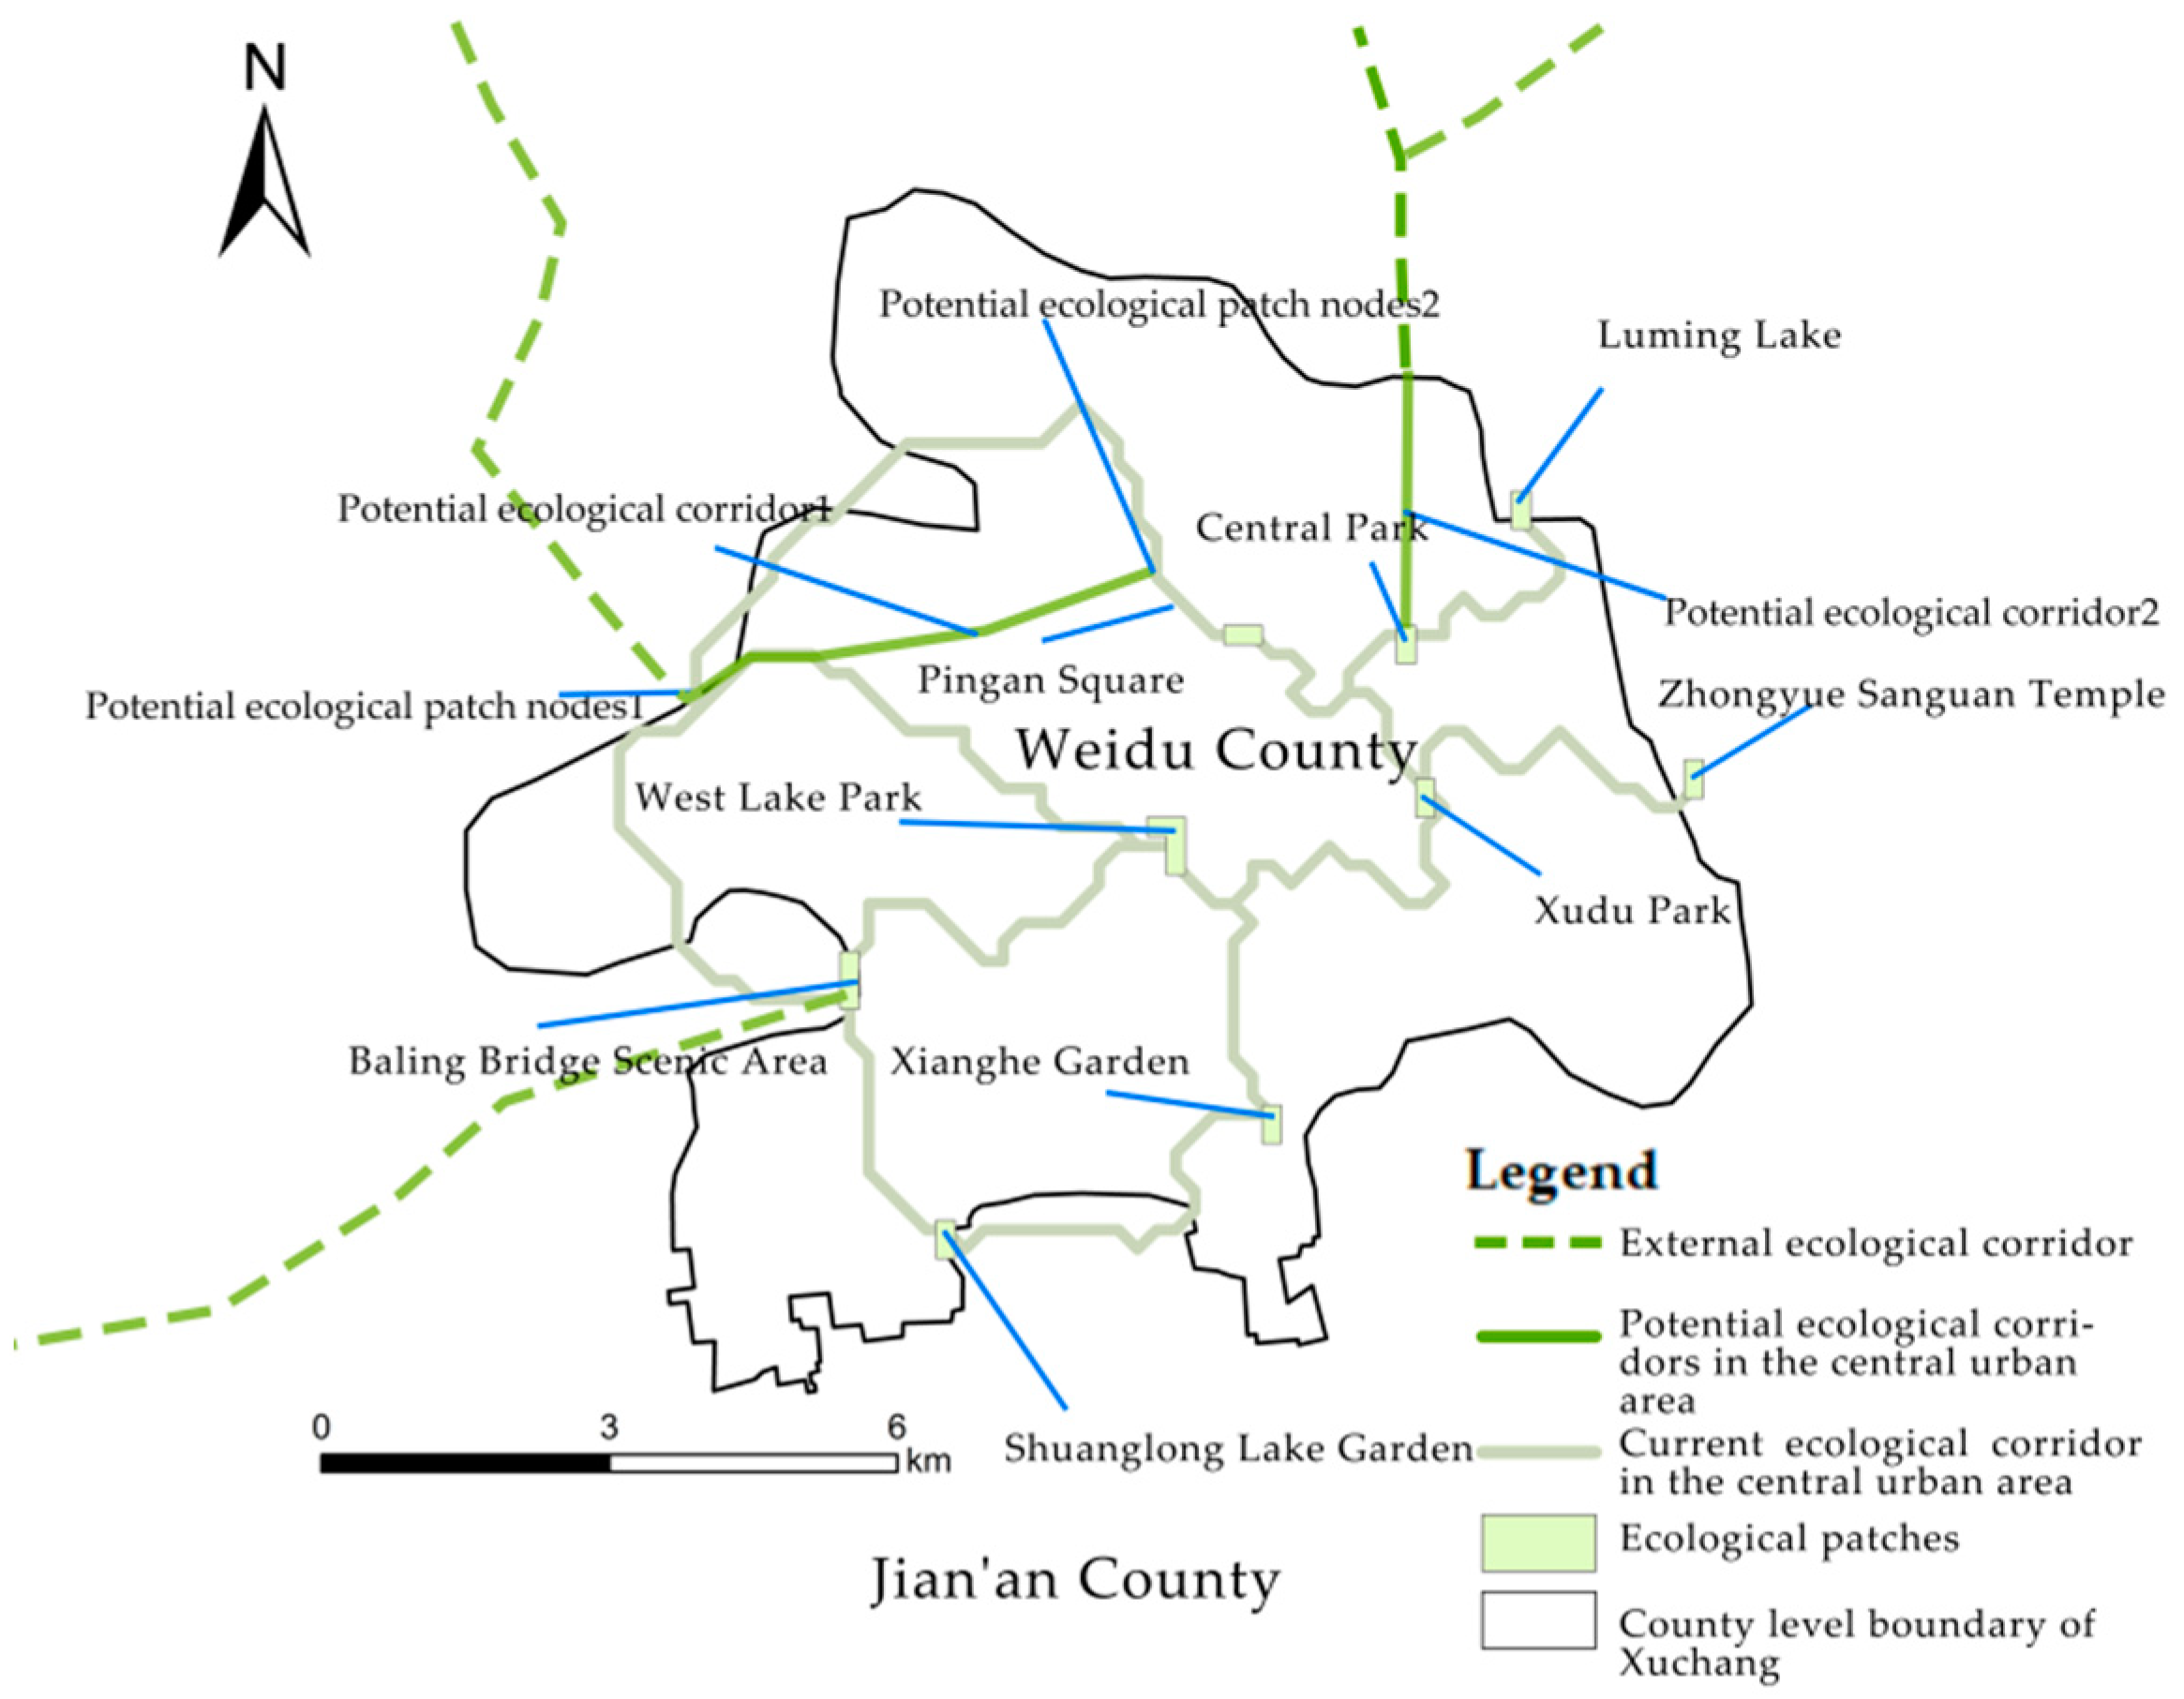
Through an analysis of the distribution of existing ecological corridors in the central city of Xuchang, this study recommends that future urban ecological corridor planning should consider constructing two central city ecological corridors with significant development potential. As illustrated in Figure 12, a potential corridor originates from two ecological nodes northwest of the city center. Node 1 lies at the convergence of three existing ecological corridors, and Node 2 is in proximity to the Xuchang City Party Construction Theme Park and the Reproducing the Three Kingdoms Theme Park. Another potential corridor extends from Central Park in the East New District of Weidu District northwards to the city’s periphery.
An analysis of public review data reveals that the majority of urban parks in the central city area of Xuchang have poor accessibility and an inefficient use of space. The northwest area of Weidu District in Xuchang City represents the old city, which is currently undergoing urban redevelopment. The eastern new city serves as the new development zone, linking to Zhengzhou for future expansion. With ample development and construction resources in recent years, there is an opportunity to optimize and elevate the Party Building Theme Park and the Reproducing the Three Kingdoms Theme Park through this potential ecological corridor. Additionally, the main traffic routes in the old city can be suitably widened to enhance connectivity between the new and the old city areas while increasing park access points to better serve surrounding residents. For the urban ecological corridor housing Central Park, improvements in horizontal traffic accessibility are imperative due to the corridor’s considerable length.
By optimizing the transportation nodes surrounding the urban park traversed by the ecological corridor, there is significant potential to realize the nested coupling of urban and ecological spaces, thereby enhancing city resilience and the ecological quality of human settlements [59].

6.2. Construction of Key Ecological Points in the Central Urban Area

To align with future urban development, emphasis should be placed on the construction of urban park systems in the northwest of Weidu District, with a particular focus on optimizing existing green spaces such as Pingan Square, the Party Building Theme Park, and the Reproducing the Three Kingdoms Theme Park. This optimization effort should prioritize enhancing spatial interactivity among these parks to encourage participation and communication among local residents. Furthermore, the continuous improvement of West Lake Park and Luming Lake Park in the central city is vital for enhancing the ecological network and connectivity between the north and south ends of the city.
Data analysis from the Dianping platform reveals that most parks in the central area of Xuchang emphasize historical and cultural characteristics but overlook ecological benefits. Therefore, it is imperative to increase the proportion of natural landscape and green coverage in future park construction to enhance ecological value.
Optimizing urban parks along ecological corridors requires attention to geographical location, interactivity, accessibility, greening degree, cultural landscape, historical value, tourist consumption behavior, and the natural beauty of each park. This approach not only strengthens the protection of key sites, but also enhances connectivity between corridor nodes, thereby improving the coherence of the overall urban ecological network.

6.3. Extend the Supply of Ecological Space

In future urban ecological network construction, it is imperative to strengthen connections between the central urban area and the surrounding urban regions. Three outward-extending ecological corridors in the central urban area can be developed: (1) potential ecological corridor 1, extending to Yuzhou City and Changge City; (2) potential ecological corridor 2, extending from Furong Lake in the north of Central Park in Weidu District to Beihai Park in Jianan District and Flower Expo Park in Yanling County; and (3) Baling Bridge Scenic Spot in Weidu District to Ziyun Mountain Scenic Spot in Xiangcheng County. These developments will establish three district-level ecological corridors, as illustrated in Figure 12. By strategically placing public facilities along these ecological corridors, connections between counties and cities will be bolstered, enabling cross-regional linkages across various ecological patches. This will regulate the urban climate, mitigate the urban heat island effect, and enhance regional ecological benefits.
Given that the number of urban parks in Xuchang City gradually decreases, with their density being high to low with Xudu Park as the central axis, it is crucial to develop an urban park system with Xudu Park at the center. In the future, Xuchang City should focus on improving the quality of Xudu Park, strengthening the connectivity of Xudu Park with surrounding parks and other parks across the city. In addition, more ecological green corridors should be constructed between regions, and the multi-branch development of urban ecological corridors must be promoted to extend the ecological benefits of urban parks in Weidu District.
Improving urban park facilities and climate conditions throughout the ecological corridor, along with the integration of ecological elements and other urban development aspects, can introduce more ecological elements encompassing production and living functions. This expansion of ecological space supply aims to realize the coordinated growth and development of urban park systems across different regions.

7. Conclusions

In this study, Weidu District in the central city of Xuchang City, Henan Province, was chosen as a sample to gain a deep understanding of urban ecological space corridor structures by quantitatively identifying the “production–living–ecological space”. Utilizing multi-source geospatial data, eleven primary ecological corridors in the central urban area of Xuchang City were systematically identified and extracted. Among these, Xudu Park serves as a common intersection point for four ecological corridors. Its geographical position is considered the starting point of the extended ecological network in the central urban district of Xuchang and also constitutes the central zone of the Weidu District urban park system. Based on the rating data from the Dianping platform, the green parks in the vicinity of Xudu Park received the highest visitor scores, indicating that future efforts to develop Xudu Park as a keystone of the urban ecological network are likely to gain greater acceptance among citizens. Integrating the distribution of Points of Interest (POIs) and public sentiment, West Lake Park and Luming Lake Park are identified as cores of the urban park system, with Xudu Park and Xianghe Garden serving as sub-centers. Additionally, the green parks around the Times Square business district, Shuanglong Lake business district, and Bayi Road business district are recognized as secondary centers. The analysis of Dianping platform comments reveals that, for the majority of parks in the central area of Xuchang, there is a significant emphasis on integrating local historical and cultural elements with negligible attention given to space usage efficiency and ecological benefits. Through the comprehensive application of the gravity model and word-of-mouth rating data, a detailed evaluation of the park system in the central city was conducted. The research findings indicate that the urban park system in the northeast new area of the central urban area demonstrates a more reasonable and well-structured spatial layout. However, the ecological corridor in the northwest exhibits a relatively long spatial dimension, suggesting that the urban parks in this area may be small, provide limited ecological benefits, or be insufficient in number.
Building upon these findings, it is proposed to significantly enhance the ecological value and public benefits of existing urban parks through the optimization of the network layout, the construction of ecological nodes, and the expansion of the service scope of ecological space. By innovatively combining POI data identification methods and a comprehensive analysis of network user comment data, this study achieves the integration of subjective and objective evaluations of the urban park system in the central city of Xuchang, thus ensuring wider public recognition and emphasizing the influence of the research results and optimization suggestions.
However, despite providing a new research perspective and a practical urban planning method, this study lacks perspective on the spatial construction of urban ecosystems. Future research endeavors should focus on the complexity of urban ecosystems, information exchange in ecological spaces, and energy flow to penetrate the multidimensional complexity of urban ecological structures. Future work will provide more robust theoretical and practical support for the construction of park cities and sustainable urban environment improvement.

Author Contributions

Conceptualization: Conceptualization: Wenyu Wei and Shaohua Wang; Methodology: Wenyu Wei; Formal analysis and investigation: Wenyu Wei; Writing—original draft preparation: Wenyu Wei and Shaohua Wang; Writing—review and editing: Xiao Li, Junyuan Zhou, Yang Zhong, Pengze Li, and Zhidong Zhang. All authors have read and agreed to the published version of the manuscript.

Funding

This study was financially supported by the National Key R&D Program of China (Grant No. 2023YFF0805904), Talent introduction Program Youth Project of the Chinese Academy of Sciences (E43302020D, E2Z105010F), and Innovation Group Project of the Key Laboratory of Remote Sensing and Digital Earth Chinese Academy of Sciences (E33D0201-5).

Data Availability Statement

The analysis datasets for the current study are available from the corresponding author on reasonable request ([email protected]).

Acknowledgments

The author would like to thank two supervisors for their guidance and support during this study, as well as the reviewers for their constructive comments on previous versions of the manuscript.

Conflicts of Interest

The authors declare no conflicts of interest.

References

  1. Ignatieva, M.; Stewart, G.H.; Meurk, C. Planning and design of ecological networks in urban areas. Landsc. Ecol. Eng. 2011, 7, 17–25. [Google Scholar] [CrossRef]
  2. Jenkins, J.; Fleenor, A.; Dietz, F. Moving Beyond the Frame: Geovisualization of Landscape Change Along the Southwestern Edge of Yosemite National Park. J. Geovis. Spat. Anal. 2019, 3, 9. [Google Scholar] [CrossRef]
  3. Rinaldo, A.; Gatto, M.; Rodriguez-Iturbe, I. River networks as ecological corridors: A coherent ecohydrological perspective. Adv. Water Resour. 2018, 112, 27–58. [Google Scholar] [CrossRef] [PubMed]
  4. Zhou, Y.; Chen, M.; Li, B.; Li, M.; Yu, J.; Chen, J. Optimization of urban green space ecological network based on dynamic changes in spatial connectivity. J. Chin. Urban For. 2023, 21, 23–32. [Google Scholar] [CrossRef]
  5. Zang, T.; Li, X.; Zhang, L. Ecological civilization thought evolution process from urban green space system to urban ecosystem—Taking Shanghai as an example. Landsc. Archit. Acad. J. 2021, 38, 25–30. [Google Scholar] [CrossRef]
  6. Wang, W.; Liu, C.; Chen, Y.; Zhang, Y. Core meaning and scientific path of the concept of open sharing of urban park green spaces under the goal of park city. Landsc. Arch. 2023, 30, 28–34. [Google Scholar] [CrossRef]
  7. Jiang, H.; Hou, L.; Liu, S. Research on the planning and construction of the park city in Guangming district, Shenzhen. Guangdong Landsc. 2019, 41, 46–50. [Google Scholar] [CrossRef]
  8. Wei, W. Research on the construction of urban ecological network system based on territorial spatial planning. Intell. Build. Smart City 2023, 07, 39–41. [Google Scholar] [CrossRef]
  9. Li, N.; Wu, K. Research on the identification and distribution characteristics of urban functional zones based on POI data. Remote Sens. Technol. Appl. 2022, 37, 1482–1491. [Google Scholar] [CrossRef]
  10. Zhan, M.; Zhu, J. Research on the identification and spatial layout optimization of ecological space corridors in mega-cities based on POI data: A case study of Shenyang’s central urban area. Chin. Gardens 2021, 37, 112–117. [Google Scholar] [CrossRef]
  11. Hao, M.; Liu, D. Ecological network construction based on interest point recognition of habitat risk: A case study of Wuhan metropolitan area. Chin. J. Appl. Ecol. 2023, 34, 2471–2480. [Google Scholar] [CrossRef]
  12. Zheng, T.; Yan, Y.; Zhang, W.; Zhu, J.; Wang, C.; Rong, Y.; Lu, H. Landsense assessment on urban parks using social media data. Acta Ecol. Sin. 2022, 42, 561–568. [Google Scholar] [CrossRef]
  13. Xu, X.; Wang, S.; Rong, W. Construction of ecological network in Suzhou based on the PLUS and MSPA models. Ecol. Indic. 2023, 154, 110740. [Google Scholar] [CrossRef]
  14. Tandarić, N.; Ives, C.D.; Watkins, C. From city in the park to “greenery in plant pots”: The influence of socialist and post-socialist planning on opportunities for cultural ecosystem services. Land Use Policy 2022, 120, 106309. [Google Scholar] [CrossRef]
  15. Li, J.; Tang, B. Requirements for urban park construction under the concept of “park city”. Urban Des. 2023, 08, 6–13. [Google Scholar]
  16. Semenzato, P.; Costa, A.; Campagnaro, T. Accessibility to urban parks: Comparing GIS based measures in the city of Padova (Italy). Urban For. Urban Green. 2023, 82, 127896. [Google Scholar] [CrossRef]
  17. Huang, B.X.; Chiou, S.C.; Li, W.Y. Landscape pattern and ecological network structure in urban green space planning: A case study of Fuzhou city. Land 2021, 10, 769. [Google Scholar] [CrossRef]
  18. Ríos-Alvear, G.; Meneses, P.; Ortega-Andrade, H.M.; Santos, C.; Muzo, A.E.; Opez, K.G.L.; Bentley, A.G.; Villamarín, F. Key connectivity areas in the Llanganates-Sangay Ecological Corridor in Ecuador: A participative multicriteria analysis based on a landscape species. Landsc. Urban Plan. 2024, 246, 105039. [Google Scholar] [CrossRef]
  19. Peng, J.; Zhao, H.; Liu, Y. Urban ecological corridors construction: A review. Acta Ecol Sin. 2017, 37, 23–30. [Google Scholar] [CrossRef]
  20. Wu, Z.; Zhang, K.; Wang, H. Research on the construction and optimization of green space ecological network under urban expansion scenario simulation: Taking some areas in Nanjing as an example. Chin. Gard. 2022, 38, 56–61. [Google Scholar] [CrossRef]
  21. Zhang, D.; Ren, H.; Sun, P.; Jing, P.; Guo, B. Construction of multi-level ecological security network in fragmented nature landscape using the three-dimensional framework of ecological adaptability. Ecol. Indic. 2023, 157, 111229. [Google Scholar] [CrossRef]
  22. Lumia, G.; Pratico, S.; Di Fazio, S.; Cushman, S.; Modica, G. Combined use of urban Atlas and Corine land cover datasets for the implementation of an ecological network using graph theory within a multi-species approach. Ecol. Indic. 2023, 148, 110150. [Google Scholar] [CrossRef]
  23. Wang, N.; Zhao, Y. Construction of an ecological security pattern in Jiangnan water network area based on an integrated Approach: A case study of Gaochun, Nanjing. Ecol. Indic. 2024, 158, 111314. [Google Scholar] [CrossRef]
  24. Kirsch, K.; Newman, G.; Zhu, R.; McDonald, T.; Xu, X.; Horney, J. Applying and Integrating Urban Contamination Factors into Community Garden Siting. J. Geovis. Spat. Anal. 2022, 6, 33. [Google Scholar] [CrossRef]
  25. Zhao, J.; Sun, G.; Webster, C. Global street experiment: A geospatial database of pandemic-induced street transitions. Landsc. Urban Plan. 2024, 242, 104931. [Google Scholar] [CrossRef]
  26. Zhang, L.; Li, Y.; Li, C. Functional identification and spatial autocorrelation analysis of production-living-ecological space in Chengdu based on POl data. J. Green Sci. Technol. 2023, 25, 216–220. [Google Scholar] [CrossRef]
  27. Cao, G.; Gu, C.; Zhang, Q. Identification and pattern analysis of “three-dimensional living space” in central urban areas based on POI data: A case study of Shanghai’s central urban area. J. Urban Plan. 2019, 02, 44–53. [Google Scholar] [CrossRef]
  28. Su, C.; Hu, X.; Meng, Q.; Zhang, L.; Shi, W.; Zhao, M. A multimodal fusion framework for urban scene understanding and functional identification using geospatial data. Int. J. Appl. Earth Obs. Geoinf. 2024, 127, 103696. [Google Scholar] [CrossRef]
  29. Li, X.; Yue, J.; Wang, S.; Luo, Y.; Su, C.; Zhou, J.; Xu, D.; Lu, H. Development of Geographic Information System Architecture Feature Analysis and Evolution Trend Research. Sustainability 2024, 16, 137. [Google Scholar] [CrossRef]
  30. Nygren, O.; Calle, M.; Gonzales-Inca, C.; Kasvi, E.; Käyhkö, N. Automated geovisualization of flood disaster impacts in the global South cities with open geospatial data sets and ICEYE SAR flood data. Int. J. Disaster Risk Reduct. 2024, 103, 104319. [Google Scholar] [CrossRef]
  31. Foroutan, E.; Hu, T.; Zhang, F.; Yu, H. Assessing heat vulnerability in Philadelphia using geographically weighted principal component analysis (GWPCA): A geospatial big data-driven approach. Int. J. Appl. Earth Obs. Geoinf. 2024, 127, 103653. [Google Scholar] [CrossRef]
  32. Peixoto, J.P.J.; Bittencourt, J.C.N.; Jesus, T.C.; Costa, D.G.; Portugal, P.; Vasques, F. Exploiting geospatial data of connectivity and urban infrastructure for efficient positioning of emergency detection units in smart cities. Comput. Environ. Urban Syst. 2024, 107, 102054. [Google Scholar] [CrossRef]
  33. Zhong, E. Deep Mapping—A Critical Engagement of Cartography with Neuroscience. Geomat. Inf. Sci. Wuhan Univ. 2022, 47, 1988–2002. [Google Scholar] [CrossRef]
  34. Zhang, Y.; Wang, S.; Liang, H.; Li, X.; Wang, Z.; Lu, H. Dual hybrid frameworks combining graph convolutional network with decoding for covering location problem. iScience 2024, 27, 109803. [Google Scholar] [CrossRef]
  35. Zhong, Y.; Wang, S.; Liang, H.; Wang, Z.; Zhang, X.; Chen, X.; Su, C. ReCovNet: Reinforcement learning with covering information for solving maximal coverage billboards location problem. Int. J. Appl. Earth Obs. Geoinf. 2024, 128, 103710. [Google Scholar] [CrossRef]
  36. Liang, H.; Wang, S.; Li, H.; Zhou, L.; Chen, H.; Zhang, X.; Chen, X. Sponet: Solve spatial optimization problem using deep reinforcement learning for urban spatial decision analysis. Int. J. Digit. Earth 2024, 17, 2299211. [Google Scholar] [CrossRef]
  37. Lee, S.Y.M.; Lau, H.Y.P. An event-comment social media corpus for implicit emotion analysis. In Proceedings of the Twelfth Language Resources and Evaluation Conference, Marseille, France, 11–16 May 2020; pp. 1633–1642. Available online: https://aclanthology.org/2020.lrec-1.203.pdf (accessed on 1 July 2024).
  38. Hosgurmath, S.; Petli, V.; Jalihal, V.K. An omicron variant tweeter sentiment analysis using NLP technique. Glob. Transit. Proc. 2022, 3, 215–219. [Google Scholar] [CrossRef]
  39. Strąk, T.; Tuszyński, M. NLP Based Retrieval of Semantically Similar Private Tax Rulings. Procedia Comput. Sci. 2022, 207, 2853–2864. [Google Scholar] [CrossRef]
  40. Chen, Q.; Wang, W.; Huang, K.; Coenen, F. Zero-shot text classification via knowledge graph embedding for social media data. IEEE Internet Things J. 2021, 9, 9205–9213. [Google Scholar] [CrossRef]
  41. Chmiel, A.; Sienkiewicz, J.; Thelwall, M.; Paltoglou, G.; Buckley, K.; Kappas, A.; Hołyst, J.A. Collective emotions online and their influence on community life. PLoS ONE 2011, 6, e22207. [Google Scholar] [CrossRef]
  42. Marulli, F.; Verde, L.; Campanile, L. Exploring data and model poisoning attacks to deep learning-based NLP systems. Procedia Comput. Sci. 2021, 192, 3570–3579. [Google Scholar] [CrossRef]
  43. Lu, Z.; He, R.; Li, J. Research on Online comment negative emotion warning based on machine learning from the perspective of big data. In Proceedings of the 2019 International Conference on Computer Science, Communications and Multimedia Engineering, Shanghai, China, 22–23 September 2019; p. 6. [Google Scholar]
  44. Banerjee, T.J. A system of content analysis of social media using AI and NLP. Int. J. Res. Eng. Sci. Manag. 2021, 4, 132–136. Available online: https://journal.ijresm.com/index.php/ijresm/article/view/844 (accessed on 1 July 2024).
  45. Yan, H.; Zhang, L.; Du, P.; Liu, T.; Wang, Z.; Yang, W. Maps in the era of We-Media: Micro-maps. J. Geomat. Sei. Technol. 2016, 33, 520–523. [Google Scholar] [CrossRef]
  46. Gong, P.; Chen, B.; Li, X.; Liu, H.; Wang, J.; Bai, Y.; Chen, J.; Chen, X.; Fang, L.; Feng, S.; et al. Mapping essential urban land use categories in China (EULUC-China): Preliminary results for 2018. Sci. Bull. 2020, 65, 182–187. [Google Scholar] [CrossRef]
  47. Nikhil, S.; Danumah, J.H.; Saha, S.; Prasad, M.K.; Rajaneesh, A.; Mammen, P.C.; Ajin, R.S.; Kuriakose, S.L. Correction to: Application of GIS and AHP Method in Forest Fire Risk Zone Mapping: A Study of the Parambikulam Tiger Reserve, Kerala, India. J. Geovis. Spat. Anal. 2021, 5, 14. [Google Scholar] [CrossRef]
  48. Li, Z.; Ding, Y.; Wang, Y.; Chen, J.; Wu, F. Construction of ecological security pattern in mountain rocky desertification areas based on the minimum cumulative resistance model: A case study in Nanchuan District, Chongqing. J. Ecol. Rural Environ. 2020, 36, 1046–1054. [Google Scholar] [CrossRef]
  49. Hur, A.; Janjua, N.; Ahmed, M. Unifying context with labeled property graph: A pipeline-based system for comprehensive text representation in NLP. Expert Syst. Appl. 2024, 239, 122269. [Google Scholar] [CrossRef]
  50. Wang, S.; Lu, H.; Huang, Q.; Liang, Q. Analysis of road network characteristics based on SuperMap GIS. Geomat. Spat. Inf. Technol. 2013, 36, 109–112. [Google Scholar] [CrossRef]
  51. Hecht, R.; Behnisch, M.; Herold, H. Innovative approaches, tools and visualization techniques for analysing land use structures and dynamics of cities and regions. J. Geovis. Spat. Anal. 2020, 4, 19. [Google Scholar] [CrossRef]
  52. Liu, G.; Cao, M.; Li, Y. Data integration method for land spatial basic information platform based on SuperMap. Surv. Mapp. Geol. Miner. Resour. 2022, 38, 57–59. [Google Scholar] [CrossRef]
  53. Wan, J.; Fei, T. “Production-living-ecological spaces” recognition methods based on street view images. J. Geo-Inform. Sci. 2023, 25, 838–851. [Google Scholar] [CrossRef]
  54. Gong, H.; Chang, J.; Du, Y. Construction of county-level ecological network based on MCR and gravity model. Mapp. Bull. 2023, 81, 23–29. [Google Scholar] [CrossRef]
  55. Yao, C.; He, Y.; Cheng, J.; Zhang, T.; Ma, H.; Pan, H. Evaluation and optimization of ecological security pattern in the Minjiang River Basin based on minimum cumulative resistance model and gravity model. Acta Ecol Sin. 2023, 43, 7083–7096. [Google Scholar] [CrossRef]
  56. Yao, Q.; Gong, T.; Shi, J. Coupling development of urban rail transit and commercial facilities based on data from Dianping—Taking Tianjin as an example. J. Tianjin Chengjian Univ. 2019, 25, 239–245. [Google Scholar] [CrossRef]
  57. Cai, W.; Wang, S.; Zhong, E.; Feng, Z.; Li, M.; Wang, B. BIM and SuperMap GIS data integration technology. Geomat. World 2018, 25, 120–124. [Google Scholar] [CrossRef]
  58. Qin, X.; Zhen, F.; Zhu, S.; Xi, G. Research on the spatial distribution pattern of the catering industry in Nanjing city based on online reputation: Taking Dianping.com as an example. Sci. Geogr Sin. 2014, 34, 810–817. [Google Scholar] [CrossRef]
  59. You, T.; Wu, T.; Li, C.; Gao, F.; Wang, L. Exploring the symbiosis between ecological corridors and urban development based on habitat characteristics: Taking the construction of ecological corridors in the eastern region of Chengdu as an example. Environ. Sci. Manag. 2022, 47, 153–158. [Google Scholar] [CrossRef]
Figure 1. Location of Xuchang City.
Ijgi 13 00322 g001
Figure 2. Research framework.
Ijgi 13 00322 g002
Figure 3. Spatial distribution map of production–living–ecological space in Xuchang City.
Ijgi 13 00322 g003
Figure 4. Distribution map of ecological resistance surface in Xuchang City.
Ijgi 13 00322 g004
Figure 5. Distribution of ecological corridors in Xuchang City and central urban area.
Ijgi 13 00322 g005
Figure 6. Kernel density distribution of green parks in the central city of Xuchang.
Ijgi 13 00322 g006
Figure 7. Park rating rankings.
Ijgi 13 00322 g007
Figure 8. Kernel density based on the distribution of word-of-mouth score data from Dianping on green parks in the central city of Xuchang.
Ijgi 13 00322 g008
Figure 9. Grade distribution of park centers in the central urban area of Xuchang.
Ijgi 13 00322 g009
Figure 10. Comparison of perceived element importance and satisfaction.
Ijgi 13 00322 g010
Figure 11. Perceived evaluation model of park system in the central urban area of Xuchang.
Ijgi 13 00322 g011
Figure 12. Potential ecological corridor distribution.
Ijgi 13 00322 g012
Table 1. Comprehensive weight table of POIs in Xuchang City.
Space TypeBroad HeadingClassDegree of RelevanceRelative AreaComprehensive Weight
Production spaceInsubstantialIncorporated business0.06320.00820.0005
Financial insurance0.02780.00820.0002
Government0.00720.19070.0014
SubstanceFactory0.425912.88985.4901
Logistics0.142012.88981.8300
TransportationTransportation0.33390.79650.2660
Living spaceEssentialCatering services0.22670.05840.0132
Shopping0.14470.05840.0084
Healthcare0.10470.11490.0120
NonessentialLife services0.10470.05840.0061
Science and education culture0.04841.68250.0814
Sports leisure0.06680.20690.0138
HabitancyAccommodation services0.12163.52200.4283
Residential district0.18243.52200.6424
Ecological spaceGreen areaFamous scenery0.25005.89551.4739
Park0.75005.89554.4216
Table 2. Relative resistance value of POI elements.
Space TypeBroad HeadingClassResistance Value
Production spaceInsubstantialIncorporated business37.17
Financial insurance48.54
Government31.15
SubstanceFactory105.26
Logistics99.01
TransportationTransportation9.92
Living spaceEssentialCatering services66.23
Shopping59.88
Healthcare30.12
NonessentialLife services47.39
Science and education culture109.89
Sports leisure30.21
HabitancyAccommodation services68.03
Residential district17.54
Ecological spaceGreen areaFamous scenery3.33
Park3.33
Table 3. Number and scale statistics of ecological corridors in the central urban area.
Ecological Corridor Serial NumberBeginning and End of Ecological CorridorEcological Corridor Length/mInteraction Force
1Xudu Park–Central Park2614855
2Shuanglong Lake Garden–Baling Bridge Scenic Area3231821
3Xudu Park–Pingan Square2980659
4Central Park–Luming Lake3097611
5West Lake Park–Baling Bridge Scenic Area5063515
6Xianghe Garden–West Lake Park3597476
7Xudu Park–Zhongyue Sanguan Temple4228356
8West Lake Park–Xudu Park5377331
9Shuanglong Lake Garden–Xianghe Garden5063156
10Baling Bridge Scenic Area–West Lake Park11,77495
11Pingan Square–Baling Bridge Scenic Area14,53742
Table 4. Perceived element lexicon.
Perceived DimensionType of ElementElement SubdivisionElement Content
User dimensionUser characteristicsAccess modeWalking, touring, sightseeing, strolling, checking in, relaxing
InteractionInteractionStory, temple fair, allusion, commemorate
Art historyGuan Yu, Guandi Temple, The Three Kingdoms, Cao Cao, history, Liu Bei, Cao Chong weighs the Elephant, Xudu
Traffic process dimensionAdjacent degreePark locationNearby, four way
Mode of transportationMode of transportationBus
Park dimensionLandscape elementNatural landscapeWater, lake water, Nihe River, lotus, landscape architecture, peony flower, lotus flower, plants, hibiscus, shade trees, ecological landscape, lawn, fish, flowers bloom and willows turn green, a riot of colors, flower Sea, garden, hydrangea flower, Yangliu, osmanthus fragrans
Human landscapeArchitecture, fountain, statues, Qingshi Bridge, sculpture, pavilion, water curtain, water column, ancient architecture, mural painting, relief sculpture, Wisdom Gate, small bridge flowing water
Landscape featuresBeauty, pretty, beautiful scenery, night view
Facility elementsService facilitySquare, slide, playground, zoo, museum, parking, basketball court, library, street food
Functional facilitiesleisure time, entertainment, amusement, rowing, bodybuilding, physical exercise, morning exercises
Environmental elementsTemperatures and climateComfortable, autumn, overcast, spring, rainy day, accumulated snow
Sound smellQuiet
Pollution levelClean, clear
Green coverGreen
Affective sensationHealthy, beautiful, graceful, ecology, happiness, antique style, beautiful scenery, full of vitality, cheerful
Scale terrainPark scaleVery large, small, square meters, wide
ConsumeConsumeFree charge
Table 5. Proportion of comment text for each indicator.
ClassifyComment CountProportionProportion of Negative CommentsPositive QuantityNegative Quantity
Access mode636.7%36.5%4023
Service facility12613.4%50.8%6264
Park scale262.8%30.8%188
Park location131.4%69.2%49
Functional facilities10911.6%29.4%7732
Interaction485.1%54.2%2226
Mode of transportation60.6%66.7%24
Landscape features333.5%0330
Green cover30.3%66.7%12
Temperature and climate202.1%55.0%911
Affective sensation303.2%16.7%255
Human landscape818.6%60.5%3249
Art history23525.1%64.3%84151
Sound smell50.5%050
Pollution level91.0%11.1%81
Consume444.7%63.6%1628
Natural landscape879.3%52.9%4146
Disclaimer/Publisher’s Note: The statements, opinions and data contained in all publications are solely those of the individual author(s) and contributor(s) and not of MDPI and/or the editor(s). MDPI and/or the editor(s) disclaim responsibility for any injury to people or property resulting from any ideas, methods, instructions or products referred to in the content.