Abstract
As monitoring technologies and data collection methodologies advance, landslide disaster data reflects attributes such as diverse sources, heterogeneity, substantial volumes, and stringent real-time requirements. To bolster the data support capabilities for the monitoring, prevention, and management of landslide disasters, the efficient integration of multi-source heterogeneous data is of paramount importance. The present study proposes an innovative approach to integrate multi-source landslide disaster data by combining the Flink-oriented framework with load balancing task scheduling based on an improved particle swarm optimization (APSO) algorithm. It utilizes Flink’s streaming processing capabilities to efficiently process and store multi-source landslide data. To tackle the issue of uneven cluster load distribution during the integration process, the APSO algorithm is proposed to facilitate cluster load balancing. The findings indicate the following: (1) The multi-source data integration method for landslide disaster based on Flink and APSO proposed in this article, combined with the structural characteristics of landslide disaster data, adopts different integration methods for data in different formats, which can effectively achieve the integration of multi-source landslide data. (2) A multi-source landslide data integration framework based on Flink has been established. Utilizing Kafka as a message queue, a real-time data pipeline was constructed, with Flink facilitating data processing and read/write operations for the database. This implementation achieves efficient integration of multi-source landslide data. (3) Compared to Flink’s default task scheduling strategy, the cluster load balancing strategy based on APSO demonstrated a reduction of approximately 4.7% in average task execution time and an improvement of approximately 5.4% in average system throughput during actual tests using landslide data sets. The research findings illustrate a significant improvement in the efficiency of data integration processing and system performance.
1. Introduction
Natural disasters are defined as natural phenomena that pose significant threats to human existence or adversely affect the living environment, including, but not limited to, earthquakes, collapses, landslides, mudslides, and floods [1]. It is imperative to implement a range of scientific measures to prevent and mitigate such disasters without further delay. Landslides specifically refer to the movement or sliding of a mixture of rock or soil primarily on a slope position due to factors such as groundwater activity, rainfall, and earthquakes, which result in the loosening of the soil mass under the influence of gravity [2]. Additionally, landslides may occur in the cracks that separate the upper layers from the bedrock in the absence of soil loosening. Long-term monitoring in landslide-prone areas and the establishment of early warning systems can facilitate the early identification of landslide hazards and the implementation of effective measures to protect lives and property. However, during the process of monitoring a landslide disaster, a substantial amount of static or dynamic data is generated. These data types are diverse and originate from various sources, leading to significant discrepancies in the data formats. Typically, most of them are scattered across different databases and require complex and labor processing procedures to be performed so that the computational requirements are met [3,4,5]. Due to the absence of standardized data integration protocols and service methods, these resource-intensive datasets cannot be effectively shared. Therefore, addressing the challenge of integrating heterogeneous data from multiple sources is crucial for improving landslide disaster monitoring.
The data sources for landslide disasters are diverse, encompassing multiple channels, such as sensors, satellite remote sensing, and geological surveys, presenting a blend of structured data, images, and text. Efficient management of this vast and ever-increasing amount of data is crucial. An array of data integration platforms and technologies has been proposed; for instance, Zhang [6] introduced a geological disaster monitoring and early warning system utilizing big data analytics, while He et al. [7] developed a “multi-source heterogeneous geological disaster monitoring data integration system.” Liu et al. [8] proposed a framework for the dynamic management and integration of models within the landslide early warning system (LEWS). Furthermore, prevalent frameworks suitable for early landslide warning typically include models based on supervised learning or time series analysis, as well as intelligent warning models established in conjunction with geographic information systems (GIS) and information visualization technologies, etc. [9]. A part of the LEWS consists solely of databases that provide single-threshold warnings. With the continuous development of big data technology, various data processing frameworks have emerged, such as Storm, Spark, and Flink [10,11,12,13,14,15]. The demand for real-time data and its processing is increasing, as effective decisions must be made in order to monitor landslide disasters [16,17,18,19]. To address the real-time requirements of big data information mining, Jin et al. [20] proposed a high-performance spatiotemporal statistical analysis system called Geostatistics-Hadoop, which achieves efficient and rapid information mining and the analysis of large-scale spatiotemporal datasets. As a typical representative of cloud computing, the Hadoop distributed big data platform effectively solves the problem of processing large amounts of data. He et al. [21] introduced a memory-based distributed computing framework called GeoBeam, which supports the processing of large-scale spatial data on Spark and Flink clusters, achieving efficient large-scale data processing. Huang et al. [22] proposed a strip-oriented parallel programming model that integrated remote sensing (RS) data strips with Spark’s Resilient Distributed Datasets (RDD), improving the efficiency of processing and enabling the analysis of massive heterogeneous remote sensing data. These studies address issues such as insufficient memory and slow data processing speeds encountered when handling large-scale data, thereby enhancing the efficiency of spatiotemporal data processing while providing a framework for disaster integration models.
Although these frameworks can effectively handle the streaming of big data processing, their default task scheduling mechanisms do not comprehensively consider factors such as their own performance and job structure in practical use, and they fail to fully exploit the maximum performance of the clusters. For instance, Storm’s default scheduler, EvenScheduler, employs a round-robin strategy for task allocation that overlooks the substantial communication overhead between nodes and processes, as well as the performance disparities among heterogeneous nodes, thereby limiting the full utilization of Storm’s real-time computing capabilities. The default scheduling strategy used in Flink is round-robin, which randomly assigns operators to containers on different nodes without considering the distribution characteristics of operators during tasks and the communication overhead between containers. Additionally, Flink’s default task-scheduling strategy lacks load-balancing capabilities, as it does not possess the real-time information on resource availability that is needed for each node to adjust and balance the workload dynamically. In comparison with distributed computing frameworks such as Spark, Hadoop, and Storm, Flink exhibits advantages in terms of its low latency and high throughput. The default task-scheduling mechanism of Flink has been optimized by Li [23] and colleagues, who proposed the load-balanced task-scheduling algorithm RFTS; this balances cluster loads by continuously monitoring cluster resources, dividing zones, and employing a task-scheduling algorithm based on artificial firefly optimization. Li et al. [24] proposed a cost-effective task-scheduling algorithm (CETSA) and load-balancing algorithm (LBA-CE) by introducing the concept of node adaptability in the load-balancing model, which balances the cluster load while reducing costs. Dai et al. [25] proposed the RoLBTS algorithm, which balances the load distribution by scheduling the resources required for tasks; this effectively improves the quality of service (QoS). These research projects present scheduling algorithms that surpass Flink’s default task scheduling mechanism, improving cluster throughput efficiency.
In the current big data environment, which is characterized by a large volume of data, rapid changes, and untraceable data, traditional batch computing frameworks are not directly applicable to big data stream computing clusters. Moreover, there is limited research on load-balancing strategies that are specifically tailored to the integration of landslide disaster datasets in certain scenarios. Hence, the primary research tasks and objectives of this paper are to achieve efficient multi-source data integration for landslide management, thereby supporting decision-making. The specific research tasks of this study are as follows:
- (a)
- To design an integration method for multi-source landslide disasters data. Based on the characteristics and data patterns of multi-source landslide data, these are classified into two categories: structured and unstructured. Corresponding integration methods for each category of multi-source landslide data are developed.
- (b)
- To develop a multi-source landslide data integration framework based on Flink. Utilize the Hadoop Distributed File System (HDFS) for file storage, employ Apache Kafka as a message queue to establish a real-time data pipeline, and utilize Flink for data processing, along with read and write operations on the database.
- (c)
- To propose a load balancing task scheduling strategy based on the improved Particle Swarm Optimization (APSO) algorithm. Cluster resource monitoring is utilized to assess the load conditions of the cluster. Using the collected historical load data, a Long Short-Term Memory (LSTM) network model is employed to predict the cluster’s load status. To address the issue of load imbalance within the cluster during data integrating, an APSO-based task scheduling algorithm is implemented to optimize the scheduling strategy, reallocating tasks in a waiting state from high-load machines to low-load machines, thereby facilitating the efficient integration of multi-source landslide data.
2. Materials and Methods
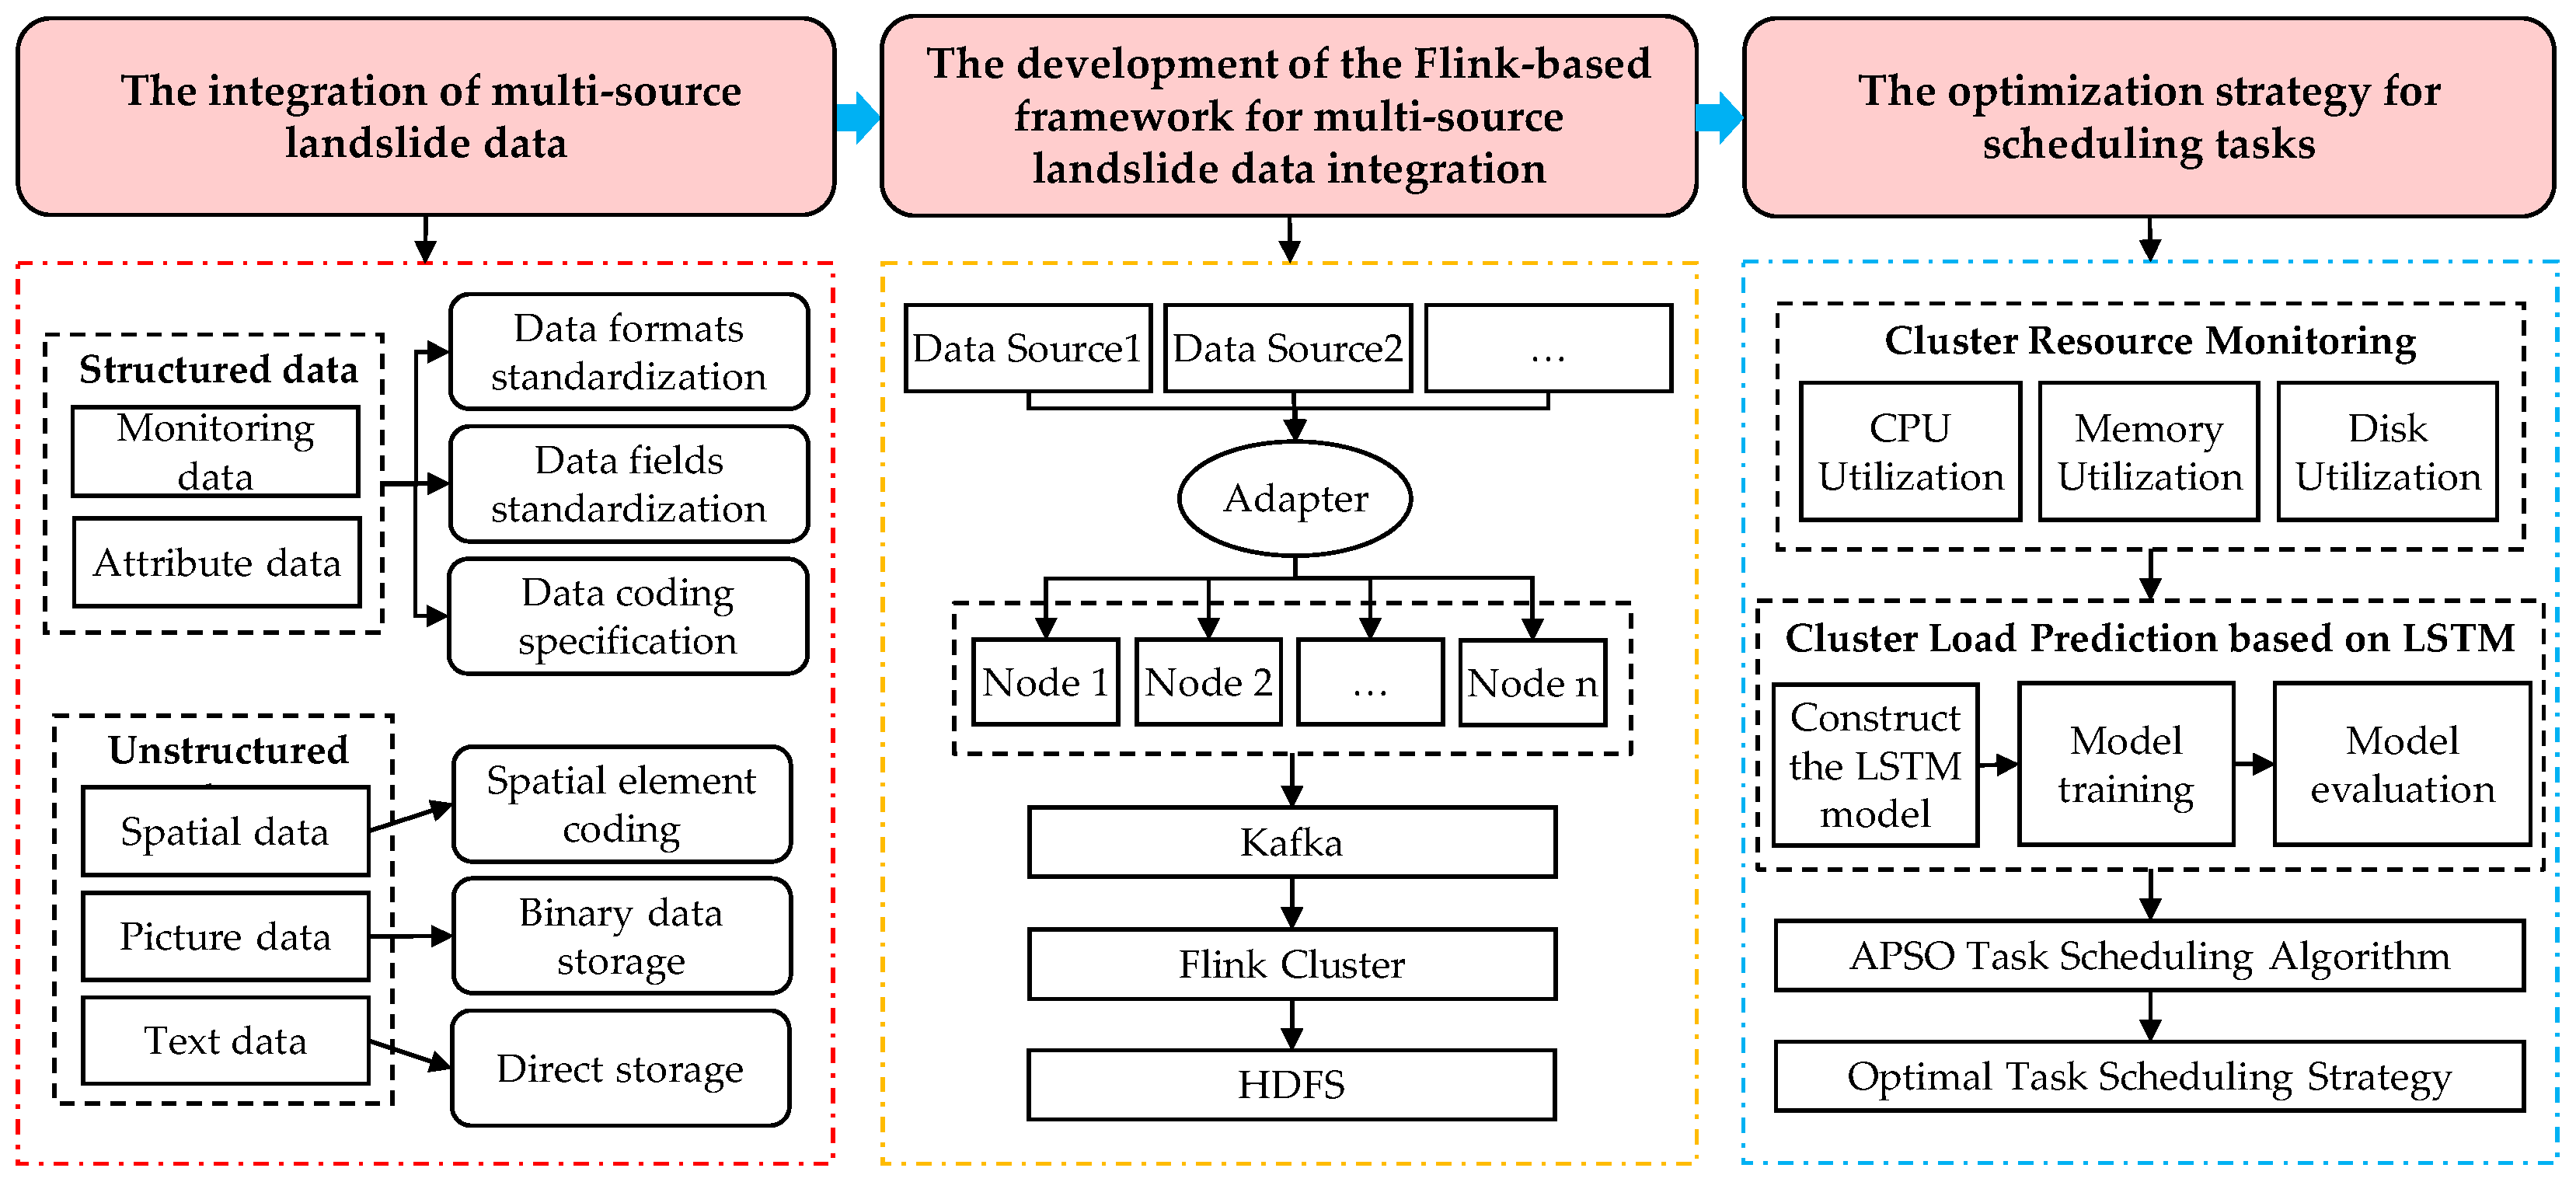
The methodology of this study is depicted in Figure 1 and comprises three primary steps: the integration of multi-source landslide data, the development of the Flink-based framework for multi-source landslide data integration, and the optimization strategy for scheduling tasks.
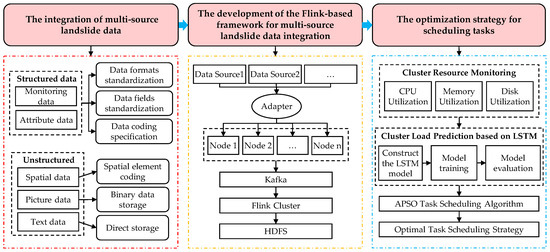
Figure 1.
Flowchart showing integration of multi-source data for landslide disasters.
2.1. Experimental Data
This study focuses on the reservoir–dam section of the upper reaches of the Yellow River. The experimental data encompass a diverse range of large, medium, and small landslide disaster events that occurred in this region from 2000 to 2023. The data formats include shp, tiff, xls/xlsx, csv, txt, docx/doc, json, among others. The size of the dataset is 6.3 TB. Based on their types, these data are primarily categorized into attribute data, monitoring data, spatial data, image data, and text data, as detailed in Table 1. Table 2 presents the types and numbers of landslide data utilized in this study. In response to the demand for multi-source real-time monitoring data for disaster management along the main reservoir and dam sections of the upper Yellow River, the design and implementation of a multi-source data integration method based on Flink for landslide disaster has been developed, addressing the current issue of low integration levels among diverse and heterogeneous data sources.

Table 1.
Experimental data.

Table 2.
Types and numbers of landslides data.
2.2. Multi-Source Landslide Data Integration
The multi-source data pertaining to landslide are categorized into structured and unstructured data based on their heterogeneity, as depicted in Table 3.

Table 3.
Classification of multi-source landslide data types.
2.2.1. Structured Data Integration
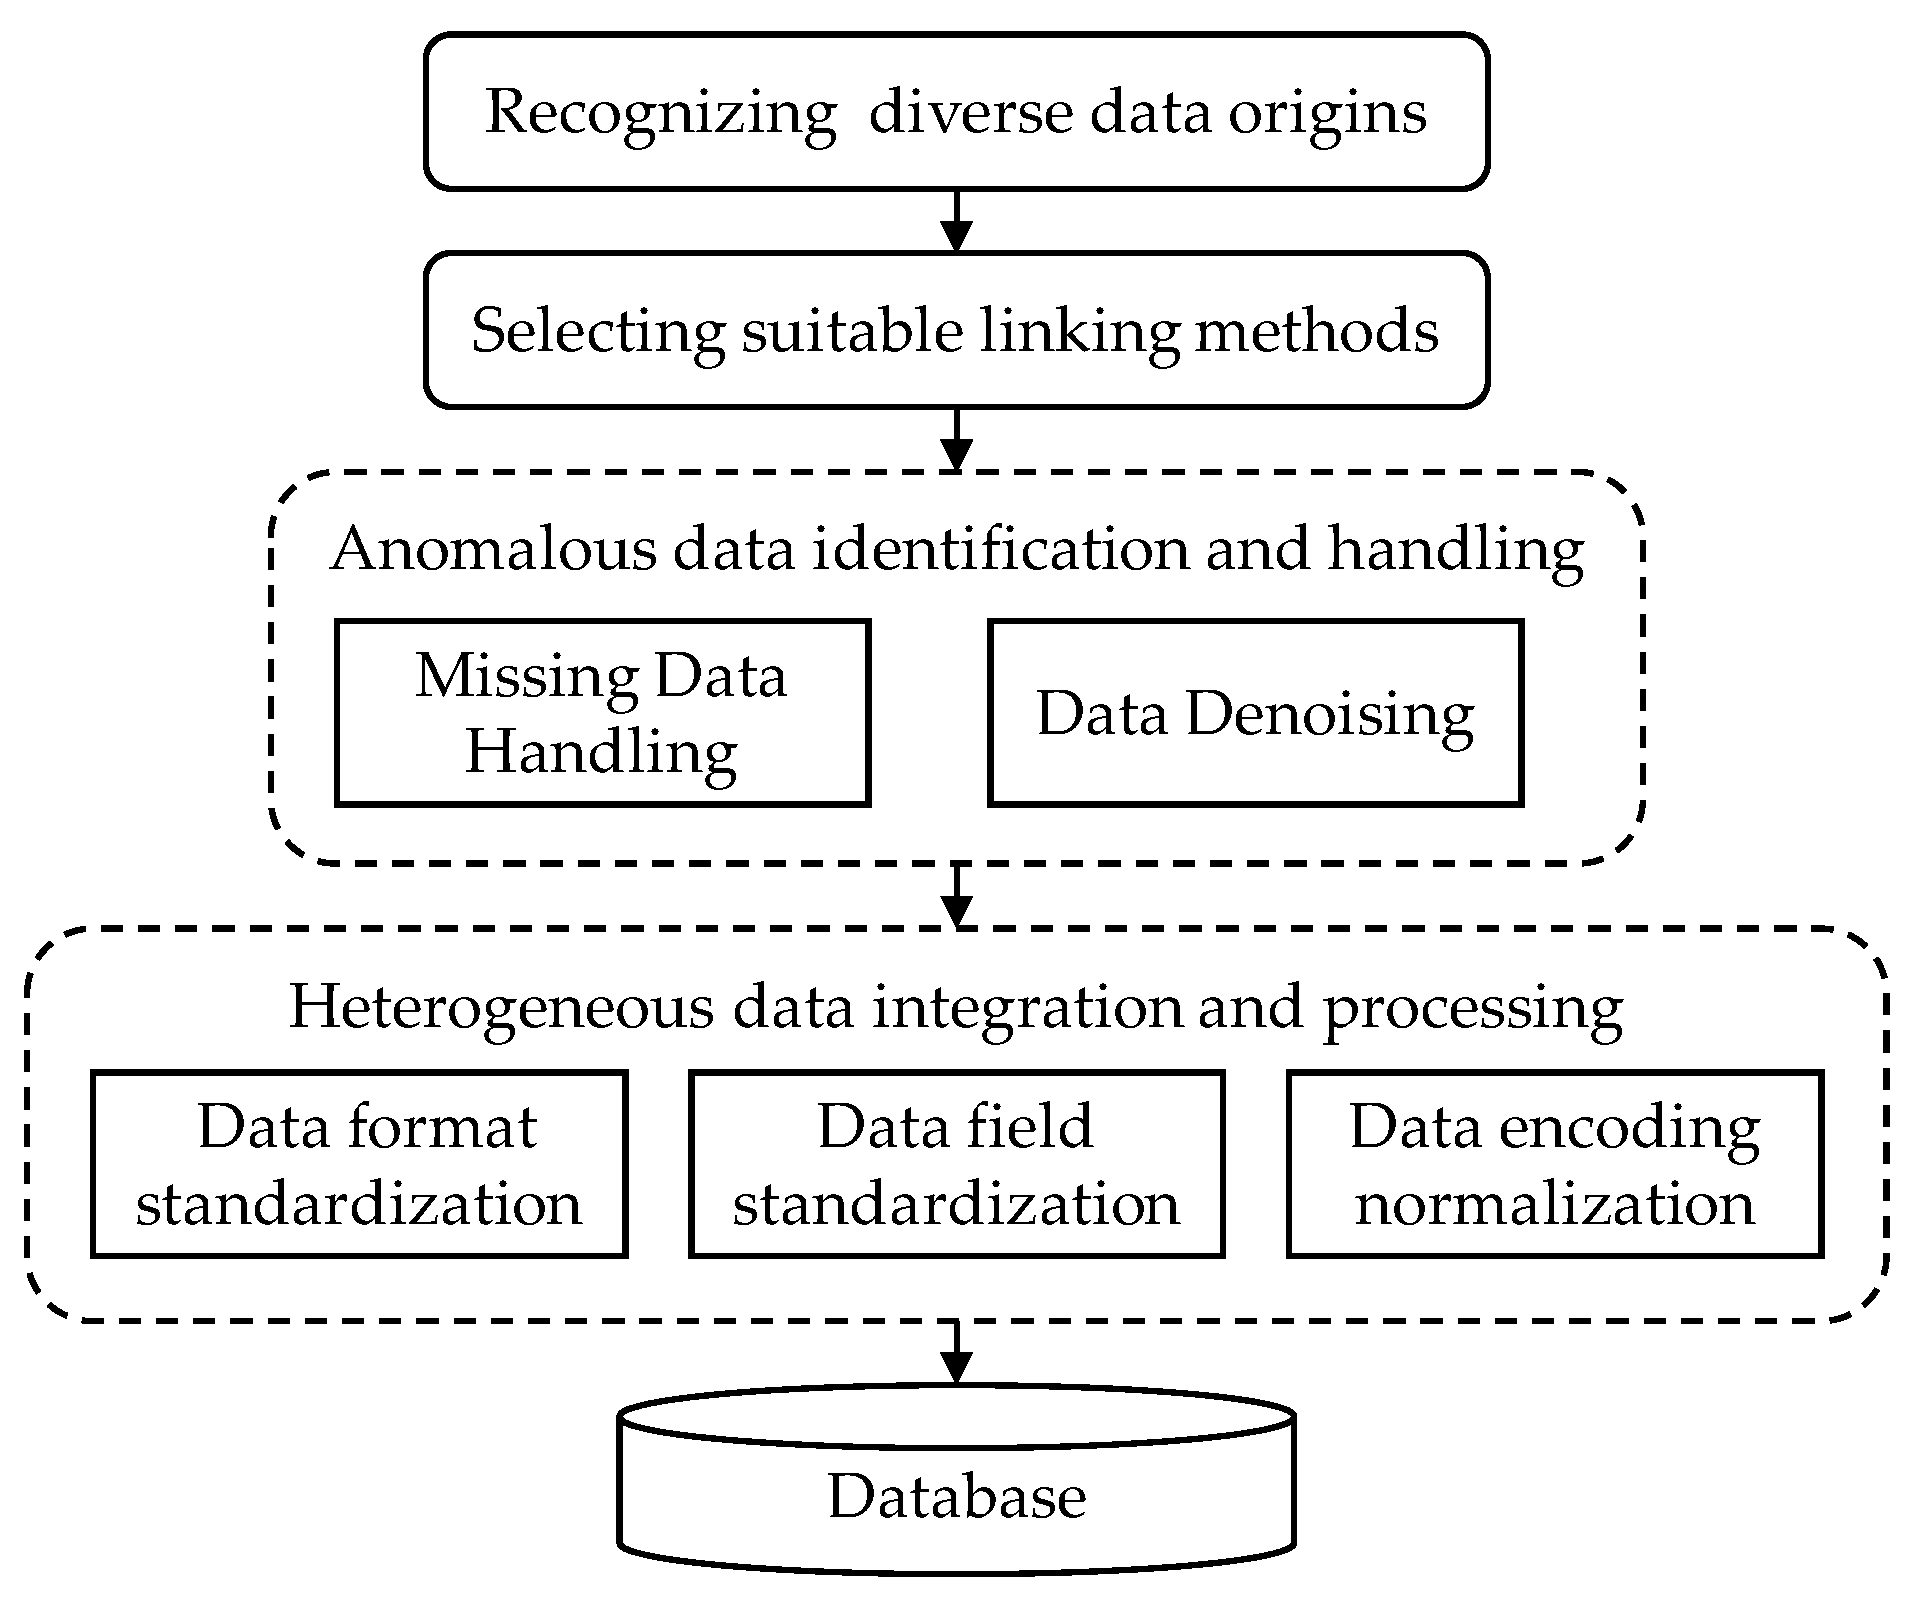
To comprehensively analyze and investigate the deformation and evolutionary processes of landslide disasters, it is imperative to deploy a multitude of heterogeneous sensors in substantial quantities on the landslide mass to acquire multidimensional information [26,27,28]. The structured data related to landslide disasters exhibit attributes such as multiple sourcing, heterogeneity, and large data volume [29,30,31,32]. To tackle these aspects of structured multi-source landslide data, the data integration techniques depicted in Figure 2 were employed.
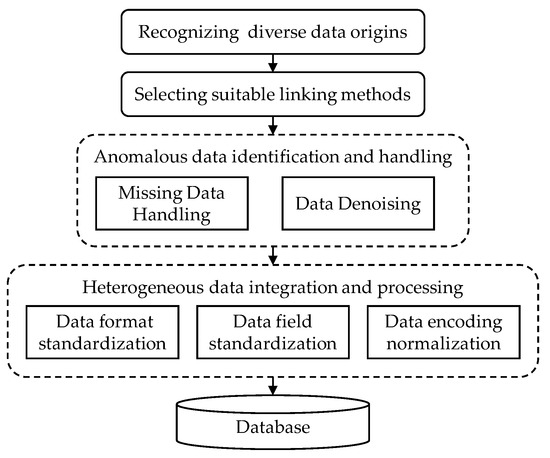
Figure 2.
Flowchart of the landslide structured data integration method.
- (1).
- Anomalous data identification and handling:
The monitoring data obtained from the data acquisition platform may be influenced by various factors. These factors often lead to anomalous situations, such as data loss or discontinuities, which inaccurately represent the true conditions. According to statistics, the proportion of missing data in the monitoring dataset collected is approximately 5%. Therefore, it is essential to address anomalous data prior to data integration. The Pauta criterion is utilized for anomalous data detection by calculating the mean (σ) and standard deviation (μ) for each attribute value in the data. Data falling outside the range (μ − 3σ, μ + 3σ) is classified as anomalous. The processing of anomalous data encompasses the following methodologies:
1) Missing Data Handling—Cubic Spline Interpolation: Cubic spline interpolation is utilized to handle missing monitoring values affected by external factors. For n + 1 data points (x0, y0), (x1, y1), …, (xn, yn), the interpolation interval [x0, xn] is partitioned into multiple subintervals. Each subinterval is approximated by a cubic polynomial function, yielding n cubic polynomial functions. A cubic polynomial function is employed to approximate the data points within each small interval [xi, xi+1], as depicted in Equation (1):
where ai, bi, ci and di denote the coefficients to be determined, while Si(x) denotes the interpolation function for the i-th small interval.
2) Data Denoising—Least Squares Method: By minimizing the sum of squared errors, the least squares method aims to identify the optimal function fit for the data, enabling noise reduction in monitoring values affected by abrupt changes attributed to external factors. This process accurately reflects the deformation of the landslide. Let there be an approximate curve f(x) = anxn + an−1xn−1 + … + a1x + a0 that provides the optimal fit for each observed data point. The vertical separation between a point P1(x1, y1) and the curve is denoted by D1 = |f(x1) − y1|. Equation (2) illustrates the summation of squared vertical distances from all points to the curve:
Determine the appropriate value of {an} such that D2 is minimized.
- (2).
- Heterogeneous data integration and processing:
The aim of transforming multi-source landslide monitoring data is to convert the structured data types or formats, ensuring alignment with the integrated system’s requisites, thereby enhancing data quality and consistency. This procedure encompasses three stages: data format standardization, data field standardization, and data encoding normalization. Structured data standardization must adhere to the following principles: (1) During the standardization of structured data, it is essential to ensure that all data sources remain consistent both logically and semantically. Identical data items should convey the same meaning across different sources. (2) Ensure that all necessary data items are present following integration to avoid the omission of critical information. (3) The integrated data must align with the original data.
1) Data format standardization
- Standardized Temporal Representation: Ensure that the time field within the monitoring data adheres to a consistent date-time format, such as the ISO 8601 standard [33] (YYYY-MM-DD HH:MM:SS), to streamline time comparisons and sorting across diverse systems.
- Harmonized Data Units: Guarantee that the numeric fields in the monitoring data utilize uniform units of measurement, including length (meters), weight (kilograms), pressure (Pascals), etc., to prevent data ambiguity and computational errors.
- Precision Alignment: Ensure that the precision of numeric fields in the monitoring data remains uniform by establishing a consistent number of decimal places, thereby securing accuracy and comparability of the data.
- Data Type Conversion: Verify the correctness of field types in the monitoring data, including converting textual data into numeric formats to facilitate subsequent numerical computations and analyses.
2) Data field standardization
Standardize the field titles and interpretations of landslide disaster data to ensure uniformity of data fields across diverse sources, aiding in data integration and comparison. The comparison of data fields before and after standardization is illustrated in Table 4.

Table 4.
Comparison Table of numerical fields pre- and post-standardization.
3) Data encoding normalization
Utilize standardized coding protocols to encode landslide surveillance data. Taking the GNSS automated monitoring information from the Huangcaoping, Zhengjiaping, Mogangling, and Xinhua deformation sites in the Dadu River Dagangshan Hydropower Station reservoir area in Sichuan Province in 2017 as an illustration, categorize and encode the data to establish a database table, thereby attaining data standardization and coherence. Utilize alphabetical codes to denote distinct landslide entities, such as employing “ZJP” for the Zhengjiaping landslide entity; arrange based on the time span of monitoring data, utilizing numeric codes for diverse time categorizations, like four-digit codes for years (e.g., 2017, 2018) and two-digit codes for months (e.g., 01, 02); categorize according to monitoring instruments, assigning unique alphabetical codes to signify corresponding instrument categories, for instance, using “R” for rain gauges; sort based on the precise parameters gauged by the monitoring data, utilizing two-letter codes to represent various monitoring parameters, for instance, “RF” for rainfall quantity. Through the amalgamation of the aforementioned categorization codes, a distinctive code can be formulated to represent specific monitoring data. For instance, a categorization code for a piece of monitoring data from the Zhengjiaping landslide entity could be ZJP-20170115-R-RF, signifying rainfall data monitored using a rain gauge on 15 January 2017, for that specific landslide entity.
2.2.2. Unstructured Data Integration
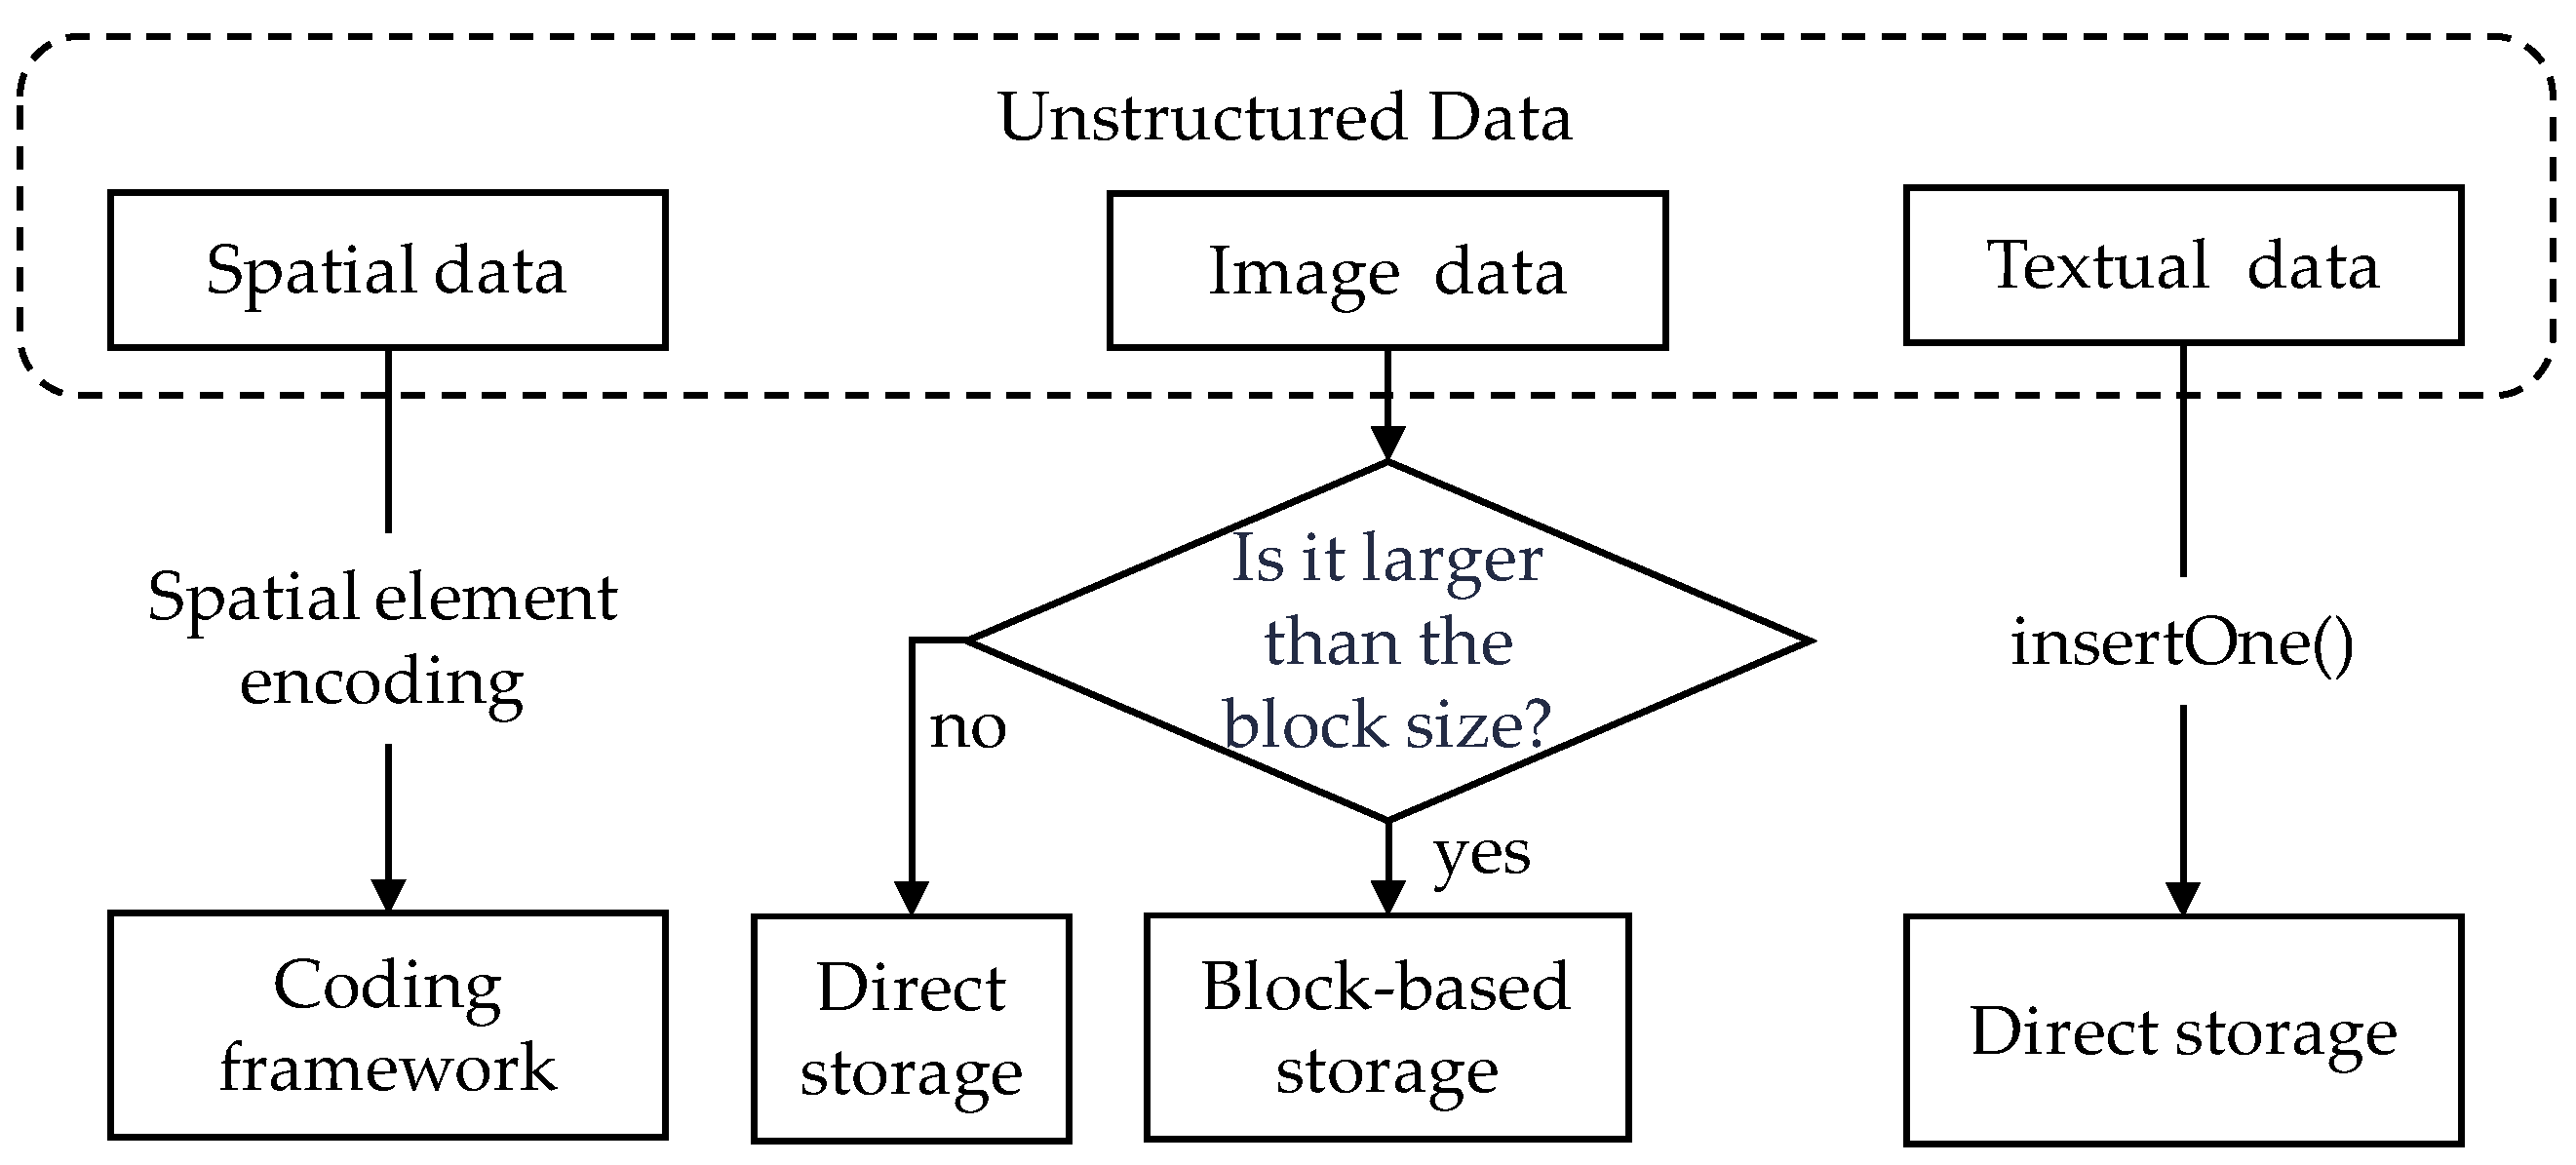
Regarding landslide unstructured data, an integration approach depicted in Figure 3 is employed.
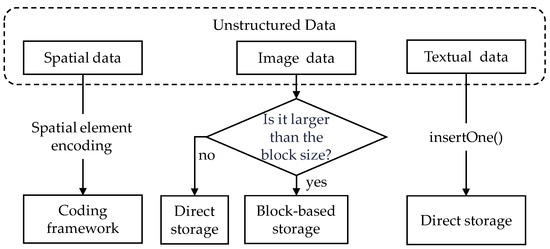
Figure 3.
Flowchart of the landslide unstructured data integration method.
- (1).
- Spatial data integration
Encoding the spatial features of landslide disaster spatial data can enhance the efficiency of managing and analyzing such data. Spatial element encoding entails abstracting spatial data into a coding framework, allowing for structured organization, storage, and retrieval of the data. The document introduces a spatial element encoding scheme, as depicted in Figure 4.

Figure 4.
Schematic illustration of spatial feature coding design.
- (2).
- Image data integration
The term landslide disaster image data refers to the image data used to describe and display the phenomenon, impact and loss of landslide disasters. This data encompasses maps delineating the distribution and vulnerability of disasters, maps for the prevention and regulation of disasters, photographs capturing disaster occurrences, aerial visuals, and more, all utilized to record and present the genuine circumstances of disasters, predominantly in formats like jpg and png.
MongoDB enforces a document size cap of 16 MB; hence, for image files within landslide disaster data surpassing this limit, MongoDB’s GridFS becomes instrumental. GridFS serves as a storage framework within MongoDB intricately crafted for accommodating sizable files. The harvested image data can be seamlessly inscribed into MongoDB by leveraging MongoDB GridFS. GridFS segregates data into two collections—fs.files and fs.chunks—wherein the former manages metadata of image files for streamlined administration and retrieval, while the latter stores the actual data of image files via segmentation.
- (3).
- Textual data integration
Textual data regarding landslide disasters pertains to written information and documents associated with calamities. This dataset comprises scholarly research articles, official reports, journalistic pieces, case studies detailing disaster occurrences, expert viewpoints, governmental publications, and other materials employed to chronicle, expound upon, and scrutinize the multifaceted dimensions of disasters. By crafting Document entities encompassing metadata like titles, authors, sources, publication dates, themes, and textual content, and persisting this data within a MongoDB repository via the insertOne technique, users can conduct inquiries into textual data predicated on metadata particulars utilizing the find method.
2.2.3. Integrated Data Quality Assessment
The assessment of integrated multi-source landslide data quality primarily entails delineating quality evaluation characteristics, selecting types of quality assessment rules, and deriving assessment outcomes [34,35,36]. Quantitative descriptions of the quality of the integrated data on landslides are conducted based on the quality attributes of landslide multi-source data, focusing on both structured and unstructured data quality assessments. Within the context of Table 5, structured multi-source landslide data quality attributes encompass accuracy, integrality, consistency, and timeliness, each quality attribute being underpinned by a multitude of data quality assessment rules. The quantified assessment scores for structured data quality metrics are contingent upon the proportion of data values conforming to constraints relative to the total data values:
where SQS represents the structured data quality assessment index score; sef represents the quality assessment characteristics, including accuracy, integrality, consistency and timeliness; datasetf represents the number of data conforming to all assessment indicators of the corresponding assessment characteristics; and datasall represents the total amount of data.

Table 5.
Quality Assessment Metrics for Integrated Structured Landslide Data.
The assessment of unstructured data quality primarily involves evaluating spatial data in terms of integrity, rationality, and consistency. Further investigation is conducted into the evaluation criteria for spatial data integration quality, as depicted in Table 6, with a quantitative comparison of integrated data quality assessment standards. The quantified evaluation scores for unstructured data quality indicators are determined by the percentage of data values that conform to constraints out of the total data values:
where USQS represents the unstructured data quality assessment index score; usef represents the quality assessment characteristics, including integrality, consistency and rationality; datauetf represents the number of data conforming to all assessment indicators of the corresponding assessment characteristics; and datasull represents the total amount of data.

Table 6.
Quality Assessment Metrics for Integrated Unstructured Landslide Data.
2.3. Integration Framework Based on Flink
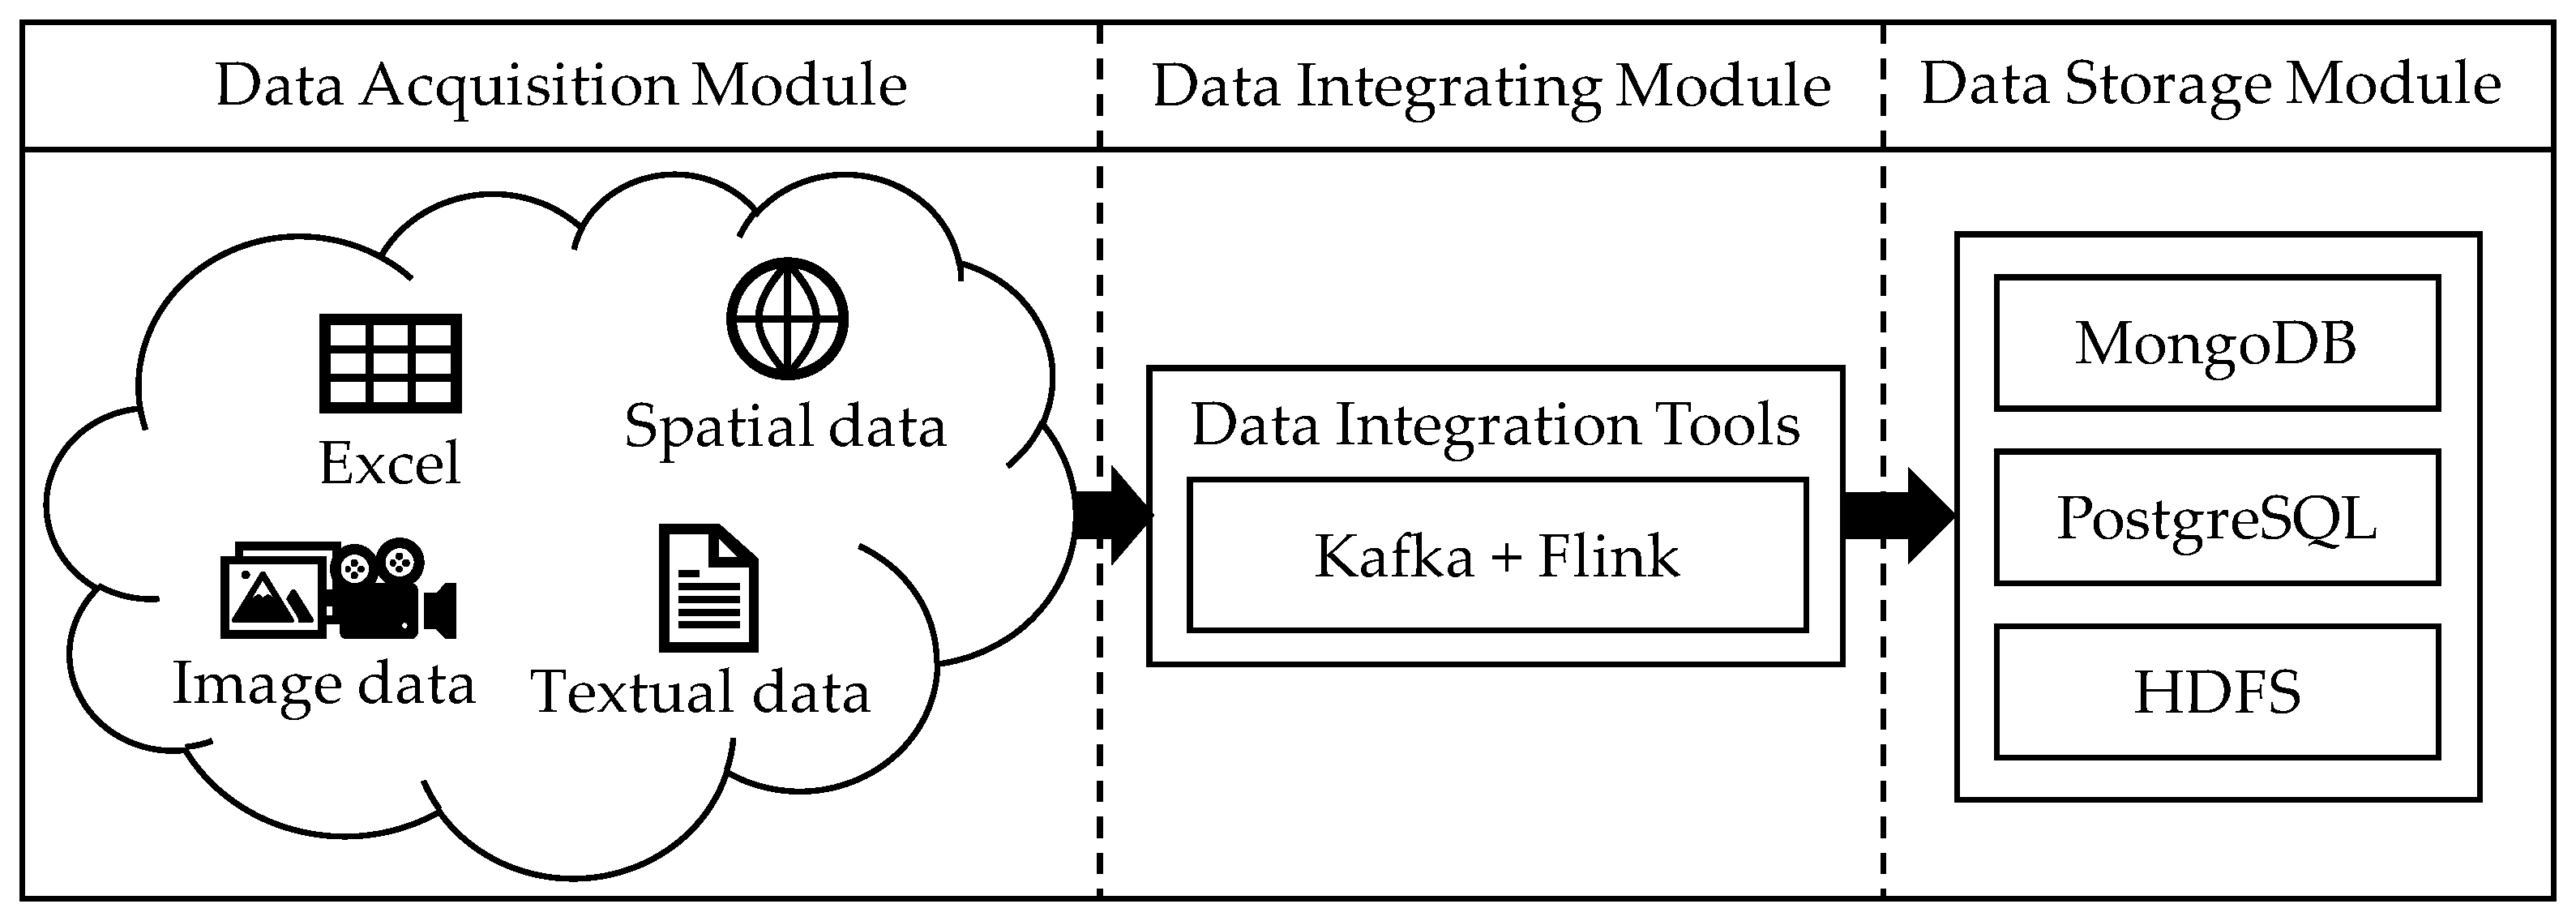
Apache Flink, serving as a distributed streaming and batch processing framework, is crafted for swift, reliable, and efficient handling of large-scale data streams and batch tasks. It supports various programming languages, such as Java and Scala, alongside a variety of databases, including Kafka, MySQL, and InfluxDB [37,38]. This paper constructs a multi-source data integration framework for landslide disaster based on Flink, as illustrated in Figure 5.
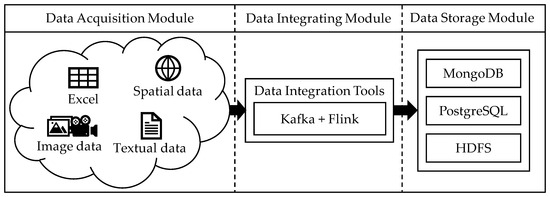
Figure 5.
A Framework Diagram for Multi-Source Landslide Data Integration Based on Flink.
- (1).
- Data Acquisition Module
This paper designs a versatile data source adapter that manages data source parameters through a configuration center called Zookeeper. Zookeeper creates a data node (ZNode) to store configuration details, akin to a directory in a file system. Additionally, Zookeeper employs a listening mechanism named Watcher to monitor changes in ZNodes. When a ZNode undergoes updates or operations, like additions or deletions, a WatchedEvent is triggered, prompting Zookeeper to update the configuration node’s data. This approach enables dynamic updates to the configuration information, reducing system redundancy and ensuring consistency across all nodes in the distributed system.
- (2).
- Data Processing Module
After the collection of landslide disaster data, it must undergo processes such as data cleansing and transformation to convert the gathered data into a uniform format suitable for storage and other tasks. Addressing issues like missing values and anomalies in the data requires marking and handling abnormal data to maintain data accuracy and integrity. Data of the same type may exhibit varying formats, necessitating conversion into a unified format to ensure consistency in data representation within the system.
- (3).
- Data Storage Module
There remains a disparity between data access speed and data processing speed, especially concerning sensor-type data sources. In such cases, the involvement of the distributed message queue Kafka serves as a buffer. Kafka initially creates a topic to store messages based on data types. Data are sent to the topic by Kafka producers and consumed by Flink for processing. This data dissemination method combines the strengths of Zookeeper, Kafka, and Flink to achieve efficient and reliable stream data processing. Flink writes integrated processed attribute data, monitoring data, textual data, and image data files into MongoDB for storage, while raster and vector data are written into PostgreSQL through PostGIS.
2.4. Cluster Load Balancing Strategy Based on APSO
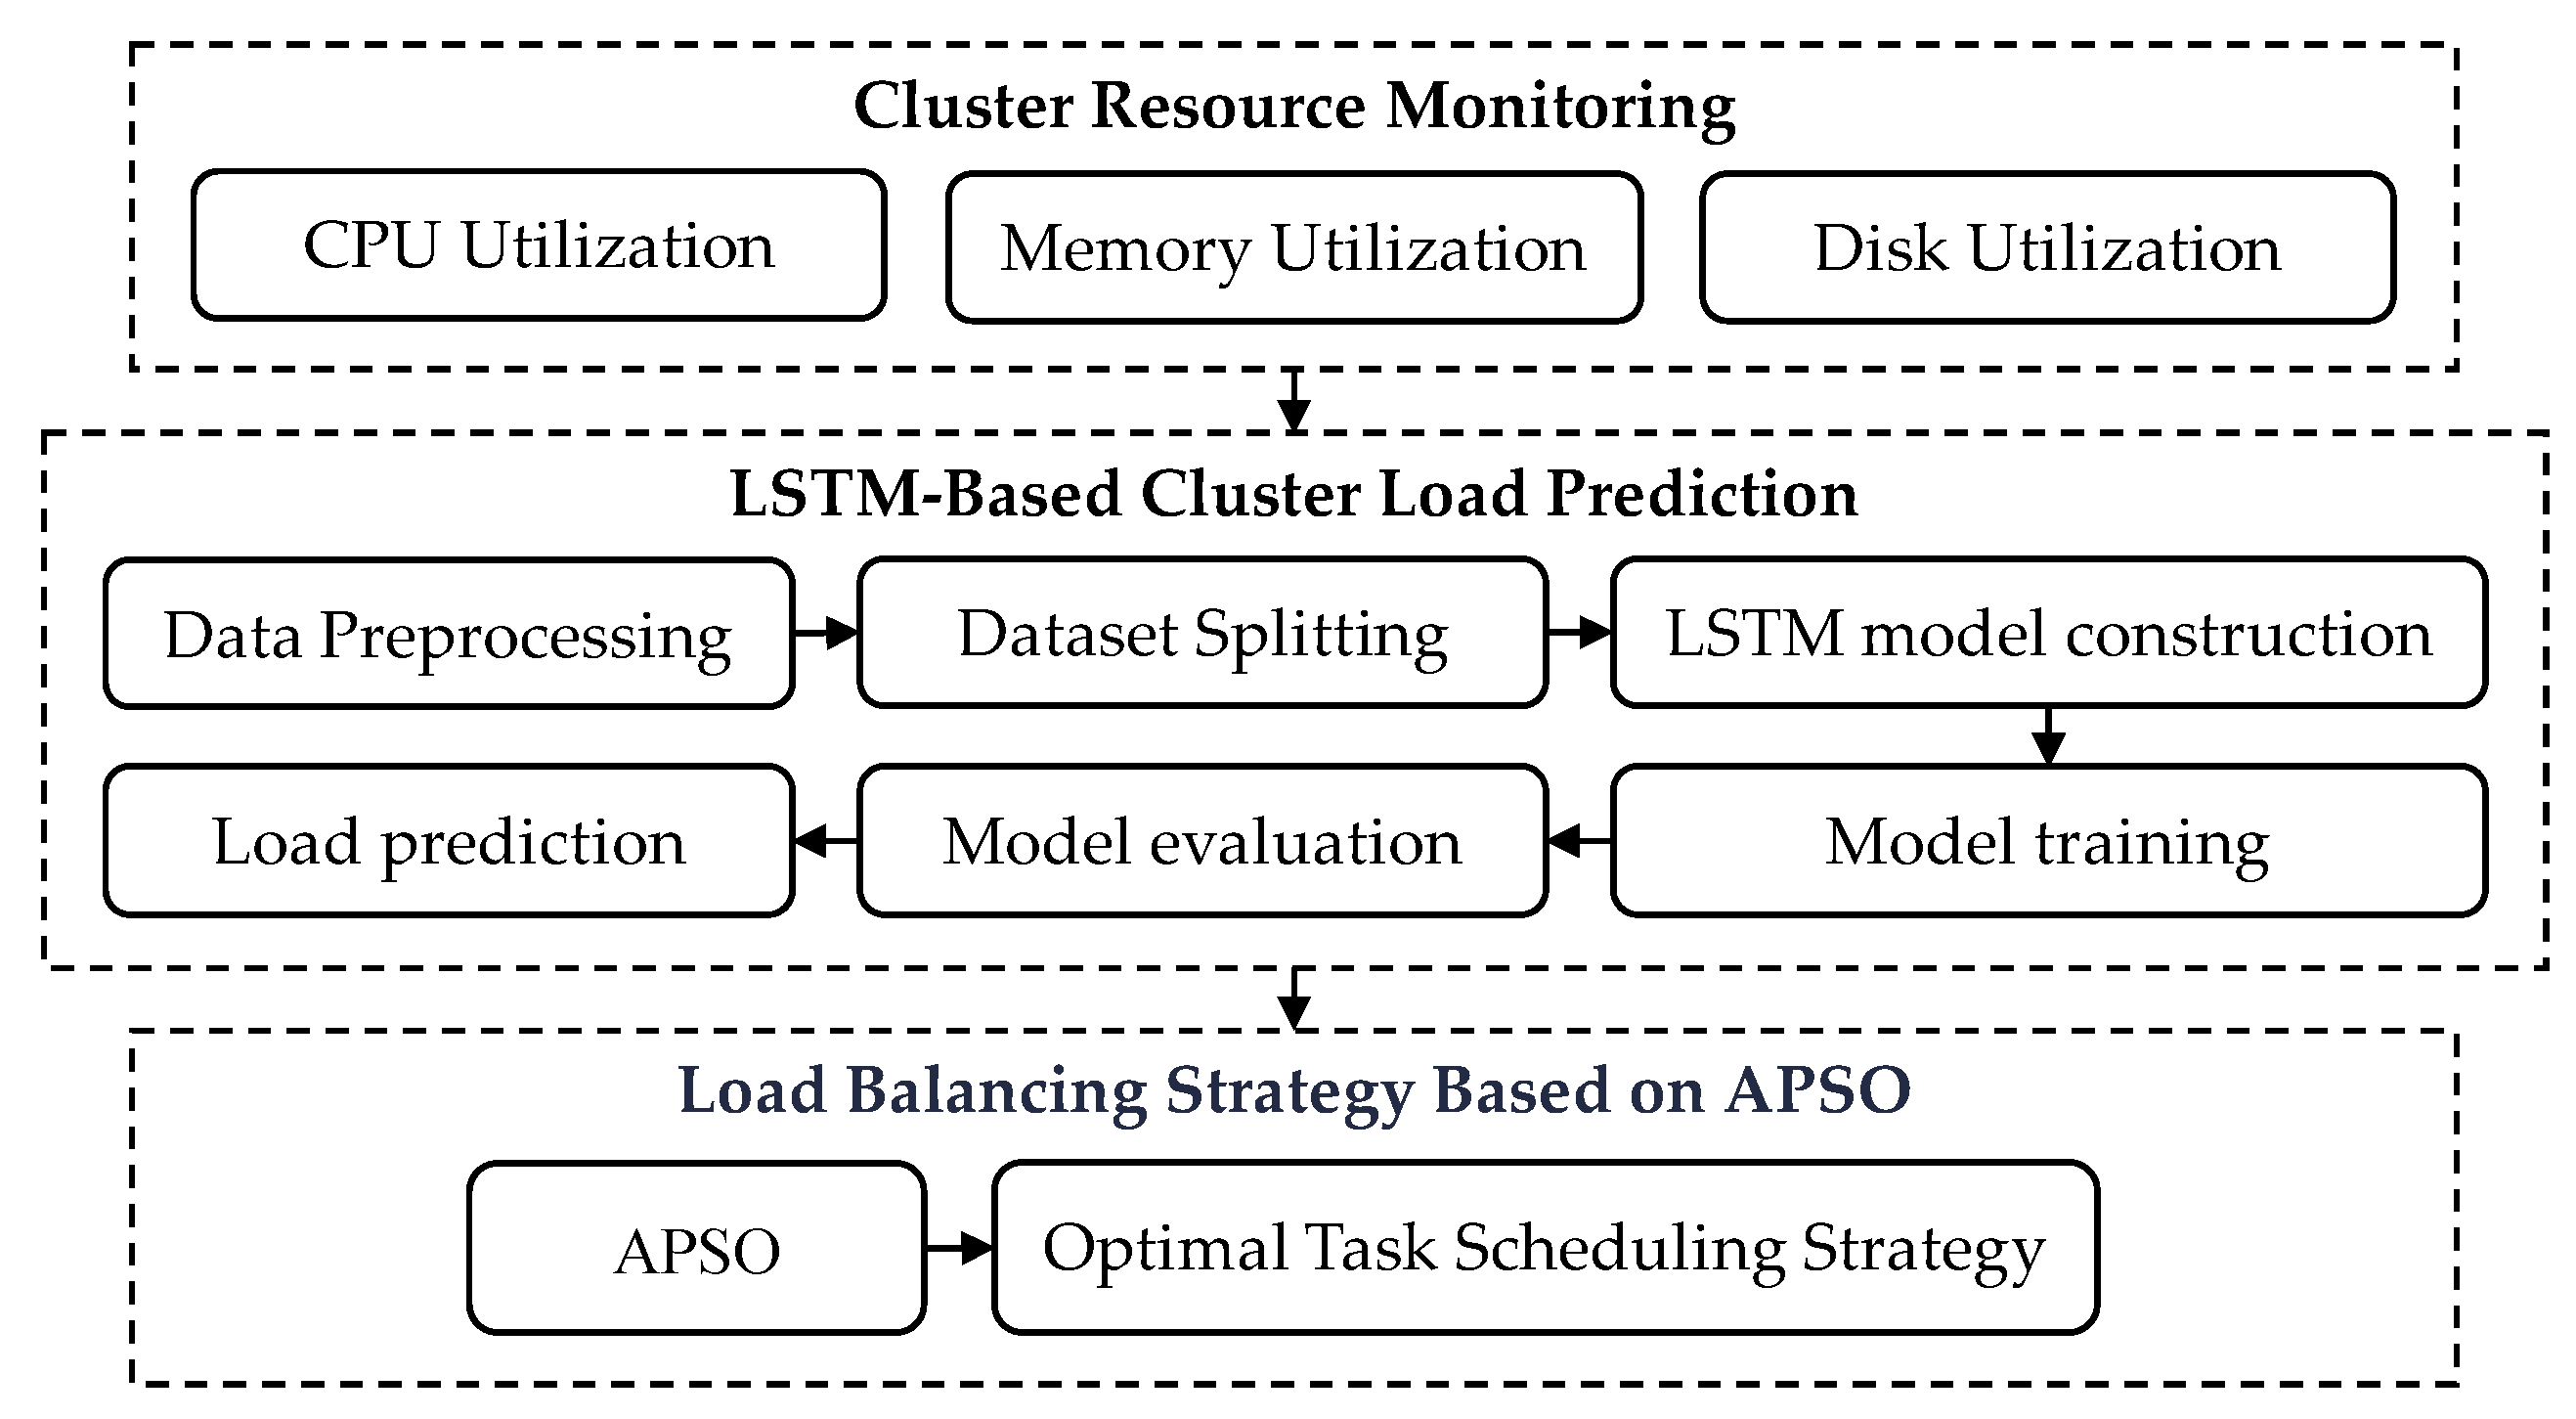
This paper employs the multi-source data integration task scheduling optimization method illustrated in Figure 6 to achieve a balanced cluster load and enhance resource utilization and data integration efficiency.
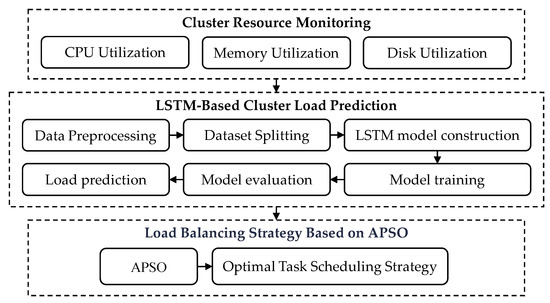
Figure 6.
Flowchart of Optimized Task Scheduling for Multi-source Data Integration in Landslide.
2.4.1. Cluster Resource Monitoring
Cluster resource monitoring collects crucial system information to support the optimization algorithm for task scheduling based on APSO, encompassing performance metrics, such as Central Processing Unit (CPU) utilization, memory usage, and task queue length. These metrics effectively reflect the current load capacity of each node and are utilized as inputs for load prediction and strategy optimization. To quantify the impact of different processing tasks, θ is used for its representation. The influence of the CPU component is denoted as θc, while the influence of the memory component is denoted as θm. Thus, the load of a single node, denoted as s in the Flink cluster, can be represented as Lj = <Lcj, Lmj>, where Lcj represents the CPU load, and Lmj represents the memory load. Therefore, the load of node s can be expressed by Equations (5) and (6):
The formula for calculating the average load of a cluster with n nodes at time t is as follows:
where θ represents a weighting coefficient used to adjust the influence weights of the CPU and memory components on the load. These weighting coefficients can be adjusted based on the actual scenario to reflect the impact of the CPU and memory on the node load.
2.4.2. LSTM-Based Cluster Load Prediction
The importance of cluster load prediction resides in its capacity to bolster system stability by anticipating fluctuations in demand, thereby averting overload and potential failures. Furthermore, it optimizes resource utilization through effective allocation, significantly reducing waste. Load forecasting also diminishes the necessity for manual intervention, facilitating automated adjustments that empower the system to respond more rapidly to evolving demands, thus enhancing overall efficiency. The Long Short-Term Memory (LSTM) is a specialized form of recurrent neural network (RNN) that possesses the capability to capture and process long-term dependencies and information. In comparison to conventional RNNs, LSTM demonstrates enhanced memory capabilities [39]. The fundamental principle underlying the LSTM model is its capacity to regulate information flow and update memory through gate mechanisms, thereby facilitating enhanced handling of long-term dependencies. This characteristic empowers LSTM with exceptional capabilities for processing time series data. In this study, an LSTM model is constructed to forecast node loads, by the subsequent steps.
(1) Data preprocessing: A time series dataset is collected from a cluster with a 5 s collection interval and a length of n. The collected historical cluster load data are subjected to preprocessing, encompassing the handling of missing values and normalization. In the load dataset, missing values are filled using the mean value imputation method, and features are normalized to have a zero mean and unit variance based on their respective mean and standard deviation.
(2) Dataset splitting: The preprocessed dataset has been divided into a training set, Ftrain, and a testing set, Ftest.
(3) LSTM model construction: The LSTM model is built using the deep learning framework pytorch. The parameters to be optimized are determined, including the number of neurons, learning rate, and number of training iterations, along with their respective optimization ranges.
(4) Model training: The LSTM model is trained using the training set Ftrain. During the training process, input sequences of the load data are utilized to predict the load for the subsequent time step as output. The mean squared error (MSE) serves as the loss function for model training.
(5) Model evaluation: The trained LSTM model is evaluated using the testing set Ftest. The assessment of prediction performance involves the computation of metrics, such as mean squared error (MSE), root mean squared error (RMSE), mean absolute error (MAE), and mean absolute percentage error (MAPE), to measure the disparity between the predicted values and the ground truth.
(6) Load prediction: The trained LSTM model is employed for load prediction. In practical applications, the latest real-time load data are input into the model to obtain load predictions for a future time horizon, thereby facilitating decisions related to cluster load balancing.
2.4.3. APSO-Based Task Scheduling Optimization Algorithm
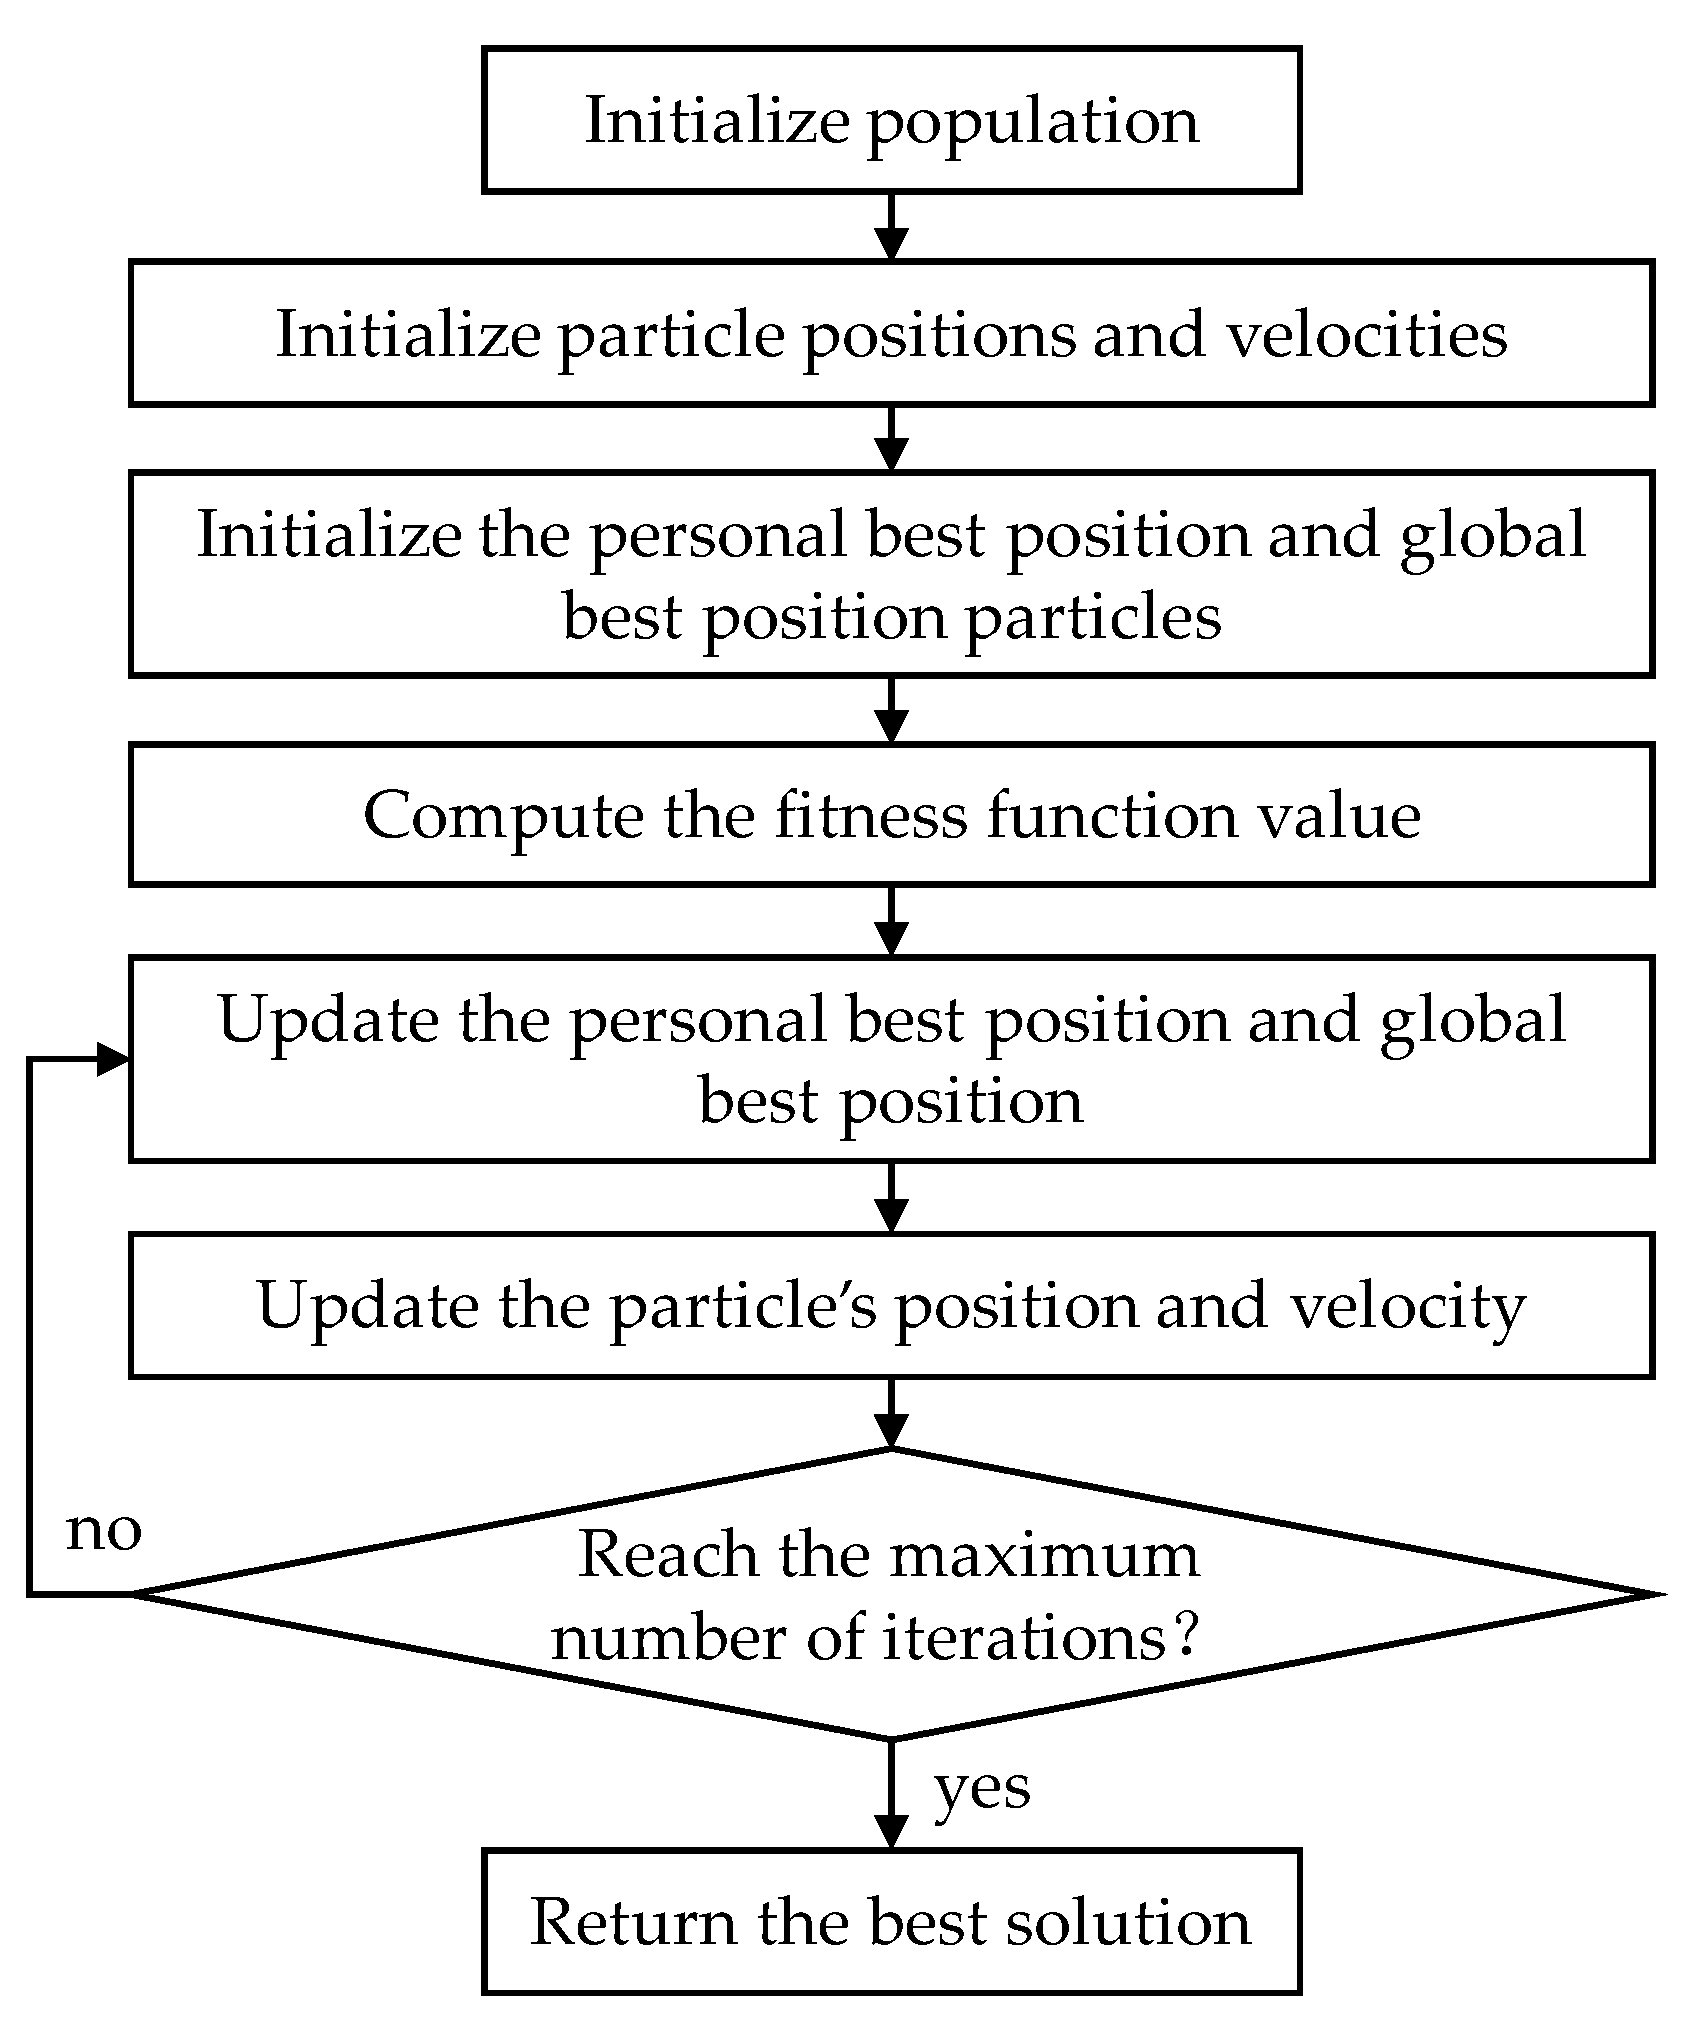
Particle Swarm Optimization (PSO) is a population-based optimization algorithm that simulates the flight behavior of bird flocks to search for optimal solutions. In PSO, each particle serves as a representation of a potential load strategy, with its position indicating the parameter values of the strategy and its velocity signifying the update speed of these parameters. By continuously updating the positions and velocities of particles, the PSO algorithm gradually converges to the optimal solution [40,41]. In the basic particle swarm algorithm, the solution space is divided into a set of particles, with each particle representing a candidate solution. In a d-dimensional solution space, initializing n particles forms a set of candidate solutions denoted as X = (X1, X2, …, Xn). The position of each particle represents the location of the candidate solution in the solution space, where the position of the i-th particle can be represented as Xi = (Xi1, Xi2, …, Xin). The velocity of each particle represents the direction of movement and speed of the particle in the solution space, where the velocity of the i-th particle can be represented as Vi = (Vi1, Vi2, …, Vin). The positions and velocities of particles are randomly initialized, and the initial best position for each particle is set to its current position, denoted as Pi = (Pi1, Pi2, …, Pin). The global best position, denoted as Pg = (Pg1, Pg2, …, Pgn), is initially set to any particle’s position or the position corresponding to the best fitness value in the population. For each particle i, the particle’s velocity and position are updated based on the current velocity, the current position, the individual historical optimal position and the global historical optimal position, as shown in Equations (8) and (9):
where i = 1, 2, …, n; Vi,t represents the velocity of particle i at time t; Xi,t represents the position of particle i at time t; ω represents the inertia weight used to balance the particle’s historical velocity and current velocity; c1 and c2 are acceleration factors that control the extent to which the particle moves towards its individual best position and the global best position, respectively; and r1 and r2 are random numbers distributed between 0 and 1, used to introduce randomness and diversity. The individual and global best positions are updated as follows: if f (Xi, t+1) > f (Pi), then Pi = Xi, t+1; if f (Xi, t+1) > f (Pg), then Pg = Xi, t+1. The aforementioned steps are iteratively performed until the maximum number of iterations is reached or the target fitness value is attained, thereby yielding the optimal solution within the search space. The specific procedure is illustrated in Figure 7.
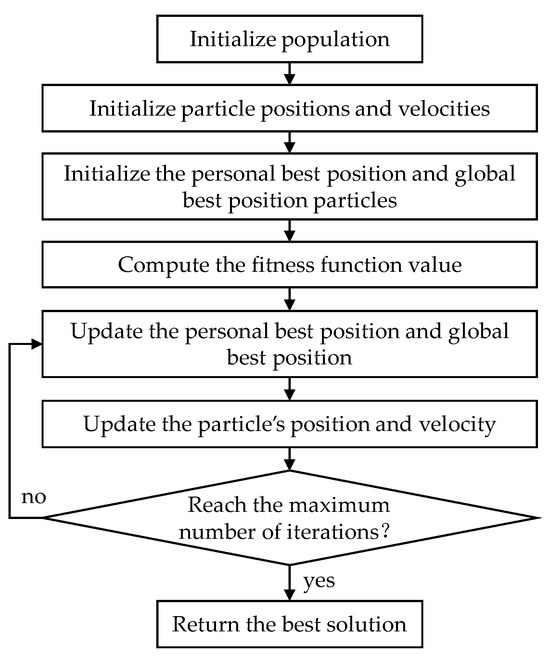
Figure 7.
Flowchart for APSO.
In PSO, the inertia weight ω is utilized to strike a balance between exploration and exploitation of the solution space, taking into account both the historical and current velocities of particles. The selection of an appropriate inertia weight significantly influences the convergence behavior and search capability of the algorithm. A higher ω coefficient enhances the global optimization ability, while a lower ω coefficient strengthens the local optimization ability [42]. Consequently, employing a fixed ω coefficient diminishes the algorithm’s global optimization potential and decelerates its convergence rate. The improved Particle Swarm Optimization (APSO) algorithm employed in this paper enhances the performance of PSO through the utilization of linearly decreasing inertia weights (refer to Equation (10)):
where ωmax and ωmin are the maximum and minimum values of the inertia weight ω, respectively; t represents the current iteration; and tmax is the maximum number of iterations.
During the process of monitoring cluster resources, the observed data on resource usage (such as CPU utilization, memory utilization, and disk utilization) are inputted into the LSTM model to obtain load prediction results. Subsequently, utilizing the optimal load strategy parameters derived from the APSO algorithm, a load strategy is generated for adjusting resource allocation and task scheduling in the Flink cluster. Based on predicted loads and optimized strategy parameters, real-time adjustments are made to optimize performance and resource utilization in the cluster. Concurrently, continuous monitoring of resource usage and performance metrics in the cluster provides feedback to update both the LSTM model and APSO algorithm constantly in order to adapt to changing and evolving loads.
3. Experiments and Results
3.1. Experimental Environment
The experimental Flink cluster comprises five computers, consisting of one master node (Master) and four worker nodes (Slave01, Slave02, Slave03 and Slave04). The Master node serves as the JobManager, while the remaining four computers function as TaskManagers. These nodes are interconnected through a local area network. Flink is configured with default parameters, and the parallelism parameter is adjusted to evaluate algorithm performance under varying degrees of parallelism. The nodes operate in Yarn mode. Table 7 presents the hardware configurations for each node, while Table 8 provides details on their software configurations.

Table 7.
Hardware configuration.

Table 8.
Software configuration.
3.2. Analysis of Integrated Results from Multi-Source Landslide Data
3.2.1. Results of Handling of Anomalous Data
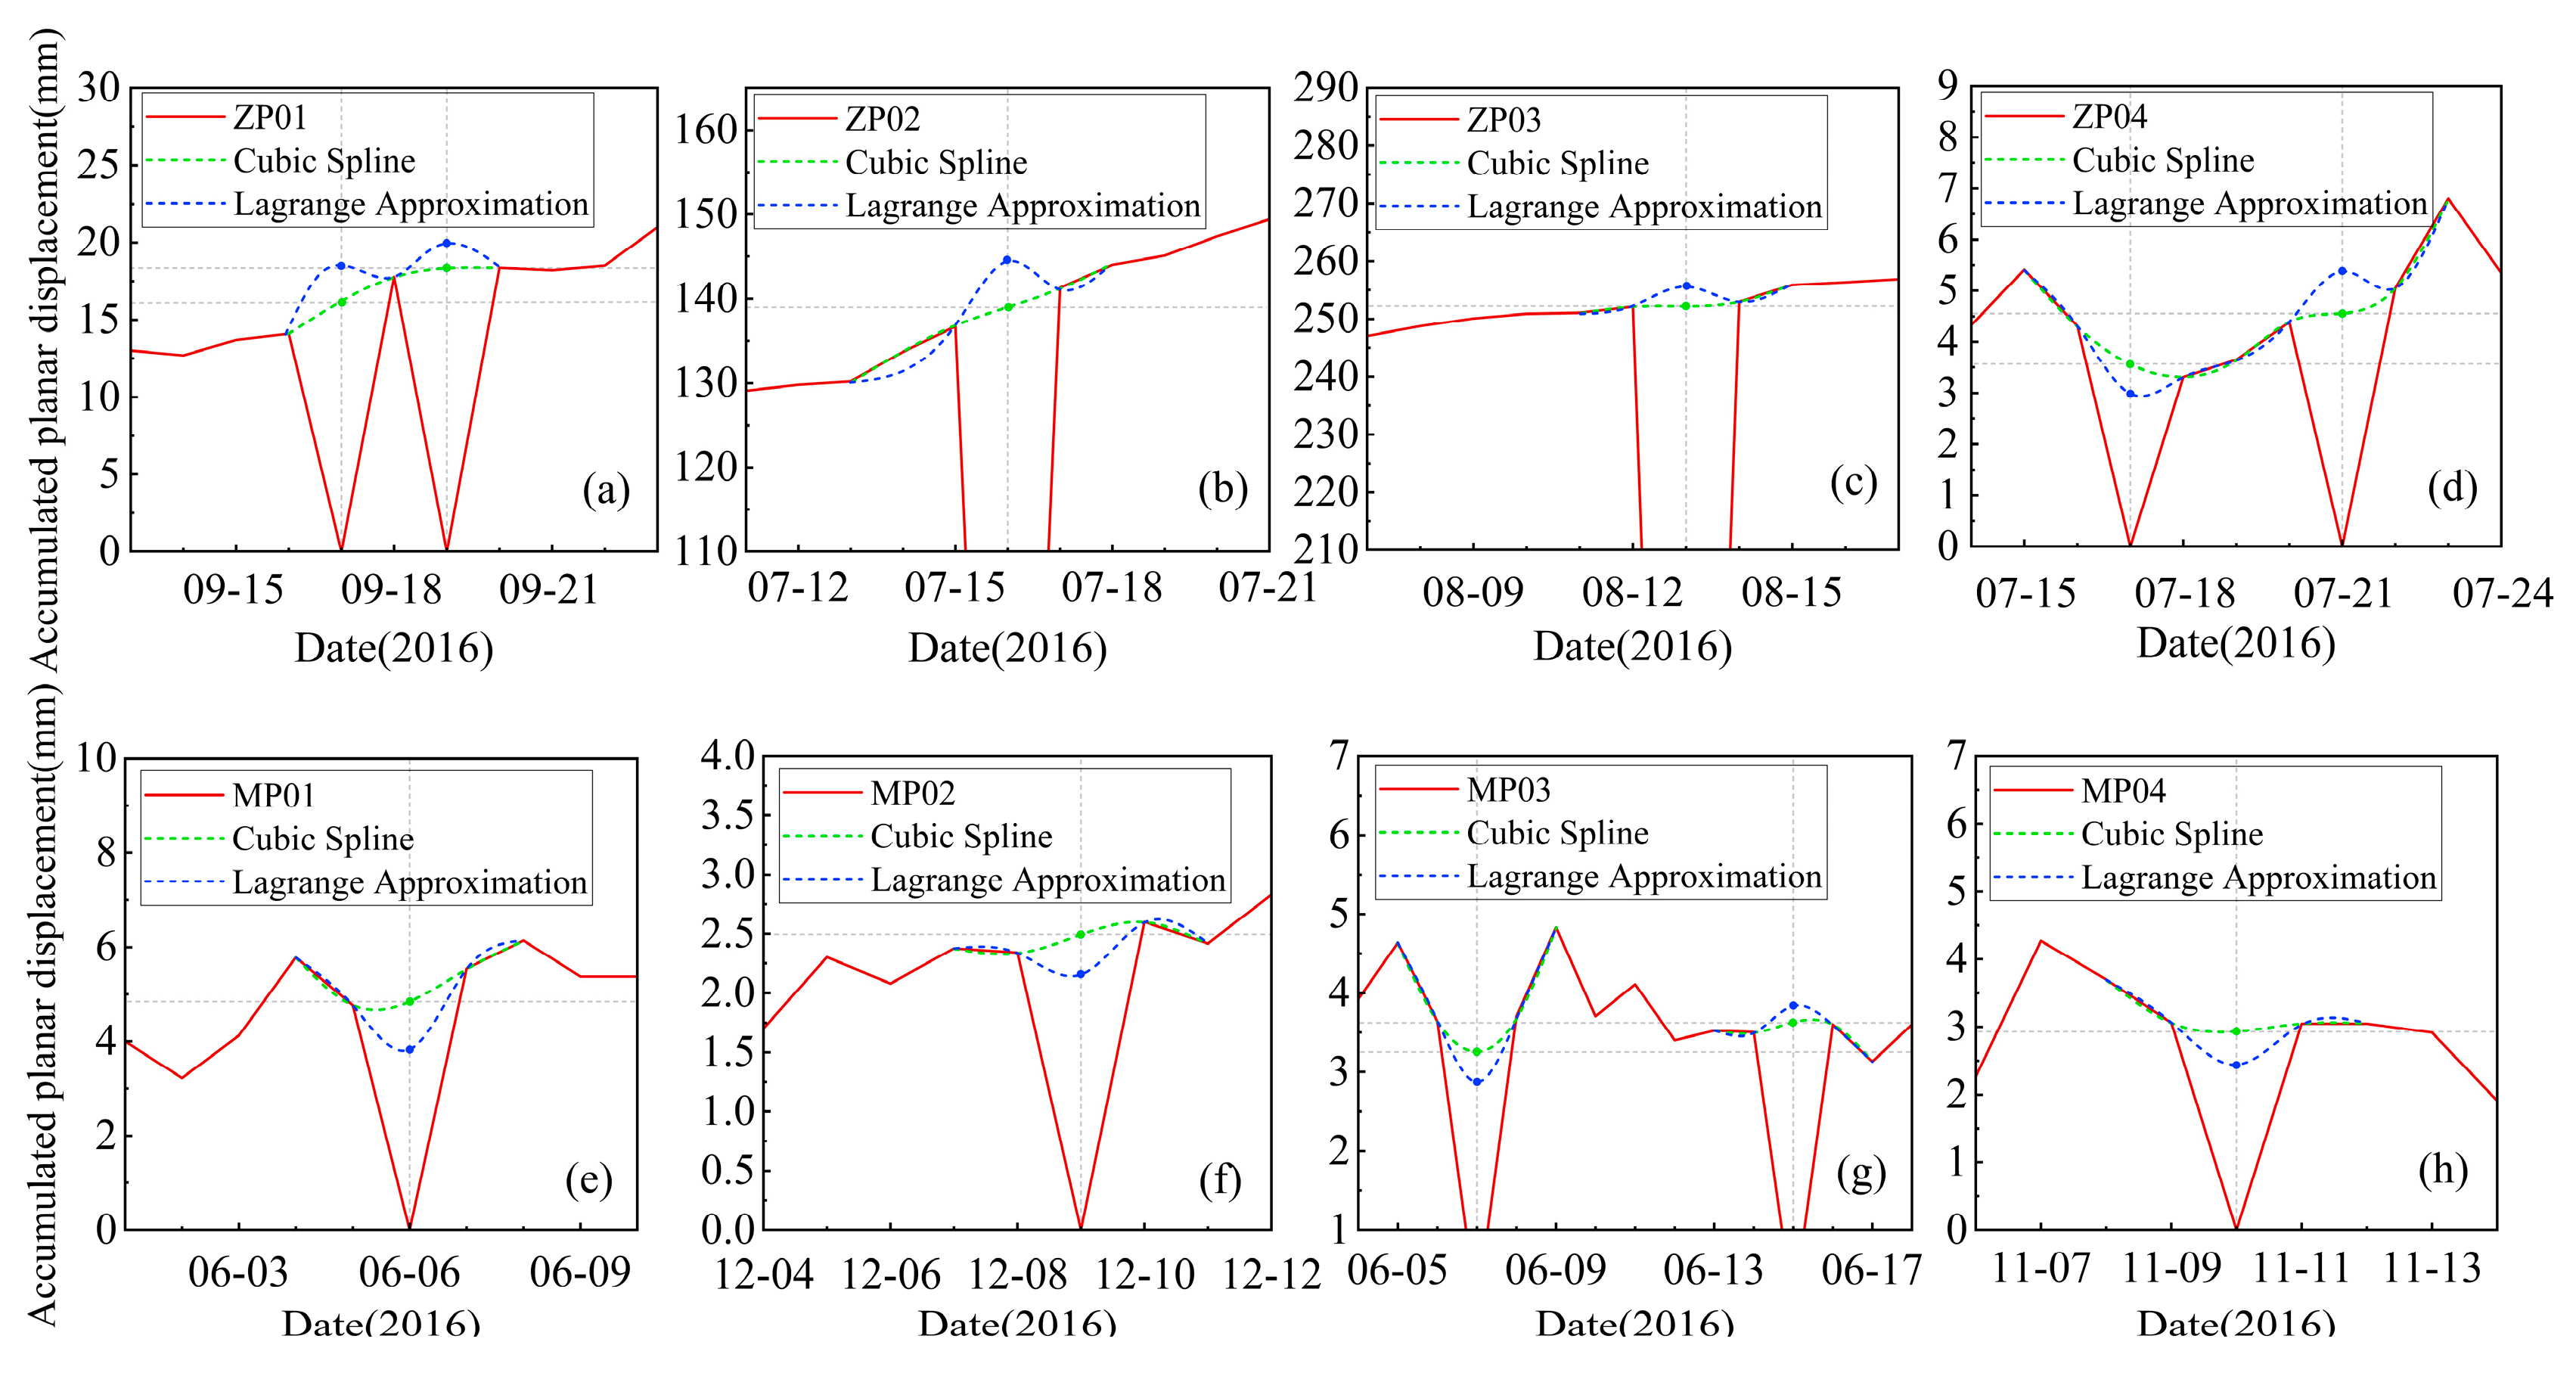
Utilizing GNSS automated monitoring data and debris flow sediment concentration monitoring data as exemplary cases, this study computes the average mean square error values between the interpolated missing values, treated using Lagrange interpolation and cubic spline interpolation, and the original dataset. Subsequently, a comparative analysis of the results is conducted.
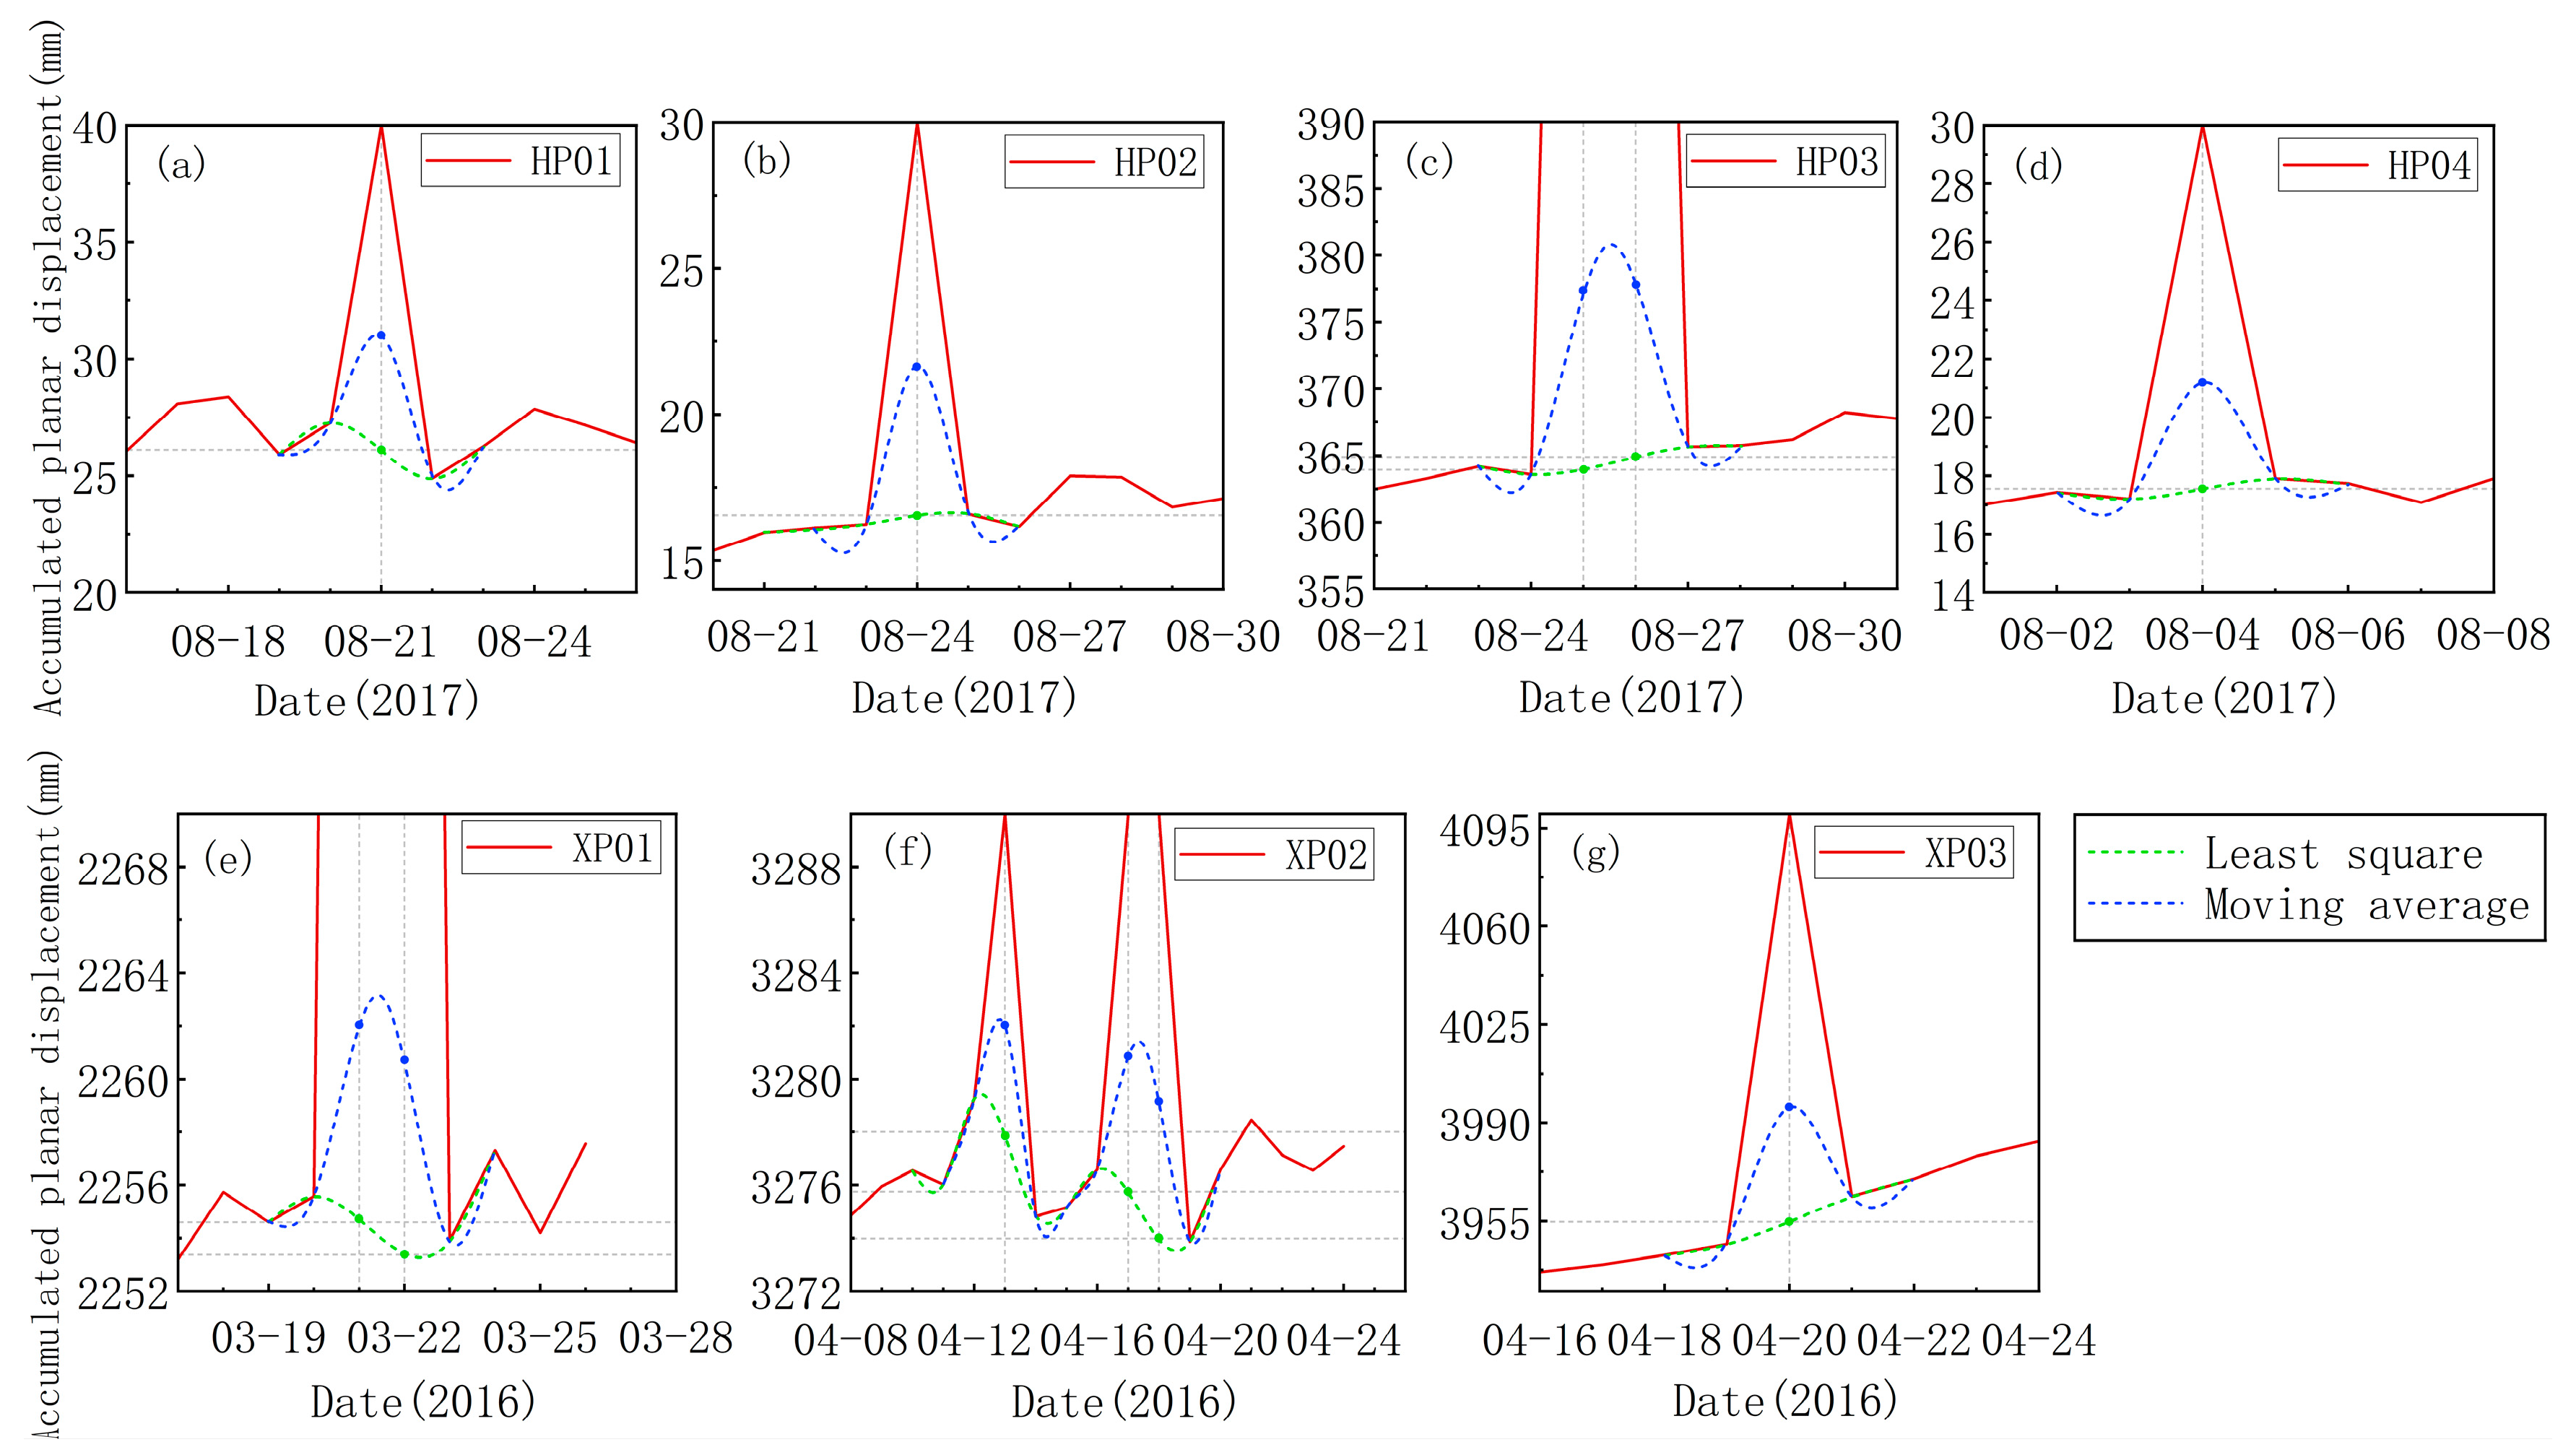
Figure 8a–d and Figure 8e–h, respectively, depict the comparison between the pre-processed and post-processed missing data in the 2016 GNSS automated monitoring data of the Huangcaoping and Zhengjiaping deformation bodies. In Figure 8b,c,e,f,h each has a single missing value, while (a, d, g) have multiple adjacent missing values. In the first category of anomalous data, the data values obtained using cubic spline interpolation are closer to the original values compared to those derived from Lagrange interpolation. In the second category of anomalous data, although the results still indicate that cubic spline interpolation outperforms Lagrange interpolation, both methods exhibit a greater error compared to the original values, in contrast to the first category of anomalous data. The missing data were interpolated using Lagrange interpolation and cubic spline interpolation methods. A comparative analysis with Lagrange interpolation reveals that the data filled by cubic spline interpolation maintains a consistent trend with the original data, while the trend of the data filled by Lagrange interpolation significantly deviates from the original. The average mean square error (MSE) for Lagrange interpolation in (a)–(h) is 6.586, whereas it is 3.425 for cubic spline interpolation on average. Therefore, results obtained through cubic spline interpolation are closer to the original data and exhibit a better fitment. Figure 9a–d and Figure 9e–g, respectively, illustrate the comparison between the pre-processed and post-processed “noisy” data in the GNSS automated monitoring of Mogangling and Xinhua deformation bodies in 2016. The original data was fitted and denoised using least squares method, as well as the moving average method. From Figure 9, it can be observed that, even after processing with the moving average method, certain jumps still persist within the data; however, the least squares method effectively eliminates noise from the dataset, aligning better with its original trend. The average mean squared error (MSE) of the moving average methods (a)–(g) is 4.258, whereas the least square method yields an average MSE of 2.375. Therefore, employing the least squares method for data noise reduction yields superior results.
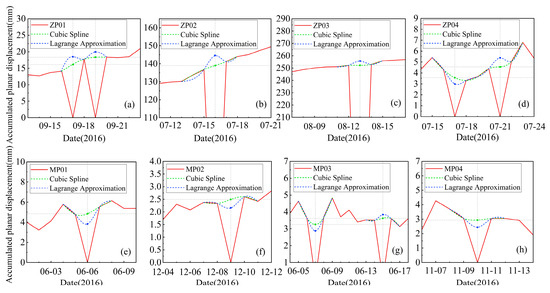
Figure 8.
Comparison of Missing Data Processing Methods. (a–h) are the before-and-after comparison plots for four GNSS automatic monitoring points of the Huangcaoping and Zhengjiaping deformation bodies in 2016, showing the application of two different methods for handling missing data.
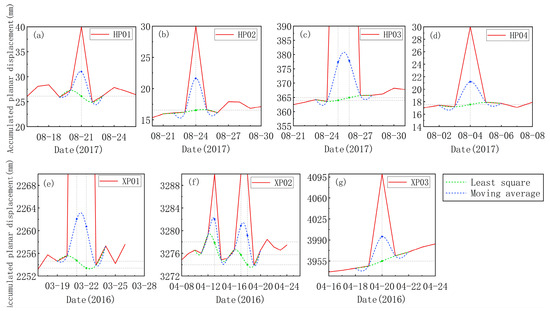
Figure 9.
Comparison of denoising methods. (a–g) are the before-and-after comparison plots for several GNSS automatic monitoring points of the Mogangling and Xinhua deformation bodies in 2016, showing the application of two different methods for data denoising.
The XGBoost model for regression prediction is used, with the following parameters: max_depth = 5, learning_rate = 0.1, n_estimators = 100, objective = ‘reg:squarederror’, booster = ‘gbtree’, random_state = 0. Partitioning the dataset into a training set and a testing set, the training set comprises 70% of the total data and the testing set accounts for the remaining 30%. During the training phase utilizing the XGBoost model, a rolling window approach is employed, establishing a fixed window size for dynamic training and evaluation. The training and validation were carried out on various datasets: the original dataset (OriData), the dataset subjected to cubic spline interpolation (CSData), the dataset processed using Lagrange interpolation (LIPData), the dataset denoised via the least squares method (OLSData), and the dataset denoised through the moving average method (MAMData). Mean squared error (MSE) was employed as the evaluation metric, yielding MSE values of 0.57, 0.46, 0.51, 0.49, and 0.55 for each respective dataset. These results indicate that the application of cubic spline interpolation, in conjunction with least squares denoising, yielded superior outcomes.
3.2.2. Results of Structured Data Integration
The comparison between the pre- and post-integration data is presented in Table 9. The table illustrates the heterogeneity of the multi-source landslide structured data prior to integration, encompassing variations in data structure, data type, data format, data units, and timestamps.

Table 9.
Comparison before and after multi-source landslide structured data integration.
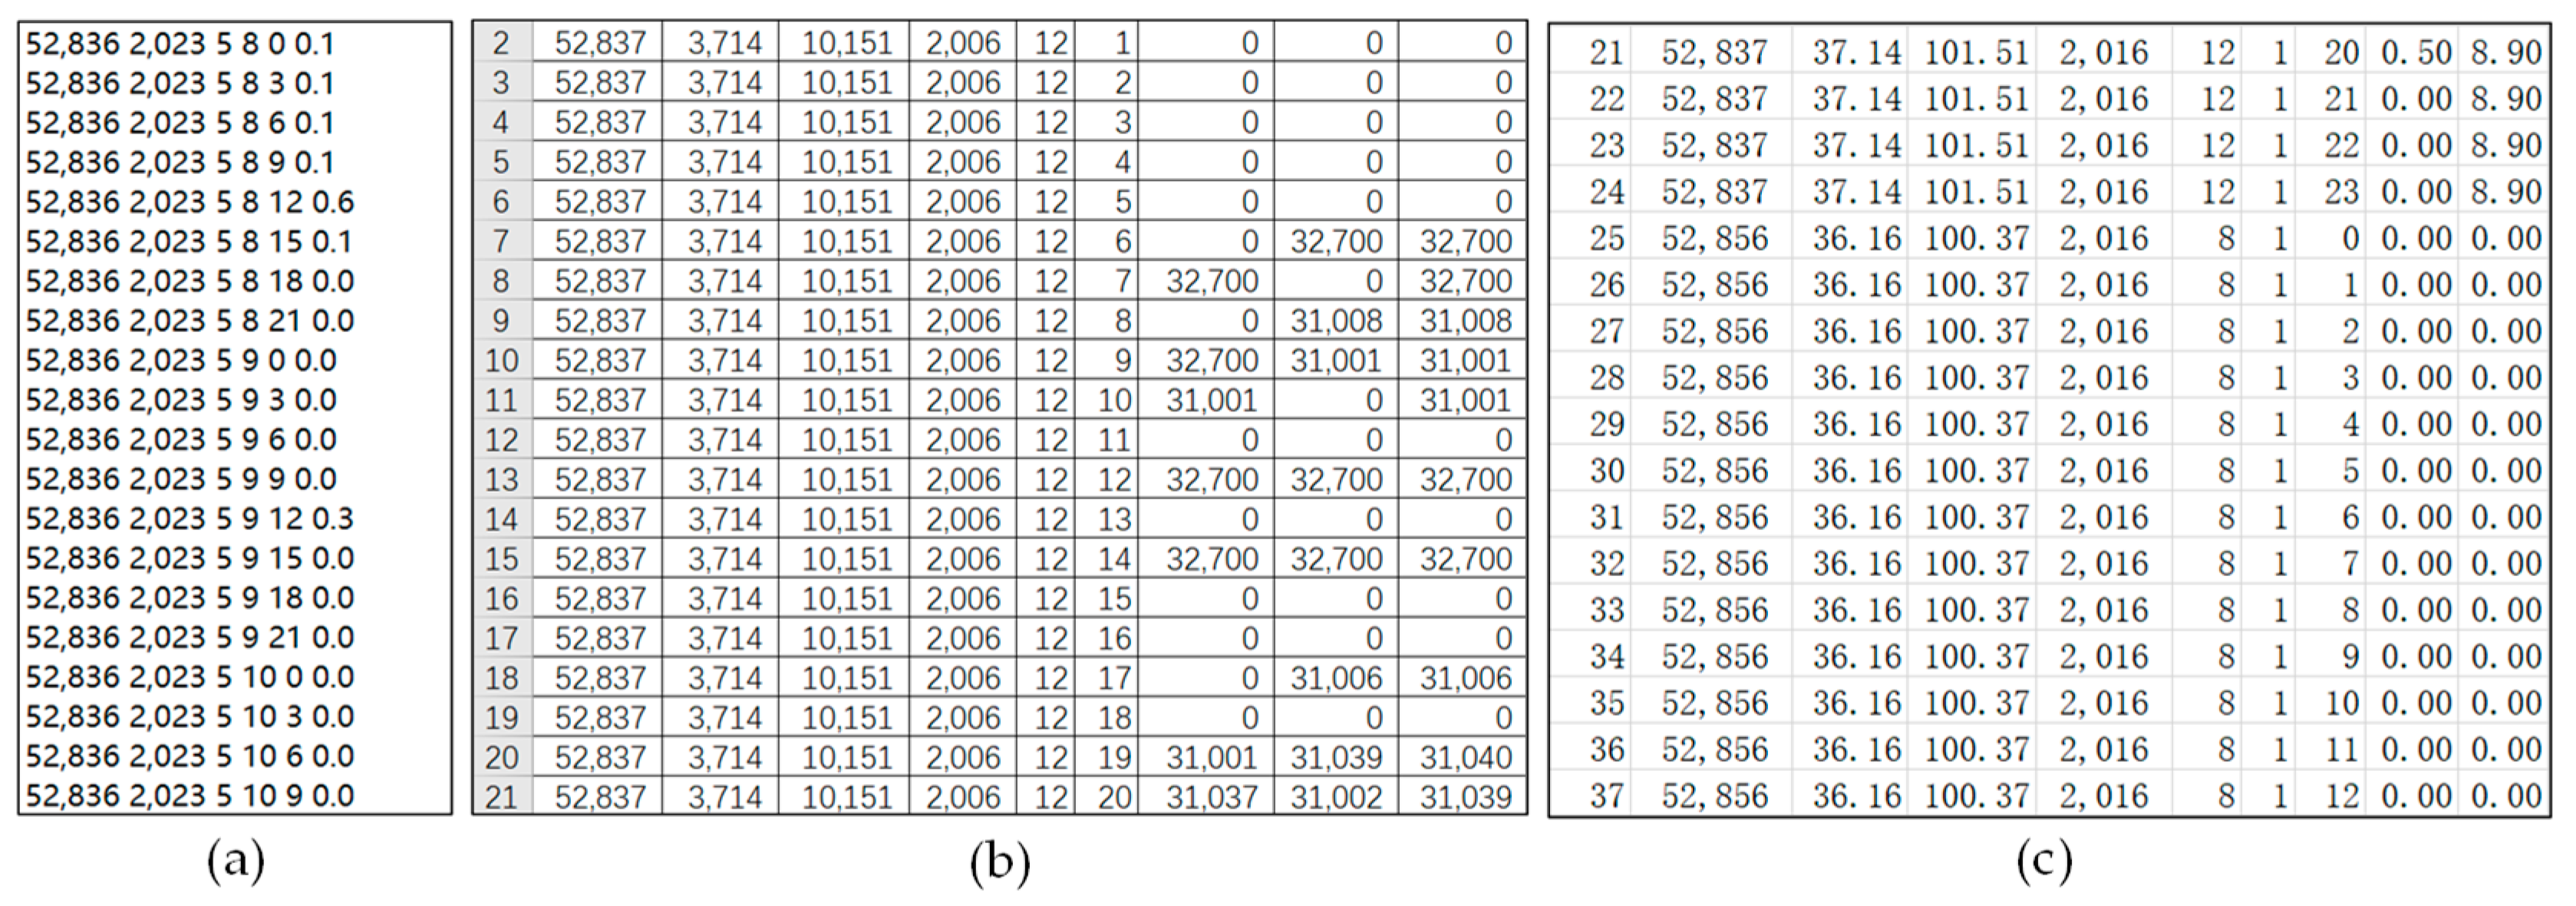
Figure 10a,b illustrates precipitation data from various meteorological observation stations in Qinghai Province before data integration. The data in the graph (a) is in txt format, while the data in the graph (b) is in xlsx format. Discrepancies are observed in data structure, synonymous field data types, data formats, and identical field data units between the two, such as the rainfall data unit for station 52836 being in millimeters (mm) and for station 52387 being 0.1 mm (0.1 mm). Standardization of data formats, data field normalization, and data coding standardization are applied to the aforementioned multi-source rainfall data. The data structure is standardized to include ID, station number, latitude, longitude, year, month, day, hour, hourly rainfall, and daily cumulative rainfall. Uniform data types are applied to fields with similar meanings in multi-source rainfall data, with station numbers using integer data types and hourly rainfall and daily cumulative rainfall using the decimal (9, 2) format. The format of the multi-source rainfall data is transformed from txt and xslx to SQL, with rainfall units standardized to millimeters. Due to variations in monitoring device sampling frequencies, data are supplemented through interpolation to ensure temporal alignment, with rainfall data described in terms of hourly and daily rainfall amounts. The integrated structured landslide data are depicted in Figure 10c.
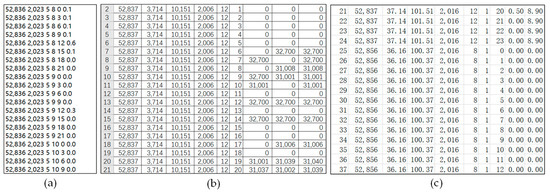
Figure 10.
Comparison of precipitation data before and after integration. (a,b) are the data before integration, and (c) represents the data after integration.
3.2.3. Results of Unstructured Data Integration
In the integration of unstructured landslide disaster data, the spatial data for landslides are organized into a shapefile storage index, as depicted in Table 10. The “name” column contains the file names, the “type” column stores their types, and the “gs” column holds their entity information.

Table 10.
Landslide spatial data file storage index.
The integrated image and textual data primarily store information such as file numbers, file names, file chunk sizes, file upload times, and lengths. The file chunk size is 261,120 bytes. When the data size exceeds the chunk size, the data are divided into multiple chunks for storage; when the data size is less than the chunk size, it is stored directly.
3.2.4. Results of Integrated Data Quality Assessment
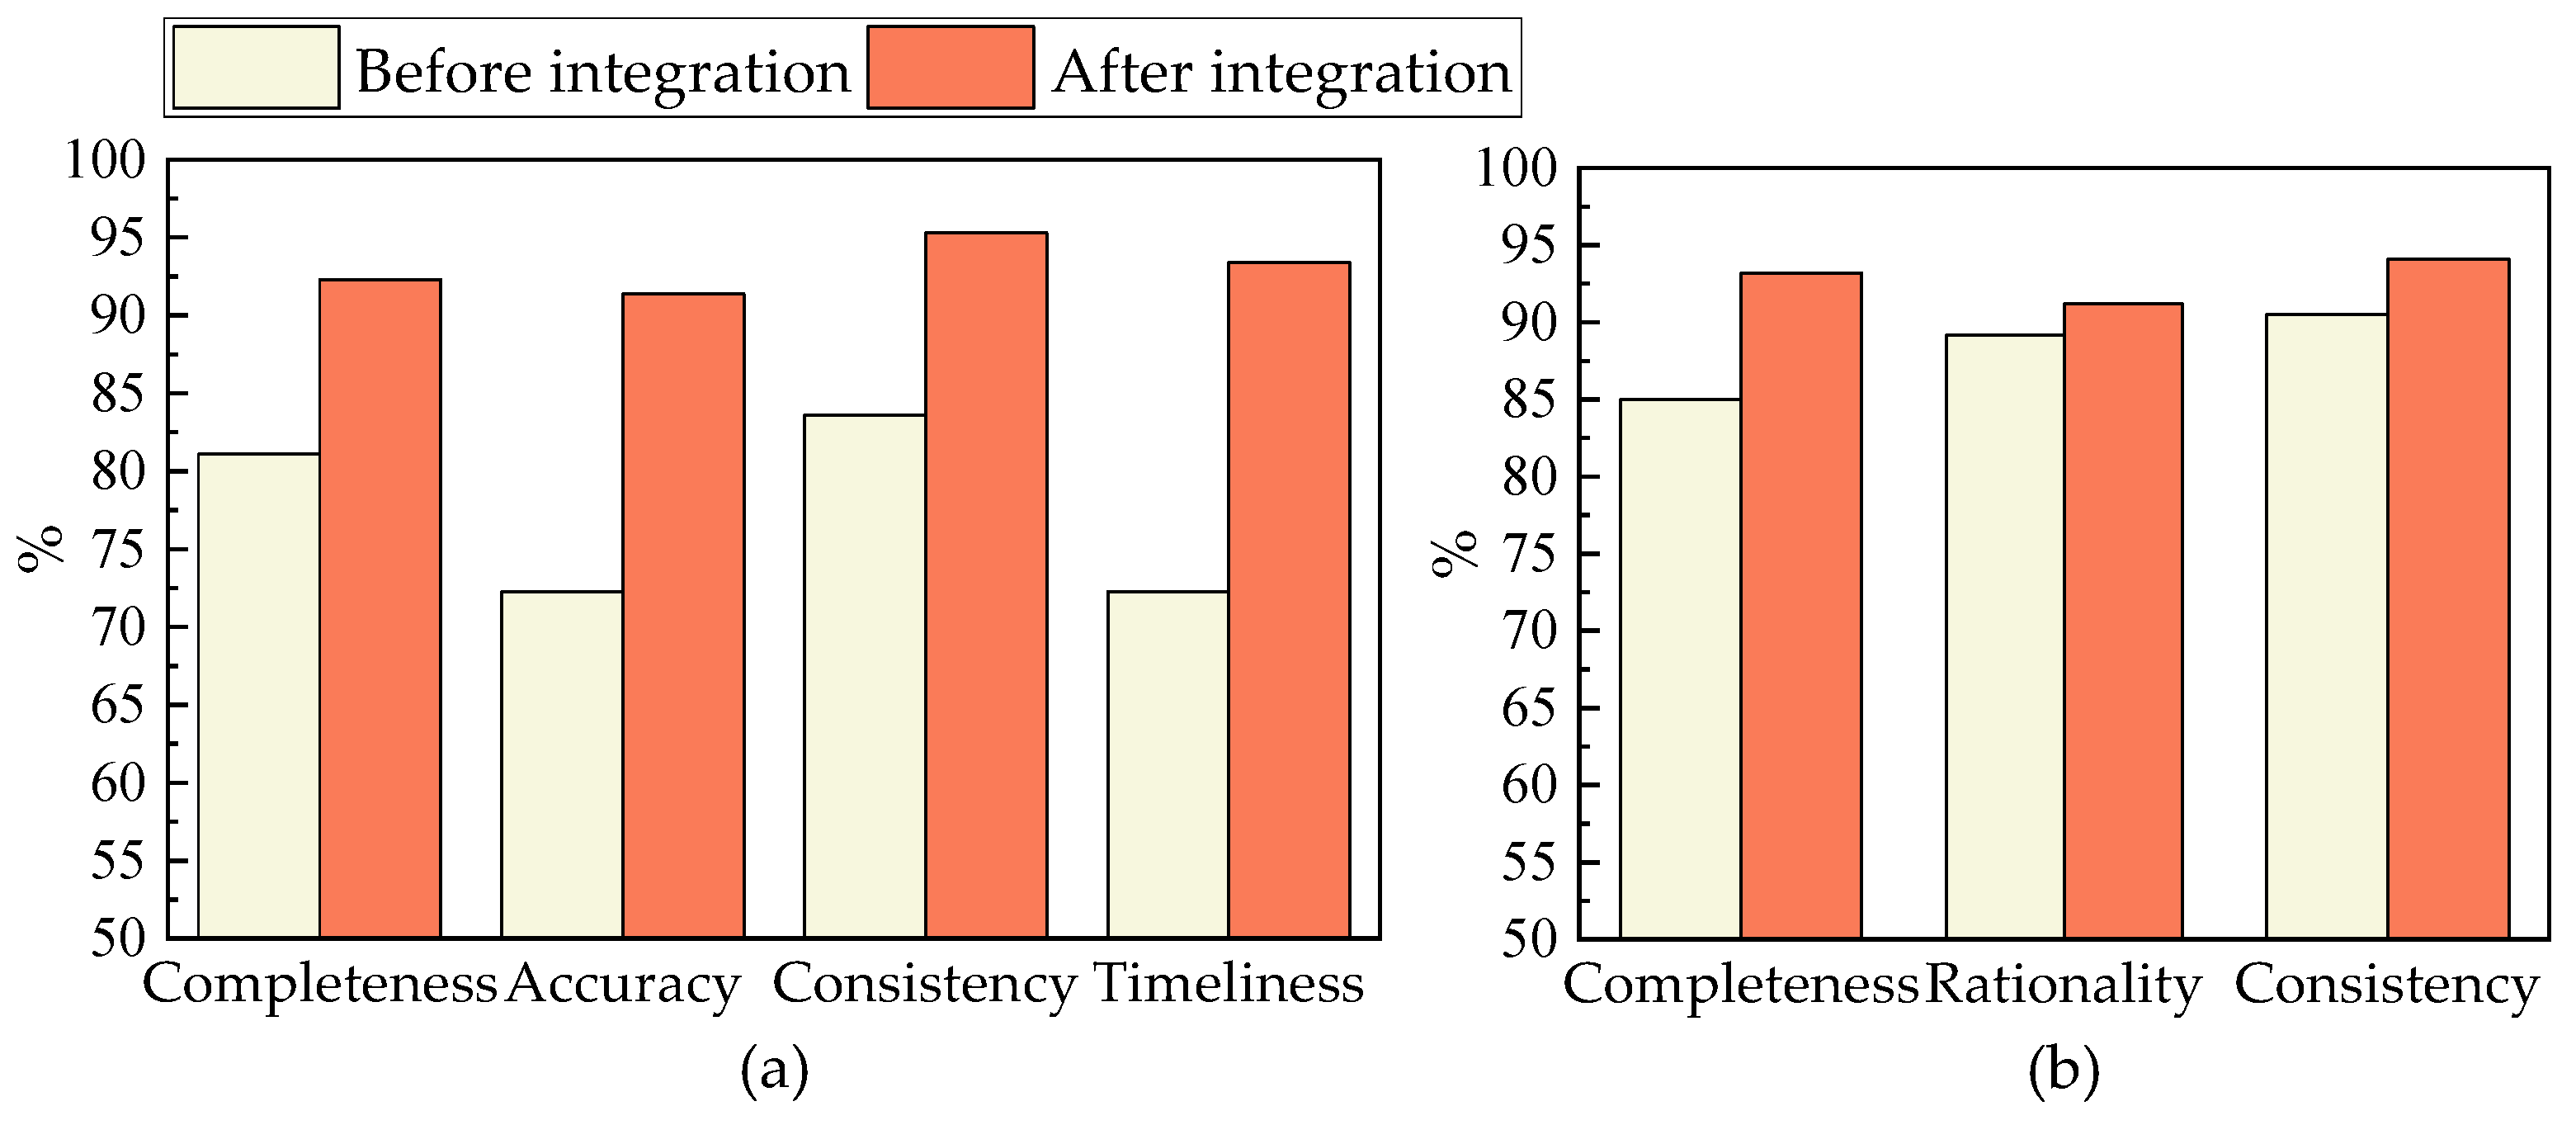
The quality characteristics of multi-source structured landslide data include accuracy, integrality, consistency, and timeliness. The quantified evaluation results of data quality assessment indicators are expressed as the percentage of data values that meet the constraints out of the total data values. From Figure 11a, it can be observed that the integrated structured landslide data have achieved over 90% in completeness, accuracy, consistency, and timeliness. Comparing the data quality assessment indicators before and after the integration of structured landslide data, the completeness has improved by 13.8% after integration, accuracy has increased by 26.4% after integration, consistency has risen by 13.9% after integration, and timeliness has enhanced by 29.1% after integration. In conclusion, based on the evaluation results of the quality indicators for integrating multi-source structured landslide data, the data quality has shown significant improvement after integration. The evaluation of unstructured data quality primarily focuses on assessing the quality of landslide spatial data, including integrity, rationality, and consistency. From Figure 11b, it is evident that the completeness, reasonableness, and consistency of the integrated unstructured disaster data have all exceeded 90% after integration. Contrasting the data quality assessment indicators before and after the integration of unstructured landslide data, completeness has increased by 9.6% after integration; reasonableness has improved by 2.2% after integration, and consistency has risen by 3.9% after integration. In summary, based on the evaluation results of the quality indicators for integrating multi-source unstructured landslide data, the data quality has shown considerable enhancement after integration.
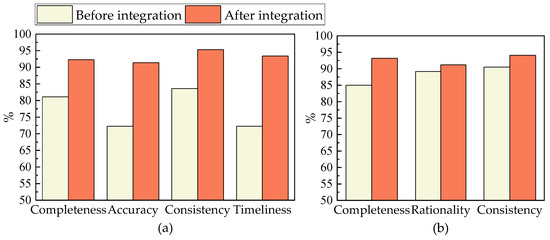
Figure 11.
Quality assessment of landslide disaster data before and after integration. (a) Structured Data. (b) Unstructured Data.
3.3. Analysis of Cluster Task Scheduling Optimization Results
3.3.1. Results of Prediction for LSTM Model
By analyzing the load data, the CPU component θc is determined to have a weight of 0.4, the memory component θm has a weight of 0.3, while the disk component θd has a weight of 0.3. A step size, denoted as L, is set, and its values are chosen as 5, 10, 20, 30, and 50. Based on different step sizes, the LSTM model is used to predict the load on the experimental dataset, and the evaluation metrics are shown in Table 11. Consequently, the optimal step size is determined to be 5. The relevant parameters of the load prediction model are determined through a combination of expertise and multiple experimental comparisons. Specifically, the LSTM model is configured with 32 neurons in the input layer, 128 neurons in the hidden layer, and 32 neurons in the output layer. The activation function used is tanh, and the model is trained for 100 iterations.

Table 11.
Comparison of prediction accuracy at different step sizes.
The load data during the 200-h operation of the cluster is used as a time series dataset for the cluster load prediction model. The features in the interval dataset include time, CPU utilization, memory utilization and disk utilization. The first 80% of the data is selected as the training set Ftrain, while the remaining 20% is used as the test set Ftest. After preprocessing the historical cluster load data, the LSTM model and the Backpropagation Neural Network (BP) model are employed to predict the cluster load. Figure 12 illustrates the difference between the predicted values and the true values using both methods. From the figure, it can be observed that both the BP model and the LSTM model capture the trend of the original sequence, but the prediction accuracy of the BP model is evidently lower compared to the LSTM model. As shown in Table 12, the LSTM model exhibits prediction errors mostly concentrated within the range of −5.0 to 5.0, with accurate peak predictions and smaller errors. Therefore, the effectiveness of the LSTM model in predicting cluster load has been verified and aligns with the expected results.

Figure 12.
Comparison of the differences between the predicted values and the true values for cluster load prediction using the LSTM and BP models.

Table 12.
Comparison of Model Accuracy.
3.3.2. Results of Optimization for APSO Task Scheduling
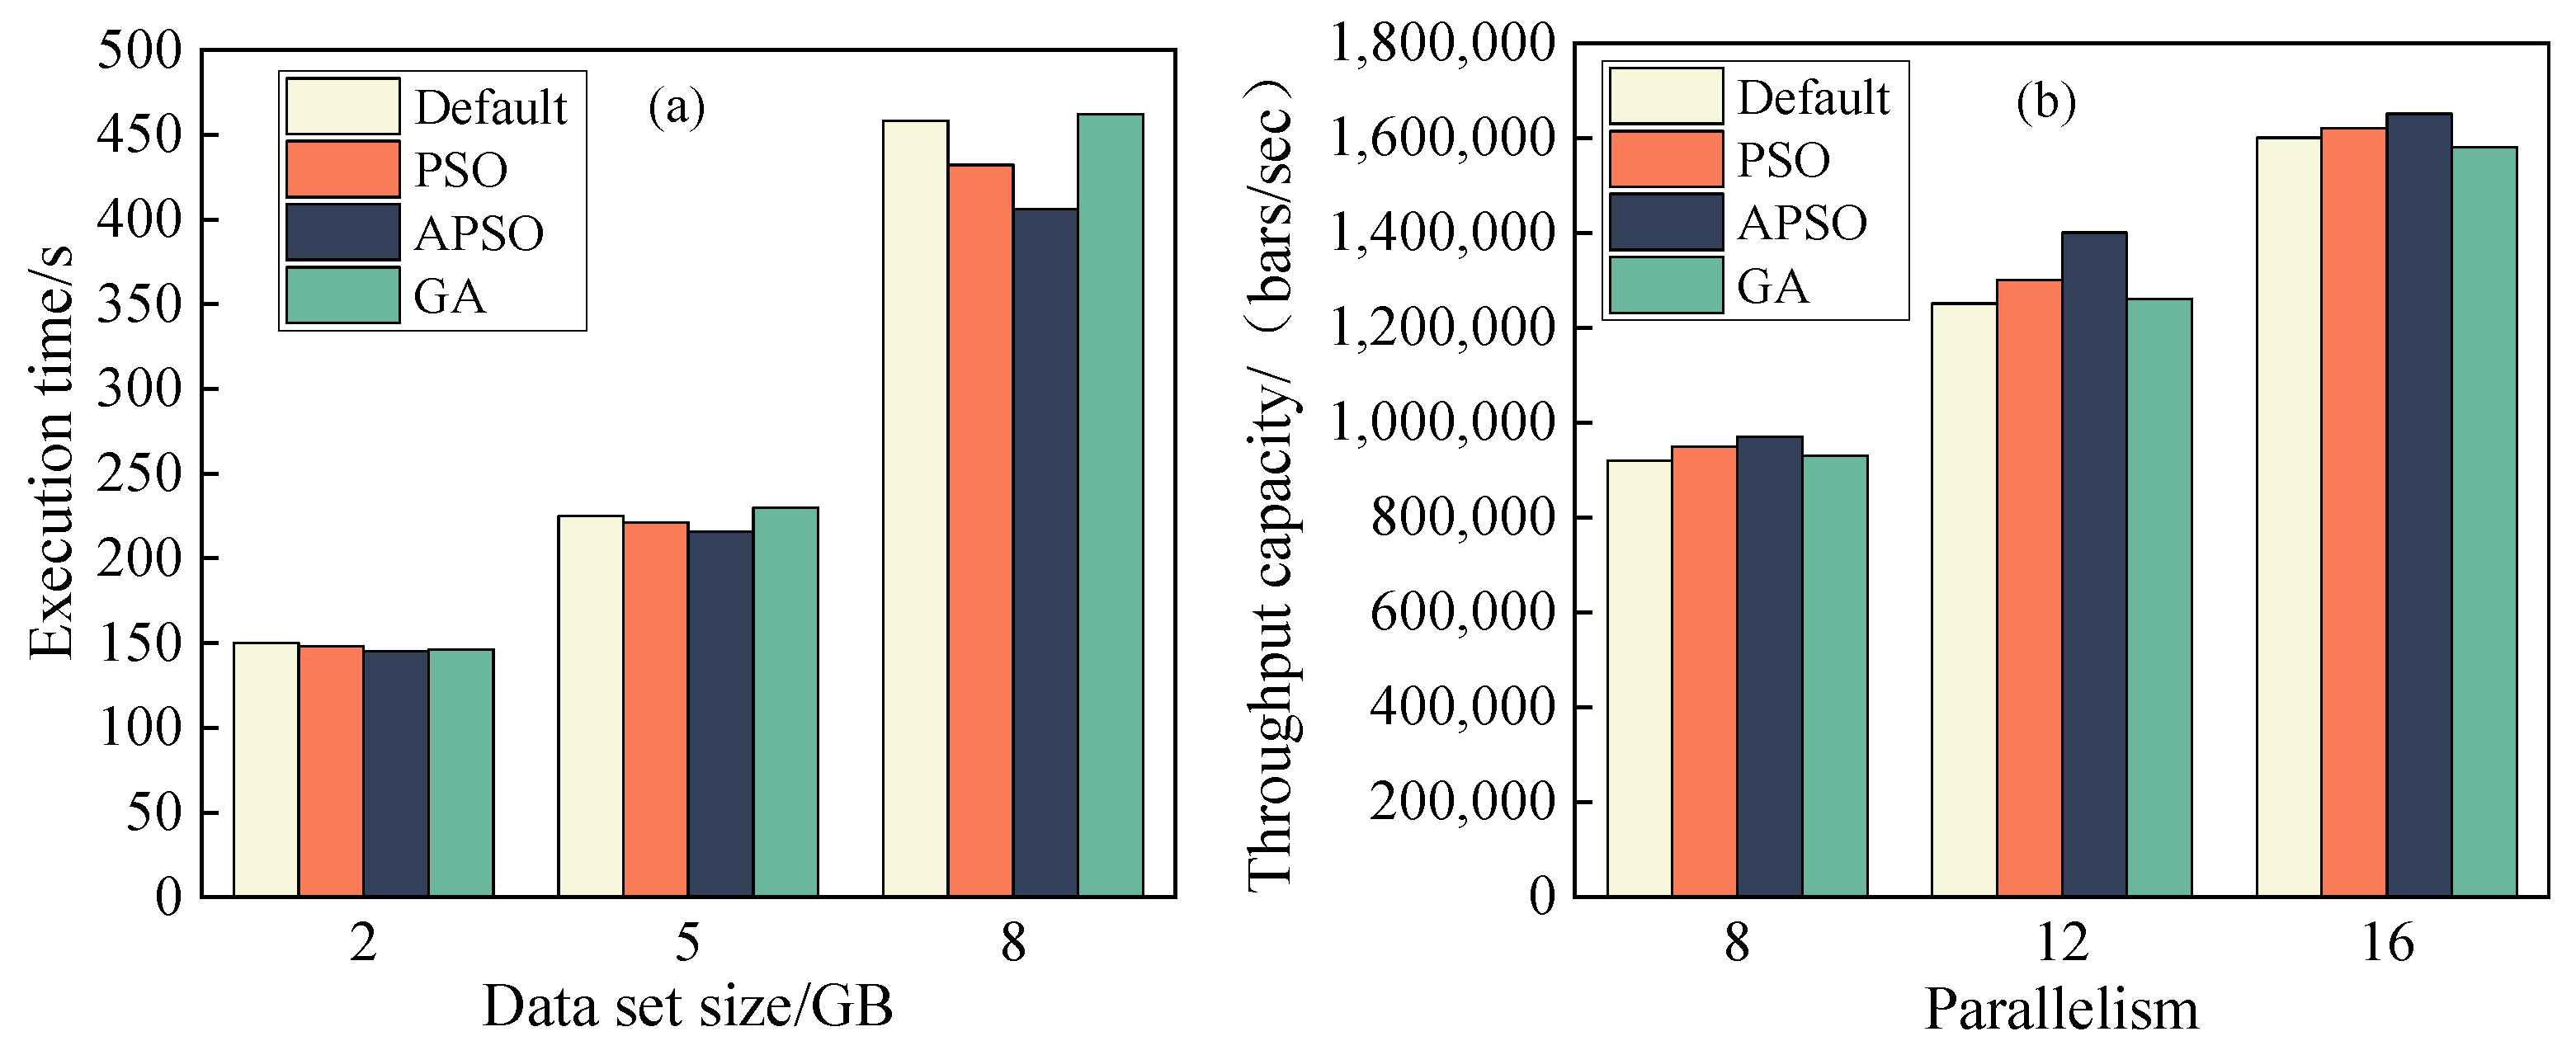
Evaluation of the APSO algorithm took place through experiments on real landslide monitoring data integration. The parameters of the APSO algorithm are set as follows: population size is n = 100, number of iterations is N = 1000, cognitive factors are c1 = c2 = 2, and ωmax = 0.7, ωmin = 0.3. Execution time refers to the total time required from task submission to completion. Figure 13a presents a comparison of the overall execution time among the default round-robin scheduling algorithm in Flink, the PSO algorithm, the APSO algorithm, and the Genetic Algorithm (GA). The experimental data are categorized into different data sizes: Data1, Data2, and Data3, representing 2 GB, 5 GB, and 8 GB, respectively, with a parallelism degree of 8. From the graph, it can be observed that both PSO and GA algorithms exhibit similar execution times, which outperform the default round-robin scheduling algorithm in Flink by approximately 2.8% in terms of efficiency improvement. Moreover, the execution time using the APSO algorithm is shorter compared to the default round-robin scheduling algorithm, basic PSO algorithm, and GA algorithm. Across multiple data sets, the average optimization efficiency of task execution time using the APSO algorithm is 4.7%. Throughput is commonly used to measure the performance and efficiency of systems, networks, or applications. Figure 13b shows the throughput comparison of the Flink default algorithm (Default), basic particle swarm optimization algorithm (PSO), genetic algorithm (GA), and improved particle swarm optimization algorithm (APSO) at different degrees of parallelism. From the graph, it can be observed that the GA algorithm and the Flink default algorithm have similar throughput when the degree of parallelism is 8 and 12. However, when the degree of parallelism is 18, the GA algorithm has slightly lower parallelism compared to the Flink default algorithm. Across the three degrees of parallelism, the basic PSO algorithm outperforms the Flink default algorithm, with an average optimization rate of 3.2% across multiple data sets. Conversely, the APSO algorithm achieves higher throughput compared to the Flink default algorithm, basic PSO algorithm, and GA algorithm. Overall, the APSO algorithm demonstrates the best optimization performance, with an average optimization efficiency of throughput of 5.4% across multiple data sets.
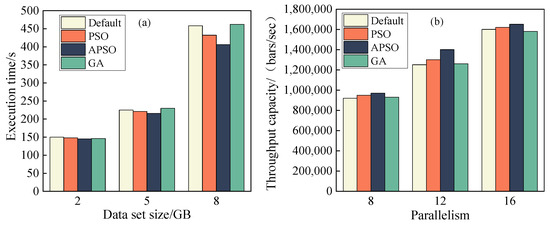
Figure 13.
Comparison of task execution time and system throughput for four algorithms. (a) Execution time. (b) Throughput capacity.
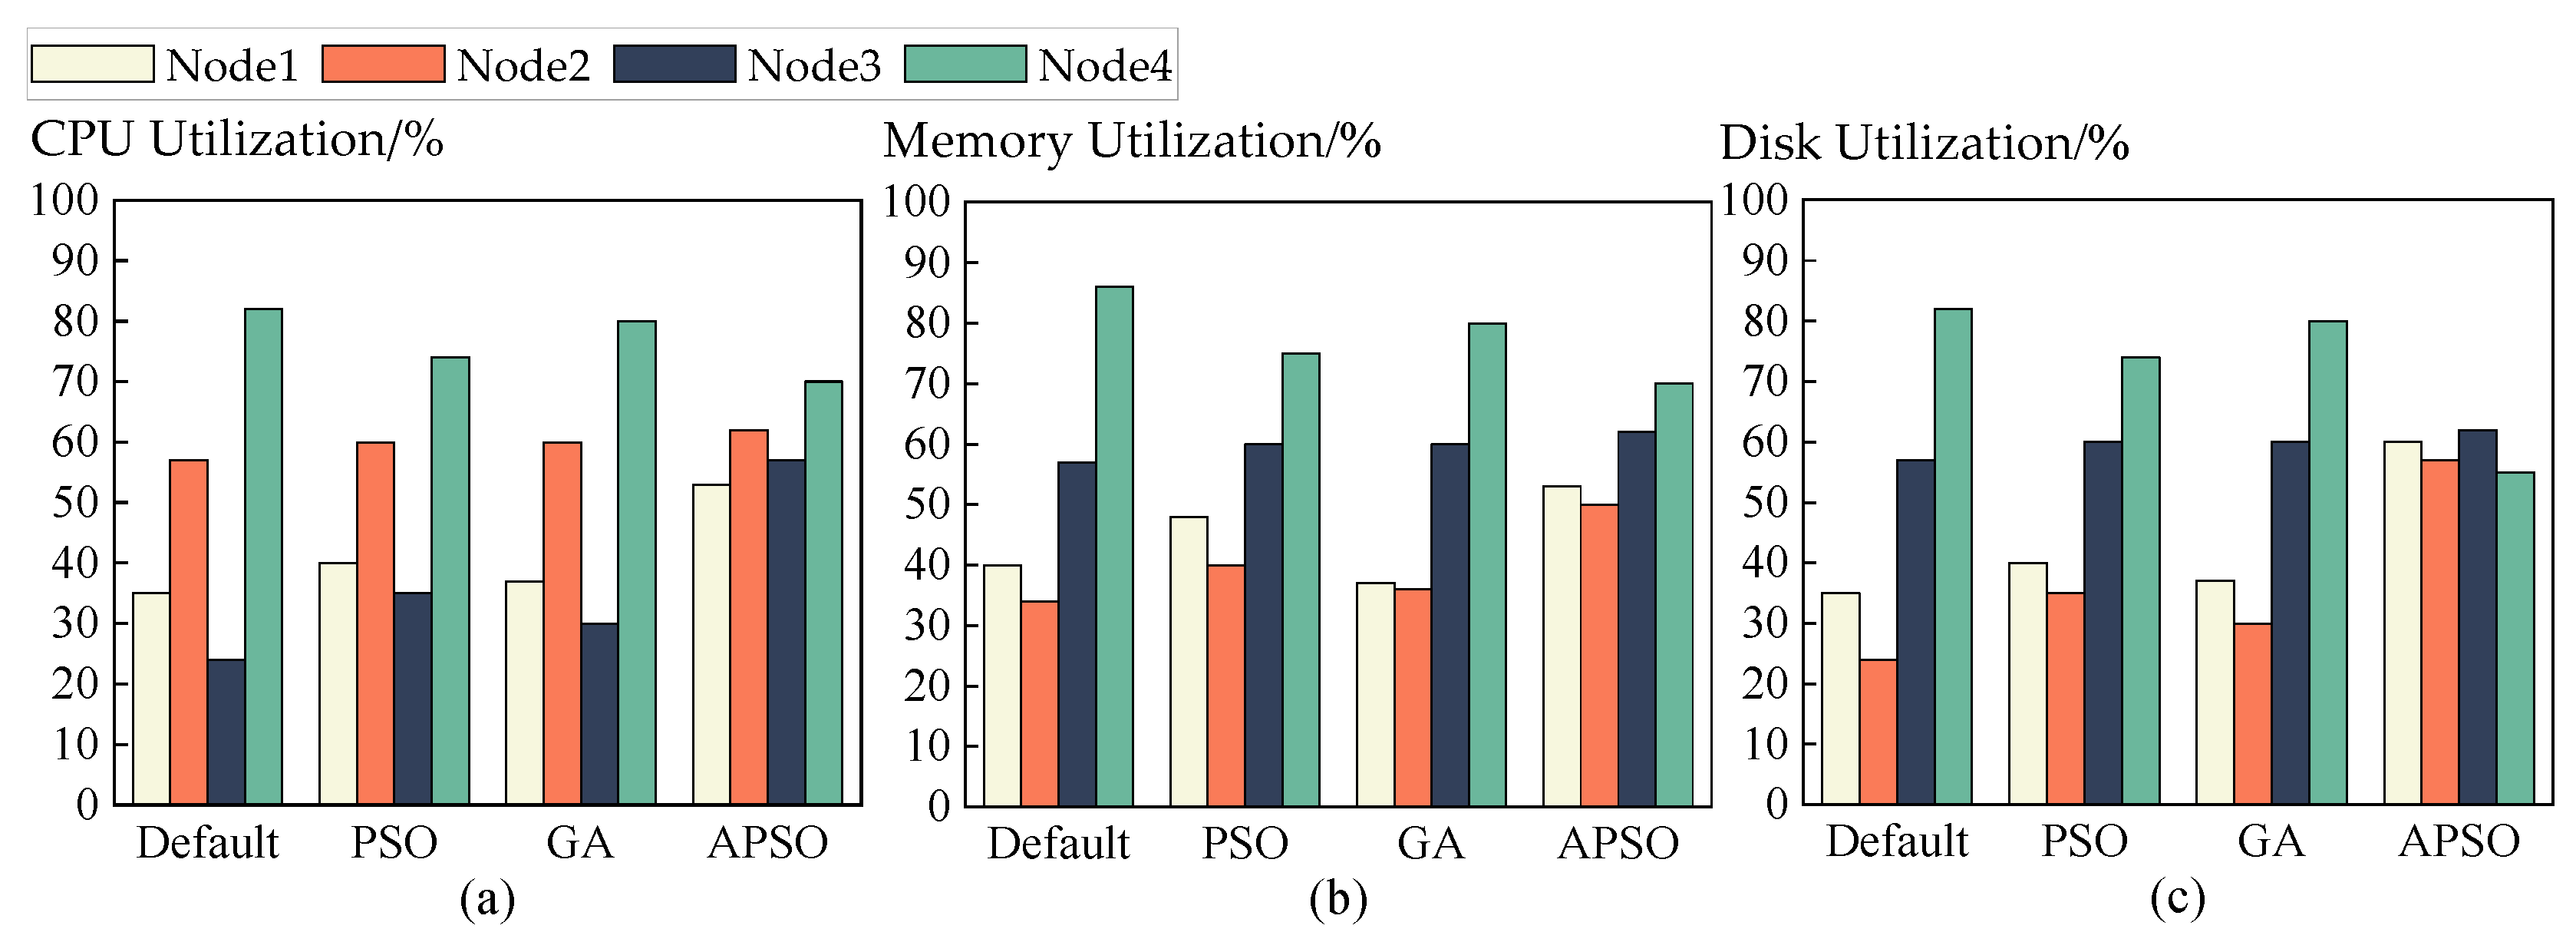
This study evaluates the load capacity of Flink cluster resource nodes through an APSO algorithm-based task scheduling approach, monitoring resources from three perspectives: CPU utilization, memory usage, and disk utilization. The experimental results are illustrated in Figure 14. The graph reveals that the default scheduling strategy employed by Flink exhibits significant load imbalances across resource nodes, failing to achieve equitable resource allocation for tasks. Notably, nodes 2 and 4 experience the highest CPU loads, exceeding the established threshold of 0.7, while nodes 3 and 4 demonstrate elevated memory and disk loads. The differences in resource loads among the GA algorithm, default scheduling algorithm, and PSO algorithm are not pronounced; however, the APSO algorithm shows some improvement relative to these methods despite persistent load disparities. When task scheduling is performed using the APSO algorithm, it is evident from the graph that all resource node loads remain below the threshold with minimized load discrepancies.
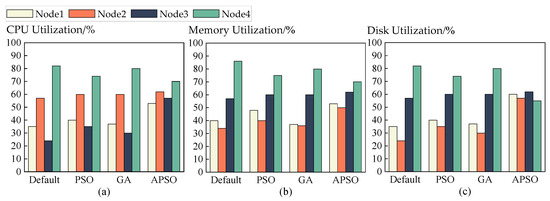
Figure 14.
A Comparative Analysis of Resource Utilization Rates Across Nodes. (a) CPU Utilization. (b) Memory Utilization. (c) Disk Utilization.
4. Discussion
The landslide multi-source data integration load balancing method based on Flink and APSO significantly enhances the speed and efficiency of data integration through real-time processing and task scheduling optimization, thereby establishing a solid foundation for the real-time collection and analysis of landslide data. In contrast to traditional data integration methods [43,44], the proposed approach not only optimizes resource utilization and reduces operational costs but also bolsters the system’s scalability and reliability, ensuring stable performance under high load and anomalous conditions. Among these approaches, the Middleware-based system stands out by providing a unified interface that simplifies the complexity of data access and integration. However, Federated Data Integration may involve the transmission and coordination of data among multiple data sources, which can impact query performance [45]. The data in a Data Warehouse are typically extracted and loaded in batches, leading to some data latency [46]. Additionally, the Middleware-based system offers functionalities, such as data transformation, cleansing, and processing, enabling the necessary transformations and manipulations to be performed during integration. It also exhibits flexibility and scalability, accommodating various data sources and formats. Flink, as a stream processing framework, falls under the category of Middleware-based data integration. It enables data from different sources to be processed and integrated in a streaming manner and provides powerful real-time computation and data processing capabilities. The approach proposed in this paper offers several advantages. It utilizes the streaming processing framework Flink and the APSO algorithm to optimize data processing and task scheduling, thereby improving the method’s adaptability to real-time data streams and processing requirements while providing enhanced load-balancing capabilities and enhanced processing efficiency. The integration of multi-source landslide data based on Flink effectively handles real-time streaming data.
Compared to the processing of large-scale data integration tasks on a single computer [47,48], the proposed method achieves the rapid aggregation and processing of data; this improves the efficiency and performance of integrating landslide monitoring data and reduces the time required to execute tasks. Compared to the integration method based on Flink’s default task scheduling, the landslide multi-source data integration method utilizing Flink and APSO achieves an average optimization efficiency of 4.7% in task execution time and 5.4% in throughput, thereby better meeting the real-time requirements for landslide data integration. Some guidelines for better data management, such as the establishment of a standard data model for rapid, efficient, and automated data integration, may be provided. In the module used for handling abnormal data, the least squares method is versatile and able to address the issue of missing data in landslide monitoring; this is because it can be flexibly applied to various data types and curve shapes. Compared to simple linear interpolation methods, the cubic spline interpolation method is better at preserving the shape and trend of the data. The LSTM model demonstrates more accurate cluster load prediction compared to the BP model. The LSTM model was used to predict node load conditions on datasets with time intervals of 5 s and 10 s. The prediction accuracy for the dataset with a 10-s interval decreased by 14.1% compared to the dataset with a 5-s interval. The APSO algorithm effectively balances the load of the data processing nodes, reduces the imbalance among tasks, and enhances the overall performance and throughput of the system.
The proposed method, however, exhibits certain limitations. Firstly, it entails a higher computational complexity due to the substantial computational resources and time required to undertake training and prediction with the LSTM model, potentially impeding real-time processing. Secondly, achieving optimal results necessitates the meticulous configuration of the parameters, as the performance and effectiveness of the APSO algorithm are contingent upon the parameter settings, which demand tuning and optimization.
5. Conclusions
This study aims to explore the techniques used to achieve the integration and load balancing of multi-source landslide monitoring data using Flink and an APSO algorithm. Based on the experimental analysis, it has been determined that using Flink as the framework for data processing and analysis effectively enables the real-time streaming processing requirements of multi-source landslide monitoring data to be handled. Compared to the default task scheduling algorithm in Flink, the APSO algorithm demonstrates significant advantages in cluster load balancing. By utilizing linearly decreasing inertia weights, the APSO algorithm achieves better load balancing among data processing nodes, thus reducing the imbalance between tasks; this improves the overall performance of the system and its throughput. The experimental results indicate that the integrated load balancing method employed for multi-source landslide monitoring data, based on Flink and APSO, outperforms traditional methods in terms of its load balancing capabilities and overall system performance. The average optimization efficiency of the task execution is 4.7%, and the average optimization efficiency of throughput is 5.4%. This implies that the system can better adapt to changes in data streams and provide higher processing efficiency and more balanced load distribution.
Despite the achievements of this study, several limitations remain. For instance, the methods for identifying anomalous data could be further improved, such as by employing cross-validation to more comprehensively detect anomalies and reduce the influence of randomness. Additionally, the performance of the proposed methods may be affected by the complexity of the integration tasks and the specific characteristics of the landslide data sources. Investigating the adaptability of these methods to real-time data integration scenarios could be a valuable direction for future research.
Due to the increasing scale of landslide data, scalability can be achieved via the application of horizontal scaling and parallel processing in order to meet the growing demands. The landslide multi-source data integration method based on Flink and APSO provides a solid foundation for landslide disaster research. Future studies can use technologies such as artificial intelligence from multiple aspects, including data fusion, data analysis, real-time monitoring and early warning systems, as well as interdisciplinary collaboration, with the aim of offering more scientific and effective support for the prevention and response to landslide disasters. Leveraging the real-time computing capabilities of Flink and the improved PSO algorithm, further advancements in data integration and load balancing can be made, thus facilitating predictive modeling and providing decision support for landslide disasters. This, in turn, will aid relevant departments in formulating effective response measures and emergency response strategies.
Author Contributions
Conceptualization, Zongmin Wang, Huangtaojun Liang and Haibo Yang; methodology, Zongmin Wang, Huangtaojun Liang and Haibo Yang; validation, Huangtaojun Liang; investigation, Zongmin Wang, Huangtaojun Liang, Haibo Yang and Mengyu Li; writing—original draft preparation, Zongmin Wang, Huangtaojun Liang; writing—review and editing, Zongmin Wang, Huangtaojun Liang, Haibo Yang, Mengyu Li and Yingchun Cai; supervision, Zongmin Wang and Haibo Yang; project administration, Haibo Yang; funding acquisition, Haibo Yang. All authors have read and agreed to the published version of the manuscript.
Funding
This research was supported by the National Key Research and Development Program of China (grant number 2022YFC3004402), the Henan provincial key research and development program (221111321100) and National Supercomputing Center in Zhengzhou.
Data Availability Statement
The authors do not have permission to share data.
Acknowledgments
We are grateful to the editors and anonymous reviewers for their thoughtful comments.
Conflicts of Interest
The authors declare no conflicts of interest.
References
- Ge, Y.F.; Zhai, G.F.; He, Z.Y.; Gao, J.Y. Research on Comprehensive Disaster Prevention and Reduction Plan from the Perspective of Resilience. J. Catastrophol. 2022, 37, 229–234. [Google Scholar] [CrossRef]
- Liu, H.L.; Ma, Y.B.; Zhang, W.G. Application of Big Data Techniques in Geological Disaster Analysis and Prevention: A Systematic Review. J. Disaster Prev. Mitig. Eng. 2021, 41, 710–722. [Google Scholar]
- Farzad, A.; Mohsen, K.; Abbas, R. Towards multi-agency sensor information integration for disaster management. Comput. Environ. Urban Syst. 2016, 56, 68–85. [Google Scholar]
- Zhong, C.; Li, H.; Xiang, W.; Su, A.J.; Huang, X.F. Comprehensive Study of Landslides Through the Integration of Multi Remote Sensing Techniques: Framework and Latest Advances. J. Earth Sci. 2012, 23, 243–252. [Google Scholar] [CrossRef]
- Chen, Z.; Song, J.; Yang, Y. An Approach to Measuring Semantic Relatedness of Geographic Terminologies Using a Thesaurus and Lexical Database Sources. ISPRS Int. J. Geo-Inf. 2018, 7, 98. [Google Scholar] [CrossRef]
- Zhang, W. Geological disaster monitoring and early warning system based on big data analysis. Arab. J. Geosci. 2020, 13, 110–117. [Google Scholar] [CrossRef]
- He, C.Y.; Ju, N.P.; Huang, J. Automatic Integration and Analysis of Multi-Source Monitoring Data for Geo-Hazard Warning. J. Eng. Geol. 2014, 13, 94–98. [Google Scholar] [CrossRef]
- Liu, L.; Deng, J.; Tang, Y. A Dynamic Management and Integration Framework for Models in Landslide Early Warning System. ISPRS Int. J. Geo-Inf. 2023, 12, 198. [Google Scholar] [CrossRef]
- Thirugnanam, H.; Uhlemann, S.; Reghunadh, R.; Ramesh, M.V.; Rangan, V.P. Review of Landslide Monitoring Techniques with IoT Integration Opportunities. IEEE J. Sel. Top. Appl. Earth Obs. Remote Sens. 2022, 15, 5317–5338. [Google Scholar] [CrossRef]
- Isah, H.; Abughofa, T.; Mahfuz, S.; Ajerla, D.; Zulkernine, F.; Khan, S. A Survey of Distributed Data Stream Processing Frameworks. IEEE Access 2019, 7, 154300–154316. [Google Scholar] [CrossRef]
- Puentes, F.; Perez-Godoy, M.D.; Gonzalez, P.; Del Jesus, M.J. An analysis of technological frameworks for data streams. Prog. Artif. Intell. 2020, 9, 239–261. [Google Scholar] [CrossRef]
- Lu, Y.H.; Li, G.Q.; Chen, Z.G. Research on Interoperability Models Between Scientific Data Centers. Front. Data Comput. 2022, 4, 69–83. [Google Scholar] [CrossRef]
- Santipantakis, G.M.; Glenis, A.; Patroumpas, K.; Vlachou, A.; Doulkeridis, C.; Vouros, G.A.; Pelekis, N.; Theodoridis, Y. SPARTAN: Semantic integration of big spatio-temporal data from streaming and archival sources. Future Gener. Comput. Syst.-Int. J. Escience 2018, 110, 540–555. [Google Scholar] [CrossRef]
- Mohamed, A.; Najafabadi, M.K.; Wah, Y.B.; Zaman, E.A.K.; Maskat, R. The state of the art and taxonomy of big data analytics: View from new big data framework. Artif. Intell. Rev. 2019, 53, 989–1037. [Google Scholar] [CrossRef]
- Jin, H.; Chen, F.; Wu, S.; Yao, Y.; Liu, Z.Y.; Gu, L.; Zhou, Y.L. Towards Low-Latency Batched Stream Processing by Pre-Scheduling. IEEE Trans. Parallel Distrib. Syst. 2019, 30, 1045–9219. [Google Scholar] [CrossRef]
- Wang, Y.J.; Wang, J.L.; Bu, K. Research on Disaster Data Management Technology and Platform Progress and the Demand it Faces. J. Catastrophol. 2019, 34, 205–210. [Google Scholar]
- Wu, Y.; Niu, R.; Wang, Y.; Chen, T. A Fast Deploying Monitoring and Real-Time Early Warning System for the Baige Landslide in Tibet, China. Sensors 2020, 20, 6619. [Google Scholar] [CrossRef] [PubMed]
- Yang, Z.; Wang, L.; Qiao, J.; Taro, U.; Wang, L. Application and verification of a multivariate real-time early warning method for rainfall-induced landslides: Implication for evolution of landslide-generated debris flows. Landslides 2020, 17, 2409–2419. [Google Scholar] [CrossRef]
- Du, Y.; Xu, X.; He, X. Optimizing Geo-Hazard Response: LBE-YOLO’s Innovative Lightweight Framework for Enhanced Real-Time Landslide Detection and Risk Mitigation. Remote Sens. 2024, 16, 534. [Google Scholar] [CrossRef]
- Jin, B.; Song, W.; Zhao, K.; Wei, X.; Hu, F.; Jiang, Y. A High Performance, Spatiotemporal Statistical Analysis System Based on a Spatiotemporal Cloud Platform. ISPRS Int. J. Geo-Inf. 2017, 6, 165. [Google Scholar] [CrossRef]
- He, Z.W.; Liu, G.; Ma, X.G.; Chen, Q.Y. GeoBeam: A distributed computing framework for spatial data. Comput. Geosci. 2019, 131, 15–22. [Google Scholar] [CrossRef]
- Huang, W.; Meng, L.; Zhang, D.; Zhang, W. In-Memory Parallel Processing of Massive Remotely Sensed Data Using an Apache Spark on Hadoop YARN Model. IEEE J. Sel. Top. Appl. Earth Obs. Remote Sens. 2017, 10, 3–19. [Google Scholar] [CrossRef]
- Li, W.J.; Shi, L.; Luo, Y.P.; Luo, Y.P. Research and implementation of a Flink-oriented load balancing task scheduling algorithm. Comput. Eng. Sci. 2022, 44, 1141–1151. [Google Scholar]
- Li, H.J.; Xia, J.L.; Luo, W.; Fang, H. Cost-Efficient Scheduling of Streaming Applications in Apache Flink on Cloud. IEEE Trans. Big Data 2023, 9, 1086–1101. [Google Scholar] [CrossRef]
- Dai, Q.L.; Qin, G.J.; Li, J.W.; Zhao, J. A resource occupancy ratio-oriented load balancing task scheduling mechanism for Flink. J. Intell. Fuzzy Syst. 2023, 44, 2703–2713. [Google Scholar] [CrossRef]
- Chen, M.J.; Ouyang, Z.X.; Fan, G.S. Extraction Method of Landslide Comprehensive Monitoring Information Based on Data Fusion. J. Geod. Geodyn. 2007, 27, 77–81. [Google Scholar]
- Chae, B.G.; Park, H.J.; Catani, F.; Simoni, A.; Berti, M. Landslide prediction, monitoring and early warning: A concise review of state-of-the-art. Geosci. J. 2017, 21, 1033–1070. [Google Scholar] [CrossRef]
- Auflič, M.J.; Herrera, G.; Mateos, R.M.; Poyiadji, E.; Quental, L.; Severine, B.; Peternel, T.; Podolszki, L.; Calcaterra, S.; Kociu, A.; et al. Landslide monitoring techniques in the Geological Surveys of Europe. Landslides 2023, 20, 951–965. [Google Scholar] [CrossRef]
- Li, W.; Wang, S.; Chen, X.; Tian, Y.; Gu, Z.; Lopez-Carr, A.; Schroeder, A.; Currier, K.; Schildhauer, M.; Zhu, R. GeoGraphVis: A Knowledge Graph and Geovisualization Empowered Cyberinfrastructure to Support Disaster Response and Humanitarian Aid. ISPRS Int. J. Geo-Inf. 2023, 12, 112. [Google Scholar] [CrossRef]
- Liu, J.; Tang, H.M.; Li, Q.; Su, A.J.; Liu, Q.H.; Zhong, C. Multi-sensor fusion of data for monitoring of Huangtupo landslide in the three Gorges Reservoir (China). Geomat. Nat. Hazards Risk 2018, 9, 881–891. [Google Scholar] [CrossRef]
- Travelletti, J.; Malet, J.-P. Characterization of the 3D geometry of flow-like landslides: A methodology based on the integration of heterogeneous multi-source data. Eng. Geol. 2012, 128, 30–48. [Google Scholar] [CrossRef]
- Liu, K.N.; Tian, Y.Z.; Shen, J.W.; Hu, X.H. Research on Recognition and Auto-correction of Elevation Errors for Contours at the Edge of Map Sheets Based on Hierarchical Grid Index. Geogr. Geo-Inf. Sci. 2021, 37, 6–11. [Google Scholar]
- Standard ISO 8601-1:2019; Date and Time—Representations for Information Interchange—Part 1: Basic Rules. International Organization for Standardization: Geneva, Switzerland, 2019. Available online: https://www.iso.org/standard/70907.html (accessed on 28 December 2024).
- Fadlallah, H.; Kilany, R.; Dhayne, H. BIGQA: Declarative Big Data Quality Assessment. ACM J. Data Inf. Qual. 2023, 15, 1–30. [Google Scholar] [CrossRef]
- Aljawarneh, S.; Lara, J.A. Editorial: Special Issue on Quality Assessment and Management in Big Data—Part I. ACM J. Data Inf. Qual. 2021, 13, 1–3. [Google Scholar] [CrossRef]
- Parker, J.D.; Mirel, L.B.; Lee, P. Evaluating data quality for blended data using a data quality framework. Stat. J. IAOS 2024, 40, 125–136. [Google Scholar] [CrossRef] [PubMed]
- Xu, W. Flink Introduction and Practice; People’s Post and Telecommunications Press: Nanjing, China, 2019; pp. 27–35. [Google Scholar]
- Ji, H.; Wu, G.; Zhao, Y.; Wang, S.; Wang, G.; Yuan, G.Y. joinTree: A novel join-oriented multivariate operator for spatio-temporal data management in Flink. Geoinformatica 2023, 27, 107–132. [Google Scholar] [CrossRef]
- Zhang, G.; Li, X.; Wang, X.; Zhang, Z.; Hu, G.; Li, Y.; Zhang, R. Research on the Prediction Problem of Satellite Mission Schedulability Based on Bi-LSTM Model. Aerospace 2022, 9, 676. [Google Scholar] [CrossRef]
- Ebadifard, F.; Babamir, S.M. A PSO-based task scheduling algorithm improved using a load-balancing technique for the cloud computing environment. Concurr. Comput. Pract. Exp. 2017, 30, 155–166. [Google Scholar] [CrossRef]
- Alsaidy, S.A.; Abbood, A.D.; Sahib, M.A. Heuristic initialization of PSO task scheduling algorithm in cloud computing. J. King Saud Univ.—Comput. Inf. Sci. 2022, 34, 2370–2382. [Google Scholar] [CrossRef]
- Zhang, M.; Peng, Y.; Yang, M.; Yin, Q.J.; Xie, X. A discrete PSO-based static load balancing algorithm for distributed simulations in a cloud environment. Future Gener. Comput. Syst. 2021, 115, 497–516. [Google Scholar]
- Tian, C.Z.; Li, G.Q. A Framework for the Data Integration of Earthquake Events. IEEE Access 2019, 7, 172628–172637. [Google Scholar] [CrossRef]
- Zhang, J.Q.; Wu, C.L.; Fan, J.Q. The Research of Landslide Monitoring Data Integration Framework Based on Three-Dimensional WebGIS. Appl. Mech. Mater. 2014, 694, 436–441. [Google Scholar] [CrossRef]
- Butenuth, M.; Gösseln, G.V.; Tiedge, M.; Heipke, C.; Lipeck, U.; Sester, M. Integration of heterogeneous geospatial data in a federated database. ISPRS J. Photogramm. Remote Sens. 2007, 62, 328–346. [Google Scholar] [CrossRef]
- Kern, R.; Kozierkiewicz, A.; Pietranik, M. The data richness estimation framework for federated data warehouse integration. Inf. Sci. 2020, 513, 397–411. [Google Scholar] [CrossRef]
- Liu, C.; Shao, X.H.; Li, W.Y. Multi-sensor observation fusion scheme based on 3D variational assimilation for landslide monitoring. Geomat. Nat. Hazards Risk 2019, 10, 151–167. [Google Scholar] [CrossRef]
- Franceschini, R.; Rosi, A.; Soldato, M.D.; Catani, F.; Casagli, N. Integrating multiple information sources for landslide hazard assessment: The case of Italy. Sci. Rep. 2022, 12, 20724. [Google Scholar] [CrossRef] [PubMed]
Disclaimer/Publisher’s Note: The statements, opinions and data contained in all publications are solely those of the individual author(s) and contributor(s) and not of MDPI and/or the editor(s). MDPI and/or the editor(s) disclaim responsibility for any injury to people or property resulting from any ideas, methods, instructions or products referred to in the content. |
© 2024 by the authors. Published by MDPI on behalf of the International Society for Photogrammetry and Remote Sensing. Licensee MDPI, Basel, Switzerland. This article is an open access article distributed under the terms and conditions of the Creative Commons Attribution (CC BY) license (https://creativecommons.org/licenses/by/4.0/).

