Article

Mapping the Dream: Designing Optimal E-Bike Routes in Valparaíso, Chile, Using a Multicriteria Analysis and an Experimental Study

by
Vicente Aprigliano
1,2,*,
Catalina Toro
1,
Gonzalo Rojas
1,
Iván Bastías
3,
Marcus Cardoso
4,
Tálita Santos
5,
Marcelino Aurélio Vieira da Silva
4,
Emilio Bustos
1,
Ualison Rébula de Oliveira
6 and
Sebastian Seriani
1
1
Escuela de Ingeniería de Construcción y Transporte, Pontificia Universidad Católica de Valparaíso, Avda Brasil 2147, Valparaíso 2362804, Chile
2
Centro de Acción Climática, Pontificia Universidad Católica de Valparaíso, Avda Brasil 2147, Valparaíso 2362804, Chile
3
Instituto de Geografía, Pontificia Universidad Católica de Valparaíso, Valparaíso 2362807, Chile
4
Transport Engineering Program, Federal University of Rio de Janeiro, Av. Horácio Macedo 2030, Rio de Janeiro 21941-914, RJ, Brazil
5
Center for Sustainable Development, University of Brasília, Brasília 70910-900, DF, Brazil
6
Departamento de Administração e Administração Pública de Volta Redonda, Universidade Federal Fluminense (UFF)/MPA-ICHS, MSG-TCE and DSG-TCE, 783 Des. Ellis H. Figueira St Volta Redonda, Rio de Janeiro 27213-145, RJ, Brazil
*
Author to whom correspondence should be addressed.
ISPRS Int. J. Geo-Inf. 2025, 14(1), 38; https://doi.org/10.3390/ijgi14010038
Submission received: 9 December 2024 / Revised: 13 January 2025 / Accepted: 15 January 2025 / Published: 20 January 2025

Abstract

:
The city of Valparaíso, Chile, faces significant mobility challenges due to its steep slopes, complex urban infrastructure, and socioeconomic conditions. In this direction, this study explores the potential promotion of E-bike uses by identifying the optimal routes that connect metro stations to strategic hilltop streets in the city. A hybrid methodology combining a multicriteria GIS-based analysis and an experimental study was used to evaluate potential routes and the possibility of increasing the power limitations for non-motorized mobility in Chile. Fifteen routes were assessed based on criteria including the slope, traffic safety, directionality, intersections, and travel distance. The results indicate that routes such as Cumming from Puerto and Bellavista stand out as the most viable for e-bike use given their favorable characteristics. The experimental study revealed that higher-powered E-bikes (500 W and 750 W) would be more able to overcome the steep slopes of Valparaíso, with an average speed of 5.36 km/h and 9.52 km/h on routes with a 10.88% average slope. These findings challenge the current regulatory limit of 250 W for non-motorized vehicles in Chile, highlighting the potential benefits of increasing their power limits to enhance sustainable mobility in the hilly urban contexts of this country. This study highlights the need to adapt urban mobility policies to the unique topographical conditions of each city. Future research should build upon more experimental studies, develop specific street-scale analyses using audit methods, incorporate climate-related variables, and evaluate the economic viability of e-bike infrastructure. Addressing these aspects could position Valparaíso as a leading example of sustainable urban mobility for cities facing comparable challenges.

1. Introduction

Great challenges lie ahead for cities around the world in integrating electric mobility (e-mobility), especially non-motorized solutions, into their urban dynamics. Some reasons for this relate to the higher speed of these modes, the lack of license requirements, and the constructive norms for cycleways, which are usually related to mechanic or regular bicycles’ limitations. In this manner, studies developed by Niemann et al. [1] and Uluk et al. [2] evidence the growing accidents in urban environments involving e-mobility devices, also known as Electric Personal Mobility Devices (ePMDs).
Another important issue is that there is discussion in different countries about the power limits for non-motorized vehicles that do not require a specific driving license. In Germany and the Netherlands, for example, the law allows the use of E-bikes with motors of up to 250 watts and a maximum speed of 25 km/h without a specific driving license [3,4]. In the United States of America (USA), most states do not require a driving license for E-bikes with motors that do not exceed 750 watts and with a maximum speed of 45 km/h considering that they are pedal-assisted [5]. In some parts of Canada, for example, British Columbia, they allow the use of E-bikes with a maximum motor power of 500 watts that reaches up to 32 km/h without a driving license [6]. In Brazil, the maximum motor power and speed should not exceed 350 watts and 25 km/h [7].
In Chile, the regulation allows one to use an E-bike with a motor power of up to 250 watts with a maximum speed of 25 km/h without the need for a driving license. In this regard, it is important to understand that these E-bike characteristics generate limiting conditions that justify the implementation of road signs related to bicycle or E-bike use or specific cycleways in certain areas. For example, defining bicycle paths (whether shared with other modes or physically separated) is allowed and justified in sections with a maximum longitudinal slope of 6% [8]. In the city of Valparaíso, Chile, the normative slope criterion is a key barrier to the development of cycle-inclusive projects, although there is evidence of cyclists in regular and electric modes riding within the city and its surroundings [9,10].
As a starting point, it is important to understand the urban context of Valparaíso. As shown in Figure 1, most of the streets on the hills of this city, where approximately 94% of the population resides [11], present an average slope higher than 6%. Specifically, in Valparaíso, 57.29% of streets, representing 25.65 km2, have slopes higher than 6%. The plain part of the city is the central business district, where most jobs are concentrated, and is mostly dedicated to commerce, education, health, and other services.
In addition, it is a city with a complex urban infrastructure in the hills, with narrow streets, inadequate maintenance of the streets and sidewalks, inadequate use of public spaces, damaged street signs, and other problems. For example, in Figure 2a,b, it is possible to observe the use of both sides of the street for parking, which is not allowed and reduces mobility space significantly, while Figure 2c shows the extensive use of the street for parking and a pothole on the street.
Concerning the mobility context in Valparaíso, Fernandes and Tirado [12] indicate that the higher income of the population relates negatively to sustainable mobility patterns. Complementary to this, Aprigliano et al. [13] conclude that accessibility to work via public and private transportation is related to sociodemographic factors, such as household size, education, age, gender, and income. On the other hand, accessibility to leisure activities using all modes in Valparaíso is mostly influenced by urban factors, such as the street design, level of mixed land use, street safety, and distance to public transport stops and stations [13]. Interestingly, for both accessibility purposes mentioned, besides the previously noted influencing factors, the slope of the streets presented negative effects on non-motorized mobility [13]. Therefore, considering the complex urban structure of the city, which complicates the implementation of large-scale public transportation systems, and the socioeconomic inequality of the city, which limits citizens’ equitable access to opportunities [12], Valparaíso requires improvements to non-motorized mobility solutions, such as the promotion of E-bikes and other similar ePMDs, which occupy less space and may reduce the accessibility gap in the city.
In this direction, this study aims to propose potential E-bike routes in the city of Valparaíso through a combination of multicriteria and spatial analyses, as well as experimental studies involving E-bikes on slopes similar to those found in the city’s hills. Inspired by Aprigliano et al. [14], which identified built environment factors that influence metro ridership in Valparaíso, this study will analyze options for routes that connect metro stations to strategic streets and sectors on the hills of the city. An improved connectivity for E-bike users from the hills to the metro stations in Valparaíso would strengthen the accessibility to opportunities in neighboring cities. For the multicriteria analysis, the factors evaluated were topography, road safety, rider comfort, travel time, and potential cycling infrastructure. In addition, an analytic hierarchy process (AHP) was implemented, considering experts’ perspectives to weigh the factors for the potential E-bike route analysis. As a complement, this research developed a preliminary experimental study with E-bikes that had different power characteristics to evaluate users’ experience riding in steep slope conditions. More details can be found in the Materials and Methods section.
Proposing potential routes for e-bikes in the city of Valparaíso through multicriteria and spatial analyses is directly aligned with the United Nations Sustainable Development Goals (SDGs) [15]. Within the SDG 13 context concerning climate action, E-bikes, recognized as a sustainable means of transport, can play a significant role in reducing carbon emissions, contributing to climate change mitigation, and promoting responsible environmental practices [16,17]. Furthermore, by providing savings in transport costs, e-bikes favor economic sustainability, a determining factor for their increasing adoption, which aligns with the global objectives of promoting affordable and clean energy related to SDG 7 [17,18]. In this way, this study positions itself as a relevant contribution to the sustainable development agenda, encouraging sustainable and economically viable urban mobility, a concern of SDG 11 (Sustainable Cities and Communities). In addition, Chile has sought to promote the shared and safe use of streets through new laws, such as the incorporation norms in the national traffic law in 2018, related to the coexistence of different modes of transportation in the streets [19].
Besides its introduction, this paper is divided into five sections: a literature review focusing on identifying, from other studies, methods and variables for the definition of potential regular and electric bicycle routes; the Materials and Methods section, which describes the research process, variables, and analytical methods; a section dedicated to a descriptive analysis of the variables; the Results section, focusing on the analytical methods; and finally, the section on our conclusions and final considerations.

2. The Literature Review

2.1. Why Are Bicycles and E-Bikes Important?

The promotion of active mobility, with an emphasis on the use of bicycles, has been consolidated as an indispensable solution to the challenges faced by contemporary cities [20,21]. The benefits generated by policies that encourage the use of bicycles are mainly related to sustainability and improved urban quality of life [22,23]. Among the current cycling modalities, electric bicycles can greatly improve the accessibility to urban areas, reducing limitations related to age, physical condition, and certain disabilities [24]. This improvement in accessibility generates an increase in the number of daily bicycle users, promoting urban cohesion and sustainability [25].
The implementation of cycling networks that connect public transport stations and other urban attraction hubs not only optimizes the efficiency of transport systems but also makes it possible to reduce greenhouse gas emissions [24]. However, the benefits of using bicycles go beyond those arising from their integration with public transport systems. According to Brand et al. [26], the transition from car use to cycling can reduce daily CO₂ emissions, contributing to climate change mitigation and improving public health.
However, implementing infrastructure dedicated to the use of bicycles still faces barriers in many cities around the world. In large cities, the use of bicycles is often challenging due to their fragmented cycling infrastructure and/or complex terrain topology [27]. Furthermore, although the introduction of electric bicycles (E-bikes) in the context of urban mobility has proven to be an essential component of reducing the dependence on motorized vehicles [28], in many cities, public agents still tend to favor cars over cycling, which highlights the urgency of giving greater visibility to public policies and increasing investments in initiatives that promote the use of bicycles [29,30,31].

2.2. A Review of the Methods and Variables in Bicycle Route Planning

To maximize the benefits arising from the use of e-bikes, it is essential for cycling routes to be adequately planned, which requires consideration of multiple criteria, such as travel time, comfort, tranquility, and acceptable slope conditions [27,32,33]. In this sense, according to Lopez-Escolano et al. [34], effective urban planning and management are essential to overcome these challenges and fully integrate bicycles into the urban environment based on information-gathering. As Maltese et al. [35] state, a strategy to promote active mobility that includes citizen engagement, land use planning, and data collection is essential. After all, understanding the real needs of cyclists makes it possible to improve cycling infrastructure and adapt route planning to the actual behavior of users [36]. In this sense, based on revealed preference research, studies have shown that cyclists tend to prefer routes with dedicated infrastructure, such as segregated cycle paths, in addition to avoiding routes with heavy traffic or many intersections [37,38].
In the search for the optimization of cycling planning processes, the use of multicriteria tools to identify the best routes is essential so that they can be established according to the different preferences of cyclists [32]. In addition, advanced technologies, such as the use of GPS devices, smartphone applications, and the use of artificial neural networks, are increasingly being used in route planning for e-bikes. These technologies allow for the collection of detailed data on the behavior and real preferences of cyclists, enabling the development of more efficient and safe cycling infrastructure [36,39]. In this sense, even the incorporation of weather information can optimize the use of e-bikes further by recommending the ideal departure times to avoid adverse conditions and maximizing the energy savings of the equipment [28,40].
As demonstrated in the literature, the planning and implementation of cycle paths in urban environments have been explored using different methodological approaches in various parts of the world. In a study applied in the city of Taipei in Taiwan, Hsu and Lin [21] proposed the integration of multicriteria assessments with geographic information systems (GISs) for the planning of cycle networks in urban areas. From the perspective of cyclists, the authors developed a model for assessing the adequacy of streets, considering criteria such as traffic volume, lane width, and pavement quality. The model demonstrated effectiveness in identifying roads that needed improvements to become safer for cyclists.
In the same context of planning a cycling network, Milakis et al. [41], in a study carried out in the metropolitan region of Athens, Greece, sought to identify the ideal locations for its implementation. This study, whose objective was to create a network that simultaneously maximized connectivity and safety and minimized the negative impacts of bicycle traffic on motorized traffic, was based on a participatory multicriteria analysis integrated with a GIS, considering the perspectives of various stakeholders, such as cyclists and transport experts. Through the resulting methodological approach, it was possible to generate a network that was satisfactorily accepted by the local community, which highlighted the importance of public participation in urban planning.
In a study conducted in Cape Town, South Africa, Beukes et al. [42] proposed an alternative method of road infrastructure planning that promoted more livable neighborhoods and a more inclusive transportation network. Using a Spatial Multicriteria Assessment (SMCE) integrated into a geographic information system (GIS), this study sought to balance the needs of different transportation modes, including private vehicles and public transportation, as well as pedestrians and cyclists, with the contextual characteristics along the routes studied. This study demonstrated the potential of context-sensitive urban planning as a tool to improve the quality of life in cities, respecting the social, economic, environmental, and cultural aspects of the surroundings, promoting safety and mobility, and also integrating active transportation modes, such as cycling, into areas with diverse needs and characteristics.
In a case study applied in the city of Dublin, Ireland, Tal et al. [28] presented an innovative solution for planning electric bicycle routes that considered weather conditions to maximize the energy efficiency and improve the cyclist experience. To validate the proposal, the authors conducted a survey with 20 cyclists, which revealed that most of the participants were significantly affected by adverse weather conditions, thus demonstrating interest in the solution proposed by said study. This study highlights the importance of considering environmental factors in planning electric bicycle routes.
In Spain, Jiménez and Calatrava [43] studied the creation of a network of cycle paths that would facilitate daily commuting between the campuses of the Technical University and within the city of Cartagena, where the university is located. This study explored favorable geographical characteristics, such as mild climate and flat terrain, to promote the use of bicycles, reducing motorized traffic and CO₂ emissions. A multicriteria analysis of different cycle network projects developed based on a mobility survey with the academic community was carried out, considering factors such as the route characteristics, traffic segregation, accessibility, safety, and cost, resulting in the selection of the most suitable proposal for implementation.
In the city of Sparta, Turkey, Saplıoğlu and Aydın [38] combined the AHP method with GIS tools to identify cycling routes that would optimize cyclist safety. This study considered accident-prone areas and the presence of roadside parking as key variables, highlighting the need for segregated cycle paths to protect cyclists from car traffic. The authors also highlighted that cycling infrastructure should prioritize safety through adequate signage and regular maintenance, factors that are especially important in complex and dynamic urban contexts.
In Canada, Grisé and El-Geneidy [44] explored social equity in cycle path planning. In a study conducted in Quebec City and using a GIS-based prioritization index, the authors identified areas where the construction of new cycle paths could benefit socially disadvantaged groups by improving accessibility to active transportation. This approach highlights the importance of considering social equity as a central variable in urban planning, ensuring that all social groups have equal access to mobility opportunities.
In the town of Imotski, Croatia, Derek and Sikora [32] used a GIS-supported multicriteria analysis to plan cycling routes. They incorporated variables such as road type, slope, and proximity to emergency services, concluding that the integration of these variables would allow for the development of routes that balance safety, convenience, and leisure. This model is especially useful for e-bikes, where battery consumption management is critical, and routes with lower slopes and better road quality are preferable.
In suburban areas of Austria and in the city of San Francisco, USA, Perger and Auer [40] proposed a route planning system specifically designed for electric vehicles which took into account energy efficiency, travel time, and battery longevity, with special attention to the topography of the routes. The main objective of this study was to develop a multi-objective optimization algorithm that would allow users to prioritize variables such as energy consumption, travel time, weather conditions, and battery wear. The results showed that topography significantly influences energy consumption, especially for electric vehicles, where energy regeneration when going downhill can contribute to the overall efficiency. This approach is particularly relevant in cities with hilly terrain, where the slope of the roads can be a significant barrier to the use of bicycles, even electric ones.
In a study conducted in the city of Kaunas, Lithuania, Zagorskas and Turskis [45] developed a universal method for prioritizing the construction and renovation of cycling segments, using a hybrid multicriteria decision-making model (MCDM) integrated with a geographic information system (GIS). The criteria, divided into four main groups (utility, safety, convenience, and comfort), were developed based on surveys with local experts and cyclists and were weighted according to their importance. The analysis, visualized through a GIS, revealed that comfort and safety were the most influential criteria in determining the priorities. The authors concluded that the proposed method improved the efficiency in allocating resources for cycling infrastructure and offered a practical and adaptable solution for different urban contexts.
In Oslo, Norway, De Jong et al. [37] contributed an analysis based on GPS data that examined cyclists’ route choices. Their study revealed that factors such as the presence of segregated cycling infrastructure and flat topography are determinants of the route definition and that cyclists tend to prefer safer and more pleasant routes, even if this means covering longer distances. This study reinforces the idea that safety and comfort are central variables that should be considered when planning cycling networks that encourage continued bicycle use.
In Portugal, based on an assessment of 1704 road segments in the city of Coimbra, Pais et al. [23] developed a multicriteria methodology for planning the maintenance of cycling infrastructure. Using the Electre Tri technique, these segments were classified into different performance categories based on criteria such as comfort, safety, lane width, and lighting and subdivided into specific subcriteria. The analysis revealed that safety was the most critical criterion, especially due to the lack of adequate separation between motorized traffic and cyclists. This methodology proved to be effective for planning maintenance interventions, allowing the authorities to prioritize the most critical segments for improvements.
Also in Portugal, Santos et al. [46] developed a decision-support tool to assess the suitability of urban road infrastructure for bicycle use, particularly in cities with hilly terrain. In a study applied in the city of Covilhã, the proposed assessment model was based on three main criteria, which were population density, proximity to main trip generation points, and road network characteristics. These criteria were combined using a weighted linear method within an MCDA approach, with the weights defined by a panel of urban mobility experts. This study identified that 23% of Covilhã’s road network is suitable for the use of conventional bicycles, while 34% is suitable for e-bikes, with e-bikes demonstrating greater potential to overcome the city’s topographical challenges. This study concluded that the methodological approach developed proved to be effective in assessing the suitability of urban road infrastructure for bicycle use, especially in cities with challenging topographical characteristics.
Overall, the reviewed studies show that integrating cycle paths with other modes of transport, taking into account local variables such as the topography and climate, and using advanced tools such as GISs and multicriteria analyses are essential to the success of urban cycle networks. Public participation and consideration of social equity are also very important aspects, as highlighted in studies such as those by Grisé and El-Geneidy [44] and Milakis and Athanasopoulos [47]. These studies suggest that creating well-planned cycle routes not only improves the efficiency of the transport system but also promotes public health, reduces carbon emissions, and improves the quality of life in cities.
As discussed previously, in order to fully realize the benefits associated with the use of electric or conventional bicycles, it is necessary for the planning of cycle routes to be carried out with a certain degree of rigor, which requires the analysis and careful consideration of several criteria. In Table 1, 13 essential factors that need to be observed when planning and implementing a cycle network are presented in light of the literature examined.
Active mobility should therefore not be seen as just a current trend but rather as an essential component of the sustainable development of cities. Ongoing research in the field of cycling planning, especially in the context of multimodal integration and adaptation to the local conditions, will continue to play a relevant role in transforming cities into more livable and resilient spaces.

3. Materials and Methods

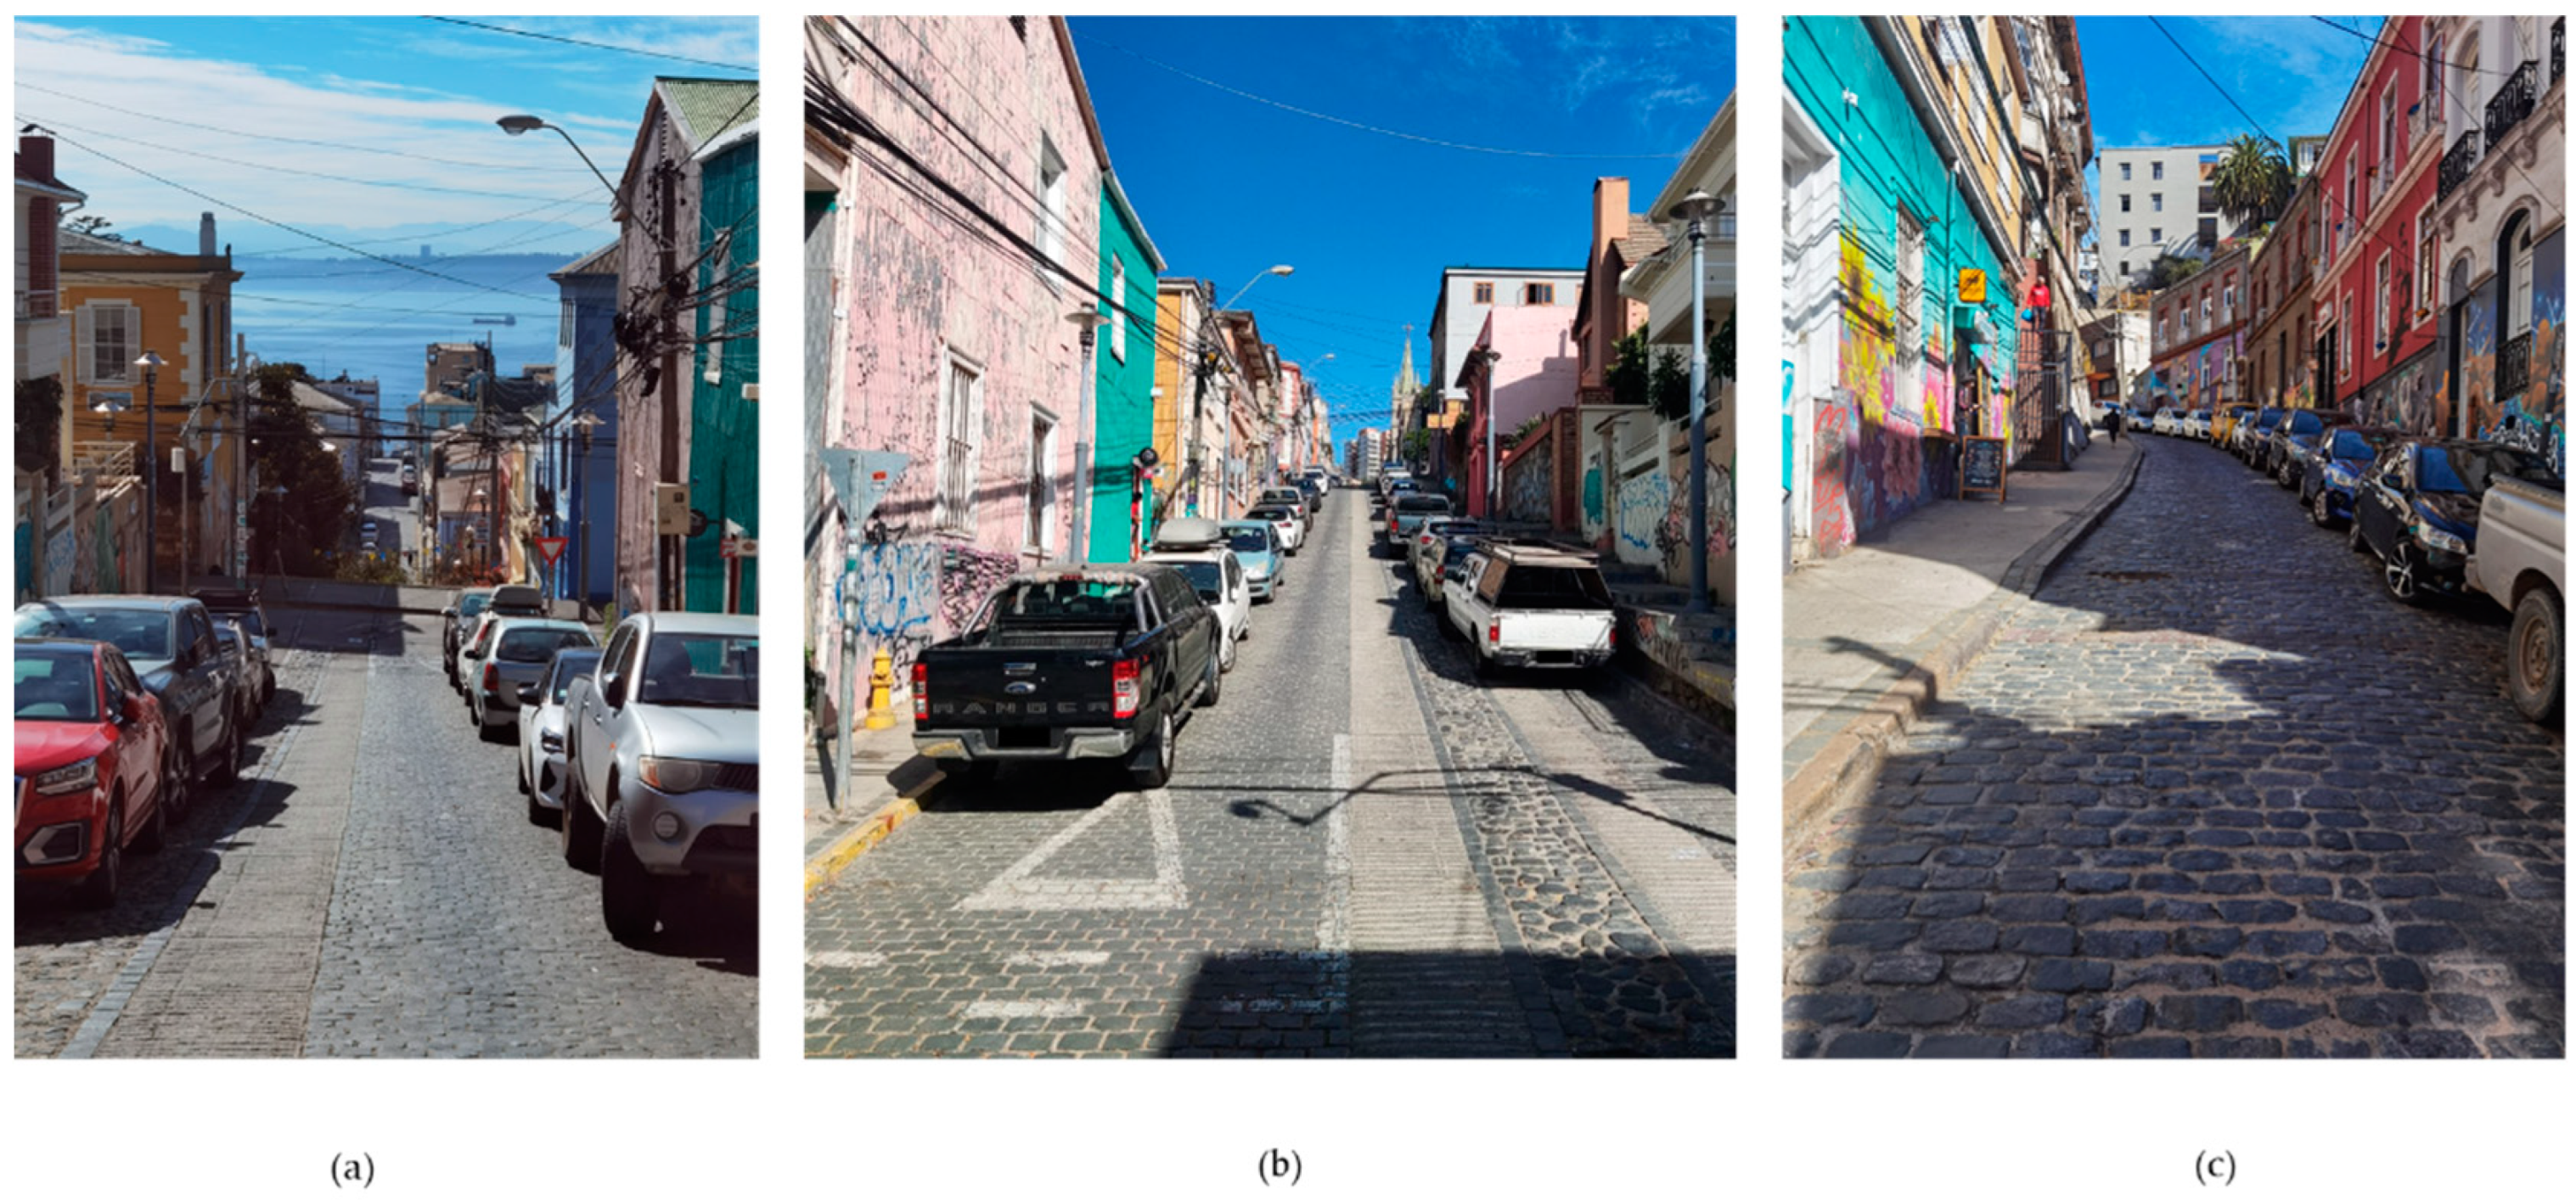
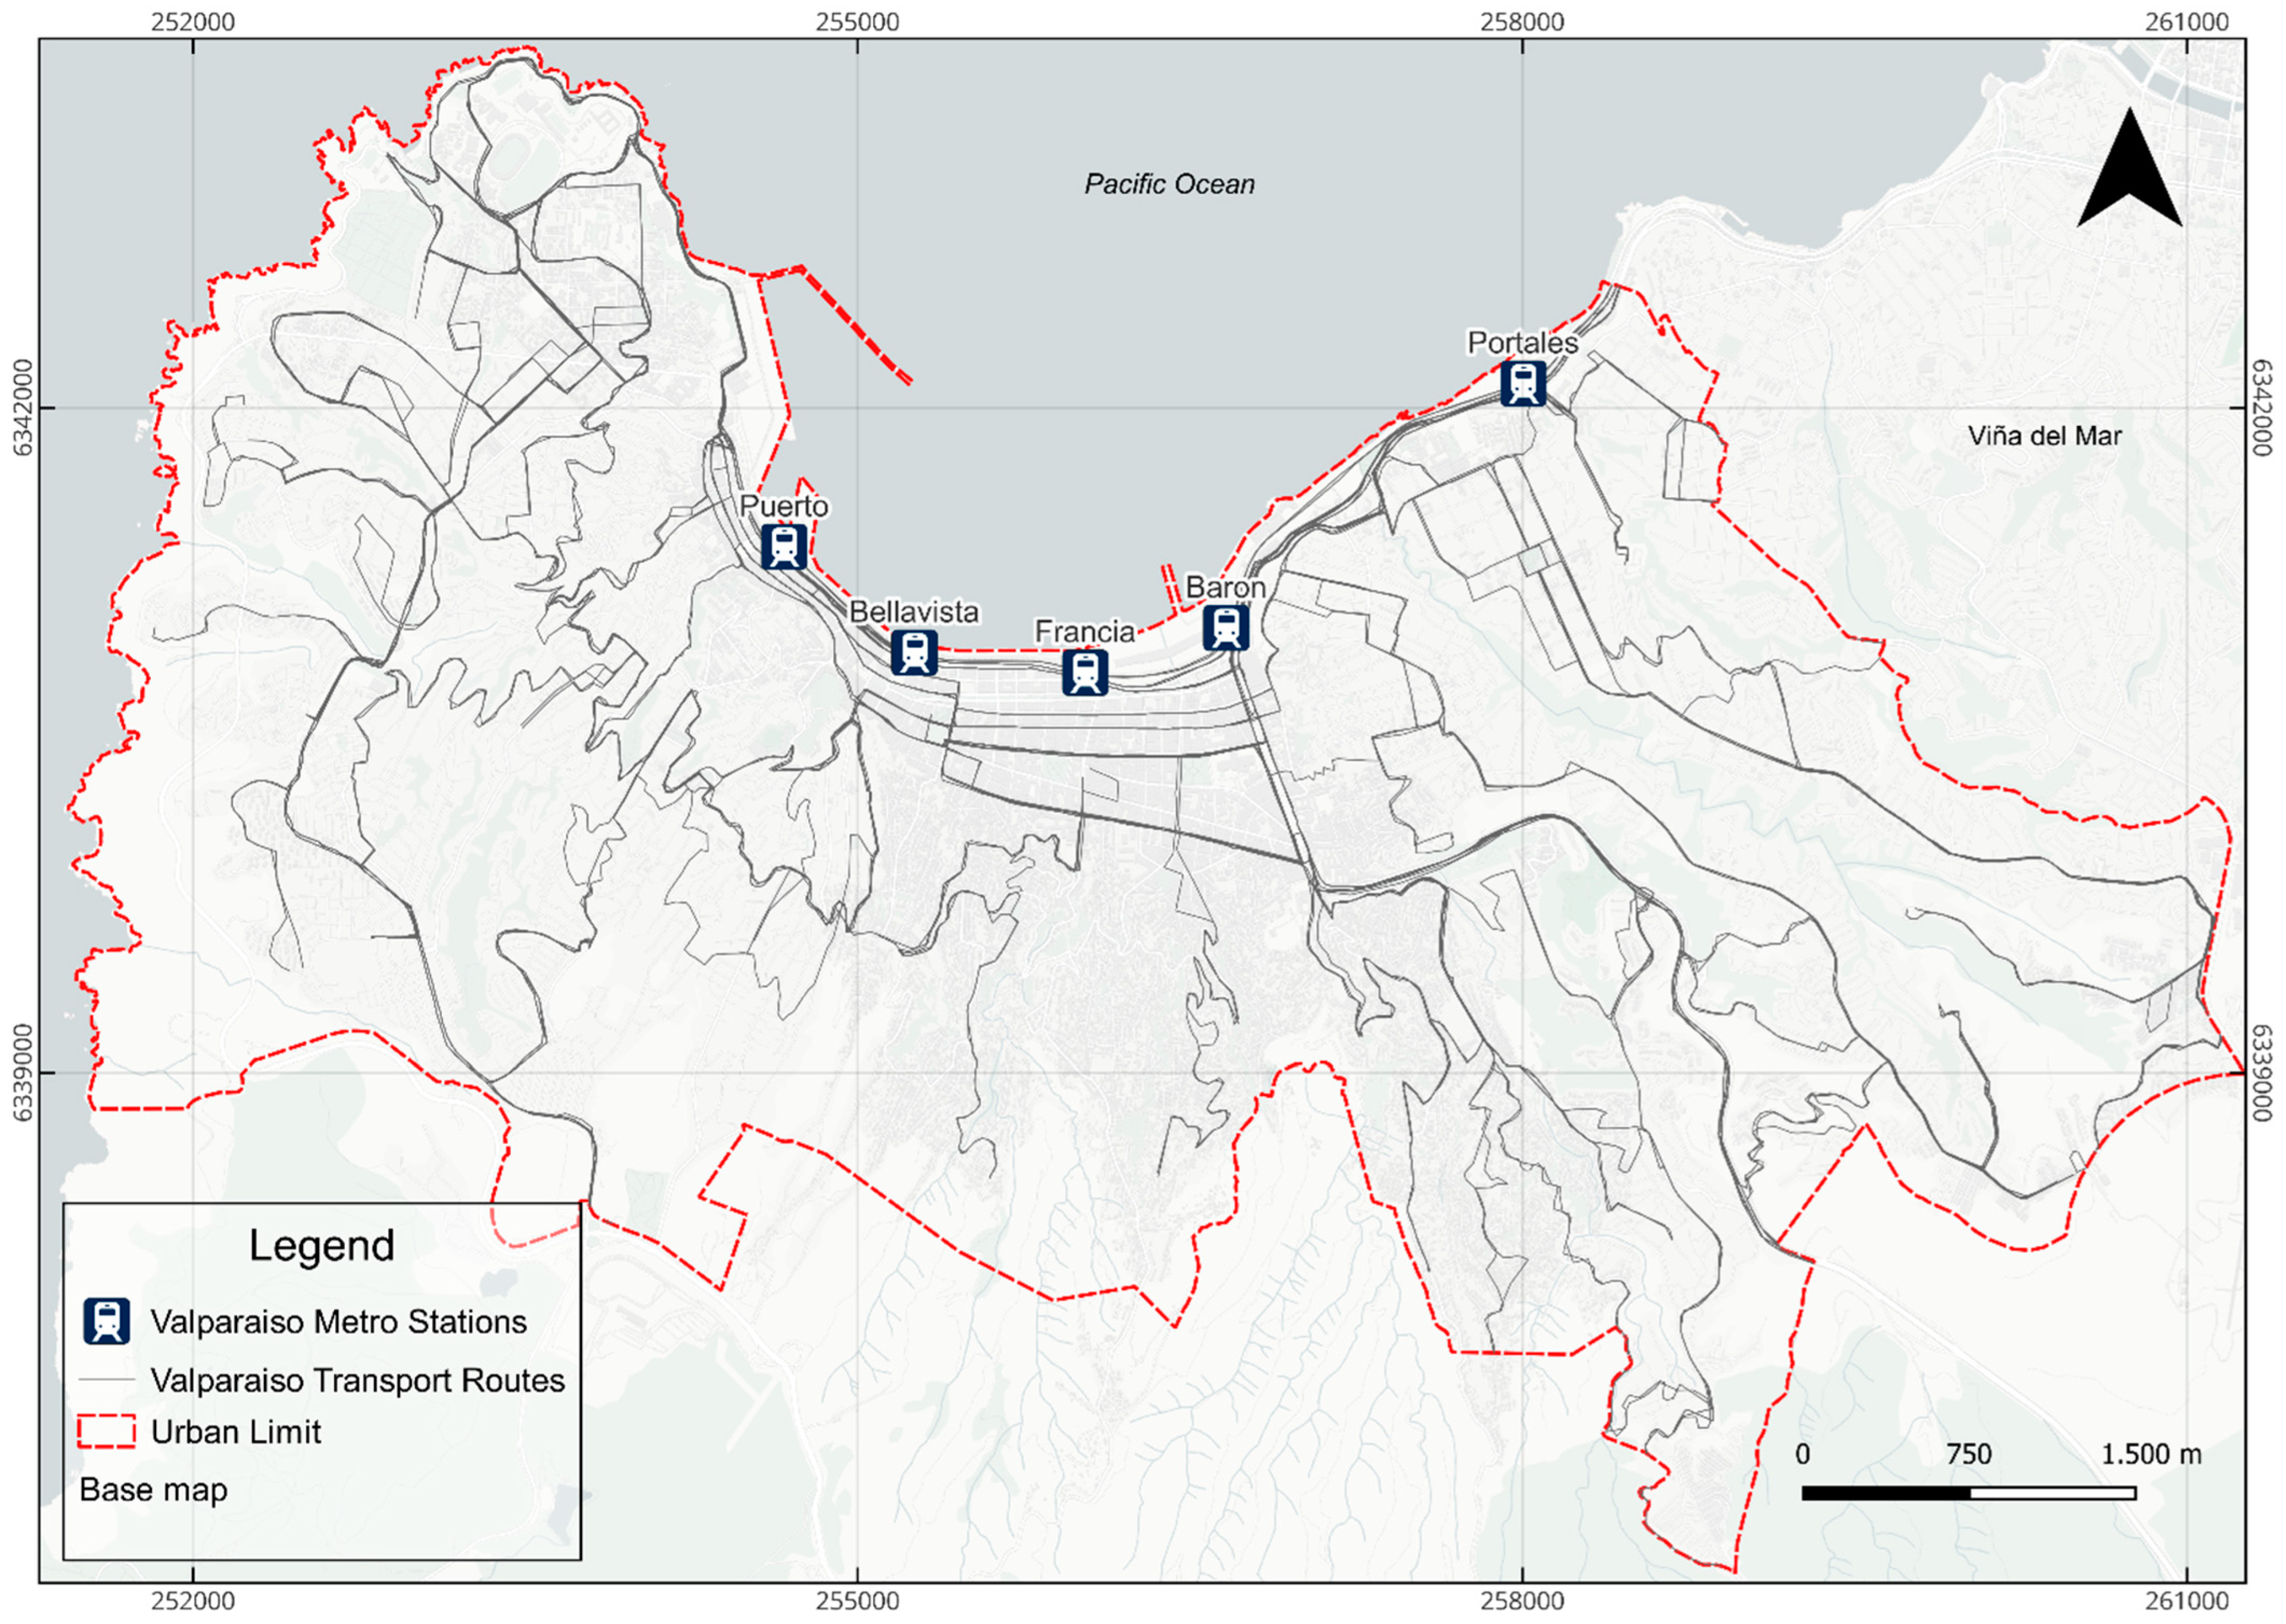
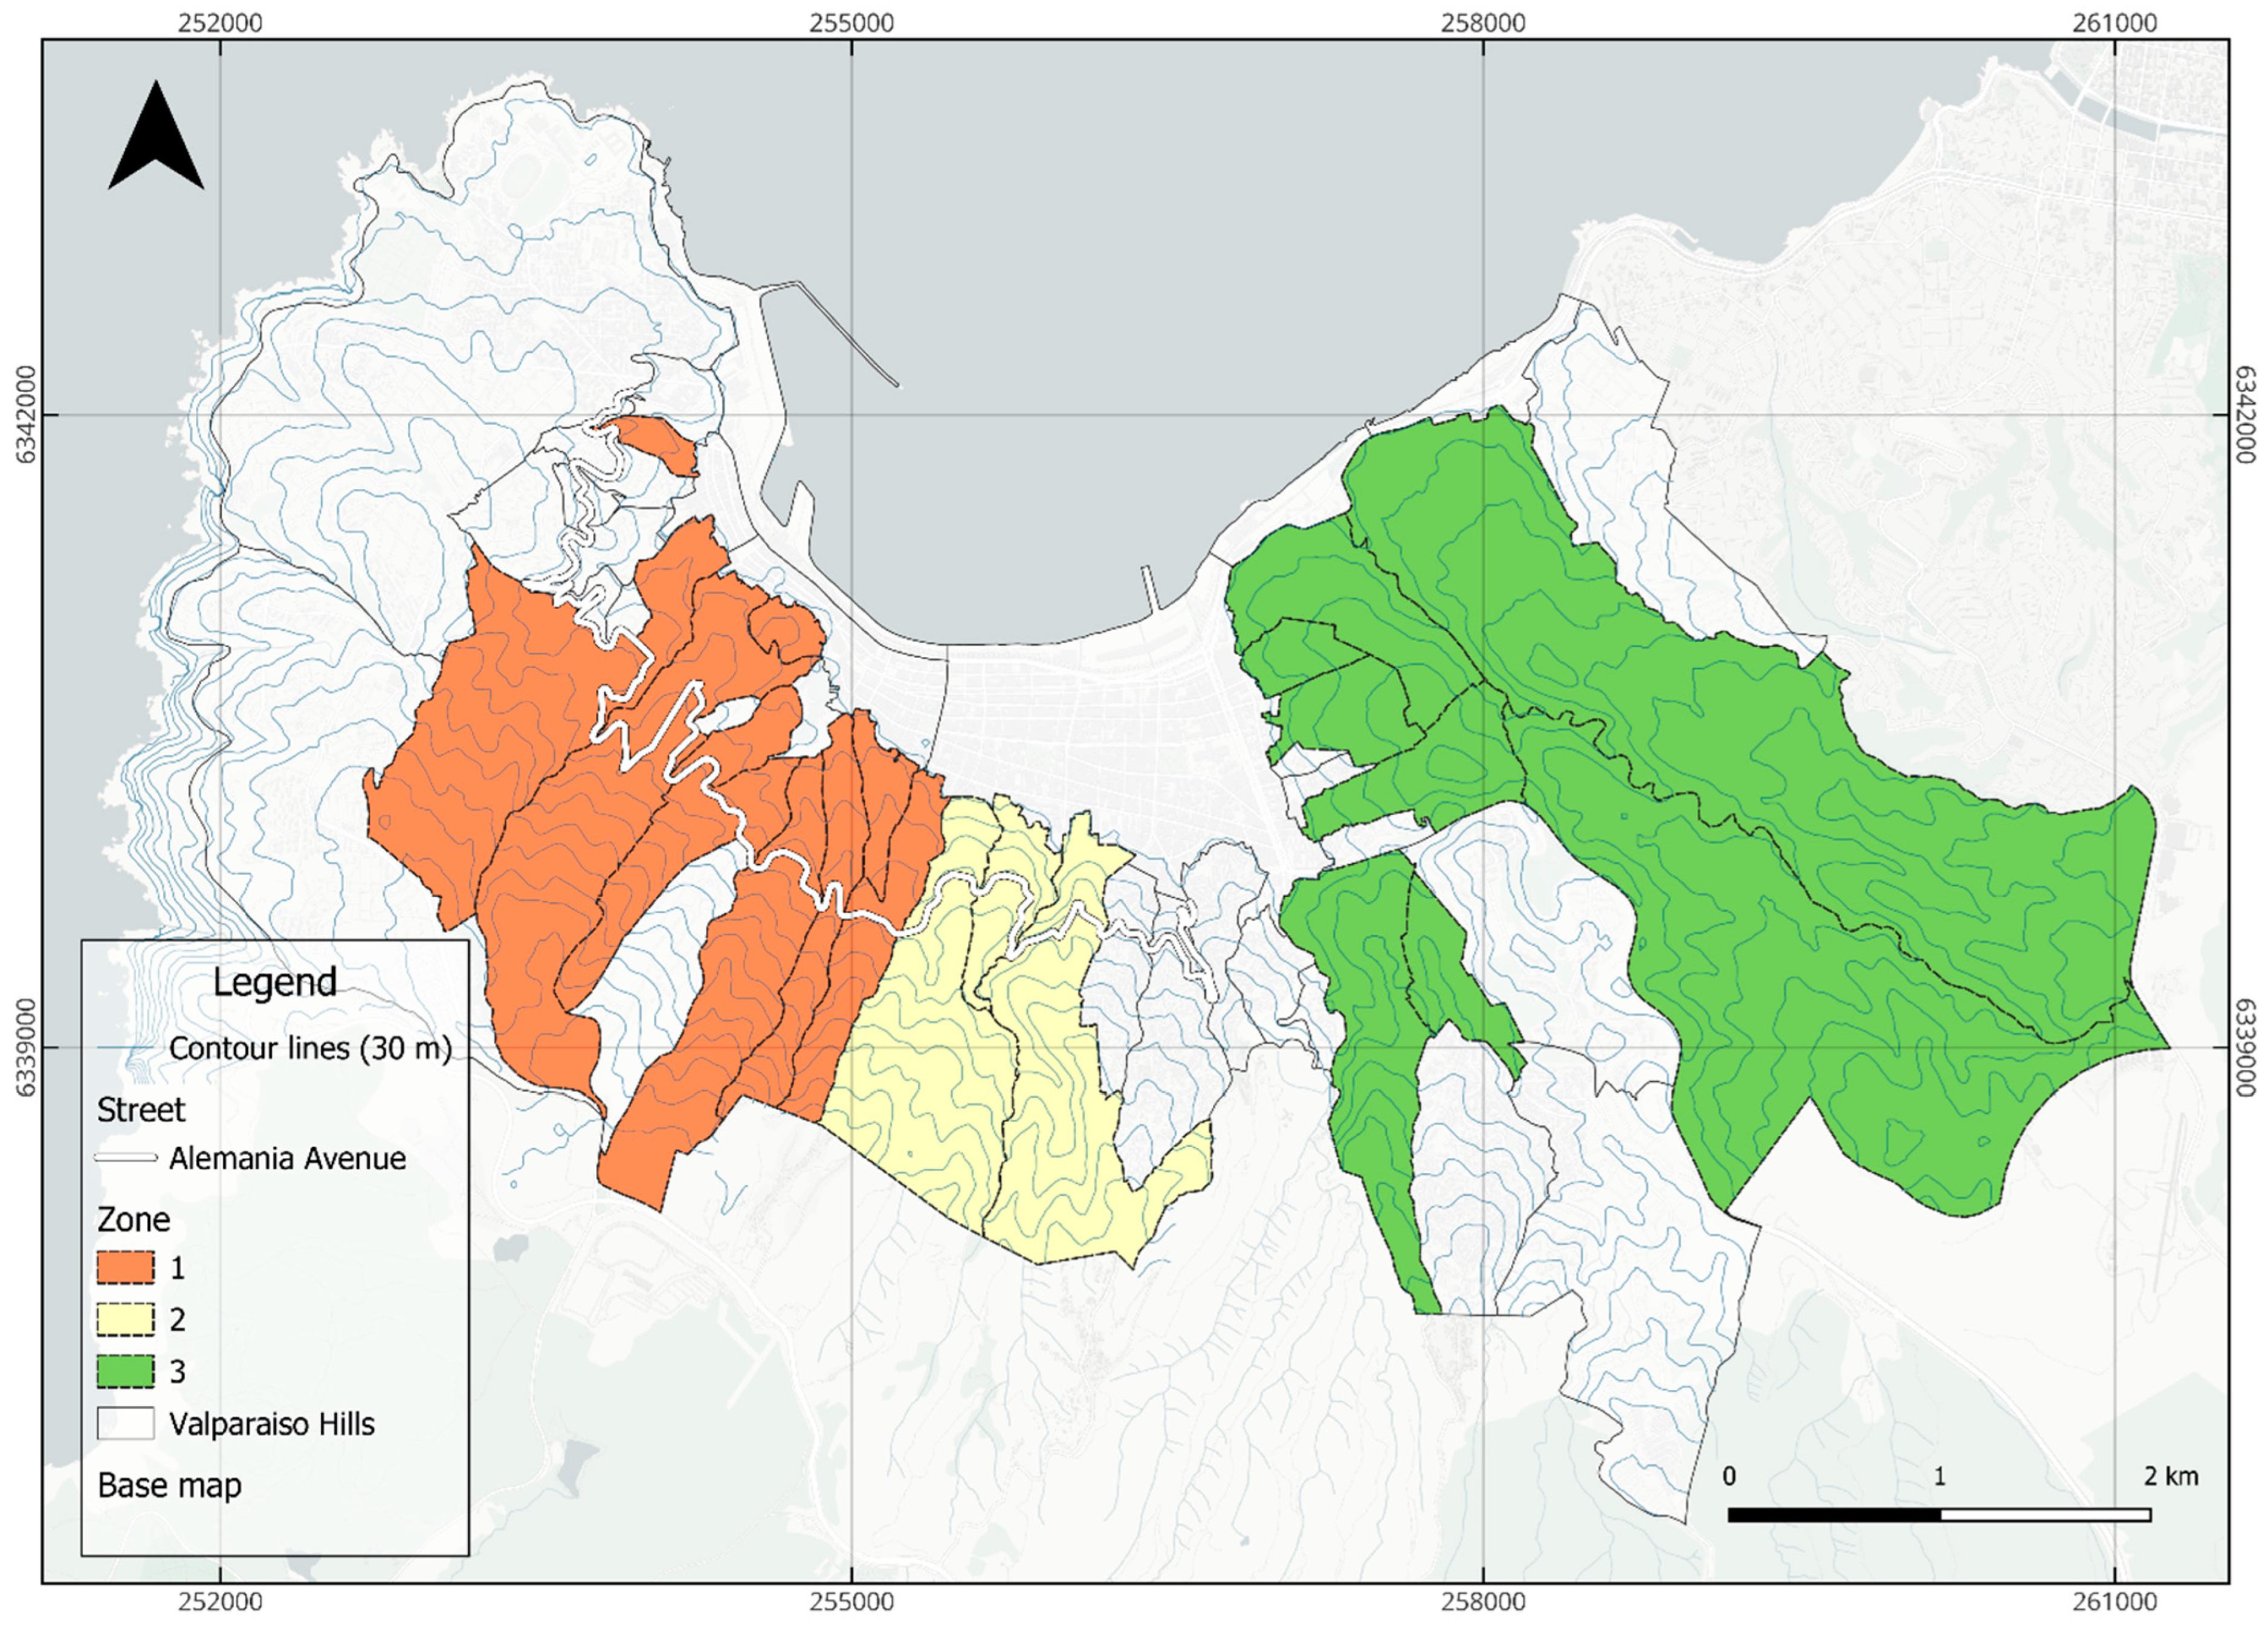
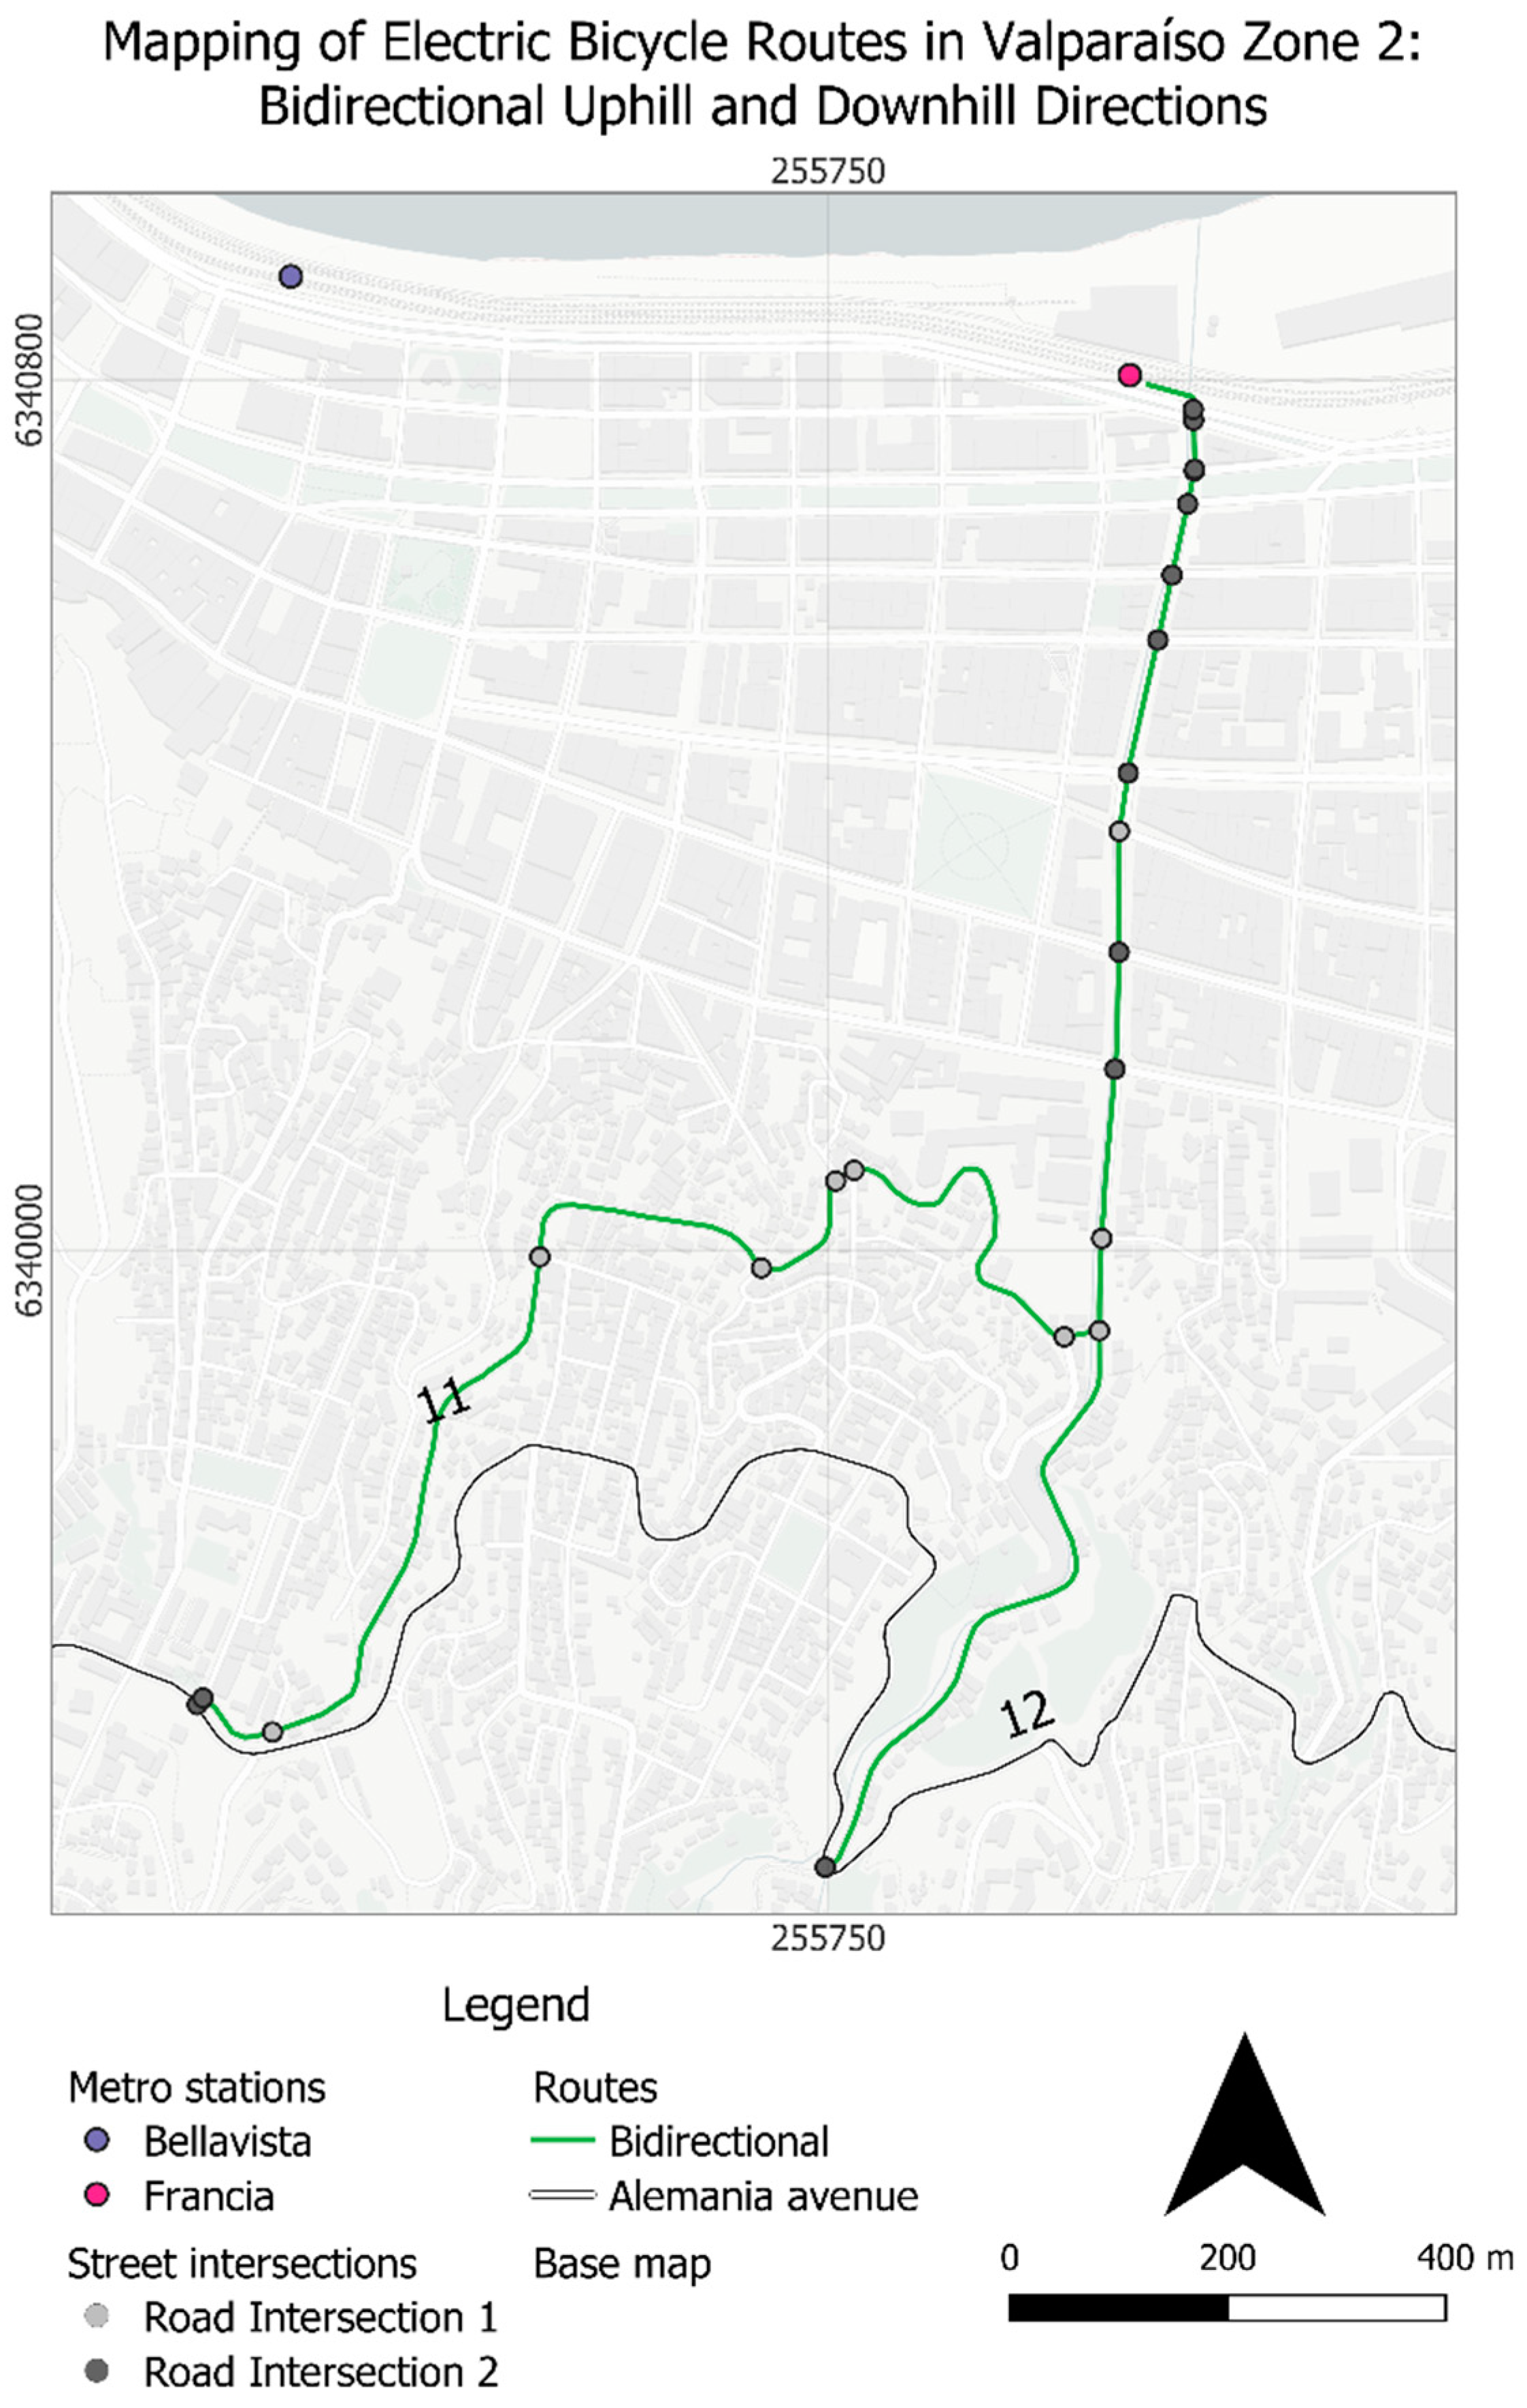
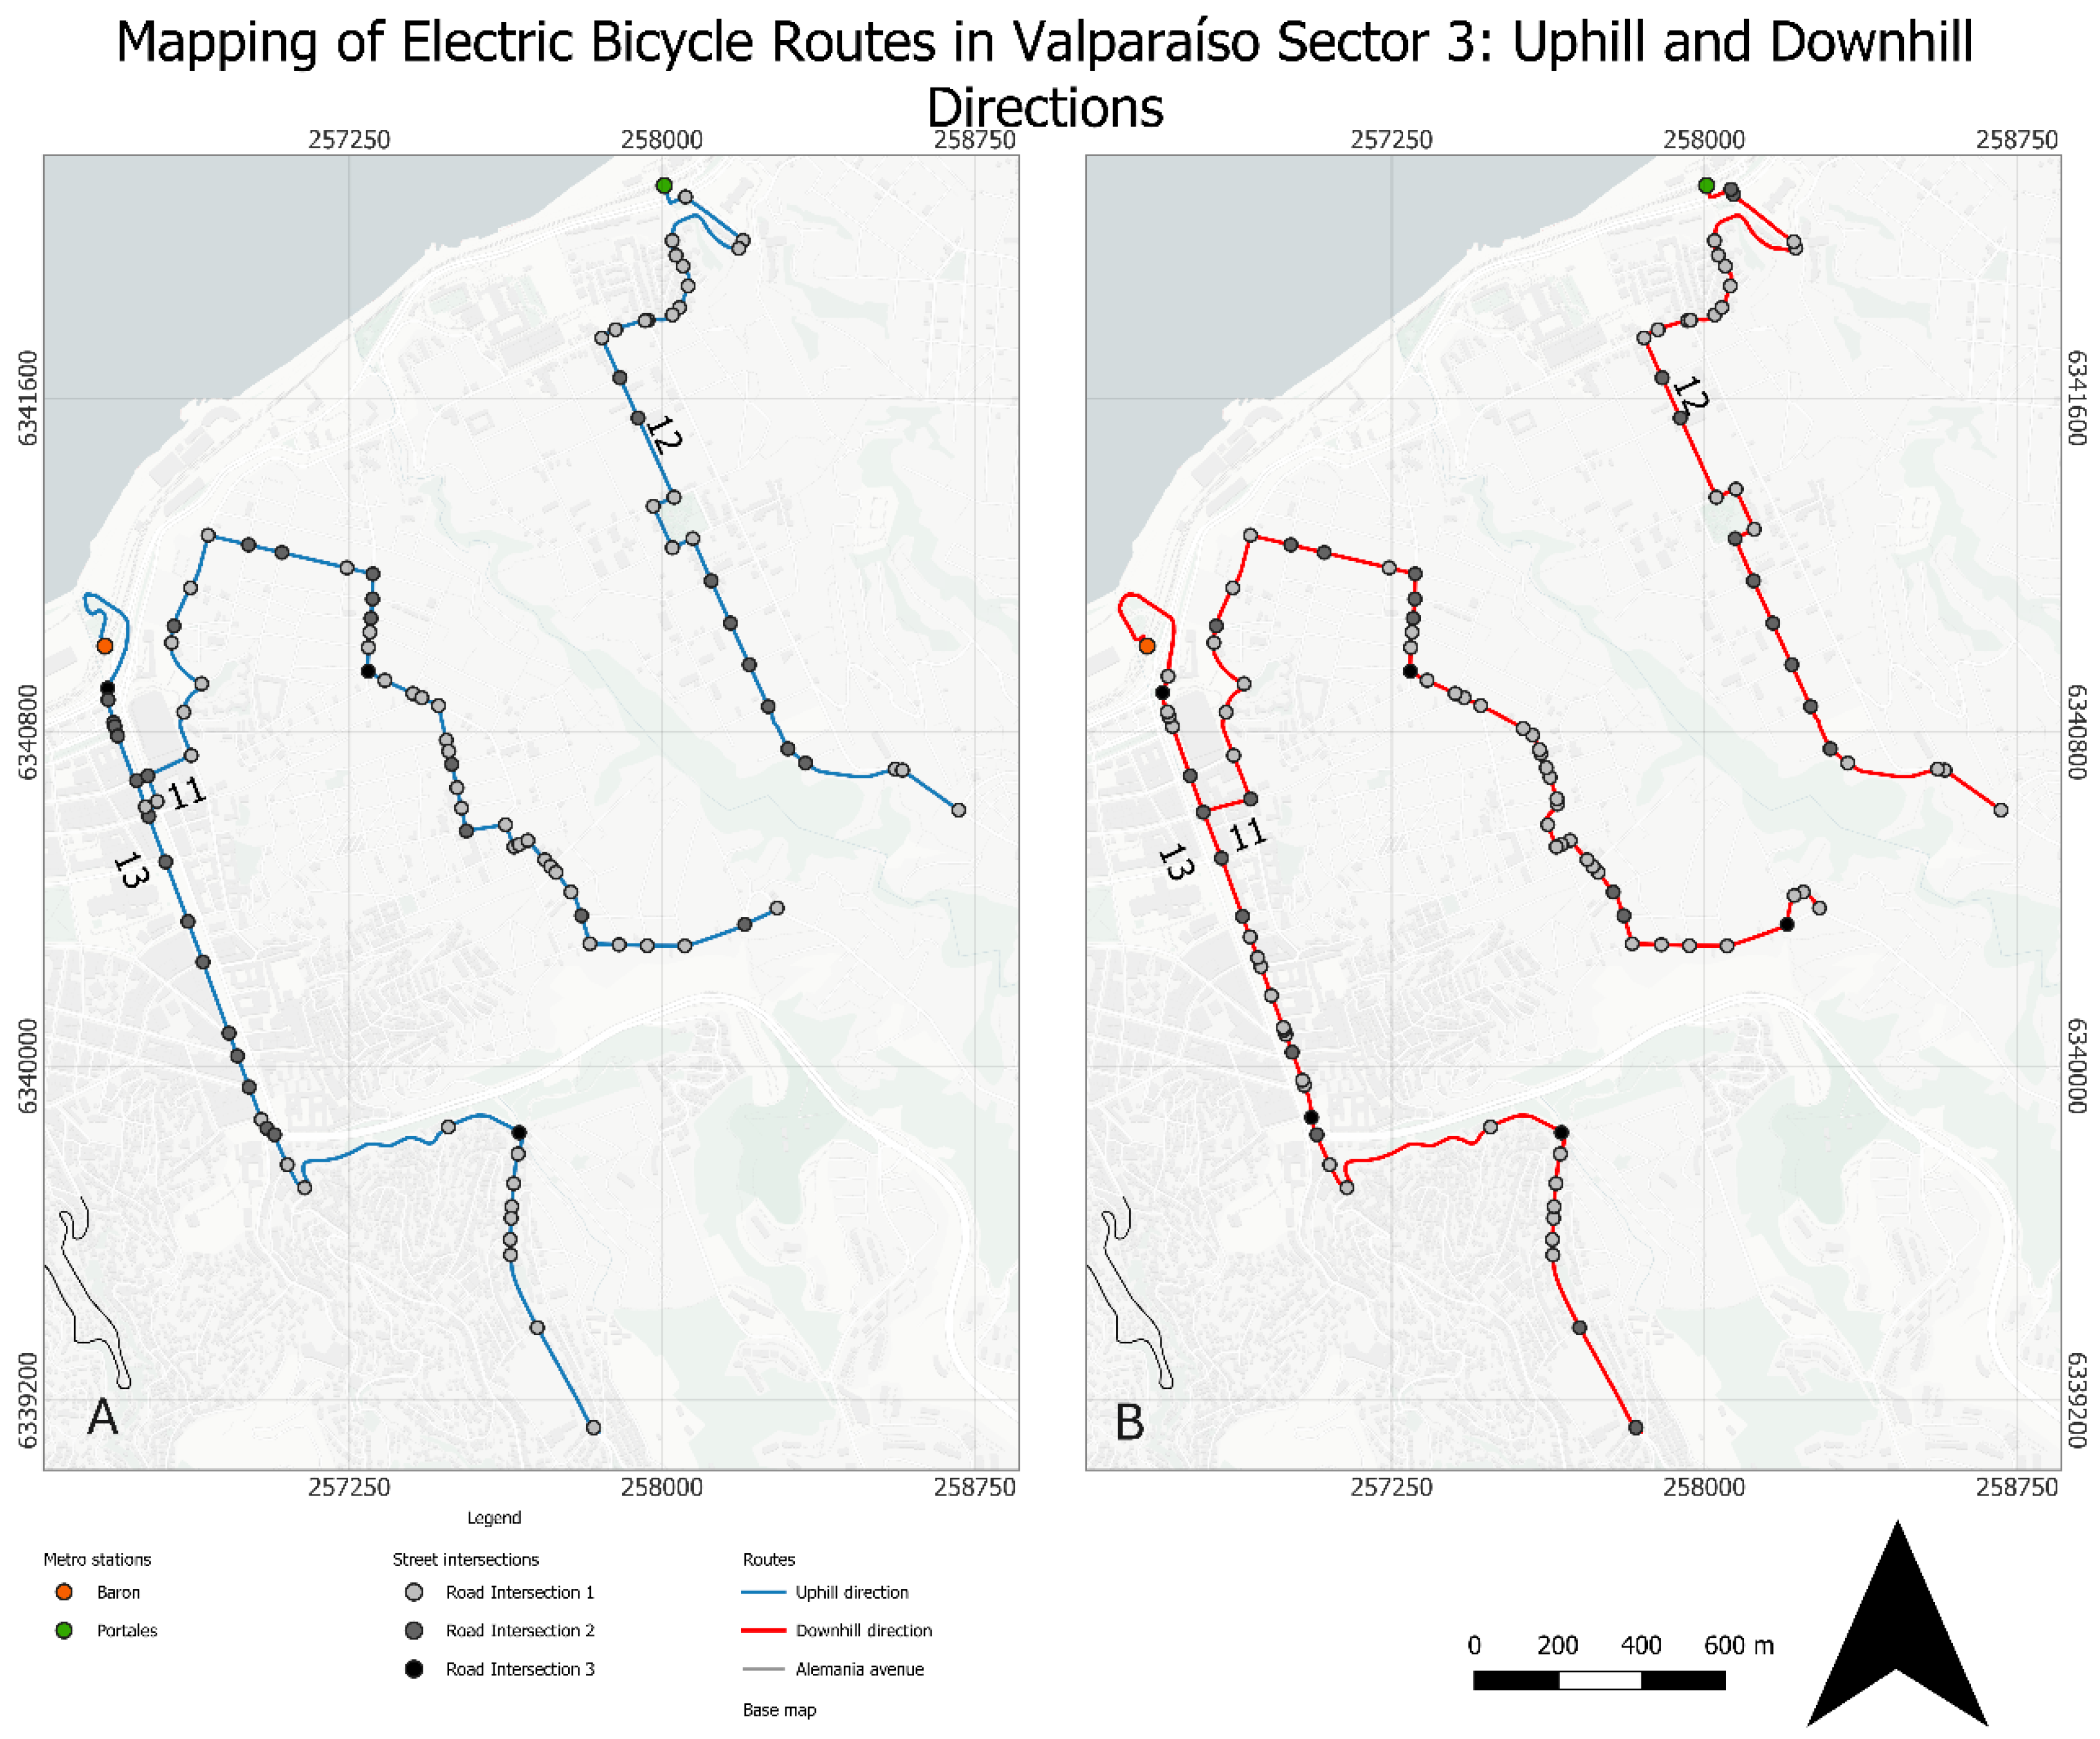
3.1. Description of the Case Study

The municipality of Valparaíso, located in the region of the same name in central Chile, is part of the metropolitan area of Valparaíso (also known as Greater Valparaíso), which also includes Viña del Mar, Concón, Quilpué, and Villa Alemana, where around 900,000 people live [57]. Specifically, around 300,000 people live in Valparaíso itself [58], distributed in the hill and plain sectors, which are connected by approximately eight bus lines [59]. In addition, the commune of Valparaíso contains 6 of the 20 metro stations in the EFE Valparaíso network, located in the coastal area of the city (Figure 3). These metro stations were considered in selecting possible routes, taking them as the starting points of each route. For a better understanding of the location of the hills named in this article, Figure A1 in Appendix A presents the details of the location of each of these with their respective names.
Regarding the economic characteristics of the city, for the year 2022, according to the CASEN survey [58], Valparaíso had 18,589 companies, which represented 12.7% at the regional level and 1.23% at the national level. The majority were micro-enterprises in the sector of the wholesale and retail trade and repair of motor vehicles and motorcycles, which constituted 31.7% of the total. According to the Internal Revenue Service [58], there were 125,239 dependent workers, which corresponded to 17.8% at the regional level and 1.2% at the national level. Of these, 19,236 (15.4%) were employed in the transport and storage sector. On the other hand, the poverty rate in Valparaíso for 2022, according to CASEN, was 7.4%, compared to 6.5% at the national level. In December 2023, the rate of overcrowded households in Valparaíso was 6.7%, compared to 8.5% nationwide [58].
In the climatic context, the city of Valparaíso has a temperate Mediterranean coastal climate, where, thanks to the presence of the ocean, there are no major temperature variations throughout the year, averaging 14° per year; on the other hand, rainfall can reach 450 mm per year [60]. The heavy rains and their frequency can have a great negative impact on people’s mobility since the city’s topography favors the generation of rivers or canals in the steep streets, making pedestrian and vehicular traffic difficult. This was a tangible reality in the winter months of 2024 since several frontal systems occurred that left large amounts of precipitation in the city and forced local authorities to declare a red alert [61,62,63], causing floods that affected streets, stairs, funiculars, and homes, in addition to landslides.

3.2. Research Planning and Design

This study is divided into two approaches: a multicriteria analysis and an experimental study. Both of these approaches support the process of analyzing the possible routes for E-bike use in the city and the potential use of electric bicycles in Valparaíso.
The methodology for determining the optimal routes was based primarily on using geographic information system (GIS) tools and analyzing various characteristics of the streets of Valparaíso. The process was divided into five main stages. The first stage consisted of a literature review of studies in Google Scholar using keywords such as “Routes”, “GIS”, “Electric Bicycles” and “Multicriteria”. The second stage, called “Route Design”, focused on the identification of possible routes from the Valparaíso metro stations to the main cross street at an altitude of 100 m above sea level in the hills. The third stage, called “Design of Variables in GIS”, involved considering factors such as the average slope, traffic accidents, directionality, route length, and the number and type of intersections, aiming to narrow down the route selection. In the fourth stage, called “Multicriteria Analysis in GIS”, the routes were evaluated using a multicriteria approach to weigh the variables collected and determine the most suitable routes. Finally, the fifth stage involved analyzing the selected routes to validate their feasibility and optimization.
After the literature review, the routes were designed. The first step was to examine the routes registered on the Garmin Connect website [64], reviewing the “Training/Planning” section and the “Heatmap of popular routes” item. This map shows limited routes within Valparaíso used by cyclists who register their activity on Garmin. Since the routes available in Garmin were scarce, alternative routes were searched for using Google Maps, taking as the starting point a metro station in Valparaíso and as the destination Avenida Alemania, a street located at an average altitude of 115.5 m that connects several hills in the city, towards Plaza O’Higgins on the Washington route at an altitude of 126 m, towards Rodelillo Avenue in the case of Cerro Barón, and just over 200 m above the intersection between Manuel Antonio Matta and Javiera Carrera for the case of Cerro Placeres, with the latter located at 160 m and 170 m above sea level, respectively. From this search, the routes were digitized using QGIS software, creating vector files in line-type shapefile format, resulting in a total of 15 proposed routes within the city of Valparaíso, all with a slope greater than 6%, generating a division by the zones shown in Figure 4 for better visualization of the routes presented in the Results section, and the names of which are detailed in Table 2.
As for the experimental study, the objective was to evaluate the performance of the electric bicycles on a route that replicated the conditions of the proposed routes. The latter were designed for specific adaptations, which made conducting these experiments on such routes less feasible at the time of study due to the high pedestrian flow, as well as public and private traffic. Therefore, a remote test route was selected, with a low pedestrian and vehicular flow and similar characteristics to those of the evaluated routes. The purpose of this selection was to measure, in different individuals, both their physical capacity and their perception, as well as to evaluate the performance of different types of bicycles on slopes: conventional and 250 W, 500 W, and 750 W electric bikes. In addition, a stop was simulated halfway up the climb, where the participants had to stop in order to evaluate both their physical capacity and that of the bicycles to accelerate on slopes.

3.3. Description of the Variables for the Multicreteria Analysis

For the design of the GIS variables with the preliminary routes, criteria were established to reduce the number of routes and select the most viable ones based on the available information in the study area. The following factors were considered: topography, road safety, rider comfort, travel time, and cycling infrastructure. For each of the factors, there was a variable of measure. Respectively, this study applied the following variables: average slope; traffic accidents, favoring routes with a lower or no incidence of accidents; route length, preferring those with a shorter length; the number and type of intersections, selecting routes with a lower number and variety of intersections; and directionality, prioritizing one-way routes due to their greater safety. The measurement of each factor is described as follows:
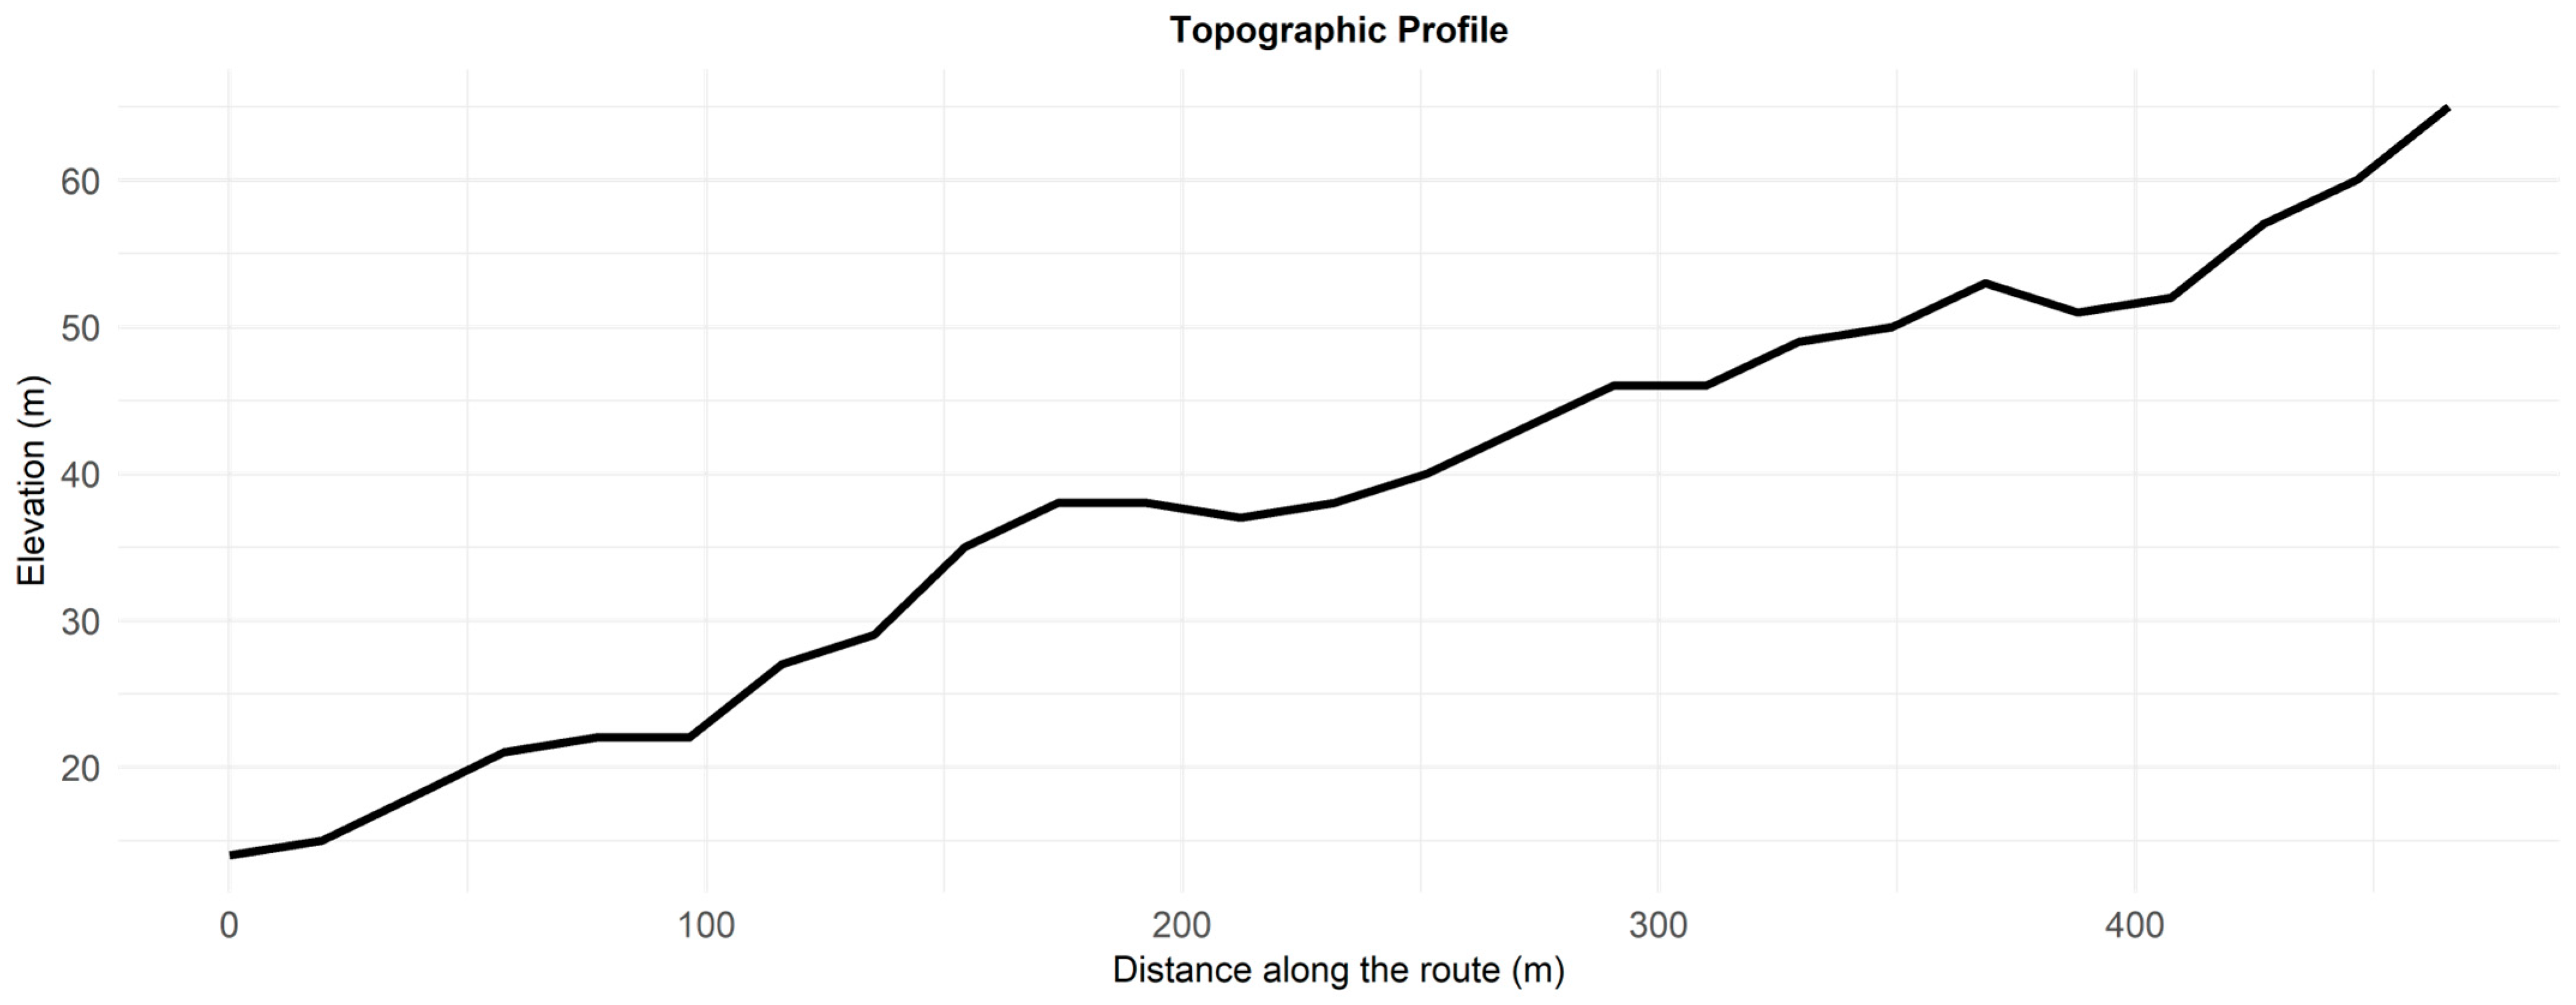
  • Topography [24,32,33,38,40,46]: A Digital Elevation Model of the Valparaíso region was used, obtained from the Spatial Data Infrastructure of Chile (IDE) [65]. This model was clipped to fit the area of Valparaíso. Next, the slope of each route was calculated using the “Zonal Statistics” tool in QGIS, obtaining the average of the slope from the beginning of the elevation to Avenida Alemania. The mask used was for routes from the foot of the hill with a buffer of a 5 m radius, similar to that stipulated in Decree 47 for the width of a local road corresponding to 11 m [66].
  • Road safety [38,49,50]: The total number of traffic accidents along each proposed route was analyzed using the information available in the CONASET Geospatial Information Portal [67], which contains georeferenced accident data for the Valparaíso commune for the year 2022. To determine the number of accidents on each route, a polygon representing the width of the street was created based on the Google Maps satellite view and the QGIS base map. This polygon allowed the points where accidents occurred within each route to be cut out. Finally, the QGIS “Count Points in Polygon” vector tool was used to calculate the total number of accidents recorded along the routes. The mask used was for routes from the foot of the hill with a 5 m buffer [66].
  • Rider comfort [23,27,33,52]: The directionality of each route was identified using Google Maps.
  • Travel time [27,33]: From the digitization of the routes, the length of each route was calculated using the “Field Calculator” tool in QGIS. The “$length” option was selected to obtain the distance from the start point to the route’s endpoint in meters.
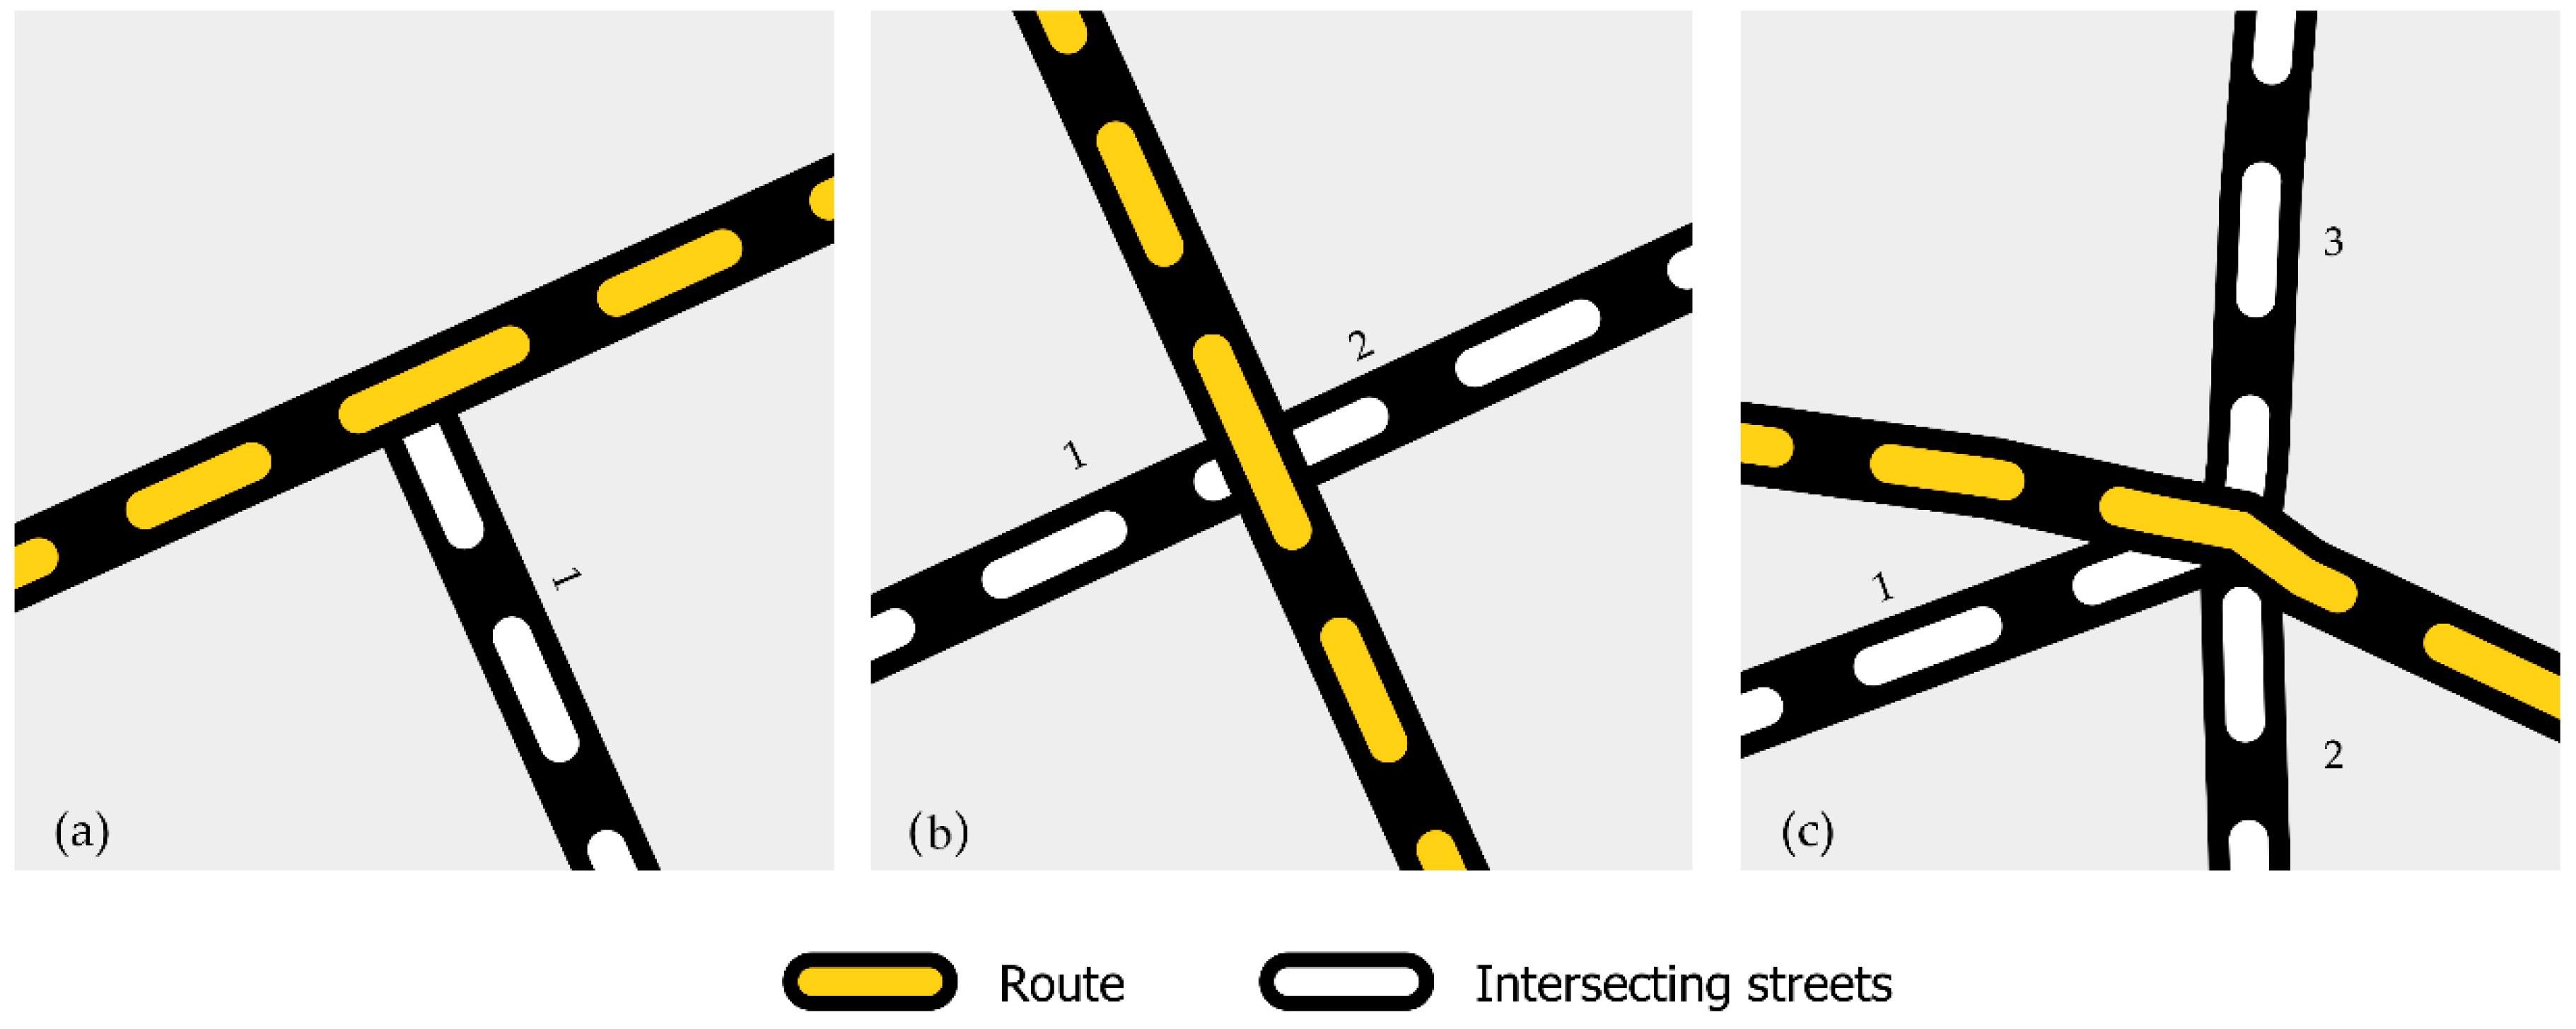
  • Cycling infrastructure [32,37,38,51,52]: Using the route lines and the base map in QGIS, all of the streets that intersected with the main route were digitized as points. The intersections were identified based on the number of streets that crossed an intersection, classifying them as intersections with one, two, or three streets. The mask used was for routes from the foot of the hill with a buffer of 5 m [66].

3.4. The Analysis Method for the Multicriteria Analysis

In the multicriteria analysis stage in the GIS, a score from 0 (very low) to 3 (very high) was assigned to each variable. It is relevant to highlight that the assessment of potential E-bike routes in Valparaíso was based on the reality in this city. This means that for some criteria, four categories were based on the quartiles of each variable in relation to the data on all of the assessed routes, such as distance, accidents, and the number of intersections (see Table A1 in Appendix A). In addition, this multicriteria analysis included the implementation of the analytic hierarchy process (AHP) [68] to weight the criteria differently based on students, academics, and professionals in the transport field. The combinations of the sections’ average slopes were used to generate a final score for each route, as seen in Table A1 in Appendix A.
Regarding the slope conditions, Nematchoua et al. [25] evidenced E-bikes’ advantages in overcoming steeper slopes compared to conventional bicycles. In this sense, adapting slope criteria to E-bike use on certain routes is interesting. Therefore, since a 5% or 6% slope is considered suitable and comfortable for the use of regular bicycles [8,69], for this criterion, the proposal was to increase the cycling potential for slopes by 2% from 6%, that is, optimizing routes with a slope of up to 8% and generating four slope ranges with their respective quartiles, with the first being less than 8%, thus penalizing streets that were too steep.
The distance criterion considered three indicators: the first being related to the total distance of the route from the metro station; the second being the total distance from the beginning of the hill’s elevation; and the third being the average of the distances of the sections of the route. All of these indicators were conditioned by their quartiles, weighting the longest distances as unfavorable. Subsequently, traffic accidents were evaluated, considering the total number of accidents per route and an area of influence of 10 m in diameter [66], also weighting these according to their quartiles, and penalizing routes with more accidents.
The variable for type of intersection followed a similar logic to the slope variable; however, it sought to penalize intersections with complex dynamics (see the types of intersections in Figure 5).
Finally, the speed criterion was considered, taking the average speed on the route as a variable. To this end, a 5 m influence area was used, from which coordinates corresponding to the people who start their journey in said area and who travel within Valparaíso were extracted, according to the data from the Origin and Destination Survey [70]. The distance and the declared time were considered, and the speed quartiles obtained were weighted, with the highest speeds classified as unfavorable.
Combinations of the variables that summed of their values and considered the weight of the criteria were used to rank the routes, from those with higher to less potential to be used as shared E-bike routes with other modes of transportation or even to be considered for further evaluation of building separated cycleways for E-bikes.

3.5. Description of the Variables for the Experimental Study

The experimental study was conducted using four types of bicycles: one regular bicycle and three electric bicycles with power ratings of 250 W, 500 W, and 750 W. The following variables were measured: the time it took the participant to complete the ride, the total distance traveled, and the average speed during each ride for each type of bicycle. In addition, the average heart rate, calories burned, and time in motion were recorded for each bicycle.
To ensure measurement accuracy, ride monitoring was performed using a Garmin EDGE 840 SENSOR BUNDLE GPS system, a VENU 2 GPS Smartwatch, and a Garmin cadence sensor and speed sensor. These devices provided accurate metrics on heart rate, calories, and movement time.
At the end of the routes, a survey was administered using Google Forms, in which each participant answered questions related to their socioeconomic data, mobility habits, level of physical activity, and experience using electric bicycles.

3.6. Analysis Methods for the Experimental Study

Different analyses were performed based on the data collected. First, the participants’ profiles, socioeconomic status, and mobility patterns were obtained. Then, a performance analysis of the power of each bicycle was carried out, considering the variables of time, distance, and speed. Subsequently, a physical activity analysis was conducted, considering heart rate, calories burned, and time in motion. Finally, the participants’ experience was analyzed, including factors such as comfort, safety, physical effort, and the ease of use of each type of bicycle.

4. Results

4.1. Multicriteria Analysis

A total of 15 routes were drawn from the five metro stations in Valparaíso: 4 from Puerto station, 6 from Bellavista station, 2 from Francia, 2 from Barón, and 1 from Portales. Only two of the routes go up and down the same road, while the others require a different route to return to the starting point. In addition, only four of the proposed routes utilize one-way streets: 1, 2, 4, and 5 (Table 3).
For better visualization of the routes, the routes were displayed in the three proposed hill areas (see Figure 6, Figure 7 and Figure 8), accompanied by their respective characteristics (Table A2, Table A3 and Table A4 in Appendix A). The first 10 routes were drawn from the Puerto and Bellavista stations, with all of them reaching Avenida Alemania (Figure 6).
In the uphill section of zone 1, the average gradients vary from 10.85% in Ferrari (7) to 21.14% in Yerbas Buenas (10). The routes with the fewest traffic accidents are Tomás Ramos (9), Almirante Montt (1 and 2), and Cumming (4 and 5), while Ecuador/Cumming (6) and Yerbas Buenas (10) have the highest values, with 13 and 14 accidents, respectively. The distances from the initial elevation of the hill range between 1300 and 2200 m, with that for Carampangue (3) being the shortest. Most of the routes have more than 20 intersections, with Carampangue (3) standing out, with the fewest, at 8. In the downhill section, the results vary—for example, in terms of average slope, where the lowest slope is in Yerbas Buenas (10), at 10.25%, and the highest slope is 16.43%, in Almirante Montt (1). The distance from the initial elevation of the hill varies between 580 and 1680 m, with Carampangue (3) having the shortest distance, at 586.46 m (Table A2 in Appendix A).
In the second zone, only two routes were drawn, starting at Francia station, sharing a large part of their routes until a fork, and with both reaching Avenida Alemania (Figure 7). Although both are bidirectional and share a large part of their start, they have differences: the Baquedano route (11) registers 16 traffic accidents and has a steeper slope, a greater distance, and more intersections than the Francia route (12) (Table A3 in Appendix A).
In zone 3, three routes were laid out, with all of them being two-way routes, i.e., one uphill and one downhill. Routes 13 and 15 start from Barón station, while route 14 starts from Portales station, reaching altitudes of approximately 160 m above sea level. Although the routes are two-way, the changes between uphill and downhill are minor (Figure 8).
The average gradients of the three routes are similar between uphill and downhill, ranging between 9 and 13%. The number of traffic accidents ranges from 7 to 27 on the uphill route, while the downhill route has the highest number of accidents of all routes, with 43 in Washington (15). The distances are generally longer on these three routes, exceeding 2.5 km and reaching up to around 3.7 km from the metro stations, both uphill and downhill. Regarding intersections, it is observed that both uphill and downhill, the Baron route (13) is the one with the most intersections, with 50 and 53 (Table A4 in Appendix A).
In relation to the descriptive measures (see Table 4), the bidirectional routes have the lowest average slope (9.4%), reaching sections with a maximum of 30.64%, followed by the downhill routes (12.72%), with maximum sections of 42%, and finally, the uphill routes (15.1%), also registering a maximum slope of 42%. The shortest distance of the route to the nearest metro station is shorter in the bidirectional direction, at 1921.1 m, followed by downhill routes at 1935.23 m and uphill routes at 2080.54 m, while the distance of the routes from the beginning of the hill has the same distribution as the distance to the metro stations, at 1007.53 m, 1184.4 m, and 1190.07 m, respectively. On average, the distance of the route sections is greater for the bidirectional routes, at 109.81 m, also presenting the highest standard deviation (137.01 m) and highest maximum (620.63 m).
Regarding accidents, the routes with the highest average number are the bidirectional ones, with 15, but these are the ones with the lowest standard deviation (1.41) and the lowest maximum value of accidents (16). On the other hand, the downhill routes are those with the highest number of accidents, with an average of 12.92, having the highest standard deviation (10.79) and the highest maximum (43). Uphill routes register an average of 10.23 accidents, with 6.5 standard deviations and 27 maximum accidents. Another relevant point is the speed, which is the highest on downhill routes, at 9.52 km/h on average, with a standard deviation of 4.34 km/h and a 20.04 km/h maximum.
Using Google Forms, a group of experts convened to answer a survey designed with comparative questions aligned with the AHP method. A total of 14 experts participated in this survey. Each participant’s responses were entered into the AHP matrix and processed using the ahpy library in Python. In order to obtain the best Consistency Index (CI) and given the varied profiles of the experts, 1001 combinations of the participants’ responses were made, considering subsets of 10 experts. This allowed for the best combination to be identified, reaching a CI of 0.156. This value is relevant considering the diversity of the participants’ profiles and provides a first approximation for the weighting of the variables (see Table 5). Regarding the analytic hierarchy process (AHP), the output for weighting the criteria is presented in Table 5.
In the AHP method applied in this study, the participants were six academics and eight professionals related to the field of urban transportation and mobility. The professional profiles of the participants are presented in Table 6.
According to the analysis carried out of the identified routes, considering the variables described above, Table 7 ranks the routes from the most optimal to the least optimal. In first place, Cumming from Puerto (5), Cumming from Bellavista (4), and Almirante Montt from Puerto (1) stand out in the uphill routes. Meanwhile, the least optimal uphill routes are Yerbas Buenas (10), Carampangue (3), and Tomás Ramos (9). Moreover, of the downhill routes, Cumming from Puerto (5), Barón (13), and Almirante Montt (1) stand out. In contrast, the least optimal downhill routes are Placeres/Matta (14), Yerbas Buenas (10), and Tomás Ramos (9). Of the bidirectional routes, the most optimal route is Baquedano (11), and the least optimal is Francia (12); these routes are the only ones with bidirectional routing.
Of all the routes, Cumming from Puerto is the best, both uphill and downhill, reaching the highest scores of 9.41 and 9.49, respectively. On the other hand, among the less optimal routes, Yerbas Buenas and Tomás Ramos stand out, routes that are repeated as the least optimal both uphill and downhill. The Cumming from Puerto route stands out for its low values for the total distance from the foot of the hill, as well as for its total number of traffic accidents, total number of intersections, and speed, whose values are between the Q1 and Q2 quartiles. In addition, it stands out for having low values in terms of the type of intersections, with two that are bidirectional and others that are unidirectional or bidirectional in Q1. As for the Yerbas Buenas and Tomás Ramos routes, these stand out for their high values in the average distance of the sections and speed, with these values in Q3. For more details on the values of each route, see Appendix A Table A2, and to understand the context of the values in the quartiles, see Table 4.

4.2. The Experimental Study

The experiments were conducted on 1 October 2024 and 4 October 2024, from 9:00 a.m. to 2:00 p.m., under sunny weather conditions. They were carried out on the eastern roadway of Gastón Hamel Nieto Avenue, in Viña del Mar, with a total of 13 participants (6 in the first instance and 7 in the second). The proposed distance was approximately 550 m, with three control points—the start (14 m above sea level (masl)); the rest point (40 masl), which emulated an intersection, which tested the participants having to restart on a slope; and the end (68 masl)—reaching an average slope throughout the route of 10.88%. Figure 9 presents the topographic profile of the route.
During the activity, each participant used a regular bicycle, a 250 W electric bicycle, a 500 W electric bicycle, and a 750 W electric bicycle. Each participant completed the outbound (uphill) and return (downhill) legs on each bike, i.e., at a total of four rides per person. To ensure data accuracy, a monitoring system consisting of a Garmin EDGE 840 SENSOR BUNDLE GPS, a VENU 2 GPS Smartwatch, a Garmin pedaling cadence sensor, and a speed sensor was used. Personnel were assigned along the route to supervise the development of the activity.
The sample consisted of 13 participants, with most of them being men (77%), with an average age of 28 years, with 33% of them having an income that did not exceed the minimum wage, and with 22% of them having an income that exceeded 2 million Chilean pesos. The mobility patterns of the participants showed that the majority used minibuses, followed by walking and the metro. Their use of transport applications was less frequent, and it should be noted that none of the participants used a bicycle as a regular means of transport. In addition, 50% of the participants took between 45 min and 1 h on their usual journeys.
Regarding the results obtained in the experiment, Figure 10 shows the time it took each participant to travel the route using each bicycle, the distance traveled, and the average speed reached. The instruction given to the participants was to pedal with each bicycle as far as their physical condition and the slope allowed, resulting in some who completed the entire route on some bicycles and other participants who could not advance beyond the rest point. Based on the above, the time results shown in Figure 10 indicate that the shortest time taken to carry out the experiment was found for the regular bicycle (6 min) because it was also the bicycle on which the participants traveled the shortest distance (0.4 km), reaching an average speed of 4.09 km/h, where few participants managed to reach halfway during the climb. In terms of distance, the bike that reached the shortest distance after the conventional one was the 500 W e-bike, reaching an average of 0.68 km, because most of the participants reached the midpoint of the route since the bike model was heavier and could not provide assistance at 0 km/h but rather had to reach a certain speed for its assistance to be activated; as for the time for this bike, it averaged 7 min since the participants had a harder time going up the slope, with fairly low speeds that reached 5.36 km/h on average. On the other hand, the 250 W and 750 W bikes were those that had the best performance, recording 0.9 km and 0.93 km distances, respectively; that is, the vast majority of the participants reached the midpoint of the route and some reached the end of it, with the fastest bike being the 750 W bike.
Some of the results obtained from the survey carried out by the participants at the end of the experiment are summarized in Figure 11 and Figure 12. Figure 11 shows the results related to the comfort and safety of the bicycles, highlighting the pattern of the low comfort and safety of the conventional bicycle. Regarding the 250 W bicycle, a medium level of comfort and safety predominate, with no responses for “very low”. On the other hand, the 500 W and 750 W bicycles tend towards high comfort and safety, with some of the participants not considering them to be very safe, mainly due to the weight of these bicycles and the speeds they can reach.
In relation to physical effort and the ease of use of the bicycles, Figure 12 presents the results for these responses, where it is observed that the majority of the participants agree that the conventional bicycle is that with which the greatest physical effort must be applied to climb a significant slope, having a medium-level ease of use. On the other hand, the 250 W bicycle presents, according to the participants, a medium level of physical effort, considered by some to involve low and by a lesser amount to involve high physical effort, while, in terms of ease of use, the majority agree that it is medium to very high. Regarding the 500 W bicycle, the majority of the participants consider the physical effort used to be medium, highlighting one person who considered it to be very high; in terms of ease of use, it varies between very low and high, highlighting more responses at the medium level, with this being due to the fact that the bicycle was very heavy and the assistance option was only activated from a certain speed. Finally, the 750 W bike is the one that requires the least physical effort due to its power and ability to climb slopes easily, while its ease of use varies between low and very high.

5. Conclusions

Aligned with the Sustainable Development Goals of the United Nations, this study identified and evaluated 15 potential E-bike routes in the city of Valparaíso that connected the city’s metro stations with strategic streets in the hills, highlighting this as an important sustainable mobility solution in a challenging urban context. The routes with better conditions based on the criteria used were to Cumming from Puerto and Bellavista stations. These could be potential routes for promoting an E-bike-inclusive city. The results indicate that variables such as the slope, traffic accidents, intersections, and directionality of the street have a significant impact on the viability and safety of E-bike users, indicating the necessity to plan E-bike routes carefully, giving priority to safety and connectivity to promote a change in modal choices towards active and sustainable mobility, similar to the results found by De Jong et al. [37] and Saplıoğlu and Aydın [38]. As found by Santos et al. [46], the results of this study showed that E-bikes were capable of overcoming steep slope conditions, which was also noted by the experts that weighted the factors evaluated in this study.
Regarding the experimental approach, it was possible to demonstrate that the E-bikes with greater power (500 W and 750 W) allowed the cyclists to overcome the slopes encountered in Valparaíso with less physical effort and better comfort. However, the characteristics of the participants and their performance may have been affected depending on the design of the E-bikes (e.g., height) and their motorized settings, such as allowing motor assistance when the bicycle achieved a certain speed, which was the case for the 500 W E-bike. Different from the other studies reviewed in the literature review section, this research explored a case study, Valparaíso, that currently does not develop cycle-friendly infrastructure. One of the reasons for this is related to norms and regulations based on conventional bicycles for establishing cycleways and routes that limit the city from exploring and developing its sustainable mobility potential further.
The contributions of this study support the bettering of the definition of non-motorized vehicles in Chile, which currently is limited to E-bikes up to 250 W, supposedly because of the fear of non-motorized vehicles achieving speeds higher than 25 km/h. However, the experiments developed in this study showed that the 500 W and 750 W E-bikes achieved average speeds of 5.36 km/h and 6.88 km/h, respectively, and overcame slopes higher than the 6%, which is a limiting value for justifying cycleways in this country. Therefore, it was shown that in the case of Valparaíso, it could be possible to reduce the accessibility gap between less and more favored populations by increasing the limiting power for non-motorized mobility and the slope at which cycleways are justified.
Considering that this is a first approach to the city of Valparaíso regarding the potential use of E-bikes in this city, there are still challenges regarding the implementation and monitoring of E-bike cycleways on the proposed routes, the strengthening of public policies and investments to promote sustainable mobility, and education and awareness with respect to street safety and the environmental impact of transport systems. In this direction, this study seeks, in future opportunities, to pursue more detailed research regarding street scale analyses with the support of street audit tools to validate the global analysis, develop more experimental studies considering the limited number of participants to improve the validity of their results, and include climate variables, such as temperature and precipitation, as they also affect daily mobility. Furthermore, it would be interesting to explore an economic evaluation of cycleway projects in the city of Valparaíso in the future.

Author Contributions

Conceptualization: Vicente Aprigliano. Methodology: Vicente Aprigliano, Catalina Toro, Gonzalo Rojas, and Sebastian Seriani. Validation: Vicente Aprigliano and Sebastian Seriani. Formal analysis: Vicente Aprigliano, Catalina Toro, Gonzalo Rojas, and Sebastian Seriani. Investigation: Vicente Aprigliano, Catalina Toro, Gonzalo Rojas, Emilio Bustos, Ivan Bastias, and Sebastian Seriani. Data curation: Catalina Toro, Gonzalo Rojas, Ivan Bastías, and Emilio Bustos. Writing—original draft preparation: Vicente Aprigliano, Catalina Toro, Gonzalo Rojas, Marcus Cardoso, Sebastian Seriani, Marcelino Aurélio Vieira da Silva, Talita Santos, Ualison Rébula de Oliveira, and Ivan Bastias. Writing—review and editing: Vicente Aprigliano, Catalina Toro, Gonzalo Rojas, Marcus Cardoso, Sebastian Seriani, Marcelino Aurélio Vieira da Silva, Talita Santos, and Ualison Rébula de Oliveira. Visualization: Vicente Aprigliano, Catalina Toro, Gonzalo Rojas, Emilio Bustos, and Sebastian Seriani. Supervision: Vicente Aprigliano. Project administration: Vicente Aprigliano. Funding acquisition: Vicente Aprigliano. All authors have read and agreed to the published version of the manuscript.

Funding

Agencia Nacional de Investigación y Desarrollo (ANID), Chile, through the FONDECYT Project 11230050.

Data Availability Statement

The raw data supporting the conclusions of this article will be made available by the authors on request.

Acknowledgments

The authors gratefully acknowledge the research support provided by Agencia Nacional de Investigación y Desarrollo (ANID), Chile.

Conflicts of Interest

The authors declare no conflicts of interest.

Appendix A

Figure A1. Names and locations of Valparaiso’s hills. Source: elaborated by the authors.
Ijgi 14 00038 g0a1
Table A1. Criteria for establishing the scores for evaluating the most optimal route. Source: elaborated by the authors.
CriteriaIndicadorDescriptionConditionScoreFormula
Avarege slopeSlope by proportion of the route sectionFor each section of the route, its gradient is calculated, a value that is weighted according to the specific conditions. This value is adjusted based on the proportion of the distance of the section within the total route.<=83 T o t a l x   S c o r e = i = 1 n P i , x D i , x D t o t a l ,   x
P i , x : S c o r e   o f   s e c t i o n   i   i n   r o u t e   x
D i , x :   D i s t a n c e   o f   s e c t i o n   i   i n   r o u t e   x
D t o t a l , x : T o t a l   d i s t a n c e   o f   r o u t e   x
>8 and <=102
>10 and <=121
>120
DistanceTotal distance from metro stationTotal distance of the route from the metro station, weighted by the quartiles of each route.<=Q13 Q 1 = D n + 1 4 ,   Q 2 = D n + 1 2 ,   Q 3 = D ( 3 n + 1 4 )
D: Set of route distances from the plan
k: Total number of route s(distances) in D.
n: Total route distances from the plan, n = k.
>Q1 and <=Q22
>Q2 and <=Q31
>Q30
Total distance from the initial elevation of the hillTotal distance of the route from the start of the hill elevation, weighted by the quartiles of each route.<=Q13 Q 1 = D n + 1 4 ,   Q 2 = D n + 1 2 ,   Q 3 = D ( 3 n + 1 4 )
D: Set of route distances from the base of the hill.
k: Total number of routes (distances) in D.
n: Total distances of the route from the base of the hill, n = k.
>Q1 and <=Q22
>Q2 and <=Q31
>Q30
Average distance of the route sectionsFor each section of the route, its distance is calculated, and an average is obtained for each route, weighted by the quartiles of all the routes.<= Q13 Q 1 = D n + 1 4 ,   Q 2 = D n + 1 2 ,   Q 3 = D ( 3 n + 1 4 )
D: Set of distances of the route sections from the base of the hill.
k: Total number of sections (distances) in D.
n: Total average distance of the route sections from the base of the hill, n = k
>Q1 and <=Q22
>Q2 and <=Q31
>Q30
Traffic accidentsTotal number of accidents by area of influence of the routeFor each route, an area of influence of 5 m was defined, within which the number of traffic accidents was calculated, weighted by the quartiles of all the routes.<=Q13 Q 1 = A p + 1 4 ,   Q 2 = A p + 1 2 ,   Q 3 = A ( 3 p + 1 4 )
A: Set of total number of accidents per area of influence.
m: Total number of areas (total number of accidents) in A.
p: Total accidents per area of influence, where p = m.
>Q1 and <=Q22
>Q2 and <=Q31
>Q30
IntersectionsTotal intersectionsFor each route, a count of intersections with other streets was made, weighting them by the quartiles of all the routes.<=Q13 Q 1 = D n + 1 4 ,   Q 2 = D n + 1 2 ,   Q 3 = D ( 3 n + 1 4 )
D: Set of intersections on the routes.
k: Total number of intersections in D.
n: Total distances of the route from the base of the hill, n = k
>Q1 and <=Q22
>Q2 and <=Q31
>Q30
Type of intersectionsFor each intersection, its type of directionality was determined, favoring one-way directions and fewer intersections. The resulting weighting was adjusted according to the proportion of intersections of that type on the route.Uni * = 13 T o t a l x   S c o r e = i = 1 n P i , x I i , x I t o t a l ,   x
P ( i , x ) : W e i g h t e d   v a l u e   o f   t h e   i n t e r s e c t i o n   o f  route i for type x
I ( i , x ) : N u m b e r   o f   i n t e r s e c t i o n s   o f   t y p e   x   i n     r o u t e   i .
I t o t a l , x : T o t a l   i n t e r s e c t i o n s   o f   t y p e   x   i n   a l l     r o u t e s .
Uni = 23
Bi = 12
Bi = 21
Uni or Bi = 2 or 30
DirectionalityDirectionality of the routeEach route was identified in terms of its directionality.Unidirectional3D = 3     I u n i d i r e c t i o n a l + 0     I b i d i r e c t i o n a l
I ( u n i d i r e c t i o n a l ) : 1   w h e n   t h e   s t r e e t   i s   u n i d i r e c t i o n a l   a n d   0   w h e n   i t   i s   n o t .
I ( b i d i r e c t i o n a l ) : 1   w h e n   t h e   s t r e e t   i s   b i d i r e c t i o n a l   and 0 when it is not .
Bidirectional0
SpeedAverage route speed A 5 m area of influence was defined per route, within which EOD zones were identified. Car trips in Valparaíso were then analyzed to obtain an average distance and speed per zone, which allowed an estimated average speed per route to be calculated.<=Q13Speed = j = 1 m D ( j ) k = 1 P T ( k )
D ( j ) : D i s t a n c e   t r a v e l e d   b y   p e r s o n   j   w h o     t r a v e l s   b y   c a r .
T I ( k ) : T i m e   s p e n t   b y   p e r s o n   k   t r a v e l i n g   b y   c a r .
m: Total number of people traveling by car (for the distances).
p: Total number of people traveling by car (for thetime).
>Q1 and <=Q22
>Q2 and <=Q31
>Q30
* Uni: unidirectional. Bi: bidirectional.
Table A2. Characteristics of the routes for zone 1. Source: elaborated by the authors.
Downhill
IDSlope per Section (%)Total Distance from Metro StationTotal Distance from the Initial Elevation of the HillAverage Distance of the Route SectionsTotal Number of Accidents by Area of Influence of the RouteTotal IntersectionsType of IntersectionsAverage Route Speed
116.431105.71871.8865.06317Uni = 164.62
Uni = 26
Bi = 13
Bi = 21
Uni or Bi = 2 or 31
215.41884.36782.3975.41624Uni = 189.04
Uni = 26
Bi = 15
Bi = 22
Uni or Bi = 2 or 33
311.221258.99586.4689.96914Uni = 1615.51
Uni = 25
Bi = 22
Uni or Bi = 2 or 31
413.351560.03894.0270.931221Uni = 199.17
Uni = 25
Bi = 14
Bi = 21
Uni or Bi = 2 or 32
515.122165.09893.7483.31226Uni = 1118.22
Uni = 29
Bi = 14
Bi = 21
Uni or Bi = 2 or 31
612.571677.741182.9583.921219Uni = 159.92
Uni = 27
Bi = 16
Uni or Bi = 2 or 31
712.981559.32787.0270.9621Uni = 288.42
Bi = 18
Bi = 24
Uni or Bi = 2 or 31
810.561516.661021.86101.151214Uni = 149.24
Uni = 26
Bi = 12
Bi = 21
Uni or Bi = 2 or 31
910.361447.931166.47160.9409Uni = 1120.04
Uni = 23
Bi = 12
Bi = 23
1010.251537.231042.46118.291412Uni = 129.92
Uni = 26
Bi = 11
Bi = 22
Uni or Bi = 2 or 31
Uphill
IDSlope per Section (%)Total Distance from Metro StationTotal Distance from the Initial Elevation of the HillAverage Distance of the Route SectionsTotal Number of Accidents by Area of Influence of the RouteTotal IntersectionsType of IntersectionsAverage Route Speed
116.471552.71780.7164.72624Uni = 1127.36
Uni = 24
Bi = 14
Bi = 21
Uni or Bi = 2 or 33
219.771532.4780.7173621Uni = 1119.62
Uni = 23
Bi = 13
Bi = 21
Uni or Bi = 2 or 33
312.521302.68586.46162.89118Uni = 1211.98
Uni = 24
Bi = 22
418.771704.85953.1777.52722Uni = 1148.17
Uni = 22
Bi = 14
Uni or Bi = 2 or 32
515.721725.2953.1969.03725Bi = 147.04
Uni = 115
Uni = 24
Uni or Bi = 2 or 32
619.142274.391242.4103.421322Uni = 199.02
Uni = 24
Bi = 17
Uni or Bi = 2 or 32
710.851871.34787.0372825Uni = 128.46
Uni = 29
Bi = 17
Bi = 26
Uni or Bi = 2 or 31
819.992054.211021.81136.991215Uni = 188.26
Uni = 22
Bi = 12
Bi = 21
Uni or Bi = 2 or 32
912.291536.811166.42139.76011Uni = 1314.52
Uni = 22
Bi = 12
Bi = 24
1021.142136.591042.45164.411413Uni = 149.17
Uni = 24
Bi = 11
Bi = 22
Uni or Bi = 2 or 32
Table A3. Characteristics of the routes for zone 2. Source: elaborated by the authors.
Bidirectional
IDSlope per Section (%)Total Distance from Metro StationTotal Distance from the Initial Elevation of the HillAverage Distance of the Route SectionsTotal Number of Accidents by Area of Influence of the RouteTotal IntersectionsType of IntersectionsAverage Route Speed
1111.172313.41398.23110.21620Uni = 136.74
Uni = 25
Bi = 17
Bi = 25
126.741528.82616.82109.241413Uni = 256.74
Bi = 13
Bi = 25
Table A4. Characteristics of the routes for zone 3. Source: elaborated by the authors.
Downhill
IDSlope per Section (%)Total Distance from Metro StationTotal Distance from the Initial Elevation of the HillAverage Distance of the Route SectionsTotal Number of Accidents by Area of Influence of the RouteTotal IntersectionsType of IntersectionsAverage Route Speed
1313.063713.582612.767.542353Uni = 1124.8
Uni = 22
Bi = 127
Bi = 27
Uni or Bi = 2 or 35
1412.352603.412099.7786.81629Uni = 1410.67
Uni = 21
Bi = 116
Bi = 28
159.613127.911455.5489.44332Uni = 184.19
Uni = 23
Bi = 114
Bi = 22
Uni or Bi = 2 or 35
Uphill
IDSlope per Section (%)Total Distance from Metro StationTotal Distance from the Initial Elevation of the HillAverage Distance of the Route SectionsTotal Number of Accidents by Area of Influence of the RouteTotal IntersectionsType of IntersectionsAverage Route Speed
1313.163648.272573.1371.561550Uni = 194.34
Uni = 25
Bi = 122
Bi = 28
Uni or Bi = 2 or 36
1412.82567.072127.9691.71728Uni = 1410.67
Uni = 21
Bi = 117
Bi = 26
1510.43140.451455.52104.722728Uni = 114.29
Uni = 211
Bi = 110
Bi = 23
Uni or Bi = 2 or 33

References

  1. Niemann, M.; Braun, K.F.; Otto, E.; Tiefenbrunner, M.; Wüster, J.; Stöckle, U.; Ahmad, S.S.; Märdian, S.; Graef, F. Dangers of E-Mobility: A Systematic Review and Meta-Analysis of Sustained Injury Patterns and Injury Severity. Saf. Sci. 2023, 167, 106283. [Google Scholar] [CrossRef]
  2. Uluk, D.; Lindner, T.; Palmowski, Y.; Garritzmann, C.; Göncz, E.; Dahne, M.; Möckel, M.; Gerlach, U.A. E-Scooter: Erste Erkenntnisse über Unfallursachen und Verletzungsmuster. Notf. Rettungsmed. 2020, 23, 293–298. [Google Scholar] [CrossRef]
  3. Germany Federal Ministry of Justice Road Traffic Act (Straßenverkehrsgesetz) (Section 7–20). Available online: https://www.gesetze-im-internet.de/englisch_stvg/englisch_stvg.html (accessed on 3 September 2024).
  4. Ministerie van Binnenlandse Zaken en Koninkrijksrelaties Regeling Voertuigen. Available online: https://wetten.overheid.nl/BWBR0025798/2018-05-20 (accessed on 3 September 2024).
  5. Consumer Product Safety Commission Electric Bicycles; Advance Notice of Proposed Rulemaking; Request for Comments and Information. Available online: https://www.federalregister.gov/documents/2024/03/15/2024-05472/electric-bicycles-advance-notice-of-proposed-rulemaking-request-for-comments-and-information (accessed on 3 September 2024).
  6. Ministry of Transportation and Infrastructure. E-Bike Rules of the Road—Province of British Columbia. Available online: https://www2.gov.bc.ca/gov/content/transportation/driving-and-cycling/cycling/e-bike-rules-of-the-road (accessed on 3 September 2024).
  7. Conselho Nacional de Trânsito. Resolução No 465, de 27 de Novembro de 2013; Contran: Brasília, Brasil, 2009. [Google Scholar]
  8. Ministerio de Vivienda y Urbanismo. Vialidad Ciclo-Inclusiva; Serie Espacios Públicos Urbanos; Ministerio de Vivienda y Urbanismo: Santiago, Chile, 2015. [Google Scholar]
  9. Bici Cosas Cicletada a Lo Vásquez, Todo lo Que Necesitas Saber—Bicicosas. Available online: https://www.bicicosas.cl/cicletada-a-lo-vasquez-todo-lo-que-necesitas-saber/ (accessed on 3 September 2024).
  10. Estación Chile e-Bike Tour 7 Cerros de Valparaiso. Available online: https://www.estacionchile.cl/detalle-tour.php?tour=74 (accessed on 3 September 2024).
  11. Instituto Nacional de Estadísticas Instituto Nacional de Estadísticas | REDATAM Procesamiento y Diseminación. Available online: https://redatam.org/ (accessed on 24 April 2024).
  12. Fernandes, V.A.; Tirado, H.M. Sustainable Mobility in Valparaíso, Chile, and its Relationship with Topography and Socio-Spatial Conditions. J. Sustain. Sci. Manag. 2021, 16, 122–134. [Google Scholar] [CrossRef]
  13. Aprigliano, V.; Toro, C.; Rojas, G.; Barros, G.; Fukushi, M.; Seriani, S. Effects of the Built Environment and Sociodemographic Factors on Accessibility in the City of Valparaíso, Chile. J. Transp. Geogr. 2024, 118, 103931. [Google Scholar] [CrossRef]
  14. Aprigliano, V.; Seriani, S.; Toro, C.; Rojas, G.; Fukushi, M.; Cardoso, M.; Silva, M.A.V.D.; Cucumides, C.; De Oliveira, U.R.; Henríquez, C.; et al. Built Environment Effect on Metro Ridership in Metropolitan Area of Valparaíso, Chile, under Different Influence Area Approaches. ISPRS Int. J. Geo-Inf. 2024, 13, 266. [Google Scholar] [CrossRef]
  15. United Nations. THE 17 GOALS|Sustainable Development. Available online: https://sdgs.un.org/goals (accessed on 3 September 2024).
  16. Bunyamin, W.M.H.W.; Baharom, R.; Munim, W.N.W.A. Wireless Battery Charger with Power Factor Correction for Electric Bike. In Proceedings of the 2023 IEEE Industrial Electronics and Applications Conference (IEACon), Penang, Malaysia, 6 November 2023; IEEE: New York, NY, USA, 2023; pp. 139–144. [Google Scholar]
  17. Yasir, A.; Hu, X.; Ahmad, M.; Alvarado, R.; Anser, M.K.; Işık, C.; Choo, A.; Ausaf, A.; Khan, I.A. Factors Affecting Electric Bike Adoption: Seeking an Energy-Efficient Solution for the Post-COVID Era. Front. Energy Res. 2022, 9, 817107. [Google Scholar] [CrossRef]
  18. Salmeron-Manzano, E.; Manzano-Agugliaro, F. The Electric Bicycle: Worldwide Research Trends. Energies 2018, 11, 1894. [Google Scholar] [CrossRef]
  19. Biblioteca del Congreso Nacional de Chile Ley 21088|Modifica la Ley de Tránsito para Incorporar Disposiciones sobre Convivencia de los Distintos Medios de Transporte. Available online: https://www.bcn.cl/leychile/navegar?idNorma=1118358 (accessed on 26 November 2024).
  20. Güldü, E.; Kuşçu Şimşek, Ç.; Selim, S. A Study on the Improvement of Bicycle Transportation in Sivas City Using Hybrid Multi-Criteria Model Based Network Analysis. Env. Dev. Sustain. 2024. [Google Scholar] [CrossRef]
  21. Hsu, T.P.; Lin, Y.T. A Model for Planning a Bicycle Network with Multi-Criteria Suitability Evaluation Using GIS. In WIT Transactions on Ecology and the Environment; WIT Press: Southampton, UK, 2011; Volume 148, pp. 243–252. [Google Scholar] [CrossRef]
  22. Ryu, S.; Chen, A.; Su, J.; Choi, K. A Multi-Class, Multi-Criteria Bicycle Traffic Assignment Model. Int. J. Sustain. Transp. 2021, 15, 524–540. [Google Scholar] [CrossRef]
  23. Pais, F.; Monteiro, J.; Sousa, N.; Coutinho-Rodrigues, J.; Natividade-Jesus, E. A Multicriteria Methodology for Maintenance Planning of Cycling Infrastructure. Proc. Inst. Civ. Eng. Eng. Sustain. 2022, 175, 248–264. [Google Scholar] [CrossRef]
  24. Chondrogianni, D.; Stephanedes, Y.J.; Fatourou, P. Assessing Cycling Accessibility in Urban Areas through the Implementation of a New Cycling Scheme. Sustainability 2023, 15, 14472. [Google Scholar] [CrossRef]
  25. Nematchoua, M.; Deuse, C.; Cools, M.; Reiter, S. Evaluation of the Potential of Classic and Electric Bicycle Commuting as an Impetus for the Transition towards Environmentally Sustainable Cities: A Case Study of the University Campuses in Liege, Belgium. Renew. Sustain. Energy Rev. 2020, 119, 109544. [Google Scholar] [CrossRef]
  26. Brand, C.; Dons, E.; Anaya-Boig, E.; Avila-Palencia, I.; Clark, A.; De Nazelle, A.; Gascon, M.; Gaupp-Berghausen, M.; Gerike, R.; Götschi, T.; et al. The Climate Change Mitigation Effects of Daily Active Travel in Cities. Transp. Res. Part D Transp. Environ. 2021, 93, 102764. [Google Scholar] [CrossRef]
  27. Hrncir, J.; Zilecky, P.; Song, Q.; Jakob, M. Practical Multicriteria Urban Bicycle Routing. IEEE Trans. Intell. Transport. Syst. 2017, 18, 493–504. [Google Scholar] [CrossRef]
  28. Tal, I.; Olaru, A.; Muntean, G.-M. eWARPE—Energy-Efficient Weather-Aware Route Planner for Electric Bicycles. In Proceedings of the 2013 21st IEEE International Conference on Network Protocols (ICNP), Goettingen, Germany, 7–10 October 2013; IEEE: New York, NY, USA, 2013; pp. 1–6. [Google Scholar]
  29. Behrendt, F. Cycling the Smart and Sustainable City: Analyzing EC Policy Documents on Internet of Things, Mobility and Transport, and Smart Cities. Sustainability 2019, 11, 763. [Google Scholar] [CrossRef]
  30. Meireles, M.; Ribeiro, P.J.G. Digital Platform/Mobile App to Boost Cycling for the Promotion of Sustainable Mobility in Mid-Sized Starter Cycling Cities. Sustainability 2020, 12, 2064. [Google Scholar] [CrossRef]
  31. Oliveira, F.; Nery, D.; Costa, D.G.; Silva, I.; Lima, L. A Survey of Technologies and Recent Developments for Sustainable Smart Cycling. Sustainability 2021, 13, 3422. [Google Scholar] [CrossRef]
  32. Đerek, J.; Sikora, M. Bicycle Route Planning Using Multiple Criteria GIS Analysis. In Proceedings of the 2019 International Conference on Software, Telecommunications and Computer Networks (SoftCOM), Split, Croatia, 19–21 September 2019; IEEE: New York, NY, USA, 2019; pp. 1–5. [Google Scholar]
  33. Hrncir, J.; Song, Q.; Zilecky, P.; Nemet, M.; Jakob, M. Bicycle Route Planning with Route Choice Preferences. Front. Artif. Intell. Appl. 2014, 263, 1149–1154. [Google Scholar] [CrossRef]
  34. Lopez-Escolano, C.; Campos, A.P.; Pardos, S.V.; Nedeliakova, E.; Stefancova, V. Incorporating Bicycles into Urban Mobility: An Opportunity for Sustainable Development. Komunikácie 2017, 19, 68–73. [Google Scholar] [CrossRef]
  35. Maltese, I.; Gatta, V.; Marcucci, E. Active Travel in Sustainable Urban Mobility Plans. An Italian Overview. Res. Transp. Bus. Manag. 2021, 40, 100621. [Google Scholar] [CrossRef]
  36. Pritchard, R. Revealed Preference Methods for Studying Bicycle Route Choice—A Systematic Review. IJERPH 2018, 15, 470. [Google Scholar] [CrossRef] [PubMed]
  37. De Jong, T.; Böcker, L.; Weber, C. Road Infrastructures, Spatial Surroundings, and the Demand and Route Choices for Cycling: Evidence from a GPS-Based Mode Detection Study from Oslo, Norway. Environ. Plan. B Urban. Anal. City Sci. 2023, 50, 2133–2150. [Google Scholar] [CrossRef]
  38. Saplıoğlu, M.; Aydın, M.M. Choosing Safe and Suitable Bicycle Routes to Integrate Cycling and Public Transport Systems. J. Transp. Health 2018, 10, 236–252. [Google Scholar] [CrossRef]
  39. Đerek, J.; Sikora, M.; Kraljević, L.; Russo, M. Using Neural Networks for Bicycle Route Planning. Appl. Sci. 2021, 11, 10065. [Google Scholar] [CrossRef]
  40. Perger, T.; Auer, H. Energy Efficient Route Planning for Electric Vehicles with Special Consideration of the Topography and Battery Lifetime. Energy Effic. 2020, 13, 1705–1726. [Google Scholar] [CrossRef]
  41. Milakis, D.; Athanasopoulos, K.; Vafeiadis, E.; Vasileiadis, K.; Vlastos, T. Planning of the Athens Metropolitan Cycle Network Using Participative Multicriteria Gis Analysis. Procedia Soc. Behav. Sci. 2012, 48, 816–826. [Google Scholar] [CrossRef]
  42. Beukes, E.; Vanderschuren, M.; Zuidgeest, M.; Brussel, M. Creating Liveable Neighborhoods through Context-Sensitive Multimodal Road Planning. Transp. Res. Rec. 2011, 2244, 27–33. [Google Scholar] [CrossRef]
  43. Jiménez, P.; Calatrava, M. Cycle Lane Network to Connect the Different Campuses of Technical University of Cartagena (Spain). In Proceedings of the 11th International Conferenceth on Urban Regeneration and Sustainability (SC 2016), Alicante, Spain, 12 July 2016; Volume 204, pp. 765–775. [Google Scholar]
  44. Grisé, E.; El-Geneidy, A. If We Build It, Who Will Benefit? A Multi-Criteria Approach for the Prioritization of New Bicycle Lanes in Quebec City, Canada. J. Transp. Land Use 2018, 11, 217–235. [Google Scholar] [CrossRef]
  45. Zagorskas, J.; Turskis, Z. Setting Priority List for Construction Works of Bicycle Path Segments Based on Eckenrode Rating and ARAS-F Decision Support Method Integrated in GIS. Transport 2020, 35, 179–192. [Google Scholar] [CrossRef]
  46. Santos, B.; Passos, S.; Gonçalves, J.; Matias, I. Spatial Multi-Criteria Analysis for Road Segment Cycling Suitability Assessment. Sustainability 2022, 14, 9928. [Google Scholar] [CrossRef]
  47. Milakis, D.; Athanasopoulos, K. What about People in Cycle Network Planning? Applying Participative Multicriteria GIS Analysis in the Case of the Athens Metropolitan Cycle Network. J. Transp. Geogr. 2014, 35, 120–129. [Google Scholar] [CrossRef]
  48. Zuo, T.; Wei, H. Bikeway Prioritization to Increase Bicycle Network Connectivity and Bicycle-Transit Connection: A Multi-Criteria Decision Analysis Approach. Transp. Res. Part A Policy Pract. 2019, 129, 52–71. [Google Scholar] [CrossRef]
  49. Fitch, D.T.; Handy, S.L. Road Environments and Bicyclist Route Choice: The Cases of Davis and San Francisco, CA. J. Transp. Geogr. 2020, 85, 102705. [Google Scholar] [CrossRef]
  50. Hardinghaus, M.; Papantoniou, P. Evaluating Cyclists’ Route Preferences with Respect to Infrastructure. Sustainability 2020, 12, 3375. [Google Scholar] [CrossRef]
  51. Desjardins, E.; Higgins, C.D.; Scott, D.M.; Apatu, E.; Páez, A. Using Environmental Audits and Photo-Journeys to Compare Objective Attributes and Bicyclists’ Perceptions of Bicycle Routes. J. Transp. Health 2021, 22, 101092. [Google Scholar] [CrossRef]
  52. Liu, Y.; Yang, D.; Timmermans, H.J.P.; De Vries, B. Differences in Street-Scale Built Environment Preferences towards Biking: A Latent Class Analysis of Stated Choice Data. Int. J. Urban. Sustain. Dev. 2021, 13, 706–714. [Google Scholar] [CrossRef]
  53. Özkan, S.P. Kentsel Alanda CBS Kullanarak Bisiklet Altyapısı Rota Planlaması: İzmir Örneği. Planning 2020, 30, 41275. [Google Scholar] [CrossRef]
  54. Baeva, S.; Shterev, V.; Stoimenov, E.; Hinov, N. Risk Assessment and Route Optimization for Life and Health Self-Keeping during e-Cycling. In AIP Conference Proceedings; AIP Publishing: Sozopol, Bulgaria, 2019. [Google Scholar]
  55. Baeva, S.; Shterev, V.; Yochev, K.; Hinov, N. Route Optimization for Long Durability Battery Life during E-Bike Cycling. In AIP Conference Proceedings; AIP Publishing: Sozopol, Bulgaria, 2019; p. 080017. [Google Scholar]
  56. Bi, H.; Shang, W.-L.; Chen, Y.; Wang, K.; Yu, Q.; Sui, Y. GIS Aided Sustainable Urban Road Management with a Unifying Queueing and Neural Network Model. Appl. Energy 2021, 291, 116818. [Google Scholar] [CrossRef]
  57. CEDEUS. Área Metropolitana de Valparaíso. Available online: https://indicadores.cedeus.cl/ciudad/16 (accessed on 12 September 2024).
  58. Biblioteca del Congreso Nacional de Chile. Reportes Estadísticos 2024 de Valparaíso. Biblioteca Del Congreso Nacional de Chile. Available online: https://www.bcn.cl/siit/reportescomunales/comunas_v.html?anno=2024&idcom=5101 (accessed on 23 September 2024).
  59. Ministerio de Transporte y Telecomunicaciones. Mapa de Recorrido de Buses, Trolebuses y Estaciones de Metro En Valparaíso 2014. Valparaíso, Chile. Available online: https://www.subtrans.gob.cl/region-de-valparaiso.html (accessed on 3 March 2024).
  60. Biblioteca del Congreso Nacional de Chile. Clima y Vegetación Región de Valparaíso. Available online: https://www.bcn.cl/siit/nuestropais/region5/clima.htm (accessed on 23 September 2024).
  61. BioBio Chile. Advierten Llegada de Sistema Frontal a la Región de Valparaíso: Se Esperan Hasta 100 mm de Agua. Available online: https://www.biobiochile.cl/noticias/nacional/region-de-valparaiso/2024/06/11/advierten-llegada-de-sistema-frontal-a-la-region-de-valparaiso-se-esperan-hasta-100-mm-de-agua.shtml (accessed on 23 September 2024).
  62. BioBio Chile. Región de Valparaíso se Prepara Para Recibir dos Sistemas Frontales Esta Semana: Hay Alerta Preventiva. Available online: https://www.biobiochile.cl/noticias/nacional/region-de-valparaiso/2024/06/17/region-de-valparaiso-se-prepara-para-recibir-dos-sistemas-frontales-esta-semana-hay-alerta-preventiva.shtml (accessed on 23 September 2024).
  63. Diario UChile Declaran Alerta Roja para las Provincias de Valparaíso y Marga Marga por Lluvias. Available online: https://radio.uchile.cl/2024/06/21/declaran-alerta-roja-para-las-provincias-de-valparaiso-y-marga-marga-por-lluvias/ (accessed on 23 September 2024).
  64. Garmin Garmin Connect. Available online: https://connect.garmin.com/modern/home (accessed on 26 November 2024).
  65. IDE Geoportal de Chile—DEM Alos Palsar Región de Valparaíso 2024. Ministerio de Bienes Nacionales. Santiago. Available online: https://www.geoportal.cl/catalog (accessed on 20 April 2024).
  66. Ministerio de Vivienda y Urbanismo. Decreto 47 FIJA Nuevo Texto de la Ordenanza General de la Ley General de Urbanismo y Construcciones; MINVU: Santiago, Chile, 1992. [Google Scholar]
  67. CONASET Portal de Información Geoespacial CONASET 2024. Santiago, Chile. Available online: https://mapas-conaset.opendata.arcgis.com (accessed on 25 May 2024).
  68. Saaty, R.W. The Analytic Hierarchy Process—What It Is and How It Is Used. Math. Model. 1987, 9, 161–176. [Google Scholar] [CrossRef]
  69. Matias, I.; Virtudes, A. Bicycle Solutions in Mountain Cities: CycloCable® in Trondheim-Norway. IOP Conf. Ser. Mater. Sci. Eng. 2019, 603, 022024. [Google Scholar] [CrossRef]
  70. SECTRA Encuestas de Movilidad. Available online: https://www.sectra.gob.cl/encuestas_movilidad/encuestas_movilidad.htm (accessed on 30 May 2024).
Figure 1. Slope map of the city of Valparaíso, indicating areas with slopes greater than and less than 6%. Source: elaborated by the authors.
Ijgi 14 00038 g001
Figure 2. Conditions of the streets in Valparaíso. (a) Templeman Street, between Lautaro Rosas and San Enrique, heading north; (b) Templeman, between Lautaro Rosas and San Enrique, heading south; (c) Urriola. Date: 25 April 2024. Source: elaborated by the authors.
Ijgi 14 00038 g002
Figure 3. Transport contextualization of Valparaiso’s urban limits. Source: elaborated by the authors.
Ijgi 14 00038 g003
Figure 4. Zoning established to separate the routes. Source: elaborated by the authors.
Ijgi 14 00038 g004
Figure 5. Type of intersections. (a) One intersection, for its type and weighting, is considered if it is unidirectional or bidirectional. (b) Two intersections, for their type and weighting, are considered if both are unidirectional or bidirectional. (c) Three intersections. Source: elaborated by the authors.
Ijgi 14 00038 g005
Figure 6. Uphill and downhill routes registered in zone 1. (A) Uphill direction; (B) downhill direction. Source: elaborated by the authors.
Ijgi 14 00038 g006
Figure 7. Bidirectional routes registered in zone 2. Source: elaborated by the authors.
Ijgi 14 00038 g007
Figure 8. Uphill and downhill routes registered in zone 3. (A) Uphill direction; (B) downhill direction. Source: elaborated by the authors.
Ijgi 14 00038 g008
Figure 9. Topographic profile of the route on which the experiment was carried out. Source: elaborated by the authors.
Ijgi 14 00038 g009
Figure 10. Metrics obtained from the sensors and instruments used in the experiments. Time and distance were obtained using the GPS and speed using a Garmin speed sensor. Source: elaborated by the authors.
Ijgi 14 00038 g010
Figure 11. Respondents’ responses to the survey section related to the perception of comfort and safety of each bicycle. Source: elaborated by the authors.
Ijgi 14 00038 g011
Figure 12. Respondents’ responses to the survey section related to physical effort and the ease of use of each bike. Source: elaborated by the authors.
Ijgi 14 00038 g012
Table 1. Essential factors to consider when implementing and planning cycle paths. Source: elaborated by the authors.
FactorsContextualizationSource
Connectivity and AccessibilityEnsure that cycle paths are connected to other modes of transport, maximizing accessibility, and facilitating intermodality.[47,48]
Departure TimeAdjust the departure time to avoid heavy traffic and adverse weather conditions and optimize the energy consumption on electric bikes.[28,40]
TopographyAssessment of road slopes, a critical factor in cities with uneven terrain, is especially important for the viability of electric bicycle routes.[24,32,33,38,40,46]
Road SafetyFocus on reducing the risks for cyclists by assessing the intersection density, traffic volume and speed, and the presence of safe infrastructure and identifying areas with a high risk of accidents to avoid dangerous routes and ensure the safety of cyclists, both on regular and electric bikes.[38,49,50]
Cycling InfrastructureEmphasis is placed on the need for dedicated, high-quality cycle paths to ensure safety and comfort, which is essential for cyclists’ route selection. Choosing main roads that offer better maintenance, reduced exposure to traffic conflicts (e.g., intersections), and safety is especially important for e-bikes due to their sensitivity to uneven surfaces.[32,37,38,51,52]
Environmental and Urban ConditionsThis includes consideration of green areas, landscaping, and air quality along the routes, improving the experience, and encouraging the use of bicycles.[23,49,53]
Travel TimeConsider total travel time to select faster and more efficient routes, taking into account distance, obstacles, and elevation changes.[27,33]
Multimodal IntegrationThis promotes the integration of cycle paths with public transport stations, facilitating the combined use of bicycles and public transport.[43,48]
Weather Conditions and ClimateConsider the effects of weather, such as rain, wind, and temperature, which can affect the safety and comfort of cyclists, especially for e-bike users.[28,40,52,54,55]
Demand and Potential UseAssess projected demand and user profiles to ensure that cycle paths meet the needs of those who depend on them most.[44,45]
Rider ComfortConsider pavement quality, road width, directionality, and the presence of obstacles to ensure a safe and comfortable cycling experience.[23,27,33,52]
Costs and Economic ViabilityAnalyze the cost of implementing and maintaining cycle paths to ensure that resources are used efficiently, balancing the benefits and investments.[43,45]
Energy CostAssessment of the energy consumption along routes is required, considering energy regeneration during braking and energy efficiency in electric bicycles.[18,56]
Table 2. Names of the hills located in the areas designated for viewing the routes. Source: elaborated by the authors.
ZoneHill Name
1ArrayánYungay
AlegreFlorida
ConcepciónCordillera
CárcelBellavista
La LomaSan Juan de Dios
2MariposaMonjas
La Cruz
3BarónPlaceres
LecherosRamaditas
LarraínRodelillo
PolancoO’Higgins
Table 3. Main characteristics of the routes.
ZoneIDStreet NameMetro StationRoute typeDirectionality
11Almirante Montt PuertoDual routeOne-Way
2Almirante Montt BellavistaDual routeOne-Way
3CarampanguePuertoDual routeBidirectional
4Cumming BellavistaDual routeOne-Way
5Cumming PuertoDual routeOne-Way
6Ecuador/CummingBellavistaDual routeBidirectional
7FerrariBellavistaDual routeBidirectional
8Guillermo RiveraBellavistaDual routeBidirectional
9Tomás RamosPuertoDual routeBidirectional
10Yerbas BuenasBellavistaDual routeBidirectional
211BaquedanoFranciaRound trip Bidirectional
12FranciaFranciaRound trip Bidirectional
313BarónBarónDual routeBidirectional
14Placeres/MattaPortalesDual routeBidirectional
15WashingtonBarónDual routeBidirectional
Table 4. Descriptive measures of downhill, uphill, and bidirectional routes. Source: elaborated by the authors.
Downhill
StatsMeanStdMin25%50%75%Max
Slope per section (%)12.727.010.717.3411.3316.4342
Total distance from metro station1935.237721105.711516.661560.032165.093713.58
Total distance from the initial elevation of the hill1184.4573.14586.46871.881021.861182.952612.7
Average distance of the route sections83.0689.020.635.7960.497.6788.27
Total number of accidents by area of influence of the route12.9210.7906121443
Total intersections22.3811.41914212653
Directionality of the route [Uni = 1]6.423.371468.2512
Directionality of the route [Uni = 2]5.082.2913669
Directionality of the route [Bi = 1]7.677.6912.754.59.527
Directionality of the route [Bi = 2]2.832.371123.258
Directionality of the route [Uni or Bi = 2 or 3]21.611112.55
Average route speed9.524.344.198.229.179.9220.04
Uphill
StatsMeanStdMin25%50%75%Max
Slope per section (%)15.18.5408.8713.5120.2642
Total distance from metro station2080.54686.191302.681552.711871.342274.393648.27
Total distance from the initial elevation of the hill1190.07569.39586.46787.031021.811242.42573.13
Average distance of the route sections91.4197.970.635.5962.2106.95788.27
Total number of accidents by area of influence of the route10.236.50781327
Total intersections22.4610.5815222550
Directionality of the route [Uni = 1]7.234.851381115
Directionality of the route [Uni = 2]4.232.83124411
Directionality of the route [Bi = 1]6.926.4912.7547.7522
Directionality of the route [Bi = 2]3.42.511.252.55.58
Directionality of the route [Uni or Bi = 2 or 3]2.51.0812235
Average route speed8.682.794.297.368.469.6214.52
Bidirectional
StatsMeanStdMin25%50%75%Max
Slope per section (%)9.48.98045.361030.64
Total distance from metro station1921.1554.781528.821724.961921.12117.252313.4
Total distance from the initial elevation of the hill1007.53552.53616.82812.171007.531202.881398.23
Average distance of the route sections109.81137.011.4438.9966.87117.4620.63
Total number of accidents by area of influence of the route151.411414.51515.516
Total intersections16.54.951314.7516.518.2520
Directionality of the route [Uni = 1]3-33333
Directionality of the route [Uni = 2]5055555
Directionality of the route [Bi = 1]52.8334567
Directionality of the route [Bi = 2]5055555
Average route speed6.7406.746.746.746.746.74
Table 5. Criteria and corresponding weights in the AHP model. Source: elaborated by the authors.
CriteriaWeight
Speed0.4681
Directionality0.1741
Intersections0.159
Traffic accidents0.0996
Distance0.0534
Average slope0.0458
Table 6. Professional profiles of the participants. Source: elaborated by the authors.
Professional RoleAverage Work Experience (Years)Total Experts
FemaleMale
Academic15.015.56 (43%)
Private System Professional-7.03 (21%)
Private System Professional, Postgraduate Student (Master’s or Doctorate)-7.02 (14%)
Public System Professional-4.02 (14%)
Public System Professional, Postgraduate Student (Master’s or Doctorate)24.0-1 (7%)
Total Experts3 (21%)11 (79%)14 (100%)
Table 7. Results of the routes’ scores when evaluating them using the criteria established in Table 5 and Table A1 in Appendix A. Source: elaborated by the authors.
IDStreet NameMetro StationUphillDownhillBidireccional
1Almirante MonttPuerto7.066.56-
2Almirante MonttBellavista6.035.75-
3CarampanguePuerto3.275.25-
4CummingBellavista8.036.47-
5CummingPuerto9.41 (↑)9.49 (↑)-
6Ecuador/CummingBellavista5.274.93-
7FerrariFrancia4.94.58-
8Guillermo RiveraBellavista4.294.85-
9Tomás RamosPuerto2.44 (↓)2.17 (↓)-
10Yerbas BuenasBellavista3.583.4-
11BaquedanoFrancia--4.08 (↑)
12FranciaFrancia--3.87 (↓)
13BarónBarón6.777.91-
14Placeres/MattaPortales4.314.02-
15WashingtonBarón5.175.35-
Significance codes: (↑) weighted maximum, (↓) weighted minimum.
Disclaimer/Publisher’s Note: The statements, opinions and data contained in all publications are solely those of the individual author(s) and contributor(s) and not of MDPI and/or the editor(s). MDPI and/or the editor(s) disclaim responsibility for any injury to people or property resulting from any ideas, methods, instructions or products referred to in the content.

