Article

Marijuana Dispensary Locations and Neighborhood Characteristics in New York City

1
Department of Urban and Regional Planning, University at Buffalo, Buffalo, NY 14260, USA
2
Department of Geography, University at Buffalo, Buffalo, NY 14260, USA
3
School of Social Work, University at Buffalo, Buffalo, NY 14260, USA
*
Author to whom correspondence should be addressed.
ISPRS Int. J. Geo-Inf. 2025, 14(1), 4; https://doi.org/10.3390/ijgi14010004
Submission received: 24 October 2024 / Revised: 16 December 2024 / Accepted: 26 December 2024 / Published: 27 December 2024

Abstract

:
New York State (NYS) passed the Marijuana Regulation and Taxation Act (MRTA) in March of 2021 to legalize adult-use recreational cannabis that allows for its distribution, retail sale, and on-site consumption in licensed businesses. While the state (NYS) has imposed some spatial constraints on the dispensaries’ locations, it is unclear what the current spatial patterns of those dispensaries are and how they impact neighborhoods. This research explores how recreational cannabis relates spatially to neighborhood characteristics using New York City as a case study. We identified how cannabis stores are spatially correlated with neighborhood attributes, including socio-demographic and land use characteristics. Our results from the compliance check showed that the highest noncompliance rate existed in block groups where dispensaries were located in relation to schools. The results from the spatial statistics suggest that dispensaries tended to be located near adult businesses that are not considered in existing buffering requirements. Our research allows policymakers to better understand the social and spatial impacts of recreational cannabis distribution to minimize negative effects on residential areas, schools, and other sensitive locations.

1. Introduction

New York State passed the Marijuana Regulation and Taxation Act (MRTA) in March 2021, which legalized adult-use recreational cannabis and allowed for its distribution, retail sale, and on-site consumption in licensed businesses. The passage of the MRTA followed a trend across the country where twenty-four states have legalized adult-use recreational cannabis since 2012 (At the time this article was written, the following states had passed legislation decriminalizing the recreational use of cannabis: Alaska, Arizona, California, Colorado, Connecticut, Delaware, Illinois, Maine, Maryland, Massachusetts, Michigan, Minnesota, Missouri, Montana, Nevada, New Jersey, New Mexico, New York, Ohio, Oregon, Rhode Island, Vermont, Virginia, and Washington. In addition to these states, the recreational use of cannabis was decriminalized in the District of Columbia and the territory of Guam). Although legislative provisions vary across these jurisdictions, they have the combined effect of decriminalizing recreational cannabis for 54% of the U.S. population. Together with other states that have enacted laws to legalize recreational cannabis, New York’s experience with siting recreational cannabis dispensaries underscores the importance of considering the impacts of these businesses on the neighborhoods where they are located.
The MRTA created a regulatory structure for the creation of New York state’s cannabis industry, encompassing the cultivation, processing, distribution, and retail sales of marijuana. The structure of the state’s cannabis industry mirrors its liquor industry. For instance, it provides for the licensing of businesses and places restrictions on vertical integration within the industry. Like the liquor industry, New York’s cannabis industry also delegates decisions about retail sales and the siting of cannabis businesses to local municipalities [1]. Towns, cities, and villages are permitted to opt out of permitting cannabis dispensaries under MRTA. Silverman et al. [2] found that 49% of the municipalities in New York State opted out of permitting cannabis dispensaries, and places that opted in had large clusters of Black and Hispanic residents [2]. Similar patterns of municipalities opting in and opting out were found by researchers in other states [3,4,5]. Much of the regulatory authority for the siting of recreational cannabis businesses falls under local land use and zoning rules.
This research explores how recreational cannabis relates spatially to neighborhood characteristics using New York City as a case study. New York City was selected as a case study because it is the largest municipality in the state and is emblematic of the type of place that opted in to allow recreational cannabis dispensaries to operate. These places tend to be urban areas with clusters of Black and Hispanic residents. New York City imposed spatial constraints on the locations of cannabis dispensaries, which mirror the types of zoning and land use regulations already imposed for liquor stores, bars, and other adult businesses. However, it is unclear what the current spatial patterns of cannabis dispensaries are and how they impact neighborhood quality of life.
This study applies visualization and spatial clustering analysis to better understand patterns of spatial variation in recreational cannabis businesses [6]. The results provide evidence for the degree to which marijuana dispensaries are disproportionately located in areas with greater disadvantages. Our research allows policymakers to better understand the social and spatial impacts of recreational cannabis dispensaries and design thoughtful and equitable license allocation procedures and policies with spatial patterns and social impacts in consideration.

2. Literature Review

2.1. Recreational Marijuana Dispensary Location and Neighborhood Characteristics

Despite the recent trend toward decriminalization, marijuana has carried a social stigma in the United States for almost a century. In large part, this stigma originated with the film Reefer Madness [7]. Marijuana use has been linked to stereotypes about race, criminality, and the drug counterculture [8,9]. The stigma associated with marijuana lowers the public’s willingness to accept cannabis businesses in a legalized and regulated context. Instead, this type of business is regulated in a manner that mirrors other establishments associated with social dysfunction and vice. The literature suggests that after legalization, cannabis businesses are regulated to the urban fringe through local land use and zoning ordinances in a similar manner to methadone clinics, homeless shelters, strip clubs, liquor stores, and other unwanted land uses [1,2]. The adoption of restrictive land use regulations has produced an uneven geography where cannabis businesses end up clustering in economically disenfranchised Black and Brown communities [10].
Many states have established their own policies and regulations concerning marijuana even though the Controlled Substances Act of 1970 made marijuana use and possession illegal in the United States under federal law. In states where recreational cannabis has been decriminalized, the decisions about retail sales and the siting of cannabis businesses are delegated to local municipalities. Much of this regulatory authority falls under local land use and zoning rules. Using local land use and zoning regulations, municipalities hold wide latitude in regulating the location and placing other restrictions on the operation of these businesses [1]. Some studies found that due to local land use and zoning policies, recreational cannabis businesses tended to be located in neighborhoods with higher poverty levels, greater minority concentrations, higher crime rates, and concentrations of other unwanted land uses [1,11,12,13,14,15,16].
Although one goal of recreational marijuana legalization across states is to promote social and economic equity, researchers have found mixed evidence for the achievement of this goal [1,2,4]. Among other outcomes, some studies have found higher rates of marijuana use in communities typically targeted for social equity benefits after dispensaries began to receive licenses [17,18,19,20]. The association between residential proximity to businesses that sell controlled substances and substance abuse is consistent with similar research on alcohol and tobacco [21,22,23,24]. Since the land use and zoning policies for cannabis businesses in NYC mirror those that apply to alcohol and tobacco retailers, cannabis dispensaries are predicted to cluster in areas already saturated with liquor stores, smoke shops, and related businesses, further exacerbating related health disparities [25].

2.2. Spatial Visualization and Analysis
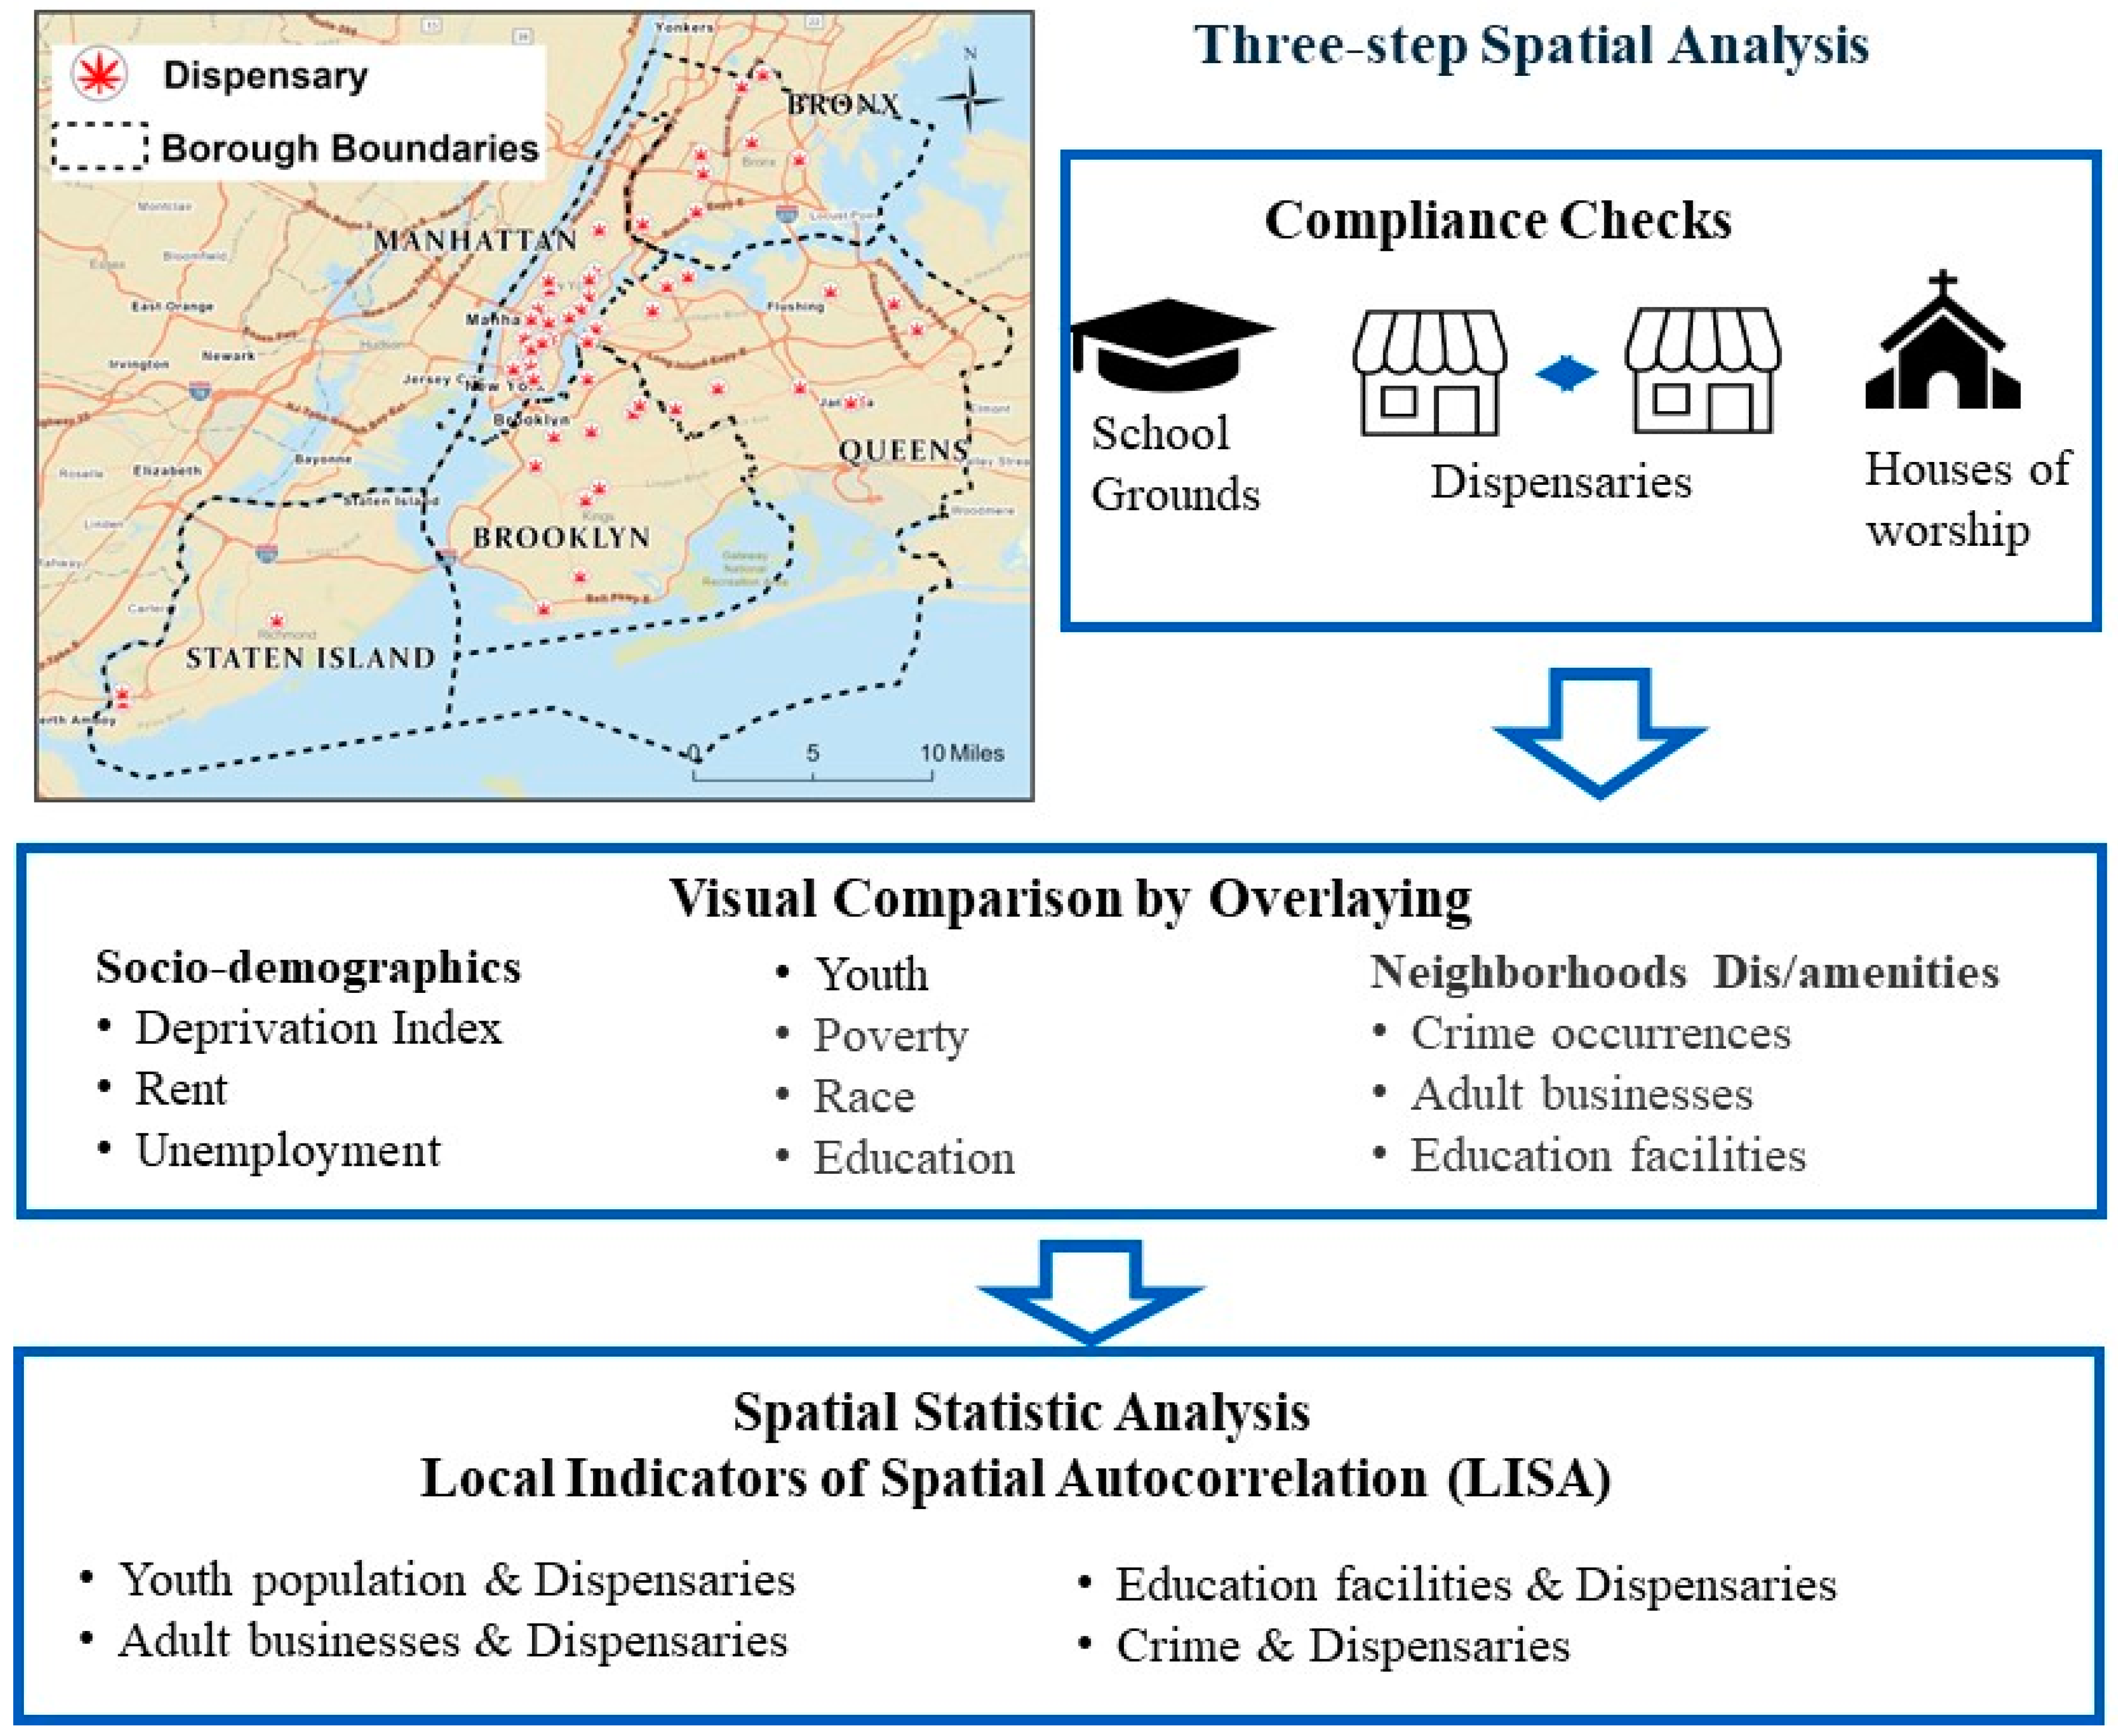
Overlaying spatial layers using GIS has been used to visualize and integrate various data, such as land use and points of interest, to gain insights into their spatial distribution [26,27,28,29,30]. This approach also aids in understanding the spatial distribution of the specific items of interest, such as hotels, restaurants, or abandoned houses, related to neighborhood characteristics, including the socio-demographic aspects and neighborhood amenities and disamenities [31,32,33].
Identifying local patterns of spatial association has long been a key focus in exploratory data analysis [6,34]. Local Indicators of Spatial Association (LISA) have been used to detect and evaluate spatial autocorrelation in geographical data by measuring the similarity between neighboring spatial units in fields such as health geography and epidemiology [35,36] and urban planning [6,37,38,39]. This method decomposes global indicators into the individual contribution of each observation, helping to identify clusters of similar or dissimilar values for analyzing spatial patterns [34]. Bivariate LISA statistics, a variant of the traditional LISA approach, specifically focus on binary spatial data [32,40] and have been used to analyze spatial patterns where the data can be classified into two distinct categories, such as building year and building heights [33] or revenues and neighborhood deprivation scores.
These studies provide a rationale for using overlaying and spatial statistics, such as LISA, to explore the spatial relationship between recreational cannabis dispensaries and neighborhood characteristics [6,33]. Insights gained from these analyses on where dispensaries are located and concentrated can inform the design of improved licensing guidelines and intervention studies.

3. Method

This study uses an integrative analysis framework (Figure 1) to explore how recreational cannabis dispensaries relate spatially to neighborhood characteristics using New York City as the study area. We examined the association between dispensaries, neighborhood characteristics, and local marijuana siting policies using a three-step spatial analysis framework, including compliance check, visual comparison by overlaying, and spatial statistical analysis.

3.1. Data Collection and Processing

In the upper left corner of Figure 1, the study area map shows the distribution of the cannabis dispensaries (indicated by the red marijuana symbols which is visible when zooming in on the image) across the five boroughs within New York City. For this study, we gathered diverse data in all five boroughs, succinctly summarized in Table 1.
Marijuana store location data were downloaded from the New York State Office of Cannabis Management website (https://cannabis.ny.gov/dispensary-location-verification) accessed on 20 June 2024. There were 136 adult-use cannabis dispensary locations across New York State. After geocoding, the dispensaries located in New York City were selected for further analysis. Forty-six entities in New York City have licenses to sell recreational marijuana. Among them, 3 are temporary delivery only, and the other 43 have storefronts.
The neighborhood characteristics were drawn from the 2022 American Community Survey 5-year estimates, including the percentage of the population paying 30% more on rent, the percentage of the labor force population aged 16 years and older unemployed, the percentage of families below the poverty level, the percentage of the non-Hispanic Black population, and the percentage of the population aged 25 years and older without a high school diploma. In addition, we used the 2021 neighborhood area deprivation index (ADI), where census block groups were stratified into disadvantaged tertiles. The ADI ranks neighborhoods by socioeconomic disadvantage based on measures of income, education, employment, and housing quality. The ADI data were retrieved at the block group level from the Neighborhood Atlas (www.neighborhoodatlas.medicine.wisc.edu, accessed on 30 March 2024).
Data on amenities and disamenities, including education facilities, crime, and adult business, were collected at the parcel level. The education facilities include K-12 schools (2022) and childcare (2022) from the New York State GIS Clearinghouse. Active liquor stores and tobacco shop location data were downloaded from the Open NY website (https://data.ny.gov/Economic-Development/Current-Liquor-Authority-Active-Licenses/9s3h-dpkz/about_data, accessed on 30 March 2024). Crime data were downloaded from NYC Open Data (https://data.cityofnewyork.us/Public-Safety/NYPD-Arrests-Data-Historic-/8h9b-rp9u/about_data, accessed on 30 March 2024), which includes a list of arrests in New York City dated back to 2006. The crime records have been filtered by the year 2021 and classified as ‘robbery’, ‘disorderly conduct’, ‘felony assault’, and ‘criminal mischief and related offenses’. A total of 32,754 records were selected from the crime database.

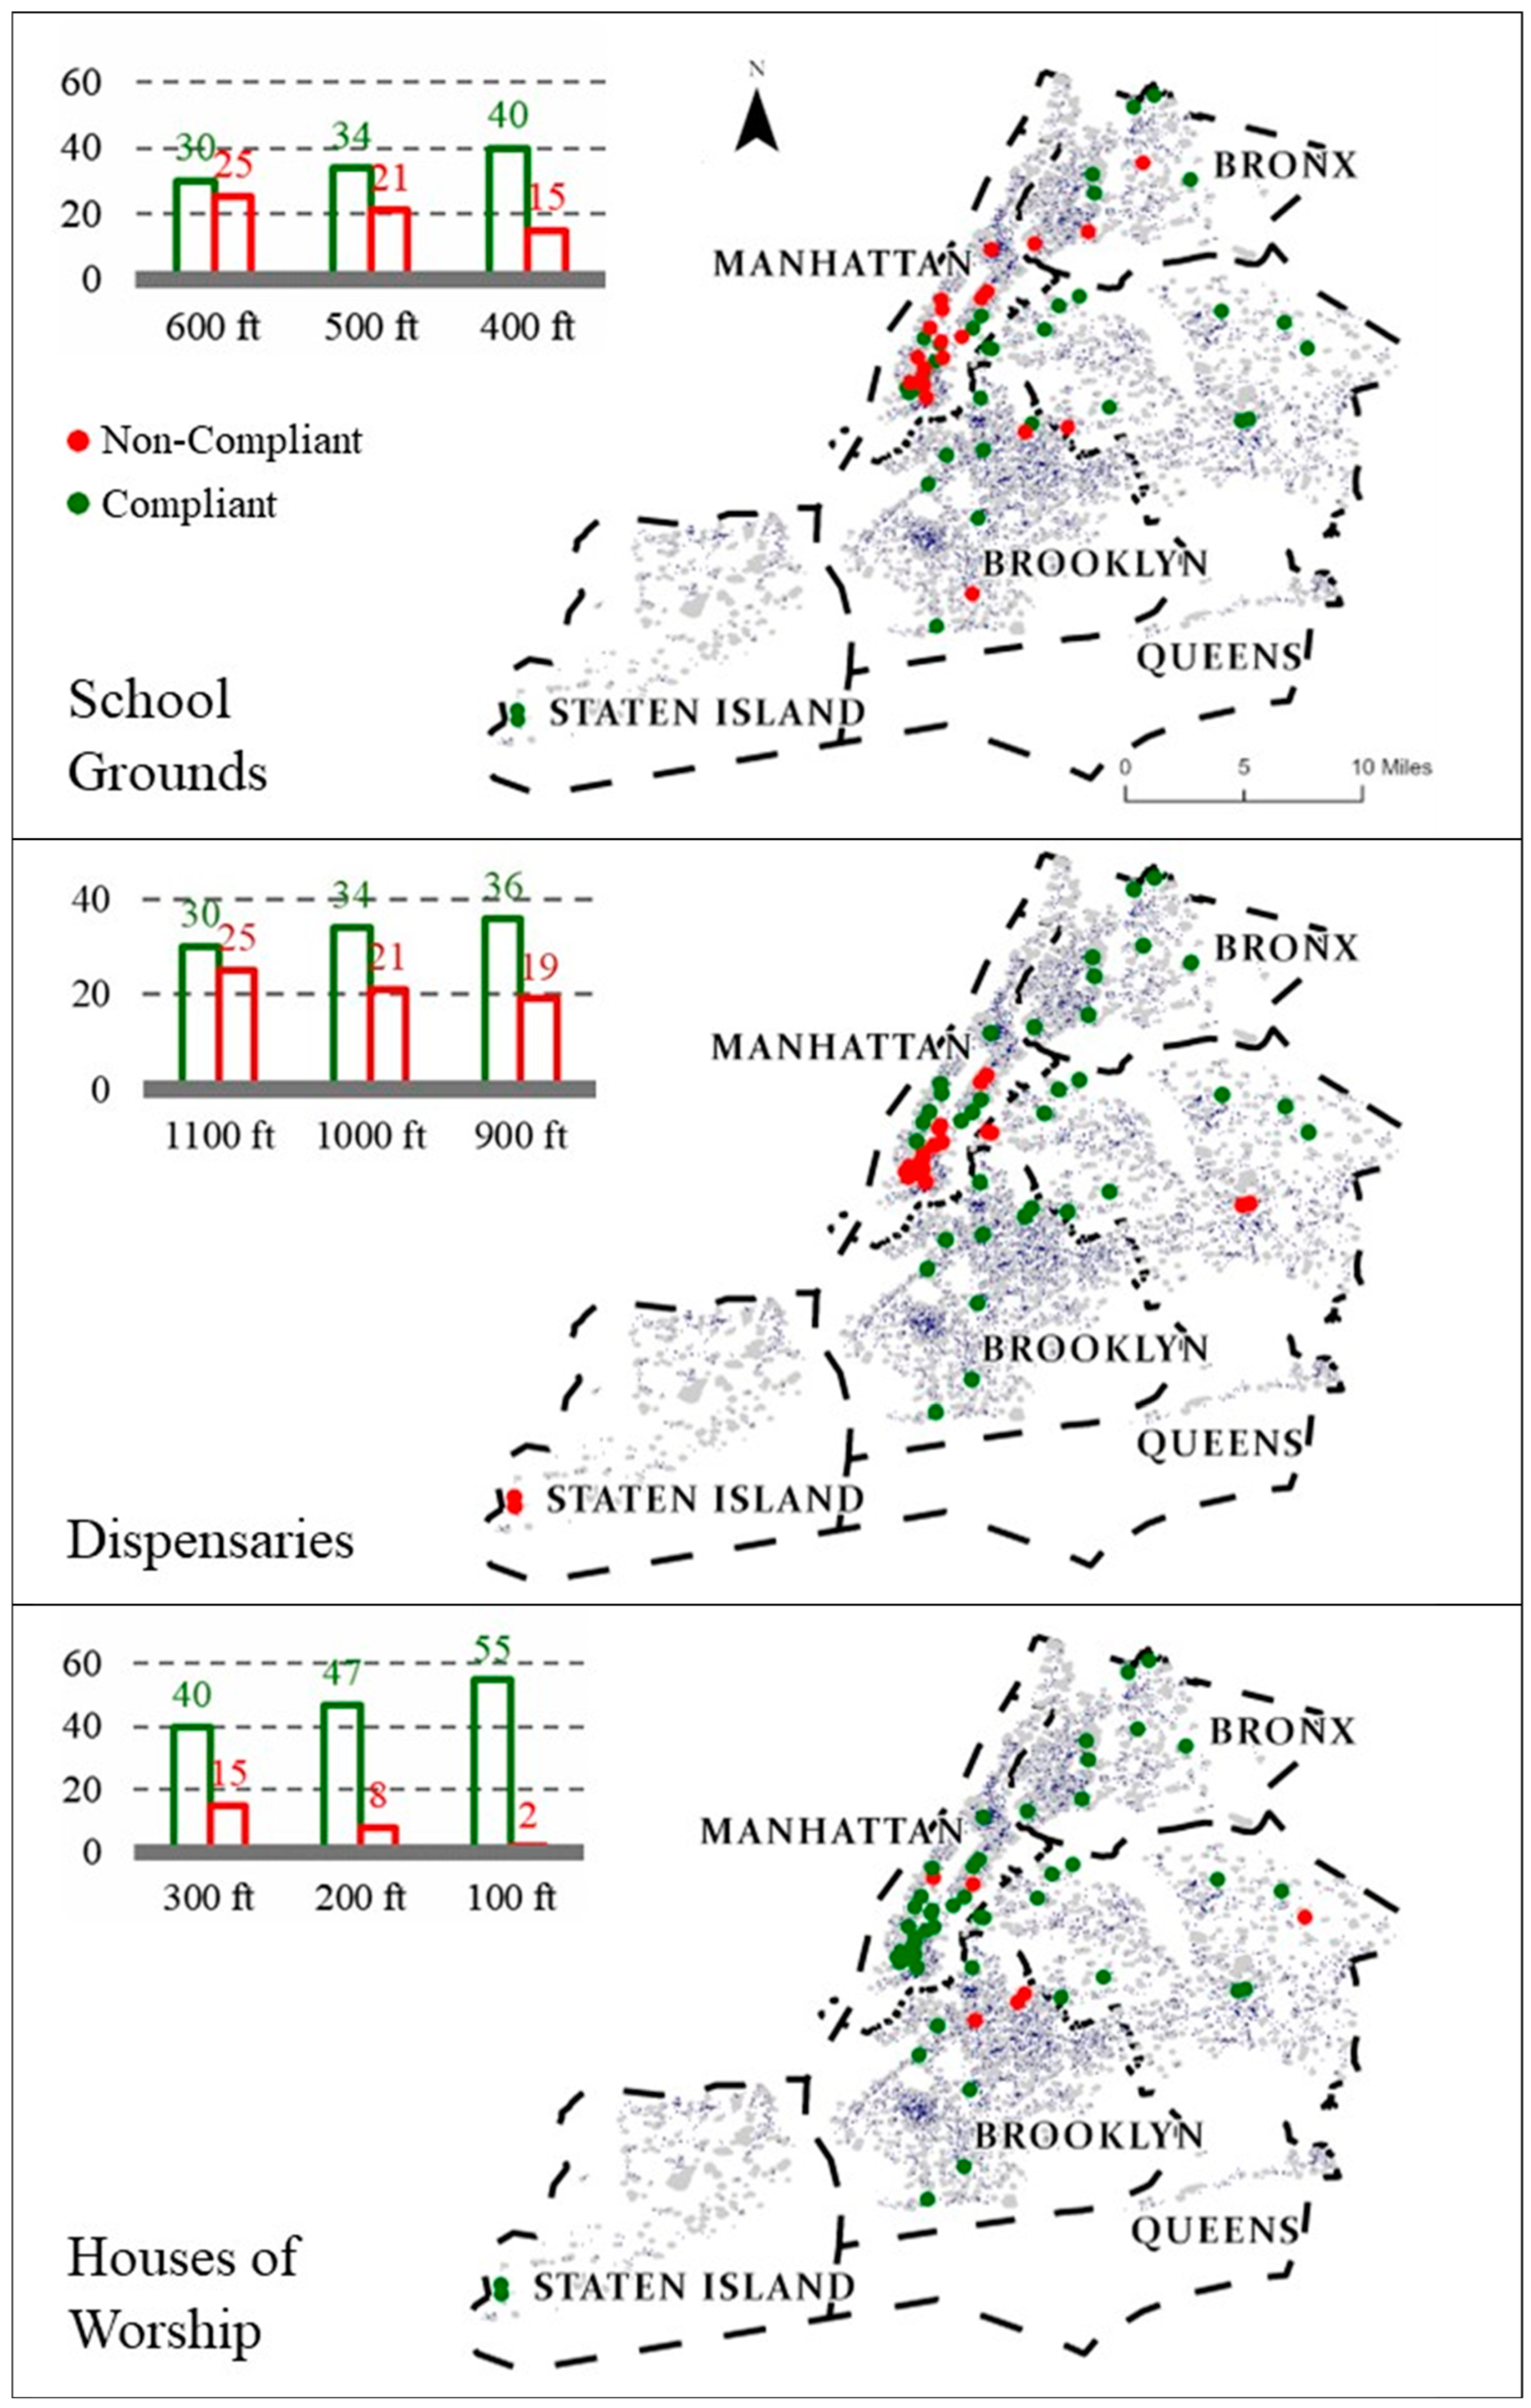
3.2. Compliance Checks

Three compliance check analyses were conducted, assessing the proximity of dispensaries to school grounds, houses of worship, and other dispensaries. According to the New York State Guidance for Adult-Use Retail Dispensaries guidelines [41], dispensaries should be situated 500 feet away from school grounds, 200 feet away from places of worship, and 1000 feet away from the nearest dispensary. For these checks, we employed the Euclidean distance, also known as the straight-line distance between the centroids of the dispensaries and the nearest boundaries of school grounds and churches.
In addition to evaluating compliance based on the specified distance in the guidelines, we conducted analyses using both longer distances and shorter distances. Specifically, we assessed compliance with three different buffer zones: 400, 500, and 600 feet for school grounds; 900, 1000, and 1100 feet for dispensaries; and 100, 200, and 300 feet for houses of worship (alternate buffer zones were considered to provide examples of what the impacts of future refinement to the New York State Guidance for Adult-Use Retail Dispensaries guidelines would have on the location of recreational cannabis dispensaries. Currently, recreational cannabis businesses are treated as adult businesses under New York law. This classification is based on the assumed risks these businesses present to communities. If the risks of recreational cannabis were assumed to be lower, similar to a liquor store, buffers might be reduced sometime in the future. On the contrary, if the risks of recreational cannabis were assumed to be higher, similar to those presented by a level 3 sex offender, buffers might be increased in the future. For example, NY state law requires a school buffer of 200 feet for businesses that are issued a liquor license, 500 feet for an adult business, and it requires 1000 feet for the residence of a level 3 sex offender, parolee, or person on probation).

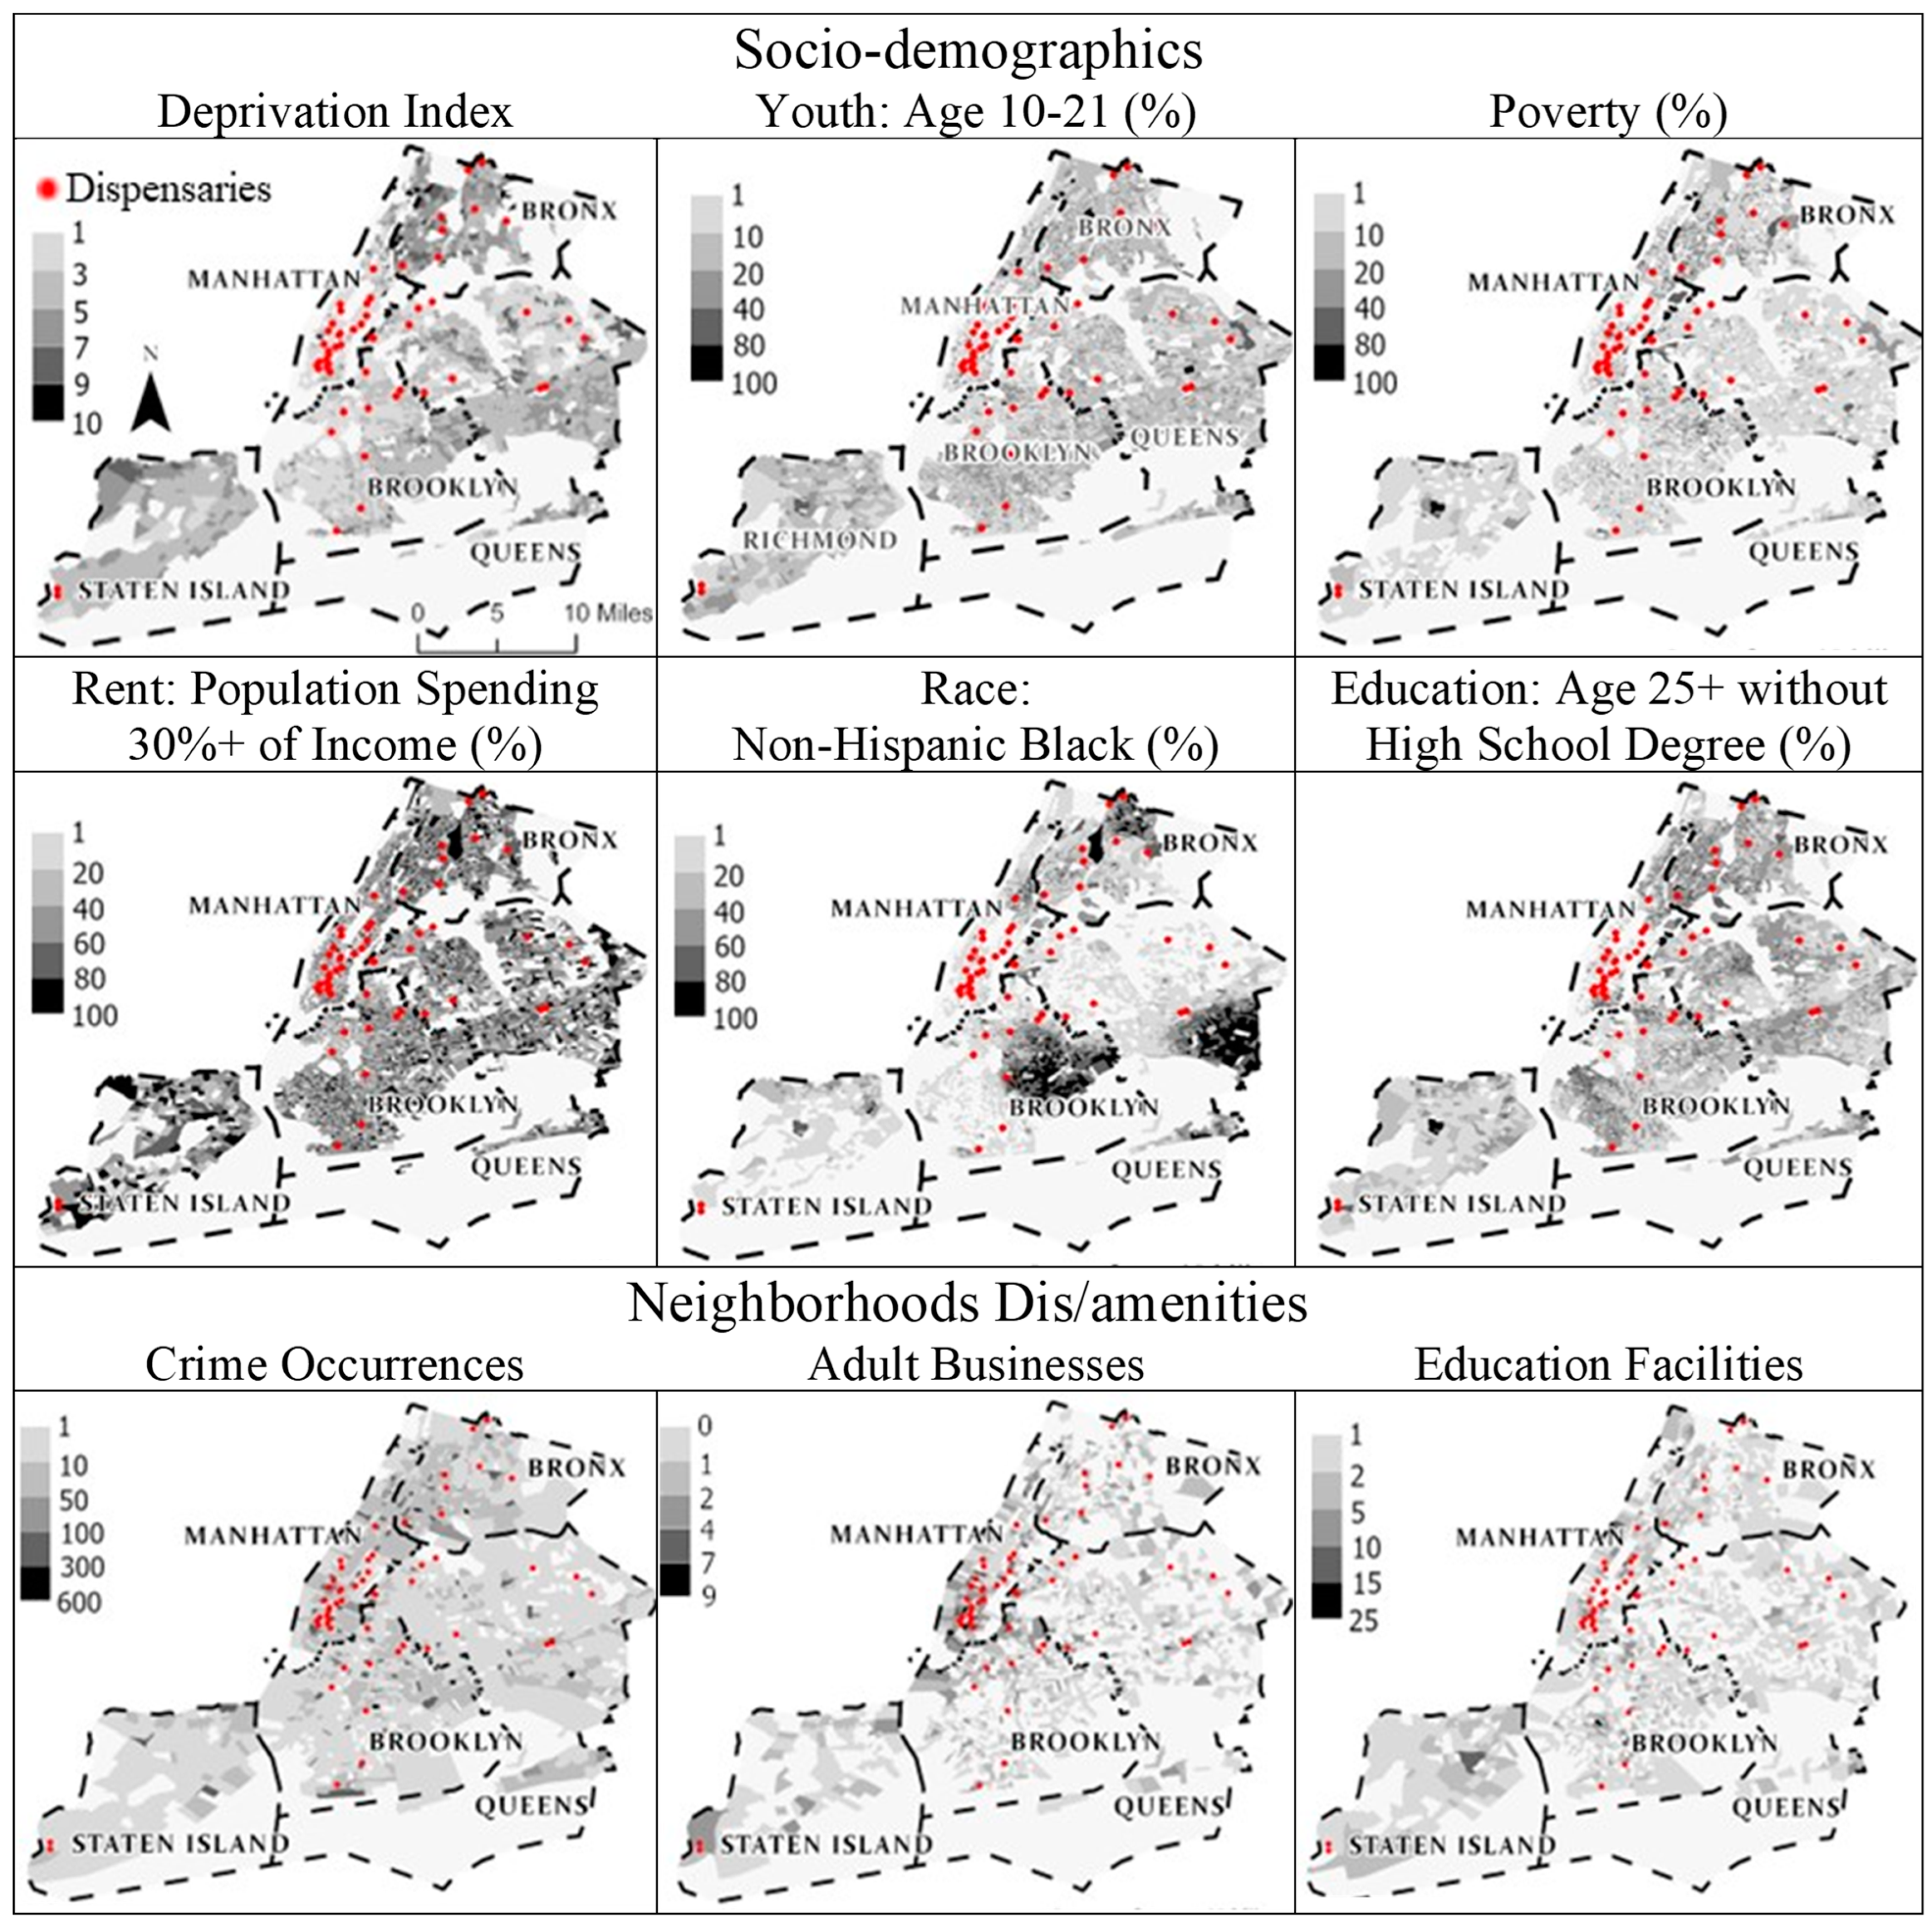
3.3. Visual Comparison by Overlaying

We conducted spatial analyses to explore the socio-demographic features of communities and neighborhood amenities and disamenities in areas where recreational cannabis businesses are licensed, comparing these with areas without such businesses. Our visualization overlays the locations of the licensed cannabis dispensaries onto the spatial distribution of these neighborhood characteristics within census block groups.
The socio-demographic characteristics were measured using the area deprivation index, unemployment rate, percentage of non-Hispanic blacks, poverty, youth, percentage of the population paying more than 30% of their income on rent, and education below high school in census block groups. Neighborhood amenities and disamenities were measured by counting the number of education facilities, crime incidents, and adult businesses within census tracts.

3.4. Spatial Statistic Analysis

We analyzed spatial clustering patterns [6] using Global Moran’s I [42] and Local Indicators of Spatial Association (LISA) statistics. Using ArcGIS Pro, we tested for significant clusters of four variables in relation to the dispensary locations: (1) youth population, (2) education facilities, (3) adult businesses, and (4) crime.
Global Moran’s I was used to assess the spatial autocorrelation between dispensaries and the four variables, testing whether similar values tend to cluster together geographically. The four variables were measured as total counts in each census tract, except for the youth population, measured at the census block group level. Due to the limited number of dispensaries in our study area at this stage, we assigned these counts to each dispensary and used inverse distance weighting to run univariate LISA instead of bivariate LISA. This spatial contiguity matrix considered that nearby features exert a greater influence on the computations for a target feature compared to those farther away. The distance between neighboring features was calculated using the Euclidean distance, which measures the straight-line distance.
To assess the robustness of the results, we also tested the K Nearest Neighbors (KNN) spatial weight scheme. For our small dataset of 55 dispensary points, we evaluated k values of 5, 6, 7, and 8 neighbors. The number of significant dispensary points identified were 22, 24, 23, and 27, respectively. Based on this test, we selected k = 7 for further analysis. This allowed us to compare the results obtained using the KNN scheme with those from the inverse distance scheme.
With a significance level of p-value < 0.05, four categories of significant clusters were determined. The high–high (HH) category suggests that a dispensary is located in a census tract with high values for youth population, education facilities, crime occurrences, or adult businesses and is surrounded by neighboring census tracts with similarly high values. Conversely, the low–low (LL) category features dispensaries in census tracts with low values for these neighboring characteristics, surrounded by tracts with low values. High–low (HL) indicates high values in the tract alongside low values in neighboring tracts, while low–high (LH) reflects low values in the tract alongside high values in neighboring tracts.

4. Findings

4.1. Compliance Check

Figure 2 shows the results of the compliance checks. It shows that there are noncompliances across all three categories listed in the New York State guidelines. Despite the relaxed distance requirements, noncompliance persists across all three categories. This discrepancy may arise from variations in our measurement methods, specifically the distance calculation between dispensary centroids and the boundaries of these three land use types. Notably, the highest rate of noncompliance occurs in block groups where dispensaries were located in relation to school grounds and other dispensaries. The second highest rate of noncompliance was observed in areas where dispensaries were clustered together. This suggests that schools were particularly impacted by the negative effects of being proximate to dispensaries. The maps in Figure 2 show that this type of noncompliance was present in four of the five boroughs in New York City. In contrast, when dispensaries were located too close to other dispensaries, the tendency was for this type of noncompliance to cluster in more discrete geographies. This was predominantly found in the borough of Manhattan. Figure 2 shows that noncompliance was the least where dispensaries were located near houses of worship. This type of noncompliance was found in three of the five boroughs and more geographically dispersed.

4.2. Visual Comparison

Figure 3 shows the results from the visual comparison of six out of seven variables we examined since unemployment and poverty displayed similar patterns. ADIs are reported on a scale from 1 to 10, with higher scores indicating greater levels of socioeconomic deprivation at the census block group level. The map showing dispensaries overlayed on the deprivation index highlights that most dispensaries clustered in relatively less socioeconomically deprived areas, largely due to the clustering of these businesses in Manhattan. However, dispensaries were in census block groups with higher deprivation indexes in other boroughs.
A similar pattern is shown when individual variables are examined. Overlays for individual variables in Figure 3 suggest that dispensaries are in areas with fewer school-age children, relatively lower poverty, relatively fewer non-Hispanic Black residents, fewer adults without a high school degree, and neighborhood amenities consistent with high-traffic commercial uses and tourism.

4.3. Results from the Spatial Statistic Analysis

Table 2 presents the results from the Global Moran’s I analysis. At a significance level of 0.05, we found that the distribution of marijuana dispensaries has a statistically significant relationship with the youth population and adult-related businesses. Positive Moran’s I values indicate that a higher number of dispensaries tend to be located near the high values of the youth population and adult-related businesses. Moran’s I values close to zero suggest that the values of the two variables are randomly distributed across space, while values near 1 suggest a clustering pattern [43]. The Moran’s I value of 0.26 and 0.37 for youth population and adult-related businesses, respectively, indicate spatial autocorrelation, with clusters of marijuana dispensaries in areas associated with high levels of adult-related businesses and youth population.
Table 3 and Figure 4 present the results of the spatial statistical analysis, applying a significance level of p-value < 0.05. Using LISA statistics, we identified four distinct categories of statistically significant clusters for each of the four types of neighborhood characteristics in relation to the locations of recreational cannabis dispensaries: HH, HL, LH, and LL. Table 3 shows the results from both spatial weight matrix schemes—KNN and Inverse Distance (ID)—on the clustering of the four variables in relation to dispensary locations. They show similar patterns but with differences in a specific number of significant clusters identified. For adult-related activities, the Inverse Distance scheme identified more H-H clusters (9) compared to the KNN scheme (3). For youth-related variables, both schemes found few clusters, with the majority of points remaining non-significant (NS).
The colored points in Figure 4 indicate dispensaries situated in areas that exhibit statistically significant spatial clustering patterns in relation to these neighborhood characteristics. The result highlights the relationship between dispensaries and the clustering of educational facilities, as shown in the upper right part of the figure. However, Figure 4 reveals that the highest levels of clustering occur around other disamenities. For example, dispensaries are often located near adult business clusters and crime clusters, which are not considered in current buffering requirements. This suggests that neighborhoods already burdened by the negative effects associated with other adult businesses and elevated crime rates are more likely to be sites for new recreational marijuana dispensaries. In part, this is the outcome of the absence of buffer zones being applied to other adult-use businesses when considering which locations are permissible for recreational marijuana dispensaries. The result is that disamenities become more concentrated in these locations, mirroring the findings of Holmes (2019) [13] and Baker (2024) [11].

5. Discussion

This study investigated the spatial relationship between recreational cannabis dispensary locations and neighborhood characteristics using New York City as a case study area. Our compliance check revealed that there are noncompliances across all three categories for the buffering requirements, with the highest noncompliance rates located in the census block groups in relation to schools (It is noteworthy that noncompliance rates located in the census block groups in relation to school did not always align with the presence of recreational cannabis dispensaries in census block groups surrounded by neighboring census tracts with a high youth population. The latter occurred at a lower rate. This is partially explained by the concentration of cannabis dispensaries in Manhattan, an area with relatively lower concentrations of youth than other boroughs in New York City.). This finding is important since it suggests that in the future, as New York City and other cities gain experience with recreational cannabis businesses and better understand the impacts of these businesses on neighborhood quality of life, buffers for cannabis businesses may be adjusted. If initial assumptions overstated the risks of these businesses, reduced buffers could result in less noncompliance. In contrast, if initial assumptions understated the risks of these businesses, the adoption of increased buffers could aggravate the noncompliance issue.
A novel finding from this analysis is that LISA statistics indicated that dispensaries tended to be located around adult businesses that were not covered by existing buffering requirements. This finding is consistent with others’ research [11,13], which finds that recreational cannabis dispensaries tend to be around other disamenities like bars, liquor stores, and other adult businesses. The contribution of our research to this body of work lies in demonstrating that, in New York City, this type of clustering is the result of not including other adult businesses in the 1000-foot buffering requirements used to identify appropriate locations to site recreational cannabis dispensaries. This results in increased concentrations of businesses associated with crime and other vices due to this lapse in land use regulations. This increased concentration negatively impacts the quality of life for residents of these areas.

6. Conclusions

Our research shows how spatial analysis can be used to identify clusters of recreational cannabis businesses and the degree to which they comply with buffers designed to protect communities from negative impacts on the quality of life (Future studies of this topic might consider using Geographically Weighted Regression (GWR) or spatial regression. GWR [44] models are primarily suited for explanatory analysis, where the goal is to quantify the relationship between variables and incorporate spatial dependence in regression outputs [45]. Applying this type of explanatory analysis was not the best fit for this study since it had a small dataset (55 samples), and the GWR can lead to overfitting and vulnerability to multicollinearity [46]). This type of analysis can empower communities to advocate for policy reforms that introduce new buffering requirements for the siting of recreational cannabis dispensaries. These requirements would address disamenities specific to recreational cannabis businesses and help prevent the increased clustering of businesses associated with crime and other vices near cannabis dispensaries. Grassroots advocacy, informed by empirical evidence replicating methods applied to this analysis, can prompt policymakers to mitigate the potential negative impacts of recreational cannabis dispensary distribution on residential areas, schools, and sensitive locations.

Author Contributions

Conceptualization, Li Yin, Kelly L. Patterson, and Robert Mark Silverman; methodology, Li Yin, Kelly L. Patterson, and Robert Mark Silverman; software, Li Yin and Suiyuan Wang; validation, Li Yin and Suiyuan Wang; formal analysis, Li Yin, Suiyuan Wang, Kelly L. Patterson, Robert Mark Silverman, and Ambreen Rehman-Veal; data curation, Li Yin and Suiyuan Wang; writing—original draft preparation, Li Yin, Kelly L. Patterson, and Robert Mark Silverman; writing—review and editing, Li Yin, Suiyuan Wang, Kelly L. Patterson, Robert Mark Silverman, and Ambreen Rehman-Veal. All authors have read and agreed to the published version of the manuscript.

Funding

This research was supported by a research grant from the Baldy Center for Law and Social Policy at the University at Buffalo.

Data Availability Statement

Data will be made available by request to the corresponding author.

Conflicts of Interest

The authors declare no conflicts of interest.

References

  1. Patterson, K.L.; Silverman, R.M.; Rehman-Veal, A.; Yin, L.; Wang, S. Building the Prison to Legal Drug Dealing Pipeline: A Comparative Analysis of Social Equity Policies in Recreational Cannabis Licensing. Societies 2024, 14, 88. [Google Scholar] [CrossRef]
  2. Silverman, R.M.; Patterson, K.L.; Williams, S.S. Don’t Fear the Reefer? The Social Equity and Community Planning Implications of New York’s Recreational Cannabis Law on Underserved Communities. J. Policy Pract. Res. 2023, 4, 150–167. [Google Scholar] [CrossRef]
  3. Dilley, J.A.; Hitchcock, L.; McGroder, N.; Greto, L.A.; Richardson, S.M. Community-level policy responses to state marijuana legalization in Washington State. Int. J. Drug Policy 2017, 42, 102–108. [Google Scholar] [CrossRef]
  4. Payan, D.D.; Brown, P.; Song, A.V. County-Level Recreational Marijuana Policies and Local Policy Changes in Colorado and Washington State (2012–2019). Milbank Q. 2021, 99, 1132–1161. [Google Scholar] [CrossRef] [PubMed]
  5. Polson, M. Buttressed and breached: The exurban fortress, cannabis activism, and the drug war’s shifting political geography. Environ. Plan. D Soc. Space 2020, 38, 626–645. [Google Scholar] [CrossRef]
  6. Yin, L.; Yin, F.; Silverman, R.M. Spatial clustering of property abandonment in shrinking cities: A case study of targeted demolition in Buffalo, NY’s African American neighborhoods. Urban Geogr. 2023, 44, 2251–2270. [Google Scholar] [CrossRef]
  7. Gasnier, L.J. Reefer Madness; G&H Productions: Los Angeles, CA, USA, 1936. [Google Scholar]
  8. Hudak, J. Marijuana: A Short History; Brookings Institution Press: Washington, DC, USA, 2020. [Google Scholar]
  9. Mortensen, T.M.; Moscowitz, L.; Wan, A.; Yang, A. The marijuana user in US news media: An examination of visual stereotypes of race, culture, criminality and normification. Vis. Commun. 2020, 19, 231–255. [Google Scholar] [CrossRef]
  10. Amiri, S.; Monsivais, P.; McDonell, M.G.; Amram, O. Availability of licensed cannabis businesses in relation to area deprivation in Washington state: A spatiotemporal analysis of cannabis business presence between 2014 and 2017. Drug Alcohol Rev. 2019, 38, 790–797. [Google Scholar] [CrossRef]
  11. Baker, D.M. Burden or benefit: Is retail marijuana facility siting influenced by LULU-or gentrification-related neighbourhood characteristics? Urban Stud. 2024, 61, 1049–1070. [Google Scholar] [CrossRef]
  12. Boggess, L.N.; Pérez, D.M.; Cope, K.; Root, C.; Stretesky, P.B. Do medical marijuana centers behave like locally undesirable land uses? Implications for the geography of health and environmental justice. Urban Geogr. 2014, 35, 315–336. [Google Scholar] [CrossRef]
  13. Holmes, A. Zoning, race, and marijuana: The unintended consequences of proposition 64. Lewis Clark Law Rev. 2019, 23, 939. [Google Scholar]
  14. Hsu, G.; Koçak, Ö.; Kovács, B. Co-opt or coexist? A study of medical cannabis dispensaries’ identity-based responses to recreational-use legalization in Colorado and Washington. Organ. Sci. 2018, 29, 172–190. [Google Scholar] [CrossRef]
  15. Morrison, C.; Gruenewald, P.J.; Freisthler, B.; Ponicki, W.R.; Remer, L.G. The economic geography of medical cannabis dispensaries in California. Int. J. Drug Policy 2014, 25, 508–515. [Google Scholar] [CrossRef] [PubMed]
  16. Németh, J.; Ross, E. Planning for marijuana: The cannabis conundrum. J. Am. Plan. Assoc. 2014, 80, 6–20. [Google Scholar] [CrossRef]
  17. Ambrose, C.A.; Cowan, B.W.; Rosenman, R.E. Geographical access to recreational marijuana. Contemp. Econ. Policy 2021, 39, 778–807. [Google Scholar] [CrossRef]
  18. Hust, S.J.; Willoughby, J.F.; Li, J.; Couto, L. Youth’s proximity to marijuana retailers and advertisements: Factors associated with Washington State adolescents’ intentions to use marijuana. J. Health Commun. 2020, 25, 594–603. [Google Scholar] [CrossRef]
  19. Mair, C.; Freisthler, B.; Ponicki, W.R.; Gaidus, A. The impacts of marijuana dispensary density and neighborhood ecology on marijuana abuse and dependence. Drug Alcohol Depend. 2015, 154, 111–116. [Google Scholar] [CrossRef]
  20. Shih, R.A.; Rodriguez, A.; Parast, L.; Pedersen, E.R.; Tucker, J.S.; Troxel, W.M.; Kraus, L.; Davis, J.P.; D’Amico, E.J. Associations between young adult marijuana outcomes and availability of medical marijuana dispensaries and storefront signage. Addiction 2019, 114, 2162–2170. [Google Scholar] [CrossRef] [PubMed]
  21. Bernstein, K.T.; Galea, S.; Ahern, J.; Tracy, M.; Vlahov, D. The built environment and alcohol consumption in urban neighborhoods. Drug Alcohol Depend. 2007, 91, 244–252. [Google Scholar] [CrossRef] [PubMed]
  22. Burgoon, M.L.; Albani, T.; Keller-Hamilton, B.; Lu, B.; Roberts, M.E.; Craigmile, P.F.; Browning, C.; Xi, W.; Ferketich, A.K. Exposures to the tobacco retail environment among adolescent boys in urban and rural environments. Am. J. Drug Alcohol Abus. 2019, 45, 217–226. [Google Scholar] [CrossRef]
  23. Leung, A.; Law, J.; Cooke, M.; Leatherdale, S. Exploring and visualizing the small-area-level socioeconomic factors, alcohol availability and built environment influences of alcohol expenditure for the City of Toronto: A spatial analysis approach. Health Promot. Chronic Dis. Prev. Can. 2019, 39, 15–24. [Google Scholar] [CrossRef] [PubMed]
  24. Morton, C.M.; Simmel, C.; Peterson, N.A. Neighborhood alcohol outlet density and rates of child abuse and neglect: Moderating effects of access to substance abuse services. Child Abus. Negl. 2014, 38, 952–961. [Google Scholar] [CrossRef] [PubMed]
  25. Tabb, L.P.; Fillmore, C.; Melly, S. Location, location, location: Assessing the spatial patterning between marijuana licenses, alcohol outlets and neighborhood characteristics within Washington state. Drug Alcohol Depend. 2018, 185, 214–218. [Google Scholar] [CrossRef]
  26. Burrough, P.A.; McDonnell, R.A.; Lloyd, C.D. Principles of Geographical Information Systems; Oxford University Press: Oxford, UK, 2015. [Google Scholar]
  27. Goodchild, M.F.; Haining, R.P. GIS and spatial data analysis: Converging perspectives. Fifty Years Reg. Sci. 2004, 83, 363–385. [Google Scholar]
  28. Guo, S.J.; Wu, W.F.; Shao, Z.F.; Teng, J.H.; Li, D.R. Extracting urban impervious surface based on optical and SAR images cross-modal multi-scale features fusion network. Int. J. Digit. Earth 2024, 17, 2301675. [Google Scholar] [CrossRef]
  29. Li, X.; Wang, W.; Li, F.; Deng, X. GIS based map overlay method for comprehensive assessment of road environmental impact. Transp. Res. Part D Transp. Environ. 1999, 4, 147–158. [Google Scholar] [CrossRef]
  30. Yin, L.; Silverman, R.M. Housing Abandonment and Demolition: Exploring the Use of Micro-level and Multi-year Models. Int. J. Geo-Inf. 2015, 4, 1184–1200. [Google Scholar] [CrossRef]
  31. Silverman, R.M.; Yin, L.; Patterson, K. Dawn of the Dead City: An Exploratory Analysis of Vacant Addresses in Buffalo, NY 2008–2010. J. Urban Aff. 2013, 35, 131–152. [Google Scholar] [CrossRef]
  32. Yin, L.; Wu, L.; Cole, S.; Wu, L. Synthesizing data to explore the dynamic spatial patterns of hotel development. ISPRS Int. J. Geo-Inf. 2019, 8, 448. [Google Scholar] [CrossRef]
  33. Wang, N.; Hincks, S. Airbnb and the COVID-19 pandemic: A geospatial analysis of Greater London. Environ. Plan. B Urban Anal. City Sci. 2024. [Google Scholar] [CrossRef]
  34. Anselin, L. Local indicators of spatial association—LISA. Geogr. Anal. 1995, 27, 93–115. [Google Scholar] [CrossRef]
  35. Cromley, E.K.; Wilson-Genderson, M.; Pruchno, R.A. Neighborhood characteristics and depressive symptoms of older people: Local spatial analyses. Soc. Sci. Med. 2012, 75, 2307–2316. [Google Scholar] [CrossRef] [PubMed]
  36. Srinivasan, S.; Pustz, J.; Marsh, E.; Young, L.D.; Stopka, T.J. Risk factors for persistent fatal opioid-involved overdose clusters in Massachusetts 2011–2021: A spatial statistical analysis with socio-economic, accessibility, and prescription factors. BMC Public Health 2024, 24, 1893. [Google Scholar] [CrossRef] [PubMed] [PubMed Central]
  37. Rae, A. Isolated Entities or Integrated Neighbourhoods? An Alternative View of the Measurement of Deprivation. Urban Stud. 2009, 46, 1859–1878. [Google Scholar] [CrossRef]
  38. Anselin, L.; Rey, S.J. Modern Spatial Econometrics in Practice: A Guide to GeoDa, GeoDaSpace and PySAL; Geoda-Press-LLC: Chicago, IL, USA, 2014. [Google Scholar]
  39. Yin, L.; Shiode, N. 3D spatial-temporal GIS modeling of urban environments to support design and planning processes. J. Urban. Int. Res. Placemaking Urban Sustain. 2014, 7, 152–169. [Google Scholar] [CrossRef]
  40. Lee, S.I. Developing a bivariate spatial association measure: An integration of Pearson’s r and Moran’s I. J. Geogr. Syst. 2001, 3, 369–385. [Google Scholar] [CrossRef]
  41. Guidance for Adult-Use Retail Dispensaries. 2024. Available online: https://cannabis.ny.gov/system/files/documents/2024/03/guidance-for-adult-use-retail-dispensaries-3.11.pdf (accessed on 30 March 2024).
  42. Moran, P.A. The interpretation of statistical maps. J. R. Stat. Soc. Ser. B (Methodol.) 1948, 10, 243–251. [Google Scholar] [CrossRef]
  43. Rogerson, P.A. Spatial Statistical Methods for Geography, 1st ed.; SAGE Publishing: Los Angeles, CA, USA, 2021. [Google Scholar]
  44. Brunsdon, C.; Fotheringham, S.; Charlton, M. Geographically weighted regression. J. R. Stat. Soc. Ser. D (Stat.) 1998, 47, 431–443. [Google Scholar] [CrossRef]
  45. Ward, M.D.; Gleditsch, K.S. Spatial Regression Models; Sage Publications: Los Angeles, CA, USA, 2018; Volume 155. [Google Scholar]
  46. Fotheringham, A.S.; Oshan, T.M. Geographically weighted regression and multicollinearity: Dispelling the myth. J. Geogr. Syst. 2016, 18, 303–329. [Google Scholar] [CrossRef]
Figure 1. Study Area and Analysis Flowchart.
Ijgi 14 00004 g001
Figure 2. Finding from the Compliance Checks.
Ijgi 14 00004 g002
Figure 3. Findings from the Visual Overlaying.
Ijgi 14 00004 g003
Figure 4. Results from the Local Indicators of Spatial Autocorrelation (LISA).
Ijgi 14 00004 g004
Table 1. Summary of Data.
Feature TypesDataset DescriptionSourceYearDetailNumber of Records
Neighborhoods Dis/amenitiesAdult-use Cannabis DispensariesNY Office of Cannabis Management2024Locations of licensed dispensaries in NYC46
Education FacilitiesNYS Tax Parcels data2022Include all educational structures2876
WorshipHomeland Infrastructure Foundation-Level Data (HIFLD)2020Proximity analysis to assess neighborhood characteristics5582
Adult BusinessesOpen NY, New York State Department of Health2024Active liquor stores with licenses and classified as liquor stores, wine stores, nightclubs, cabarets, and microbreweries; and active tobacco shops classified as tobacco retail and retail electronic cigarette store1571 liquor stores; 404 tobacco shop
CrimeNYC Open Data2021NYPD arrest records classified under robbery, disorderly conduct, felony assault, and criminal mischief and related offenses32,754
Social demographicsArea Deprivation Index (ADI)Neighborhood Atlas2021State-specific decile of block group ADI score, ranking from 1 to 106807
RentAmerican Community Survey (ACS) 5-Year, US Census Bureau2022Percentage of the population paying 30% more on rent6807
UnemploymentACS 5-Year, US Census Bureau2022Percentage of labor force population aged >= 16 y unemployed6807
PovertyACS 5-Year, US Census Bureau2022Percentage of families below the poverty level6807
RaceACS 5-Year, US Census Bureau2022Percentage of non-Hispanic Black population6807
EducationACS 5-Year, US Census Bureau2022Percentage of population aged >= 25 y without a high school diploma6807
Table 2. Global Moran’s I (Spatial Weight Matrix: Inverse Distance) Results.
Moran’s IndexVariancez-Scorep-Value (* Is Significant <0.05)
Crime0.1000.0121.1020.270
Education0.1410.0131.3950.163
Youth0.2620.0132.4120.016 *
Adult0.3670.0143.2860.001 *
Table 3. Spatial Weight Matrix Scheme Comparison: KNN vs. Inverse Distance (ID).
CrimeEducationYouthAdult
KNNIDKNNIDKNNIDKNNID
L-L12 5 142
L-H5366 118
H-L 131 11
H-H23 4 239
NS (>0.05)4746434450522636
Disclaimer/Publisher’s Note: The statements, opinions and data contained in all publications are solely those of the individual author(s) and contributor(s) and not of MDPI and/or the editor(s). MDPI and/or the editor(s) disclaim responsibility for any injury to people or property resulting from any ideas, methods, instructions or products referred to in the content.

