Article

Towards More Reliable Measures for “Perceived Urban Diversity” Using Point of Interest (POI) and Geo-Tagged Photos

by
Zongze He
and
Xiang Zhang
*
School of Geospatial Engineering and Science, Sun Yat-sen University, Zhuhai 519082, China
*
Author to whom correspondence should be addressed.
ISPRS Int. J. Geo-Inf. 2025, 14(2), 91; https://doi.org/10.3390/ijgi14020091
Submission received: 4 December 2024 / Revised: 27 January 2025 / Accepted: 17 February 2025 / Published: 19 February 2025

Abstract

:
Urban diversity is essential for promoting urban vitality and achieving sustainable urban development. However, existing studies rely on static and non-visual data and seldom incorporate human perception aspects in the diversity estimation. Together with the modifiable areal unit problem (MAUP) in the traditional entropy-based approach, urban diversity is prone to be biased or underestimated. In this study, we use urban function (from POI) and visual semantics (from geo-tagged photos) to estimate what we call “perceived urban diversity”. More importantly, we propose to improve the traditional entropy-based diversity measures by addressing the MAUP issue using area- and accessibility-based extensions. Empirical analysis using Shenzhen, China, as a case study reveals that our “perceived diversity” indicators display stronger correlations to urban vitality. Furthermore, combining different data sources (e.g., geo-tagged photos) provides a more comprehensive portrayal of urban diversity. Finally, our results suggest that neighborhoods dominated by residential or commercial land uses would benefit the most from enhanced diversity. These findings are useful for a refined assessment of urban diversity and offer valuable insights for urban planning and community design.

1. Introduction

The unprecedented urbanization of the world since the 20th century has led to the formation of world-famous megacities such as New York, Tokyo, and London. The growth of these megacities has witnessed economic prosperity and cultural diffusion, symbolizing the progress of human society. However, with the accelerated pace of urbanization, human–land conflicts become increasingly pronounced in urban areas. Issues such as urban sprawl, residential vacancy, population loss, and ecological degradation [1,2,3] have further intensified these challenges, making urban development more difficult and less sustainable. Consequently, the enduring focal point of urban research has been the precise evaluation of the correlation between human activities and urban space [2,4,5,6]. During the 1960s, Jacobs introduced the concept of urban vitality to delineate the facets of interactions between humans and the urban environment [7]. Following that, urban vitality has found extensive applications across the domains of psychology, sociology, geography, and urban planning, yielding diverse interpretations to the concept [6,8,9,10]. However, identifying the underlying factors that influence urban vitality has been a challenging question for researchers [4,10,11]. For example, many have evaluated factors that effectively promote urban (neighborhood) vitality, including the road network structure [12,13], the accessibility of facilities [5], building density [6], urban diversity [14], and urban form [15,16]. Among others, urban diversity has attracted much attention and is acknowledged by researchers as a primary factor influencing urban vitality [17,18,19].
To foster urban vitality, it is essential to ensure diversity in urban streets in terms of mixed uses, street styles, building types, and pedestrian flow characteristics [7]. Many studies empirically confirmed this theory, suggesting a positive correlation between urban vitality and diversity [6,20,21]. We, therefore, refer to this principle as the “Theory of diversity”. However, existing methods focused on the mixed-use aspect of urban diversity using land-use and point-of-interest (POI) data [18,22]. These approaches are limited by biases and inaccuracies stemming from outdated data and single-dimensional measurements, which constrain their ability to comprehensively reflect the complexity of urban diversity. With the increasing availability of crowdsourced data (e.g., geo-tagged images) and advanced computer vision algorithms, it is now feasible to quantify the human perception of the built environment in finer details [23,24,25]. Therefore, one of our purposes is to test if crowdsourced (e.g., geo-tagged) images provide additional information that helps better quantify the perception of urban diversity. In doing so, we estimate urban diversity using POI and geo-tagged images, separately and in their combination, and test how well the indicators explain the urban vitality (according to the theory of diversity).
On the other hand, Shannon’s information entropy is widely used to estimate urban diversity with POI data [6,17,18,21]. Nevertheless, such an approach can be significantly influenced by the scale of spatial units used [26]. Such a modifiable areal unit problem (MAUP) presents a major challenge in precisely measuring the urban diversity [27]. For example, Figure 1a depicts how diversity is traditionally calculated for each spatial unit based on POI. The process involves aggregating semantics of POI within each unit, followed by an entropy-based diversity calculation. Yet, these methods may oversimplify the complex nature of urban diversity and fail to account for the influence of amenities located just outside the spatial unit. For a small spatial unit (e.g., N in Figure 1, which contains only one data point), existing diversity measures may lead to underestimation. This is because amenities and groceries surrounding the spatial unit also have an impact on people’s perception of the diversity and, hence, their willingness of visiting the unit. For instance, if the unit N represents a public space like a square or a green area surrounded by diverse commercial facilities, this public space may be perceived as a region of high diversity. This highlights the growing demand for more precise and multidimensional metrics to capture the complexity of urban diversity as human perception naturally extends beyond the boundary of a neighborhood unit, especially in densely populated urban areas [28,29].
For larger spatial units (e.g., M in Figure 1), the cluster of POI within the unit already encompasses rich semantics that aligns with people’s perception of its diversity, which reduces the likelihood of the underestimation issue. Therefore, as a first contribution, we propose to adjust the search radius for different spatial units based on their sizes (e.g., the blue search radius in Figure 1b) to alleviate the biased estimation of urban diversity (see Section 3.4.2 for details).
Further, a deeper look at the problem suggests that the above area-based approach to adjusting the search radius can be an oversimplified solution. As demonstrated in Figure 1c,d, the perception range of people for diversity can be different, even in spatial units of the same size. For spatial unit G, due to the low accessibility to various infrastructures (e.g., residential, commercial, green space, etc.), the perception range of people may go beyond the unit’s boundary. For spatial unit of higher accessibility (e.g., H in Figure 1d), the perception range can be more confined. Therefore, we hypothesize that accessibility may also have an impact on the perception of diversity in addition to the size factor. As a second contribution, we propose to incorporate the idea of accessibility into the search radius adjustment. For spatial units with lower accessibility, we increase the degree of search radius expansion, and vice versa (see Section 3.4.3 for details).
Taken together, we propose to integrate urban functional (using POI) and visual semantic (using geo-tagged photos) aspects to jointly evaluate urban diversity. This integration addresses the research gap by overcoming the limitations of diversity calculations from single perspectives. Furthermore, we refine the classic entropy-based diversity estimation to better reflect what we term “perceived diversity” to address the MAUP problem. Specifically, we propose to adjust the search radius of a spatial unit using area- and accessibility-based rules, respectively. This refined approach aims to align diversity estimation more closely with the human perception of places.
To validate our hypothesis and the proposed diversity indicators, we test how well the proposed indicators are consistent with the theory of diversity and also compare them with existing measures. That is, we analyze how different diversity indicators correlate to urban vitality on a daily basis. Our results show that the proposed diversity indicators exhibited stronger correlation to urban vitality proxy and more effectively reflect the semantics of the spatial unit than the original entropy-based approach. Importantly, the incorporation of geo-tagged images significantly enhances the explanatory power of the POI-based diversity measure, offering a richer and more nuanced perspective on urban spaces. In addition, we also analyze the impact of the estimated diversity on vitality across various land-use categories. These findings underscore the significance of our approach in advancing the study of urban diversity and its relationship with urban vitality, offering a novel and practical framework for understanding and designing vibrant urban spaces.
After discussing the relevant literature (Section 2), we present our methodology in Section 3, where we detailed how the new diversity indicators are derived (Section 3.3 and Section 3.4), as well as how neighborhood vitality proxy is calculated (Section 3.5). The proposed methodology and new indicators were empirically validated in Section 4. We provide an in-depth discussion of the proposed methodology in Section 5. This paper concludes in Section 6.

2. Literature Review

2.1. Urban Vitality and Its Quantification

The term “urban vitality” was initially expounded in her book The Death and Life of Great American Cities, where Jacobs posited that human activities and living spaces collectively constitute the diversity of urban life, which enhances urban vitality [7]. Subsequent scholars have enriched the concept. For example, Lynch (1960) defines urban vitality as the extent to which the settlement form supports human life such as functions, biological needs, and capacities [30]. Maas (1984) identifies three components of urban vitality: the continued presence of people in public places, the activities and opportunities available, and the environmental context [31]. Montgomery (1998) characterizes urban vitality by factors such as pedestrian traffic, cultural events, active street life, and the overall sense of liveliness, emphasizing the importance of human activity [32]. In general, urban vitality signifies the level of prosperity in neighborhoods, directly or indirectly reflecting the vibrant scenes generated by social activities in urban areas. Despite these conceptualizations, there has been a lack of empirical evidence [21].
Traditionally, census and/or survey data such as population density, employment, production, and urban services were used as proxies to quantify urban vitality [33,34]. These data are typically aggregated at the census tract level and are not able to capture urban vitality at refiner grains [35]. With the increasing availability of crowd-sourced geographic information [36], data from social network [37,38], mobile signaling [12,39], human mobility [40], and transit-smart-card records [41] have been employed in recent years to measure urban vitality at finer spatial and temporal scales [5].

2.2. Measuring Urban Diversity

According to Jacobs’ observation on urban development, diversity in urban design influences individuals’ willingness to visit some places; neighborhoods with a diverse design will ultimately enhance the vitality of urban neighborhoods [7]. Numerous scholars have systematically measured the diversity of urban design through the lens of the theory of diversity. The diversity indicators developed previously mainly focus on the mixing of land-use types [2,42,43] with various methods of quantification, including the area ratio [44], entropy index [45], dissimilarity index [46], Simpson’s index [47], and opportunity cumulative mode [41]. However, such methods often involve directly transferring indicators from other disciplines, such as biology and economics, into the calculation of urban diversity, without adequately considering the actual perception of the surrounding environment by individuals in urban contexts, as illustrated in Figure 1a, where only the semantic information within spatial units is considered. Moreover, data sources for assessing land-use mixture predominantly rely on individual data sources such as land-use surveys [48] and POI data [18].
Other researchers explored additional dimensions of urban diversity. For instance, Zhang et al. (2022) examined passenger diversity, spatial interaction diversity, and built-environment diversity [19]. Kang et al. (2021) incorporated activity diversity, spatial diversity, and temporal diversity to formulate a comprehensive diversity indicator [14]. While the concept of diversity has been quantitatively assessed from multiple perspectives, the functional and visual diversity of the built environment, especially scenarios perceived by people, has been insufficiently considered.
To this end, geo-tagged images have the potential to capture the functional and visual semantics of geographic scenes at finer grains, providing a human-level sensing of a place [25]. With the advancement in deep learning, machines have reached a human-level understanding of visual scenes [49]. This offers an accurate and efficient means for characterizing urban diversity from large-scale scene recognition, especially when crowd-sourced images are largely available. Recently, many studies focus on analyzing street-view images with deep learning to capture fine-grained perceptions of places (e.g., green-looking ratio [50], interface enclosure, street safety [16], aesthetics [6], etc.). However, street-view images mainly capture outdoor scenes on the streets. Geo-tagged images, on the other hand, include both outdoor and indoor scenes and events [25,49,51,52,53], which makes it possible to depict the urban scenes more comprehensively. We, therefore, aim to test if geo-tagged photos enhance the quantification of urban diversity.
Consequently, this study addresses two key gaps in the existing research: First, by combining POI data with geo-tagged images, it overcomes the limitations of traditional diversity calculations that rely on a single dimension, incorporating visual perception into the diversity assessment. Second, it incorporates the dynamic perception range of individuals into the diversity calculation (as shown in Figure 1, where different perception ranges are defined based on spatial unit area and accessibility) rather than solely considering the static diversity of the built environment within city regions.

3. Data and Methodology

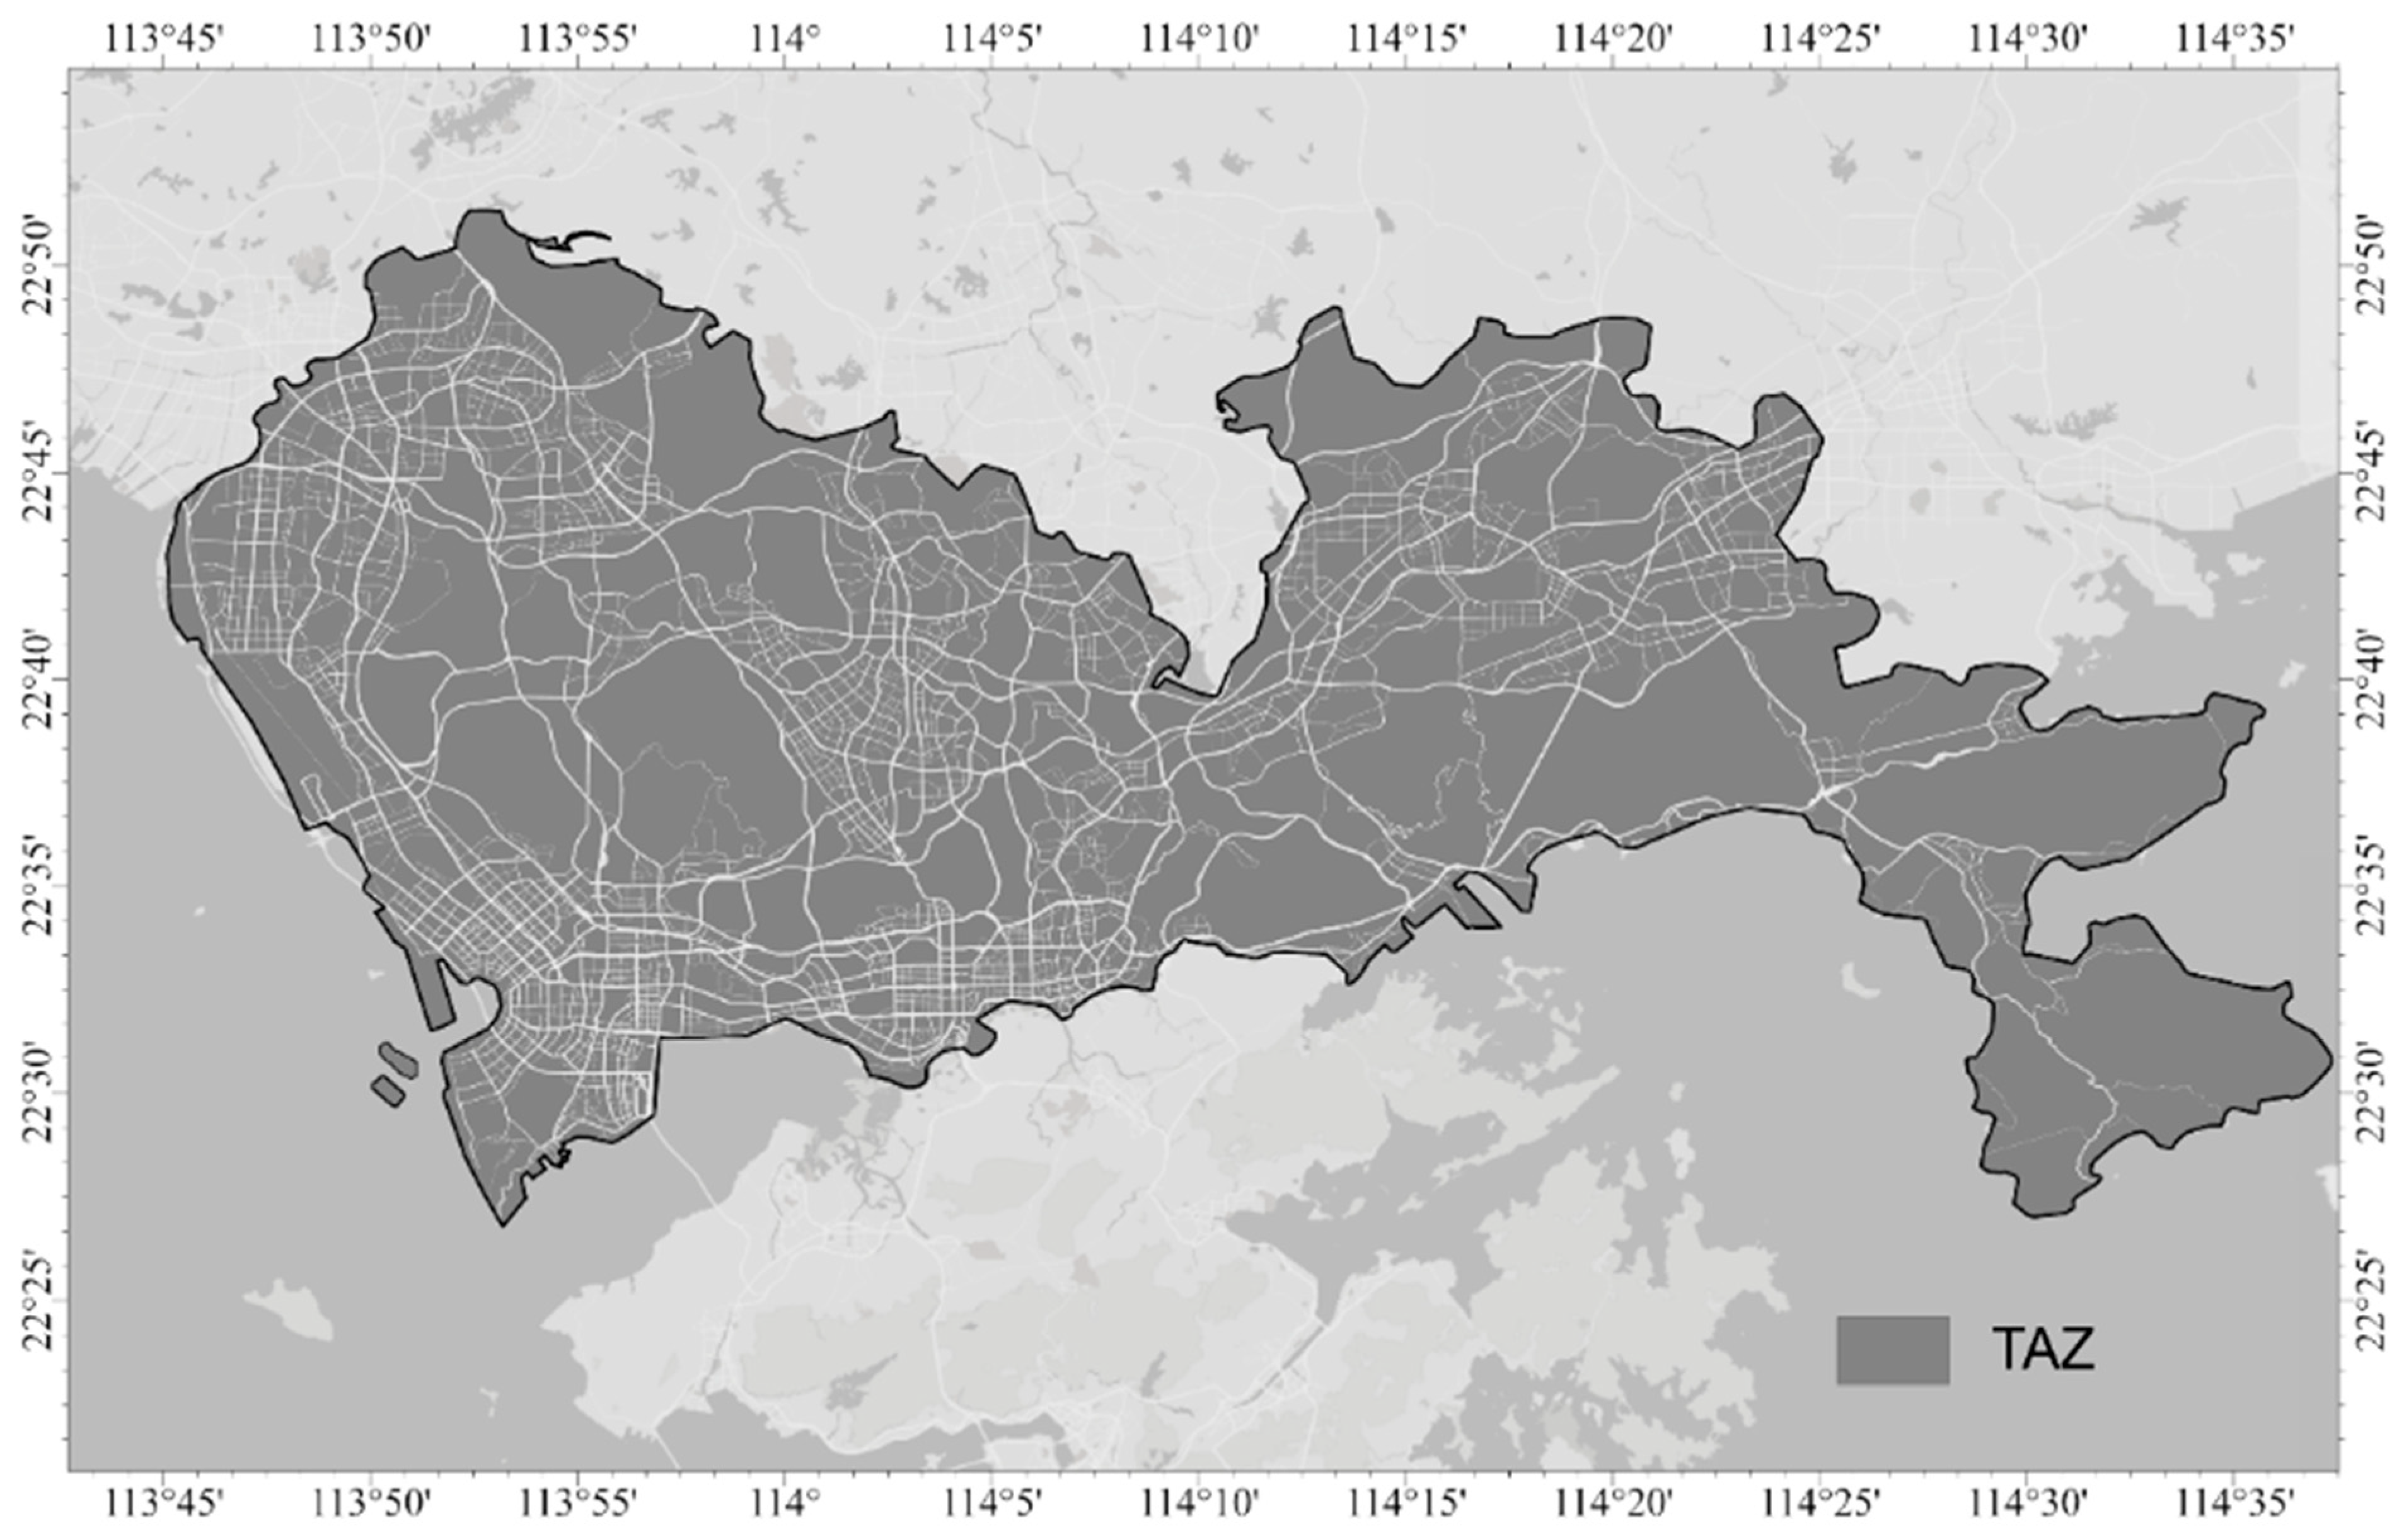
3.1. Study Area and Data Used

As a prominent special economic zone in China, Shenzhen is an emerging immigrant city, China’s economic hub, and an international metropolis. Meanwhile, a large number of studies have proved that there is a high positive correlation between vitality and urban diversity in this city [6,12,18]. Therefore, in this study, we choose Shenzhen as the study area. Extensive experiments have demonstrated that Traffic Analysis Zones (TAZs) represent fundamental geographic units characterized by similar demographic and socio-economic attributes, making them widely utilized in urban and transportation research [17,18]. Here, TAZs were delineated based on the primary, secondary, tertiary, trunk, and motorway segments of the OpenStreetMap (OSM) road network. Each TAZ underwent meticulous verification and correction by overlaying the latest Google Remote Sensing imagery. This process involved eliminating excessively small parcels and consolidating fragmented parcels to ensure the logical construction of each TAZ. The outcomes of this procedure are illustrated in Figure 2 below.
The data used in this study are outlined in Table 1 and described in the following:
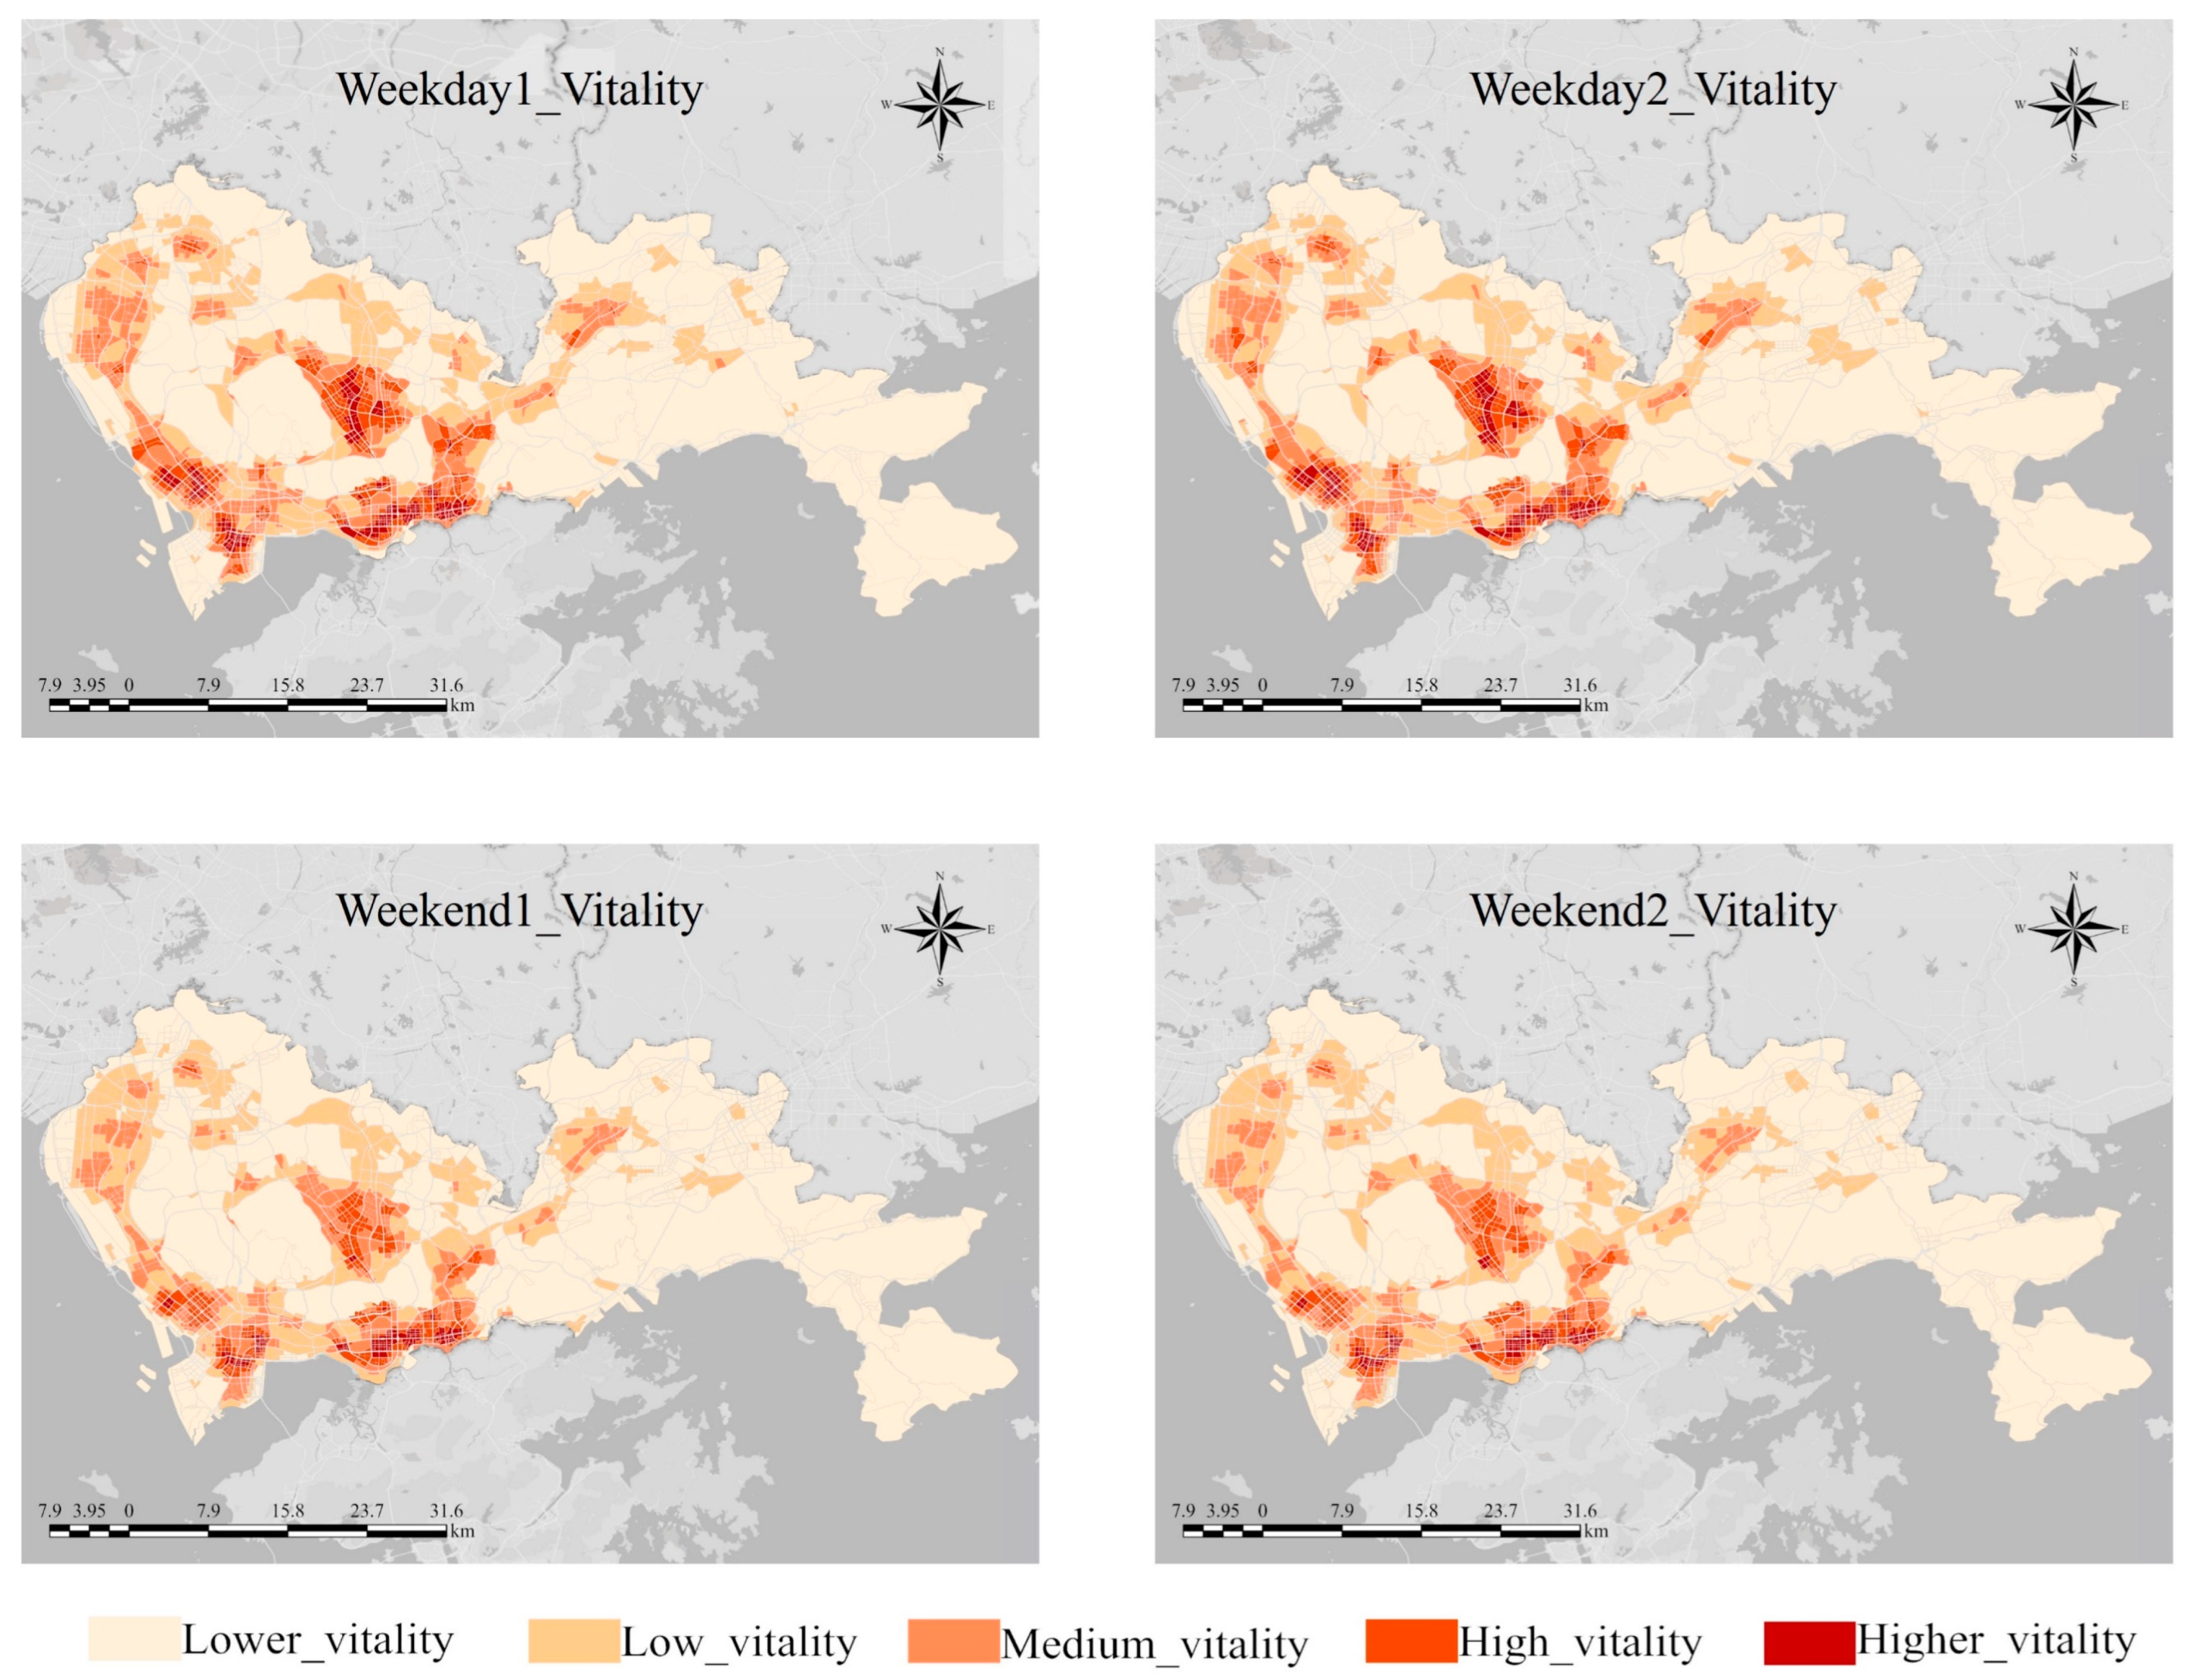
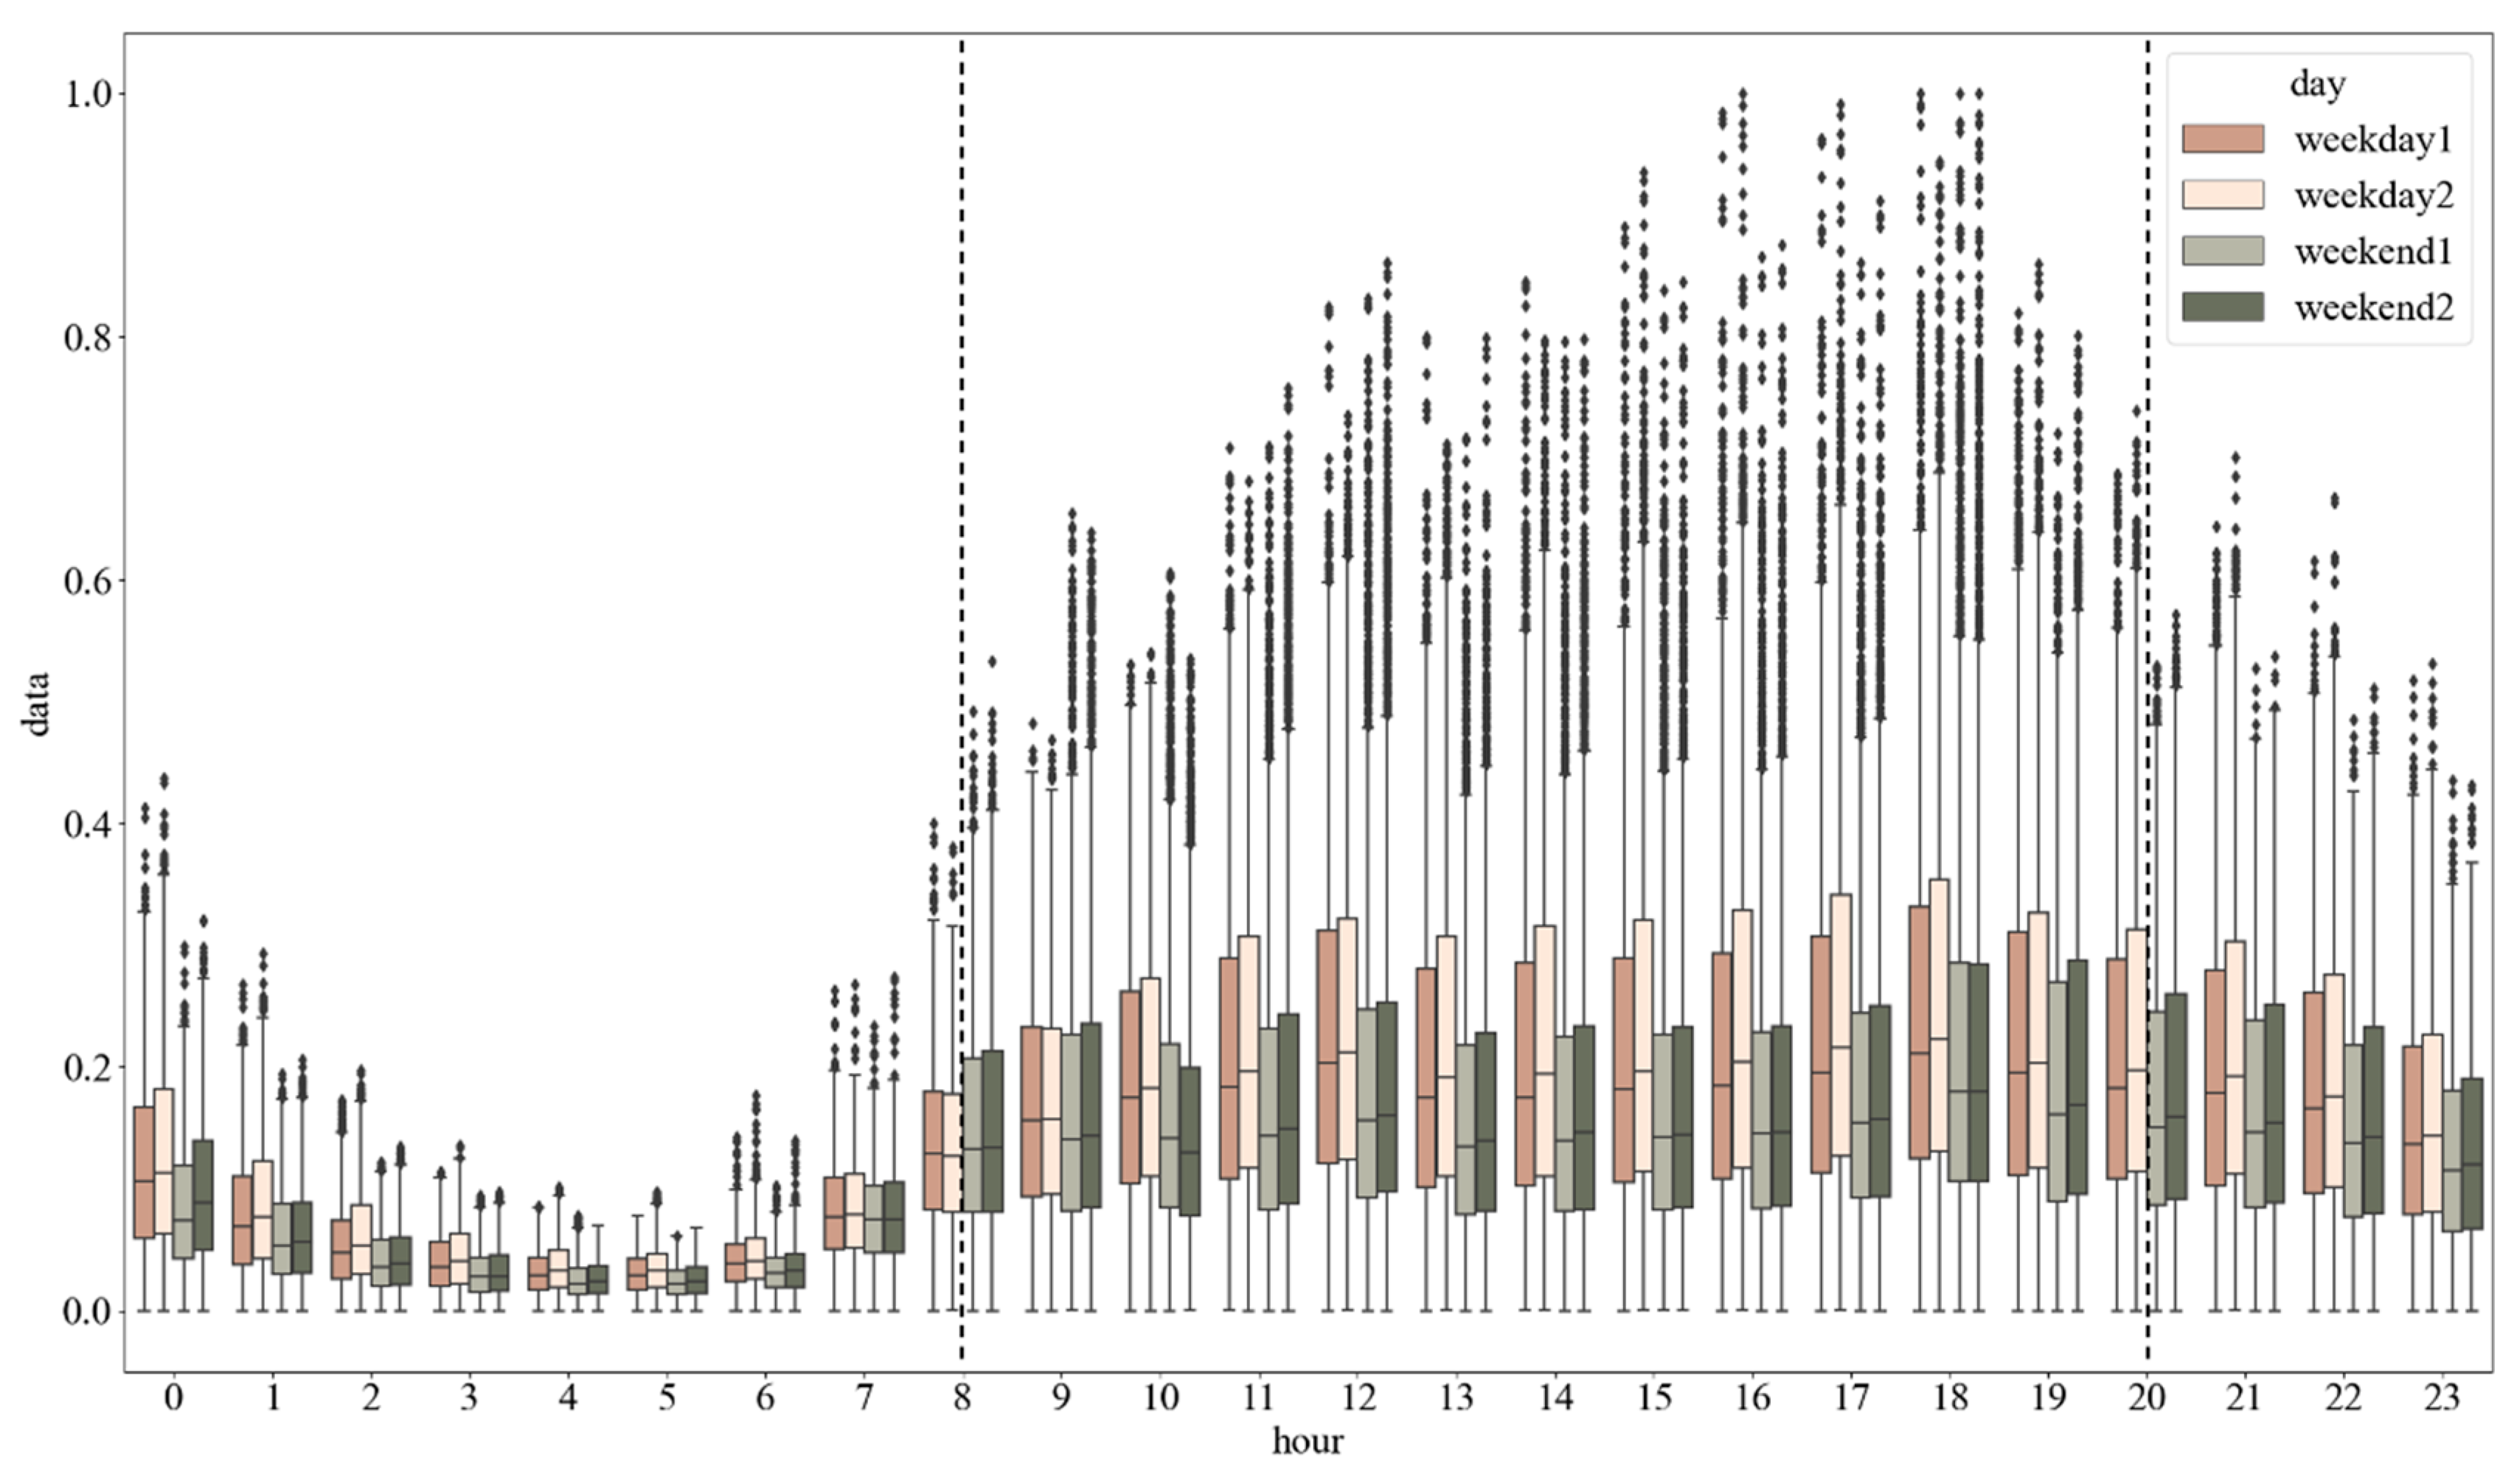
  • Baidu heatmap: Baidu heatmap describes the total number of times visit locations are visited by people at any time of the day [54]. Therefore, the 24 h Baidu heatmap is used here as a surrogate for urban vitality. To understand the interplay between the proposed diversity indicator and vitality and its variations, Baidu heatmaps for two weekdays and two weekends (spanning 7–10 January 2023) were chosen as the vitality proxies for this study.
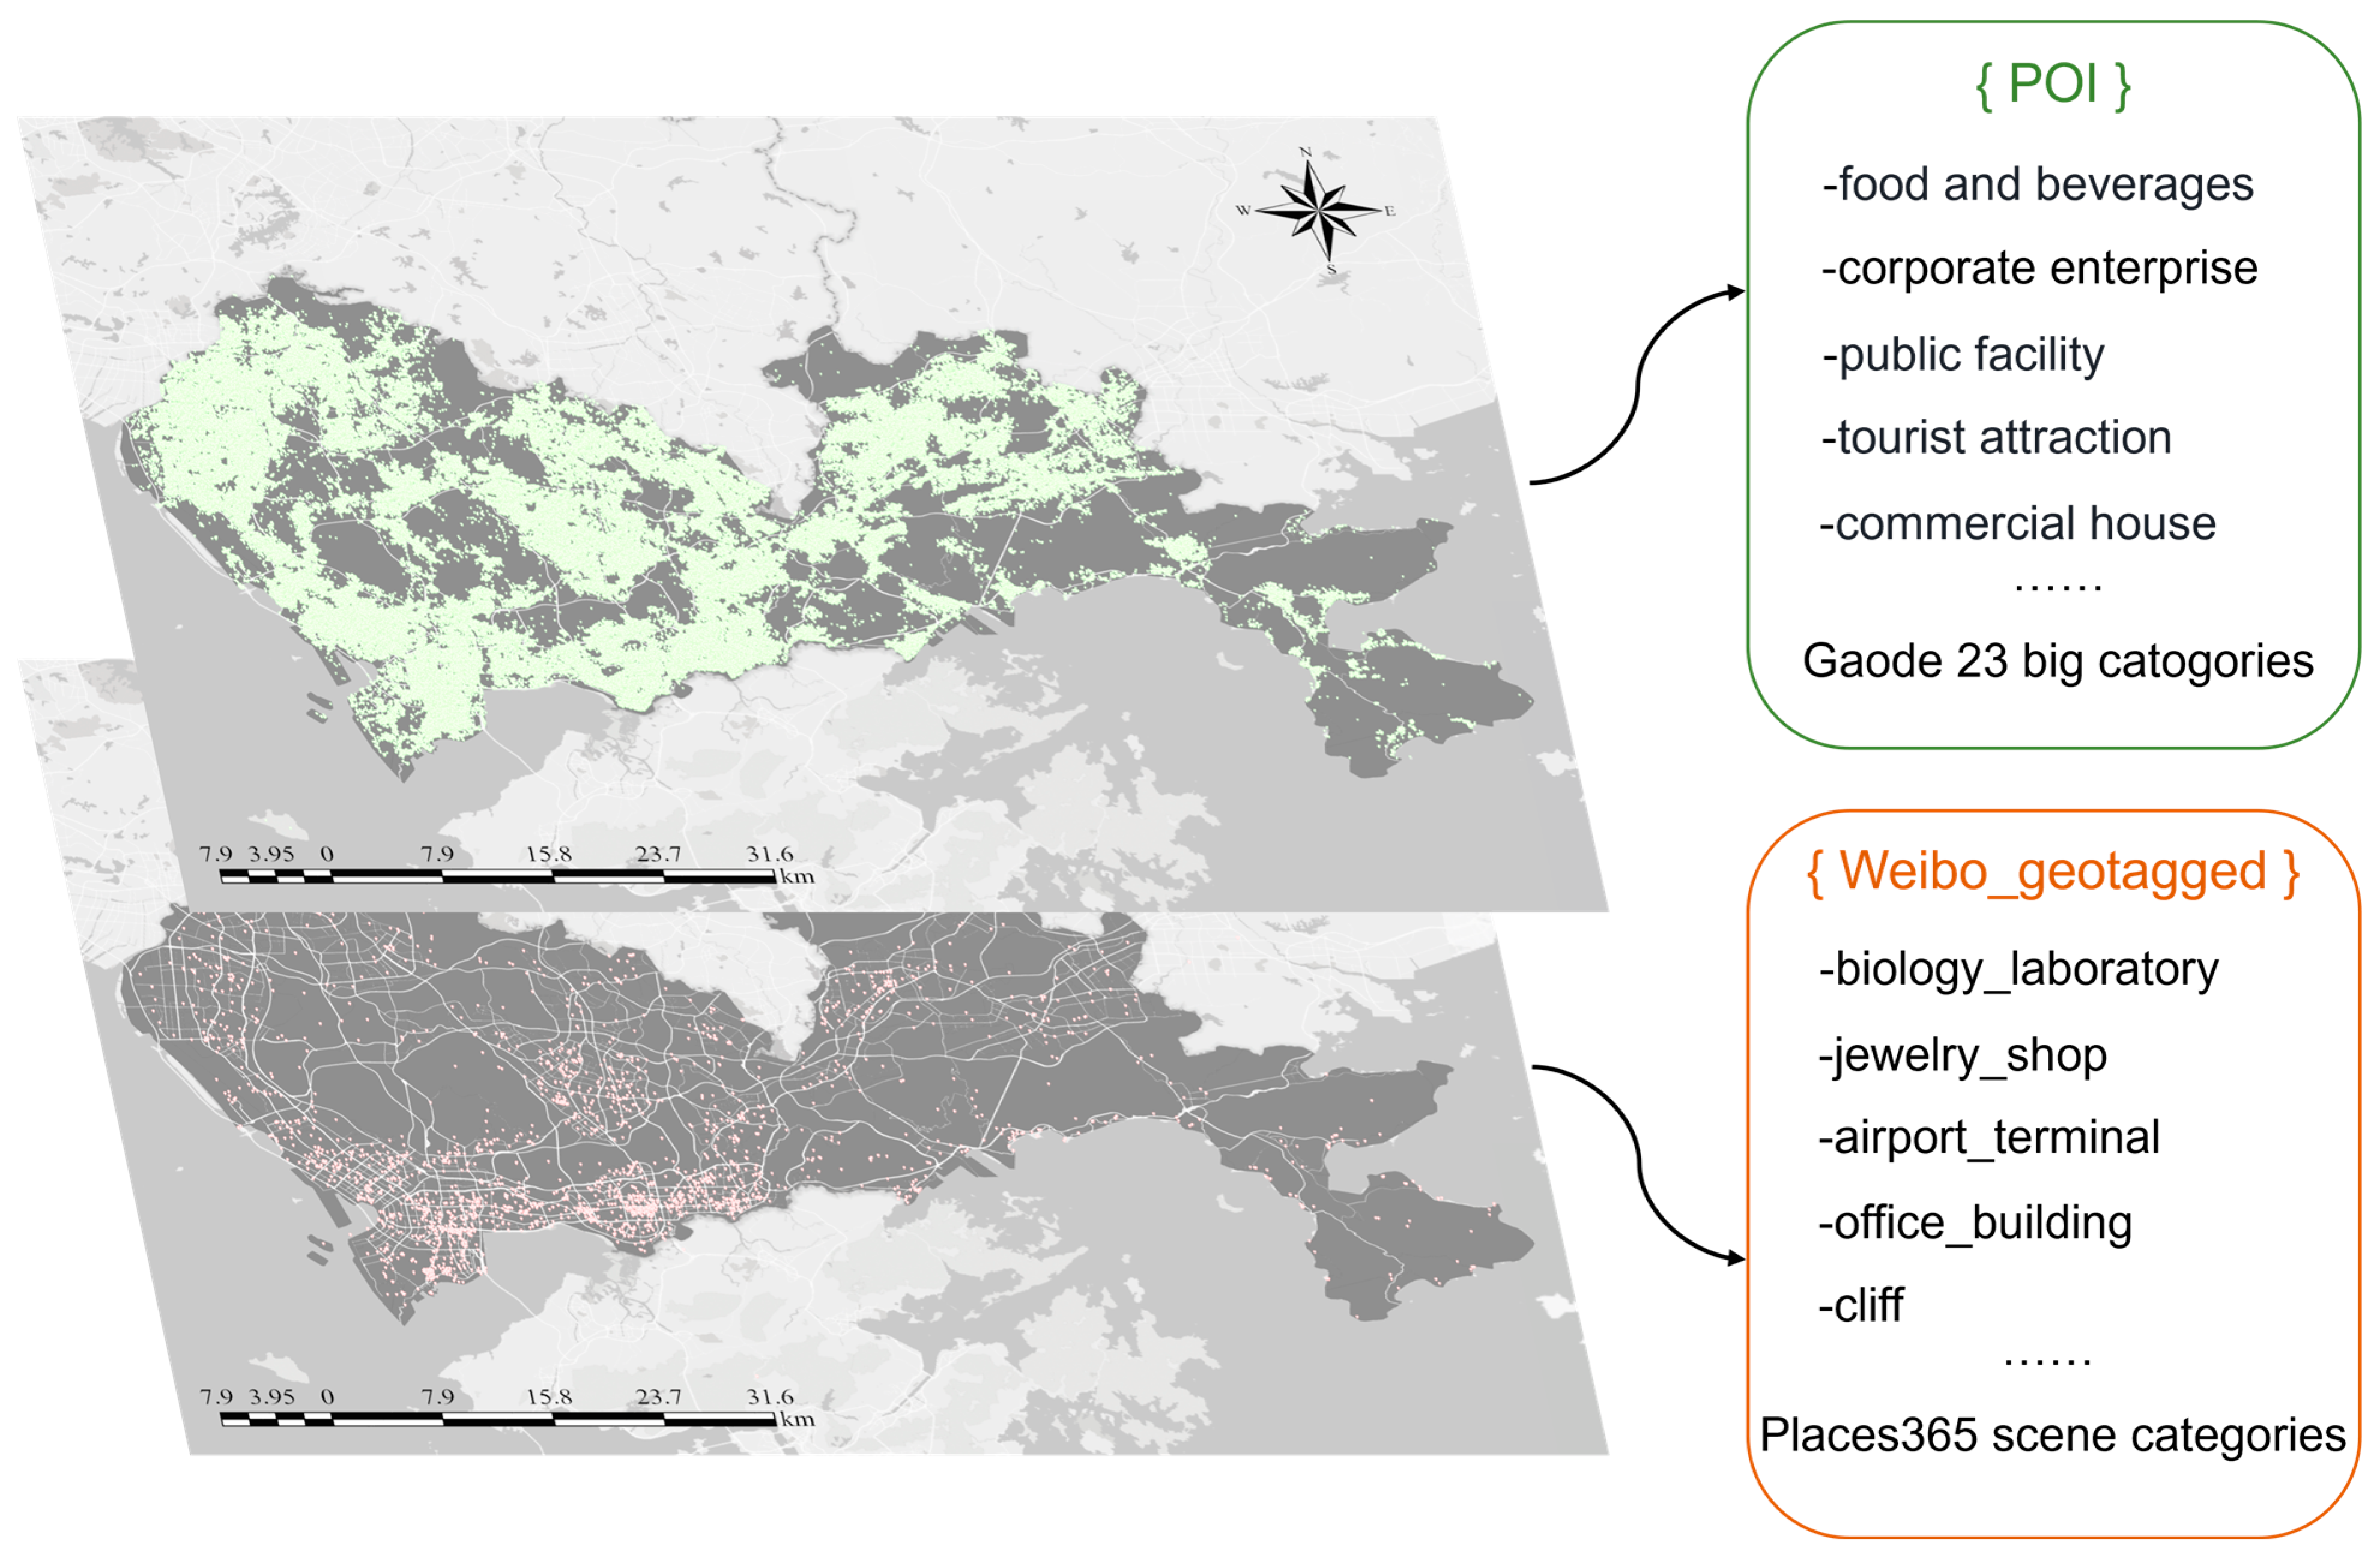
  • Gaode POI: The POI dataset is sourced from Gaode Maps, a major platform that offers map services in China. As of June 2022, this dataset comprises over 600,000 POIs under 23 major categories specific to Shenzhen. The functional attributes of POIs and their spatial distribution are shown in Figure 3.
  • Geo-tagged images: Geo-tagged data derived from the Weibo, a famous social media in China. Weibo-geo-tagged image dataset comprises images shared by users on the Weibo platform. We extracted 75,663 images from Weibo check-in data from December 2022 to March 2023. After the data cleaning and screening, 41,055 valid images were obtained. The spatial distribution of the images and scene categories are shown in Figure 3.
  • Shenzhen planning map: Shenzhen planning map is obtained from Shenzhen municipal government, which mainly includes 11 types of land use.

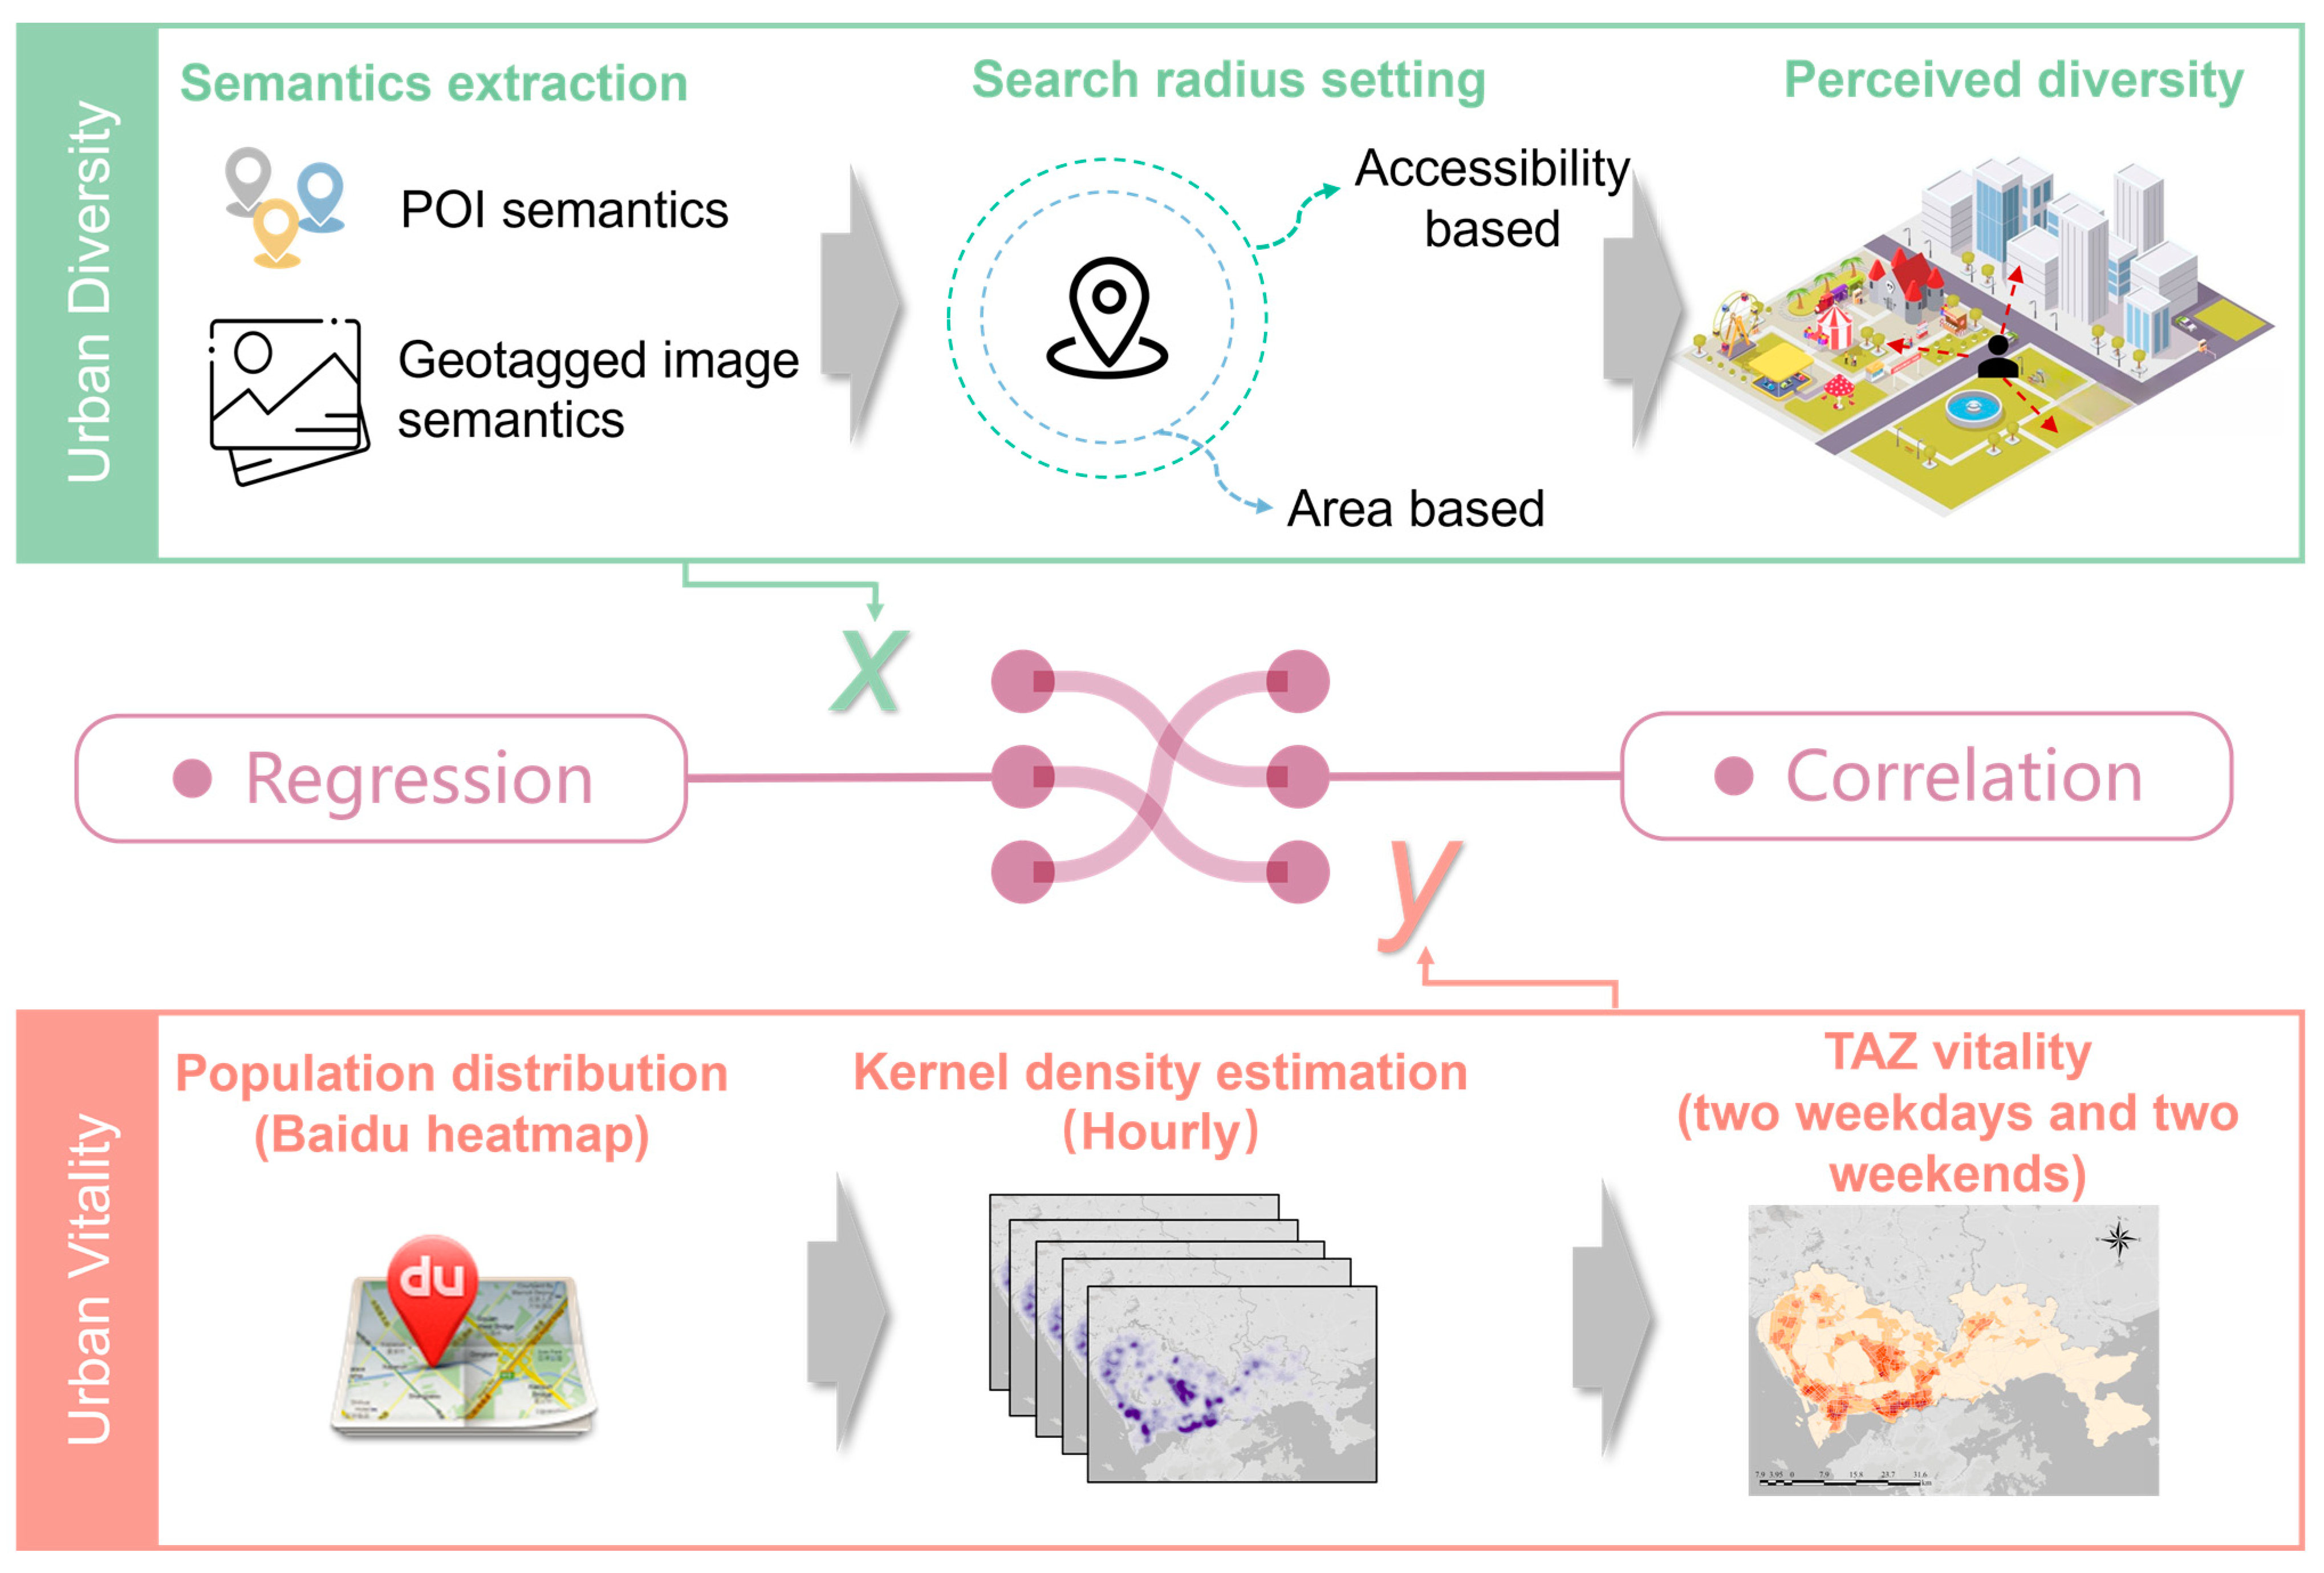
3.2. Overall Framework

The overall research framework of this study consists of three parts and is depicted in Figure 4. Firstly, we measure urban semantics by extracting functional semantics (e.g., food service, companies, public facilities, business residence, etc.) from POIs and scene visual semantics (e.g., airfield, amusement park, classroom, living room, etc.) from geo-tagged images (i.e., Weibo check-in data), respectively (Section 3.3). Then, perceived diversity indicators are devised to better estimate diversity for each Traffic Analysis Zone (TAZ) using POI and/or geo-tagged images. In the perceived diversity indicators, the classic Shannon diversity measure was adapted using area- and accessibility-based rules (Section 3.4). Secondly, urban vitality was measured by estimating kernel density (KDE) at the TAZ level using population distribution (Baidu heatmap) on weekdays and weekends. Finally, we evaluate how the perceived diversity correlate to the measured vitality. Additionally, the contribution of diversity to vitality under various dominant land-use types per TAZ was examined using linear regression analysis.

3.3. Extraction of Urban Semantics

In this study, urban semantics mainly consists of functional and scene visual semantics. We use the category types of POIs to express urban functional semantics. For scene visual semantics, we use a deep scene recognition model (e.g., Places365 [49]) to detect urban scene categories from geo-tagged images. However, extracting scene visual semantics is not straightforward as geo-tagged images can be noisy and the pre-trained Places365 model needs to be further validated for our dataset. Therefore, we follow the four steps outlined in Section S1 of the Supplementary Materials (data preparation, data cleaning, scene recognition, and validation) to extract semantics from geo-tagged images (Supplementary Figure S1).
Finally, the scene categories recognized from geo-tagged images were grouped into 16 broader categories (Supplementary Figure S2) before the entropy-based diversity estimation. This is because the recognized scene categories (365 categories) significantly outnumber the types of POIs (23 categories). This can lead to a substantial disparity between the entropy calculation for POI functions and scene visual semantics. In doing so, the confidence of the predicted labels of an image under the 365 categories was aggregated to characterize the likelihood of the new label (under the 16 categories) (see Section S2 of the Supplementary Materials for more details).

3.4. Perceived Diversity Indicators

Traditional approaches to urban diversity estimation have predominantly relied on Shannon’s diversity indicator (SHDI). However, such approaches suffer from the MAUP issues (see Section 1). Here, we propose to address the issues by exploring two extensions: (1) area-based Shannon’s diversity indicator (AREA_SHDI) and (2) accessibility-based Shannon’s diversity indicator using the Gaussian two-step floating catchment area method (2SFCA_SHDI). In the following, we first introduce the SHDI in its original form and then describe in detail the two new diversity indicators.

3.4.1. Shannon’s Diversity Indicator (SHDI)

First, the percentage of each type of geo-tagged data (either POI or images in our study) in each TAZ was calculated. This procedure calculates the traditional entropy (diversity) for each TAZ using Equation (1):
S H D I = i = 1 m P i × l n P i
where we have m categories of geo-tagged data in a spatial unit (i.e., a TAZ zone); P i is the frequency of each category in all categories within the unit.

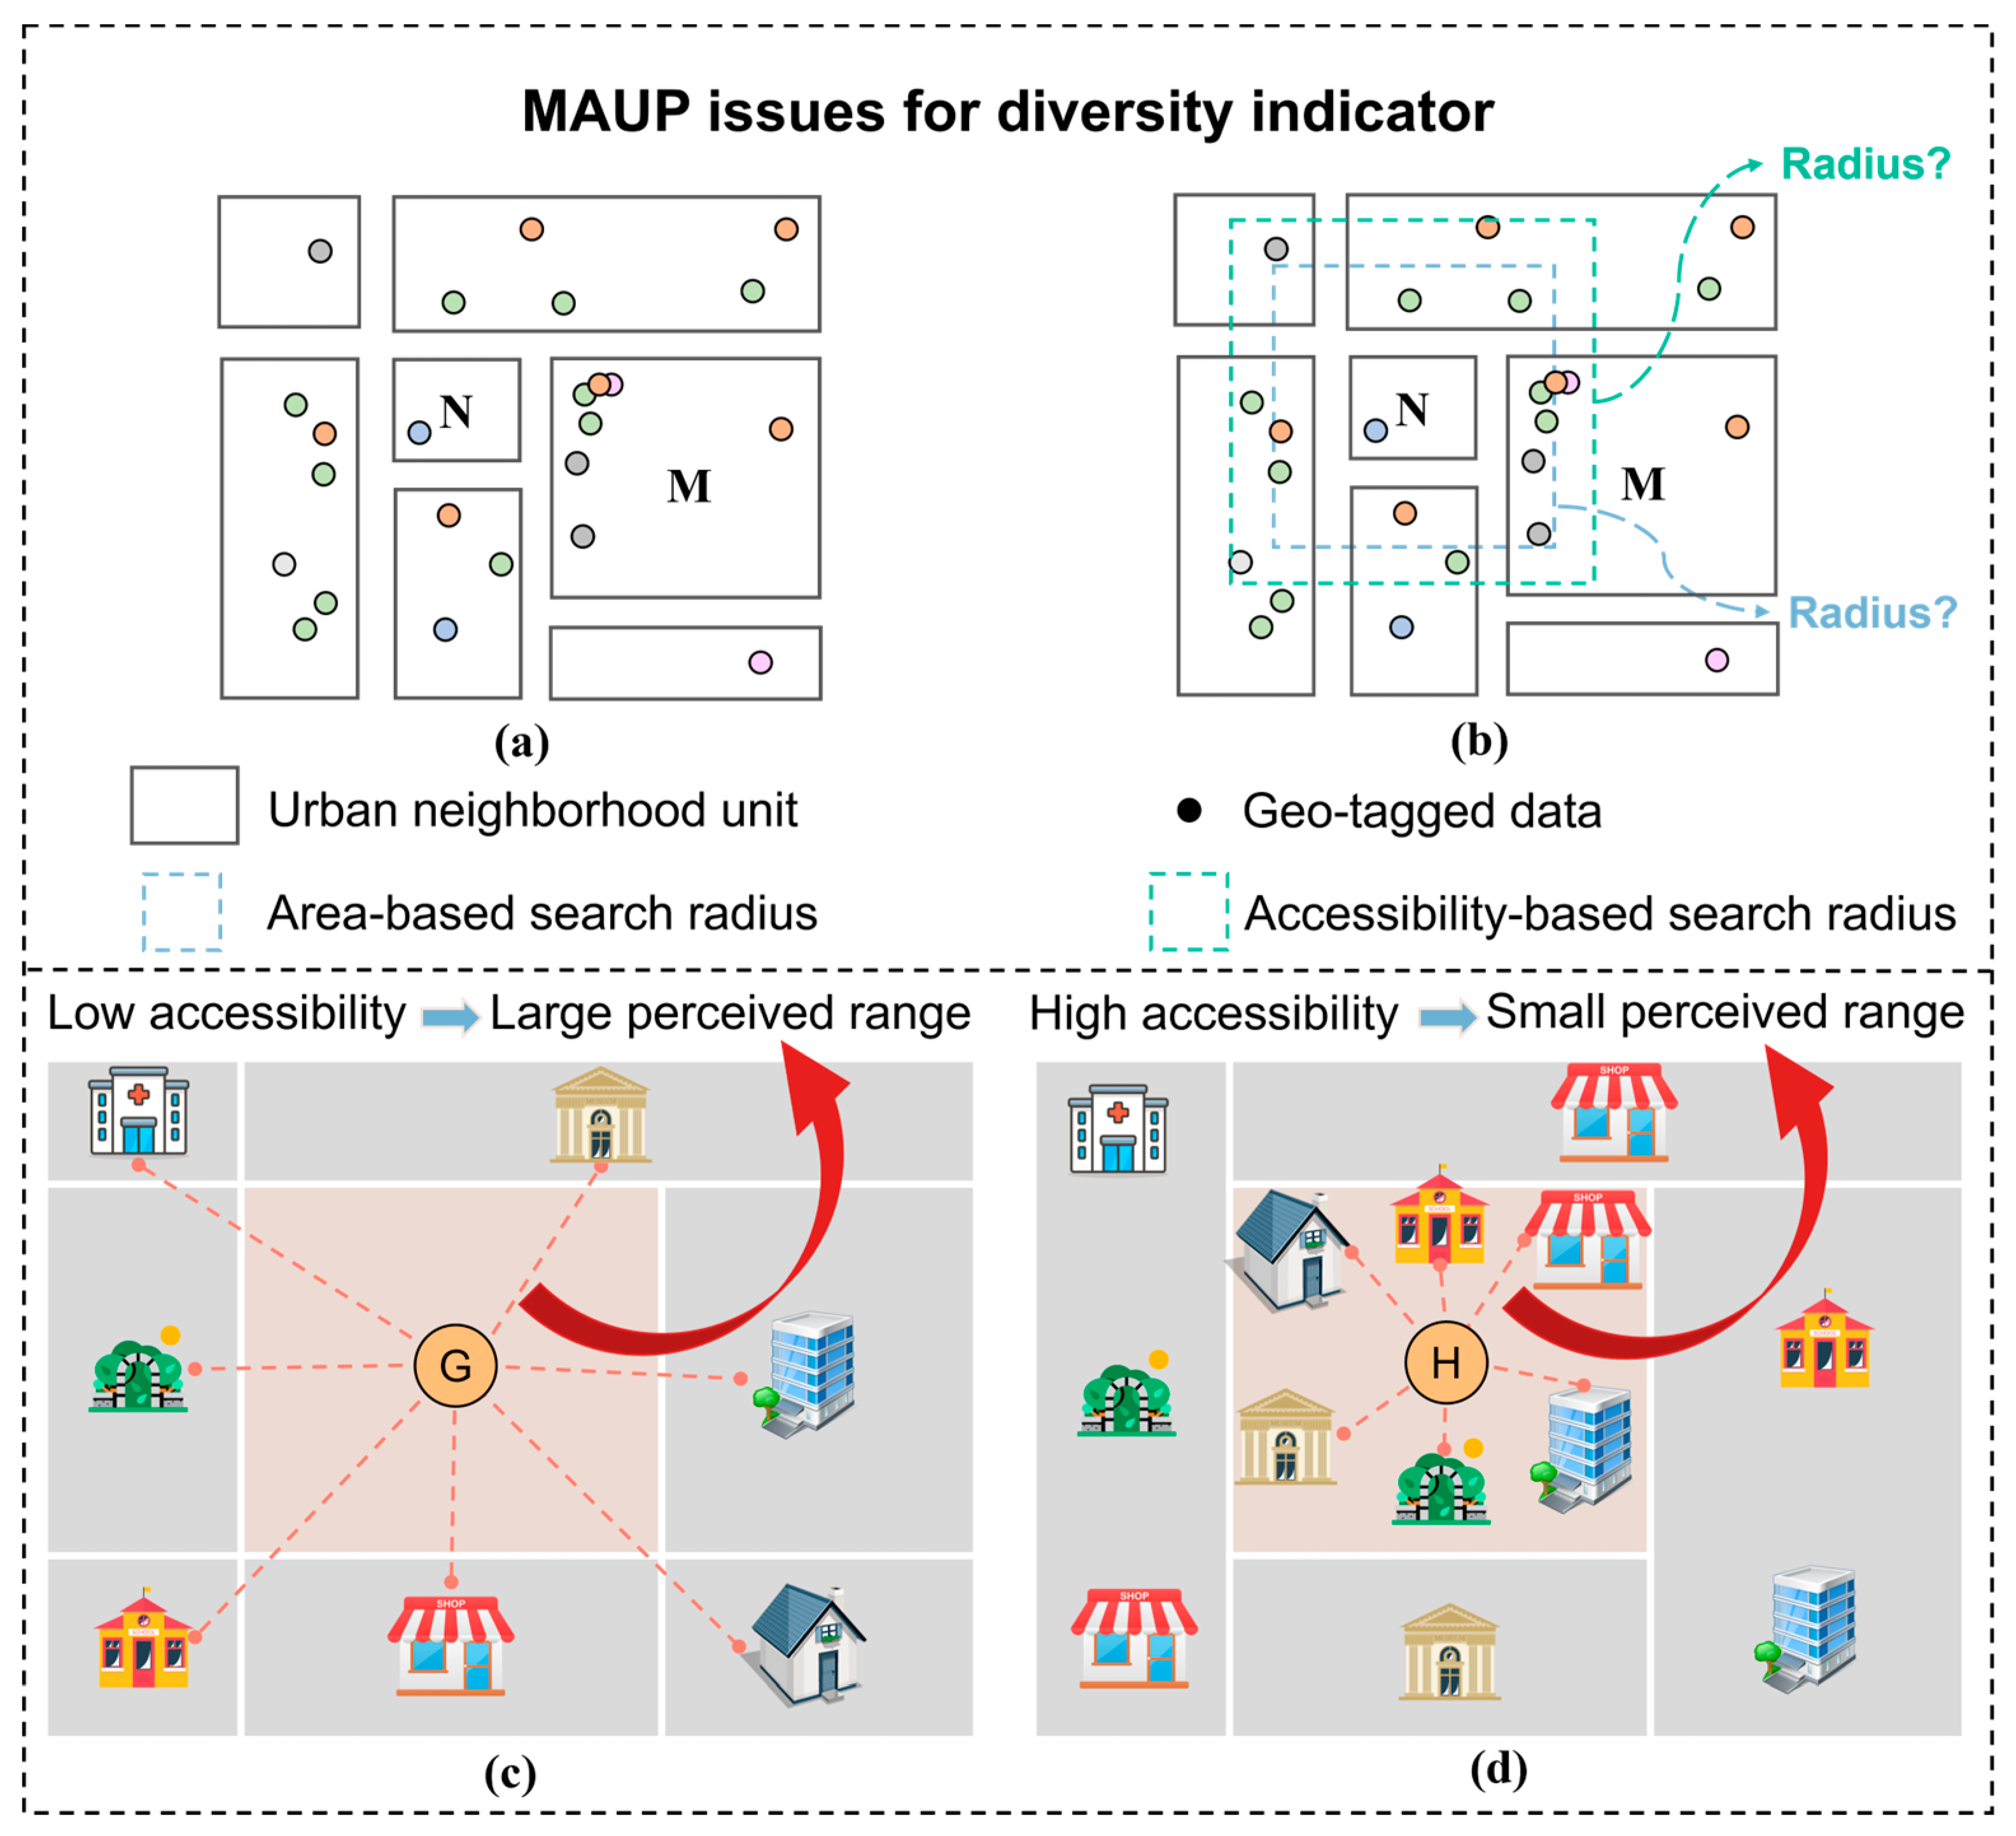
3.4.2. Area-Based SHDI

As discussed in Section 1, the traditional Shannon’s diversity indicator (SHDI) has inherent limitations. That is, our perception of diversity in a spatial unit can go beyond its boundary in certain conditions. Here, we expand the search radius of different spatial units based on the idea that smaller spatial units are allocated a larger search radius to avoid underestimation in diversity estimation. The search radius is calculated as follows (see also Figure 5):
S e a r c h _ r a d i u s = 0 ,                   i f   A r e a i > A r e a a v g + 3 A r e a s t d C / A r e a i , i f   A r e a i A r e a a v g + 3 A r e a s t d
where A r e a i denotes the area of the current spatial unit; A r e a a v g and A r e a s t d denote the mean and standard deviation of the areas of all spatial units; the constant C specifies that the search radius is limited to 1000 when A r e a i takes the minimum value ( A r e a m i n ); the search radius is set to 0 when A r e a i   >   A r e a a v g + 3 A r e a s t d . Figure 5 illustrates the search radius as a function of the area of the spatial unit. Then, the geo-tagged data fall in the extended radius are considered in Equation (1) to calculate the diversity (i.e., AREA_SHDI).

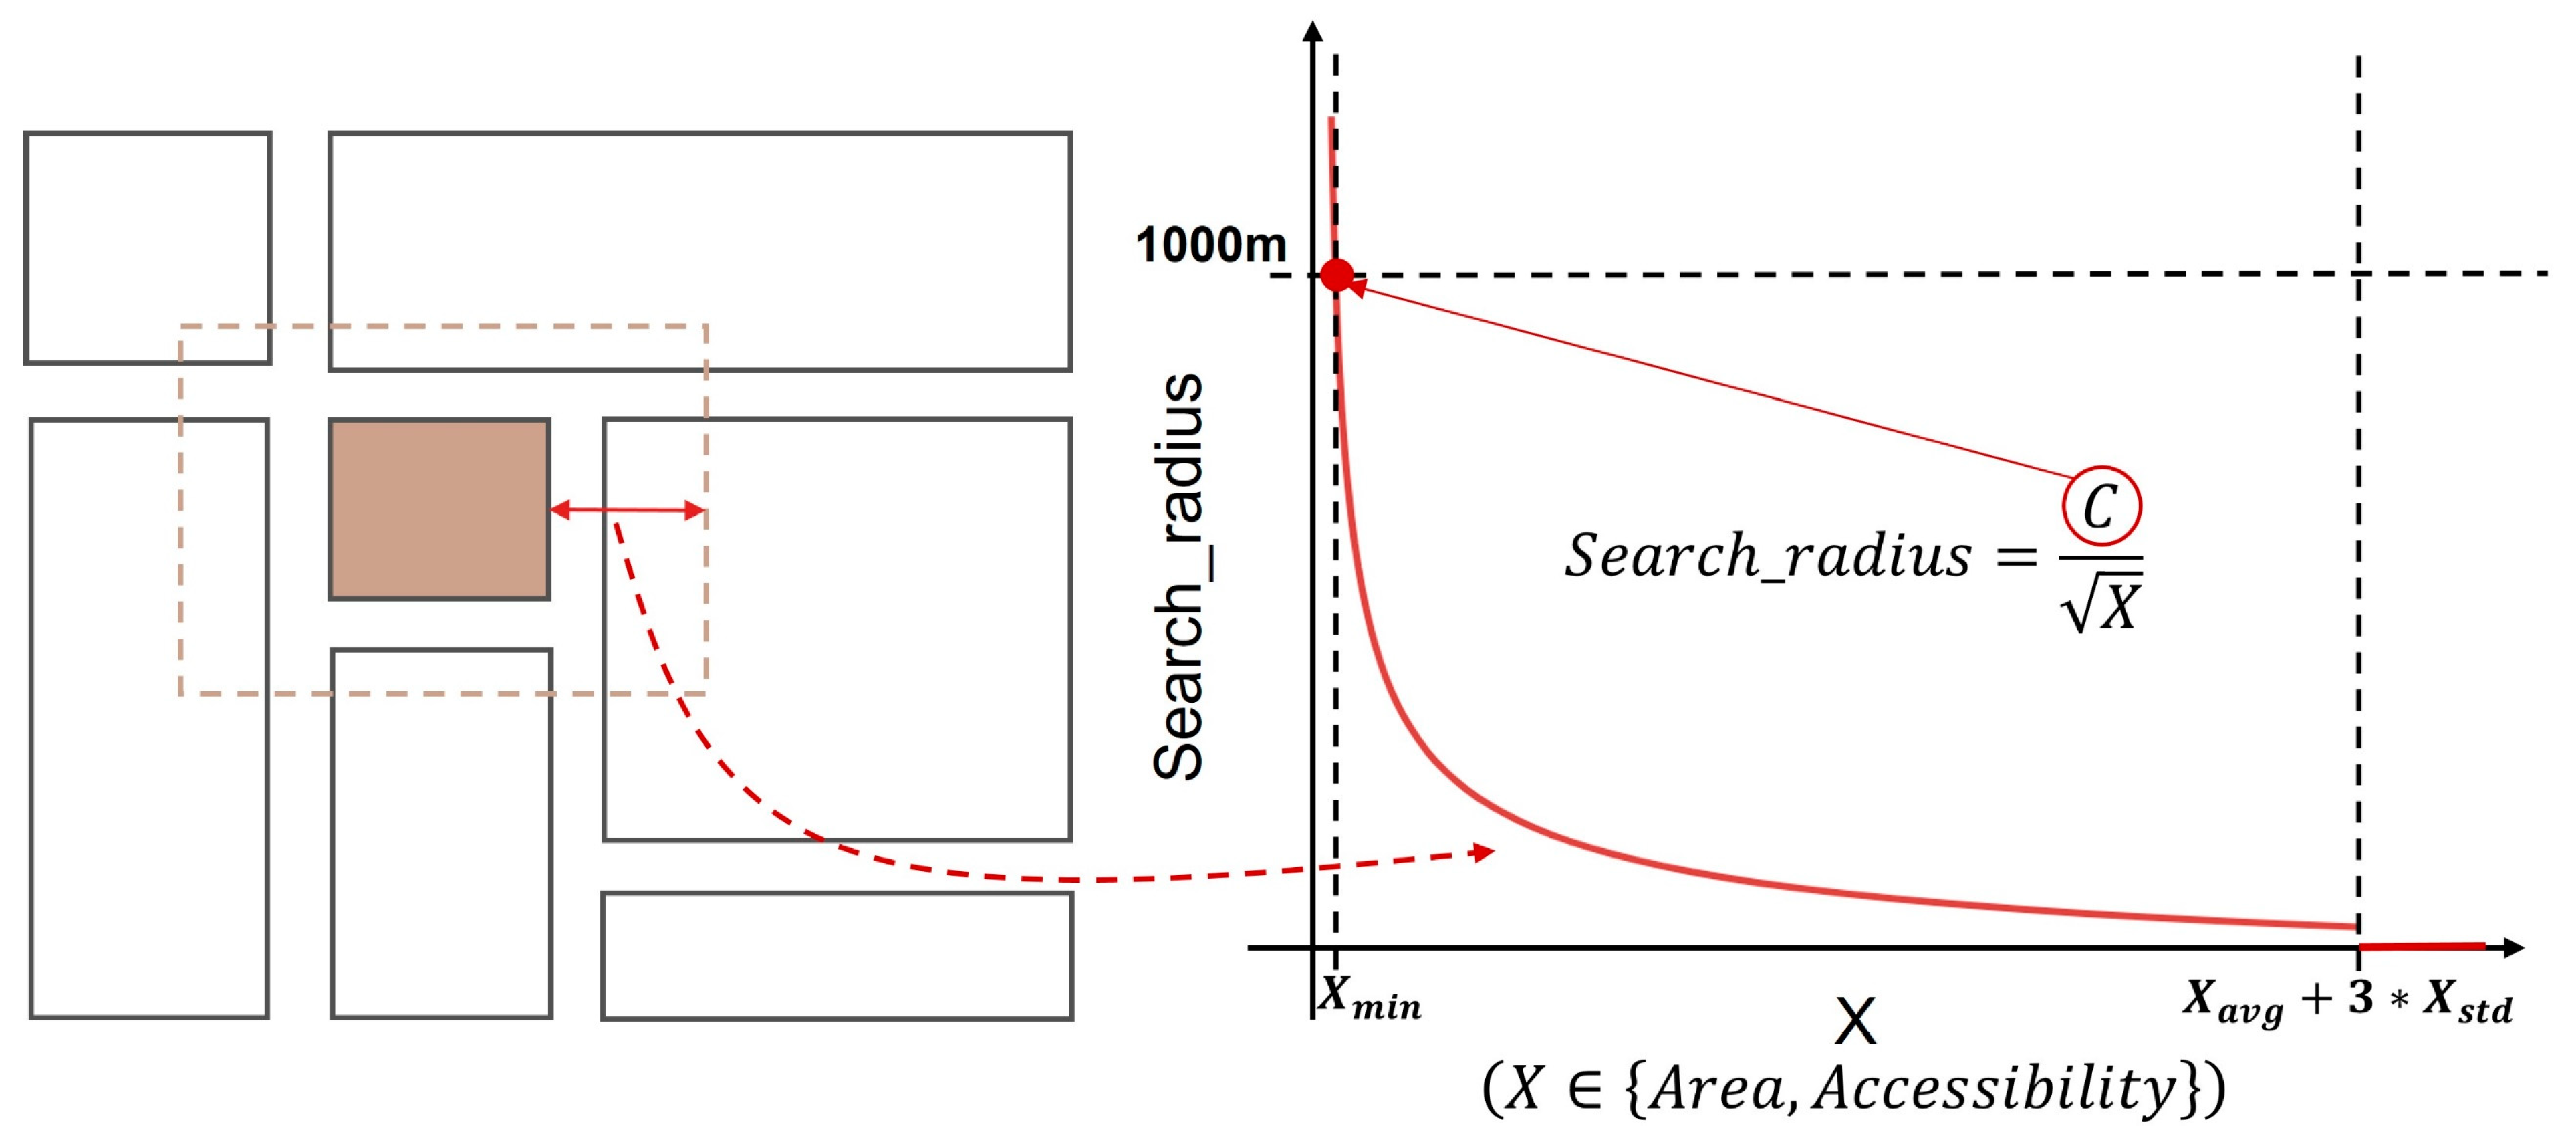
3.4.3. Accessibility-Based SHDI

A detailed look into the problem seems to indicate that the above area-based diversity calculation is just a rough estimation of the search radius. Here, we further hypothesize that the perception range of people for diversity can be different for spatial units of the same size depending on their accessibility to nearby resources (e.g., land-use types). Hence a unit’s search radius can be adjusted based on its accessibility properties. First, the Gaussian two-step floating catchment area method (2SFCA) [55,56] is used here to characterize the accessibility of a spatial unit to nearby land-use types (Ai). Then, Ai, its average (Aavg), and standard deviation (Astd) across all spatial units are used to substitute the Areai, Areaavg and Areastd in Equation (2) to calculate the search radius for 2SFCA_SDHI. Finally, geo-tagged data points falling within this new search radius are considered in the 2SFCA_SHDI calculation using Equation (1). The accessibility of a spatial unit is calculated as follows:
A i = l d i l d 0 G d i l , d 0 R l
where A i denotes the accessibility of the ith spatial unit, and dil denotes the distance from the ith spatial unit to the surrounding land-use type l; all land-use parcels close enough (dil < d0) are considered. In this study, we set d0 = 1000 m, which is consistent with the concept of 15 min living circle [57,58]. Rl denotes the total number of potential users of land-use type l, which represents the supply-to-demand relation. G d i j , d 0 is the weight coefficient of Rl, which is a Gaussian distance decay function to model the effect that Rl decreases with distance. The calculation of Rl is described in Equation (4):
R l = S l i d i l d 0 G d i l , d 0 P i
where S l denotes the degree of supply (area) of the lth land-use type; Pi denotes the degree of demand (population) of the ith spatial unit. Finally, the specific form of the Gaussian distance decay function is given in Equation (5):
G d i l , d 0 = e ( 1 2 ) × ( d i l d 0 ) 2 e ( 1 2 ) 1 e ( 1 2 ) 0 ,   d i l > d 0 , d i l d 0

3.5. Vitality Proxy

The specific construction process of vitality indicator involves analyzing the 24 h population distribution (we used Baidu heat map grid data sampled at a 200 m interval) for two weekdays and two weekends. First, we carried out kernel density estimation (KDE) on the population data per hour. Then, we averaged the previous density as the daily average vitality proxy for weekdays and weekends. Finally, the vitality proxy is normalized and spatially mapped within TAZ units, yielding the TAZ vitality in subsequent analysis.

3.6. Correlation Analysis

In this study, the Pearson correlation coefficient was initially employed to investigate the correlation between TAZ vitality and the three diversity indicators (SHDI, AREA_SHDI, and 2SFCA_SHDI) derived from both POI and Weibo-geo-tagged data. Additionally, the bivariate Moran’s I [59] was utilized to examine the spatial correlation degree and formulated in the following equation:
I k l = x k i x ¯ k S k 2 j = 1 n W i j x l j x ¯ l S l 2
In addition, this study further explores the extent to which diversity contributes to vitality under each dominant land-use type. The dominant land-use types are obtained by selecting the land-use type from government planning map with the largest area within each TAZ unit. Next, the following linear regression with group data (Equation (7)) is taken to observe the contribution of diversity to vitality under each dominant land-use type based on the regression fit coefficients.
V = W x r e s i d e n t i a l , x i n d u s t r i a l ,   x g r e e n   s p a c e + E

4. Results and Analysis

4.1. Explorative Analysis

In the exploratory analysis section, we analyzed the spatial distribution of urban vitality and various urban diversity indicators (including traditional diversity, area-based diversity, and accessibility-based diversity). This allowed us to investigate the spatial differences between these diversity variants. Furthermore, we examined the spatial consistency between the proposed “perceived diversity” and urban vitality based on their spatial distributions.

4.1.1. Spatial Distribution of Vitality Proxy

The spatial distribution of TAZ vitality on weekdays and weekends is depicted in Figure 6, and the vitality values are classified into five categories (higher, high, medium, low, and lower). In general, the southwest corner and central-southern parts of Shenzhen exhibited higher vitality on both weekdays and weekends, representing the core urban areas with concentrated human activity, while the eastern and northwestern parts displayed extensive areas of low vitality. In addition, the distributions of vitality were relatively decentralized on weekdays, with a higher concentration of human activity in the central and western parts, as well as in the central urban areas in the south. On weekends, vitality is more concentrated in the southern part of the city, with a slight decrease in the value of vitality in the areas around the central urban areas compared to weekdays.

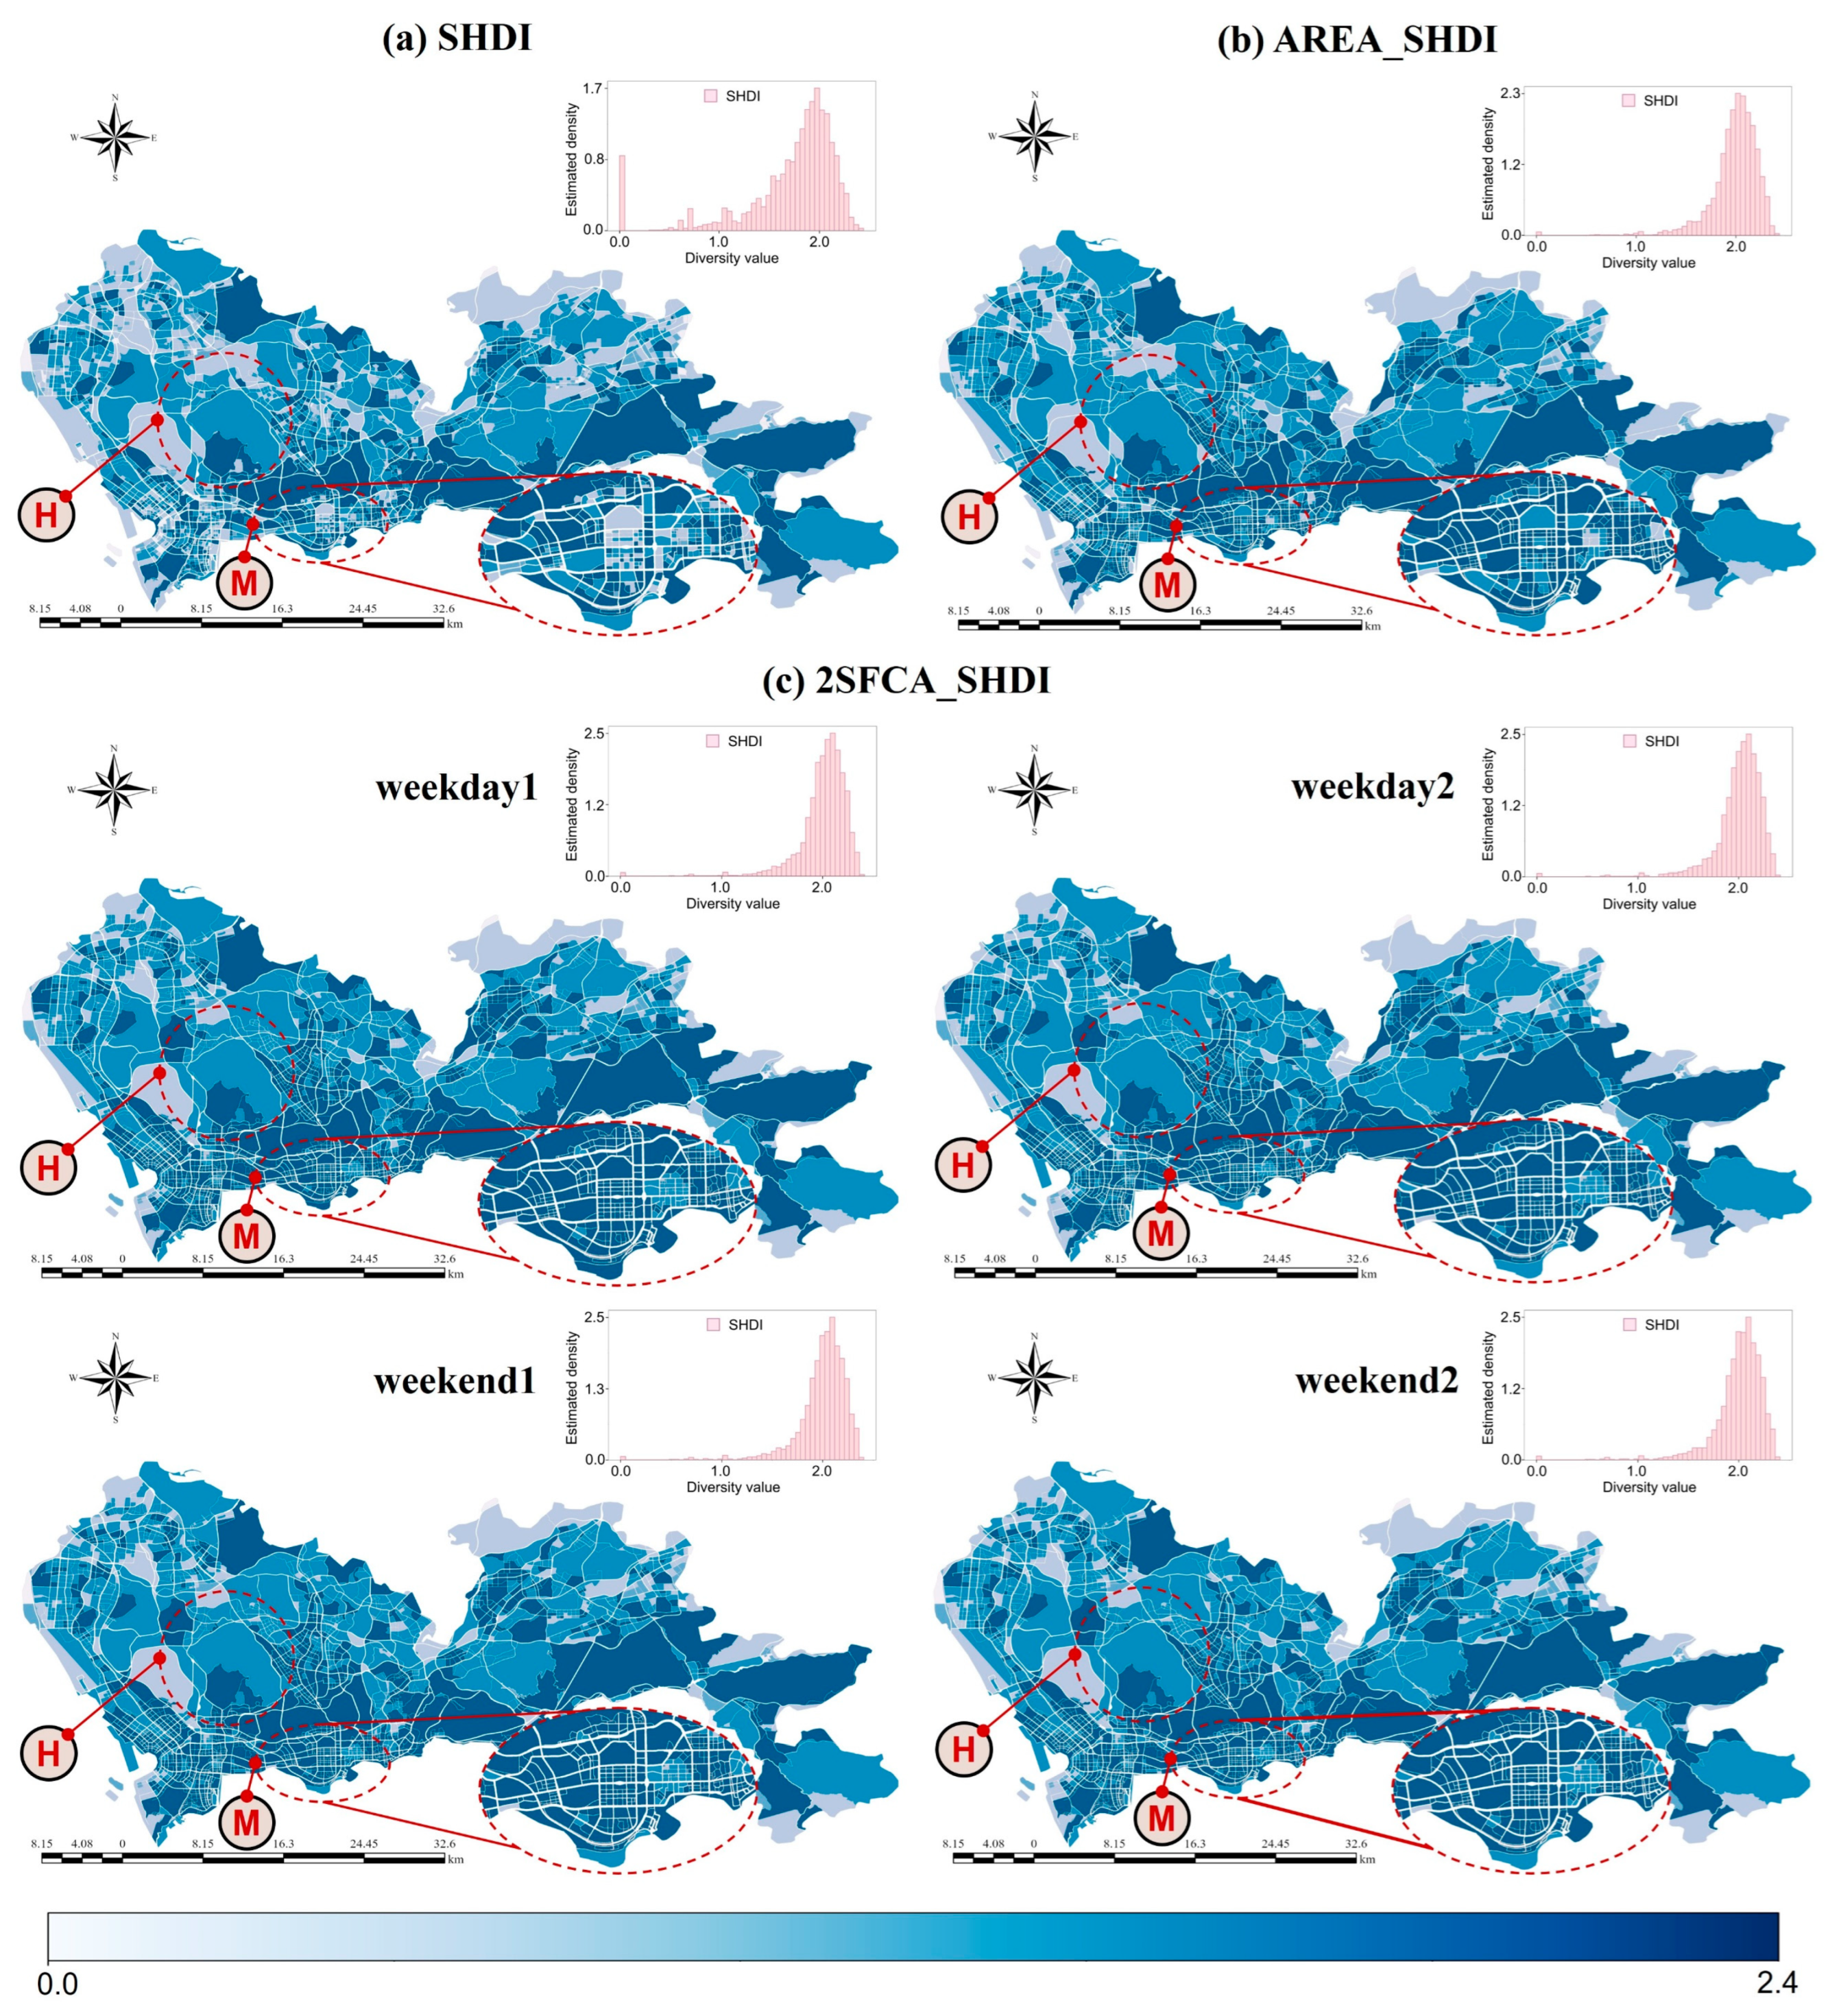
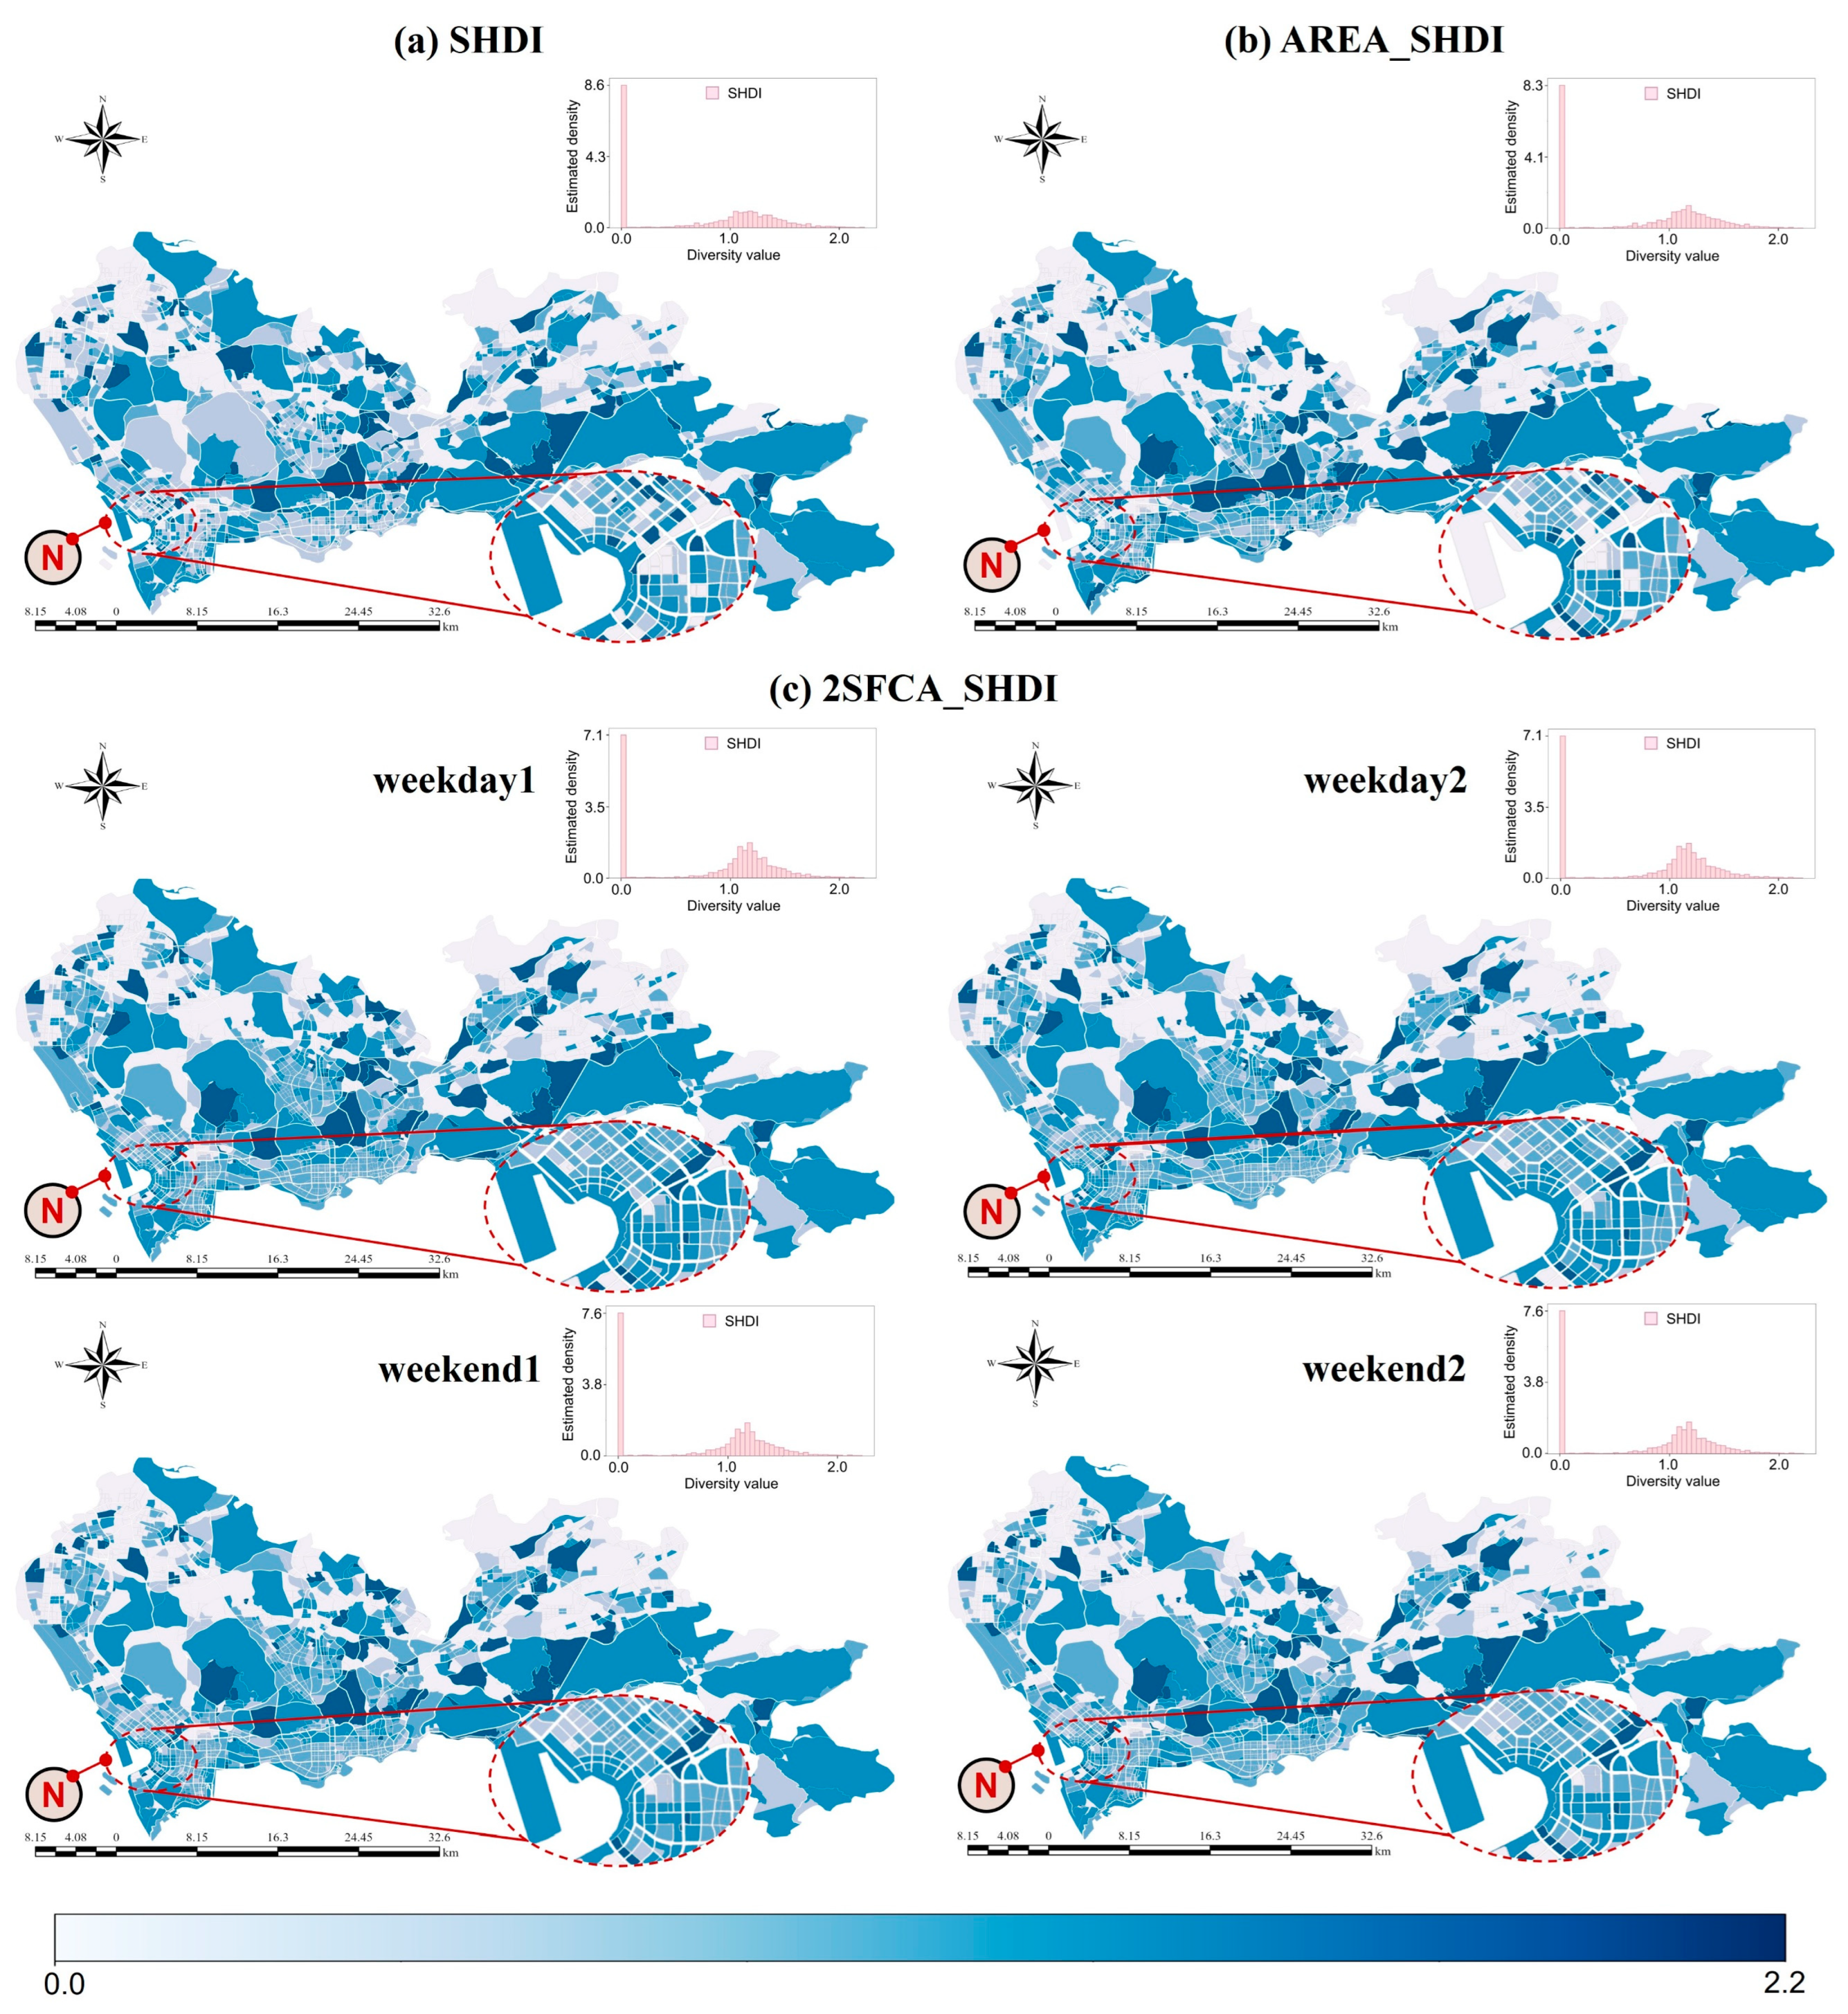
4.1.2. Spatial Distribution of Traditional Diversity Indicators

Figure 7a and Figure 8a display the distribution of various TAZ diversity measures by POIs and geo-tagged images, respectively. Due to limited availability of Weibo-geo-tagged images, parts of the TAZs in Figure 8 do not contain geo-tagged images, and the spatial distribution of diversity is sparser. The results indicate that the mixing degree (diversity) was underestimated in certain smaller TAZs (e.g., M in Figure 7a), attributed to the neglect of human perception ranges in the traditional SHDI method. Likewise, diversity values in the N region (Figure 8a) were severely underestimated. Furthermore, the histograms in Figure 7a and Figure 8a show that the distribution of estimated diversity values from the traditional SHDI are less concentrated (flatter) than those from the proposed measures.

4.1.3. Spatial Distribution of Area-Based SHDI

The area-based diversity indicator (AREA_SHDI) estimated is depicted in Figure 7b and Figure 8b. The results show that regions with many small TAZs obtained higher gain in estimated diversity. This is confirmed by the histogram that the distribution of diversity exhibits a noticeable shift and concentration towards higher values. For example, the amount of increase in the estimated diversity value is subtle for H as it is dominated by TAZs of large sizes, while a significant increase in N can be observed (N is full of small spatial units). Table 2 also confirms that regions M and N experienced a higher increase in estimated diversity than H.

4.1.4. Spatial Distribution of Accessibility-Based SHDI

The accessibility-based diversity indicator (2SFCA_SHDI) calculated from POIs and geo-tagged images are shown in Figure 7c and Figure 8c, respectively. Since 2SFCA_SHDI depends on dynamic population distribution, diversity was estimated for the four sample days (i.e., weekday1, weekday2, weekend1, and weekend2). First, the histograms in Figure 7c and Figure 8c exhibit a shift and concentration towards higher values, respectively. Second, it is clear that the diversity values in the central urban areas of Shenzhen (M in Figure 7c) are significantly higher than the SHDI estimations and are slightly higher than AREA_SHDI (Table 2). Third, the spatial distribution of the accessibility-based diversity in N (Figure 8) is smoother than that obtained by SHDI and AREA_SHDI, respectively. This suggests that spatial dependency (autocorrelation) is better incorporated into 2SFCA_SHDI due to the use of accessibility, which went beyond local computations and produced more reasonable results, especially in densely populated areas.

4.2. Interaction Between “Perceived Diversity” and Vitality

Many previous studies have empirically verified diversity theory towards urban vitality and confirmed that the diversity and vitality of a city are positively correlated [6,7,18,41]. We, therefore, use such a correlation to test the performance of different diversity measures. First, we fitted the regressions of diversity and other factors on vitality to confirm the conclusion that diversity positively contributes to vitality and to provide preliminary indications that “perceived diversity” is more reliable than other diversity measures. Second, diversity calculated using POIs and/or geo-tagged images were evaluated to see which source provided useful information to the measure of diversity. Then, the proposed diversity indicators were tested to see if “perceived diversity” better corresponded to urban vitality.

4.2.1. The Impact of Diversity Measures and Other Factors on Urban Vitality

To investigate how well our “perceived diversity” measures explain urban vitality compared with other variables, we included slope, building height, road network density (sidewalk density), housing prices, accessibility to a bus station, and accessibility to a subway station as our initial factors [40,60]. According to the multilinearity (Variance Inflation Factor, VIF) test, we excluded the variables such as sidewalk density (VIF = 10.12) and accessibility to a subway station (VIF = 10.53) and selected slope, accessibility to a bus station, housing prices, and building height as base explanatory variables. As a direct comparison to the proposed “perceived diversity” indicators (i.e., AREA_SHDI, 2SFCA_SDHI), existing diversity measures like Richness [61], Simpson [47], and the classic entropy measure SHDI were also examined based on ordinary least squares (OLS) regression using POI data (Table 3).
Table 3 shows that, in general, the coefficients of the diversity indicators were orders of magnitude higher than those of the base explanatory variables across models 1–5, indicating a stronger relationship with urban vitality than other factors. For our “perceived diversity” measures (models 4 and 5) in particular, the coefficients (AREA_SHDI: 0.066, 2SFCA_SHDI: 0.079) were significantly higher than models with existing diversity indicators and yielded more reliable fits (i.e., higher adjusted R2 of 0.265 and 0.273, respectively). Taken together, this indicates that our “perceived diversity” measures better corresponded to urban vitality than traditional diversity measures and were more explanatory than other factors. Hence, we will focus on the entropy-based “perceived diversity” in subsequent analysis and discuss the relationship between diversity and vitality in greater detail. This will use multiple data sources and more days of observation to further demonstrate the expressive power of the proposed “perceived diversity” in predicting urban vitality.

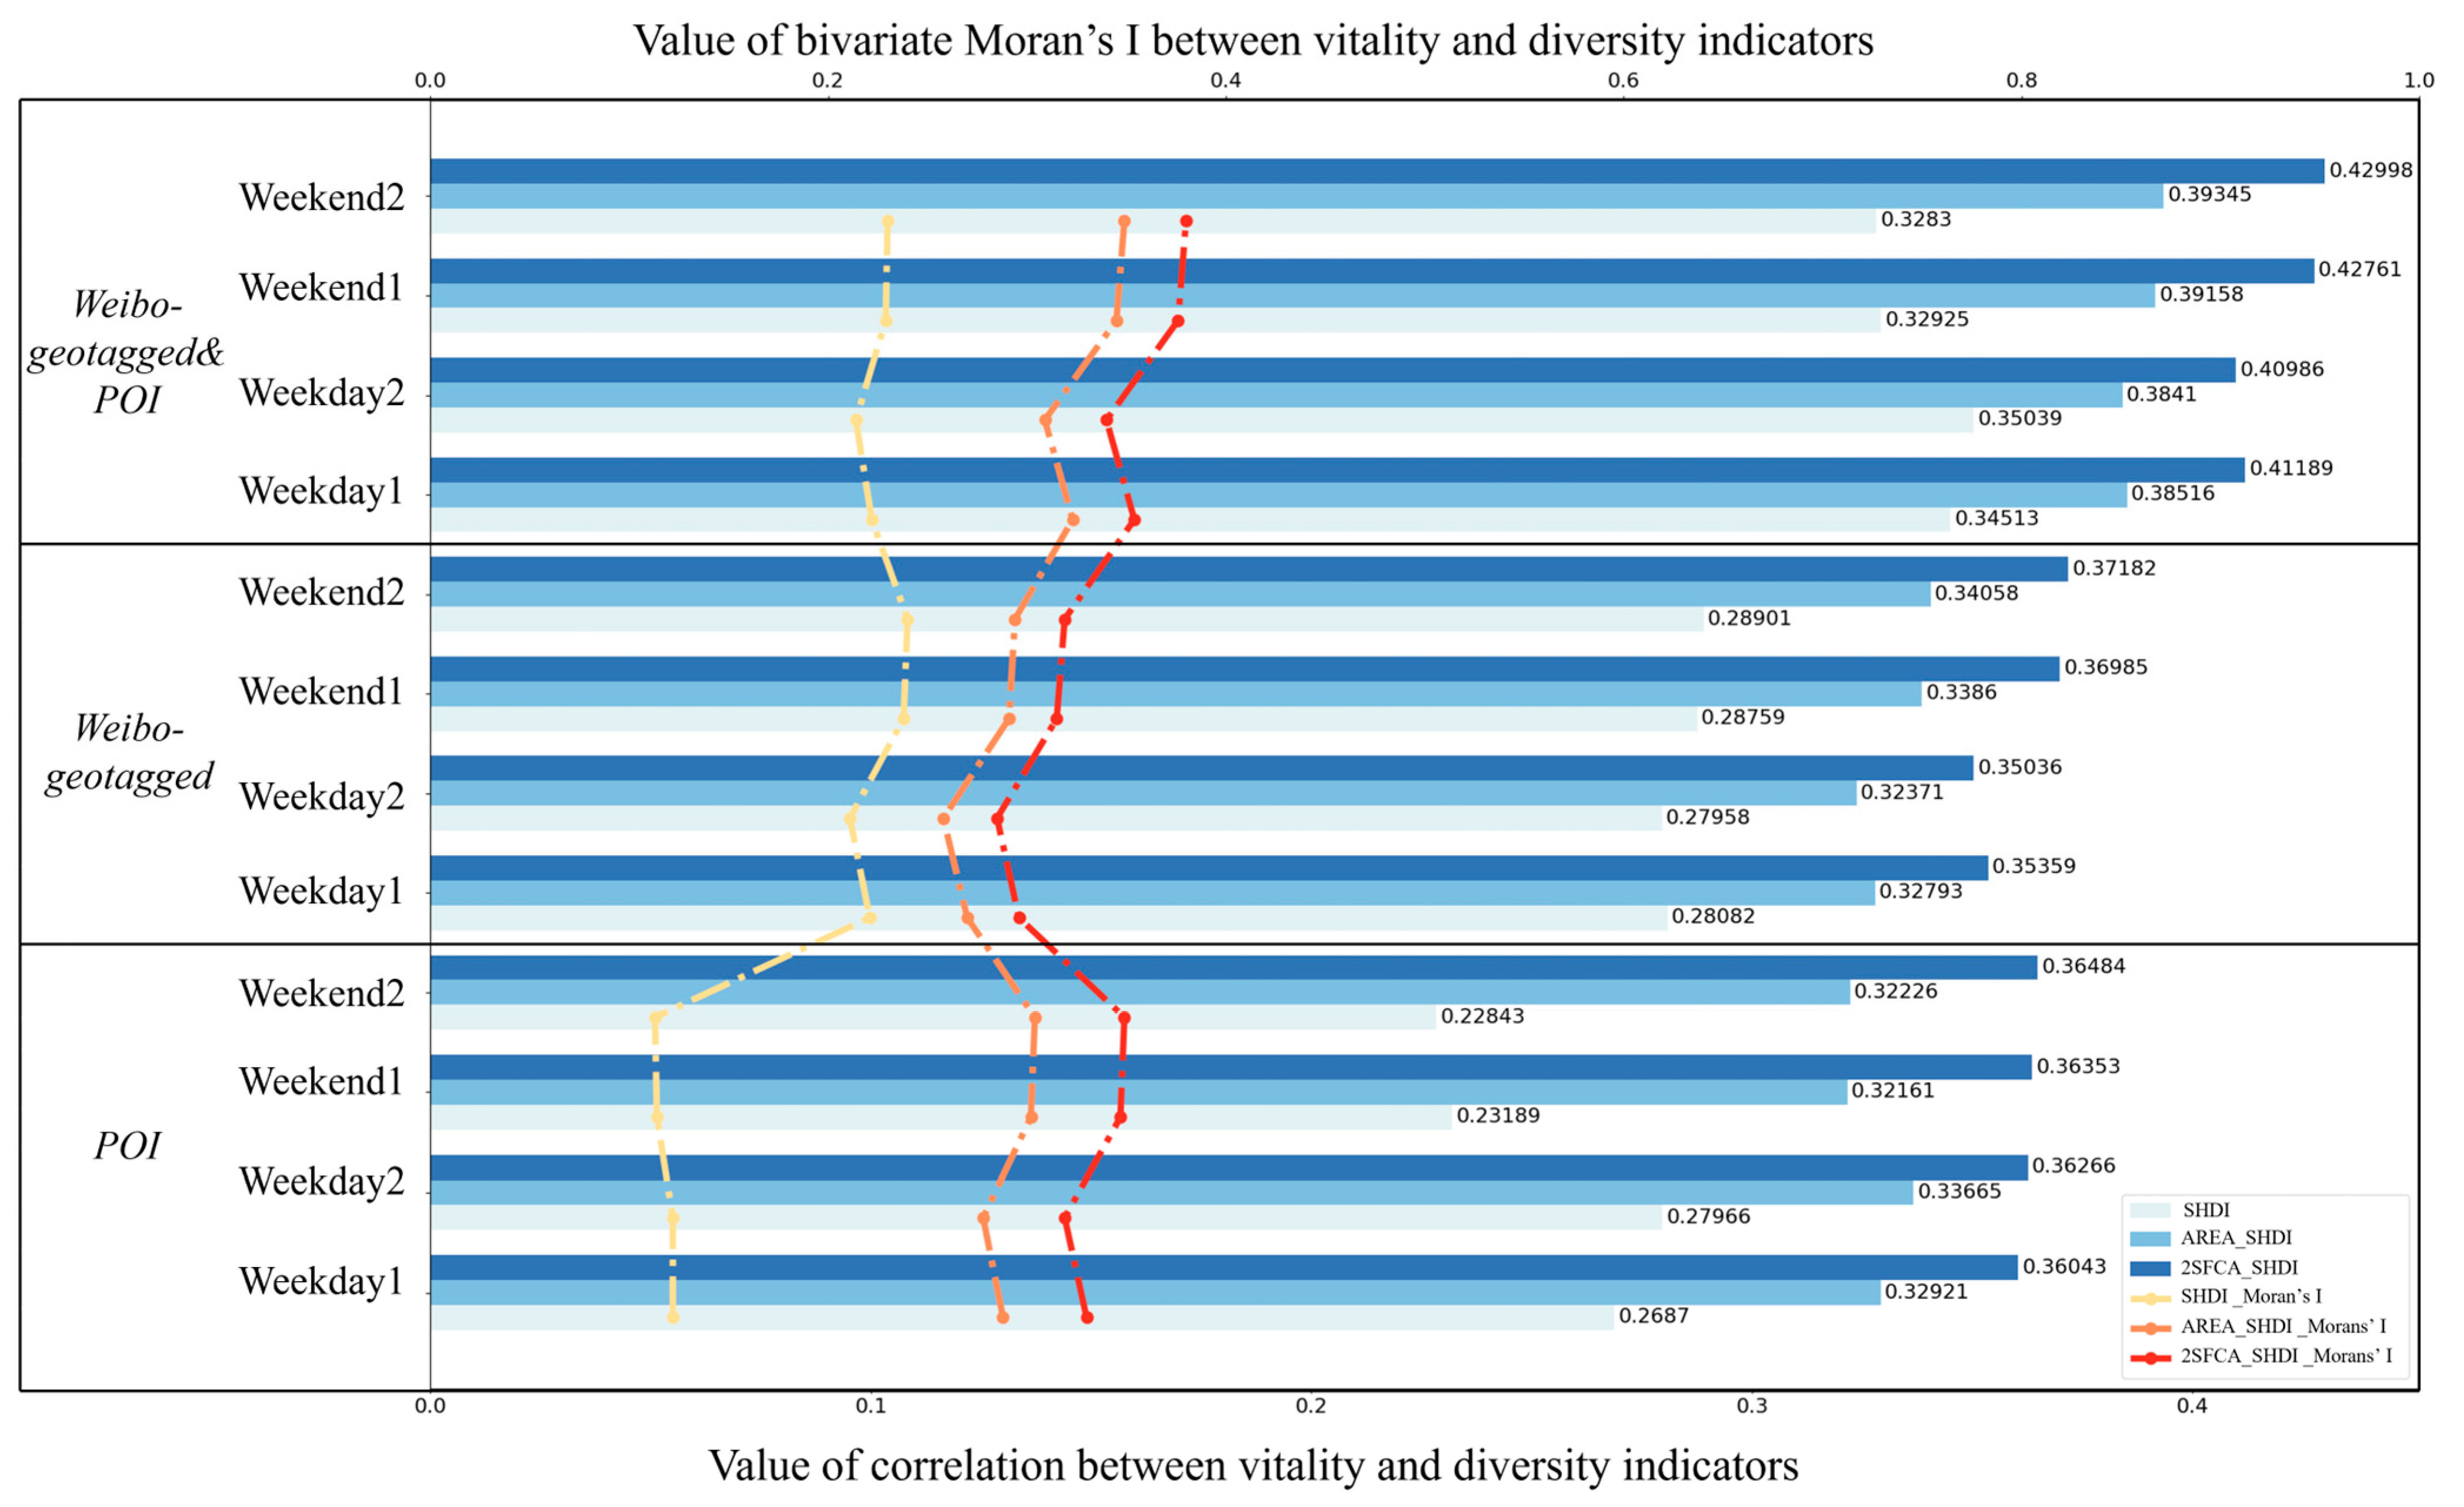
4.2.2. Diversity Measured from Multiple Data Sources Is More Representative

Evidence from Pearson’s correlation. We carried out correlation analysis for diversity measures using POIs, geo-tagged images, and the combination of the two data sources. For each data source, we calculated diversity using three versions of SHDI. In general, diversity measures from POIs and geo-tagged images separately appeared similar degrees of (positive) correlation to the vitality proxy (Figure 9). Specifically, diversity estimated using classic SHDI showed stronger correlation to vitality when geo-tagged images (visual scene semantics) were used. For diversity estimated using proposed indicators (AREA_SHDI and 2SFCA_SHDI), geo-tagged images alone offered slightly better performance than POIs on weekends, while POIs alone performed slightly better on weekdays. Taken together, these results imply that both POIs and geo-tagged images offer unique information to quantify the diversity. When we combined the two sources together, the correlation between the estimated diversity and vitality exhibited significant improvement, e.g., an 11–22.9% relative increase in the correlation coefficient r can be observed. This suggests that combining multiple data sources is more informative than using individual sources in estimating urban diversity.
Evidence from bivariate Moran’s I. The above analysis only shows non-spatial, in-place correlation between urban diversity and vitality. The bivariate Moran correlation further examines how diversity measured at a location correlates to vitality levels in its neighborhood. We observed that, though not significant, the bivariate Moran’ I (correlation) between the perceived diversity indicators (i.e., AREA_SHDI and 2SFCA_SHDI) and vitality improved by about 0.06 when they were measured by combining POIs and geo-tagged images. For the classic SHDI, there seemed to be no improvement even when we combine the two data sources. In this case, geo-tagged images (I ≈ 0.21) appeared to offer much more information than POIs (I ≈ 0.12).

4.2.3. “Perceived Diversity” Better Corresponds to Urban Vitality

Evidence from Pearson’s Correlation. The analysis of the correlation confirmed a positive correlation between overall diversity and vitality. Figure 9 clearly shows that our proposed indicators for “perceived diversity” (AREA_SHDI and 2SFCA_SHDI) exhibited significantly stronger correlation with vitality: the coefficient improved by approximately 20% (for AREA_SHDI) and 40% (for 2SFCA_SHDI) than the original SHDI, respectively, for all data sources and sampled days. In particular, notable improvement in the correlation can be observed in the accessibility-based diversity indicator (2SFCA_SHDI) as compared with its area-based counterpart. This suggests that the proposed “perceived diversity” indicators display better correspondence to urban vitality.
Evidence from bivariate Moran’s I. The curve graph in Figure 9 illustrates the bivariate Moran’s I concerning various diversity estimations and vitality. Remarkably, the Moran correlation between “perceived diversity” (AREA_SHDI and 2SFCA_SHDI) and vitality surpassed that of the traditional SHDI. The increase in I values was apparent for all cases, especially for diversity measured from POI data alone. One reason for such improvement might be that the proposed indicators introduce some kind of spatial smoothness (i.e., autocorrelation) in their formulation, especially for 2SFCA_SHDI.
Summarizing the results, we obtained the following key findings:
  • Both functional semantics from POIs and visual semantics from geo-tagged photos are equally important in understanding and characterizing urban diversity.
  • Diversity indicators derived from the combination of POIs and geo-tagged photos better depict the diversity of Shenzhen neighborhoods.
  • The proposed “perceived diversity” indicators, specifically area- and accessibility-based SHDI, significantly strengthen the correlation between urban vitality and diversity, among which the accessibility-based diversity indicator performed the best.

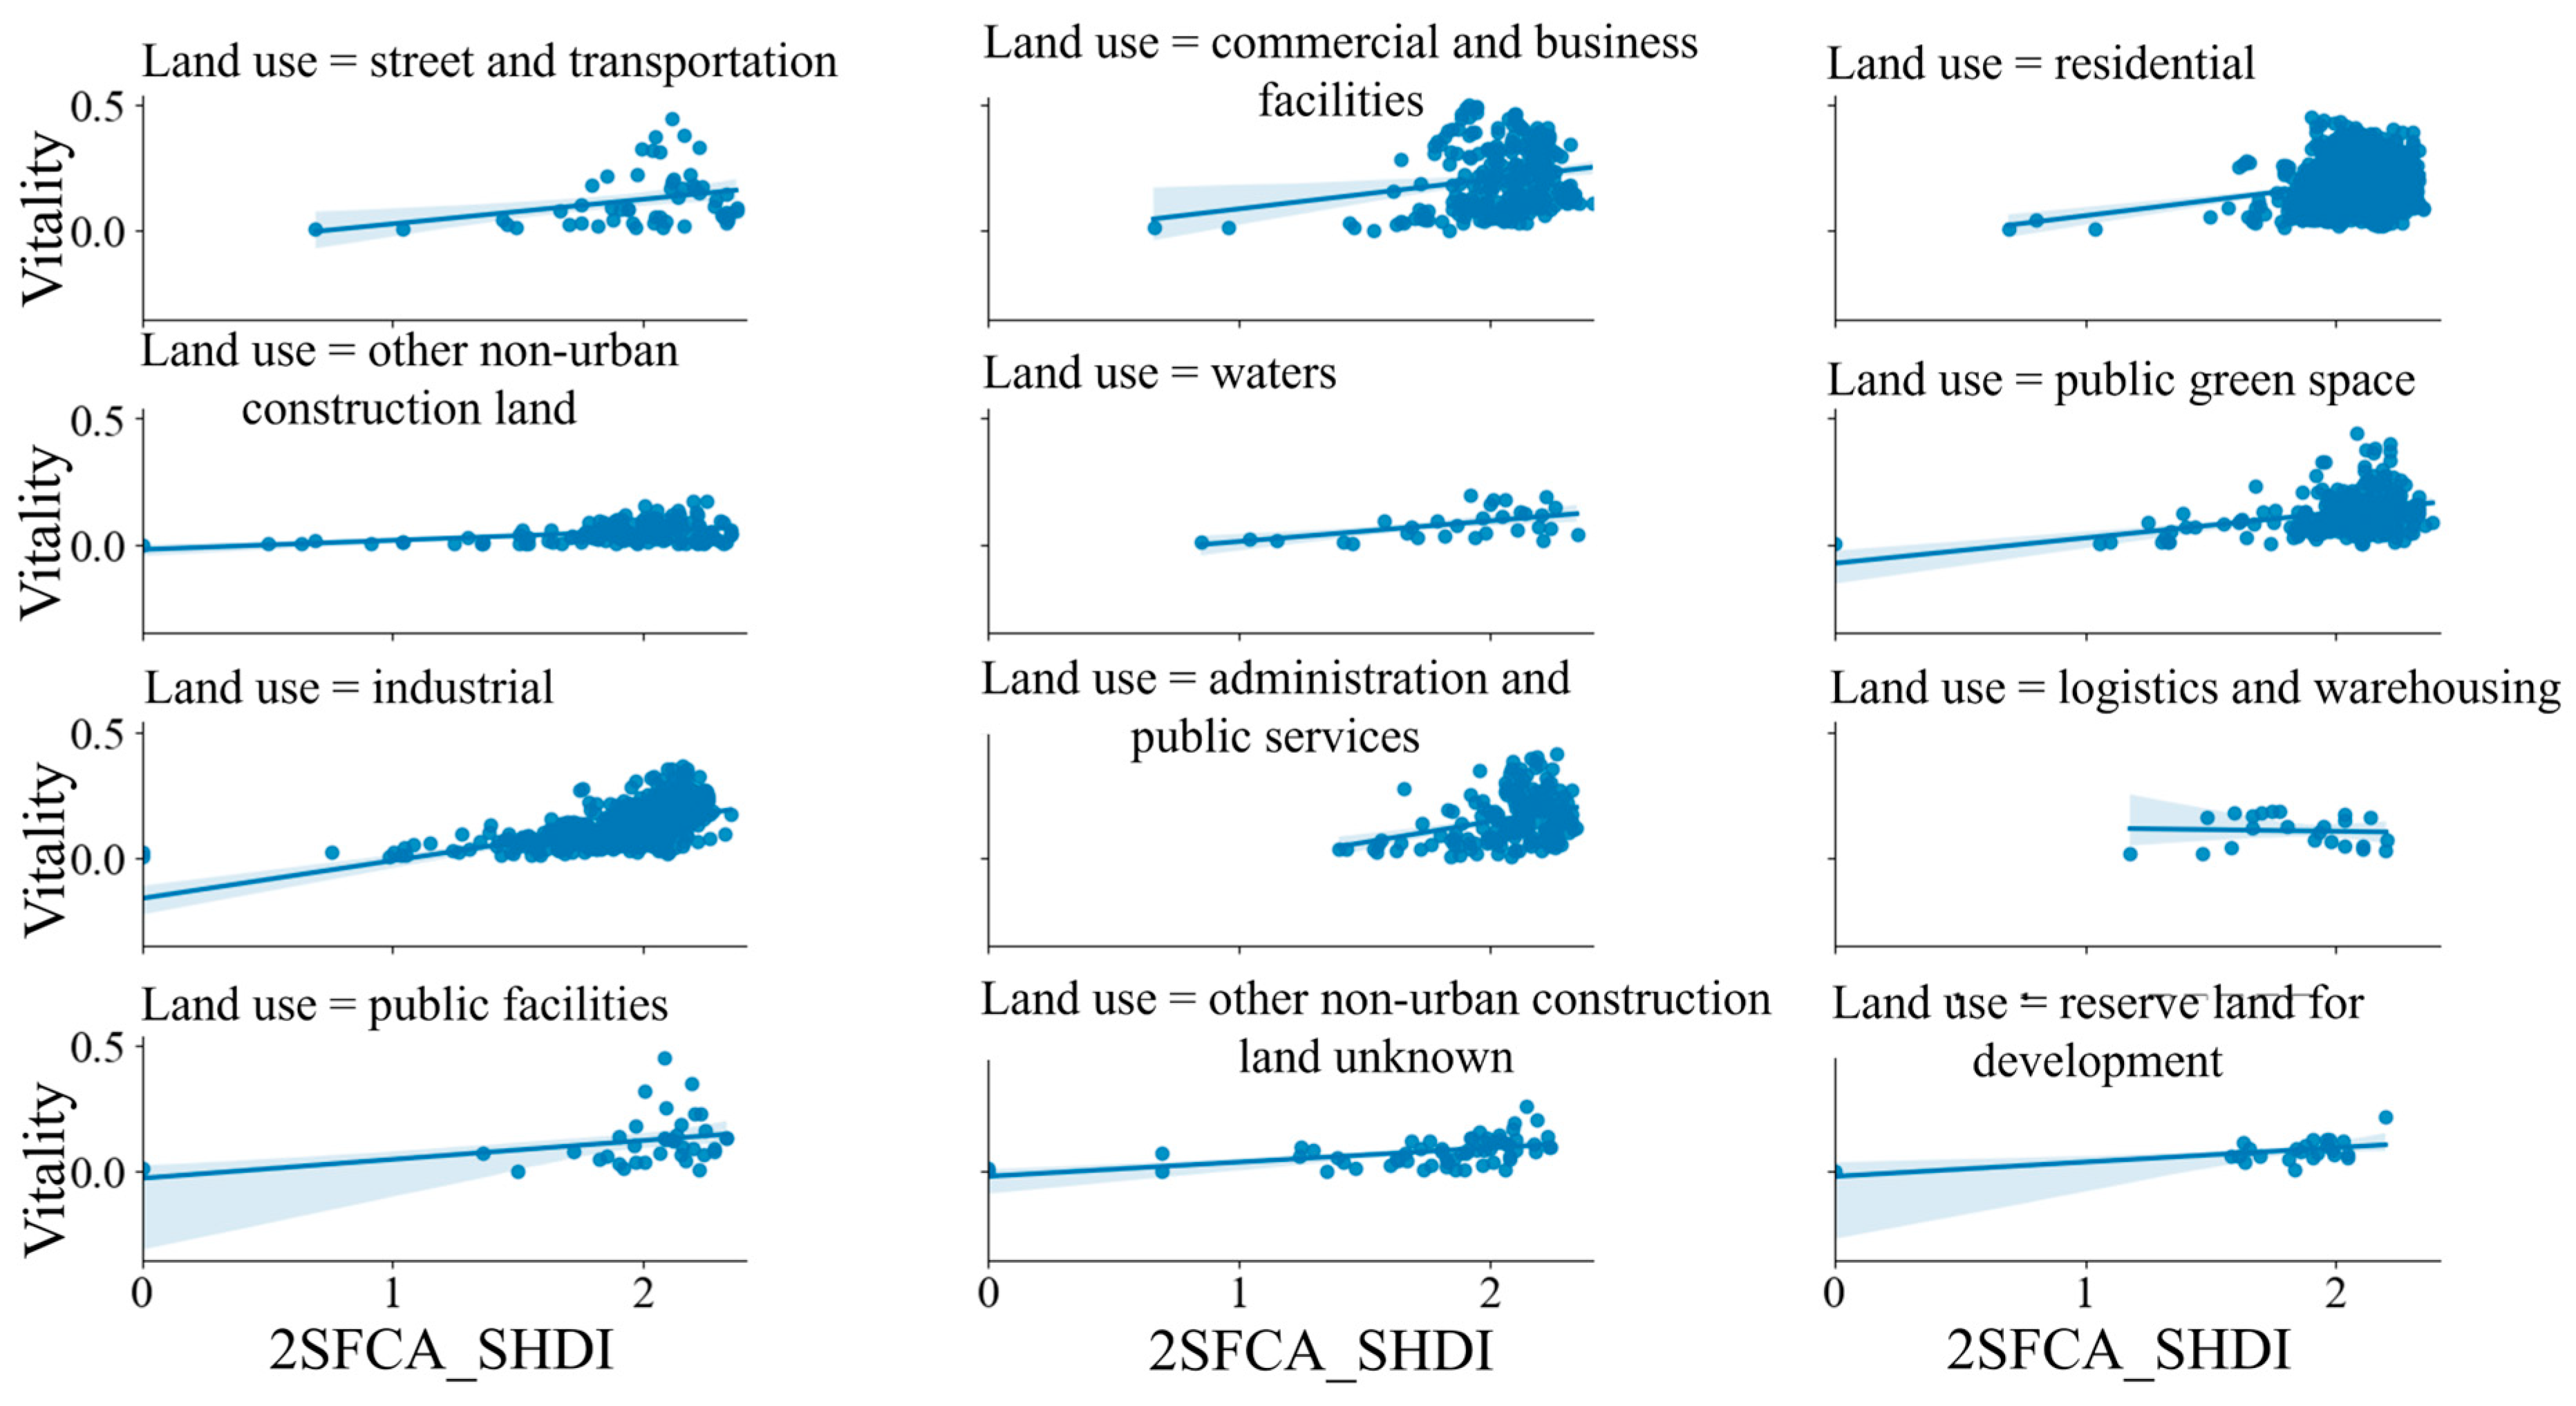
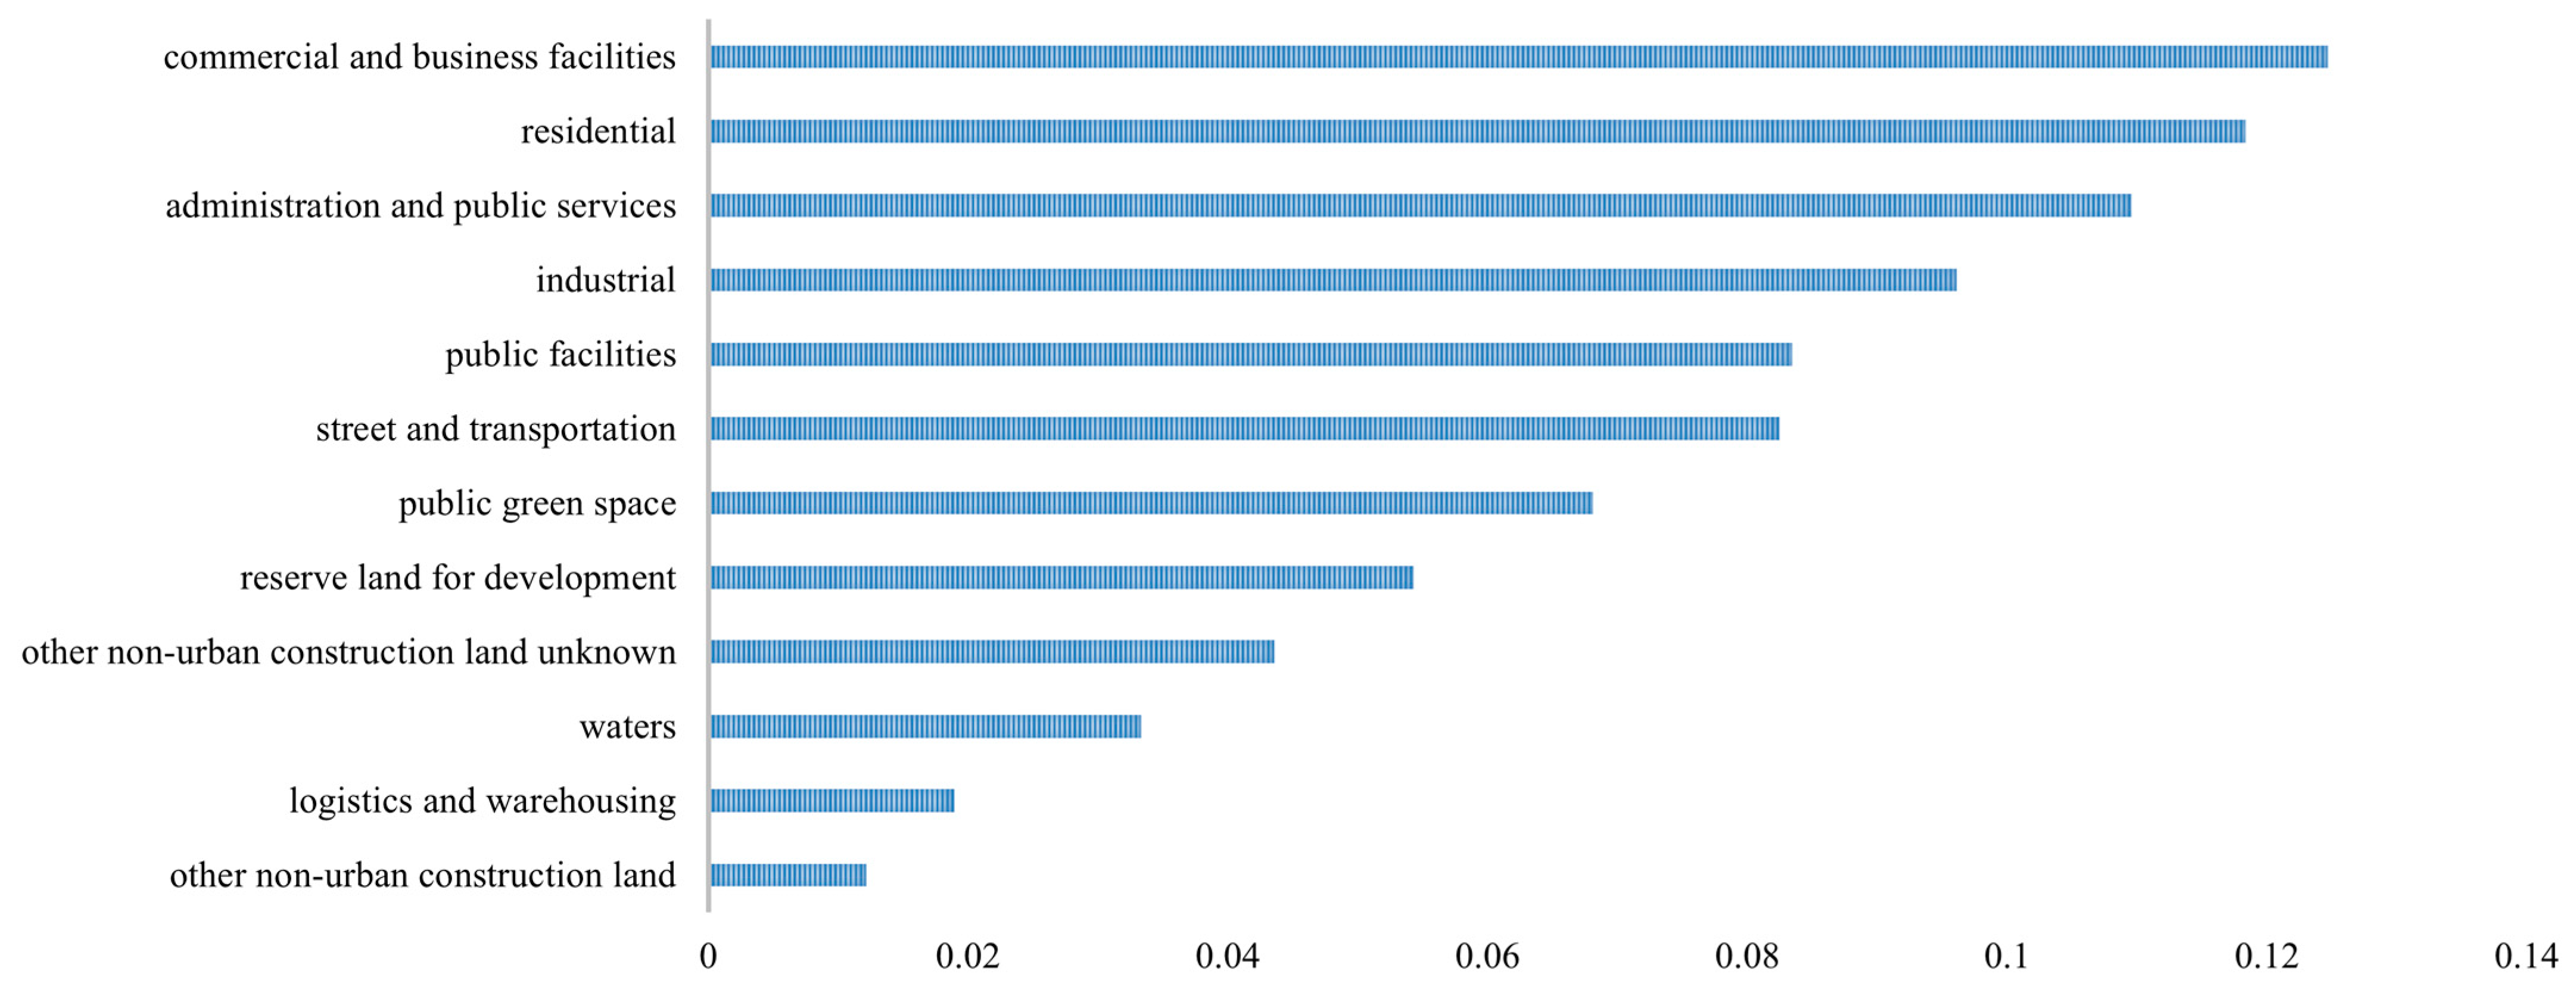
4.2.4. How Diversity Contributes to Vitality Under Different Land-Use Type?

Here, we further analyze how the proposed “perceived diversity” contributes to urban vitality under different land-use types (Figure 10). Specifically, the accessibility-based diversity indicator (2SFCA_SHDI) measured from the combination of geo-tagged photos and POI data was used. Figure 10 underscores varied contributions of diversity to vitality across different land-use categories. Together with Figure 11, the diversity of TAZs in Shenzhen dominated by “commercial and business facilities”, “residential”, and “administration and public services” presented the major contributions to vitality (with coefficients of regression are as high as 0.125, 0.118, and 0.11, respectively). For TAZs dominated by commercial and business facilities, enhanced diversity seems to be able to boost the vitality of Shenzhen’s neighborhoods. In contrast, for non-urban construction land, logistics and warehousing, and water-dominated TAZs, the contribution of diversity to vitality is marginal (the coefficients are as low as 0.033, 0.019, and 0.013, respectively). This implies that improving diversity within these areas does not significantly impact the vibrancy of the neighborhoods.

5. Discussion

5.1. Implications of “Perceived Diversity”

One of our main contributions is the incorporation of human perception into urban diversity estimation, thus expanding the methodology beyond traditional approaches that focus only on land-use and spatial characteristics [18,42,43]. By integrating POI data and geo-tagged images, our approach provides a more comprehensive measure of diversity, accounting for both the physical environment and how individuals perceive and interact with it. This aligns with recent calls for a more human-centered approach in urban research [6,62,63]. The success of incorporating human perception can be extended to other urban indicators, such as greenness, safety, comfort, and crowdedness, where the measure should not only consider features in a spatial unit but also look beyond the boundary as long as interactions exist between the features and people.
These findings suggest that urban vitality should be fostered through a shift from traditional static land-use measures to a more holistic approach that considers human perception and interaction with urban environments. This perspective can guide more effective urban regeneration, public space design, and transportation planning. By understanding “perceived diversity”, policy-makers can create interventions that enhance the vibrancy and inclusivity of urban spaces, ultimately improving residents’ quality of life by focusing on sensory and perceptual aspects of the built environment.

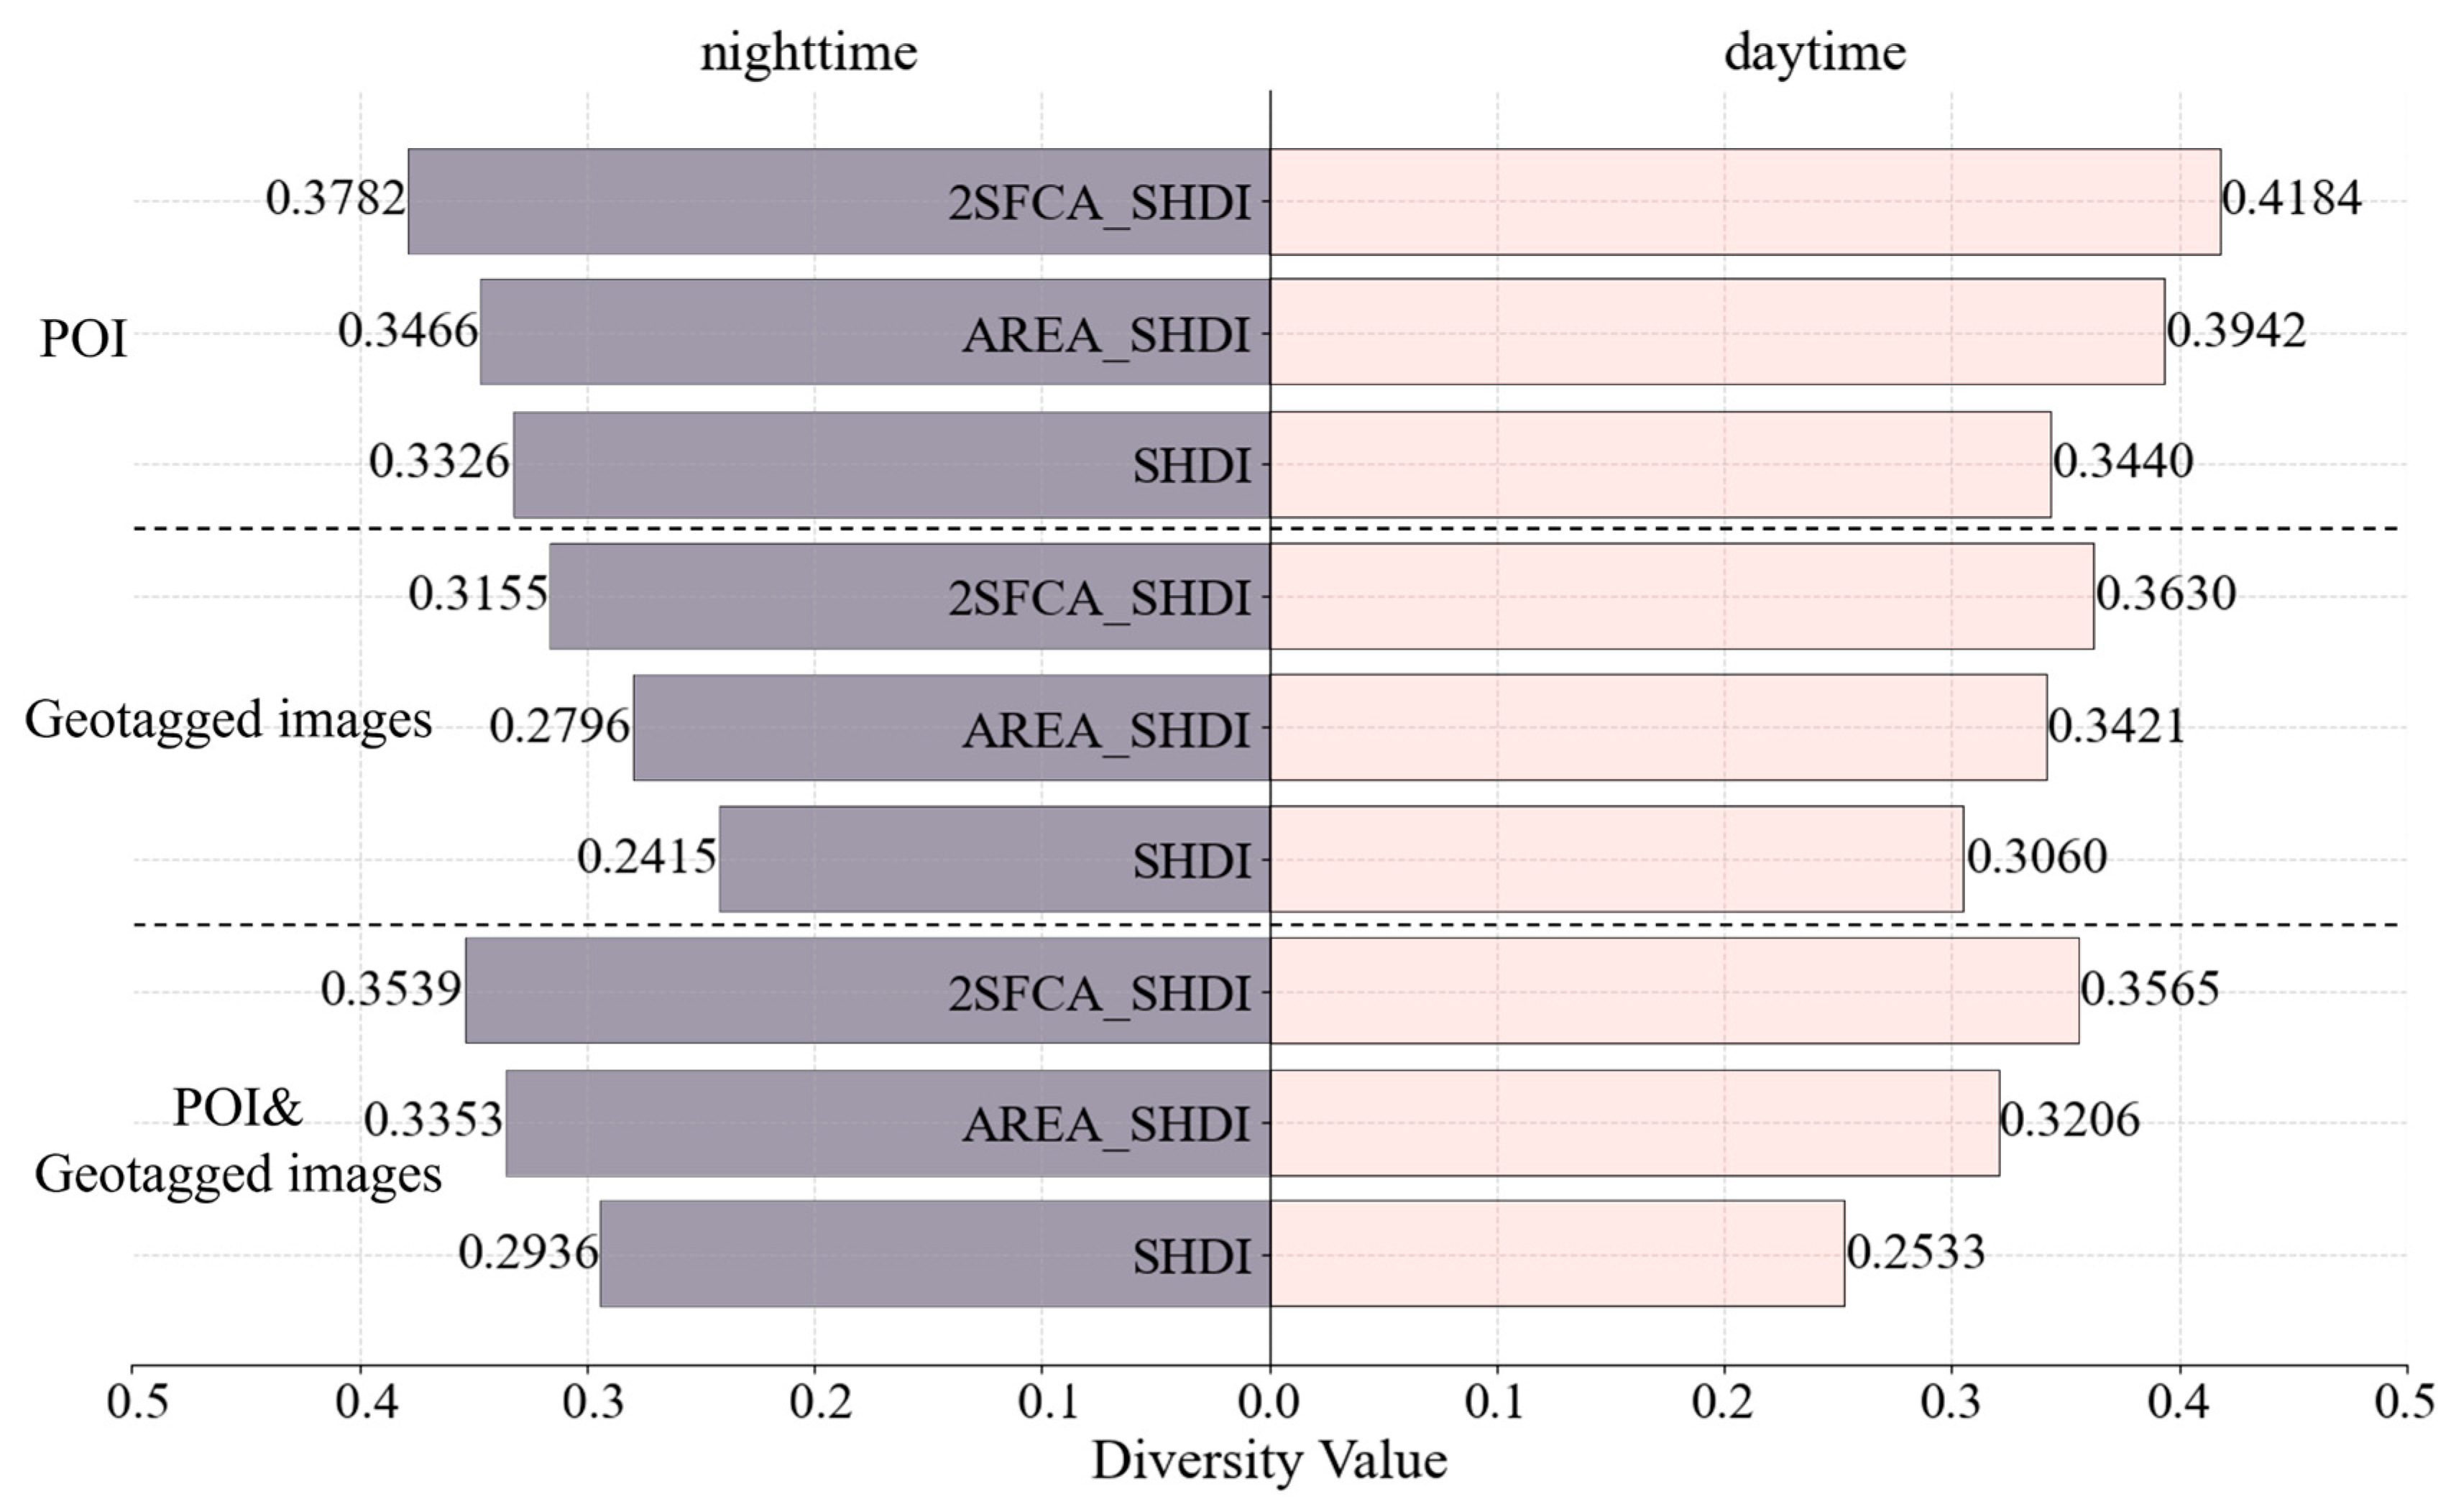
5.2. Daytime and Nighttime Variations

Figure 12 illustrates the obvious temporal variations of urban vitality summarized over all TAZs during 24 h in Shenzhen. At each point in time, the mean vitality values for weekdays were almost always higher than those for weekends, suggesting a generally more vibrant (active) community during working days. The difference was the most obvious from 9 am to 6 pm, corresponding to the working hours during the day.
To get insight into how the correlation between vitality and diversity varies during a day, we split daytime and nighttime using 8 am and 8 pm as splitting points [64]. First, Figure 13 generally confirms our previous findings. That is, the use of combined data sources improved the correlation irrespective of time. The proposed area- and accessibility-based diversity indicators performed better. Though human activity (vitality) is much lower at night (Figure 12), the correlation between diversity and vitality at night was only a little lower than during the day.
Then, the result illustrates that the correlation was lower at nighttime than at daytime in most cases. The differences appeared most obvious for diversity measured using geo-tagged photos alone (the correlation coefficient during the day was about 0.06 higher than that in the night). The second-most obvious differences can be observed when diversity was measured with the mixture of geo-tagged images and POIs. For diversity measured using POIs alone, the coefficient displays no substantial difference. This may be explained by the fact that people take more photos during the day, while POIs are a static feature not varying with time.
It is worth noting that the correlation coefficient during daytime is more or less the same as the coefficient for the whole day (Figure 9), but the correlation during nighttime is generally lower. This may reflect the current limitation of the crowd-souring approach to data collection (e.g., geo-tagged photos from social media) during night. Hence, data collected during the day may be more representative.

5.3. Limitations and Challenges

In this study, we note that some parameters in the proposed diversity indicators were empirically determined and, hence, specific to certain cities. For instance, the upper limit of the search radius was set to 1000 m in Equation (2). In future work, we aim to replicate similar hypothesis tests across multiple cities to develop adaptive search radius based on the characteristics of each urban context, thereby exploring a more flexible approach for parameter setting.
On the other hand, the reliance on POI data and geo-tagged images may introduce biases due to the uneven distribution of these data sources, potentially underrepresenting less-developed or remote areas. To address this issue, future research should integrate additional data sources, including spontaneously generated sensor data (such as portable cameras [65], vehicle-mounted cameras [66], etc.), to measure and characterize each urban area more comprehensively and equitably, thus providing a more balanced representation of urban diversity.
Finally, the necessity of developing urban diversity varies across different cities and regions, reflecting inherent heterogeneity. A key challenge for future research is how each city can formulate diversity development strategies tailored to the specific characteristics of its local areas. For example, the level of diversity required in the commercial centers or residential neighborhoods may differ significantly across cities, depending on the unique urban context and developmental priorities of each area.

5.4. Recommendations to Urban Planning

While diversity in urban design is essential to create vibrant cities, our analysis shows that different land-use types have different demands to diversity and vitality (Section 4.2.4). For example, large-scale logistics and warehousing land and natural ecological conservation land do not require diversity in design because there is no need for these land uses to be vibrant. On the contrary, in downtown areas, central business districts, and holiday resorts, it is necessary to promote a vibrant neighborhood. Therefore, we provide a guideline for fine-grained urban planning—the diversity of urban construction depends on the different dominant land-use types of spatial units as well as its surrounding environment. We believe this insight vital to policy-makers and urban planners in that it helps to avoid oversimplified decisions by assessing the necessity of design beforehand. This approach fosters a more-informed and tailored urban development strategy aligned with the complex interplay between diversity and vitality across various urban land uses.

6. Conclusions

To enhance the explanation and representation of urban diversity, this paper makes contributions in three aspects: (1) the conceptual framework of “perceived diversity”, (2) the new measures for perceived diversity with multiple data sources, and (3) the necessity of fostering diversity across land-use types.
First, we introduce the concept of “perceived urban diversity” and formulate a set of indicators to quantify the concept by extending the classic entropy-based diversity measures using area- and accessibility-based rules. We performed empirical analysis in Shenzhen, China, that demonstrates stronger correlations between the proposed “perceived diversity” and urban vitality when incorporating the perceptual aspect of humans. Moreover, we confirm that that “perceived diversity” based on accessibility correlates most significantly with vitality among all the indicators. Therefore, we show that “perceived diversity” explains urban diversity more effectively and provides a new perspective for the estimation of urban diversity.
Second, we adopted the functional semantics of POIs and the visual scene semantics of geo-tagged images to characterize different aspects of urban diversity. Our results show that the correlation between diversity and vitality significantly improves when the diversity estimated from the two data sources is combined, which suggests that urban diversity is an aggregation of multiple semantic dimensions. This further implies that more perspectives may be necessary to enrich the quantification of urban diversity.
Finally, we investigated the varying degrees of the contribution of diversity to vitality under different dominant land-use types. We found that not all spatial units in Shenzhen, China, display the same level of correlation between diversity and vitality. This further implies that planning to increase urban diversity may have different effects on planning units of different land-use types. For example, residential and commercial areas can benefit the most from enhanced diversity in Shenzhen.
However, this study relies on the case of Shenzhen for setting the parameters in the calculation of perceived diversity, which lacks flexibility. Additionally, the uneven spatial distribution of POI data and geo-tagged images may result in the underrepresentation of less-developed or remote areas. To address these limitations, future research will explore adaptive approaches that integrate multiple data sources for calculating perceived urban diversity. This framework will be extended to a broader range of cities, providing valuable support for urban planning and policy-making in diverse contexts.

Supplementary Materials

The following supporting information can be downloaded at: https://www.mdpi.com/article/10.3390/ijgi14020091/s1, Figure S1: Geo-tagged image processing for scene visual semantics recognition; Figure S2: Reclassifying the 365 categories (in Places365) into 16 border categories; Figure S3: Inference result accuracy validation and evaluation: (a) The first inference serial number that matches the original image scene, occupying a proportion of all samples; (b) total number of categories that match the original image scene information in the TOP1~TOP5 obtained by the inference; Figure S4: Extracting visual scene semantics from geo-tagged images: the confidence levels reflect the uncertainty (mixture) level of the scenes.

Author Contributions

Conceptualization, Zongze He and Xiang Zhang; methodology, Zongze He; software, Zongze He; validation, Zongze He; formal analysis, Zongze He; investigation, Zongze He and Xiang Zhang; data curation, Zongze He; writing—original draft preparation, Zongze He; writing—review and editing, Xiang Zhang; visualization, Zongze He and Xiang Zhang; supervision, Xiang Zhang; project administration, Xiang Zhang; and funding acquisition, Xiang Zhang. All authors have read and agreed to the published version of the manuscript.

Funding

This research was funded by the National Key Research and Development Program of China (grant No. 2022YFB3903402) and Guangdong Basic and Applied Basic Research Foundation (grant No. 2024A1515012083).

Data Availability Statement

Data are available upon request.

Acknowledgments

We appreciate the valuable feedbacks from the reviewers and the editorial team of ISPRS International Journal of Geo-Information.

Conflicts of Interest

The authors declare no conflicts of interest.

References

  1. Huang, B.; Zhou, Y.; Li, Z.; Song, Y.; Cai, J.; Tu, W. Evaluating and characterizing urban vibrancy using spatial big data: Shanghai as a case study. Environ. Plan. B Urban Anal. City Sci. 2020, 47, 1543–1559. [Google Scholar] [CrossRef]
  2. Xia, C.; Yeh, A.G.-O.; Zhang, A. Analyzing spatial relationships between urban land use intensity and urban vitality at street block level: A case study of five Chinese megacities. Landsc. Urban Plan. 2020, 193, 103669. [Google Scholar] [CrossRef]
  3. Li, M.; Liu, J.; Lin, Y.; Xiao, L.; Zhou, J. Revitalizing historic districts: Identifying built environment predictors for street vibrancy based on urban sensor data. Cities 2021, 117, 103305. [Google Scholar] [CrossRef]
  4. Li, Y.; Yabuki, N.; Fukuda, T. Exploring the association between street built environment and street vitality using deep learning methods. Sustain. Cities Soc. 2022, 79, 103656. [Google Scholar] [CrossRef]
  5. Wang, X.; Zhang, Y.; Yu, D.; Qi, J.; Li, S. Investigating the spatiotemporal pattern of urban vibrancy and its determinants: Spatial big data analyses in Beijing, China. Land Use Policy 2022, 119, 106162. [Google Scholar] [CrossRef]
  6. Wu, C.; Ye, Y.; Gao, F.; Ye, X. Using street view images to examine the association between human perceptions of locale and urban vitality in Shenzhen, China. Sustain. Cities Soc. 2023, 88, 104291. [Google Scholar] [CrossRef]
  7. Jacobs, J. The Death and Life of Great American Cities; Random House, Inc.: New York, NY, USA, 1961. [Google Scholar]
  8. Marquet, O.; Viiralles-Guasch, C. Neighbourhood vitality and physical activity among the elderly: The role of walkable environments on active ageing in Barcelona, Spain. Soc. Sci. Med. 2015, 135, 24–30. [Google Scholar] [CrossRef] [PubMed]
  9. Ye, Y.; Li, D.; Liu, X. How block density and typology affect urban vitality: An exploratory analysis in Shenzhen, China. Urban Geogr. 2018, 39, 631–652. [Google Scholar] [CrossRef]
  10. Chen, Z.; Dong, B.; Pei, Q.; Zhang, Z. The impacts of urban vitality and urban density on innovation: Evidence from China’s Greater Bay Area. Habitat Int. 2022, 119, 102490. [Google Scholar] [CrossRef]
  11. Lao, X.; Gu, H.; Yu, H.; Xiao, F. Exploring the Spatially-Varying Effects of Human Capital on Urban Innovation in China. Appl. Spat. Anal. Policy 2021, 14, 827–848. [Google Scholar] [CrossRef]
  12. Tang, L.; Lin, Y.; Li, S.; Li, S.; Li, J.; Ren, F.; Wu, C. Exploring the Influence of Urban Form on Urban Vibrancy in Shenzhen Based on Mobile Phone Data. Sustainability 2018, 10, 4565. [Google Scholar] [CrossRef]
  13. Yue, W.; Chen, Y.; Zhang, Q.; Liu, Y. Spatial Explicit Assessment of Urban Vitality Using Multi-Source Data: A Case of Shanghai, China. Sustainability 2019, 11, 638. [Google Scholar] [CrossRef]
  14. Kang, C.; Fan, D.; Jiao, H. Validating activity, time, and space diversity as essential components of urban vitality. Environ. Plan. B-Urban Anal. City Sci. 2021, 48, 1180–1197. [Google Scholar] [CrossRef]
  15. Jiang, B.; Huang, J.-T. A new approach to detecting and designing living structure of urban environments. Comput. Environ. Urban Syst. 2021, 88, 101646. [Google Scholar] [CrossRef]
  16. Wang, L.; Han, X.; He, J.; Jung, T. Measuring residents’ perceptions of city streets to inform better street planning through deep learning and space syntax. Isprs J. Photogramm. Remote Sens. 2022, 190, 215–230. [Google Scholar] [CrossRef]
  17. Tu, W.; Zhu, T.; Xia, J.; Zhou, Y.; Lai, Y.; Jiang, J.; Li, Q. Portraying the spatial dynamics of urban vibrancy using multisource urban big data. Comput. Environ. Urban Syst. 2020, 80, 101428. [Google Scholar] [CrossRef]
  18. Yue, Y.; Zhuang, Y.; Yeh, A.G.-O.; Xie, J.-Y.; Ma, C.-L.; Li, Q.-Q. Measurements of POI-based mixed use and their relationships with neighbourhood vibrancy. Int. J. Geogr. Inf. Sci. 2017, 31, 658–675. [Google Scholar] [CrossRef]
  19. Zhang, J.; Liu, X.; Tan, X.; Jia, T.; Senousi, A.M.; Huang, J.; Yin, L.; Zhang, F. Nighttime Vitality and Its Relationship to Urban Diversity: An Exploratory Analysis in Shenzhen, China. IEEE J. Sel. Top. Appl. Earth Obs. Remote Sens. 2022, 15, 309–322. [Google Scholar] [CrossRef]
  20. Long, Y.; Huang, C.C. Does block size matter? The impact of urban design on economic vitality for Chinese cities. Environ. Plan. B Urban Anal. City Sci. 2019, 46, 406–422. [Google Scholar] [CrossRef]
  21. Niu, N.; Li, L.; Li, X.; He, J. The structural dimensions and community vibrancy: An exploratory analysis in Guangzhou, China. Cities 2022, 127, 103771. [Google Scholar] [CrossRef]
  22. Zhuo, Y.; Zheng, H.; Wu, C.; Xu, Z.; Li, G.; Yu, Z. Compatibility mix degree index: A novel measure to characterize urban land use mix pattern. Comput. Environ. Urban Syst. 2019, 75, 49–60. [Google Scholar] [CrossRef]
  23. Arietta, S.M.; Efros, A.A.; Ramamoorthi, R.; Agrawala, M. City Forensics: Using Visual Elements to Predict Non-Visual City Attributes. IEEE Trans. Vis. Comput. Graph. 2014, 20, 2624–2633. [Google Scholar] [CrossRef]
  24. Han, S.; Ren, F.; Du, Q.; Gui, D. Extracting Representative Images of Tourist Attractions from Flickr by Combining an Improved Cluster Method and Multiple Deep Learning Models. ISPRS Int. J. Geo Inf. 2020, 9, 81. [Google Scholar] [CrossRef]
  25. Zhou, B.; Liu, L.; Oliva, A.; Torralba, A. Recognizing City Identity via Attribute Analysis of Geo-tagged Images. In Proceedings of the Computer Vision—ECCV 2014, Zurich, Switzerland, 6–12 September 2014; Springer International Publishing: Cham, Switzerland, 2014. [Google Scholar]
  26. Zhao, G.; Song, J.; Liu, S. A Comparative Study on the Measurement Methods of Urban Mixed Land Use. China City Plan. Rev. 2022, 31, 58–71. [Google Scholar]
  27. Ziakopoulos, A.; Yannis, G. A review of spatial approaches in road safety. Accid. Anal. Prev. 2020, 135, 105323. [Google Scholar] [CrossRef] [PubMed]
  28. Gifford, R.; Nilsson, A. Personal and social factors that influence pro-environmental concern and behaviour: A review. Int. J. Psychol. J. Int. Psychol. 2014, 49, 141–157. [Google Scholar] [CrossRef] [PubMed]
  29. Ashihara, Y. The Aesthetic Townscape; The MIT Press: Cambridge, MA, USA, 1983. [Google Scholar]
  30. Lynch, K. The Image of the City; MIT Press: Cambridge, MA, USA, 1960; pp. 46–68. [Google Scholar]
  31. Maas, P.R. Towards a Theory of Urban Vitality; University of British Columbia: Vancouver, BC, Canada, 1984. [Google Scholar]
  32. Montgomery, J. Making a city: Urbanity, vitality and urban design. J. Urban Des. 1998, 3, 93–116. [Google Scholar] [CrossRef]
  33. Harvey, L. Defining and Measuring Employability. Qual. High. Educ. 2001, 7, 97–109. [Google Scholar] [CrossRef]
  34. Azmi, D.I.; Karim, H.A. Implications of Walkability towards Promoting Sustainable Urban Neighbourhood. In Proceedings of the ASEAN Conference on Environment-Behaviour Studies (AcE-Bs) on Way of Life—Socio-Economic and Cultural Context, Bangkok, Thailand, 16–18 July 2012. [Google Scholar]
  35. Sung, H.; Lee, S. Residential built environment and walking activity: Empirical evidence of Jane Jacobs’ urban vitality. Transp. Res. Part D Transp. Environ. 2015, 41, 318–329. [Google Scholar] [CrossRef]
  36. Heipke, C. Crowdsourcing geospatial data. Isprs J. Photogramm. Remote Sens. 2010, 65, 550–557. [Google Scholar] [CrossRef]
  37. Wu, L.; Zhi, Y.; Sui, Z.; Liu, Y. Intra-Urban Human Mobility and Activity Transition: Evidence from Social Media Check-In Data. PLoS ONE 2014, 9, e97010. [Google Scholar] [CrossRef] [PubMed]
  38. Wang, B.; Lei, Y.Q.; Wang, C.G.; Wang, L. The Spatio-temporal Impacts of the Built Environment on Urban Vitality: A Study Based on Big Data. Sci. Geogr. Sin. 2022, 42, 274–283. [Google Scholar]
  39. Jia, C.; Du, Y.; Wang, S.; Bai, T.; Fei, T. Measuring the vibrancy of urban neighborhoods using mobile phone data with an improved PageRank algorithm. Trans. Gis 2019, 23, 241–258. [Google Scholar] [CrossRef]
  40. Li, Q.; Cui, C.; Liu, F.; Wu, Q.; Run, Y.; Han, Z. Multidimensional Urban Vitality on Streets: Spatial Patterns and Influence Factor Identification Using Multisource Urban Data. Isprs Int. J. Geo-Inf. 2022, 11, 2. [Google Scholar] [CrossRef]
  41. Zeng, C.; Song, Y.; He, Q.; Shen, F. Spatially explicit assessment on urban vitality: Case studies in Chicago and Wuhan. Sustain. Cities Soc. 2018, 40, 296–306. [Google Scholar] [CrossRef]
  42. Brown, B.B.; Yamada, I.; Smith, K.R.; Zick, C.D.; Kowaleski-Jones, L.; Fan, J.X. Mixed land use and walkability: Variations in land use measures and relationships with BMI, overweight, and obesity. Health Place 2009, 15, 1130–1141. [Google Scholar] [CrossRef] [PubMed]
  43. Song, Y.; Merlin, L.; Rodriguez, D. Comparing measures of urban land use mix. Comput. Environ. Urban Syst. 2013, 42, 1–13. [Google Scholar] [CrossRef]
  44. Shi, B.; Yang, J. Scale, distribution, and pattern of mixed land use in central districts: A case study of Nanjing, China. Habitat Int. 2015, 46, 166–177. [Google Scholar] [CrossRef]
  45. Im, H.N.; Choi, C.G. The hidden side of the entropy-based land-use mix index: Clarifying the relationship between pedestrian volume and land-use mix. Urban Stud. 2018, 56, 1865–1881. [Google Scholar] [CrossRef]
  46. Sakoda, J.M. A Generalized Index of Dissimilarity. Demography 1981, 18, 245–250. [Google Scholar] [CrossRef] [PubMed]
  47. Hunter, P.R.; Gaston, M.A. Numerical index of the discriminatory ability of typing systems: An application of Simpson’s index of diversity. J. Clin. Microbiol. 1988, 26, 2465–2466. [Google Scholar] [CrossRef] [PubMed]
  48. Handy, S. Methodologies for exploring the link between urban form and travel behavior. Transp. Res. Part D Transp. Environ. 1996, 1, 151–165. [Google Scholar] [CrossRef]
  49. Zhou, B.; Lapedriza, A.; Khosla, A.; Oliva, A.; Torralba, A. Places: A 10 Million Image Database for Scene Recognition. IEEE Trans. Pattern Anal. Mach. Intell. 2018, 40, 1452–1464. [Google Scholar] [CrossRef]
  50. Zhang, F.; Zhang, D.; Liu, Y.; Lin, H. Representing place locales using scene elements. Comput. Environ. Urban Syst. 2018, 71, 153–164. [Google Scholar] [CrossRef]
  51. Zhou, B.; Lapedriza, A.; Xiao, J.; Torralba, A.; Oliva, A. Learning Deep Features for Scene Recognition using Places Database. In Proceedings of the Neural Information Processing Systems, Montreal, QC, USA, 8–13 December 2014. [Google Scholar]
  52. Guerrero, P.; Møller, M.S.; Olafsson, A.S.; Snizek, B. Revealing Cultural Ecosystem Services through Instagram Images: The Potential of Social Media Volunteered Geographic Information for Urban Green Infrastructure Planning and Governance. Urban Plan. 2016, 1, 1–17. [Google Scholar] [CrossRef]
  53. Lu, H.-Y.; Lou, Y.-T.; Jin, B.; Xu, M. What is Discussed about COVID-19: A Multi-modal Framework for Analyzing Microblogs from Sina Weibo without Human Labeling. Comput. Mater. Contin. 2020, 64, 1453–1471. [Google Scholar] [CrossRef]
  54. Li, X.; Qian, Y.; Zeng, J.; Wei, X.; Guang, X. The Influence of Strip-City Street Network Structure on Spatial Vitality: Case Studies in Lanzhou, China. Land 2021, 10, 1107. [Google Scholar] [CrossRef]
  55. Luo, W.; Wang, F.H. Measures of spatial accessibility to health care in a GIS environment: Synthesis and a case study in the Chicago region. Environ. Plan. B-Plan. Des. 2003, 30, 865–884. [Google Scholar] [CrossRef]
  56. Dai, D. Racial/ethnic and socioeconomic disparities in urban green space accessibility: Where to intervene? Landsc. Urban Plan. 2011, 102, 234–244. [Google Scholar] [CrossRef]
  57. Wang, J.; Kwan, M.P.; Chai, Y.W. An Innovative Context-Based Crystal-Growth Activity Space Method for Environmental Exposure Assessment: A Study Using GIS and GPS Trajectory Data Collected in Chicago. Int. J. Environ. Res. Public Health 2018, 15, 703. [Google Scholar] [CrossRef] [PubMed]
  58. Ulloa-Leon, F.; Correa-Parra, J.; Vergara-Perucich, F.; Cancino-Contreras, F.; Aguirre-Nuñez, C. “15-Minute City” and Elderly People: Thinking about Healthy Cities. Smart Cities 2023, 6, 1043–1058. [Google Scholar] [CrossRef]
  59. Shahri, M.; Shahri, M.; Mirzaie, M. Bivariate Moran’s I and Lisa to explore the crash risky locations in urban areas. N-Aerus 2013, 14, 1–12. [Google Scholar]
  60. Meng, Y.; Xing, H. Exploring the relationship between landscape characteristics and urban vibrancy: A case study using morphology and review data. Cities 2019, 95, 102389. [Google Scholar] [CrossRef]
  61. Macarthur, R.H. Patterns of Species Diversity. Biol. Rev. 1965, 40, 510–533. [Google Scholar] [CrossRef]
  62. Fan, Z.; Zhang, F.; Loo, B.P.Y.; Ratti, C. Urban visual intelligence: Uncovering hidden city profiles with street view images. Proc. Natl. Acad. Sci. USA 2023, 120, e2220417120. [Google Scholar] [CrossRef] [PubMed]
  63. Ito, K.; Kang, Y.; Zhang, Y.; Zhang, F.; Biljecki, F. Understanding urban perception with visual data: A systematic review. Cities 2024, 152, 105169. [Google Scholar] [CrossRef]
  64. Vecchi, R.; Marcazzan, G.; Valli, G. A study on nighttime–daytime PM10 concentration and elemental composition in relation to atmospheric dispersion in the urban area of Milan (Italy). Atmos. Environ. 2007, 41, 2136–2144. [Google Scholar] [CrossRef]
  65. Khamis, K.; Ouellet, V.; Croghan, D.; Gonzalez, L.M.H.; Packman, A.I.; Hannah, D.M.; Krause, S. The Autobot-WQ: A portable, low-cost autosampler to provide new insight into urban spatio-temporal water quality dynamics. Front. Built Environ. 2023, 9, 1072757. [Google Scholar] [CrossRef]
  66. Duarte, F.; Ratti, C. What Urban Cameras Reveal About the City: The Work of the Senseable City Lab. In Urban Informormatics; Springer: Berlin/Heidelberg, Germany, 2021; pp. 491–502. [Google Scholar]
Figure 1. Modifiable areal unit problem (a,b) and accessibility issues (c,d) in diversity estimation under the concept of “perceived diversity” (see text for detailed explanation).
Ijgi 14 00091 g001
Figure 2. Traffic Analysis Zones (TAZs) of Shenzhen.
Ijgi 14 00091 g002
Figure 3. Distribution of POI and geo-tagged images and their semantic categories.
Ijgi 14 00091 g003
Figure 4. Overall framework.
Ijgi 14 00091 g004
Figure 5. Schematic of search radius expansion (The red curve in the figure illustrates the numerical correspondence between the area or accessibility of spatial units and the search radius).
Ijgi 14 00091 g005
Figure 6. Vitality calculated for TAZs in Shenzhen on weekdays and weekends.
Ijgi 14 00091 g006
Figure 7. Diversity measured by POIs: traditional diversity (a) and two new indicators for perceived diversity (b,c).
Ijgi 14 00091 g007
Figure 8. Diversity measured by geo-tagged images: traditional diversity (a) and two new indicators for perceived diversity (b,c).
Ijgi 14 00091 g008
Figure 9. The correlation coefficient (r) between urban vitality and various diversity indicators in Shenzhen and the bivariate Moran’s correlation between the two.
Ijgi 14 00091 g009
Figure 10. Regression of vitality and 2SFCA_SHDI (POI and Weibo-geo-tagged combined) under different land-use types.
Ijgi 14 00091 g010
Figure 11. Statistics of regression coefficients under different dominant land-use types.
Ijgi 14 00091 g011
Figure 12. Boxplot of the 24 h variation of vitality at the TAZ level in Shenzhen.
Ijgi 14 00091 g012
Figure 13. Comparison of vitality and diversity correlation between daytime and nighttime.
Ijgi 14 00091 g013
Table 1. Detailed description to the data used.
Data SourceData VolumeDateURLPurpose
Baidu heatmap10,000+ hourly
recording points
7–10 January 2023https://huiyan.baidu.com/products/popgeoapiservice
(accessed on 1 February 2025)
proxy for vitality
Gaode POI685,390 poisJune 2023https://lbs.amap.com/api/webservice/guide/api/search (accessed on 1 February 2025)proxy for urban functional semantics
Geo-tagged image (from weibo)75,663 images7 December 2022–23 March 2023https://weibo.com/ (accessed on 1 February 2025)proxy for urban scene visual semantics
Shenzhen planning map60,259 land-use parcels
(11 categories)
2022https://pnr.sz.gov.cn/d-xgmap/ (accessed on 1 February 2025)calculate accessibility and dominant land-use types
Table 2. Diversity values estimated for typical regions in Figure 7 and Figure 8.
Diversity IndicatorRegion HRegion MRegion N
SHDI119.25249.7058.40
AREA_SHDI121.22290.0171.14
2SFCA_SHDI_Weekday1129.64295.9571.56
2SFCA_SHDI_Weekday2129.32295.9071.55
2SFCA_SHDI_Weekend1127.87295.9971.47
2SFCA_SHDI_Weekend2121.11296.0171.44
Table 3. Regression results of POI-based urban diversity and other factors with vitality.
VariableCoefficientStd. ErrorAdjusted R2
Model 1 (Other_factor + Richness)
Constant0.07590.00610.259
Slope0.00100.0004
Accessibility to bus station−0.00060.0001
Housing prices0.00000.0000
Building height0.00660.0003
Diversity: Richness0.00380.0004
Model 2 (Other_factor + Simpson)
Constant0.07500.00730.247
Slope0.00110.0004
Accessibility to bus station−0.00050.0001
Housing prices0.00000.0000
Building height0.00700.0003
Diversity: Simpson0.04500.0084
Model 3 (Other_factor + SHDI)
Constant0.07440.00690.250
Slope0.00110.0004
Accessibility to bus station−0.00060.0001
Housing prices0.00000.0000
Building height0.00680.0003
Diversity: SHDI0.02090.0033
Model 4 (Other_factor + AREA SHDI)
Constant−0.02410.01360.265
Slope0.00110.0004
Accessibility to bus station−0.00040.0001
Housing prices0.00000.0000
Building height0.00660.0003
Diversity: AREA_SHDI0.06660.0066
Model 5 (Other_factor + 2SFCA SHDI)
Constant−0.04660.01400.273
Slope0.00110.0004
Accessibility to bus station−0.00040.0001
Housing prices0.00000.0000
Building height0.00660.0003
Diversity: 2SFCA_SHDI0.07910.0069
Disclaimer/Publisher’s Note: The statements, opinions and data contained in all publications are solely those of the individual author(s) and contributor(s) and not of MDPI and/or the editor(s). MDPI and/or the editor(s) disclaim responsibility for any injury to people or property resulting from any ideas, methods, instructions or products referred to in the content.

